environmental 2015 health profile...air quality water quality 0.0 0.7 2.4 1.3 10.3% health...
TRANSCRIPT

WAUKESHA COUNTY
ENVIRONMENTAL HEALTH PROFILE 2015
WISCONSIN ENVIRONMENTAL PUBLIC HEALTH TRACKING PROGRAM

How have you used your county's profile? Tell us about it!
[email protected] 608-267-2488
HOW TO USE THIS PROFILE
Below you will find our suggestions for how to use this profile. This profile contains many data
points unique to environmental health. As you explore the information on the following pages,
consider how it might be put to good use in your community. We are here to help you along the
way. If you have questions about how to integrate these data into your work, let us know!
COMMUNITY HEALTH ASSESSMENTS Data from the profiles can be used in your health department or hospital's community health assessments to help meet state
and federal requirements.
ACCREDITATION The profiles can be used to address the Public Health Accreditation Board’s accreditation standards. For instance, Standard
1.3: Analyze public health data to identify trends in health problems, environmental public health hazards, and social and
economic factors that affect the public’s health.
GRANT PROPOSALS Data in this profile can help you and your team develop a rationale for funding requests. These data can help justify existing
programs and show where there is still work to be done.
EDUCATION AND OUTREACH When creating programs and outreach materials for your community, these data can help you build your case and show the
extent of a problem. Communities have used their profile data to target education efforts to areas with the most need.
POLICY DEVELOPMENT This profile contains measures that can be used to justify the need for a policy. If a policy is put in place, these data can be
used as baseline measures with which to monitor changes over time.

WAUKESHA COUNTY DASHBOARD | 2015 ENVIRONMENTAL HEALTH PROFILE
Ozone ArsenicAnnual days above standard Average concentration in µg/L
Wisconsin: Wisconsin:
Particulate Matter 2.5 NitrateAnnual days above standard Average concentration in mg/L
Wisconsin: Wisconsin:
Carbon Monoxide (CO) Low Birth WeightRate of ER visits per 100,000 people Percent of births <2500 grams
Wisconsin: Wisconsin:
Childhood Lead Poisoning Preterm BirthPercent with blood lead ≥5 µg/L Percent of births <37 weeks gestation
Wisconsin: Wisconsin:
Heat Stress Lung CancerRate of ER visits per 100,000 people Rate of cases per 100,000 peopleWisconsin: Wisconsin:
Melanoma AsthmaRate of cases per 100,000 people Rate of ER visits per 100,000 people*Wisconsin: Wisconsin:
6.3%
1.1 0.1 0.4 1.5
HOME HAZARDS
7.1 8.2
BIRTH OUTCOMES
7.3%6.5%
AIR QUALITY WATER QUALITY
2.4 1.30.0 0.7
10.3%
HEALTH INDICATORS
10.6 16.5
9.9%
58.4 62.0
2.2%
25.5 18.4 376.0169.0
Above state value At or below state value ^ Data are suppressed | References on next page
WISCONSIN ENVIRONMENTAL PUBLIC HEALTH TRACKING PROGRAM
dhs.wi.gov/epht | [email protected] | 608-267-2488
Wisconsin Department of Health Services | Division of Public Health | Bureau of Environmental and Occupational Health
*This indicator is represented per 10,000 people on the data portal.

4 | Wisconsin Environmental Public Health Tracking
DASHBOARD DATA DETAILS
HEALTH INDICATORS
BIRTH OUTCOMES
HOME HAZARDS
AIR QUALITY
WATER QUALITY
Particulate Matter 2.5 (PM2.5) and Ozone: Monitored and modeled estimates of air quality readings Source: National Environmental Public Health Tracking Network, Centers for Disease Control and Prevention Year displayed: 2011
Arsenic and Nitrate: Measured concentrations from public water systems Source: National Environmental Public Health Tracking Network, Centers for Disease Control and Prevention Years displayed: Averaged data from 2011-2013
Childhood Lead Poisoning: Reported blood lead test results Source: Wisconsin Childhood Lead Poisoning Prevention Program, Bureau of Environmental and Occupational Health, Division of Public Health, Wisconsin Department of Health Services Note: The first version of this profile contained lead data from 2013. These data reflected duplicated cases, which might inflate rates in some counties. This issue has been corrected and the data are now deduplicated. This version also includes 2014 data, as they were available during the second printing. Please update any saved copies with this version. Year displayed: 2014
Carbon Monoxide (CO) Poisoning: Age-adjusted rate of emergency room visits related to CO poisoning Source: Office of Health Informatics, Division of Public Health, Wisconsin Department of Health Services Years displayed: Averaged data from 2009-2013
Low Birth Weight and Preterm Birth: Wisconsin birth certificate data Source: Office of Health Informatics, Division of Public Health, Wisconsin Department of Health Services Years displayed: Averaged data from 2011-2013
Heat Stress: Age-adjusted rate of emergency room visits related to heat stress Source: Office of Health Informatics, Division of Public Health, Wisconsin Department of Health Services Years displayed: Averaged data from 2009-2013
Melanoma and Lung Cancer: Age-adjusted rate of cases reported by health care providers Source: Wisconsin Cancer Reporting System, Office of Health Informatics, Division of Public Health, Wisconsin Department of Health Services Years displayed: Averaged data from 2006-2010
Asthma: Age-adjusted rate of emergency room visits related to asthma Source: National Environmental Public Health Tracking Network, Centers for Disease Control and Prevention Year displayed: 2012
Below are the abbreviated references for the data presented in the dashboard. Note that some measures have more years of data available on the Wisconsin Tracking portal, available at dhs.wi.gov/epht. For additional details on the data, see page 15. For more information about age-adjustment and other terms referenced in this profile, visit the
Wisconsin Tracking Program "Glossary of Terms," available at dhs.wisconsin.gov/epht/glossary.htm.

OZONEANNUAL DAYS ABOVE STANDARD
Wisconsin Environmental Public Health Tracking | 5
ANNUAL DAYS ABOVE STANDARD
1.1PARTICULATE MATTER 2.5
0.0
AIR QUALITY WAUKESHA COUNTY
PARTICULATE MATTER 2.5
STATEWIDE: 9.4
11.1ANNUAL DAYS ABOVE STANDARD
STATEWIDE: 0.7
OZONE
ANNUAL AVERAGE (µg/m3)
STATEWIDE: 0.1
0
2
4
6
8
10
12
14
2001 2002 2003 2004 2005 2006 2007 2008 2009 2010 2011
Waukesha County
Wisconsin Average
Air pollution means substances are in the air that should not be there – or should be there in
smaller amounts. Two important pollutants to consider for the health of a community are fine
particulate matter and ozone. Particulate matter describes microscopic particles that settle in
our lungs after being inhaled. The "2.5" in "particulate matter 2.5 (PM2.5)" refers to the size of
the particles, which are smaller than the width of a human hair. Ozone is created as a result of
emissions from vehicles and industrial facilities. Both particulate matter and ozone can trigger
health problems, especially in people with breathing conditions like asthma. Levels of these
contaminants are measured by monitoring stations set up around the state.
OZONE
The chart to the left provides a year-to-
year comparison of the number of days in
which ozone was above the standard set
by the US Environmental Protection
Agency. The fewer days above the
standard, the better.
TAKE A CLOSER LOOK AT THE DATA:
dhs.wi.gov/epht
Above state value At or below state value ^ Suppressed

WAUKESHA COUNTY
6 | Wisconsin Environmental Public Health Tracking
AIR QUALITYPARTICULATE MATTER 2.5
Particulate matter 2.5 (PM2.5) is so tiny that it can settle in a person’s lungs or bloodstream after being inhaled. These
particles are more common near busy roads and in areas with dusty industries. PM has been linked to heart attacks
and asthma attacks. Below are three charts showing how the annual average of PM2.5, heart attack rates, and asthma
emergency room visits have fluctuated over the 2002-2011 time period. In most Wisconsin counties, there has been a
downward trend in all three measures over time.
For more information on ozone and particulate matter, please visit dhs.wisconsin.gov/epht/criteriapollutants.htm.
0
2
4
6
8
10
12
14
16
2002 2003 2004 2005 2006 2007 2008 2009 2010 2011
Waukesha County
Wisconsin Average
0
5
10
15
20
25
30
35
40
45
2002 2003 2004 2005 2006 2007 2008 2009 2010 2011
Waukesha County
Wisconsin Average
0
100
200
300
400
500
600
2002 2003 2004 2005 2006 2007 2008 2009 2010 2011
Waukesha County
Wisconsin Average
PARTICULATE MATTER 2.5 ANNUAL AVERAGE
(µg/m3)
HEART ATTACK HOSPITALIZATIONS
Rate per 10,000 people
ASTHMA EMERGENCY ROOM VISITS
Rate per 100,000 people

WAUKESHA COUNTY
ARSENIC AND NITRATEMEAN CONCENTRATION LEVELS IN PUBLIC WATER (2011-2013)
Wisconsin Environmental Public Health Tracking | 7
WATER QUALITY
STATEWIDE: 1.3 STATEWIDE: 1.5
AVERAGE CONCENTRATION
IN PUBLIC WATER (µg/L)
AVERAGE CONCENTRATION
IN PUBLIC WATER (mg/L)
ARSENIC NITRATE
2.4 0.4PUBLIC DRINKING WATER
About two-thirds of Wisconsin residents obtain
water from public water systems. Data presented
on this page are collected from public water
systems.
Levels of contaminants in public water systems
are monitored and regulated by the Wisconsin
Department of Natural Resources. All counties
reported arsenic and nitrate mean concentrations
below the maximum contaminant levels
established by the US Environmental Protection
Agency.
For more information and to explore data about
other drinking water contaminants in Wisconsin,
visit dhs.wi.gov/epht.
0
2
4
6
8
10
12
Arsenic meanconcentration (µg/L)
Nitrate meanconcentration (mg/L)
Waukesha County
Wisconsin Average
Maximum contaminant level
Water that is piped into your home, school, or workplace comes from either a public water
system or a private well. Two important water contaminants to consider for the health of a
community are arsenic and nitrate. Potential health effects of drinking water with high levels of
arsenic include skin damage, circulatory system problems, and cancers (such as bladder and lung
cancer). Some studies have also found evidence of a link between exposure to high nitrate levels
in drinking water early in pregnancy and certain birth defects. Infants who consume drinking
water with high nitrate levels are at risk of shortness of breath and blue baby syndrome.
(10 mg/L) (10 µg/L)
TAKE A CLOSER LOOK AT THE DATA:
dhs.wi.gov/epht
At or below state value Above state value ^ Suppressed

WAUKESHA COUNTY
8 | Wisconsin Environmental Public Health Tracking
AVERAGE CONCENTRATION (mg/L)
NITRATE IN PRIVATE WELLS
WATER QUALITY
ARSENIC IN PRIVATE WELLSAVERAGE CONCENTRATION (µg/L)
PRIVATE DRINKING WATER
About one-third of Wisconsin residents obtain water from private wells. Private water wells are those that are
owned by individuals. Private well owners are responsible for monitoring and testing their wells. Regulations are in
place to guide the creation of new wells, but requirements are limited once a well is in place. As a result, not all
private wells are regularly monitored for contamination.
concentration (µg/L) concentration (mg/L)
The Wisconsin Environmental Public Health Tracking
Program worked to improve access to private well
data by partnering with the University of Wisconsin-
Stevens Point's Center for Watershed Science to
support a mapping tool. This tool provides private
well data for multiple contaminants at county,
township, and section levels. The well data were
voluntarily submitted by homeowners and represent
data from the past 25 years. The data do not include
water quality information for all known private wells.
County-specific measures for arsenic and nitrate in private
wells are displayed below. Seven counties have reported
average concentrations of arsenic above the 10 µg/L
maximum contaminant level. For nitrate, all counties are
below the 10 mg/L maximum contaminant level. To
explore data for the other water contaminants, visit
bit.ly/wellwaterviewer.
Above maximum contaminant level
The arsenic data displayed include results of 15,230 samples collected from 1988-2014. The nitrate data displayed
include results of 113,465 samples collected from 1972-2014. The number of samples collected varies from year to
year; accordingly, some years are better represented than others. Note that the level of precision between the arsenic
and nitrate values is different in the map legends; this is related to the level of detection capabilities of the laboratory
equipment.
Above maximum contaminant level

WAUKESHA COUNTY
Wisconsin Environmental Public Health Tracking | 9
HOME HAZARDS
RATE OF ER VISITS PER 100,000 PEOPLE
CARBON MONOXIDE
STATEWIDE: 8.2
2.2%
PERCENT OF TESTED CHILDREN
WITH BLOOD LEAD ≥5 µg/dL
STATEWIDE: 6.3%
CHILDHOOD LEAD
7.1CARBON MONOXIDE
RATE OF ER VISITS
RELATED TO CO PER 100,000
POISONINGPOISONING
Lead and carbon monoxide (CO) poisoning are two home hazards monitored by the Wisconsin
Environmental Public Health Tracking Program. Carbon monoxide poisoning prevents oxygen
from getting to the body, which can damage tissue and even cause death. In children, lead
poisoning slows growth and development, particularly in the brain. Lead poisoning is also
associated with increased incarceration and poor academic outcomes.
0.0
1.0
2.0
3.0
4.0
5.0
6.0
7.0
8.0
9.0
10.0
2004-2008 2009-2013
Waukesha County
Wisconsin Average
CARBON MONOXIDE POISONING
Carbon monoxide (CO) is a toxic, colorless,
and odorless gas. CO is created whenever
fuel or other materials are burned. Wisconsin
state law requires that all homes have a
carbon monoxide detector on every level.
The chart to the left presents age-adjusted
rates of emergency room visits for CO
poisoning. For more information on carbon
monoxide poisoning, please visit
dhs.wisconsin.gov/air/co.htm.
TAKE A CLOSER LOOK AT THE DATA:
dhs.wi.gov/epht
Above state value At or below state value ^ Suppressed
WAUKESHA COUNTY
CHILDHOOD LEAD POISONING
10 | Wisconsin Environmental Public Health Tracking
PERCENT OF TESTED CHILDREN WITH BLOOD LEAD ≥5 µg/dL
CHILDHOOD LEAD POISONING (2009-2011)
CENSUS TRACT-LEVEL COUNTS OF
HOME HAZARDS
0.0%
5.0%
10.0%
15.0%
20.0%
25.0%
30.0%
35.0%
40.0%
2001 2002 2003 2004 2005 2006 2007 2008 2009 2010 2011 2012 2013 2014
Waukesha County
Wisconsin Average
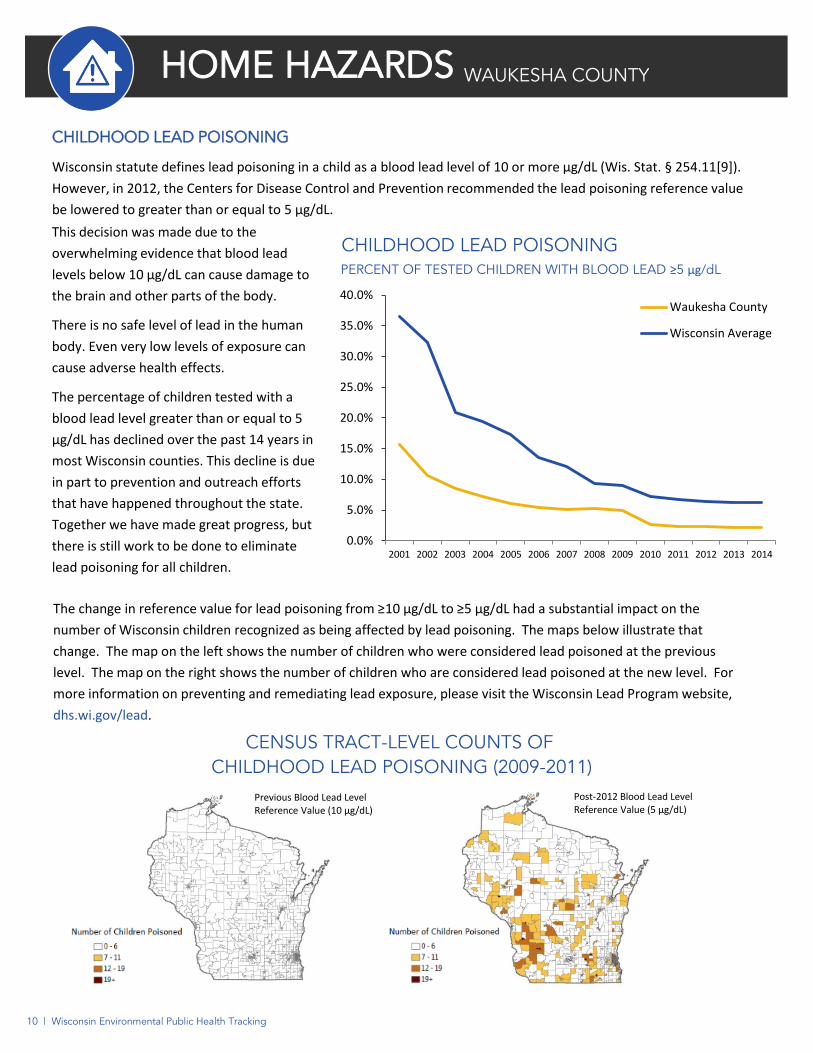
This decision was made due to the
overwhelming evidence that blood lead
levels below 10 µg/dL can cause damage to
the brain and other parts of the body.
There is no safe level of lead in the human
body. Even very low levels of exposure can
cause adverse health effects.
The percentage of children tested with a
blood lead level greater than or equal to 5
µg/dL has declined over the past 14 years in
most Wisconsin counties. This decline is due
in part to prevention and outreach efforts
that have happened throughout the state.
Together we have made great progress, but
there is still work to be done to eliminate
lead poisoning for all children.
CHILDHOOD LEAD POISONING
Wisconsin statute defines lead poisoning in a child as a blood lead level of 10 or more µg/dL (Wis. Stat. § 254.11[9]).
However, in 2012, the Centers for Disease Control and Prevention recommended the lead poisoning reference value
be lowered to greater than or equal to 5 µg/dL.
The change in reference value for lead poisoning from ≥10 µg/dL to ≥5 µg/dL had a substantial impact on the
number of Wisconsin children recognized as being affected by lead poisoning. The maps below illustrate that
change. The map on the left shows the number of children who were considered lead poisoned at the previous
level. The map on the right shows the number of children who are considered lead poisoned at the new level. For
more information on preventing and remediating lead exposure, please visit the Wisconsin Lead Program website,
dhs.wi.gov/lead.
Previous Blood Lead Level Reference Value (10 µg/dL)
Post-2012 Blood Lead Level Reference Value (5 µg/dL)

WAUKESHA COUNTY
LOW BIRTH WEIGHT PERCENT OF BIRTHS BELOW 2,500 GRAMS
Wisconsin Environmental Public Health Tracking | 11
BIRTH OUTCOMES
<2,500 GRAMS <37 WEEKS GESTATION
STATEWIDE: 7.3% STATEWIDE: 10.3%
LOW BIRTH WEIGHT PRETERM BIRTH
PERCENT BIRTHS PERCENT BIRTHS
6.5% 9.9%
TAKE A CLOSER LOOK AT THE DATA:
dhs.wi.gov/epht 0.0%
1.0%
2.0%
3.0%
4.0%
5.0%
6.0%
7.0%
8.0%
2002-2004 2005-2007 2008-2010 2011-2013
Waukesha CountyWisconsin AverageConfidence Interval
Reproduction is complex, and many factors affect a mother's ability to conceive, carry a baby to
term, and deliver a baby without complications. Environmental factors such as air pollution and
exposure to contaminated drinking water can increase the likelihood of low birth weight and
preterm births. Low birth weight has also been linked to exposure during pregnancy to lead,
solvents, pesticides, and polycyclic aromatic hydrocarbons (a group of over 100 contaminants
produced by burning fuels like coal).
LOW BIRTH WEIGHT
Low birth weight ̶ being born with a weight
under 2,500 grams ̶ can occur as a result of
slow fetal growth over a full-term pregnancy,
being born preterm, or both. The figure to
the left provides a comparison between the
county-level percentage of low birth weight
babies and the percentage of low birth weight
babies in Wisconsin from 2002-2013.
Confidence intervals based on the county rate
have been added to the chart to the
left. They are denoted with dotted gray
lines. These confidence intervals indicate the
precision of the estimated values. The closer
the dotted lines are to the county line, the
better (or more precise) the estimate.
Above state value At or below state value ^ Suppressed

WAUKESHA COUNTY
PRETERM BIRTHSPERCENT OF BIRTHS <37 WEEKS GESTATION
12 | Wisconsin Environmental Public Health Tracking
BIRTH OUTCOMES
PRETERM BIRTH
A baby is considered to be preterm if he or she is born before completing 37 weeks of gestation. Many women
who have preterm birth have no known risk factors. Women have the best chance of preventing preterm birth by
being healthy before and during pregnancy and receiving high-quality prenatal care. Environmental factors can
also play a role, as research has shown a relationship between exposure to air pollution, lead, solvents, and
tobacco smoke during pregnancy and a higher risk of preterm birth.
0.0%
2.0%
4.0%
6.0%
8.0%
10.0%
12.0%
14.0%
2002-2004 2005-2007 2008-2010 2011-2013
Waukesha County
Wisconsin Average
Confidence Interval
The figure to the right provides a
comparison between the percentage of
preterm babies at the county level and the
percentage of preterm babies in Wisconsin
from 2002-2013.
Confidence intervals based on the county
rate have been added to the chart to the
right. They are denoted with dotted gray
lines, which indicate the precision of the
estimated values. The closer the dotted
lines are to the county line, the better (or
more precise) the estimate.
For more information on preterm births,
visit dhs.wi.gov/epht/premature.htm.
BIRTH DEFECTS
A birth defect is a problem that happens while the baby
is developing in the mother's body. Most birth defects
happen during the first three months of pregnancy. A
birth defect may affect how a baby's body looks, works,
or both.
Many birth defects are known to be related to
environmental factors. Birth defects such as spina
bifida, cleft lip/palate, gastroschisis, hypospadias, Down
syndrome, and heart defects have all been linked to
living near hazardous waste sites. Some birth defects
have also been linked to disinfection by-products in
drinking water. Some studies have also found evidence
of a link between exposure to high nitrate levels in
drinking water early in pregnancy and certain birth
defects.
The causes of most birth defects remain
unknown. With the data collected through the
National Environmental Public Health Tracking
Program, researchers will be better equipped to study
the relationship between birth defects and the
environment.
The Wisconsin Environmental Public Health Tracking
Program obtains data on 10 types of birth defects
from the Birth Defect Prevention and Surveillance
Program at the Wisconsin Department of Health
Services. The Birth Defects Registry is a passive
surveillance system for which reporting by health care
providers is optional. Much of this data is available on
our web portal, which can be found at
dhs.wisconsin.gov/epht/birthdefects.htm.

WAUKESHA COUNTY
RATE OF ER VISITS PER 100,000 PEOPLE
Wisconsin Environmental Public Health Tracking | 13
STATEWIDE: 376
ASTHMA
RATE OF ER VISITS
PER 100,000 PEOPLE
169.0
HEALTH INDICATORS
HEAT STRESS
58.4LUNG CANCER
25.5MELANOMA
10.6
STATEWIDE: 18.4
RATE OF ER VISITS
PER 100,000 PEOPLE
STATEWIDE: 16.5
HEAT STRESS
RATE OF CASES
PER 100,000 PEOPLE
STATEWIDE: 62
RATE OF CASES
PER 100,000 PEOPLE
0.0
2.0
4.0
6.0
8.0
10.0
12.0
14.0
16.0
18.0
2004-2008 2009-2013
Waukesha County
Wisconsin Average
Heat stress, melanoma, lung cancer, and asthma are four of the many health indicators
collected by the Wisconsin Environmental Public Health Tracking Program. Each of these
indicators is strongly linked to one or more environmental factors.
HEAT STRESS
Heat stress encompasses a range of conditions
including heat rash, heat syncope, heat cramps,
and heat exhaustion. Any individual can
develop heat stress when involved in intense
physical activity or when exposed to high
environmental temperatures.
In this profile, heat stress is measured by
emergency room visits related to heat. For
more information on heat stress, visit
bit.ly/cdcheatstress.
Above state value At or below state value
TAKE A CLOSER LOOK AT THE DATA:
dhs.wi.gov/epht
^ Suppressed

WAUKESHA COUNTY
MELANOMA LUNG CANCERRATE OF CASES PER 100,000 PEOPLE RATE OF CASES PER 100,000 PEOPLE
ASTHMARATE OF ER VISITS PER 100,000 PEOPLE
14 | Wisconsin Environmental Public Health Tracking
HEALTH INDICATORS
MELANOMA AND LUNG CANCER
Cancer is a term used for diseases in which abnormal cells divide without control and are able to invade other body
tissues. There are more than 100 different types of cancer. Melanoma is a cancer of the skin pigment cells and is the
most dangerous type of skin cancer. Lung cancer forms in the tissues of the lung, usually in the cells lining the air
passages, and is the leading cause of cancer deaths in the United States.
0
5
10
15
20
25
30
1996-2000 2001-2005 2006-2010
Waukesha CountyWisconsin AverageConfidence Interval
0
10
20
30
40
50
60
70
80
1996-2000 2001-2005 2006-2010
Waukesha CountyWisconsin AverageConfidence Interval
Both melanoma and lung cancer are strongly linked to
environmental causes. Melanoma is linked to
ultraviolet (UV) radiation exposure, and lung cancer is
related to radon and environmental tobacco smoke.
In this profile, melanoma and lung cancer data are
presented as age-adjusted rates of new cases per
100,000 people.
The rate of melanoma in Wisconsin is increasing over
time, and nearly all Wisconsin counties are following
the same upward trend. The rate of lung cancer has
held relatively steady in Wisconsin, with more
variability by county. Confidence intervals based on
the county rate have been added to the charts above.
They are denoted with dotted gray lines, which
indicate the precision of the estimated values. The
closer the dotted lines are to the county line, the
better (or more precise) the estimate.
For more information on melanoma, visit
dhs.wisconsin.gov/epht/melanoma.htm. To read
ASTHMA
Asthma is a disease that affects breathing and may
restrict the ability to get oxygen to the lungs. Symptoms
of asthma often occur because a person is exposed to a
trigger such as outdoor air pollution.
In this profile, asthma is measured by the rate of asthma-
related emergency room visits per 100,000 people. The
overall rate of asthma emergency room visits in
Wisconsin has declined slightly since 2002. Rates at the
county level are more variable. For more information
about asthma, visit dhs.wisconsin.gov/asthma/Index.htm
0
100
200
300
400
500
600
2002 2003 2004 2005 2006 2007 2008 2009 2010 2011 2012
Waukesha County
Wisconsin Average
more about lung cancer, visit
dhs.wisconsin.gov/epht/lung.htm.

Wisconsin Environmental Public Health Tracking | 15
DATA DETAILSAIR QUALITY
Particulate Matter 2.5 (PM2.5) Measures: Annual Average PM2.5 (µg/m3), Percent of days above standard set by the US Environmental Protection Agency
Source: National Environmental Public Health Tracking Network, Centers for Disease Control and Prevention
Years displayed: 2002-2011, data from 2011 are displayed on the dashboard
Data details: These measures include monitored and modeled estimates of PM2.5 levels. Modeled estimates are used to fill in gaps for days when monitoring does not occur or in counties where monitors do not exist. The data downloaded from the national portal for percent of days above standard were multiplied by 365 to get number of days above US Environmental Protection Agency standard. The US Environmental Protection Agency's National Ambient Air Quality Standard (NAAQS) for a 24-hour average PM2.5 concentration is 35 µg/m3.
Ozone Measure: Number of days above standard set by the US Environmental Protection Agency
Source: National Environmental Public Health Tracking Network, Centers for Disease Control and Prevention
Years displayed: 2001-2011, data from 2011 are displayed on the dashboard
Data details: This measure is the number of days with maximum eight-hour average ozone concentration over the Environmental Protection Agency's National Ambient Air Quality Standard (NAAQS) of 0.075 ppm. This measure includes monitored and modeled estimates of ozone levels. Modeled estimates are used to fill in gaps for days when monitoring does not occur or in counties where monitors do not exist.
Heart Attack Measure: Age-adjusted rate of hospitalizations among persons age 35 and over per 10,000 people
Source: National Environmental Public Health Tracking Network, Centers for Disease Control and Prevention
Years displayed: 2002-2011
Data details: These data are collected from inpatient hospital records. This measure includes cases with an ICD-9 code of 410.0-410.92. The National Environmental Public Health Tracking Network suppresses data for counties with fewer than six hospitalizations per 100,000 to protect confidentiality. However, counties with zero cases are not suppressed. Direct age-adjustment is conducted using the 2000 US standard population.
Asthma
Measures: Annual age-adjusted rate of emergency department visits per 100,000 people
Source: National Environmental Public Health Tracking Network, Centers for Disease Control and Prevention
Years displayed: 2002-2012, data from 2012 are displayed on the dashboard
Data details: These data are collected from emergency room visit records. This measure includes cases with an ICD-9 code of 493. The National Environmental Public Health Tracking Network suppresses data for counties with fewer than six visits per 100,000 to protect confidentiality. However, counties with zero cases are not suppressed. Direct age-adjustment is conducted using the 2000 US standard population. On the National Environmental Public Health Tracking portal, this measure is calculated per 10,000 people. For use in this profile, it is converted to per 100,000 people.
Lung Cancer and Melanoma
Measure: Age-adjusted rates of cases among persons age 35 and over per 100,000 people
Source: Wisconsin Cancer Reporting System, Office of Health Informatics, Division of Public Health, Wisconsin Department of Health Services
Years displayed: 1996-2010, data from 2006-2010 are displayed on the dashboard Data details: Rates are calculated from counts of cancer cases reported to the Wisconsin Cancer Reporting System by health care providers in Wisconsin. Data for counties with fewer than six cases are suppressed to protect confidentiality. However, counties with zero cases are not suppressed. Direct age-adjustment is conducted using the 2000 US standard population.
Heat Stress
Measure: Age-adjusted rate of emergency department visits per 100,000 people
Source: Office of Health Informatics, Division of Public Health, Wisconsin Department of Health Services
Years displayed: 2004-2013, data from 2009-2013 are displayed on the dashboard
Data details: These data are collected from emergency room visit records. This measure includes cases with an ICD-9 code of 992.0-992.9, or cause of injury code E900.0 or E900.9. Data for counties with fewer than five visits are suppressed to protect confidentiality. However, counties with zero visits are not suppressed. Direct age-adjustment is conducted using the 2000 US standard population.
HEALTH INDICATORS

continued
16 | Wisconsin Environmental Public Health Tracking
DATA DETAILS
Arsenic Measures: Mean concentration of arsenic (µg/L) in public drinking water
Source: National Environmental Public Health Tracking Network, Centers for Disease Control and Prevention
Years displayed: Averaged data from 2011-2013
Data details: Arsenic concentrations in drinking water are based on samples taken from public community water systems. Because many counties did not have any samples for a given year, three years of data were aggregated (2011-2013). Some counties had multiple arsenic mean values (from different water systems), so the values were first averaged within a given county and then averaged across the years.
Nitrate Measure: Mean concentration of nitrate (mg/L) in public drinking water
Source: National Environmental Public Health Tracking Network, Centers for Disease Control and Prevention
Years displayed: Averaged data from 2011-2013
Data details: Nitrate concentrations in drinking water are based on samples taken from public community water systems. Because many counties did not have any samples for a given year, we aggregated three years of data (2011-2013). Some counties had multiple nitrate mean values (from different water systems), so the values were first averaged within a given county and then averaged across the years.
WATER QUALITY
Lead Poisoning Measure: Percent of children tested who had a blood lead level ≥5 µg/dL
Source: Wisconsin Childhood Lead Poisoning Prevention Program, Bureau of Environmental and Occupational Health, Division of Public Health, Wisconsin Department of Health Services
Years displayed: 2001-2014, data from 2014 displayed on dashboard
Data details: Wisconsin blood lead testing data from children less than six years of age are reported to the Wisconsin Childhood Lead Poisoning Prevention Program. Data are de-duplicated such that they contain the most recent confirmatory (venous) test following an elevated screening (capillary) test. If no confirmatory test for the individual is available, the most recent screening test result is used. The first version of this profile contained lead data from 2013. These data reflected duplicated cases, which might inflate rates in some counties. This issue has been corrected. This version of the profile also includes 2014 data, as they were available during the second printing. Please update any saved copies with this version.
Carbon Monoxide Poisoning Measure: Annual average rate of emergency room visits, age adjusted per 100,000 people
Source: Office of Health Informatics, Division of Public Health, Wisconsin Department of Health Services
Years displayed: 2004-2013, data averaged from 2009-2013 displayed on dashboard
Data details: This measure includes carbon monoxide poisonings that were unintentional (fire- or non-fire-related) and of unknown intent. These data are collected from emergency room visit records. The measure includes cases with an ICD-9 code of 986 or cause of injury code E868.2, E868.3, E868.8, E868.9, E982.0, E982.1, E818, E825 ,E838, E844, E867, E868, or E890-E899. Data for counties with fewer than five visits are suppressed to protect confidentiality. However, data from counties with zero visits are not suppressed. Direct age-adjustment is conducted using the 2000 US standard population.
HOME HAZARDS
Low Birth Weight
Measures: Percentage of babies weighing <2,500 grams at birth among all babies born to county residents
Source: Office of Health Informatics, Division of Public Health, Wisconsin Department of Health Services
Years displayed: 2002-2013, data from 2011-2013 are displayed on dashboard
Data details: Data are from Wisconsin resident birth certificates. Birth weight in grams is reported by the hospital or attending clinical staff.
Preterm Birth
Measure: Percentage of babies born at <37 weeks gestation among all babies born to county residents
Source: Office of Health Informatics, Division of Public Health, Wisconsin Department of Health Services
Years displayed: 2002-2013, data from 2011-2013 are displayed on dashboard
Data details: Data are from Wisconsin resident birth certificates. The last menstrual period a mother had prior to confirmed pregnancy is used to determine weeks of gestation. If data from this source are not available, the attending clinician's estimated weeks of gestation is used.
BIRTH OUTCOMES

WISCONSIN ENVIRONMENTAL PUBLIC HEALTH TRACKING PROGRAM
HENRY ANDERSON, MD
Principal Investigator, Chief Medical Officer
608-266-1253
PAUL CRESWELL, PHD
Senior Epidemiologist
608-267-9752
SPECIAL THANKS
Iowa Environmental Public Health Tracking Program
Wisconsin Environmental Public Health Tracking Program’s Technical Advisory Group
Jeff Phillips, Bureau of Environmental and Occupational Health, Wisconsin Department of Health Services
Sarah Mattes, Tobacco Prevention and Control Program, Wisconsin Department of Health Services
Kevin Masarik, Center for Watershed Science and Education, University of Wisconsin-Extension
DAWN BERNEY, MPA
Evaluator
608-267-3830
JENNY CAMPONESCHI, MS
Program Manager
608-267-3811
MEGAN CHRISTENSON, MS, MPH
Epidemiologist
608-266-7897
MARK WERNER, PHD
Chief, Health Hazard Evaluation Section
608-266-7480
JOSEPH OLSON
IS Systems Development Services Professional
608-266-6696
CHRISTY VOGT, MPH, CHES
Communications and Education Coordinator
608-267-2488

State of Wisconsin | Department of Health Services | Division of Public Health
Bureau of Environmental and Occupational Health
Wisconsin Environmental Public Health Tracking Program
[email protected] | dhs.wisconsin.gov/epht
MAY 2015 | P-00719