entrepreneurial exits and innovation - siepr.stanford.edu · entrepreneurial exits and innovation *...
TRANSCRIPT

Entrepreneurial Exits and Innovation*
Vikas A. Aggarwal
INSEAD Boulevard de Constance
77300 Fontainebleau France
David H. Hsu
The Wharton School University of Pennsylvania
2028 Steinberg-Dietrich Hall Philadelphia, PA 19104
February 2012
ABSTRACT
We examine how IPOs and M&As affect entrepreneurial innovation as measured by forward patent citations and product development. We construct a panel dataset of all venture capital-backed biotechnology firms founded between 1980 and 2000, tracked yearly through 2006. We address the possibility of unobserved self-selection into exit mode in two ways: (1) we compare firms that filed for an IPO (or announced a merger) with those who did not complete the transaction for reasons unrelated to innovation, and (2) we use an instrumental variables approach based on relative financing channel liquidity at the industry level. We find evidence of a short-run positive IPO effect on innovation, with the effect reversing over a longer time window. Patent generality increases but originality decreases after an IPO. Innovation outcomes improve and are sustained for the acquisition exit channel. We conclude with inventor-level analyses to assess the importance of inventor turnover for these patterns.
Keywords: Entrepreneurial exits; innovation.
* We thank Iain Cockburn, Florian Ederer, Joan Farre-Mensa, Josh Lerner, and audience members at the NBER productivity lunch, the Strategic Management Society annual meeting, Temple Fox School, Tilburg Entrepreneurial Finance Conference, and the UCLA Entrepreneurship & Innovation seminar for helpful comments. We also thank Sean Nicholson and Simon Wakeman for providing biotechnology product and alliance data, and Andy Wu for excellent research assistance. We acknowledge funding from the Wharton Entrepreneurship and Family Business Research Centre at CERT, the Centre of Excellence for Applied Research and Training Term Fund, and the Wharton-INSEAD Center for Global Research and Education.

2
1. Introduction
Entrepreneurs of innovative ventures are illiquid until an exit (or liquidity) event such as
conducting an initial public offering of stock or being acquired by another entity. As a result, a leading
performance measure researchers in the entrepreneurship literature investigate is the likelihood of an exit
event. The main motivation for studying this outcome is that such exit events offer liquidity and financial
returns to the entrepreneurial founders, their investors, and other equity shareholders. However, we know
little about the relationship between entrepreneurial exit modes and organizational innovation.
Such innovation outcomes are important for both start-up entrepreneurs and managers at
established companies. For entrepreneurs, different liquidity mode choices entail different tradeoffs
regarding organizational structure, governance, incentives, and resources, which in turn affect innovation
output. For industry incumbents, a deeper understanding of the consequences of organizational changes
accompanying the going public process and the entrepreneurial acquisition process are important in
assessing the innovation profile of a potential competitor. A final motivation for investigating the research
question of the relationship between entrepreneurial exit modes and innovation outcomes is to better
assess the public policy implications of the shifting balance of entrepreneurial exit modes away from
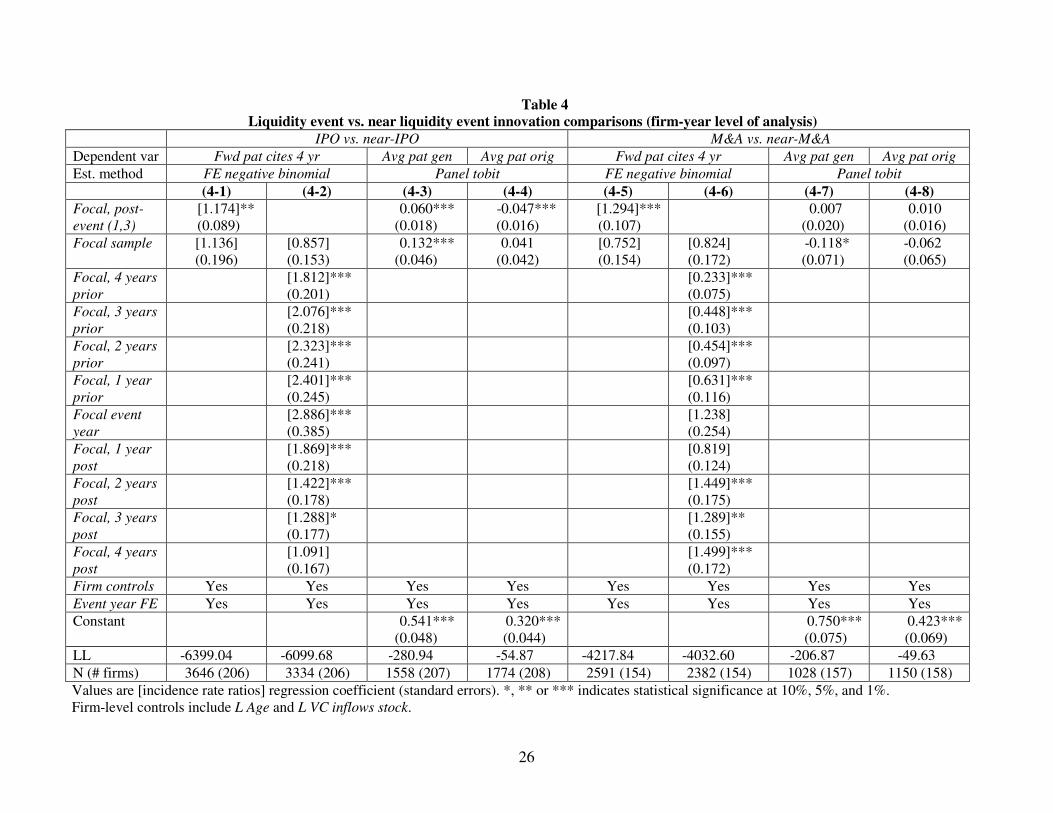
initial public offerings and toward mergers and acquisitions. Figure 1 plots the ratio of deal (and deal
value) from VC-backed M&As to IPOs over the 1992 to 2007 time period. The same data series are
plotted for VC-backed biotechnology firms (the industry subject of this study) in Figure 2. Acquisitions
have clearly outstripped IPOs as the modal form of entrepreneurial exit. While assessing the welfare
implications of this shift is beyond the scope of this paper, the innovation consequences are a key
component to such an analysis.
To illustrate the phenomenon we study, consider the example of Pixar, the computer animation
studio. In the fall of 1994, before Pixar released its first hit, Toy Story, Pixar majority owner Steve Jobs
considered selling the studio to Microsoft. The chief negotiator on behalf of Microsoft was Nathan
Myhrvold, then head of Microsoft Research, who recalled why Microsoft was interested in the deal: “I
was interested in them initially because we were interested in graphics, and we had the idea that maybe
there’s some technology that we could invest in early on that would be relevant to PCs [personal
computers] later.” (Price, 2008: 140). Jobs subsequently had a change of heart in selling out and instead
licensed several patents covering technologies such as motion blur and realistic depth of field to
Microsoft for a fixed fee of $6.5 million. Pixar went on to conduct an IPO in 1995 and raised $140
million, edging out the Netscape IPO for the largest public offering of that year. Pixar was eventually
acquired by Disney in 2006. While it is of course not possible to know what would have happened to the
creative output of a Microsoft-owned Pixar or an independent Pixar post-2006, it would be interesting to
understand the relationship between corporate ownership and innovation.

3
Perhaps the largest challenge to designing a study investigating the innovation consequences of
entrepreneurial exit mode is the possible issue of self-selection into exit mode based on unobserved
factors. Clearly the gold standard of random assignment of ventures to exit mode is not available. Not
only is being in the position to consider a liquidity event (of any sort) not a random occurrence, the choice
between exit modes may be importantly influenced by unobserved factors. While we recognize that
disentangling the comingling of exit mode selection and treatment effects is challenging, we employ two
approaches enabled by our panel dataset of the universe of VC-funded US biotechnology start-ups
founded between 1980-2000. First, we conduct a quasi-experiment in which we compare the innovation
profiles of firms experiencing a given exit event to subsamples of firms which “nearly” experienced the
event, but for reasons unrelated to innovation, did not experience the event. Second, we employ an
instrumental variables strategy centered on the relative liquidity of alternative funding sources to the start-
ups. Because these funding sources are imperfectly correlated with each other, the attractiveness of a
given funding channel rises or diminishes over time to entrepreneurs. Yet these industry-wide fluctuations
in the funding environment are unlikely to be correlated with firm-level innovation outcomes. We use
these variables to instrument for the choice of exit mode.
Across the range of our comparisons, we find that firms undergoing a public offering experience
a boost in forward patent citations in the short-term, but in the medium- and long-term the effect is
insignificant or negative. The fundamental nature of patents produced, as measured by patent “generality”
and “originality”, are positively and negatively related, respectively, to the IPO process. By comparison,
acquired start-ups experience an increase in forward patent citations and product portfolio, and these
effects do not abate over time. Average patent generality and originality are unaffected by acquisitions.
We further investigate the extent to which inventor turnover following liquidity events might account for
these empirical patterns. We do so by constructing an inventor-year panel dataset covering inventor
histories both in- and out-of-sample with regard to our focal firms. We do not find evidence that our firm-
level IPO results are driven by inventor turnover (either inflow or outflow). However, we find evidence
that more productive inventors are hired into firms following M&A. We conclude by discussing how
organizational explanations resulting from ownership changes accompanying exit modes might be
consistent with our empirical results.
2. Literature
We review the literature in three domains. We first discuss the related literature on IPOs assessing
the benefits and costs of doing so, particularly as they might relate to innovation outcomes. We then
discuss the literature on M&As and their effects on firm innovation. A final section reviews the much
smaller set of studies that consider the entrepreneurial choice between an IPO and an M&A.

4
Initial public offerings and innovation. While the literature on IPOs is extensive (for review
articles, see Ritter & Welch, 2002 and Brau & Fawcett, 2006), there has only recently been work that has
begun to evaluate how organizational changes resulting from the going public process might impact the
innovative profile of a firm. Research contemporaneous with our study suggests that firms pursuing an
IPO see a decline in the quality of their innovations, largely due to skilled inventor departures and post-
IPO productivity decreases (Bernstein, 2012). This study complements our own by evaluating a multi-
industry context, with a focus solely on the IPO mode of exit. To better understand the link between
going public and possible innovation outcomes, we review in this section the various themes in the prior
literature on the benefits and costs of IPOs for entrepreneurial firms.
Broadly speaking, researchers have discussed three benefits to going public. First, doing so
enables equity holders to achieve liquidity (Pagano et al., 1998), which can be especially important if the
shareholders are not diversified (Bodnaruk et al., 2008). A second theme is that cost of capital and
valuation considerations might make going public more desirable as a funding source relative to other
means of raising capital. For example, diversified outsiders are willing to pay a higher price for risky cash
flows relative to entrepreneurs (Benninga et al., 2005), and entrepreneurs financed by more experienced
venture capitalists tend to access the public markets for financing when equity valuations are relatively
high (Lerner, 1994). Moreover, it is difficult to raise a commensurately large amount of capital for
research and development and capital expenditures from alternative funding sources (Kim & Weisbach,
2008). A third set of studies highlight the strategic moves (going beyond the need for a cash infusion into
the enterprise) that IPOs allow. These include the possibility of gaining analyst coverage, enhancing
corporate image and legitimacy (and the associated quality signaling to the labor and/or capital markets),
facilitating takeovers by turning newly issued stock into a currency for acquisitions, and bolstering
product market competitiveness (Chemmanur et al., 2010). With regard to the factors that might also
affect innovation outcomes, the financial inflows to the firm that can be leveraged for research and
development, including labor force investments and physical assets, seem important, though Asker, et al.
(2011) reports that public firms invest less than private ones. Several of the strategic factors such as those
facilitating product market development also seem relevant for innovation. One such notable factor is the
flexibility of vertical integration (enabled by IPO funding) as opposed to other organizational forms.
Guedj (2009), for example, documents higher likelihoods of regulatory stage passage for contract-based
pharmaceutical drug development relative to projects that are developed via firm vertical integration. At
the same time, non-integrated projects are less likely to earn ultimate regulatory marketing approval
relative to vertically integrated projects, suggesting a possible incentive distortion and/or advantage to
organizational flexibility associated with vertical integration.

5
Against these benefits of public ownership, the literature identifies a number of costs. Broadly
speaking we might think of two different types of costs, those related to control/governance and those
related to disclosure and reporting requirements. With regard to the first type, if entrepreneurs complete a
public offering, the shareholder base of the firm would expand tremendously. As a consequence, the
allocation of control rights also becomes more diffuse relative to privately-held ownership (typically the
corporate board of directors is expanded in the ramp-up to an IPO [Baker & Gompers, 2003]). Therefore,
in addition to innate entrepreneurial preferences or benefits associated with control, less distributed
control rights allow entrepreneurs to retain relative autonomy in making decisions in the face of
differences of opinion with outsiders (Boot et al., 2006). With regard to the possible impact of more
widespread oversight and narrowed entrepreneurial control associated with the transition from private to
public status on innovation outcomes, the expected effect is theoretically ambiguous, as it depends on the
relative productivity differences associated with more versus less concentrated corporate governance.
A second set of possible costs of going public relates to the accompanying disclosures and
reporting requirements (e.g., Battacharya & Ritter, 1981; Maksimovic & Pichler, 2001). Due to the
expanded number of possible shareholders, the regulatory requirements associated with going public
include regular public disclosures on firm operations, which may have innovation effects for reasons
internal and external to the firm. Within the firm, if managers know that they will have to report project
status on a regular basis, they may be incentivized to select projects that are more likely to yield steady
progress. Developing important innovations, however, is a process that not only involves a longer time
horizon, but also offers returns with higher variance relative to more certain investment activities.
Moreover, innovation often requires experimentation, which may be curtailed if managers know they
have to report results on a quarterly basis. As such, for situations in which managers want to incentivize
exploratory (rather than exploitative) behavior, private rather than public firm ownership might be
optimal (Ferreira, Manso & Silva, 2010). With such a shift in the resource allocation process, together
with the possible vesting of stock options in the going-public process, the focal organization may suffer
from more turnover in their employee base (Stuart & Sorenson, 2003). A countervailing effect on internal
operations stemming from routine disclosures, however, may result from the reports acting as a focusing
device for managers and organizational personnel. Regular organizational disclosures might induce an
innovative rhythm akin to effort inducement to keep pace with Moore’s Law in semiconductors.
Routine public disclosures may also have product market competition effects. Consider the
following quote from the founder of the movie rental company, Netflix: “In retrospect, Mr. Hastings [the
Netflix founder] wishes he had waited longer to go public…’In hindsight, what triggered Amazon and
Blockbuster to compete with us is they could see how profitable we were and how fast we were
growing.’” (Rivlin, 2005: G8). Entrepreneurs therefore sacrifice the opportunity to operate “under the

6
radar” with respect to announcing their offerings in exchange for liquidity and other benefits of a public
offering. In the context of biotechnology, because firms typically operate in a revenue-negative status at
the time of considering an IPO, alternative mechanisms of appropriation such as patent protection and
venture capital affiliation can lessen the cost of disclosure to some biotechnology firms (Guo et al., 2004).
Mergers and innovation. The lion’s share of the literature on the effect of M&A on innovation
takes the acquirer’s perspective. In that literature, there is recognition that acquisitions can be an
important channel for incumbents to access technology (Granstrand & Sjolander, 1990; Chaudhuri &
Tabrizi, 1999). There is, however, little agreement on whether acquisitions offer an innovation payoff to
the acquirer. Some studies, such as Hitt, et al. (1991) find a negative or neutral effect of acquisitions on
patent and R&D intensity post-acquisition. Other studies find that acquisitions can boost performance
under certain circumstances, such as if the target is structurally integrated at the appropriate time, or if the
target is technologically complementary to the acquirer (Ahuja & Katila, 2001; Higgins & Rodriguez,
2006; Puranam et al., 2006; Zhao, 2009; Desyllas & Hughes, 2010). There is, however, a much smaller
literature on the supply side of the acquisition equation, especially as it relates to innovation outcomes.
Many of the studies on the subject are based on case studies (Graebner & Eisenhardt, 2004; Cassiman et
al., 2005), with results focused more on the underlying processes of entrepreneurial acquisitions and
subsequent R&D, rather than on innovative outcomes. A more recent study by Lerner, et al. (2011) uses
the private equity context to evaluate whether firms’ innovation profiles change as a result of being
acquired via buyout, and finds an overall increase in the innovative output of private equity-acquired
firms over the long-term.
While in concept there are synergies of personnel and organizations that should benefit the
acquisition target (the entrepreneurial firm), the act of merging, typically into a larger organization, can
impose costs that might dampen innovation. Seru (forthcoming) argues that as a division within a
conglomerate, the acquired firm may have skewed managerial incentives to oversell the true prospects of
a given technology in an effort to acquire more internal resources. The result is that managers in the
conglomerate are less willing to fund innovative projects in the first place, as they are not able to assess
the true quality of the projects. Consistent with this argument, Seru (forthcoming) finds lower patent
grants and forward citations following acquisition as compared to exogenously uncompleted acquisitions.
A more general literature on innovation inside established as opposed to start-up firms generally
concludes that due to organizational and incentive reasons incumbents are expected to produce more
incremental rather than radical types of innovations. This can result, for example, from incentives to
optimize established organizational processes (Henderson & Clark, 1990) or from programs such as
process innovation efforts (Benner & Tushman, 2002). As well, there are personnel adjustment costs
associated with M&As. This can result from changes in corporate culture and/or from turnover in

7
personnel composition (Kapoor & Lim, 2007). In short, the literature finds that the costs of technology-
based M&As typically outweigh their benefits.
Choice among exit modes and innovation. In considering the entrepreneurial choice between
exit modes versus staying private, a key pre-condition to the choice is building a significant business to
warrant further business expansion. Conditional on this, there have been only a few papers to our
knowledge that deal with the choice between entrepreneurial exit modes. The literature examining
entrepreneurial choice of exit mode identifies four explanations driving the choice. When there is
significant venture capital involvement, a first set of studies finds that financing contractual design can
influence exit outcomes, and VCs may negotiate certain control rights in the first place based on their
assessment of entrepreneurial quality (Hellmann, 2006; Cumming, 2008). A second group of explanatory
variables for exit mode choice centers on industry or market characteristics such as industry identity,
industry degree of leverage and concentration, and public equity hotness (Brau et al., 2003; Bayar &
Chemmanur, forthcoming). A third cluster of studies examines the role of firm and product
characteristics, such as growth potential, capital constraints, degree of information asymmetry, and
complementarity with the potential acquirer (Poulsen & Stegemoller, 2008; Bayar & Chemmanur,
forthcoming). A final category of explanations relates to founder characteristics, most notably
entrepreneurial preferences for control versus value creation. Schweinbacher (2008) argues in a
theoretical model that because entrepreneurs value control, which is more likely under an IPO exit, they
are driven to be more innovative in order to make an acquisition less likely. This paper is the only one to
our knowledge linking the entrepreneurial choice among multiple modes of exit with entrepreneurial
innovation, and we do not believe any empirical study has addressed this topic.
3. Data and Measures
Sample. We sample the universe of VC-funded biotechnology firms founded between 1980 and
2000, identifying these firms using the VentureXpert database. We focus on start-ups receiving venture
capital funding because the associated quality screen of VC involvement (Kortum & Lerner, 2000) offers
a desirable dimension of homogeneity among firms in the sample, and the liquidity needs arising from the
venture capital cycle (Gompers & Lerner, 2004; Inderst & Muller, 2004) create pressures to pursue exit
opportunities. A second desirable dimension of homogeneity in our study concerns our selection of
biotechnology as the industry context. The importance of patenting to the appropriation and valuation of
innovations is particularly important in biotechnology relative to other sectors (e.g., Levin et al., 1987).
Our use of a single industry context thus enables us not only to obtain relevant measures of the value and
importance of innovations, but also to triangulate with alternative within-industry measures (as we do
with product-based outcomes as discussed later in this section), an objective that would be significantly

8
more challenging in a multi-industry context. We focus on firms founded in the 21-year period between
1980 and 2000 to ensure that our results are generalizable across a range of initial industry conditions, as
well as to ensure that we can observe firm outcomes for a sufficiently long period of time post-founding.
The sample consists of the 476 U.S.-based firms in the human biotechnology industry (SIC codes 2833-
2836) founded during these years.
The primary dataset is structured as an unbalanced firm-year panel, with observations for each
firm running from the year of founding through 2006. Since the most recent founding year is 2000 and the
data is collected through 2006, we observe each firm for a minimum of seven years (except for cases
where the firm undergoes an observed dissolution event prior to 2006).1 Left-censoring is not an issue
since we observe firms beginning with the date of founding. The final observation year of 2006 is chosen
in accordance with our patent-based forward citation measure for innovation outcomes (described below),
for which we utilize a 4-year post-application window (for our 476 firm sample we observe 15,439
patents, and 45,789 forward citations associated with these patents). In addition to the firm-year panel we
assemble an inventor-year panel to understand the role of individual inventors in influencing our observed
empirical patterns. We identify all inventors associated with patents of our focal firm sample, and
construct full inventor histories for each of these individuals; these histories include patenting activities
both within and outside our focal firms.2 The resulting inventor-year dataset consists of 12,769 inventors
associated with 15,439 focal firm patents, each observed on average for 11.3 years; the total number of
patents (both within and outside the focal firms) associated with this set of inventors is 57,803.
We utilize several archival sources to assemble these datasets. For exit events this includes news
article searches from Factiva, combined with data from Thomson One Banker, Zephyr, and SEC filings.
For innovation outcomes we draw on the IQSS Patent Network database (see Lai et al., 2011 for a
description), a database that incorporates the U.S. Patent and Trademark Office (USPTO) data on all
patents applied for since 1975. In addition to enabling us to construct patent-based innovation measures at
the firm-year level, we can also identify unique inventors, and as a consequence construct individual
inventor career histories. In addition, we collect data on firms’ product pipelines, strategic alliances, VC
funding, and post-acquisition structural integration, as well as measures of aggregate (industry-level) deal
value within the IPO, M&A and VC funding channels (which we use to construct instruments for firms’
choice of exit mode). To assemble these categories of data we draw respectively on the following sources:
PharmaProjects and Inteleos, Deloitte Recap RDNA, VentureXpert, CorpTech, and SDC. We describe the
variables and their construction in further detail below.
1 The average lifespan of a venture fund during this timeframe is 8-10 years and so VC-backed firms in this industry thus have strong incentives to pursue an exit event within 5-7 years post-founding. 2 We track inventor histories starting with 1975 to ensure that we capture a sufficient window of history for inventors prior to their joining the focal firm.

9
Exit events. We observe variation in the modes by which entrepreneurs and their stakeholders
achieve exit. From the time of founding, each firm can undergo multiple exit or “near-exit” events (those
for which the process was begun, but never consummated). For M&A events we are concerned
specifically with situations in which the focal firm is the target in the acquisition (thereby creating a
liquidity event for the founders and investors). We conduct an exhaustive archival search using news
articles from Factiva, triangulated with Thomson One Banker, Zephyr, and SEC filings, to identify
realized exit events for our focal firms (from founding through 2006), as well as those exit events that
were withdrawn. For IPOs, a withdrawn event represents situations in which the firm filed for an IPO but
subsequently did not go public due to exogenous market conditions. Withdrawn M&A events represent
similar situations in which a deal was announced but never consummated.
Withdrawn IPO and M&A events enable us to conduct a quasi-experiment to identify the
treatment effect of exits (IPO or M&A) using sub-samples that pool realized-exit and near-exit events
(IPO/near-IPO in one case and M&A/near-M&A in the other). An assumption of this approach is that a
firm’s withdrawal from a previously planned exit event is uncorrelated with its innovation capacity. For
withdrawn IPO events we verify through news articles that withdrawal is a function of unstable or volatile
market conditions, factors exogenous to our model specifications. For withdrawn M&A events we
similarly verify that withdrawals are due to shareholder objections or to regulatory oversight, items
unrelated to our outcome variables.
In addition to collecting data on exit and near-exit events, for the sub-sample of acquired firms
we create two measures that enable us to test for specific organizational mechanisms possibly influencing
innovation output. First, we construct the variable, structural integration, a measure of whether the
acquired firm is integrated into the parent following an acquisition. We adopt the definition used by
Puranam, Singh and Zollo (2006), and use an indicator variable set to 1 if a firm appearing in the
CorpTech directory the year before an acquisition does not appear in the CorpTech directory the year
following the acquisition. Second, we construct a measure of technological overlap between the acquiring
and acquired firms. This enables us to examine whether similarity between the two firms’ technology
portfolios influences post-acquisition innovation outcomes. Following Jaffe (1986), we define technology
overlap as the angular separation between the primary U.S. patent class vectors of the two firms. Each
vector has a dimension of 987, and is indexed by unique patent classes; a given value within a vector
represents the proportion of the firm’s stock of patents (applied for prior to and until the date of
acquisition) assigned to the patent class associated with the index for that value. The technology overlap
measure is the angular dot product of the two vectors: a value of 1 represents vectors with perfect overlap,
while a value of 0 represents orthogonal patent class vectors.

10
Innovation outcomes. To construct our measures of firm-level innovation, we begin by
identifying all patents associated with our focal firms. We extract from the IQSS Patent Network database
(Lai et al., 2011) all patents applied for by assignees between 1975-2010 whose name matches either the
current or former name(s) of our focal firms. To ensure that we are comprehensive in our data collection
process we conduct the search using an algorithm that matches various permutations of the company
name (e.g., we would code patents from “Amgen”, “Amgen Inc.”, and “Amgen Canada Incorporated” as
being associated with the same firm). Once we collect focal firm patent numbers, we then collect forward
citation numbers (future patents citing the focal patent in their application), backward citations (patents
cited by the focal patent), and patent class information for the focal, citing and cited patents.
Identifying patents for firms undergoing an M&A exit raises the issue that post-M&A patent
applications associated with inventions of the acquired firm may be made with the acquirer listed as the
assignee. Thus, it may be difficult to track the innovation outcomes of firms after an acquisition, unless
the acquired firm operates as an independent entity, with future patents accruing to the subsidiary rather
than to the parent. We use an inventor matching algorithm to address this issue. We first assemble a
database of inventors associated with pre-acquisition patents applied for by the focal (acquired) firm. We
then search patent applications where the acquirer is the assignee during the post-acquisition period, and
consider patents from this set of inventors as having originated from the acquired firm (our results are
robust to specifications not including these added patents).
We utilize several measures of patent-based innovation output, including patent applications,
forward citations, originality, and generality. Prior work (e.g., Trajtenberg, 1990) shows that forward
citations in particular have a strong correlation with economic value. In line with the literature we define
the variable forward patent citations 4-year as the number of citations within a four-year post-issue
window to patents applied for (and subsequently granted) by the focal firm in a given firm-year.3 Our
measure of forward citations thus constrains our observation window to a final year of 2006. The
variables average patent originality and average patent generality are based on the Hall, Jaffe, and
Trajtenberg (2001) definitions, and utilize our collected measures of backward and forward citations
respectively. Both measures are bounded between 0 and 1. Patent originality is defined as 1 minus the
Herfindahl concentration index of patent classes associated with cited patents (backward citations); a
higher (lower) value of originality thus suggests that the focal patents build on a broader (narrower) set of
technological areas. Patent generality is defined similarly, except that citing patents are used (forward
3 We also examine the robustness of our results to using our forward citation measure less self-citations (the two versions of the variable are pairwise correlated at 92%). Removing self-citations strengthens the results, and so we report the more conservative full forward citations in our empirical tables.

11
citations); a higher (lower) value of generality thus suggests that the focal patents impact a broader
(narrower) set of technological areas.
As an alternate measure of innovative output, we collect data on the product portfolios of firms in
our sample. We utilize the Inteleos and PharmaProjects databases to construct measures of the number of
products each firm has in different stages of development. In our empirical context of biotechnology, a
relevant metric for product development is the stage of an individual drug compound in the FDA approval
process. We track the trajectory of an individual drug over time by combining Inteleos (for which we
have data for years 1990-2001) and PharmaProjects (which we use to collect 2002-2006 data, matching
these with drug compounds identified in Inteleos). Because of the time period coverage limitations for
these sources we compile product-level data only for firms founded post-1989. We measure the number
of products in a given firm-year at four stages of the FDA approval process: pre-clinical, stage 1, stage 2
and stage 3. To create an aggregate measure of product portfolio value in a given firm-year, we weight the
number of products based on their stage, putting arbitrary weights of 1, 2, 5, and 10, respectively, on these
four stages, reflecting the relatively greater economic value based on the likelihood of eventual
commercialization of products in later stages of development (our results also hold for un-weighted
counts of firm product portfolios).
Instruments and controls. To address the possibility of unobserved self-selection into exit mode,
we compare exit and near-exit events as described previously, and also utilize an instrumental variables
approach based on the relative financing channel liquidity at the industry level. We collect aggregate
financing amounts for the IPO, M&A and VC channels from SDC. These amounts represent the sum total
value of deals of these three types within the biotechnology industry during the year. Expectations of the
threshold needed to take one exit route over the other are likely formed by contemporaneous observation
of the activity happening in one market as compared to the other. While there is reason to believe that
these financing channels are correlated, they are likely not perfectly so.
To construct our instruments we measure the extent to which there is a wedge in value differential
between any two exit markets by taking the 4-year moving average (a window over which expectations
can be formed). It is important to note that it is notoriously difficult to predict not only whether a given
market will be “hot”, but also the relative degree to which one market will be more active than the other.
We utilize three different versions of this instrument to measure the relative size of one funding channel
versus another in a given year: IPO relative to VC; M&A relative to VC; and IPO relative to M&A.
Market conditions in any given year are likely to drive the propensity of a firm to exit via either the IPO
or M&A route, or to obtain VC financing without pursuing a liquidity event through one of the two exit
channels. These three relative deal value variables thus influence a firm’s choice of exit mode. At the
same time, however, we would not expect that external market conditions favoring one form of exit (or

12
financing) versus another would necessarily influence the innovative activity of a given firm, independent
of the effects associated with our main exit outcome variables. These two conditions, that relative
financing channel liquidity (a) influences exit outcomes and (b) does not influence innovation outcomes,
thus suggest that this set of variables appropriately instruments for exit mode choice.
Finally, we employ a set of firm-level controls to account for any residual time-varying
unobserved heterogeneity in our model specifications (we utilize firm fixed effects in most of our
specifications). To account for firm-level quality and life cycle considerations we use firm age, along with
VC inflows, which measures the cumulative amount of VC funding received by the firm through the
current firm-year (and which we collect using VentureXpert). In addition, we use the Deloitte Recap
RDNA database to collect data on the cumulative stock of strategic alliances a firm has entered up to the
current firm-year, a further measure of firm quality (e.g., Stuart, Hoang & Hybels, 1999).4
Summary and descriptive statistics. Table 1 provides variable definitions and descriptive
statistics (reported at the firm-year level) of the variables used in our analyses, segmented by dependent
and a number of independent variable categories (event and time variables, firm characteristics, and
instrumental variables). Table 2, Panel A describes the overall number of firms experiencing each event
or near-event, broken down by time interval. In total, our sample firms experienced 162 acquisitions, 18
near-acquisitions, 196 IPOs, and 37 near-IPOs tracked through the end of 2006. Table 2, Panel B
summarizes firm characteristics evaluated as of the time of exit or near-exit. Statistically significant
differences are noted within each comparison group of exit vs. near-exit (but not for differences across
groups, such as compared to the sample remaining privately-held over the study duration).
The near-IPO sample received slightly more in aggregate VC ($51M) as compared to the firms
going public ($33M), though firm age and strategic alliance stock were comparable across the two
samples. The stock of forward patent citations was slightly higher for the near-IPO sample (71) compared
to the IPO sample (40), while average patent generality was higher for the IPO sample (0.43) compared to
the near-IPO sample (0.28). Meanwhile average patent originality and the stock of products in the product
portfolio were comparable across the samples. Firms experiencing a near-M&A were slightly older than
those experiencing an M&A (11.7 vs. 9.2 years), had more aggregate strategic alliances (28 vs. 16), and
had more forward patent citations (244 vs. 87) than their counterpart firms. Average patent generality and
originality, aggregate products in portfolio, and aggregate VC inflows were similar across the two sub-
samples. With this overview of the data, we now turn our attention to our empirical results.
4. Empirical Results
4 Firms’ strategic alliance stock is correlated with VC inflows stock at the 66% level, and so in the empirical tables, we only use the latter variable, though the results are robust to using the former variable instead.

13
Post-event versus pre-event comparisons. We begin our analysis in Table 3 with a simple
regression analysis of the innovation pattern for the firms that experienced an IPO or an acquisition,
comparing the post- as compared to the pre-event innovation profiles. Looking first at forward patent
citations over a 4-year window post-patent application, we find using a conditional fixed effects negative
binomial specification that the post-IPO (1,3) effect is an increase of 80% (without controls) and 19%
(with firm and event year controls). The reported values in square brackets are incidence rate ratios rather
than regression coefficients (a ratio above 1.0 corresponds to a positive estimated coefficient, with values
below 1.0 representing a negative coefficient); standard errors are reported in parentheses. The next two
columns employ panel random effects tobits of patent generality and originality, since these variables are
theoretically bound between zero and (asymptotically) 1. The post-IPO window is positively correlated
with average patent generality and negatively with average patent originality, both at the 1% level. The
final four columns of the table report analogous specifications for the M&A sample. With the full slate of
controls, we find that the post-M&A (1,3) window is associated with a 52% increase in forward patent
citations, but that patent generality and originality are unaffected by M&A. We also find that there is
heterogeneity in the M&A effect, with firms that were acquired and structurally integrated with the
acquirer experiencing worse innovation outcomes as measured by forward patent citations.5 Another
dimension of heterogeneity relates to the degree of technology complementarity between the acquiring
and focal firms. We find (in unreported regressions, available upon request) that acquisitions with a
higher initial value of technology overlap between the parties lead to an increase in forward patent
citations for all time windows spanning five years post-M&A. We therefore find evidence of within-
M&A sample heterogeneity in both post-acquisition integration and technological complementarity. Our
estimates thus far have not, of course, taken into consideration the possible self-selection into exit mode
based on unobservables. We employ two strategies in the next section to address this: we first compare
actual versus near-events, and then turn our attention to an instrumental variables analysis.
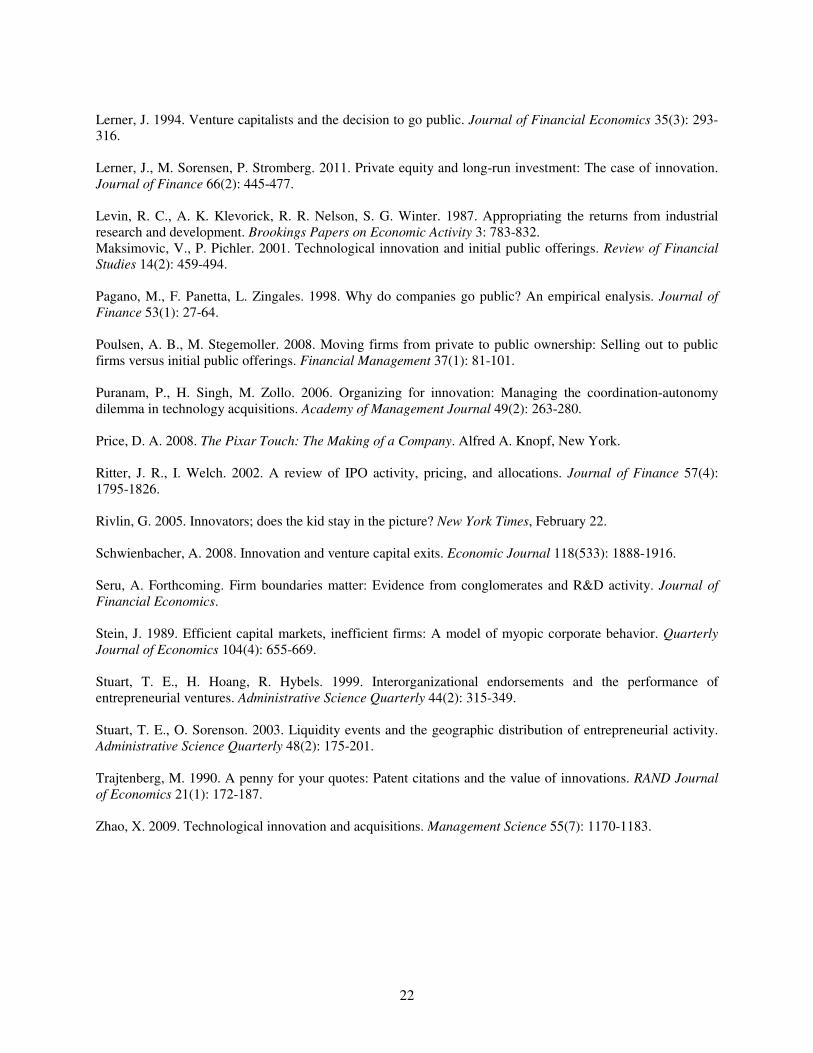
Liquidity event versus near liquidity event comparisons. In Table 4, we compare the sample of
liquidity events with “near” liquidity events, as we described in our data section. We begin our first two
specifications by examining the correlates of forward patent citations. In both (4-1) and (4-2), we include
firm-level controls and event year fixed effects; we run this for the focal sample of IPOs, leaving the near-
IPO sample as the reference group. The key variable in the first specification is the focal, post IPO (1,3)
variable, which is significant at 5% and implies a 17.4% increase following IPO for the focal sample. We
5 We constructed several other measures of within M&A-sample heterogeneity. Since we employ a yearly panel
dataset for our main analysis, we interact these variables with the post-window period indicator variable to identify the effect. Having a prior alliance prior to the acquisition (as occurred in 15% of our focal acquisitions) does not have an effect on innovation outcomes, nor does being acquired by a public firm (as happened in 73% of our acquisition sample).

14
examine the year-by-year patterns for the 4 years before the IPO, the IPO year, and the 4 years after the
IPO. The resulting inverted-U shape forward citation pattern may be an IPO “window dressing” type
effect, or grounded in product lifecycle investment patterns, which is consistent with the Chemmanur et
al. (2010) finding that IPOs occur at the peak of firms’ productivity cycle. The positive yearly effects
weaken in both statistical and economic significance by the third and fourth year, and as we show below,
the post-event windows spanning a longer time horizon yield zero or negative effects. Notably, the
coefficients on the focal sample variable in both (4-1) and (4-2) are statistically insignificant, suggesting
that overall, there is no difference in forward patent citation patterns between the “treatment” and
“control” subsamples except for the window around the IPO. The next two columns, (4-3) and (4-4),
report the results of panel tobits of average patent generality and originality. We find a positive generality
effect and a negative originality effect for the IPO sample in the post window period. The latter result is
consistent with the Ferreira, et al. (2010) paper, which argues that organizational exploration, as is needed
for innovation, is more difficult for publicly-held firms. We find no such patent generality and originality
differences for the M&A versus near-M&A sample (specifications [4-7] and [4-8]). With regard to
forward patent citations, we find a 29.4% positive aggregate effect post-M&A in column (4-5). Looking
at the yearly outcomes reveals an interesting pattern: in the years before the M&A event as compared to
the near-M&A sample, the focal sample firms lag in forward citation rates. However, this pattern reverses
by the second year post M&A. As we will see below, these effects persist and strengthen over time post-
M&A. The focal sample coefficient is also not different from zero in both (4-5) and (4-6).
Liquidity event versus privately-held comparisons. In Table 5, we use the same structure of
analysis as before, but compare the sample of firms undergoing a liquidity event with firms that remained
private for the duration of the study period (through 2006). While both IPOs and M&As are associated
with increases in forward patent citations as shown in (5-1) and (5-5), the focal sample dummy for each is
positive and significant, suggesting that firms which achieve an exit outcome have different innovation
profiles compared to the sample of private firms. The forward citation effects are preserved if we
instrument for the possibly endogenous selection of exit mode in an OLS firm fixed effects model in
which the log of forward citations is the dependent variable. We use the relative industry liquidity of the
IPO (or M&A) channel as compared to private VC funding as an instrumental variable in (5-2) and (5-6),
respectively. Finally, the same patterns with regard to patent generality and originality as reported for the
other sample comparisons also hold here.
Choice between IPO versus acquisition comparisons. In Table 6, we analyze the choice between
IPO and M&A and innovation outcomes. Our beginning sub-sample is the set of firms conducting one or
the other exit mode, with M&A the omitted category in specifications (6-1) through (6-4). Model (6-1)
reports a fixed effects negative binomial of the count of forward patent citations within 4 years, and

15
includes our firm-level controls and event year fixed effects. The (1,3) post-IPO window dummy is
positive and significant at the 10% level, as is the dummy variable indicating the IPO focal sample (as
compared to the M&A sample). The latter result is consistent with Schweinbacher’s (2008) theory that
entrepreneurs may be incentivized to innovate more to realize an IPO rather than M&A outcome for
control reasons. The next specification uses the log of forward citations as the dependent variable in a
firm fixed effects model and instruments for the possible endogeneity of the choice of an IPO by using the
relative VC-backed biotechnology liquidity of IPOs as compared to M&As, and finds similar effects. As
we found using other sub-samples of comparison, the panel tobits of patent generality and originality in
(6-3) and (6-4) have positive and negative coefficients, respectively, for the post-IPO window. The final
three columns of Table 6 use the sub-sample of firms experiencing both an IPO and M&A (usually an
IPO followed by an acquisition), and estimate both the post-IPO and post-M&A effects in a single
specification. Column (6-5) shows that the post-IPO effect is no different than zero, while the post-M&A
window is associated with a 21% increase in forward patent citations (and is statistically significant at the
5% level). We do not employ an instrumental variables regression akin to (6-2) because we now have two
possible endogenous event variables, but only one relevant instrumental variable, the relative industry
liquidity of IPOs compared to M&As. The final two specifications of the table examine patent generality
and originality. Model (6-6) shows that neither event is associated with patent generality. The final
specification shows that only in the post-IPO window is there a negative effect on patent originality.
Product outcomes. So far, we have concentrated our attention on innovation outcomes based on
patent-derived measures. Product-based innovation outcomes are also of considerable interest, and so we
analyze those here. Our sample consists of only the firms founded post-1989, for reasons we describe in
the data section. Our unit of analysis is again a firm-year, and our dependent variable is a weighted
measure of the product portfolio of a firm in a given year. Since progression in the US clinical trial
process implies nonlinearities with regard to hurdle rates and resources consumed, we arbitrarily apply a
weight of 1 to preclinical products in a firm’s portfolio in a given year, a weight of 2 to products in stage
1, a weight of 5 to stage 2 products, and a weight of 10 to stage 3 products. The results reported here are
also qualitatively similar without weighting. Since the dependent variable is a count, we again employ
conditional-fixed effects negative binomial specifications and adopt similar specifications as in the
forward patent citation regressions. The results, reported in Table 7, are similar to the overall patterns we
find in the patent-based innovation measures. While the statistical significance of the estimates is very
similar, the magnitudes of the event window measures are uniformly larger than their patent-based
outcome counterparts.
Event window result robustness. Throughout the analyses thus far, we have mainly employed a 1
to 3 year post-event window in assessing our results. In Table 8, we report results that vary this event

16
window. Each cell in the table represents a different regression using all the same non-window right hand
side regressors as the specification stated in the fourth row of the table, with only the estimated coefficient
associated with the relevant time window variable reported. For example, the estimated incident rate ratio
for the focal, post IPO (1,3) variable in column 1 is 1.185, which suggests that for the sample of firms
which went public, the average increase in forward citations in the first through third window following
the IPO as compared to before the IPO was 18.5%, inclusive of our firm and event year controls. It is
clear that across the three margins of comparisons we employ, post- compared to pre-IPO, actual versus
near IPO, and IPO versus always-private, forward citations increase only when the (1,3) window is
considered, while the following time windows yield zero results: (1,4), (1,5), and (2,5). If one extends the
time window long enough to the (1,10) window, the estimated coefficient on IPO turns negative. On the
other hand, as specifications (8-4) through (8-6) demonstrate, the increase in forward patent citations
following M&A is robust across comparison groups and across event windows. The magnitude of the
estimated effect increases with the time windows, and all coefficients are significant at the 1% level.
These same empirical patterns hold when we analyze the subsample of firms experiencing either an IPO
or and M&A (in 8-7) and in the subsample of firms experiencing both an IPO and an M&A (8-8).
Furthermore, the product portfolio patterns largely follow the forward patent citation results, with zero or
negative effects post-IPO in the medium to long run, while the product portfolio patterns are sustained
post-M&A. We do not show the different time windows associated with patent generality and originality,
as the results are largely insensitive to the time window considered.
Inventor-level analysis. There could be two general classes of explanations for the innovation
results we report. First, inventive employee turnover following the exit event could drive the results (e.g.,
Stuart & Sorenson, 2003). Alternatively, there could be possible inventive productivity differentials
propelled by changes in incentives, resources, and organizational structure associated with the exit events
themselves. Our empirical strategy is to empirically examine the first of these two categories, and
attribute the residual effects to the second class of explanatory variables (as we do not have direct
measures of the latter). We do so by rebuilding our entire database at the inventor-year level (rather than
the firm-year level). We use the Lai et al. (2011) inventor disambiguation algorithm and data to construct
our sample, as the U.S. Patent and Trademark Office does not keep individual unique identifiers for
inventors. In brief, the Lai et al. (2011) method uses a supervised Bayesian learning approach, which does
not make any parametric assumptions about any matching field and assigns probabilistic matches, to
uniquely identify inventor patenting histories for patents awarded between 1975 and 2010. We construct
our inventor-level data to follow unique inventors that were employed in our sample of firms during our
observation window. We then construct entire inventor career histories of these individuals to build patent
based measures of innovation for the time period before the focal inventor entered and after the focal

17
inventor exited our focal firm, if they did. The career history of each inventor is thus tracked beginning
with the year of the inventor’s first patent application, running through 2006, with the history including
data on patenting both within and outside our focal sample. We observe a total of 57,803 “career” patents
(and 180,451 associated forward citations within a 4 year post-grant window to those patents) across our
sample of 12,769 unique inventors. To complete our inventor-year dataset we include data on the
inventor’s firm association for the given year, along with firm-level characteristics for the year for in-
sample firms.
We explore two sets of outcomes at the inventor level. First, we construct the variables, change in
(mean: 0.09; s.d.: 0.28) and change out (mean: 0.04; s.d.: 0.19), which are indicator variables for whether
a given inventor either joined or departed a focal firm in a given year. For inventors joining a focal firm in
our sample, we set the variable change in equal to 1 in the first year in which the inventor applies for a
patent in the focal firm. A departure, captured by change out, is identified when an inventor who has
patented in one of our focal firms is observed to subsequently patent outside this same focal firm. This
variable is equal to 1 in the year the inventor patents in the ‘new’ firm. The key independent variables for
these analyses are the post-event window dummies, as in the firm-year analyses above. Second, we
characterize inventive productivity as measured by the forward citation weighted patent count stock of the
inventors who join and leave the focal organization in a 4 year window from patent grant via the variable
stock of inventor fwd cites 4yr (mean: 21.98; s.d.: 57.24). The relevant independent variable is the time
window post event, and we analyze the same comparison groups as our firm-year level analyses. In this
second set of analyses the key independent variables are interaction terms for the focal sample, post-event
window with the inventor mobility variables (change in and change out). These analyses allow us to
estimate whether the quality of inventors joining or leaving post-liquidity event differs for firms
experiencing an exit event as compared to the firms that nearly experienced the event. We estimate a
random effects logit specification for the first set of analyses (which treats unobserved quality as a
random variable; fixed effects specifications are restrictive, requiring within-inventor variation in the
dependent variable, though the results using such specifications are qualitatively similar) and a
conditional fixed effects negative binomial specification for the second set; in both sets of analyses we
use firm and inventor controls, defining the inventor-level variable, years since first invention (mean:
8.25; s.d.: 6.09), as the number of years since the inventor’s first patent application.
In our regression analyses of the inventor dataset in Table 9, we find that IPO events are not
associated with change in or change out, but that for M&A events, the estimates are positive and
negative, respectively (specifications 1, 2, 4 and 5 of Table 9). We further wanted to examine turnover of
high (or low) inventively productive employees following entrepreneurial exits. If such inventor mobility
were to explain the IPO patterns, we should find that either more productive inventors are leaving firms

18
after an IPO and/or less productive inventors are joining firms after an IPO. We do not find evidence of
either in (9-3). The comparable inventor turnover explanation of the M&A effects would either hold that
more productive inventors are joining the firm post M&A and/or that less productive inventors are
departing the firm post-M&A. We find evidence for the former but no evidence of the latter in (9-6). Our
results suggest that in the three-year window post M&A, inventors who are 16% more productive (as
measured by forward patent citations) join the firm relative to the firms which nearly experienced an
M&A. Inventors in the treated group saw a (weakly significant) 6% decline in own inventive
productivity. Similar results hold for the post- vs. pre-event samples, available on request.
5. Discussion and Conclusion
We examine the impact of entrepreneurial exit mode on innovation outcomes, as measured by
patent and product data. We construct a firm-year panel dataset of all venture capital funded
biotechnology firms founded between 1980-2000, and track these firms through the end of 2006. To
address the possible effects of self-selection of exit mode based on unobservables, we conduct a quasi-
experiment in which we compare factual exits with “nearly complete” exits. We also use an instrumental
variables approach. Our findings suggest that firms experiencing an IPO have a short-term boost in
forward patent citations and in product portfolio outcomes, but that these effects fade with time. Average
firm patent generality increases post-IPO, but average patent originality declines, and both effects hold
over the longer term. Inventor-level analyses suggest that inventor inflows and outflows following an IPO
do not explain the firm-level patterns. Firms undergoing an acquisition in our sample experienced a
durable increase in forward patent citations and in their product portfolios, though acquired firms
structurally integrated to the acquirer did worse on these dimensions (and firms acquired by
technologically similar firms outperformed). Average patent originality and generality are unaffected by
M&As. Inventor-level analyses suggest that while M&A affects inventor inflow and outflow, more
productive inventors join firms post-M&A.
Our IPO results suggest an inverted-U shaped innovation pattern, with innovation peaking a few
years following an IPO. A number of theories in the literature are consistent with our empirical patterns.
One group of explanations center on effort and incentives associated with the IPO. The innovation ramp-
up leading to an IPO may result from a “window-dressing” effect (Stein, 1989; Jain and Kini, 1994). The
pre-IPO innovation run-up as compared to the M&A patterns is consistent with Schweinbacher’s (2008)
theory regarding entrepreneurial control preferences. The results are consistent with possible short-
termism associated with reporting requirements as a public company (Ferreira et al., 2010), which may
dampen incentives for experimentation, an important condition for innovation. The empirical patterns are
also consistent with demand for capital effects along the product lifecycle (Chemmanur et al., 2010), and

19
with possible differences in corporate investments undertaken by public as compared to private firms
(Asker et al., 2011). Contemporaneous work by Bernstein (2012) enables us to triangulate our IPO
results: that paper finds a decrease in patent quality due to an increase in skilled inventor outflow. While
we do not find a similar pattern of inventor outflows in our study, our inverted-U pattern is consistent
with the finding of an overall innovation decline over the longer-term following an IPO.
Our M&A results are consistent with complementarity theories and some scientific labor market
theories. While most of the prior literature considering the effect of M&A on innovation offers across-
industry evidence, we present results within an industry, and pursue empirical strategies to isolate
treatment rather than selection effects. Our results suggest that biotechnology mergers can contribute to
innovation, and likely result from complementarities with acquirers. This is consistent with the Lerner et
al. (2011) results in the context of private equity-based acquisitions. Our finding that the entity being
acquired hires more productive inventors post-acquisition is consistent with corporate legitimization
effects, and may also reflect more sophisticated incentive plans as a result of being acquired. Another
labor market theory consistent with the effects is that employees of an acquired firm may have strong
incentives to perform after an acquisition for job protection reasons (though it would seem such effects
may be expected to abate over time, while we find sustained effects). We are unable to observe resources
devoted by an acquirer to the enterprise, which would be important in directly examining the central
mechanism in the Seru (forthcoming) paper highlighting information asymmetries between managers in a
division within a conglomerate and internal resource markets. Extrapolating the argument from Cassiman,
et al. (2005) that when merged entities are technologically substitutive they significantly reduce their
R&D level after the M&A (and the opposite under complementarity), it may be the case that in our
empirical setting investments tend to increase in ways that eclipse the effect of information asymmetry.
In summary, we utilize an industry setting with desirable dimensions of homogeneity to evaluate
the innovation implications of entrepreneurial firms’ choice among a menu of alternative exit mode
options. Our empirical methods address the challenge of inference based on self-selection effects by
controlling directly for firm-level qualities, by utilizing both exit event and “near-exit” event
observations, and by instrumenting for the relative attractiveness of different exit modes relative to one
another using market-based measures of financing channel liquidity. We use alternative outcome
measures based on patent and product data (which show consistent within-mode results) and find that
innovation outcomes diverge significantly by entrepreneurial exit mode. We conclude that entrepreneurial
firms’ exit mode selection affects innovation outcomes.

20
References Ahuja, G., R. Katila. 2001. Technological acquisitions and the innovation performance of acquiring firms: A longitudinal study. Strategic Management Journal 22(3): 197-220. Asker, J., J. Farre-Mensa, A. Ljungqvist. 2011. Comparing the investment behavior of public and private
firms. NBER working paper 17394. Baker, M., P. A. Gompers. 2003. The determinants of board structure at the initial public offering. Journal of
Law and Economics 46: 569-598. Battacharya, S., J. Ritter. 1981. Innovation and communication: Signaling with partial disclosure. Review of
Economic Studies 50(2): 331-346. Bayar, O., T. J. Chemmanur. Forthcoming. IPOs versus acquisitions and the valuation premium puzzle: A theory of exit choice by entrepreneurs and venture capitalists. Journal of Financial and Quantitative Analysis. Benner, M., M. Tushman. 2002. Process management and technological innovation: A longitudinal study of the photography and paint industries. Administrative Science Quarterly 47(4): 676-706. Benninga, S., M. Helmantel, O. Sarig. 2005. The timing of initial public offerings. Journal of Financial
Economics 75(1): 115-132. Bernstein, S. 2012. Does going public affect innovation? Working Paper, Harvard University. Bodnaruk, A., E. Kandel, M. Massa, A. Simonov. 2008. Shareholder diversification and the decision to go public. Review of Financial Studies 21(6): 2779-2824. Boot, A. W. A., R. Gopalan, Thakor, A. V. 2006. The entrepreneur’s choice between private and public ownership. Journal of Finance 61(2): 803-836. Brau, J. C., S. E. Fawcett. 2006. Initial public offerings: An analysis of theory and practice. Journal of Finance 61(1): 399-436. Brau, J., F. Francis, N. Kohers. 2003. The choice of IPO versus takeover: Empirical evidence. Journal of
Business 76(4): 583-612. Cassiman, B., M. G. Colombo, P. Garrone, R. Veugelers. 2005. The impact of M&A on the R&D process: An empirical analysis of the role of technological- and market-relatedness. Research Policy 34(2): 195-220. Chaudhuri, S., B. Tabrizi. 1999. Capturing the real value in high-tech acquisitions. Harvard Business Review
September-October: 123-130. Chemmanur, T. J., S. He, D. K. Nandy. 2010. The going-public decision and the product market. Review of
Financial Studies 23(5): 1855-1908. Cumming, D. 2008. Contracts and exits in venture capital finance. Review of Financial Studies 21(5): 1947-1982. Desyllas, P., A. Hughes. 2010. Do high technology acquirers become more innovative? Research Policy 39(8): 1105-1121.

21
Ferreira, D., G. Manso, A. C. Silva. 2010. Incentives to innovate and the decision to go public or private. MIT Sloan Research Paper 4799-10. Gompers, P., J. Lerner. 2004. The Venture Capital Cycle. MIT Press, Cambridge, MA. Graebner, M. E., K. M. Eisenhardt. 2004. The seller’s side of the story: Acquisition as courtship and governance as syndicate in entrepreneurial firms. Administrative Science Quarterly 49(3): 366-403. Granstrand, O., S. Sjolander. 1990. The acquisition of technology and small firms by large firms. Journal of
Economic Behavior and Organization 13(3): 367-386. Guedj, I. 2009. Ownership vs. contract: How vertical integration affects investment decisions in
pharmaceutical R&D. Working Paper, University of Texas at Austin. Guo, R., B. Lev, N. Zhou. 2004. Competitive costs of disclosure by biotech IPOs. Journal of Accounting
Research 42(2): 319-355. Hall, B., A. Jaffe, M. Trajtenberg. 2001. The NBER patent citations data file: Lessons, insights and methodological tools. NBER Working Paper 8498. Henderson, R. M., K. Clark. 1990. Architectural innovation: The reconfiguration of existing product technologies and the failure of established firms. Administrative Science Quarterly 35(1): 9-30. Hellmann, T. 2006. IPOs, acquisitions, and the use of convertible securities in venture capital. Journal of
Financial Economics 81(3): 649-679. Higgins, M. J., D. Rodriguez. 2006. The outsourcing of R&D through acquisitions in the pharmaceutical industry. Journal of Financial Economics 80(2): 351-383. Hitt, M. A., R. E. Hoskinsson, R.D. Ireland, J.S. Harrison. 1991. Effects of acquisitions on R&D inputs and outputs. Academy of Management Journal 34(3): 693-706. Inderst, R., H. Muller. 2004. The effect of capital market characteristics on the value of start-up firms. Journal
of Financial Economics 72(2): 319-356. Jaffe, A. 1986. Technological opportunity and spillovers of R&D: Evidence from firms’ patents, profits and market value. American Economic Review 76(5): 984-1001. Jain, B., O. Kini. 1994. The post-issue operating performance of IPO firms. Journal of Finance 49(5): 1699-1726. Kapoor, R., K. Lim. 2007. The impact of acquisitions on the productivity of inventors at semiconductor firms: A synthesis of knowledge-based and incentive-based perspectives. Academy of Management Journal 50(5): 1133-1155. Kim, W., M. S. Weisbach. 2008. Motivations for public equity offers: An international perspective. Journal of
Financial Economics 87(2): 281-307 Kortum, S., J. Lerner. 2000. Assessing the contribution of venture capital to innovation. RAND Journal of
Economics 31(4): 674-692. Lai, R., A. D’Amour, A. Yu, Y. Sun, L. Fleming. 2011. Disambiguation and co-authorship networks of the U.S. patent inventor database (1975-2010). Working Paper, Harvard University.
22
Lerner, J. 1994. Venture capitalists and the decision to go public. Journal of Financial Economics 35(3): 293-316. Lerner, J., M. Sorensen, P. Stromberg. 2011. Private equity and long-run investment: The case of innovation. Journal of Finance 66(2): 445-477. Levin, R. C., A. K. Klevorick, R. R. Nelson, S. G. Winter. 1987. Appropriating the returns from industrial research and development. Brookings Papers on Economic Activity 3: 783-832. Maksimovic, V., P. Pichler. 2001. Technological innovation and initial public offerings. Review of Financial
Studies 14(2): 459-494. Pagano, M., F. Panetta, L. Zingales. 1998. Why do companies go public? An empirical enalysis. Journal of
Finance 53(1): 27-64. Poulsen, A. B., M. Stegemoller. 2008. Moving firms from private to public ownership: Selling out to public firms versus initial public offerings. Financial Management 37(1): 81-101. Puranam, P., H. Singh, M. Zollo. 2006. Organizing for innovation: Managing the coordination-autonomy dilemma in technology acquisitions. Academy of Management Journal 49(2): 263-280. Price, D. A. 2008. The Pixar Touch: The Making of a Company. Alfred A. Knopf, New York. Ritter, J. R., I. Welch. 2002. A review of IPO activity, pricing, and allocations. Journal of Finance 57(4): 1795-1826. Rivlin, G. 2005. Innovators; does the kid stay in the picture? New York Times, February 22. Schwienbacher, A. 2008. Innovation and venture capital exits. Economic Journal 118(533): 1888-1916. Seru, A. Forthcoming. Firm boundaries matter: Evidence from conglomerates and R&D activity. Journal of
Financial Economics. Stein, J. 1989. Efficient capital markets, inefficient firms: A model of myopic corporate behavior. Quarterly
Journal of Economics 104(4): 655-669. Stuart, T. E., H. Hoang, R. Hybels. 1999. Interorganizational endorsements and the performance of entrepreneurial ventures. Administrative Science Quarterly 44(2): 315-349. Stuart, T. E., O. Sorenson. 2003. Liquidity events and the geographic distribution of entrepreneurial activity. Administrative Science Quarterly 48(2): 175-201. Trajtenberg, M. 1990. A penny for your quotes: Patent citations and the value of innovations. RAND Journal
of Economics 21(1): 172-187. Zhao, X. 2009. Technological innovation and acquisitions. Management Science 55(7): 1170-1183.

23
Table 1
Descriptive statistics and variable definitions*
(Firm-year unit of analysis)
VARIABLE DEFINITION MEAN STD. DEV.
Dependent variables
Forward patent citations 4
year
Forward patent citations to firm i’s flow of patents within 4 years of patent grant
3.03 16.45
Average patent generality 1- Herfindahl concentration of patent class assignments associated with patents referencing the focal patent, averaged at the firm level
0.39 0.24
Average patent originality 1- Herfindahl concentration of patent class assignments associated with patents referenced by the focal patent, averaged at the firm level
0.43 0.23
Products in portfolio § Weighted count of the number of products in each stage of the FDA approval process for firm i in year t (see text for weighting scheme)
2.12 8.76
Independent variables
Event and time variables
Focal IPO sample Dummy = 1 only for all firm-years (pre- and post-event) associated with a firm undergoing an IPO
0.43 0.49
Focal M&A sample Dummy = 1 only for all firm-years (pre- and post-event) associated with a firm undergoing an M&A
0.39 0.49
Focal, post-IPO window Dummy = 1 for the time window 1 to 3 years (inclusive) post the IPO event
0.05 0.21
Focal, post-M&A window Dummy = 1 for the time window 1 to 3 years (inclusive) post the M&A event
0.04 0.20
Biotechnology firm characteristics Age Age in years of the focal firm as of year t 8.60 6.15
VC inflows stock Cumulative VC inflows invested in the focal firm to year t (in $M)
9.59 22.63
Strategic alliance stock Cumulative number of strategic alliances the focal firm had entered into as of year t as reported by Recap
6.13 14.51
Structural integration Dummy = 1 if following an acquisition, firm i which was listed in the Corptech directory of Technology Companies prior to the acquisition is no longer listed
0.20 0.40
Technology overlap Normalized angular separation between vectors of primary patent classes of acquired and acquiring firms (see text; formula follows Jaffe (1986))
0.57 0.32
Instrumental variables
IPO vs. VC liquidity Relative annual deal value to biotech start-ups offered by first relative to second channel (% differences of each calculated as focal yr relative to prior 3 yr avg)
0.55 2.10
M&A vs. VC liquidity 0.02 1.32
IPO vs. M&A liquidity 0.25 2.15
The natural logarithm of a variable, X, will be denoted L X. § denotes data compiled only for firms founded post-1989.

24
Table 2: Description of events and firms
Panel A: Tabulation of events by year groups
Year span Acquisitions
Withdrawn
acquisitions IPOs
Withdrawn
IPOs
1980-1984 0 0 15 0
1985-1989 4 2 20 2
1990-1994 11 2 59 7
1995-1999 57 2 46 8
2000-2004 62 10 44 17
2005-2006 28 2 12 3
Total 162 18 196 37
Panel B: Firm characteristics at time of exit or near-exit
Firms going public Near-IPOs Firms acquired Near-M&As Privately-held
mean std. dev. mean std. dev. mean std. dev. mean std. dev. mean std. dev.
Age 6.41 3.90 5.71 2.99 9.22 5.09 11.67* 6.93 8.26 6.08
VC inflow stock 32.99 43.39 50.64** 44.95 28.67 37.82 19.93 28.26 5.91 15.96
Strategic alliance stock
8.84 8.30 9.41 6.52 14.58 23.21 28.35* 53.09 2.51 6.63
Fwd patent cites 4yr stock
39.82 85.92 70.65* 141.85 86.90 211.24 243.56*** 441.41 14.44 62.46
Avg patent generality
0.43 0.23 0.28*** 0.17 0.31 0.22 0.37 0.24 0.39 0.26
Avg patent originality
0.43 0.24 0.35 0.21 0.46 0.23 0.43 0.17 0.41 0.25
Products in portfolio stock §
146.08 196.89 160.60 257.03 53.98 89.89 73 77.73 30.73 58.35
§ denotes data compiled only for firms founded post-1989; *, **, *** indicates significance differences at the 10, 5, and 1% levels.

25
Table 3
Post- vs. pre-event innovation comparisons (firm-year level of analysis)
Post- vs. pre-IPO
innovation comparisons
Post- vs. pre-M&A
innovation comparisons
Dependent variable
Forward patent citations
4 years
Avg patent
generality
Avg patent
originality
Forward patent citations
4 years
Avg patent
generality
Avg patent
originality
Estimation method
FE negative binomial Panel tobit FE negative binomial Panel tobit
(3-1) (3-2) (3-3) (3-4) (3-5) (3-6) (3-7) (3-8)
Focal, post-
event (1,3)
[1.796]*** (0.126)
[1.185]** (0.090)
0.061*** (0.018)
-0.044*** (0.016)
[2.444]*** (0.187)
[1.524]*** (0.142)
0.019 (0.022)
0.015 (0.018)
Focal, post-
M&A (1,3) *
integration
[0.622]** (0.136)
-0.066 (0.050)
0.053 (0.040)
Firm-level
controls
No Yes Yes Yes No Yes Yes Yes
Event year FE No Yes Yes Yes No Yes Yes Yes
Constant 0.675*** (0.027)
0.349*** (0.024)
0.636*** (0.029)
0.361*** (0.027)
Log likelihood
-7109.53 -6101.57 -236.92 -30.22 -4989.19 -3598.42 -155.89 -32.76
# observations (# firms)
5157 (191) 3415 (189) 1472 (190) 1665 (191) 4239 (157) 2147 (122) 888 (129) 978 (128)
Values are [incidence rate ratios] regression coefficient (standard errors). *, ** or *** indicates statistical significance at 10%, 5%, and 1%. Firm-level controls include L Age and L VC inflows stock.
26
Table 4
Liquidity event vs. near liquidity event innovation comparisons (firm-year level of analysis)
IPO vs. near-IPO M&A vs. near-M&A
Dependent var Fwd pat cites 4 yr Avg pat gen Avg pat orig Fwd pat cites 4 yr Avg pat gen Avg pat orig
Est. method FE negative binomial Panel tobit FE negative binomial Panel tobit
(4-1) (4-2) (4-3) (4-4) (4-5) (4-6) (4-7) (4-8)
Focal, post-
event (1,3)
[1.174]** (0.089)
0.060*** (0.018)
-0.047*** (0.016)
[1.294]*** (0.107)
0.007 (0.020)
0.010 (0.016)
Focal sample [1.136] (0.196)
[0.857] (0.153)
0.132*** (0.046)
0.041 (0.042)
[0.752] (0.154)
[0.824] (0.172)
-0.118* (0.071)
-0.062 (0.065)
Focal, 4 years
prior
[1.812]*** (0.201)
[0.233]*** (0.075)
Focal, 3 years
prior
[2.076]*** (0.218)
[0.448]*** (0.103)
Focal, 2 years
prior
[2.323]*** (0.241)
[0.454]*** (0.097)
Focal, 1 year
prior
[2.401]*** (0.245)
[0.631]*** (0.116)
Focal event
year
[2.886]*** (0.385)
[1.238] (0.254)
Focal, 1 year
post
[1.869]*** (0.218)
[0.819] (0.124)
Focal, 2 years
post
[1.422]*** (0.178)
[1.449]*** (0.175)
Focal, 3 years
post
[1.288]* (0.177)
[1.289]** (0.155)
Focal, 4 years
post
[1.091] (0.167)
[1.499]*** (0.172)
Firm controls Yes Yes Yes Yes Yes Yes Yes Yes
Event year FE Yes Yes Yes Yes Yes Yes Yes Yes
Constant 0.541*** (0.048)
0.320*** (0.044)
0.750*** (0.075)
0.423*** (0.069)
LL -6399.04 -6099.68 -280.94 -54.87 -4217.84 -4032.60 -206.87 -49.63
N (# firms) 3646 (206) 3334 (206) 1558 (207) 1774 (208) 2591 (154) 2382 (154) 1028 (157) 1150 (158)
Values are [incidence rate ratios] regression coefficient (standard errors). *, ** or *** indicates statistical significance at 10%, 5%, and 1%. Firm-level controls include L Age and L VC inflows stock.

27
Table 5
Liquidity event vs. privately-held innovation comparisons (firm-year level of analysis)
IPO vs. privately-held
innovation comparisons
M&A vs. privately-held
innovation comparisons
Dep Var Fwd cites 4yr L(fwd cites
4yr)
Avg patent
generality Avg patent
originality Fwd cites 4yr L(fwd cites
4yr)
Avg patent
generality Avg patent
originality
Est method FE NB FE IV OLS Panel tobit FE NB FE IV OLS Panel tobit
(5-1) (5-2) (5-3) (5-4) (5-5) (5-6) (5-7) (5-8)
Focal, post-event
(1,3)
[1.137]* (0.085)
0.101** (0.047)
0.056*** (0.019)
-0.050*** (0.016)
[1.324]*** (0.109)
0.091** (0.044)
0.008 (0.021)
0.008 (0.017)
Focal sample [1.463]*** (0.118)
0.068*** (0.025)
-0.001 (0.022)
[1.270]*** (0.109)
0.049* (0.027)
-0.001 (0.024)
Firm-level
controls
Yes Yes Yes Yes Yes Yes Yes Yes
Event year FE Yes Yes Yes Yes Yes Yes Yes Yes
Constant 0.605*** (0.035)
0.615*** (0.026)
0.352*** (0.023)
0.675*** (0.034)
0.594*** (0.028)
0.361*** (0.025)
LL/R-squared -7851.71 0.05 -454.27 -173.17 -5751.52 0.04 -407.43 -197.24
# observations (# firms)
5073 (294) 6338 (383) 1931 (300) 2195 (307) 4150 (254) 5604 (361) 1437 (262) 1623 (269)
Values are [incidence rate ratios] regression coefficient (standard errors). *, ** or *** indicates statistical significance at 10%, 5%, and 1%. Firm-level controls include L Age and L VC inflows stock.

28
Table 6
Choice between IPO vs. M&A innovation comparisons (firm-year level of analysis)
Sample Firms undergoing either an M&A or an IPO Firms undergoing an M&A and an IPO
Dependent Variable Fwd cites 4yr L(fwd cites
4yr)
Avg patent
generality Avg patent
originality Fwd cites 4yr Avg patent
generality Avg patent
originality
Est method FE NB FE IV OLS Panel tobit FE NB Panel tobit
(6-1) (6-2) (6-3) (6-4) (6-5) (6-6) (6-7)
Focal, post-IPO (1,3) [1.138]* (0.086)
0.088* (0.053)
0.060*** (0.018)
-0.049** (0.016)
[1.138] (0.128)
0.034 (0.026)
-0.053** (0.023)
Focal, post-M&A
(1,3)
[1.211]** (0.119)
-0.011 (0.023)
0.006 (0.019)
Focal IPO sample [1.619]*** (0.158)
0.064** (0.028)
-0.044* (0.025)
Firm-level controls Yes Yes Yes Yes Yes Yes Yes
Event year FE Yes Yes Yes Yes Yes Yes Yes
Constant 0.798*** (0.047)
0.612*** (0.029)
0.410*** (0.027)
0.628*** (0.035)
0.332*** (0.033)
LL/R-squared -7119.26 0.03 -330.67 -73.57 -3105.07 -88.62 -3.74
# observations (# firms)
4319 (251) 4730 (287) 1748 (254) 1980 (255) 1673 (93) 735 (94) 820 (95)
Values are [incidence rate ratios] regression coefficient (standard errors). *, ** or *** indicates statistical significance at 10%, 5%, and 1%. Firm-level controls include L Age and L VC inflows stock.

29
Table 7 Product outcomes (firm-year level of analysis)
Dep. var. / est. method
Weighted products in portfolio / FE negative binomial
Sample IPOs IPOs & withdrawn
IPOs
IPOs & (always)
privately held
M&As M&As & withdrawn
M&As
M&As & (always)
privately held
Firms undergoing
IPO or M&A
Firms undergoing
IPO & M&A
Comparison
Post vs. Pre IPO
Actual vs. near IPO
IPO vs. privately held
Post vs. Pre M&A
Actual vs. near M&A
M&A vs. privately held
IPO vs. M&A
IPO vs. M&A
(7-1) (7-2) (7-3) (7-4) (7-5) (7-6) (7-7) (7-8)
Focal, post-
IPO (1,3)
[1.308]** (0.154)
[1.327]** (0.155)
[1.529]*** (0.179)
[1.248]* (0.145)
[1.217] (0.249)
Focal IPO
sample
[0.752] (0.139)
[0.368]*** (0.048)
[1.528]*** (0.230)
Focal, post-
M&A (1,3)
[2.774]*** (0.441)
[2.181]*** (0.298)
[1.894]*** (0.248)
[2.069]*** (0.394)
Focal M&A
sample
[0.614] (0.243)
[0.228]*** (0.032)
Firm-level
controls
Yes Yes Yes Yes Yes Yes Yes Yes
Event year FE Yes Yes Yes Yes Yes Yes Yes Yes
Log likelihood
-1984.17 -2280.34 -2876.30 -1088.35 -1312.57 -2192.43 -2484.32 -764.36
# observations (# firms)
920 (70) 1073 (82) 1468 (116) 734 (55) 929 (70) 1451 (114) 1399 (106) 445 (34)
Values are [incidence rate ratios] (standard errors). *, ** or *** indicates statistical significance at 10%, 5%, and 1%. Firm-level controls include L Age and L VC inflows stock.

30
Table 8
Exit event window robustness regressions (firm-year level of analysis)
Dep. var. / est. method
Forward patent citations
4 years / FE negative binomial
Sample IPOs IPOs & withdrawn
IPOs
IPOs & (always)
privately held
M&As M&As & withdrawn
M&As
M&As & (always)
privately held
Firms undergoing
IPO or M&A
Firms undergoing
IPO & M&A
Comparison
Post vs. Pre IPO
Actual vs. near IPO
IPO vs. privately held
Post vs. Pre M&A
Actual vs. near M&A
M&A vs. privately held
IPO vs. M&A
IPO vs. M&A
Non-window
RHS same as:
(3-2) (4-1) (5-1) (3-6) (4-5) (5-5) (6-1) (6-5)
(8-1) (8-2) (8-3) (8-4) (8-5) (8-6) (8-7) (8-8)
Focal, post-
IPO (1,3)
[1.185]** (0.090)
[1.174]** (0.089)
[1.137]* (0.085)
[1.138]* (0.086)
[1.138] (0.128)
Focal, post-
IPO (1,4)
[1.125] (0.082)
[1.109] (0.080)
[1.070] (0.076)
[1.070] (0.077)
[1.040] (0.113)
Focal, post-
IPO (1,5)
[1.070] (0.077)
[1.050] (0.075)
[1.010] (0.071)
[1.009] (0.071)
[0.948] (0.103)
Focal, post-
IPO (2,5)
[0.944] (0.075)
[0.927] (0.074)
[0.895] (0.070)
[0.894] (0.070)
[0.778]** (0.096)
Focal, post-
IPO (1,10)
[0.739]*** (0.059)
[0.718]*** (0.056)
[0.693]*** (0.052)
[0.683]*** (0.052)
[0.500]*** (0.061)
Focal, post-
M&A (1,3)
[1.522]*** (0.141)
[1.294]*** (0.107)
[1.324]*** (0.109)
[1.211]** (0.119)
Focal, post-
M&A (1,4)
[1.829]*** (0.154)
[1.549]*** (0.117)
[1.577]*** (0.117)
[1.416]*** (0.126)
Focal, post-
M&A (1,5)
[2.195]*** (0.174)
[1.859]*** (0.132)
[1.880]*** (0.132)
[1.736]*** (0.145)
Focal, post-
M&A (2,5)
[2.252]*** (0.180)
[1.989]*** (0.142)
[2.010]*** (0.143)
[1.842]*** (0.155)
Focal, post-
M&A (1,10)
[3.284]*** (0.268)
[2.839]*** (0.211)
[2.810]*** (0.208)
[2.703]*** (0.225)
Values are [incidence rate ratios] (standard errors). *, ** or *** indicates statistical significance at 10%, 5%, and 1%. Each cell represents a different (full) regression equation with only the focal time window changed relative to the specification listed in the fourth row in the table.

31
Table 9
Inventor level analyses (inventor-year level of analysis)
Sample IPOs & withdrawn IPOs M&As & withdrawn M&As
Dependent Variable Pr (inventor departs focal
firm)
Pr (inventor joins focal firm)
Stock of
inventor fwd
cites 4yr
Pr (inventor departs focal
firm)
Pr (inventor joins focal firm)
Stock of
inventor fwd
cites 4yr
Estimation method RE logit RE logit FE Neg. Bin. RE logit RE logit FE Neg. Bin.
(9-1) (9-2) (9-3) (9-4) (9-5) (9-6)
Focal, post-event (1,3) -0.053 (0.365)
0.245 (0.183)
[0.963] (0.025)
0.932** (0.457)
-0.701** (0.317)
[0.941]* (0.032)
Focal event sample -0.052 (0.343)
0.096 (0.225)
[0.673]*** (0.042)
1.152* (0.676)
0.440 (0.324)
[1.833]*** (0.214)
Inventor change out
[1.021] (0.081)
[0.941] (0.305)
Inventor change in
[0.929] (0.047)
[0.728]*** (0.051)
Focal event sample *
inventor change out
[0.983] (0.080)
[1.115] (0.363)
Focal event sample *
inventor change in
[0.952] (0.049)
[1.208]*** (0.086)
Focal, post-event (1,3)
* inventor change out
[1.052] (0.078)
[0.969] (0.082)
Focal, post-event (1,3)
* inventor change in
[0.950] (0.038)
[1.159]** (0.078)
Firm & inventor
controls
Yes Yes Yes Yes Yes Yes
Inventor FE No No Yes No No Yes
Event year FE Yes Yes Yes Yes Yes Yes
Constant -6.539*** (0.451)
6.891*** (0.492)
-8.374*** (0.964)
6.804*** (0.719)
Log likelihood -2144.46 -7920.45 -28927.20 -794.73 -3777.57 -14291.88
# obs. (# inventors) 17,811 (7,332) 17,811 (7,332) 13,211 (3,332) 8,707 (3,676) 8,735 (3,697) 6,560 (1,718)
Values are [incidence rate ratios] regression coefficient (standard errors). *, ** or *** indicates statistical significance at 10%, 5%, and 1%. Firm-level controls include L age and L VC inflows stock; inventor-level control is L years since first invention.
32
Figure 1
Panel A: Relative intensity of M&A to IPOs in VC-backed start-ups, 1992-2007
Panel B: Relative intensity of M&A to IPOs in VC-backed biotech firms, 1992-2007
Note: data for M&A deal value for Panel B is unavailable for 1992-1999. Source: DowJones/VentureSource
0.00
5.00
10.00
15.00
20.00
25.00
1992 1993 1994 1995 1996 1997 1998 1999 2000 2001 2002 2003 2004 2005 2006 2007
Ratio of amt raised M&A/IPO by VC-backed firms
Ratio of M&A deals/IPOs by VC-backed firms
0
1
2
3
4
5
6
7
8
9
1992 1993 1994 1995 1996 1997 1998 1999 2000 2001 2002 2003 2004 2005 2006 2007
Ratio of amt raised M&A/IPO by VC-backed firms
Ratio of M&A deals/IPOs by VC-backed firms