entrails - ipdps - ieee international parallel & distributed … · 2014-06-10 · mlc flash...
TRANSCRIPT

IPDPS Keynote May 21, 2014
Reading the Tea-Leaves:How Architecture Has
Evolved at the High EndPeter M. Kogge
McCourtney Prof. of CS & Engr.University of Notre Dame
Acknowledgement: This work was funded in part by the US Dept. of
Energy, Sandia National Labs, as part of their XGC project,
and in part by the DOE PSAAP C-SWARM Project.
Entrails

IPDPS Keynote May 21, 2014
Rationale Behind This Talk
• Track technology trends
• Understand “best of breed”
• Project ahead
• Identify “tall poles”
• Do so on yearly basis– First as part of EXASCALE technology report
– Then as yearly updates under Sandia XGC project
– In future under DOE PSAAP C-SWARM Center

IPDPS Keynote May 21, 2014
Topics
• 2004: Technology “Perfect Storm”
• Our Current Architecture Spectrum
• The Exascale Memory Energy Horror Show
• TOP500 Lessons
• GRAPH500 Lessons
• HPCC Lessons
• 3D Stack Projections

IPDPS Keynote May 21, 2014
The Technology Environment
• We all believe death of Moore’s Law is in sight
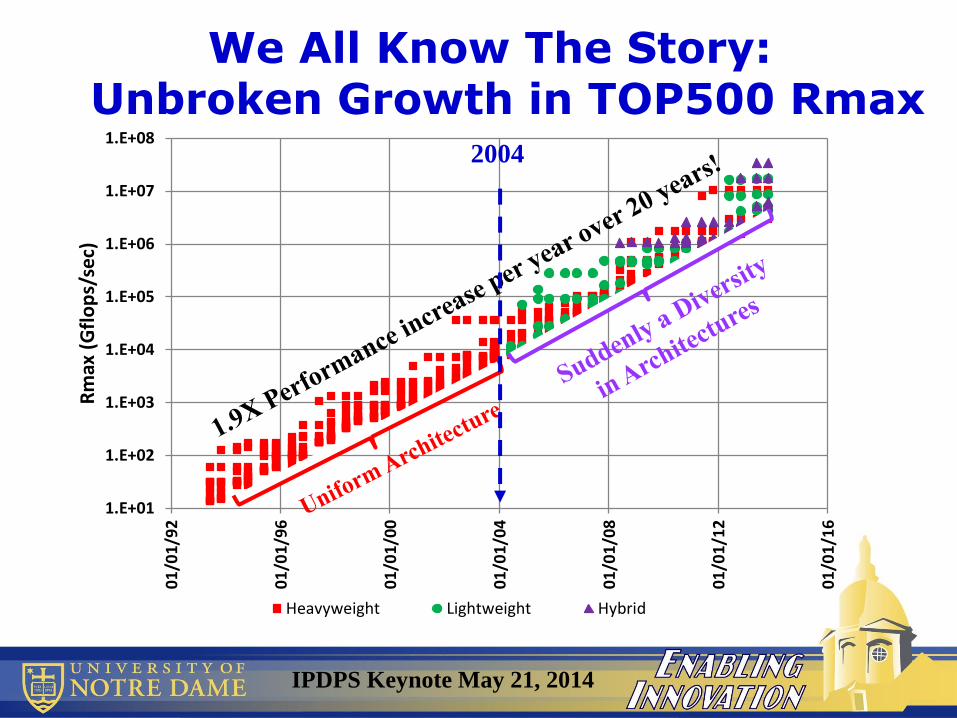
• And “TOP500” has continued unabated for 20 years
• But the world already changed in 2004
• Problem: Power Wall Limits Clock
• Problem: Loss of Memory Density
• Problem: Loss of off Chip Bandwidth
• Result: Have entered era of very massive parallelism
IPDPS Keynote May 21, 2014
1.E+01
1.E+02
1.E+03
1.E+04
1.E+05
1.E+06
1.E+07
1.E+08
01
/01
/92
01
/01
/96
01
/01
/00
01
/01
/04
01
/01
/08
01
/01
/12
01
/01
/16
Rm
ax (
Gfl
op
s/se
c)
Heavyweight Lightweight Hybrid
We All Know The Story:Unbroken Growth in TOP500 Rmax
2004

IPDPS Keynote May 21, 2014
But When We Look DeeperSomething Big Happened in 2004!
Cores/socket increased
Clock rates went flat
Memory/core went flat
Total Cores increased
even faster
Flops/cycle increased
even faster
0.50
0.75
1.00
1.25
1.50
1.75
2.00
2.25
2.50
01
/01
/96
01
/01
/00
01
/01
/04
01
/01
/08
01
/01
/12
Co
mp
ou
nd
An
nu
al G
row
th R
ate:
CA
GR
Rmax (Gflop/s) Total Cores
Ave Cycles/sec per core (Mhz) Mem/Core (GB)
Ave. Cores/Socket TC: Total Concurrency (Rmax)
2004
Rmax Growth Continues

IPDPS Keynote May 21, 2014
The 2004 “Perfect Storm”
Single core microprocessors: • more capable & faster• power increase offset by lower
voltagesMemory: more memory/chip• Due to density increase & bigger
chips• Memory latency improves slowlyInterconnect: tracks clock• Wire driven
2004
Moore’s Law: transistor size and intrinsic delay continue to decrease
• Operating Voltage stops decreasing• Chip power exceeds inexpensive cooling• No more performance gains from most complex cores• Off-chip I/O maxes out• Economics of DRAM inhibits bigger chips• Wire interconnect peaks
2020Today
The rise of multi-core:• More, simpler, cores per die• Slower clocks• Relatively constant off-die bandwidthMemory: • Slow density increase• Slow grow in off-memory bandwidthInterconnect: • Complex, power consuming wire• Very complex fiber optics
1970s

IPDPS Keynote May 21, 2014
Power: THE 1st Design Constraint
• Moore’s Law: feature reduction by “S” per year
• Power in CMOS circuit: αCFV2
– αC: average capacitance switched per clock cycle; Scales ≈1/S
– F: clock rate; Intrinsic peak scales as S
– V: operating voltage: This is the problem!
• αCF essentially flat for different Moore generations
• But we can pack S2 more circuits on same chip size
• Thus power: S2 V2
• Before 2004, V declined, reducing increase in power
• After 2004, V has flattened; power can run wild!
– And better cooling is too expensive
• Only option: reduce clock

IPDPS Keynote May 21, 2014
0.0
0.5
1.0
1.5
2.0
2.5
3.0
3.5
4.0
4.5
5.01/1
/80
1/1
/84
1/1
/88
1/1
/92
1/1
/96
1/1
/00
1/1
/04
1/1
/08
1/1
/12
1/1
/16
1/1
/20
1/1
/24
Op
era
tin
g V
olt
ag
e (
Vd
d)
Actual MPU High Performance Logic Low Power Logic DRAM
Flattening Operating Voltage
2004
Today

IPDPS Keynote May 21, 2014
We’ve Hit a Power Ceiling
data from www.cpudb.stanford.edu
1
10
100
1,000
1/1
/80
1/1
/84
1/1
/88
1/1
/92
1/1
/96
1/1
/00
1/1
/04
1/1
/08
1/1
/12
To
tal D
ie P
ow
er
(W
att
s)

IPDPS Keynote May 21, 2014
The Clock Ceiling
data from www.cpudb.stanford.edu
10
100
1,000
10,000
1/1/80 1/1/84 1/1/88 1/1/92 1/1/96 1/1/00 1/1/04 1/1/08 1/1/12
Clock (MHz)

IPDPS Keynote May 21, 2014
Memory Density Increasing, But
1.E-01
1.E+00
1.E+01
1.E+02
1.E+03
1.E+04
1985 1990 1995 2000 2005 2010 2015 2020 2025
Mem
ory
Den
sity
(G
b/c
m2)
DRAM SLC FlashMLC Flash (2b Cells) MLC Flash (3b Cells)MLC Flash (4b Cells) MLC Flash (3D)
IPDPS Keynote May 21, 2014
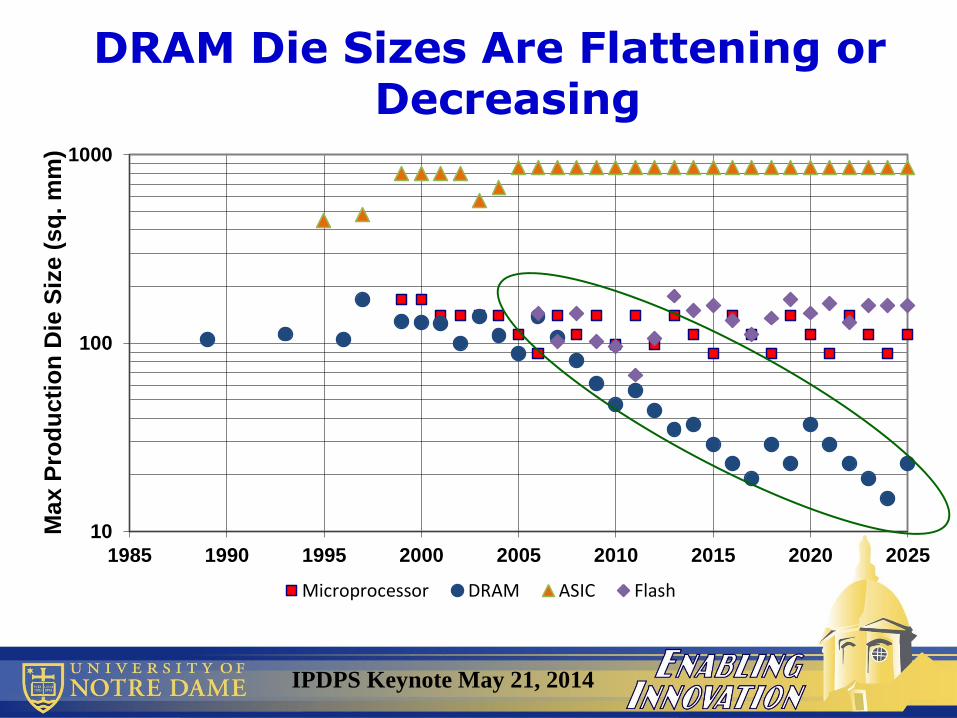
DRAM Die Sizes Are Flattening or Decreasing
10
100
1000
1985 1990 1995 2000 2005 2010 2015 2020 2025
Ma
x P
rod
uc
tio
n D
ie S
ize
(s
q.
mm
)
Microprocessor DRAM ASIC Flash

IPDPS Keynote May 21, 2014
So Memory Density Growth/Die is Slowing
1.E-03
1.E-02
1.E-01
1.E+00
1.E+01
1.E+02
1.E+03
1.E+04
1985 1990 1995 2000 2005 2010 2015 2020 2025
Mem
ory
Cap
acit
y (G
b/c
hip
)
DRAM SLC FlashMLC Flash (2b Cells) MLC Flash (3b Cells)MLC Flash (4b Cells) MLC Flash (3D)

IPDPS Keynote May 21, 2014
Chip I/O Pitch is Flattening
1
10
100
1000
1985 1990 1995 2000 2005 2010 2015 2020 2025
Co
nta
ct
Pit
ch
(m
icro
ns
)
Area Array Flip Chip 2-row Staggered Wedge Bond
Ball Bond 3 row staggered TSV (thermocompression)
TSV (solder microbump) Eqvt. Cost/Perf MPU Eqvt. High Perf MPU
Eqvt. ASIC

IPDPS Keynote May 21, 2014
0.1
1
10
100
2000 2005 2010 2015 2020 2025
Sig
na
llin
g R
ate
(G
Tp
s)
DDR DDR2 DDR3
DDR4 CAGR of 17% CAGR of 12%
GDDR PCI-Express Hypertransport
QPI Differential Differential per wire
And Commodity Off-Chip Signaling Rates At Best Slow Rise

IPDPS Keynote May 21, 2014
Thus “Per Unit Logic” Off-Chip B/W Decaying
0.1
1.0
10.0
2000 2005 2010 2015 2020
Ma
x O
ff-C
hip
B/W
/ M
illi
on
T
ran
sis
tors
(G
bp
s)
All DDRx All GDDR All I/O Protocol

IPDPS Keynote May 21, 2014
With Even Less B/W When We Normalize to “per Cycle”
0
0
1
10
2000 2005 2010 2015 2020
BW
/ M
T / P
ow
er-
lim
ited
Cyc
le
All DDRx All GDDR All I/O Protocol
IPDPS Keynote May 21, 2014
Topics
• 2004: Technology “Perfect Storm”
• Our Current Architecture Spectrum
• The Exascale Memory Energy Horror Show
• TOP500 Lessons
• GRAPH500 Lessons
• HPCC Lessons
• 3D Stack Projections

IPDPS Keynote May 21, 2014
Today’s Heavyweight
DIM
MD
IMM
DIM
MD
IMM
ProcessorSocket
DIM
MD
IMM
DIM
MD
IMM
ProcessorSocket
Router I/O Socket
DIM
MD
IMM
DIM
MD
IMM Processor
Socket
DIM
MD
IMM
DIM
MD
IMM Processor
Socket
A Power 7 Drawer

IPDPS Keynote May 21, 2014
LightWeight ArchitecturesStarting with BlueGene L
2 Nodes per “Compute Card.” Each node:
• A low power compute chip
• Some memory chips
• “Nothing Else”
System Architecture:
• Multiple Identical Boards/Rack
• Each board holds multiple Compute Cards
• “Nothing Else”
• 2 simple dual issue cores
• Each with dual FPUs
• Memory controller
• Large eDRAM L3
• 3D message interface
• Collective interface
• All at subGHz clock“Packaging the Blue Gene/L supercomputer,” IBM J. R&D, March/May 2005
“Blue Gene/L compute chip: Synthesis, timing, and physical design,” IBM J. R&D, March/May 2005

IPDPS Keynote May 21, 2014
BlueGene/Q
http://www.heise.de/newsticker/meldung/SC-2010-IBM-zeigt-BlueGene-Q-mit-17-Kernen-1138226.html
Integrated
• NIC
• Memory controllers
DR
AM
DR
AM
DR
AM
DR
AM Processor
Socket
DR
AM
DR
AM
DR
AM
DR
AM
IPDPS Keynote May 21, 2014
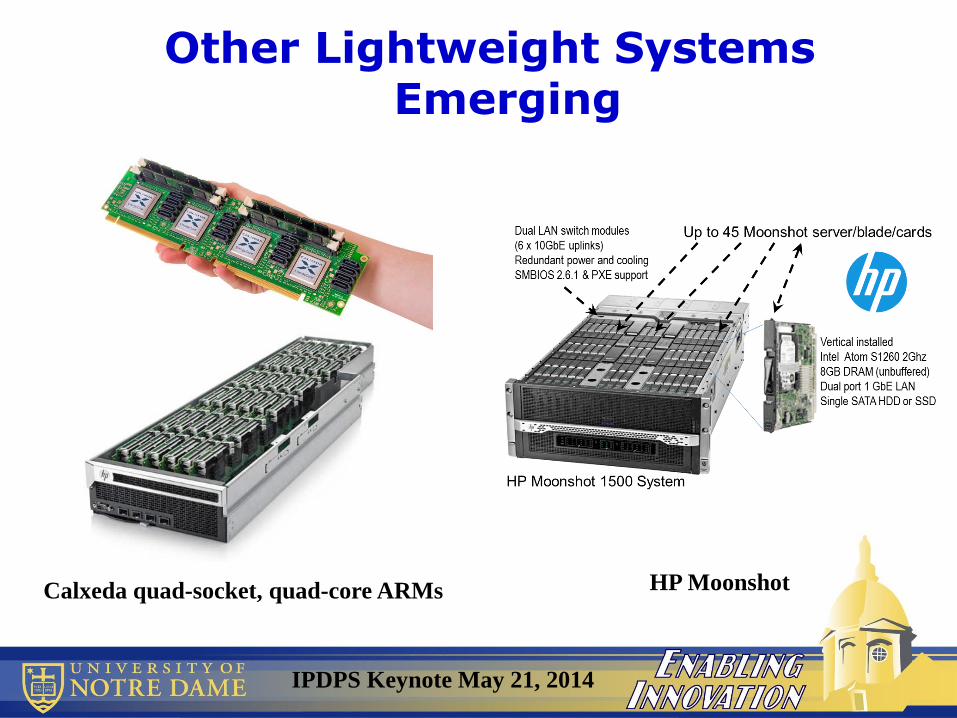
Other Lightweight Systems Emerging
Calxeda quad-socket, quad-core ARMs HP Moonshot
IPDPS Keynote May 21, 2014
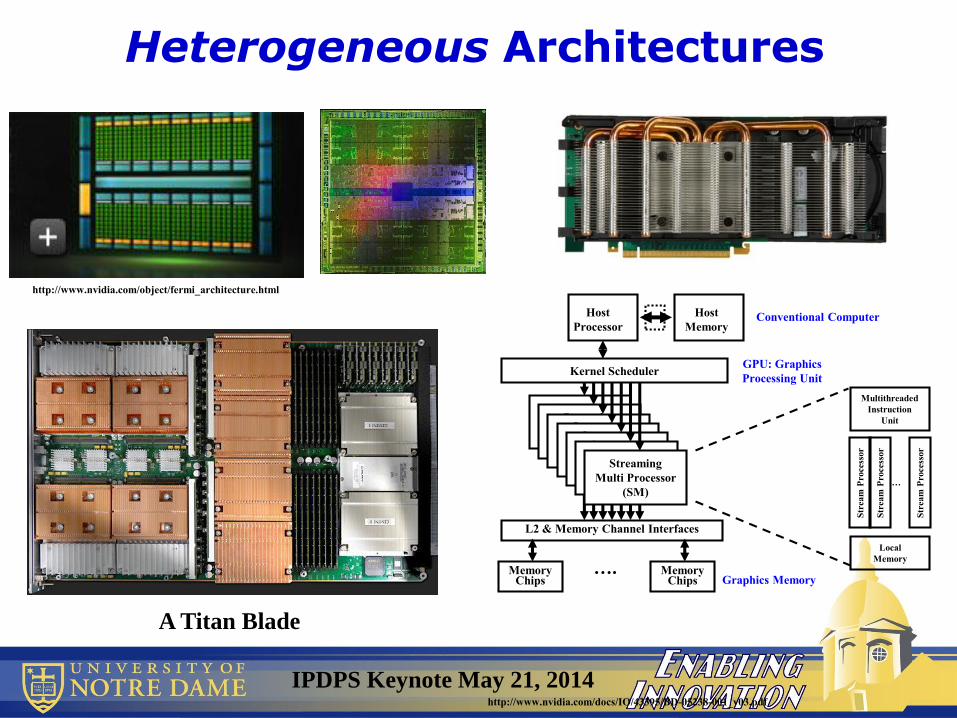
Heterogeneous Architectures
http://www.nvidia.com/object/fermi_architecture.html
Host
Processor
Host
Memory
Streaming
Multi Processor
(SM)
Streaming
Multi Processor
(SM)
Streaming
Multi Processor
(SM)
Streaming
Multi Processor
(SM)
Streaming
Multi Processor
(SM)
Streaming
Multi Processor
(SM)
Streaming
Multi Processor
(SM)
L2 & Memory Channel Interfaces
Kernel Scheduler
MemoryChips
MemoryChips
….
GPU: Graphics
Processing Unit
Conventional Computer
Graphics Memory
Str
eam
Process
or
Str
eam
Process
or
Str
eam
Process
or
Multithreaded
Instruction
Unit
Local
Memory
…
http://www.nvidia.com/docs/IO/43395/BD-05238-001_v03.pdf
A Titan Blade

IPDPS Keynote May 21, 2014
Big Little Architectures
• Heterogeneous multi-core with same ISA
• “Bigger” cores:
– Higher performance
– But less energy efficient
• “Littler” cores:
– Less performance
– But more energy efficient
• Ability to move program states from core to core
• Examples:
– ARM Cortex-A15 and A7, A53 and A57
– Almost Intel Xeon and Xeon PHI
BigCore
Litt
le C
ore
Shared Cache
(b) 2-to-1
BigCore
Litt
le C
ore
Shared Cache
Litt
le C
ore
(a) 1-to-1

IPDPS Keynote May 21, 2014
Topics
• 2004: Technology “Perfect Storm”
• Our Current Architecture Spectrum
• The Exascale Memory Energy Horror Show
• TOP500 Lessons
• GRAPH500 Lessons
• HPCC Lessons
• 3D Stack Projections

IPDPS Keynote May 21, 2014
The Exascale Study Analysis:67MW for 1EF/s = 67pj/flop
(a) Quilt Packaging (b) Thru via chip stack
Reg File
11%
Cache Access
20%
Off-chip
13%
Leakage
28%
On-chip
6%DRAM Access
1%
FPU
21%
But This IGNORED
Most of Memory Access Path!
IPDPS Keynote May 21, 2014
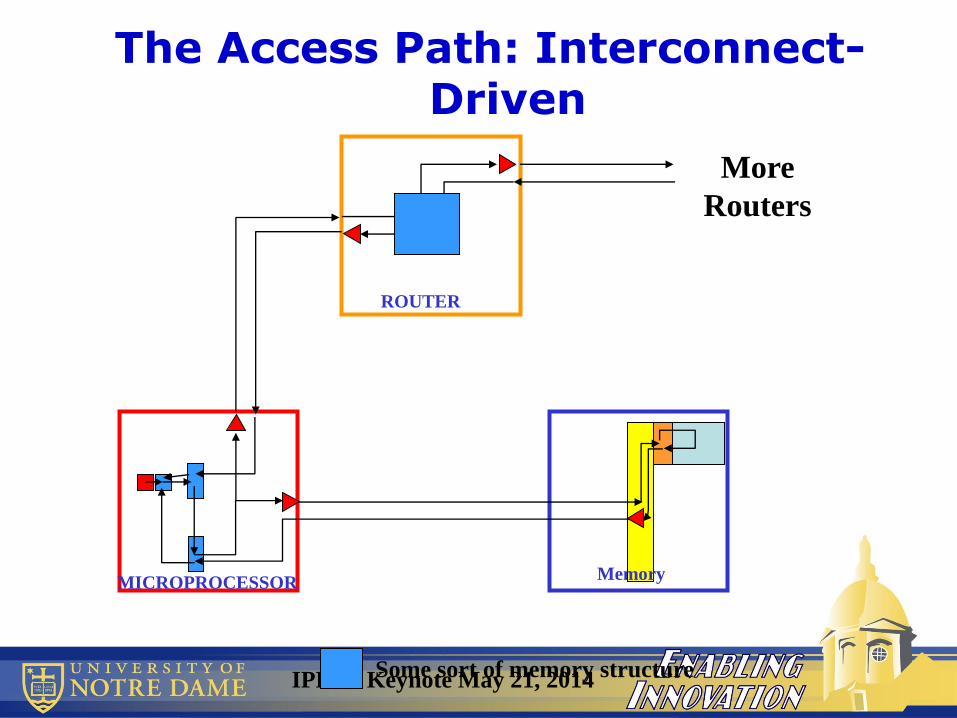
The Access Path: Interconnect-Driven
ROUTER
MemoryMICROPROCESSOR
More
Routers
Some sort of memory structure
IPDPS Keynote May 21, 2014
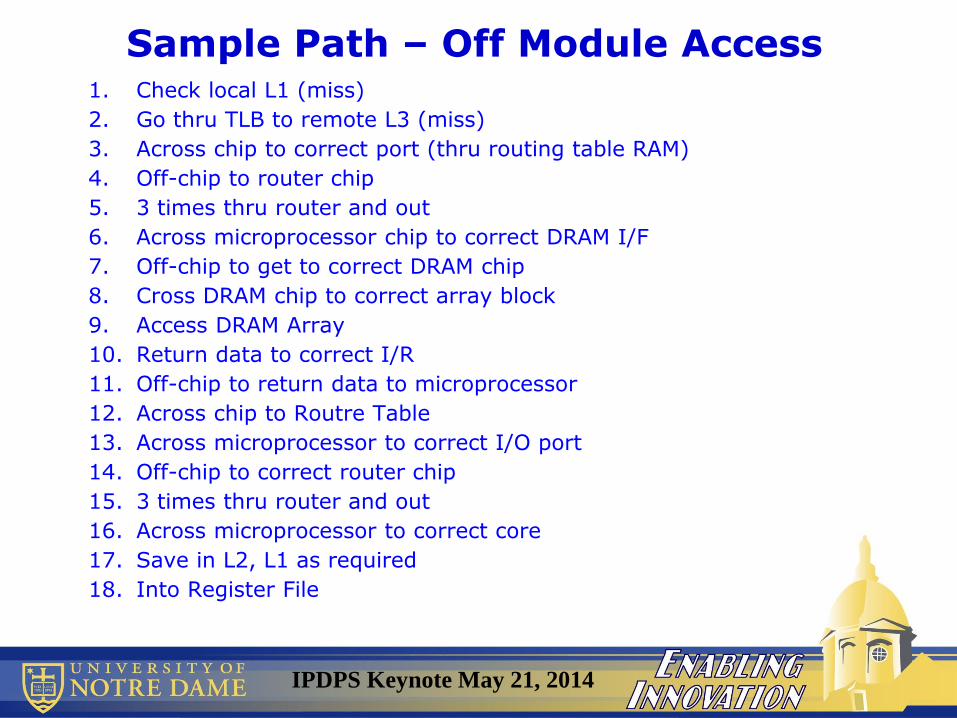
Sample Path – Off Module Access1. Check local L1 (miss)
2. Go thru TLB to remote L3 (miss)
3. Across chip to correct port (thru routing table RAM)
4. Off-chip to router chip
5. 3 times thru router and out
6. Across microprocessor chip to correct DRAM I/F
7. Off-chip to get to correct DRAM chip
8. Cross DRAM chip to correct array block
9. Access DRAM Array
10. Return data to correct I/R
11. Off-chip to return data to microprocessor
12. Across chip to Routre Table
13. Across microprocessor to correct I/O port
14. Off-chip to correct router chip
15. 3 times thru router and out
16. Across microprocessor to correct core
17. Save in L2, L1 as required
18. Into Register File

IPDPS Keynote May 21, 2014
Taper Data from Exascale Report
IPDPS Keynote May 21, 2014
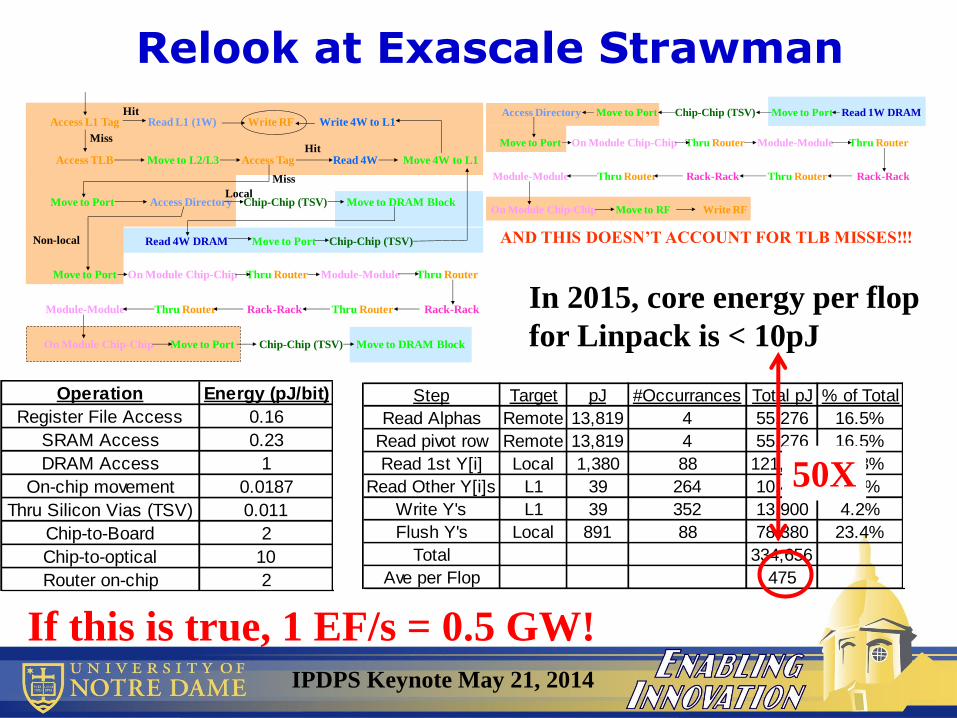
Relook at Exascale Strawman
Access L1 Tag
Access TLB Move to L2/L3 Access Tag
Read L1 (1W) Write RF
Read 4W Move 4W to L1
Write 4W to L1
Access DirectoryMove to Port Chip-Chip (TSV) Move to DRAM Block
Read 4W DRAM Move to Port Chip-Chip (TSV)
Move to Port On Module Chip-Chip Thru Router Module-Module
Rack-Rack
Thru Router
Thru Router Rack-Rack Thru RouterModule-Module
On Module Chip-Chip Move to Port Chip-Chip (TSV) Move to DRAM Block
Hit
HitMiss
Miss
Local
Non-local
Access Directory Move to Port Read 1W DRAMMove to PortChip-Chip (TSV)
Move to Port On Module Chip-Chip Thru Router Module-Module
Rack-Rack
Thru Router
Thru Router Rack-Rack Thru RouterModule-Module
On Module Chip-Chip Move to RF Write RF
AND THIS DOESN’T ACCOUNT FOR TLB MISSES!!!
In 2015, core energy per flop
for Linpack is < 10pJ
Step Target pJ #Occurrances Total pJ % of Total
Read Alphas Remote 13,819 4 55,276 16.5%
Read pivot row Remote 13,819 4 55,276 16.5%
Read 1st Y[i] Local 1,380 88 121,400 36.3%
Read Other Y[i]s L1 39 264 10,425 3.1%
Write Y's L1 39 352 13,900 4.2%
Flush Y's Local 891 88 78,380 23.4%
Total 334,656
Ave per Flop 475
If this is true, 1 EF/s = 0.5 GW!
Operation Energy (pJ/bit)
Register File Access 0.16
SRAM Access 0.23
DRAM Access 1
On-chip movement 0.0187
Thru Silicon Vias (TSV) 0.011
Chip-to-Board 2
Chip-to-optical 10
Router on-chip 2
50X

IPDPS Keynote May 21, 2014
Access vs Reach
1.E+00
1.E+01
1.E+02
1.E+03
1.E+04
1.E+05
1.E-05 1.E-03 1.E-01 1.E+01 1.E+03 1.E+05 1.E+07
Reachable GB
pJ
to
Ac
ce
ss a
Wo
rd
Curve Fit = 626*GB0.2
Tianhe-2:
9000 pJ
Tianhe-2:
7500 pJ

IPDPS Keynote May 21, 2014
And This Means You Can Reference Memory Occasionally….
• 100% L1 Hit, once every 6.5 Flops
• 80% L1 Hit and 100% L2/L3 Hit, once every 18 Flops
• 80% L1 Hit, 90% L2/L3 Hit, and all the rest is local, once every 35 Flops
• 80% L1 Hit, 90% L2/L3 Hit, 60% local, and 40% Global, once every 118 Flops
IPDPS Keynote May 21, 2014
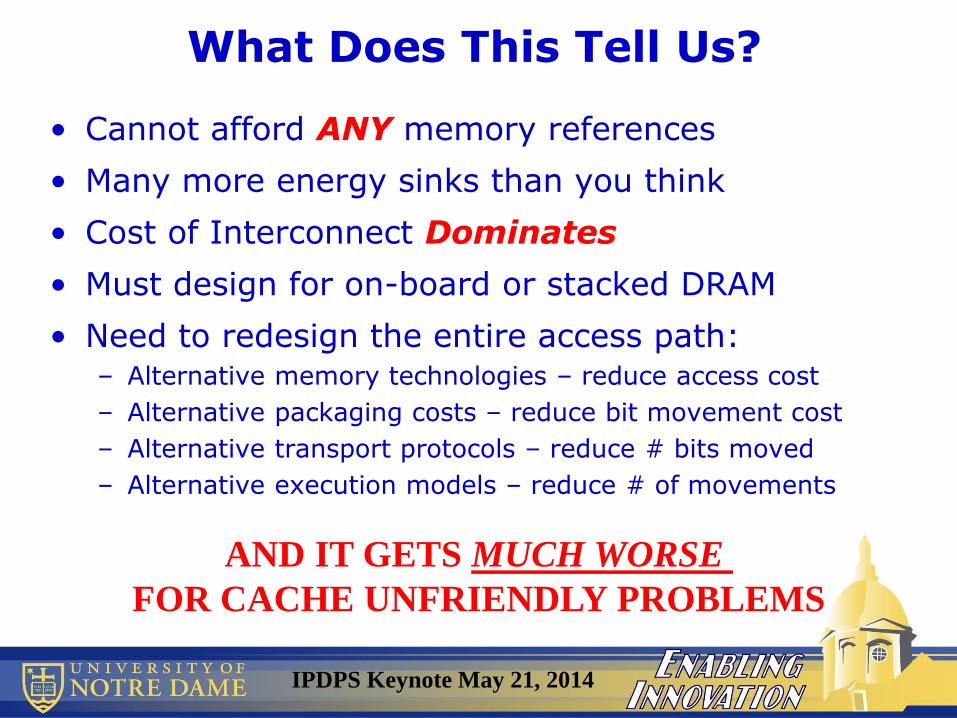
What Does This Tell Us?
• Cannot afford ANY memory references
• Many more energy sinks than you think
• Cost of Interconnect Dominates
• Must design for on-board or stacked DRAM
• Need to redesign the entire access path:– Alternative memory technologies – reduce access cost
– Alternative packaging costs – reduce bit movement cost
– Alternative transport protocols – reduce # bits moved
– Alternative execution models – reduce # of movements
AND IT GETS MUCH WORSE
FOR CACHE UNFRIENDLY PROBLEMS

IPDPS Keynote May 21, 2014
The Key Take Away
You can hide the latency…
But
You Can’t Hide the Energy
IPDPS Keynote May 21, 2014
Topics
• 2004: Technology “Perfect Storm”
• Our Current Architecture Spectrum
• The Exascale Memory Energy Horror Show
• TOP500 Lessons
• GRAPH500 Lessons
• HPCC Lessons
• 3D Stack Projections

IPDPS Keynote May 21, 2014
1.E+01
1.E+02
1.E+03
1.E+04
1.E+05
1.E+06
1.E+07
1.E+08
01
/01
/92
01
/01
/96
01
/01
/00
01
/01
/04
01
/01
/08
01
/01
/12
01
/01
/16
Rm
ax (
Gfl
op
s/se
c)
Heavyweight Lightweight Hybrid Trend: CAGR=1.88
Emergence of Lightweight, Hybrid
IPDPS Keynote May 21, 2014
1.E+00
1.E+01
1.E+02
1.E+03
1.E+04
1.E+05
1.E+06
1.E+071
/1/9
2
1/1
/96
1/1
/00
1/1
/04
1/1
/08
1/1
/12
1/1
/16
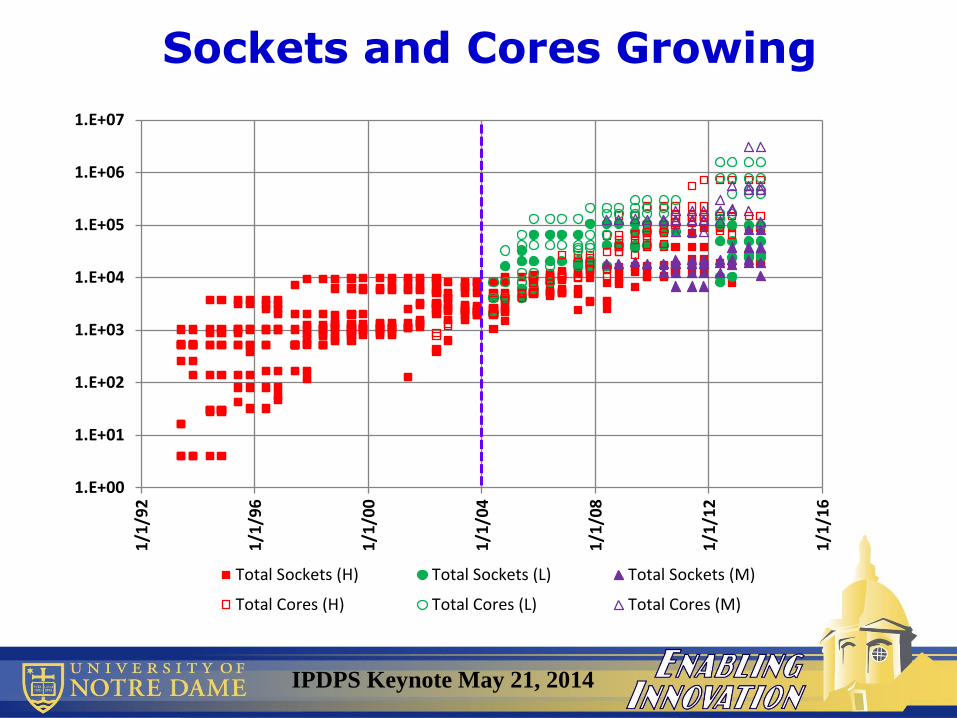
Total Sockets (H) Total Sockets (L) Total Sockets (M)
Total Cores (H) Total Cores (L) Total Cores (M)
Sockets and Cores Growing
IPDPS Keynote May 21, 2014
1.E+01
1.E+02
1.E+03
1.E+04
1.E+05
1.E+06
1.E+07
1.E+080
1/0
1/9
2
01
/01
/96
01
/01
/00
01
/01
/04
01
/01
/08
01
/01
/12
01
/01
/16
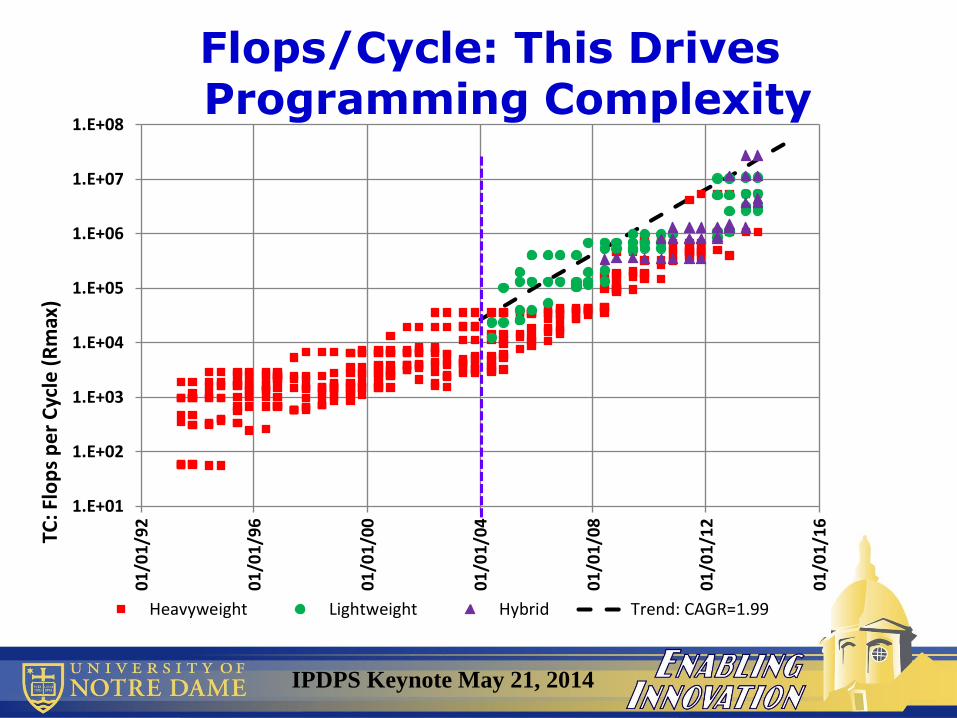
TC: F
lop
s p
er
Cyc
le (
Rm
ax)
Heavyweight Lightweight Hybrid Trend: CAGR=1.99
Flops/Cycle: This Drives Programming Complexity
IPDPS Keynote May 21, 2014
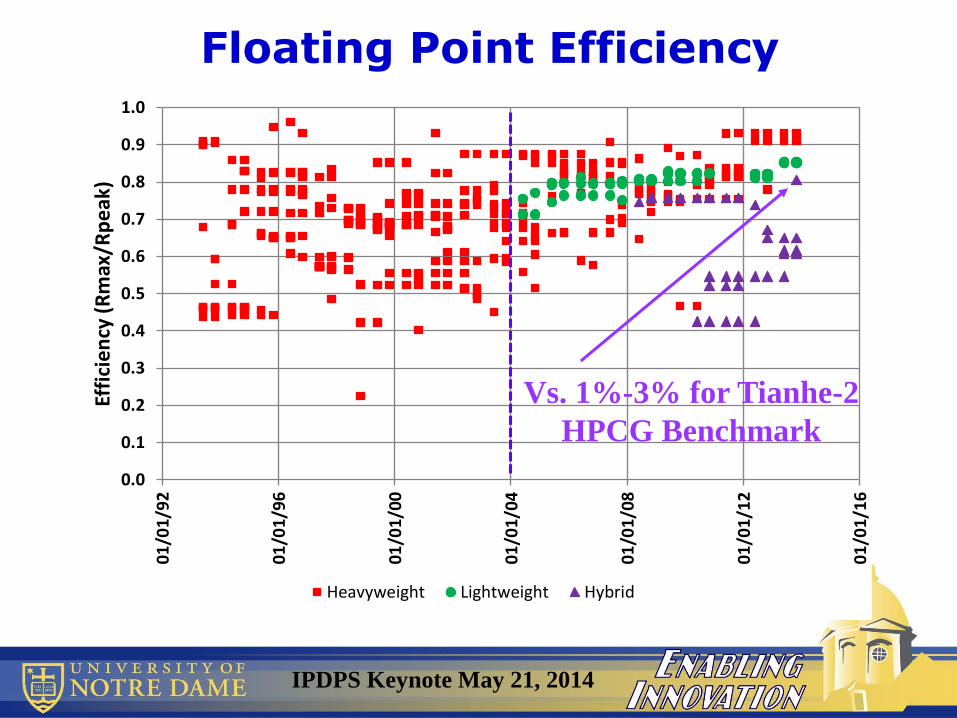
0.0
0.1
0.2
0.3
0.4
0.5
0.6
0.7
0.8
0.9
1.0
01
/01
/92
01
/01
/96
01
/01
/00
01
/01
/04
01
/01
/08
01
/01
/12
01
/01
/16
Effi
cien
cy (
Rm
ax/R
pe
ak)
Heavyweight Lightweight Hybrid
Floating Point Efficiency
Vs. 1%-3% for Tianhe-2
HPCG Benchmark
IPDPS Keynote May 21, 2014
1.E+00
1.E+01
1.E+02
1.E+03
1.E+04
1.E+05
1.E+06
1.E+07
1.E+08
1.E+09
01
/01
/92
01
/01
/96
01
/01
/00
01
/01
/04
01
/01
/08
01
/01
/12
01
/01
/16
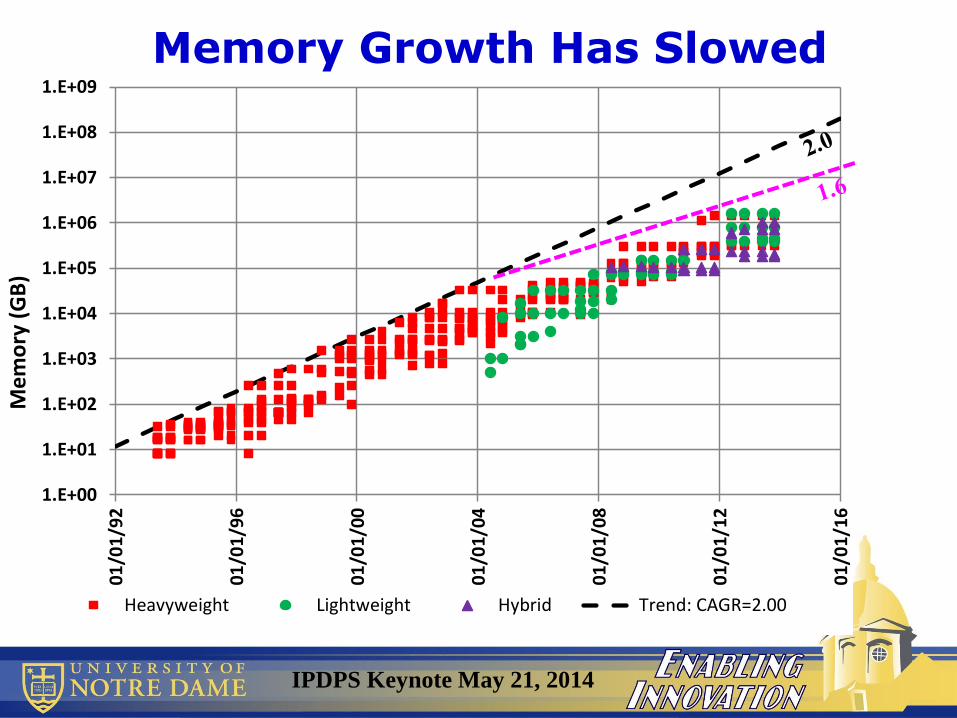
Me
mo
ry (
GB
)
Heavyweight Lightweight Hybrid Trend: CAGR=2.00
Memory Growth Has Slowed

IPDPS Keynote May 21, 2014
1.E-02
1.E-01
1.E+00
1.E+01
01
/01
/92
01
/01
/96
01
/01
/00
01
/01
/04
01
/01
/08
01
/01
/12
01
/01
/16M
emo
ry/G
F(R
max
) (G
B)
Heavyweight Lightweight Hybrid Trend: CAGR=0.72
And Memory per Flop/s Is Dropping!

IPDPS Keynote May 21, 2014
1.E+01
1.E+02
1.E+03
01
/01
/92
01
/01
/96
01
/01
/00
01
/01
/04
01
/01
/08
01
/01
/12
01
/01
/16
Wat
ts/S
ock
et
Heavyweight Lightweight Hybrid Trend: CAGR=1.32
Ceiling on System Power “per Socket”

IPDPS Keynote May 21, 2014
Energy per Flop is Dropping
1.E+01
1.E+02
1.E+03
1.E+04
1.E+05
1.E+06
1.E+07
1/1
/19
92
1/1
/19
96
1/1
/20
00
1/1
/20
04
1/1
/20
08
1/1
/20
12
1/1
/20
16
1/1
/20
20
1/1
/20
24
Ene
rgy
pe
r Fl
op
(p
J)
Heavyweight Heavyweight - Scaled Heavyweight - Constant
Lightweight Lightweight - Scaled Lightweight - Constant
Heterogeneous Hetergeneous - Scaled Historical
CMOS Projection - Hi Perf CMOS Projection - Low Power UHPC Goal
Trends vs 20pJ/Flop goal
• Heavyweight: never
• Lightweight: close
• Hybrid: Possible
Technology alone
One-time Lightweight Gain
One-time Hybrid Gain
But this is Rpeak

IPDPS Keynote May 21, 2014
But Energy Efficiency Limits Performance
1.E+02
1.E+03
1.E+04
1.E+05
1.E+06
1.E
+0
2
1.E
+0
3
1.E
+0
4
1.E
+0
5
1.E
+0
6
1.E
+0
7
1.E
+0
8
pJ/
Flo
p (
Rm
ax)
Gflops (Rmax)Top500 Heavyweight Green500 HeavyweightTop500 Lightweight Green500 LightweightTop500 Hybrid Green500 Hybrid

IPDPS Keynote May 21, 2014
Conclusions
• TOP500 continues to grow at 2X/year
– With 80% efficiency
• But less and less relevance to real problems
• And need to program for 10s of millions of flops/cycle
• With falling relative memory footprint
• New HPCG benchmark due out June

IPDPS Keynote May 21, 2014
Topics
• 2004: Technology “Perfect Storm”
• Our Current Architecture Spectrum
• The Exascale Memory Energy Horror Show
• TOP500 Lessons
• GRAPH500 Lessons
• HPCC Lessons
• 3D Stack Projections

IPDPS Keynote May 21, 2014
20
9
Graph 500
• Start with a root, find reachable nodes
• Simplifications: only 1 kind of edge, no weights
• Performance metric: TEPS: Traversed Edges/sec
1
3
5
7
8e0 e1
e2
e3e4
e5
e6
e7e8
Level Scale Size GB Edge(B)
10 26 Toy 17 272
11 29 Mini 140 280
12 32 Small 1024 256
13 36 Medium 17408 272
14 39 Large 143360 280
15 42 Huge 1153434 281.6
Average 273.6Starting at 1: 1, 0, 3, 2, 9, 5

IPDPS Keynote May 21, 2014
1.E-02
1.E-01
1.E+00
1.E+01
1.E+02
1.E+03
1.E+04
1.E+05
1/1
/10
1/1
/11
1/2
/12
1/1
/13
1/1
/14
TEP
S (B
illio
ns/
sec)
Heavyweight Lightweight Hybrid Other Trend
TEPS vs Time

IPDPS Keynote May 21, 2014
1.E-02
1.E-01
1.E+00
1.E+01
1.E+02
1.E+03
1.E+04
1.E+05
1.E+00 1.E+01 1.E+02 1.E+03 1.E+04 1.E+05
TEP
S (B
illio
ns/
sec)
NodesHeavyweight Lightweight Hybrid Other Trend
TEPS vs # Nodes
IPDPS Keynote May 21, 2014
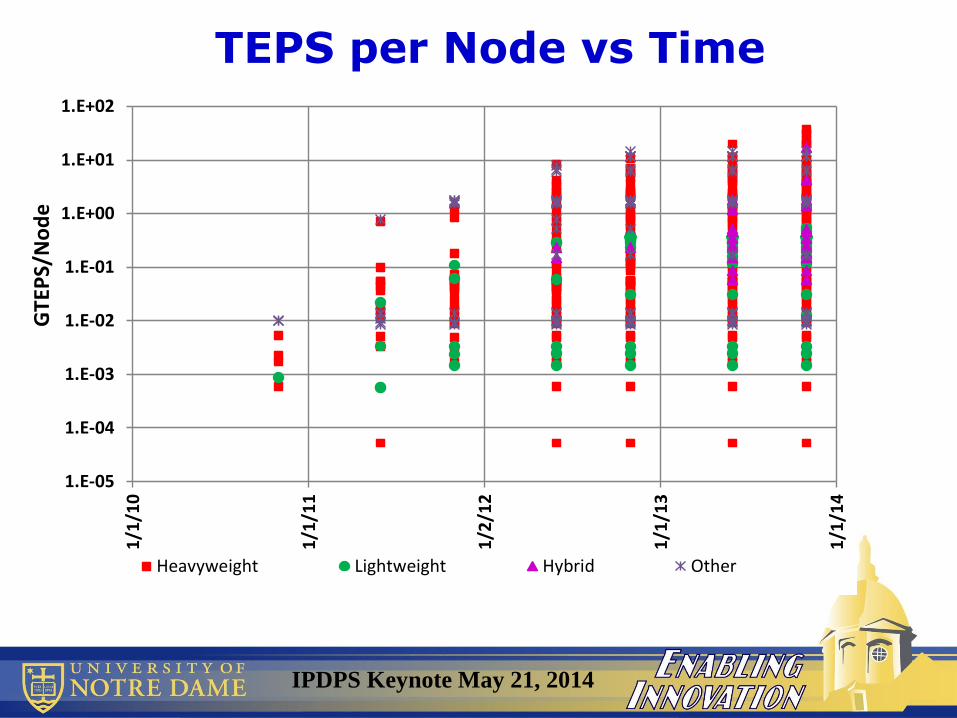
TEPS per Node vs Time
1.E-05
1.E-04
1.E-03
1.E-02
1.E-01
1.E+00
1.E+01
1.E+02
1/1
/10
1/1
/11
1/2
/12
1/1
/13
1/1
/14
GTE
PS/
No
de
Heavyweight Lightweight Hybrid Other
IPDPS Keynote May 21, 2014
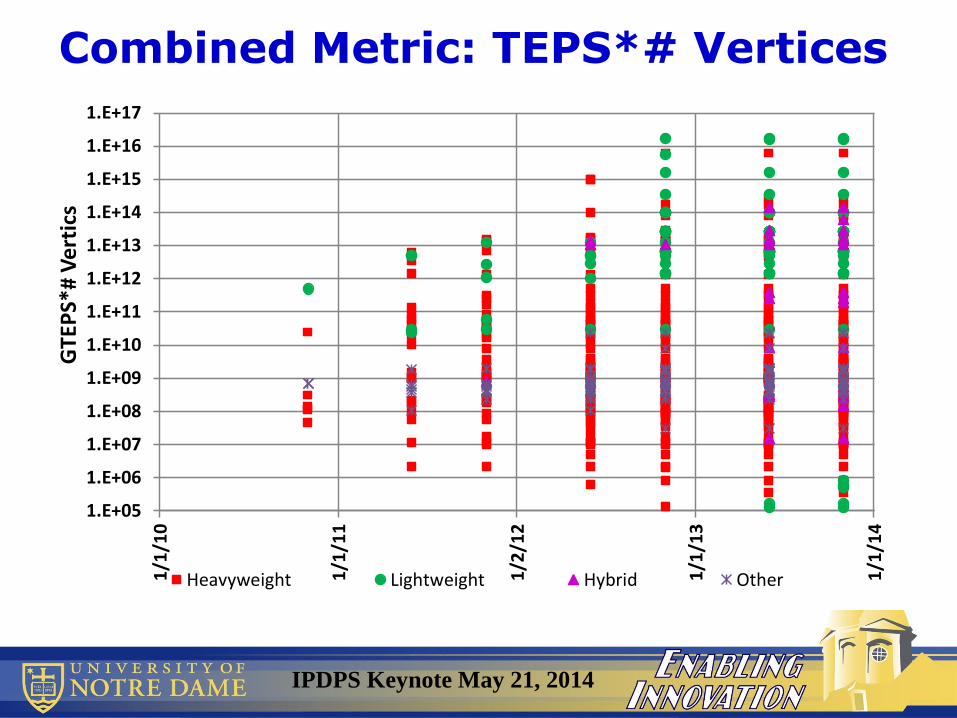
Combined Metric: TEPS*# Vertices
1.E+05
1.E+06
1.E+07
1.E+08
1.E+09
1.E+10
1.E+11
1.E+12
1.E+13
1.E+14
1.E+15
1.E+16
1.E+17
1/1
/10
1/1
/11
1/2
/12
1/1
/13
1/1
/14
GTE
PS*
# V
erti
cs
Heavyweight Lightweight Hybrid Other

IPDPS Keynote May 21, 2014
TEPS per Node vs # Nodes
1.E-04
1.E-03
1.E-02
1.E-01
1.E+00
1.E+01
1.E+00 1.E+01 1.E+02 1.E+03 1.E+04 1.E+05
GTE
PS
pe
r N
od
e
NodesHeavyweight Lightweight Hybrid Other

IPDPS Keynote May 21, 2014
1.E-04
1.E-03
1.E-02
1.E-01
1.E+00
1/1/10 1/1/11 1/2/12 1/1/13 1/1/14
GTE
PS/
No
de
NodesBGQ BGP
Where Does Improvement Come From? BlueGene Analysis
Due to Hardware
Software/Algorithm
Improvements

IPDPS Keynote May 21, 2014
TEPS/Node vs Node Count
1.E-04
1.E-03
1.E-02
1.E-01
1.E+00
1.E+02 1.E+03 1.E+04 1.E+05
GTE
PS/
No
de
NodesBGQ BGP
IPDPS Keynote May 21, 2014
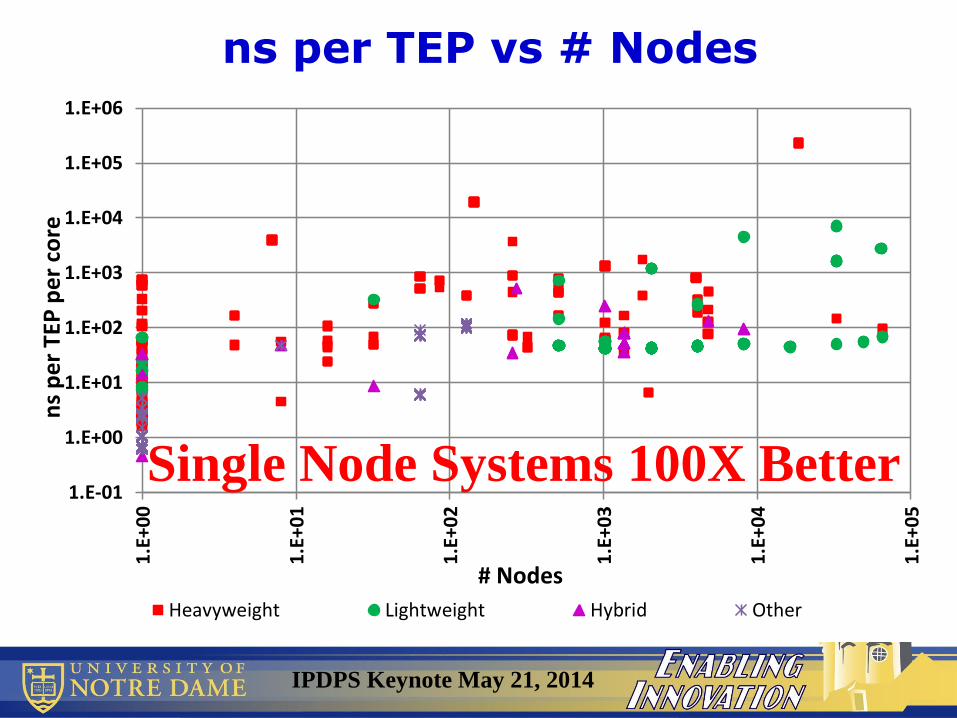
1.E-01
1.E+00
1.E+01
1.E+02
1.E+03
1.E+04
1.E+05
1.E+06
1.E
+0
0
1.E
+0
1
1.E
+0
2
1.E
+0
3
1.E
+0
4
1.E
+0
5
ns
pe
r T
EP p
er
core
# Nodes
Heavyweight Lightweight Hybrid Other
ns per TEP vs # Nodes
Single Node Systems 100X Better

IPDPS Keynote May 21, 2014
1.E-01
1.E+00
1.E+01
1.E+02
1.E+03
1.E+04
1.E+05
1.E+06
10
15
20
25
30
35
40
ns
pe
r T
EP p
er
core
Problem Scale
Heavyweight Lightweight Hybrid Other
ns per TEP vs Memory
Large Memory Systems Are Not Shared

IPDPS Keynote May 21, 2014
Conclusions
• GRAPH500 has two metrics: TEPS & problem size
– With problem size growing towards petabytes
• Algorithm: heavy on
– remote atomic accesses
– All to all comm patterns
• Near perfect weak scaling, but lose 100X in going from shared memory to distributed
• Comparative BlueGene data: ½ hardware, ½ algorithm (driven by new architectural features)
• New benchmarks coming: search, shortest path, max independent set

IPDPS Keynote May 21, 2014
Topics
• 2004: Technology “Perfect Storm”
• Our Current Architecture Spectrum
• The Exascale Memory Energy Horror Show
• TOP500 Lessons
• GRAPH500 Lessons
• HPCC Lessons
• 3D Stack Projections

IPDPS Keynote May 21, 2014
The HPCC Challenge Benchmarks
• Outgrowth of the DARPA HPCS program
• Focus on large-scale parallel MPI implementations
• 362 system measurements reported since 2003
• Benchmarks:
– HPL*: the LINPACK benchmark used in TOP500
– DGEMM: DP FP matrix-matrix multiply
– STREAM*: Sustainable memory B/W for 4 long vector ops• TRIAD: a[i] = b[i] + c[i]*SCALAR
– PTRANS: Comm capabilities for parallel matrix transpose
– RandomAccess*: Integer random updates (GUPS)
– FFT*: DP FP
• *ed versions reported at HPC Challenge Awards at SC

IPDPS Keynote May 21, 2014
Performance/Process vs Time
1.E-08
1.E-07
1.E-06
1.E-05
1.E-04
1.E-03
1.E-02
1.E-01
1.E+00
1/1/02 1/1/04 1/1/06 1/1/08 1/1/10 1/1/12 1/1/14 1/1/16
HP
L TF
/s p
er
Pro
cess
Heavyweight Lightweight Hybrid Other
HPL1.E-02
1.E-01
1.E+00
1.E+01
1.E+02
1.E+03
1.E+04
1/1/02 1/1/04 1/1/06 1/1/08 1/1/10 1/1/12 1/1/14 1/1/16
EP S
TREA
M T
riad
GB
/s p
er
Pro
cess
Heavyweight Lightweight Hybrid Other
STREAM
1.E-04
1.E-03
1.E-02
1.E-01
1.E+00
1.E+01
1.E+02
1/1/02 1/1/04 1/1/06 1/1/08 1/1/10 1/1/12 1/1/14 1/1/16
Glo
bal
FFT
GF/
Pro
cess
Heavyweight Lightweight Hybrid Other
FFT
1.E-06
1.E-05
1.E-04
1.E-03
1.E-02
1.E-01
1.E+00
1.E+01
1/1/02 1/1/04 1/1/06 1/1/08 1/1/10 1/1/12 1/1/14 1/1/16
Glo
bal
Ran
do
mA
cce
ss G
UP/
s p
er
Pro
cess
Heavyweight Lightweight Hybrid Other
GUPS

IPDPS Keynote May 21, 2014
Performance/Process vs # Processes
1.E-08
1.E-07
1.E-06
1.E-05
1.E-04
1.E-03
1.E-02
1.E-01
1.E+00
1.E+00 1.E+01 1.E+02 1.E+03 1.E+04 1.E+05 1.E+06
HP
L TF
/s p
er
Pro
cess
ProcessesHeavyweight Lightweight Hybrid Other
1.E-04
1.E-03
1.E-02
1.E-01
1.E+00
1.E+01
1.E+02
1.E+00 1.E+01 1.E+02 1.E+03 1.E+04 1.E+05 1.E+06
Glo
bal
FFT
GF/
Pro
cess
ProcessesHeavyweight Lightweight Hybrid Other
1.E-02
1.E-01
1.E+00
1.E+01
1.E+02
1.E+03
1.E+04
1.E+00 1.E+01 1.E+02 1.E+03 1.E+04 1.E+05 1.E+06
EP S
TREA
M T
riad
GB
/s p
er
Pro
cess
ProcessesHeavyweight Lightweight Hybrid Other
1.E-06
1.E-05
1.E-04
1.E-03
1.E-02
1.E-01
1.E+00
1.E+01
1.E+00 1.E+01 1.E+02 1.E+03 1.E+04 1.E+05 1.E+06
Glo
bal
Ran
do
mA
cce
ss G
UP/
s p
er
Pro
cess
ProcessesHeavyweight Lightweight Hybrid Other
HPL STREAM
FFT GUPS

IPDPS Keynote May 21, 2014
How Does HPL Relate to Streams?
1.E-08
1.E-07
1.E-06
1.E-05
1.E-04
1.E-03
1.E-02
1.E-01
1.E+00
1.E-02 1.E-01 1.E+00 1.E+01 1.E+02 1.E+03 1.E+04
HP
L TF
/s p
er
Pro
cess
EP STREAM Triad GB/s per ProcessHeavyweight Lightweight Hybrid Other
Seems like linear correlation
between Memory B/W & Flops
IPDPS Keynote May 21, 2014
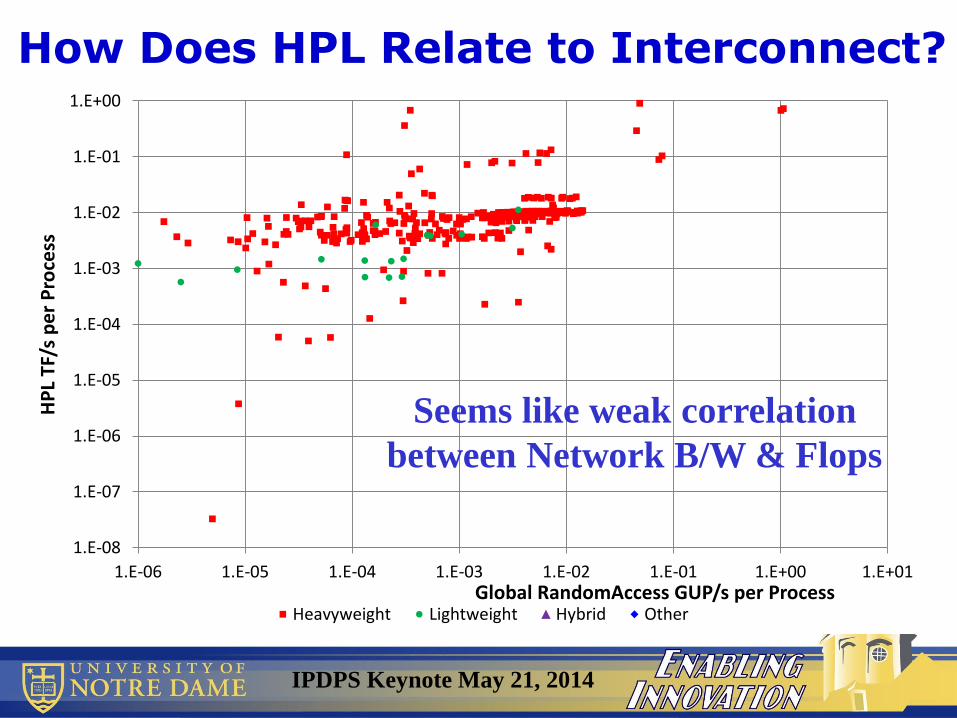
How Does HPL Relate to Interconnect?
1.E-08
1.E-07
1.E-06
1.E-05
1.E-04
1.E-03
1.E-02
1.E-01
1.E+00
1.E-06 1.E-05 1.E-04 1.E-03 1.E-02 1.E-01 1.E+00 1.E+01
HP
L TF
/s p
er
Pro
cess
Global RandomAccess GUP/s per ProcessHeavyweight Lightweight Hybrid Other
Seems like weak correlation
between Network B/W & Flops
IPDPS Keynote May 21, 2014
1.E-08
1.E-07
1.E-06
1.E-05
1.E-04
1.E-03
1.E-02
1.E-01
1.E+00
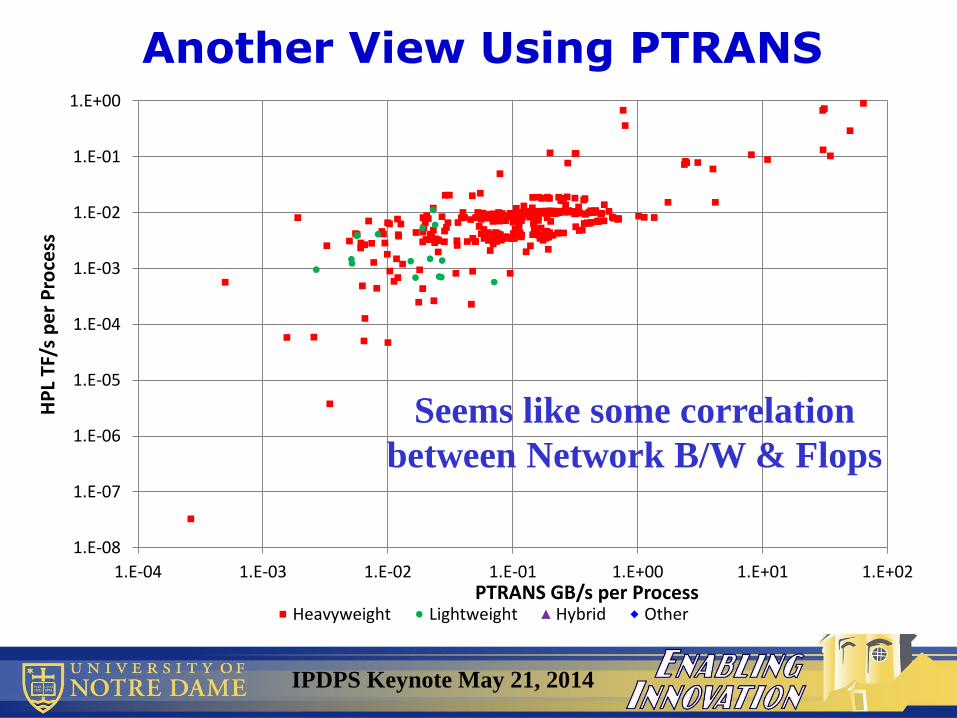
1.E-04 1.E-03 1.E-02 1.E-01 1.E+00 1.E+01 1.E+02
HP
L TF
/s p
er
Pro
cess
PTRANS GB/s per ProcessHeavyweight Lightweight Hybrid Other
Another View Using PTRANS
Seems like some correlation
between Network B/W & Flops

IPDPS Keynote May 21, 2014
Topics
• 2004: Technology “Perfect Storm”
• Our Current Architecture Spectrum
• The Exascale Memory Energy Horror Show
• TOP500 Lessons
• GRAPH500 Lessons
• HPCC Lessons
• 3D Stack Projections

IPDPS Keynote May 21, 2014
Emerging Technology: 3D Stacks
• Stackable memory chips
– Same memory cells as in today’s DRAM
– Internally re-architected for more simultaneous access
• “Through Silicon Vias” (TSVs) to go vertically up and down
• Logic chip on bottom
– Multiple memory controllers
– More sophisticated off-stack interfaces than DDR
• Prototype demonstrated in 2011
• 1st Product in 2014
– Spec:http://www.hybridmemorycube.org
– Capacity: up to 8GB: 8X single chip
– Bandwidth: up to 480GB/s: 40X
– Lots of room on logic chip
http://www.micron.com/products/hybrid-memory-cube
2-bank Partition
16 64Mb “Partitions”

IPDPS Keynote May 21, 2014
The HMC Architecture
VaultController
VaultController
VaultController
VaultController
Multi-bankPartition
Multi-bankPartition
Multi-bankPartition
Multi-bankPartition
Multi-bankPartition
Multi-bankPartition
Multi-bankPartition
Multi-bankPartition
Multi-bankPartition
Multi-bankPartition
Multi-bankPartition
Multi-bankPartition
Multi-bankPartition
Multi-bankPartition
Multi-bankPartition
Multi-bankPartition
Vault:
TSV-connectedstack of
Memory Die
Multi-bankPartition
Multi-bankPartition
Multi-bankPartition
Multi-bankPartition
Multi-bankPartition
Multi-bankPartition
Multi-bankPartition
Multi-bankPartition
Multi-bankPartition
Multi-bankPartition
Multi-bankPartition
Multi-bankPartition
Multi-bankPartition
Multi-bankPartition
Multi-bankPartition
Multi-bankPartition
Logic Base Die
Memory Die
Off-Stack I/O(Shared by All Vault Controllers via Distributed Routing)
160 GB/s =>320 => …
Partition
Partition
…
VaultController
Vault N
Partition
Partition
…
VaultController
Vault 1
Intra-Logic chip Routing
… Memory Die 1
… Memory Die M
Built-InTest Engine
Maintenance Interface
Link1
LinkL…
High Speed Full Duplex Multi-lane Interfaces
Blue: TSVs
LogicBaseDie
…
…
IPDPS Keynote May 21, 2014
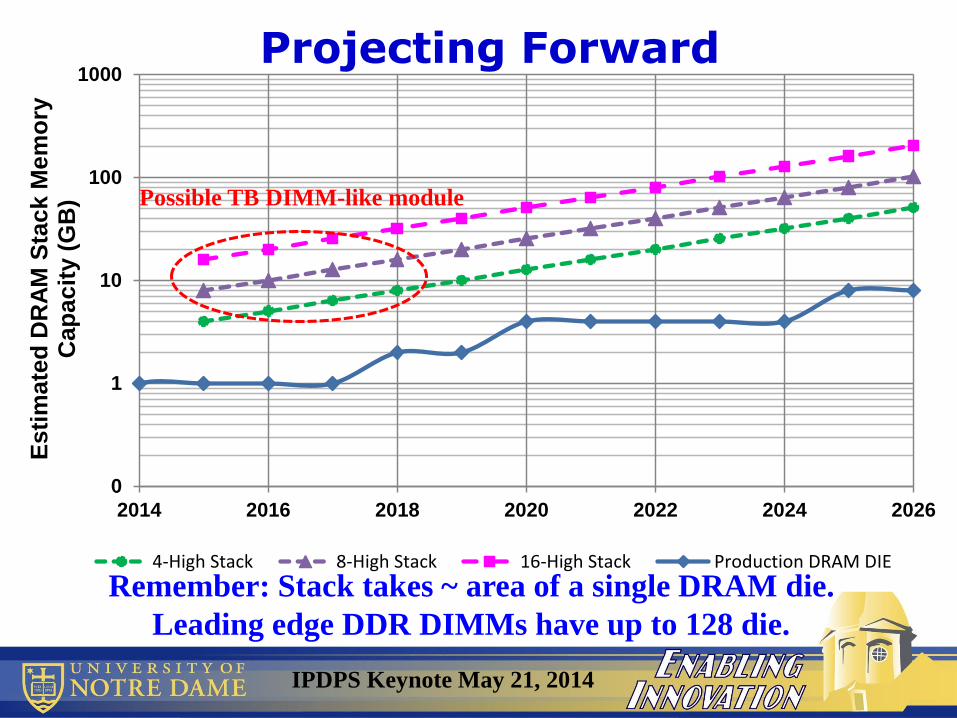
0
1
10
100
1000
2014 2016 2018 2020 2022 2024 2026
Es
tim
ate
d D
RA
M S
tac
k M
em
ory
C
ap
ac
ity (
GB
)
4-High Stack 8-High Stack 16-High Stack Production DRAM DIE
Projecting Forward
Remember: Stack takes ~ area of a single DRAM die.
Leading edge DDR DIMMs have up to 128 die.
Possible TB DIMM-like module

IPDPS Keynote May 21, 2014
Bandwidth Estimates
0
200
400
600
800
1000
1200
2011 2013 2015 2017 2019 2021 2023 2025
GB
/s
Peak Memory-Logic Peak I/O (Full Duplex) Peak DDRx B/W (GB/s)
DDRx

IPDPS Keynote May 21, 2014
Stack Power Projections
0
1
10
100
2014 2016 2018 2020 2022 2024 2026
Es
t. M
ax
Sta
ck
Po
we
r (W
att
s)
16-High Stack 8-High Stack
4-High Stack Base Die
Base: I/O Base: Router
Base: Memory Controller DRAM Die

IPDPS Keynote May 21, 2014
SNL Xcaliber Architecture
(b) X-caliber Node Mockup
(a) X-caliber Node Architecture
(c) X-caliber stack notional architecture
IPDPS Keynote May 21, 2014
10
100
2014 2016 2018 2020 2022 2024 2026
pJ
/flo
p (
Rp
ea
k)
16-High Stack 8-High Stack 4-High Stack
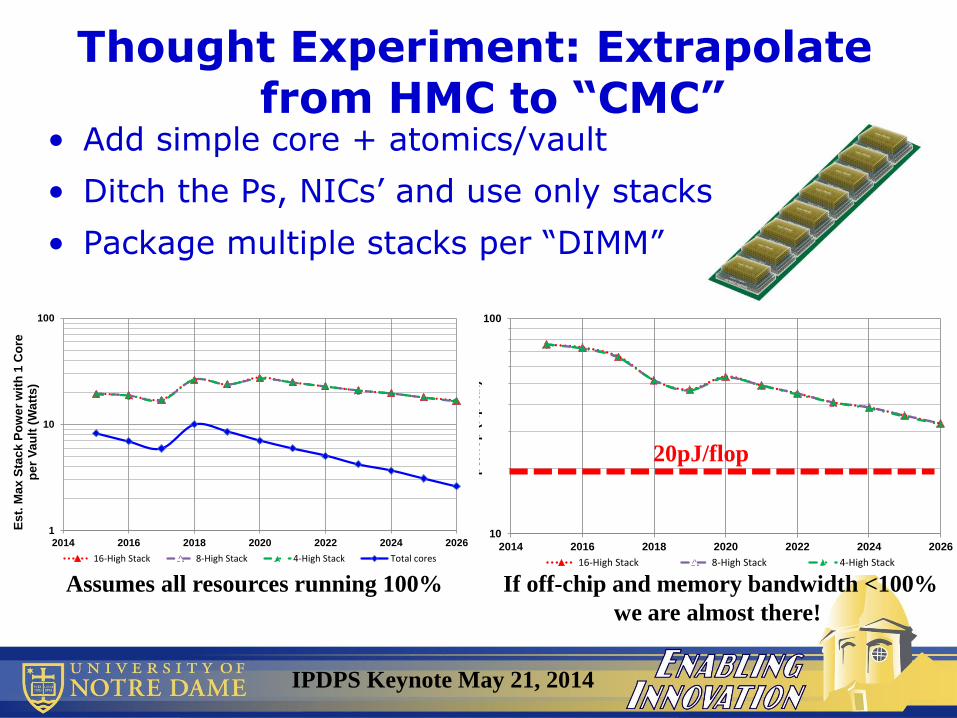
Thought Experiment: Extrapolate from HMC to “CMC”
• Add simple core + atomics/vault
• Ditch the Ps, NICs’ and use only stacks
• Package multiple stacks per “DIMM”
20pJ/flop
Assumes all resources running 100% If off-chip and memory bandwidth <100%
we are almost there!
1
10
100
2014 2016 2018 2020 2022 2024 2026
Es
t. M
ax
Sta
ck
Po
we
r w
ith
1 C
ore
p
er
Va
ult
(W
att
s)
16-High Stack 8-High Stack 4-High Stack Total cores

IPDPS Keynote May 21, 2014
Possible 3D Architectures• Advantages
– Already has significant internal resiliency
– Huge bandwidth to logic chip
– Huge off-stack bandwidth with better protocol
– Very much in line with lightweight architectures
• Future Possibilities
– Direct mount multiple stacks to same substrate
– Lightweight cores + atomics natural per vault
– Heterogeneous memory die in stack to provide on die checkpointing, storage, etc.
– Multitude of novel resiliency options
– Augment protocol to support active messages
• Study of a stack-based Big Data solution: Huge increase in performance & performance/unit volume
IPDPS Keynote May 21, 2014
Overall Summary
• 2004: Turning point in HPC architecture
• Heavyweight alone are going flat
• Hybrid more energy efficient for flops – but there are memory issues
• Lightweight more scalable for both flops and communication
• No escape for massive parallelism
• New algorithms will blend multiple metrics
• 3D stacks an interesting alternative