entertainment one interim results - amazon s3 · movies in development: ... the mark gordon company...
TRANSCRIPT

entertainmentone.com
entertainmentone.com
Interim results 21 November 2017

entertainmentone.com
Business review
2 entertainmentone.com

entertainmentone.com
Highlights Robust first half performance across the Group
• Revenue consistent at £396m
• Underlying EBITDA up 36% to £51m
• EBITDA margin up 360 basis points reflecting the growth in Family and realisation of cost savings
Family ahead of expectations, driven by Peppa Pig in China and PJ Masks
• Retail revenue from brands up from US$0.7bn to US$1.2bn
Strong performance across Television • eOne Television delivers higher international sales revenue
• MGC experiences high levels of activity across television and film
Film starting to migrate from acquisition to production
Transition from physical to digital delivers ongoing cost savings
Integration of Film and Television proceeding as planned – expected annual cost savings of £8m by FY20
Library valuation increased by 13% to US$1.7 billion
Full year in line with management expectations
3

entertainmentone.com
Strategy: Connect, Create, Deliver
4

entertainmentone.com
Family Ahead of expectations: Revenues up 64% and underlying EBITDA up 54%
5
Brand H1 Progress Outlook
China a key driver to growth: licensing revenues up over 700% as consumer product ranges expanded. Audience traction on broadcast and VOD remains strong
US licensing programme continues to build, supported by infrastructure investment
Recently introduced to Japanese audiences in partnership with Tokyo TV
Chinese licence agreements anticipated to grow from 20 at the end of FY17 to 60 by the end of FY18
Peppa Pig S5 now in production, with new episodes to be delivered from March 2018 onwards
‘Evergreen’ status underlined with recent multi-territory Merlin deal for location based entertainment formats
Successful licensing roll-out from September 2016 continues, driving 600% revenue growth
PJ Masks now around 36% of total Family licensing revenues
PJ Masks S2 production progressing well, with broadcast anticipated in early 2018
Further licensing programmes due to be rolled out in FY18 across Europe and the Far East. Preparations are currently under way for a full consumer launch in China, expected in FY19
Strong audience response to PJ Masks Live! US stage show, opened October 2017
PJ Masks S3 greenlight anticipated in H2
Cupcake & Dino: General Services in production, with Netflix, Teletoon Canada and Disney Channel Latin America attached
Ricky Zoom now in production with broadcast partners from France, Italy and Latin America attached. Master toy licence currently in final stages of negotiation
Ricky Zoom and Cupcake & Dino: General Services expected to be delivered to broadcast partners in FY19
Family currently working on 10 development projects

entertainmentone.com
Key titles Revenue growth due to strong international sales of Designated Survivor and AMC series
Private Eyes renewed for third series after international audience success
The Other Guy, eOne’s first Australian production, positively received by audiences
US unscripted growth balanced by weaker performance from the Canadian unscripted slate
H1 Progress
Television 82% of FY18 forecast margin committed or greenlit
6
301
Key titles Key renewals for H2: • ICE – S2 • Mary Kills People – S2 • Ransom – S2 • Cardinal – S2 and S3 • You Me Her – S3 • Private Eyes – S3
New drama deliveries: • The Detail: November 2017 • Let’s Get Physical: December 2017 • Burden of Truth: December 2017 • Sharp Objects: May 2018
US unscripted set for a strong H2
International sales of key shows anticipated to be robust
Outlook
Half hours of produced/ acquired content delivered (2016: 360)
£96m Investment in produced and acquired content (2016: £75m)
900 Half hours of produced/ acquired content expected
£200m Investment in produced and acquired content

entertainmentone.com
Designated Survivor S2 deliveries continue into H2
50 projects in active development
New TV projects delivered: • Youth & Consequences: for YouTube Red
Molly’s Game slated for release on 25 December
New series The Rookie for ABC
Movies in development: • The Chronicles of Narnia: The Silver Chair • The Killer • All the Old Knives
Substantial revenue and EBITDA increases due to global success of Designated Survivor S1 and S2
Key shows recommissioned: • Grey’s Anatomy – S14 • Criminal Minds – S13 • Ray Donovan – S6 • Quantico – S3
Key movies: • Molly’s Game • Murder on The Orient Express:
currently in cinemas • The Nutcracker and the Four Realms:
in post-production
Key titles H1 Progress
The Mark Gordon Company 91% of FY18 forecast margin committed or greenlit
7
Outlook
21 Half hours of produced content (2016: 10)
£34m Investment in produced content (2016: £25m)
60 Half hours of produced content
£80m Investment in produced content
Key partners

entertainmentone.com
Key titles Outlook H1 Progress
Film Migration from acquisition to production under way
8
Lower profile films and fewer releases in H1 reduce revenue
Business reshaping efficiencies started in FY16 deliver £10m annualised savings by FY18
Investment in productions net of tax credits increased to £22m (2016: inflow of £4m)
Key releases during the period: • Detroit • Valerian and the City of a Thousand
Planets • Hampstead • Logan Lucky
Key titles
76 Theatrical releases in H1 (2016: 88)
£71m
£22m
Investment in acquired content (2016: £98m)
Investment in productions (2016: £4m inflow)
Release slate for H2 includes: • The Post • A Bad Moms Christmas • Molly’s Game
New producer relationships: • Brad Weston/MAKEREADY • Neal Moritz (Fast and Furious) • Andy and Barbara Muschetti (It)
Ongoing streamlining anticipated to deliver around £8m in annualised savings by FY20 across Film and Television
48 Unique titles released in H1 (2016: 49)
180 Theatrical releases expected in FY18
£130m
£50m
Investment in acquired content
Investment in productions
100 Unique titles expected in FY18

entertainmentone.com
Lower revenue for the period due to prior year release of The Lumineers’ hit album, Cleopatra
Increase in digital revenue offsets continued decline in physical
EBITDA up 16% with improved margins, despite 9% lower revenue
110 digital single releases (2016: 98)
Artist management activities continue to perform strongly: • Arkells: Knocking At The Door • Jax Jones: You Don’t Know Me now
Platinum status in 20 countries • Lights: successful new album release,
Skin & Earth
Music continues to transition to higher margin digital sales
Recent music label album releases will drive revenues in H2 and beyond from acts including: • Death From Above • Emily Haynes & The Soft Skeleton • The Bloody Beetroots • Stars • Wu-Tang
Music supervision across a number of eOne projects: • Ice S2 • Let’s Get Physical • Molly’s Game • Ricky Zoom • PJ Masks Live! Tour
Key artists H1 Progress
Music Digital transition drives improved margins
9
Key artists Outlook
entertainmentone.com
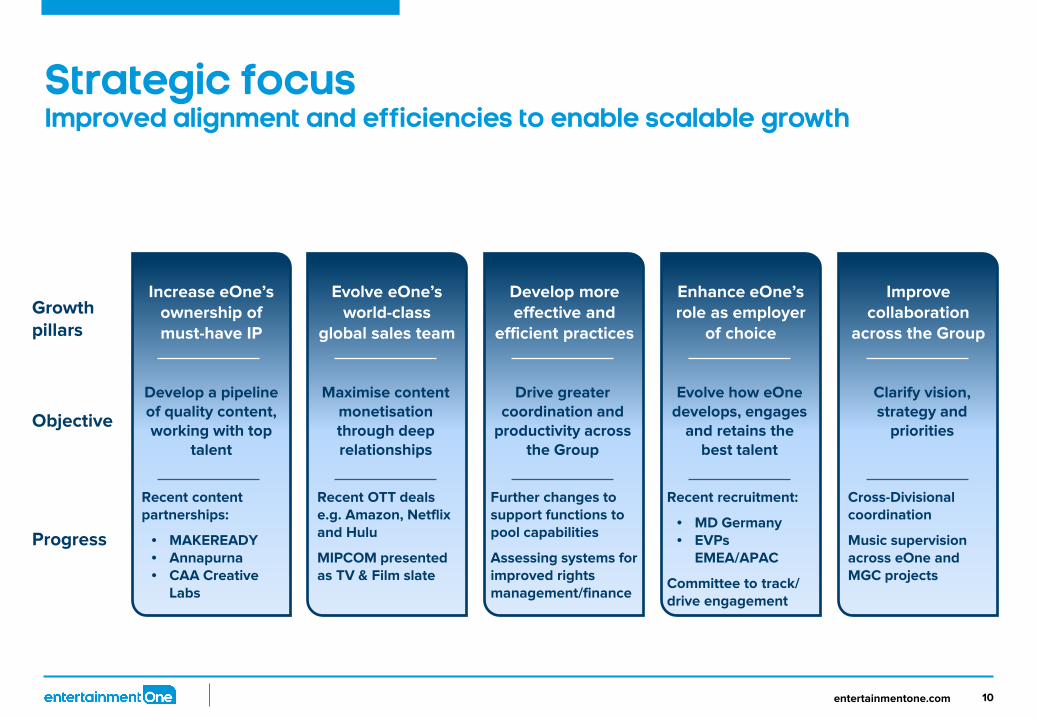
Strategic focus Improved alignment and efficiencies to enable scalable growth
10
Growth pillars
Objective
Progress
Recent content partnerships:
• MAKEREADY • Annapurna • CAA Creative
Labs
Increase eOne’s ownership of must-have IP
Develop a pipeline of quality content, working with top
talent
Recent OTT deals e.g. Amazon, Netflix and Hulu
MIPCOM presented as TV & Film slate
Evolve eOne’s world-class
global sales team
Maximise content monetisation through deep relationships
Further changes to support functions to pool capabilities
Assessing systems for improved rights management/finance
Develop more effective and
efficient practices
Drive greater coordination and
productivity across the Group
Recent recruitment:
• MD Germany • EVPs
EMEA/APAC
Committee to track/ drive engagement
Enhance eOne’s role as employer
of choice
Evolve how eOne develops, engages
and retains the best talent
Cross-Divisional coordination
Music supervision across eOne and MGC projects
Improve collaboration
across the Group
Clarify vision, strategy and
priorities

entertainmentone.com
Library valuation process and methodology Annual independent valuation of eOne’s content
11
eOne provides historic performance of each segment and projections for new titles to Salem Partners
Salem evaluates projections using historical performance for similar content and its own models
• Los Angeles-based financial services group, founded in 1997
• Widely-respected industry experts in the valuation of intellectual property
• Independent financial and valuation opinions recognised and approved by major regional and national accounting and law firms, major commercial banks and institutional investors
Management fee and tax deducted from cash flows
Post-tax cash flows discounted using eOne WACC over 10 years with terminal value
Deduct NPV of future advance obligations to arrive at final library valuation

entertainmentone.com
55%
45%
2017
Family
Film andTelevision
Library valuation up 13%
12
As at 31 March 2017, the overall value of the Group’s independent content library valuation increased to US$1.7 billion - The annual independent library valuation includes
eOne’s share of all of the Group’s television, family, film and music assets as at 31 March 2017
- Key valuation assumptions consistent year-on-year
- No significant change in Divisional split
Key assumptions FY16 FY17
Discount rate 8.2% 7.9%
Admin & OH rate 6.0% 6.0%
FX rates:
CAD 0.77 0.81
GBP 1.44 1.40
EUR 1.13 1.20
AUD 0.76 0.80
US$1,700m

entertainmentone.com
13 entertainmentone.com
Financial review

entertainmentone.com 14
Half Year Financial Highlights
entertainmentone.com
Revenue £395.7m Stable Growth across Family and Television offset by decline in Film
EBITDA1 £51.4m 36.3% Growth in Family and Television
EBITDA margin 13.0% 3.6pts Growth of Family and lower costs in Film
EPS2 4.8p 2.2p
Free cash outflow3 £66.6m £1.3m Broadly stable
Net debt £312.8m £49.5m Includes cash outflows due to prior years’ restructuring

entertainmentone.com 15
Revenue consistent period-on-period Revenue growth in Television and Family offset by Film
Period-on-Period Divisional Revenue Bridge
Group revenue 1.3% – Strong Television growth from higher international
distribution sales for third party content in eOne Television and strong revenues from Designated Survivor seasons 1 and 2
– Family growth driven by significant growth of PJ Masks and continued strong performance from Peppa Pig
– Film decline reflecting lower box office and lower profile of films compared to the prior period
Foreign exchange – Translation impact of weaker pound against the US,
Canadian and Australian dollar and the euro – underlying revenue decline on a constant currency basis was 5.0%
£m 2017 2016. Change
Television 168.5 144.5. 16.6%
eOne Television 118.9 ‘98.0. 21.3%
The Mark Gordon Company 51.6 28.3. 82.3%
Music 23.4 25.8. (9.3%)
Television eliminations (25.4) (7.6). (234.2%)
Family 62.1 37.9. 63.9%
Film 171.8 242.0. (29.0%)
Total Divisional Revenue 402.4 424.4. (5.2%)
Group eliminations (6.7) (23.4). 71.4%
Total Group Revenue 395.7 401.0. (1.3%)
£424.4m £402.4m
£24.0m £24.2m (£70.2m)
2016 Television Family Film 2017

entertainmentone.com 16
£m 2017 2016 Change
Television 20.6 18.5. 11.4%
eOne Television 7.8 7.1. 9.9%
The Mark Gordon Company 9.9 9.0. 10.0%
Music 2.9 2.5. 16.0%
Family 38.1 24.7. 54.3%
Film (2.6) (2.3). (13.0%)
Total Divisional EBITDA 56.1 40.9. 37.2%
Group eliminations (0.1) -.. -
Group costs (4.6) (3.2). (43.8%)
Total Group EBITDA 51.4 37.7. 36.3%
EBITDA Margin % 13.0% 9.4% 360bps
EBITDA up 36.3% Growth driven by Television and Family with lower costs in Film
Period-on-Period EBITDA Bridge
£37.7m
£51.4m £2.1m
£13.4m (£0.3m) (£0.1m) (£1.4m)
2016 Television Family Film Group elims Centre 2017
Group EBITDA 36.3% – Strong performance by increased revenue across eOne
Television and MGC and improved margins in Music due to continued shift from physical to digital
– Family EBITDA growth from strong performance of PJ Masks and Peppa Pig
– Film EBITDA benefitted from gross margin improvements due to lower P&A spend and amortisation of acquired content and costs savings from prior years’ restructuring
Foreign exchange – Translation impact of weaker pound against the US,
Canadian and Australian dollar and the euro – underlying EBITDA growth on a constant currency basis was 33.5%

entertainmentone.com 17
Adjusted cash outflow lower by £12.5 million Reflecting strong cash generation in Family
Adjusted cash outflow lower than prior period by £12.5 million – Strong cash generation in Family driven by revenue growth
– Reduced investment in acquired content rights in Film due to limited higher profile films partly offset by lower amortisation driven by lower revenue
Negative free cash flow of £66.6 million, after interest, tax and capex – Driven by timing of tax payments
2017 2016
£m Television Family Film Centre &
Elims Total Television Family Film Centre &
Elims Total
Underlying EBITDA (exc. Production) 18.5 38.4 (2.7) (4.7) 49.5 21.2 24.8 (3.2) (3.2) 39.6
Amortisation of investment in acquired content rights 18.8 0.4 35.1 - 54.3 15.6 0.4 54.4 - 70.4
Investment in acquired content rights (15.7) (1.2) (71.2) - (88.1) (13.2) (0.7) (97.7) - (111.6)
Amortisation of investment in productions 19.3 1.2 2.3 - 22.8 20.1 (0.2) 0.8 - 20.7
Investment in productions, net of grants (31.6) (2.0) (1.3) 0.3 (34.6) (18.6) (1.1) 0.6 - (19.1)
Working capital - (10.4) (25.4) - (35.8) (13.8) (6.6) (24.4) - (44.8)
Joint venture movements - - - - - 0.4 - - - 0.4
Adjusted cash flow 9.3 26.4 (63.2) (4.4) (31.9) 11.7 16.6 (69.5) (3.2) (44.4)
Capital expenditure (1.5) (0.9)
Tax paid (21.7) (7.1)
Net interest paid (11.5) (12.9)
Free cash flow (66.6) (65.3)

entertainmentone.com 18
Net debt higher including cash outflows due to prior years’ restructuring costs
£m 2017 2016
Net debt (312.8) (263.3)
Net debt higher than prior period driven by: – Higher one-off items including financing (2017: £41.2m,
2016: £7.7m) including prior years’ restructuring as anticipated
Full year leverage expected to be 1.3x

entertainmentone.com 19
Full Year Outlook: Update 2018 Guidance Television May 2017 guidance Latest FY18
Investment in productions, eOne Television £170.0 million £160.0 million
Investment in acquired content, eOne Television £40.0 million £40.0 million
Investment in productions, The Mark Gordon Company £80.0 million £80.0 million
Half hours produced/acquired, eOne Television 1,000 900
Half hours produced, The Mark Gordon Company 75 60
Family May 2017 guidance Latest FY18
Investment in productions £5.0 million £5.0 million
Investment in acquired content £4.0 million £4.0 million
Film May 2017 guidance Latest FY18
Investment in acquired content £150.0 million £130.0 million
Investment in productions £50.0 million £50.0 million
No. of theatrical releases 200 180
No. of unique theatrical releases 100 100
May 2017 guidance Latest FY18
Amortisation of acquired intangibles £40.0 million £40.0 million
Operating one-off items £5.0 million £7.0 million
Net debt to Group EBITDA leverage 1.2x 1.3x

entertainmentone.com
Summary
Strong performance for the first half across the Group
Family ahead of expectations, driven by Peppa Pig in China and PJ Masks
Television pipeline robust, with a slate of new shows and recommissions
Film migrating from acquisition to production
Further reshaping will generate additional operational and financial benefits
Library valuation increased by 13% to US$1.7 billion
Full year in line with management expectations
20

entertainmentone.com
Q&A
21 entertainmentone.com

entertainmentone.com
Appendix
22 entertainmentone.com

entertainmentone.com 23
Reconciliation between H1 18 and H1 17 reported and adjusted earnings
2017 Restated 2016
£m Reported Adjustments Adjusted Reported Adjustments Adjusted
Underlying EBITDA 51.4 - 51.4 37.7 - 37.7
Amortisation of acquired intangibles (20.0) 20.0 - (20.7) 20.7 -
Depreciation/amortisation of software (1.9) - (1.9) (2.4) - (2.4)
Share-based payment charge (5.8) 5.8 - (2.8) 2.8 -
One-off items (3.3) 3.3 - 1.4 (1.4) -
Net finance charges (19.6) 6.5 (13.1) (15.7) 4.2 (11.5)
Profit/(loss) before tax 0.8 35.6 36.4 (2.5) 26.3 23.8
Tax 0.5 (9.5) (9.0) 1.3 (6.5) (5.2)
Profit/(loss) after tax 1.3 26.1 27.4 (1.2) 19.8 18.6
Less: Non-controlling interest (3.5) (2.8) (6.3) (4.7) (2.5) (7.2)
(Losses)/earnings (2.2) 23.3 21.1 (5.9) 17.3 11.4
Diluted (losses)/earnings per share (p) (0.5) 5.3 4.8 (1.4) 4.0 2.6
23

entertainmentone.com 24
One-off items
£m 2017 2016
Restructuring costs
Strategy-related 0.8 5.7
Total restructuring costs 0.8 5.7
Other items
Acquisition costs/(gains) 2.2 (9.0)
Other items 0.3 1.9
Total other items 2.5 (7.1)
Total one-off costs/(gains) 3.3 (1.4)

entertainmentone.com 25
Production financing cash flow 2017 2016
£m Television Family Film Total Television Family Film Total
Production underlying EBITDA 2.1 (0.3) 0.1 1.9 (2.7) (0.1) 0.9 (1.9)
Amortisation of investment in productions 23.5 0.1 4.0 27.6 21.9 1.3 21.8 45.0
Investment in productions, net of grants (84.2) (2.0) (20.9) (107.1) (70.3) (0.5) 3.1 (67.7)
Working capital 58.7 (0.1) 28.9 87.5 33.2 (0.5) (13.2) 19.5
Adjusted cash flow 0.1 (2.3) 12.1 9.9 (17.9) 0.2 12.6 (5.1)
Capital expenditure - (0.1)
Tax paid (1.0) (1.6)
Net interest paid (0.7) -
Production free cash flow 8.2 (6.8)
entertainmentone.com 26
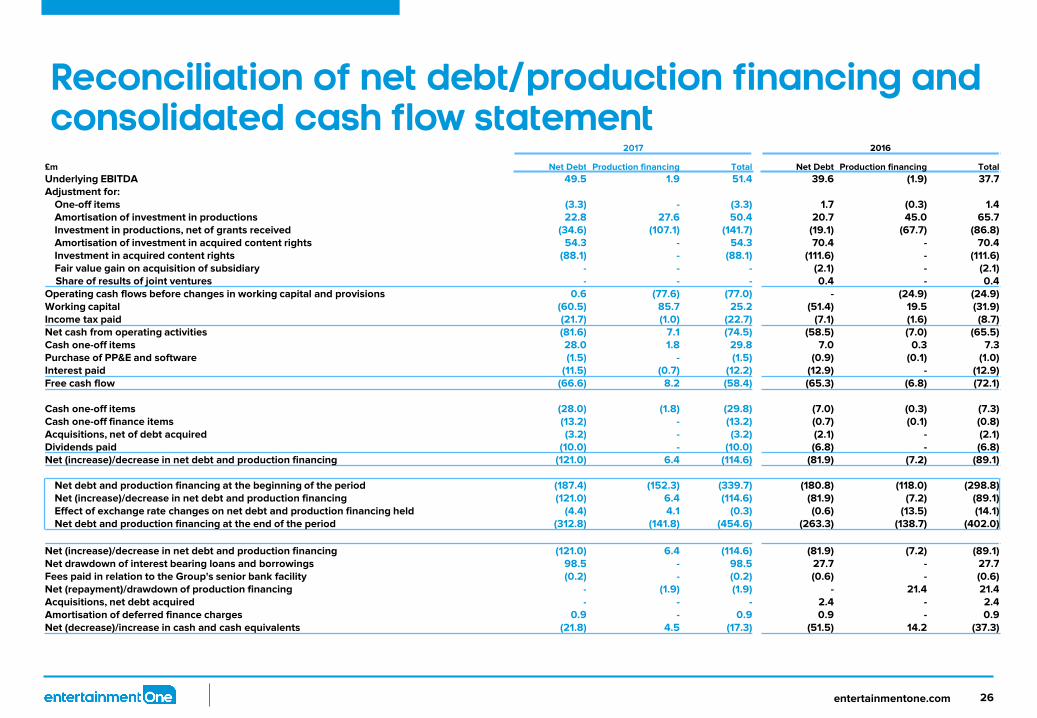
Reconciliation of net debt/production financing and consolidated cash flow statement
2017 2016
£m Net Debt Production financing Total Net Debt Production financing Total
Underlying EBITDA 49.5 1.9 51.4 39.6 (1.9) 37.7 Adjustment for:
One-off items (3.3) - (3.3) 1.7 (0.3) 1.4 Amortisation of investment in productions 22.8 27.6 50.4 20.7 45.0 65.7 Investment in productions, net of grants received (34.6) (107.1) (141.7) (19.1) (67.7) (86.8) Amortisation of investment in acquired content rights 54.3 - 54.3 70.4 - 70.4 Investment in acquired content rights (88.1) - (88.1) (111.6) - (111.6) Fair value gain on acquisition of subsidiary - - - (2.1) - (2.1)
Share of results of joint ventures - - - 0.4 - 0.4 Operating cash flows before changes in working capital and provisions 0.6 (77.6) (77.0) - (24.9) (24.9) Working capital (60.5) 85.7 25.2 (51.4) 19.5 (31.9) Income tax paid (21.7) (1.0) (22.7) (7.1) (1.6) (8.7) Net cash from operating activities (81.6) 7.1 (74.5) (58.5) (7.0) (65.5) Cash one-off items 28.0 1.8 29.8 7.0 0.3 7.3 Purchase of PP&E and software (1.5) - (1.5) (0.9) (0.1) (1.0) Interest paid (11.5) (0.7) (12.2) (12.9) - (12.9) Free cash flow (66.6) 8.2 (58.4) (65.3) (6.8) (72.1)
Cash one-off items (28.0) (1.8) (29.8) (7.0) (0.3) (7.3) Cash one-off finance items (13.2) - (13.2) (0.7) (0.1) (0.8) Acquisitions, net of debt acquired (3.2) - (3.2) (2.1) - (2.1) Dividends paid (10.0) - (10.0) (6.8) - (6.8) Net (increase)/decrease in net debt and production financing (121.0) 6.4 (114.6) (81.9) (7.2) (89.1)
Net debt and production financing at the beginning of the period (187.4) (152.3) (339.7) (180.8) (118.0) (298.8) Net (increase)/decrease in net debt and production financing (121.0) 6.4 (114.6) (81.9) (7.2) (89.1) Effect of exchange rate changes on net debt and production financing held (4.4) 4.1 (0.3) (0.6) (13.5) (14.1) Net debt and production financing at the end of the period (312.8) (141.8) (454.6) (263.3) (138.7) (402.0)
Net (increase)/decrease in net debt and production financing (121.0) 6.4 (114.6) (81.9) (7.2) (89.1) Net drawdown of interest bearing loans and borrowings 98.5 - 98.5 27.7 - 27.7 Fees paid in relation to the Group's senior bank facility (0.2) - (0.2) (0.6) - (0.6) Net (repayment)/drawdown of production financing - (1.9) (1.9) - 21.4 21.4 Acquisitions, net debt acquired - - - 2.4 - 2.4 Amortisation of deferred finance charges 0.9 - 0.9 0.9 - 0.9 Net (decrease)/increase in cash and cash equivalents (21.8) 4.5 (17.3) (51.5) 14.2 (37.3)

entertainmentone.com 27
Analysis of net debt and cash
£m 2017 2016
£285m Senior secured notes at 6.875% (285.0) (285.0)
Bank borrowings (94.4) (32.5)
Cash (net of overdrafts) 59.4 45.7
Deferred finance charges 7.7 9.1
Other (0.5) (0.6)
Net debt (312.8) (263.3)

entertainmentone.com 28
Notes 1. Underlying EBITDA is operating profit or loss excluding amortisation of acquired intangibles; depreciation; amortisation of software; share-based payment
charge; tax, finance costs and depreciation related to joint ventures; and operating one-off items. Underlying EBITDA is reconciled to operating profit in the Other Financial Information section of the Interim Announcement.
2. Adjusted profit before tax and adjusted diluted earnings per share are the reported measures excluding amortisation of acquired intangibles; share-based payment charge; tax, finance costs and depreciation related to joint ventures; operating one-off items; finance one-off items; and, in the case of adjusted diluted earnings per share, one-off tax items. Refer to the Other Financial Information section of the Interim Announcement for a reconciliation of adjusted profit before tax and Note 6 in the condensed consolidated financial statements for the adjusted diluted earnings per share reconciliation.
3. Free cash flow is calculated from cash flows associated with the net debt of the Group. It excludes cash flows associated with production activities. Free cash flow is adjusted cash flow less capital expenditure, net interest paid and tax paid. It is measured excluding one-off items. Adjusted cash flow is underlying EBITDA (excluding EBITDA related to Production Financing), amortisation of investment in acquired content rights, investment in acquired content rights, amortisation of investment in productions, investment in productions (net of grants), working capital and joint venture movements.

entertainmentone.com 29
Important information
This confidential presentation (including any oral information, question and answer session and any other document or materials distributed at or in connection with this presentation) (the “Presentation”) has been prepared by Entertainment One Ltd. (the “Company”), and contains confidential information regarding the Company, its business and operations and members of its group (“Group”). It is provided for the exclusive use of the persons provided with the Presentation, and the Presentation and any further confidential information made available to any recipient, either verbally or in writing, must be held in complete confidence and without prejudice to the aforesaid, such information and documents containing such information may not be reproduced, used or in any way disclosed without the prior written consent of the Company.
This Presentation is not intended to form the basis of any investment activity or decision, and should not be considered as a recommendation by the Company that any recipient should acquire any interest in the share capital or in any other interest in the Company. It does not constitute or form part of and should not be relied upon in connection with any offer or invitation to sell or issue, or a solicitation of an offer or invitation to purchase or subscribe for, any securities or other interests in the Company or any related entity and no legal relations shall be created by its issue.
The contents of this Presentation have not been approved for distribution in the UK by an authorised person for the purposes of Section 21 of the Financial Services and Markets Act 2000 (“FSMA”). This Document may only be communicated or caused to be communicated in the UK to: (1) persons authorised to carry on a regulated activity (“Authorised Persons”) under FSMA; (2) persons otherwise having professional experience in matters relating to investments and qualifying as investment professionals under Article 19 of the Financial Services and Markets Act 2000 (Financial Promotion) Order 2005, as amended (the “Order”); (3) persons qualifying as high net worth individuals under Article 48 of the Order; (4) persons qualifying as high net worth companies or unincorporated associations under Article 49 of the Order; or (5) to any other person to whom this Document may otherwise lawfully be communicated or caused to be communicated, including the recipients (“Relevant Persons” ).
The distribution of the Presentation in certain jurisdictions may be restricted by law and therefore persons into whose possession this document comes should inform themselves about and observe such restrictions. Any person who receives this Presentation in violation of such restrictions should not act upon it and should return it to the Company immediately. The Presentation is not directed to, or intended for distribution or use by any persons or entity that is a citizen or resident or located in any locality, state, country or other jurisdiction where such distribution or use would be contrary to law or regulation or which would require any registration or licensing within such jurisdiction. In particular, this Presentation (and the information contained in it) is not for release, publication or distribution, directly or indirectly, in the United States (or for the account of any "U.S. Person" as defined in Regulation S under the US Securities Act 1933), Australia, New Zealand, Canada, Japan or South Africa. Persons into whose possession this Presentation comes should inform themselves about and observe such restrictions.