entertaining people - annual reports
TRANSCRIPT

THE RANK GROUP PLC
Entertaining people
The Rank Group Plc Annual Report and
Financial Statements 2010

Entertainment – it’s something our people have been doing for almost three-quarters
of a century.
See overleaf for an overview of our businesses
Group overviewOur businesses IFCOur markets IFCOur performance 1Entertaining people since 1937 2Chairman’s statement 3
Business review Chief executive’s review 5– State of play 7– Strategic overview 9Operating review 14– Bingo 14– Casino 20– Remote gaming and betting 27Operating responsibly 30Finance review 34Tax fact file 38
Governance Board of directors 42Corporate governance 44Remuneration report 56
Statutory reports and financial statementsIndependent auditors’ report 66Group income statement 67Group statement of comprehensive income 68Balance sheets 69Statements of changes in equity 70Statements of cash flow 71Notes to the financial statements 72
Other informationFive year review 118Shareholder information 119Our games 120Glossary IBC
CONTENTS
The Group overview, Business review and Governance sections make up the Directors’ Report in accordance with the Companies Act 2006.

Directors’ report: Group overview
OUR BUSINESSES
Rank is a leading European gaming-based entertainment company, headquartered in Great Britain and listed on the London Stock Exchange.
* Before adjustment for the free bets, promotions and customer bonuses.** Before exceptional items.*** At 31 December 2010, Grosvenor operated 35 casino venues in Great Britain, incorporating 36 operating licences.
Mecca Bingo Top Rank España Grosvenor Casinos Rank Interactive
Mecca Bingo provides social, community-focused gaming-based entertainment in more than one hundred venues across Great Britain. The brand holds particular appeal for women.
Top Rank España delivers gaming-based entertainment to the Spanish market.
Grosvenor Casinos provides entertainment based around casino table games and high prize gaming machines in venues across Great Britain and in Belgium. The brand is most popular with male customers but is becoming increasingly attractive to women too.
Rank Interactive distributes and markets Rank’s brands via remote (online and mobile) media, principally to customers in Great Britain.
Revenue* Revenue Revenue* Revenue*
£234.5m £37.0m £238.6m £57.7mOperating profit** Operating profit** Operating profit** Operating profit
£29.7m £6.8m £36.0m £7.9mMarket positions
– 103 licensed bingo clubs in Great Britain
– Headquartered in Maidenhead, England
Market positions
– 11 licensed bingo clubs in Madrid, Catalonia, Andalucia and Galicia
– Headquartered in Barcelona, Spain
Market positions
– 35*** licensed casinos in Great Britain
– 2 licensed casinos in Belgium
– Headquartered in Maidenhead, England
Market positions
– meccabingo.com is one of the most popular online bingo brands in Great Britain
– Based in Alderney, Channel Islands
Customer numbers Customer numbers Customer numbers Customer numbers
911,000 331,000 1,131,000 261,000Key achievements
– Increase in customers
– Strong improvement in customer satisfaction score
– Growth in customer referrals to meccabingo.com
Key achievements
– Revenue and profit growth in difficult market conditions
– Increase in customers and customer visits
Key achievements
– Exceeded one million customers for first time
– Extensive programme of estate modernisation
– Significant growth in revenue and operating profit
Key achievements
– Sustained revenue growth from meccabingo.com
– Increase in customers
– Preparation for launch to Spanish market in 2011

OUR MARKETS
Mecca Bingo:
103 clubs
8,157 employees
Grosvenor Casinos:
35 casinos*
Spain
Top Rank España:
11 clubs
590 employees
Belgium
Grosvenor Casinos:
2 clubs
190 employees
Rank entertains across a portfolio of leisure venues and via online and mobile media.
* 35 venues incorporating 36 licences.
Employee numbers based on averages for 2010.
Key:
Mecca Bingo:
Grosvenor Casinos:
Great Britain
We have developed a portfolio of brands to meet the gaming and entertainment needs of a wide range of customers and a variety of occasions.
Gaming-based entertainment, delivered across multiple channels
OUR BRANDS
OUR VENUES
Mecca Bingo Grosvenor Casinos Blue Square Top Rank España
Venues –
Online –
Mobile –Dis
trib
uti
on

1The Rank Group Plc: Annual report and financial statements 2010
OUR PERFORMANCE
During 2010, Rank recorded another year of growth in adjusted earnings per share, driven by continued operational improvements and further debt reduction.
Directors’ report: Group overview
07 534.4
522.2
540.0
567.8
08
09
10
Revenue* (£m) £567.8m07 68.3
60.3
58.0
62.0
08
09
10
Operating profit** (£m) £62.0m
07 511.0
505.4
520.5
544.5
08
09
10
Statutory revenue (£m) £544.5m07 96.8
86.6
83.9
92.3
08
09
10
EBITDA*** (£m) £92.3m
07 46.2
40.5
48.5
55.2
08
09
10
Adjusted profit before tax (£m)**** £55.2m07 316.9
226.5
186.8
123.4
08
09
10
Net debt (£m) £123.4m
07 7.4
7.3
8.9
10.2
08
09
10
Adjusted earnings per share (p) 10.2p07 2.0
1.35
Nil
2.4
08
09
10
Dividend per share (p) 2.4p
09 37.0
38.010
Net promoter score (%) 38.0%07 12.8
11.5
10.7
10.9
08
09
10
Operating margin (%) 10.9%
Net promoter score measures a customer’s propensity to recommend our brands. It is calculated by subtracting negative scores from positive scores with the difference expressed as a percentage of the whole.
* Before adjustment for free bets, promotions and customer bonuses.** Before exceptional items.*** Group EBITDA before exceptional items is Group operating profit before depreciation
and amortisation.
**** Adjusted profit before taxation is calculated by adjusting profit from continuing operations before taxation to exclude exceptional items, the unwinding of discount in disposal provisions, other financial gains or losses and the amortisation of the equity component of the convertible bond.
Note: All references in this report to ‘like-for-like’ exclude club openings and closures as well as changes to gaming taxation.

2 The Rank Group Plc: Annual report and financial statements 2010
Directors’ report: Group overview
ENTERTAINING PEOPLE SINCE 1937
Entertaining history Entertaining brands
The Rank Organisation was established in 1937 by J Arthur Rank (later Lord Rank) in Britain’s motion pictures industry and in time expanded into other forms of entertainment.
Over the years, Rank has been involved in a wide variety of leisure retail and manufacturing activities, including cinemas, holiday camps, theme parks, pubs, clubs, restaurants, hotels, photocopier manufacture, film production and distribution and in-home entertainment (TV, radio and popular music).
The desire to entertain beats through Rank’s long and varied corporate history. It is felt as keenly today in our Mecca Bingo, Grosvenor Casinos, Top Rank España and Blue Square brands as it was 74 years ago.
During its history, Rank has presided over some of the world’s best known entertainment brands, from the globally cool Hard Rock Café and Hard Rock Casino to enduring British favourites like Odeon Cinemas and Butlin’s Holiday Camps. As a major player in the British film industry from the 1930s to the 1970s, Rank has been associated with the development of a number of world famous third-party brands, including the ‘James Bond’ and ‘Carry On’ motion picture franchises.
Even today, several decades after the Rank Organisation made its final movie, the Group’s ‘gong-man’ logo is among the most evocative images of entertainment in Great Britain.
The development of loved and trusted brands remains central to Rank’s approach to entertaining its customers.
Entertaining games Entertaining people
Rank moved into the gaming industry in 1961, when a number of its cinemas started providing games of bingo (which had just been legalised under the 1960 Betting and Gaming Act) between screenings. The growing popularity of the game and a nationwide decline in the level of cinema attendances prompted the company to shift the focus of operations in many clubs from movies to bingo and in time to establish dedicated bingo clubs under the Top Rank brand (which was replaced by Mecca Bingo following its acquisition in 1990).
Having established itself as one of the largest bingo businesses in Great Britain, Rank moved into the casinos sector in 1990; and in 2003 the company invested in the growing remote gaming and betting sector via the acquisition of Blue Square.
Following the sale of the Hard Rock brand in 2007, Rank emerged as a focused gaming-based entertainment business.
Throughout almost three-quarters of a century, our people have sought to fulfil the human need for entertainment.
The roll-call of those who have brought joy to our lives under the Rank name includes film directors Sir David Lean, Michael Powell and Sir Alfred Hitchcock; and actors and movie stars, Sir Laurence Olivier, Sir Michael Caine and Kenneth Williams. The Beatles and Bob Dylan were amongst the artists who performed at Rank venues in the 1960s; whilst The Who and Bruce Springsteen are just two of the internationally acclaimed acts who helped Hard Rock entertain the world, under Rank’s ownership of the brand.
We remain proud of our heritage and true to our founding spirit of entertainment.
The iconic Rank ‘gong man’ symbolises the spirit of entertainment. In 2011, as we prepare to celebrate our 75th birthday, the desire to entertain is the common impulse that unites all of our people.

3The Rank Group Plc: Annual report and financial statements 2010
OUR PROGRESS OVER THE YEAR
During 2010, Rank recorded a further year of progress, delivering strong growth in earnings and dividend per share through improved revenue and profit conversion. In a challenging economic environment, the Group continued to strengthen its financial position through debt reduction and stepped up investment in its assets and strategic capabilities.
This performance was built on a number of key competitive advantages, including the ownership of established and trusted gaming brands (Mecca Bingo celebrates its 50th anniversary this year); the ability to deliver them across a range of land-based venues and remote channels; increasingly sophisticated systems for understanding and engaging with our customers; and a management team totally motivated to delivering outstanding service to customers.
Our most important strength is the ability of our people to bring enjoyment to others. At Rank, we have been doing this for nearly three-quarters of a century, from our early days as a motion picture company and since 1961 as one of the leading operators within Great Britain’s licensed gaming market. Within the pages of this year’s annual report we pay tribute to our people and highlight just some of the outstanding contributions to customer service that were made during 2010.
Our performance – customersOur commercial performance is predicated on our ability to delight and to entertain the 2.5 million customers that we serve across our businesses. The hard work, ingenuity and inspiration of our team of more than 8,900 employees is central to our ability to create experiences that bring excitement, fun and a sense of community for all of our customers.
As a consequence of these efforts, Group customer satisfaction (as measured by net promoter score) increased slightly to 38%. We have set our sights on further improvement as we seek to build on this year’s growth in customers and customer visits.
We all share a desire to ensure that our customers can enjoy themselves in safe environments and for preventing any negative effects arising from our operations – something that is critical to both customer trust in our brands and broader society’s faith in our integrity.
The British Gambling Prevalence Survey, published in February 2011 demonstrated the effects of the industry’s approach in this area with the casinos and bingo clubs sectors once again recording comparatively low incidences of problem gambling.
Building on our track record for responsible operation we have continued to engage positively with governments and regulators in order to help shape a more supportive environment. In Great Britain, we have made some progress, notably relating to Government proposals for the positive reform of amusement machines regulations in licensed bingo clubs. During 2011,
“ Our most important strength is the ability of our people to bring enjoyment to others. At Rank we have been doing this for nearly three-quarters of a century.”
Directors’ report: Chairman’s statement
Peter Johnsonchairman24 February 2011

4 The Rank Group Plc: Annual report and financial statements 2010
Directors’ report: Chairman’s statement continued
we will continue to invest resources in this area in order to be permitted to deliver the product and service improvements that our customers have asked us for.
Our performance – communityWe recognise that our ability to achieve our financial objectives is based not simply on how we make our customers feel; but also how the wider communities in which we operate feel about us. This is built upon what we are able to give back to those communities.
In 2010, our businesses provided employment for more than 8,900 people across Great Britain, Belgium and Spain and generated more than £156m in local and national taxes.
During 2010, Rank’s brand teams raised more than £288,000 for our chosen charity, Marie Curie Cancer Care – an achievement that owes everything to the dedication and generosity of our people and our customers. The funds will enable the charity to provide more than 14,400 hours of care by Marie Curie nurses – often for people in communities where our businesses operate.
Our performance – shareholdersRank delivered a positive return for shareholders during 2010, with the shares rising by more than 50% over the course of the year. The shares delivered a total shareholder return (‘TSR’) of 55% for the 12-month period.
The resumption of ordinary dividend payments in April reflected how far the Group had come since the difficult period of 2007 and 2008, when the negative effects of the smoking ban and the Gambling Act combined with unexpected increases in gaming duty caused significant loss of earnings.
During 2010, the Group returned to growth in operating profit despite a number of headwinds, including the reversion of VAT to a 17.5% standard rate and a difficult economic environment. We were particularly encouraged by the fact that our improved performance was based upon an increase in customer numbers and customer visits. We have invested considerable resources to improve our customer insight capabilities and to use them to deliver better entertainment to our customers.
DividendReflecting the Group’s continued progress, the board is pleased to recommend that a final dividend of 1.66p per ordinary share be paid on 4 May 2011 to shareholders on the register at 1 April 2011. This represents a 23% increase compared with the final dividend for 2009 and is in line with our medium-term aim of growing dividends faster than earnings as we target a level of 3.0 times dividend cover.
The full-year dividend in respect of the 2010 financial year (incorporating the interim and final dividends) is 2.4p per share – approximately 24% of the Group’s adjusted earnings per share.
OutlookLooking ahead, the operating environment for our businesses in 2011 presents both challenges and opportunities. The Group is in a strong position to meet both as a result of the actions we have taken in recent years to improve our service to customers, to extend and enhance our venues and remote channels, to keep operating costs in balance and to reduce debt.
In this our 75th year, we look forward to the future with confidence.
Shareholder Return
Total shareholder return (TSR)Shares in Rank delivered a 55% TSR in 2010 as a result of sustained operational improvement and the resumption of dividend payments.
Value of hypothetical £100 holding(Five years)
0255075100125150
100908070605Rank FTSE 350
07 7.4
7.3
8.9
10.2
08
09
10
Adjusted earnings per share (p) 10.2p
07 2.0
1.35
Nil
2.4
08
09
10
Dividend per share (p) 2.4p

5The Rank Group Plc: Annual report and financial statements 2010
During 2010, Rank recorded another year of growth in adjusted earnings per share, driven by continued operational improvements and further debt reduction. At the same time we continued to build for the future, investing in our assets, strengthening our team and improving our capabilities in key strategic areas.
During the year, our brand teams served more than 2.5 million customers, with growth across each of our businesses. Customer visits increased by 1.7% to more than 22 million and average spend per visit improved by 3.4% to £25.30.
The Group’s net promoter score, which measures the propensity of customers to recommend our brands, increased to 38%, with the strongest improvement from Mecca Bingo.
Group key performance indicators (KPIs)
2010 2009
Customers (000s) 2,514 2,330*Customer visits (000s)** 22,441 22,068Average revenue per customer (£) 225.86 231.76Spend per visit (£) 25.30 24.47Online-offline crossover*** 2.9%Net promoter score 38% 37%
* Re-stated to adjust for customer cross-over between brands and channels.** Excludes Rank Interactive.*** Percentage of UK customers playing online and offline with Rank brands.
Moving into 2011, the consumer environment remains challenging with higher sales taxes in both Great Britain and Spain; as well as the introduction of a full smoking ban in Spain. Nevertheless, the Group has started the year well with growth in like-for-like revenue and increases in customer visits in our two largest businesses, Grosvenor Casinos and Mecca Bingo.
We aim to complete a refinancing during the second half of 2011, due to the expiry of our existing banking facilities in 2012. Whilst the lending environment is not as benign as it was in 2007 (when we agreed our current banking facilities), the Group’s operating performance and substantially reduced net debt levels have put us in an advantageous position.
In each of our markets, we have the opportunity to achieve sustained growth in operating profit through stimulating consumer demand for our brands and broadening brand distribution both via land-based venues and remote media.
OUR STRENGTH TO GROW
Directors’ report: Chief executive’s review
“ In each of our markets, we have the opportunity to achieve sustained growth in operating profit through stimulating consumer demand for our brands and broadening brand distribution both via land-based venues and remote media.”
Ian Burkechief executive24 February 2011
6 The Rank Group Plc: Annual report and financial statements 2010
Directors’ report: Chief executive’s review continued
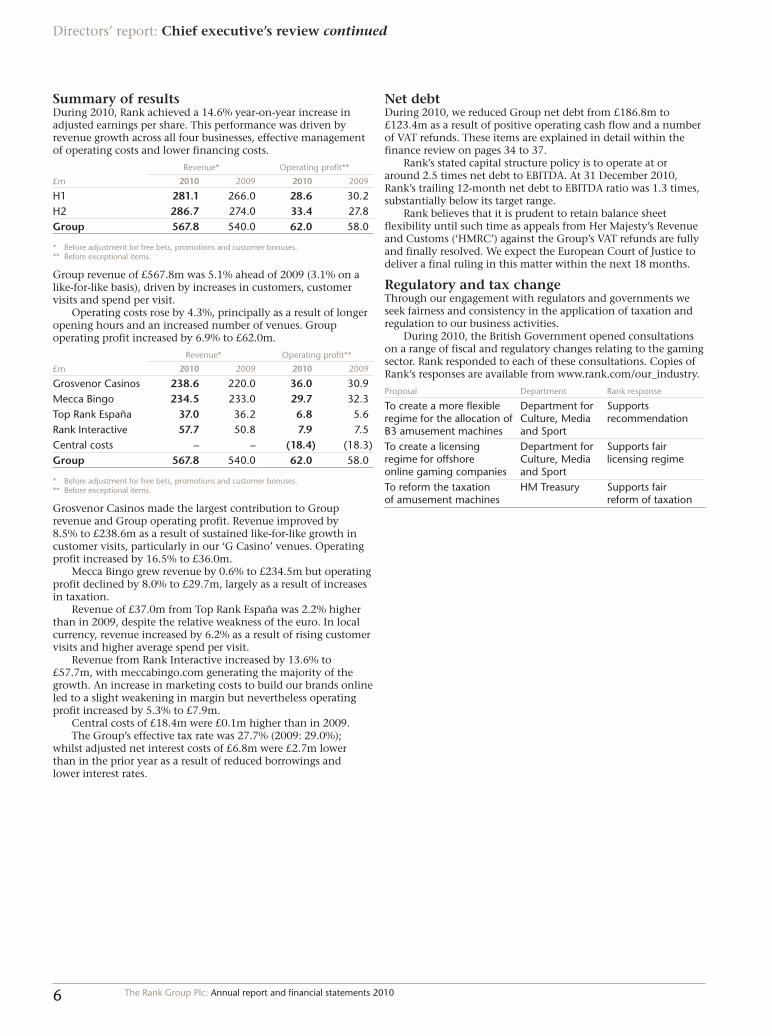
Summary of resultsDuring 2010, Rank achieved a 14.6% year-on-year increase in adjusted earnings per share. This performance was driven by revenue growth across all four businesses, effective management of operating costs and lower financing costs.
Revenue* Operating profit**
£m 2010 2009 2010 2009
H1 281.1 266.0 28.6 30.2H2 286.7 274.0 33.4 27.8Group 567.8 540.0 62.0 58.0
* Before adjustment for free bets, promotions and customer bonuses.** Before exceptional items.
Group revenue of £567.8m was 5.1% ahead of 2009 (3.1% on a like-for-like basis), driven by increases in customers, customer visits and spend per visit.
Operating costs rose by 4.3%, principally as a result of longer opening hours and an increased number of venues. Group operating profit increased by 6.9% to £62.0m.
Revenue* Operating profit**
£m 2010 2009 2010 2009
Grosvenor Casinos 238.6 220.0 36.0 30.9Mecca Bingo 234.5 233.0 29.7 32.3Top Rank España 37.0 36.2 6.8 5.6Rank Interactive 57.7 50.8 7.9 7.5Central costs – – (18.4) (18.3)Group 567.8 540.0 62.0 58.0
* Before adjustment for free bets, promotions and customer bonuses.** Before exceptional items.
Grosvenor Casinos made the largest contribution to Group revenue and Group operating profit. Revenue improved by 8.5% to £238.6m as a result of sustained like-for-like growth in customer visits, particularly in our ‘G Casino’ venues. Operating profit increased by 16.5% to £36.0m.
Mecca Bingo grew revenue by 0.6% to £234.5m but operating profit declined by 8.0% to £29.7m, largely as a result of increases in taxation.
Revenue of £37.0m from Top Rank España was 2.2% higher than in 2009, despite the relative weakness of the euro. In local currency, revenue increased by 6.2% as a result of rising customer visits and higher average spend per visit.
Revenue from Rank Interactive increased by 13.6% to £57.7m, with meccabingo.com generating the majority of the growth. An increase in marketing costs to build our brands online led to a slight weakening in margin but nevertheless operating profit increased by 5.3% to £7.9m.
Central costs of £18.4m were £0.1m higher than in 2009.The Group’s effective tax rate was 27.7% (2009: 29.0%);
whilst adjusted net interest costs of £6.8m were £2.7m lower than in the prior year as a result of reduced borrowings and lower interest rates.
Net debtDuring 2010, we reduced Group net debt from £186.8m to £123.4m as a result of positive operating cash flow and a number of VAT refunds. These items are explained in detail within the finance review on pages 34 to 37.
Rank’s stated capital structure policy is to operate at or around 2.5 times net debt to EBITDA. At 31 December 2010, Rank’s trailing 12-month net debt to EBITDA ratio was 1.3 times, substantially below its target range.
Rank believes that it is prudent to retain balance sheet flexibility until such time as appeals from Her Majesty’s Revenue and Customs (‘HMRC’) against the Group’s VAT refunds are fully and finally resolved. We expect the European Court of Justice to deliver a final ruling in this matter within the next 18 months.
Regulatory and tax changeThrough our engagement with regulators and governments we seek fairness and consistency in the application of taxation and regulation to our business activities.
During 2010, the British Government opened consultations on a range of fiscal and regulatory changes relating to the gaming sector. Rank responded to each of these consultations. Copies of Rank’s responses are available from www.rank.com/our_industry.
Proposal Department Rank response
To create a more flexible regime for the allocation of B3 amusement machines
Department for Culture, Media and Sport
Supports recommendation
To create a licensing regime for offshore online gaming companies
Department for Culture, Media and Sport
Supports fair licensing regime
To reform the taxation of amusement machines
HM Treasury Supports fair reform of taxation

7The Rank Group Plc: Annual report and financial statements 2010
Great Britain is by far the largest of Rank’s markets, representing approximately 90% of Group revenue and offers the opportunity for Rank to operate its strategic model of integrated online-offline gaming. Whilst the online opportunity in Spain and Belgium remains largely untapped at present, nascent regulation appears set to change this within the next 12 months.
The Group chooses to operate in these markets due to their size, growth potential, regulatory stability, geographical proximity and their cultural acceptance of gaming as a form of entertainment.
Great Britain
Adult population 48.9 million Size of gambling market £9.9bnGDP per capita £23,676 Gambling spend
per adult£202
Unemployment rate
7.7% Broadband penetration rate
67%
Proportion of Rank Group revenue
90% Smart phone penetration rate
38%
Source: Company research; Euromonitor International.
OverviewGreat Britain is one of the largest, longest established and most stable gaming and betting markets in Europe.
This year marks the 50th anniversary of the country’s first licensed bingo clubs and high street betting shops; a regulated casinos industry has been in place for more than 40 years; and Great Britain was one of the first jurisdictions in the world to recognise the legitimacy of remote gambling.
This relative stability, allied to demand growth potential (via investment and regulatory progression) and Rank’s long operating experience makes Great Britain an attractive market.
According to the Gambling Prevalence Survey, published in February 2011, 73% of adults in Great Britain participated in at least one form of gambling during 2010. By far the most popular activity was the National Lottery, followed by other lotteries, scratchcards and sports betting.
An estimated 13% of the adult population played gaming machines whilst 9% played bingo (8% in licensed clubs) and 5% played casino games (4% in licensed casinos).
Economic outlookThe UK economy grew by 1.8% in 2010 whilst unemployment stood at 7.7%. According to forecasts from Goldman Sachs, GDP will grow by 2.4% in 2011.
Political and regulatory changesThe key change to the political and regulatory landscape in 2010 was the replacement in government of the Labour Party by a Conservative-Liberal Democrat coalition, following the General Election in May.
Whilst, little substantive change has taken place since the election, there are signs that the coalition may adopt a fairer and more supportive position towards the licensed gaming industry, compared with the latter years of its Labour predecessor.
– In November 2010, the Department for Culture, Media and Sport proposed changes to amusement machine regulations that would permit licensed bingo clubs and amusement arcades to offer customers a higher number of B3 jackpot gaming machines. The consultation period for this change has now closed and an announcement regarding implementation is expected during the first half of 2011.
– The Department for Culture, Media and Sport is expected to follow up plans to create a licensing regime for offshore online gaming and betting operators.
During 2010, Rank operated branded gaming-based entertainment businesses aimed at customers in three jurisdictions – Great Britain, Spain and Belgium.
National Lottery
Other lotteries
Scratchcards
Horse races
Gaming machines
Online gaming
Private betting
Bingo
Other sports betting
Casino gamesFixed odds betting terminals
Online betting
Football pools
Gaming and betting in Great Britain, land-based and remote (% of adult population)
59%
25%
24%
16%
13%
11%
9%
9%
5%
4%
4%
4%
13%
7 3
90 17.1
Rank Group revenue by territory 2010 (%)
Great Britain
Spain
Belgium
Source: British Gambling Prevalence Survey 2010.
STATE OF PLAY

8 The Rank Group Plc: Annual report and financial statements 2010
Directors’ report: Chief executive’s review continued
– The Conservative Party has stated that it considers the rate of bingo duty applied to licensed bingo clubs to be too high and has pledged to reduce it from 20% to 15% “at such time as public finances permit”.
Tax changesThere have been a number of changes to business taxation in Great Britain; and a number of changes to gambling taxation have been proposed:
– On 4th January 2011, the standard rate of VAT increased from 17.5% to 20.0%.
– The basic rate of corporation tax will reduce from 28% to 27% this year and is expected to be lowered further to 26% in 2012.
– HM Treasury has announced that the taxation regime for amusement machines will be reformed from 2012, with the current application of VAT plus a fixed annual machine charge being replaced by ad valorem duty rates.
– Whilst no announcements have yet been made on the subject, it is Rank’s view that in time offshore online gaming operators generating revenue from UK customers will be subject to UK gaming duty.
Spain
Adult population 37.8 million Size of gambling market €9.5bnGDP per capita €22,926 Gambling spend
per adult€251
Unemployment rate
20.2% Broadband penetration rate
53%
Proportion of Rank Group revenue
7% Smart phone penetration rate
17%
Source: Company research; Euromonitor International.
OverviewSpain is one of the largest gaming markets in Europe and has one of the highest levels of gambling expenditure per head.
The present regime for gaming and betting came into effect in 1977 following more than four decades of prohibition. Gaming machines and lotteries are the most popular forms of gaming in the country, followed by bingo and casino games.
Regulation and taxation of the industry is largely devolved to the country’s 17 autonomous communities and while this has resulted in some regional variances, it has also created an environment for gradual regulatory evolution.
Since 2008 land-based sports betting has been permitted in the Madrid and Basque regions; and Madrid has also been leading efforts to legalise internet gambling. The Spanish government has indicated that it intends to create a federal framework for the taxation and regulation of internet gambling and Rank expects this to take effect during 2012.
Economic outlookThe Spanish economy declined by 0.2% in 2010*, emerging from an 18-month recession during the first quarter of the year. At the end of the year, unemployment was estimated at 20.2%, representing a 2.2% point increase since 2009.
Goldman Sachs forecasts that the economy will grow in 2011, with a 1.0% improvement in GDP
Political and regulatory changes – In January 2011, a full ban on smoking in public places was introduced. This replaced a previous partial ban which permitted smoking to discrete sections of a premises.
– A framework for the regulation and taxation of internet gambling is due to be published during 2011 with implementation likely in 2012.
Tax changes – From 1 July 2010, the standard rate of VAT increased from 16% to 18%.
– From January 2011, the rate of bingo duty applied in the autonomous community of Madrid was reduced from 22% of gross stakes to 15% with a corresponding increase in the customer prize pool from 64% to 70% of gross stakes.
– In February 2011, the Spanish government announced that in a regulated market, remote gaming operators would be subject to taxation at 25% of gross profits.
Belgium
Adult population 8.6 million Size of gambling market €3.3bnGDP per capita €32,607 Gambling spend
per adult€384
Unemployment rate
8.5% Broadband penetration rate
64%
Proportion of Rank Group revenue
3% Smart phone penetration rate
23%
Source: Company research; Euromonitor International.
OverviewBelgium is a small but well-established and relatively stable market for gambling, an activity with a rich cultural heritage: the country’s first recorded lotteries date back to 1465; whilst the casino at Spa is the oldest surviving casino in the world.
Political and regulatory changesSince April 2010, the country has been operating without a full government. A provisional administration has continued to govern the country in the absence of a majority party. Whilst this position has created some political uncertainty, it has not blocked reform of the country’s gambling industry.
– In January 2011, regulations came into effect for the legalisation of online gambling in Belgium. A number of Royal Decrees need to be passed in order to activate the regime. The first online sports betting licences are likely to be granted during the first half of 2011, with online casino licences expected to follow later in the year.
– Under current regulations, online gambling licences will be restricted to land-based licence holders.
Tax changes – As the legislation is currently drafted, remote gaming taxation will be levied at between 11% and 15% of gross profits.
* Goldman Sachs estimates.

9The Rank Group Plc: Annual report and financial statements 2010
In order to achieve our aim, we have developed a strategy that is defined at both a Group level and a brand level.
– Group strategy – provides a framework to determine long-term decisions about which markets and sectors to operate in and how to allocate capital between them.
– Brands strategy – provides a framework for operational decisions within our brand portfolio.
Group strategyOur Group strategy is to develop gaming-based entertainment experiences, offered to customers via licensed venues and remote channels in markets where the regulatory and fiscal framework offers the opportunity to generate attractive, sustainable returns.
In order to access these markets, we have developed a portfolio of brands aimed to meet the gaming and entertainment preferences of a wide range of customers and for a variety of occasions. Behind these brands are a range of common competencies (e.g. hospitality, catering, machines management) and shared services (e.g. procurement, finance, human resources, property management).
As a business operating in a highly regulated sector of the leisure and entertainment market, three key capabilities are core to our strategy:
– Customer focus – we use customer insight (based on analysis of quantitative data and qualitative intelligence) to guide service and product evolution;
– Responsible operation – the way that we look after our customers not only determines the sustainability of our customer relationships but also our position with regard to regulators, governments and the broader communities within which we operate; and
– Constructive political engagement – we work with governments and regulators to shape a regulatory and fiscal environment that supports both our own development and responsible policy objectives.
We perceive growing convergence between land-based and remote gaming and see the ability to meet consumption demand across a range of channels as an increasingly important advantage in a competitive market.
Within the markets where we operate, licensed gaming venues such as casinos and bingo clubs offer an attractive combination of growth potential and stability. Relatively low levels of market penetration (only 5% of adults in Great Britain played casino games in 2010) and changing regulations offer the opportunity to modernise in order to stimulate demand growth. Meanwhile, important licensing restrictions and the requirement for high levels of probity add a defensive aspect to the sector.
Brands strategy
We view our ownership of established and trusted brands and the ability to reach out to more than 2.5 million customers both through our land-based venues and remote channels as a source of competitive advantage.
Each of Rank’s brands is following a strategy to grow customer numbers, visits and revenue through:
1. the systematic use of data and customer feedback to inspire service and product improvements;
2. capital investment to extend the reach and broaden the appeal of our land-based venues; and
3. the wider distribution of our brands via online and mobile media.
See overleaf to read how we are executing our brand strategy.
STRATEGIC OVERVIEW
Rank’s aim is to generate wealth for shareholders by achieving sustainable growth in earnings and dividends per share.

10 The Rank Group Plc: Annual report and financial statements 2010
Directors’ report: Chief executive’s review continued
1.1 Customer focus through insight & engagement
The desire to understand more about customer attitudes and behaviours in order to refine our products and services and inspire innovation is the keystone of our approach. Driving this to the heart of our operations through systems development and customer and employee engagement is critical to the achievement of our goals.
We have continued to invest in our insight capability, covering the collection, analysis and interpretation of quantitative and qualitative data in order to gain a deeper understanding of customer behaviour.
During the final quarter of the year, we launched a single inventory customer relationship management system covering all of our UK customers across Mecca Bingo, Grosvenor Casinos and Rank Interactive. This allows us to view how our customers interact with each of our brands, including club and website visits, spending patterns, games preferences and satisfaction scores. It is becoming a core business tool for our brands, guiding how we develop products and services, how we communicate with our customers and where we invest capital in new venues.
The development of customer rewards programmes in Grosvenor Casinos and Mecca Bingo has facilitated the collection of more detailed information on customer preferences than was hitherto available.
At 31 December 2010, more than 328,000 customers were members of our Play Points customer rewards programmes. During the year, we extended Play Points from eight to 13 of our casinos with the programme encompassing 18% of our members and tracking 15% of our revenue. Play Points was also extended from two to eight Mecca Bingo clubs.
We continued to gather and analyse qualitative data to understand changes in customer behaviour. During the course of the year, we interviewed more than 49,000 customers to compile our net promoter score, we received more than 15,000 individual pieces of feedback and invested in over 1,300 hours of focus group and immersion research.
1.2 Insight into action – service improvementsDuring 2010, we continued to invest in service and product improvements, based upon our understanding of customer preferences.
Gaming and entertainmentMore than 90% of Group revenue is generated by the games that our customers play. During 2010, gaming revenue grew by 4.6% to £520.2m.
Highlights included:
– Launch of exclusive ‘Britain’s Got Talent’ games on meccabingo.com and in Mecca Bingo clubs;
– Replacement of 1,650 electronic bingo units in 17 clubs with ‘Mecca Max’ mobile gaming terminals, offering main stage bingo, interval games and amusements;
– Extension of server-based amusement machines from 422 units to 673 across all Mecca Bingo clubs, enhancing our ability to test new games;
– Roll-out of 1,687 community games across our amusement machines in Mecca Bingo;
– Upgrades to electronic roulette in 13 Grosvenor Casinos; and
– Extension of ‘After Dark’ suite of late night games from two to six Mecca Bingo clubs.
We will maintain our focus on innovation in entertainment in 2011, with the completion of the Mecca Max deployment across the estate, the testing of new games in Grosvenor Casinos, the deployment of third-party branded games across all channels and the continued development of ‘After Dark’.
Food and drinkImproving the quality of food and drink in Rank’s land-based businesses remains a key area of opportunity for the Group both in terms of broadening the appeal of our venues and capturing a greater proportion of our customers’ leisure expenditure.
During 2010, we continued to use customer insight to guide improvements to the quality of our bar and restaurant operations, through menu developments, service improvements, more competitive pricing and promotional activity.
In Mecca Bingo, we have now grown spend per visit on food and drink by 17.7% since 2007, largely as a result of the move to table service with meals cooked to order.
As a consequence of the changes we generated £47.6m in Group revenue from sales of food and drink in 2010 – an increase of 11.2%, despite the negative effect of the rise in the standard rate of VAT. This represented 8.4% of total Group revenue.
During 2011, we will continue to make improvements across the business including the extension of table service from 63 to 93 Mecca Bingo clubs.
Systematic use of data and customer feedback1

11The Rank Group Plc: Annual report and financial statements 2010
During 2010, we invested £51.6m of capital across the Group. More than 80% of the capital investment was deployed in our portfolio of Grosvenor Casino and Mecca Bingo venues, enhancing existing units and developing new units.
The capital was focused on improving the customer experience of our brands, through enhancements to service and to the architectural fabric of our venues.
Grosvenor CasinosThe modernisation and expansion of our casinos estate forms a key element of the Group’s growth strategy. In 2006 we launched the G Casino format with the aim of reaching out to a much broader base of customers than would typically visit a traditional casino.
The format has proved successful (achieving significantly higher levels of customer visits, revenue and profit than traditional casinos) and we have set ourselves a target of reaching 20 ‘G Casino’ venues by the end of 2012, via the opening of new casinos and the relocation and conversion of existing casinos.
Provincial casinos – performance comparison
CasinosAverage
visits/weekAverage
spend/visitAverage
EBITDA/week
G Casino* 9 3,637 £30.82 £29.2kTraditional Grosvenor 17 2,307 £31.94 £16.8k
* Excludes three casinos converted to G Casino format in 2010 and London casinos.
We converted three existing Grosvenor Casinos (in Brighton, Newcastle-upon-Tyne and Birmingham) to the G Casino format at a combined capital cost of £3.9m. Since the start of 2011 we have carried out a similar project to convert our Walsall venue and now operate 14 venues under the G Casino format.
Later this year, we will open one new G Casino venue at Stockton-on-Tees and convert at least one existing casino (in Plymouth) to the G Casino model.
During the final quarter of the year, we opened two experimental ‘E-casinos’ in Scarborough and Liverpool. The E-casino model offers a predominantly electronic casino gaming experience and has been developed for markets where consumer demand does not at present warrant investment in a full casino.
We closed one loss-making casino in the year, at Hove in East Sussex.
At 31 December 2010, we operated 35 casino venues in Great Britain (incorporating 36 licences) compared with 34 venues (35 licences) at the end of 2009. During February 2011, we opened a second licensed casino area within our Walsall
venue and we plan to increase the estate to 36 venues (38 licences) by the end of 2011.
Mecca BingoDuring the year, we invested £22.6m of capital in the maintenance and improvement of our bingo clubs in Great Britain. The improvements expenditure broadly falls into two categories – Full House Destination and Full House Local.
Full House Destination is a modern leisure venue that provides community games, amusements and food and drink in a social, female-focused environment. During the year, we converted four Mecca Bingo clubs (Oldbury, Aberdeen, Dagenham and Southend-on-Sea) to the Full House Destination format at a combined capital cost of £5.7m.
Whilst we have seen positive customer responses and an encouraging uplift in customer visits and revenue at these venues, further work is required to refine the model.
We have taken steps to reduce operating costs in these venues and are looking at means to lower capital costs on any future conversions.
Full House Local is our capital investment programme for traditional bingo clubs (many of them small ex-cinema sites). During the year, we invested £1.2m on modest renewal projects at nine of these clubs, combining service enhancements (cook-to-order food) with improvements to the fabric of the venues, inside and out. We are very pleased with the early results of this programme and plan to undertake a number of similar projects in 2011.
Capital investment to extend reach and broaden appeal of our brands2
Andrew Smith, general manager of our Mecca club in Oldbury, West Midlands which was converted to the Full House Destination format in 2010.

12 The Rank Group Plc: Annual report and financial statements 2010
Directors’ report: Chief executive’s review continued
The development of established, trusted brands, distributed to suit customer preference is a key component of our Group and brands strategy.
During 2010, both Mecca Bingo and Grosvenor Casinos generated revenue growth from their land-based venues and their remote gaming sites as the brands benefited from closer operational integration. During the year, 2.9% of the 2.1 million customers of our UK brands played in either a land-based casino or bingo club and via one of our internet or mobile sites. Whilst this level of cross-over is still relatively low, we consider that the ability to cross-sell between channels presents a significant opportunity for our brands.
Revenue by brand (land-based and remote)
£m 2010 2009
Mecca brand 273.7 264.6Grosvenor Casino brands 242.1 221.3Top Rank España* 37.0 36.2Blue Square** 15.0 17.9
* Land-based operations only.** Remote operations only.
Mecca brandRevenue from our Mecca Bingo clubs and Mecca branded websites increased by 3.4% to £273.7m in 2010 with a strong performance from remote gaming supplementing a modest improvement from our clubs. This was driven in part by a step-up in national brand promotions, including television advertising. Critically, our internal affiliate scheme (which rewards Mecca Bingo clubs for promoting meccabingo.com to customers) generated more than 16,000 new online customers in 2010 – a 191% increase compared with the prior year.
Grosvenor Casinos brandsRevenue from Grosvenor Casinos venues and branded websites increased by 9.4% to £242.1m in 2010. The majority of this growth was generated by our land-based venues. The extension of our market-leading position in land-based casino gaming into remote channels remains a major area of unrealised opportunity.
SpainDuring the year, we advanced the development of online gaming for the Spanish market, which is expected to be subject to regulation from 2011 or 2012. We plan to launch during the first half of 2011.
BelgiumThe opening of the Belgian online gaming market has created potential for Rank to expand its operations in that territory. Under current proposals, only land-based casino operators may apply for online casino licences. Rank currently operates two casinos in Belgium. Whilst the online legislation has not yet been fully enacted and the technical regulations have not been finalised, the ability to offer online as well as land-based casino gaming in Belgium may represent a growth opportunity for the Group.
Mobile gamingThe use of smartphones and other mobile communications devices is gradually transforming the way that people seek entertainment – both in Great Britain and around the world.
During 2010, we offered our customers a range of mobile gaming experiences – both on local area networks in Mecca Bingo clubs and on wide area networks under Rank Interactive.
Highlights of the year included:
– the replacement of 1,650 electronic bingo units with Mecca Max mobile gaming terminals;
– the launch of Mecca Bingo and Blue Square ‘apps’ in the Apple Store;
– Blue Square awarded ‘Best Mobile Performance of the Year’ at the e-gaming review awards.
During the final quarter of the year, Rank acquired the assets of Rapid Mobile, a mobile technology development business. The acquisition will guide Rank’s continued development in the area of mobile gaming.
Wider distribution of our brands via online and mobile media3
During 2010, Rank Interactive launched official apps for Mecca Bingo and Blue Square.
13The Rank Group Plc: Annual report and financial statements 2010
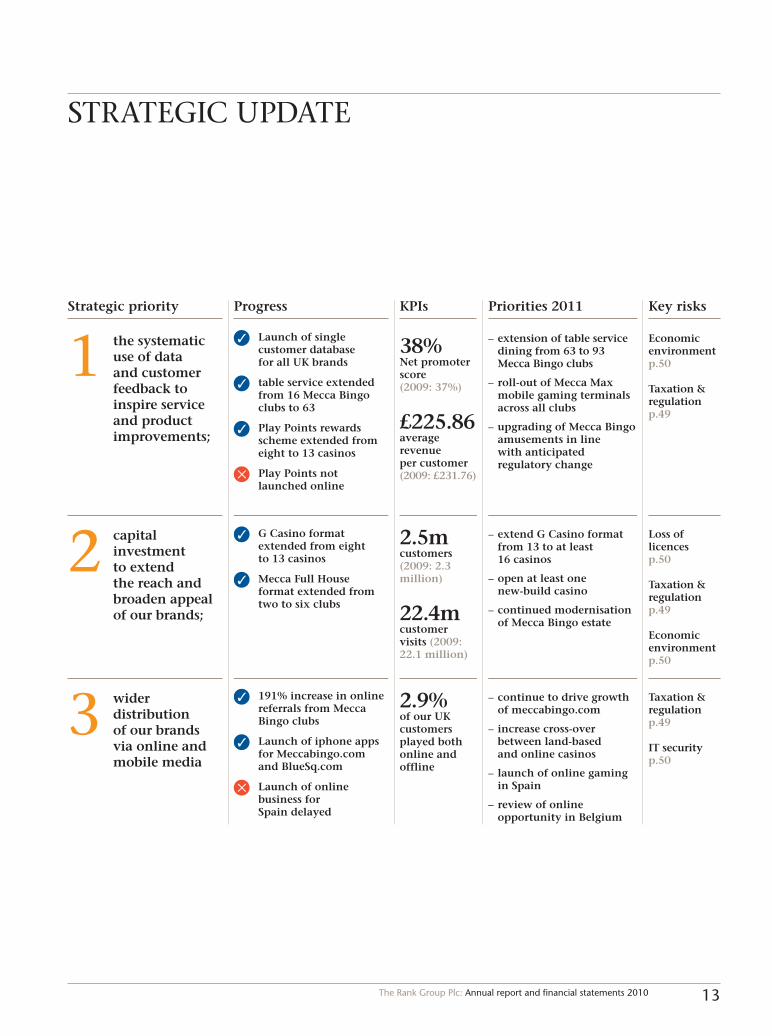
STRATEGIC UPDATE
Strategic priority
the systematic use of data and customer feedback to inspire service and product improvements;
1Progress
Launch of single customer database for all UK brands
table service extended from 16 Mecca Bingo clubs to 63
Play Points rewards scheme extended from eight to 13 casinos
Play Points not launched online
38% Net promoter score (2009: 37%)
£225.86 average revenue per customer (2009: £231.76)
Priorities 2011
– extension of table service dining from 63 to 93 Mecca Bingo clubs
– roll-out of Mecca Max mobile gaming terminals across all clubs
– upgrading of Mecca Bingo amusements in line with anticipated regulatory change
Key risks
Economic environmentp.50
Taxation & regulationp.49
capital investment to extend the reach and broaden appeal of our brands;
2 G Casino format extended from eight to 13 casinos
Mecca Full House format extended from two to six clubs
Loss of licencesp.50
Taxation & regulationp.49
Economic environmentp.50
– extend G Casino format from 13 to at least 16 casinos
– open at least one new-build casino
– continued modernisation of Mecca Bingo estate
wider distribution of our brands via online and mobile media
3 191% increase in online
referrals from Mecca Bingo clubs
Launch of iphone apps for Meccabingo.com and BlueSq.com
Launch of online business for Spain delayed
Taxation & regulationp.49
IT securityp.50
2.9% of our UK customers played both online and offline
– continue to drive growth of meccabingo.com
– increase cross-over between land-based and online casinos
– launch of online gaming in Spain
– review of online opportunity in Belgium
2.5m customers (2009: 2.3 million)
22.4m customer visits (2009: 22.1 million)
KPIs

Jo Williamson Regional administrator Mecca Bingo Midlands
Jo helped coordinate a nationwide search for a star through Mecca’s association with hit TV show ‘Britain’s Got Talent’.
Will Clarke Membership manager Mecca Bingo Bolton
Will has pioneered the use of social media sites to increase customer numbers in Bolton.
Arun Todd Amusement team leader Mecca Bingo Huddersfield
Arun was named Mecca’s ‘amusement team leader of the year’ for 2010.
Claire Osborne Head of bingo & games meccabingo.com
In 2010, Claire oversaw strong growth from Mecca Bingo online.
14 The Rank Group Plc: Annual report and financial statements 2010
Directors’ report: Operating review

Tracy Green Operations manager Mecca Bingo Leeds
Tracy was named Mecca’s ‘operations manager of the year’ for 2010.
Glenys Weaver Team leader Mecca Bingo Swansea
Glenys Weaver led Swansea to become the highest fund-raising club for Marie Curie Cancer Care in 2010.
Pete Peart General manager Mecca Bingo Burnt Oak
Since his arrival at our Burnt Oak club in 2010, Pete has achieved a 50% point upwards swing in customer satisfaction. Pete is a graduate of the Mecca Management Academy (see page 31).
Julia Cook Brand manager Mecca Bingo
In 2010, Julia helped re-launch four clubs as Mecca Full House Destination.
Entertaining people
15The Rank Group Plc: Annual report and financial statements 2010
16 The Rank Group Plc: Annual report and financial statements 2010
Directors’ report: Operating review continued
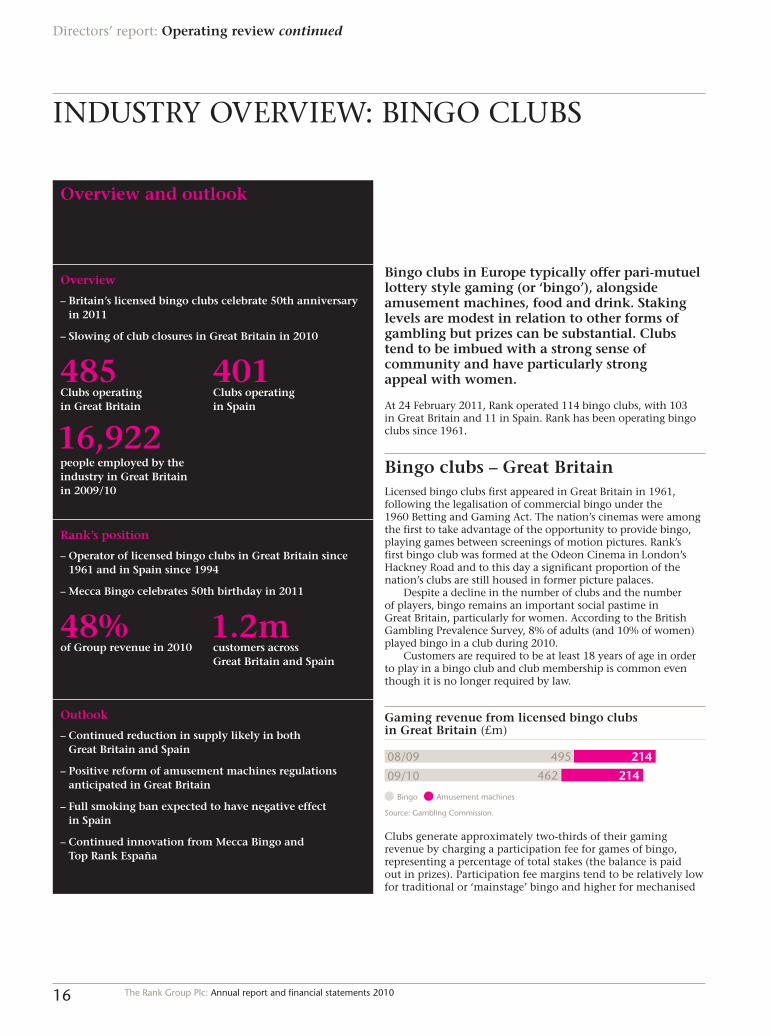
INDUSTRY OVERVIEW: BINGO CLUBS
Overview and outlook
Overview
– Britain’s licensed bingo clubs celebrate 50th anniversary in 2011
– Slowing of club closures in Great Britain in 2010
485Clubs operating in Great Britain
401Clubs operating in Spain
16,922people employed by the industry in Great Britain in 2009/10
Rank’s position
– Operator of licensed bingo clubs in Great Britain since 1961 and in Spain since 1994
– Mecca Bingo celebrates 50th birthday in 2011
48%of Group revenue in 2010
1.2mcustomers across Great Britain and Spain
Outlook
– Continued reduction in supply likely in both Great Britain and Spain
– Positive reform of amusement machines regulations anticipated in Great Britain
– Full smoking ban expected to have negative effect in Spain
– Continued innovation from Mecca Bingo and Top Rank España
Bingo clubs in Europe typically offer pari-mutuel lottery style gaming (or ‘bingo’), alongside amusement machines, food and drink. Staking levels are modest in relation to other forms of gambling but prizes can be substantial. Clubs tend to be imbued with a strong sense of community and have particularly strong appeal with women.
At 24 February 2011, Rank operated 114 bingo clubs, with 103 in Great Britain and 11 in Spain. Rank has been operating bingo clubs since 1961.
Bingo clubs – Great BritainLicensed bingo clubs first appeared in Great Britain in 1961, following the legalisation of commercial bingo under the 1960 Betting and Gaming Act. The nation’s cinemas were among the first to take advantage of the opportunity to provide bingo, playing games between screenings of motion pictures. Rank’s first bingo club was formed at the Odeon Cinema in London’s Hackney Road and to this day a significant proportion of the nation’s clubs are still housed in former picture palaces.
Despite a decline in the number of clubs and the number of players, bingo remains an important social pastime in Great Britain, particularly for women. According to the British Gambling Prevalence Survey, 8% of adults (and 10% of women) played bingo in a club during 2010.
Customers are required to be at least 18 years of age in order to play in a bingo club and club membership is common even though it is no longer required by law.
Source: Gambling Commission.
08/09 214495
462 21409/10
Gaming revenue from licensed bingo clubs in Great Britain (£m)
Bingo Amusement machines
Clubs generate approximately two-thirds of their gaming revenue by charging a participation fee for games of bingo, representing a percentage of total stakes (the balance is paid out in prizes). Participation fee margins tend to be relatively low for traditional or ‘mainstage’ bingo and higher for mechanised

17The Rank Group Plc: Annual report and financial statements 2010
bingo or ‘interval games’. According to the latest data from the Gambling Commission, the average participation fee margin in 2009/10 was 34%.
The remaining one-third of gaming revenue is generated from amusement machines. Clubs are permitted an unlimited number of low stake/low prize machines and a smaller number of £500 jackpot machines (see page 120 for details on amusement machine categories).
In addition to gaming activities, Mecca Bingo generates around 10% of its revenue from the sale of food and drink, although it is likely that this is above average for the sector.
Source: Gambling Commission/Bingo Association.
10 496
48511
Number of bingo clubs operating in Great Britain(to February 2011)
SupplyBased upon information from the Gambling Commission and the Bingo Association, there were approximately 485* licensed bingo clubs in Great Britain at 24 February 2011.
The two largest operators within the sector are Gala Bingo and Mecca Bingo with 247 clubs between them. Gala Bingo’s estate of clubs has been in decline in recent years, falling from 164 to 144 clubs between February 2008 and February 2011. By contrast, Mecca Bingo has proved relatively stable, closing just one club and adding one new club over the same period.
During the 12 months to February 2011, there were 11 closures of bingo clubs in Great Britain and no new openings.
Bingo club operators in Great Britain*
OperatorFebruary
2011 February
2010
Gala Bingo 144 146Mecca Bingo 103 103Top Ten Bingo 22 24Carlton Clubs 14 14Buckingham Bingo 8 10Others 194 199Total 485 496
Source: Gambling Commission/Bingo Association.
* During 2010, the Gambling Commission revised its classifications to differentiate between full-time commercial bingo clubs and bingo played in holiday parks and working men’s clubs. The figure also excludes venues where more than one licensed bingo club is in operation as well as amusement arcades that have obtained bingo club licences in order to offer a greater number of B3 jackpot machines.
Bingo clubs – SpainLicensed bingo clubs first appeared in Spain following the legalisation of gaming in 1977. Today, bingo is the fourth biggest form of gaming in Spain after amusement machines, lotteries and scratchcards.
The most recently available data on the Spanish market is drawn from the 2009/10 report from the country’s gambling regulator, the Comisión Nacional del Juego.
The report shows bingo revenues declined by 15% to €1.1bn in 2009. The number of bingo clubs operating fell by 18 to 401.
Responsibility for the taxation and regulation of gaming and betting in Spain is devolved to the country’s 17 autonomous communities, under guidance from the national Ministry of Finance and Ministry of the Interior.
06/07 1406
1365
1268
1083
07/08
08/09
09/10
Revenue from licensed bingo clubs in Spain(€m)
Source: Comisión Nacional del Juego.
06/07 443
425
419
401
07/08
08/09
09/10
Number of licensed bingo clubs in Spain
Source: Comisión Nacional del Juego.

18 The Rank Group Plc: Annual report and financial statements 2010
Directors’ report: Operating review continued
MECCA BINGO
H1 08 116.9
110.7
116.3
116.7
118.7
115.8
H2 08
H1 09
H2 09
H1 10
H2 10
Revenue* (£m) £234.5m
H1 08 22.7
15.2
19.0
13.3
16.0
13.7
H2 08
H1 09
H2 09
H1 10
H2 10
Operating profit** (£m) £29.7m
* All references to revenue in this section are before adjustments for free bets, promotions and customer bonuses.
** All references to operating profit and EBITDA in this section are before exceptional items.
Mecca Bingo produced a stable underlying performance during 2010. The business achieved modest revenue growth in the year but operating profit slipped, largely due to the effect of the increase in the standard rate of VAT.
Revenue of £234.5m was up 0.6% on the prior year as the business benefited from a full year’s trading at its Beeston ‘Full House’ club. On a like-for-like basis, revenue declined by 0.8%. Operating profit declined by 8.0% to £29.7m.
Financial performance
2010 2009
Revenue (£m) 234.5 233.0Like-for-like revenue (0.8)%EBITDA (£m) 43.0 42.4Operating profit (£m) 29.7 32.3Operating margin 12.7% 13.9%
The performance of Mecca Bingo was strongest during the first half of the year with the extreme weather conditions in December undermining the business’s second half.
Key performance indicators
2010 2009
Customers (000s) 911 881Customer visits (000s) 14,688 14,933Spend per visit (£) 15.96 15.60Net promoter score 47% 39%
In line with our strategy, the stable revenue generation of our bingo clubs was based upon our success in re-engaging with lapsed customers and reaching out to new customers through service and amenity improvements.
Over the course of the year, our bingo clubs served approximately 911,000 customers – an increase of 3.4% compared with 2009. Customer visits declined by 1.6% to 14.7 million. Spend per visit increased by 2.3% to £15.96, with growth in spending on food and drink and amusements. On a like-for-like basis, customer visits declined by 2.5% and spend per visit increased by 2.2%.
Net promoter score, which measures customer propensity to recommend our bingo clubs, increased by eight percentage points to 47%, beating our target of 45%.
Revenue analysis
(£m) 2010 2009
Main stage bingo 40.5 40.0Interval games 103.8 105.0Amusement machines 65.8 65.6Food & drink/other 24.4 22.4Total 234.5 233.0
H1 08 102
102
103
103
103
103 XX
FY 08
H1 09
FY 09
H1 10
FY 10
Clubs operating 103
H1 08 984
898
912
881
943
911 XX
FY 08
H1 09
FY 09
H1 10
FY 10
Customers (000s) 911,000
Moving annual total.

19The Rank Group Plc: Annual report and financial statements 2010
Main stage bingo – Revenue from main stage bingo increased by 1.3% although this performance was distorted by changes to taxation introduced in the 2009 Budget. Excluding the tax changes, main stage bingo revenue declined by 3.8% on lower customer visits.
Interval games – Revenue from interval games declined by 1.1% as our clubs received fewer customer visits. This performance represented a slight increase in spend per visit, which resulted from gameplay enhancements and participation fee margin improvement.
Amusement machines – Revenue from amusement machines increased by 0.3% despite the lower level of customer visits and tax changes. Excluding the effect of the VAT rise, revenue increased by 2.5% reflecting continued improvements to the quality of our amusements product and service.
Food & drink/other – Revenue from food and drink increased by 8.9%, reflecting double-digit growth in spend per visit as customers responded positively to changes made to the quality of our in-club meals.
TOP RANK ESPAÑA
H1 08 17.7
18.1
18.1
18.1
18.4
18.6
H2 08
H1 09
H2 09
H1 10
H2 10
Revenue (£m) £37.0m
H1 08 4.1
2.8
2.7
2.9
3.0
3.8
H2 08
H1 09
H2 09
H1 10
H2 10
Operating profit (£m) £6.8m
Financial performance
2010 2009
Revenue (£m) 37.0 36.2Like-for-like revenue 2.2%EBITDA (£m) 9.5 8.4Operating profit (£m) 6.8 5.6Operating margin 18.4% 15.5%
Top Rank España recovered strongly in 2010, despite the difficult economic conditions in Spain.
Revenue of £37.0m was up 2.2% on the prior year despite the weakening of the euro. In local currency, revenue increased by 6.2%. Operating profit increased by 21.4% to £6.8m as a result of operational improvements and a programme of cost savings introduced during the first half. The business incurred a £1.4m one-off charge relating to redundancies which for reasons of
segment materiality has been treated as exceptional (and so excluded from the result disclosed here).
Key performance indicators
2010 2009
Customers (000s) 331 314Customer visits (000s) 2,339 2,310Spend per visit (£) 15.82 15.67Net promoter score 38% n/a
In line with our strategy, Top Rank España’s growth in revenue was driven by an increase in customer numbers and customer visits.
Over the course of the year, our Spanish bingo clubs served approximately 331,000 customers – an increase of 5.4% compared with 2009 – and customer visits rose by 1.3% to more than 2.3 million. A small decrease in the frequency of customer visits was more than offset by an increase in the number of customers and an increase in the spend per visit of 1.0% to £15.82.
In its first year of measurement, the business achieved a net promoter score of 38% – just short of its 40% target but on an improving trend.
Revenue analysis
(£m) 2010 2009
Bingo 23.2 24.0Amusement machines 10.2 8.4Food & drink/other 3.6 3.8Total 37.0 36.2
Bingo – Revenue from games of bingo declined by 3.3% to £23.2m. In euros, revenue increased by 0.2% reflecting growth in customer visits and a reduction in average expenditure.
Amusement machines – Revenue from amusement machines increased by 21.4% to £10.2m. In euros, revenue increased by 26.1%, reflecting the positive effect of regulatory reform in our Madrid clubs and enhanced machines management.
Food & drink/other – Revenue from sales of food and drink declined by 5.3% to £3.6m. In euros revenue decreased by 0.7%.

John Dumbleton, MBE Head of legal The Rank Group Plc
John who has worked for Rank since 1977, was awarded an MBE in 2011 for services to charity.
Tracey Collins General manager Grosvenor Casino Southampton
Tracey was named ‘leader of the year’ at the Women in Gaming Awards 2010.
Glenn Young Casino games dealer Grosvenor Casino Dundee
Glenn was named Grosvenor’s ‘best newcomer’ in 2010.
Laura Craddock Head of casinos grosvenorcasinos.com
Laura re-launched our online casino in 2010.
20 The Rank Group Plc: Annual report and financial statements 2010
Directors’ report: Operating review continued

Leigh Stark Head chef Park Tower Casino London
The Park Tower was short-listed for the best casino restaurant in the world award at the International Gaming Awards 2011. Leigh was named Grosvenor’s ‘chef of the year’ in 2009 and 2010.
Brian Duffin Health & safety manager The Rank Group Plc
Brian helped Rank to become the first leisure company in Great Britain to win the British Safety Council’s ‘Sword of Honour’ award.
Delaney Gordon General manager Grosvenor Casino Piccadilly London
Delaney and Martin led an outstanding year for our London casinos. Martin worked with Brian Duffin to help win the British Safety Council’s ‘Sword of Honour’ award.
Martin Ramskill General manager Victoria Casino London
Entertaining people
21The Rank Group Plc: Annual report and financial statements 2010

22 The Rank Group Plc: Annual report and financial statements 2010
Directors’ report: Operating review continued
INDUSTRY OVERVIEW: CASINOS
Overview and outlook
Overview
150Casino licences operating in Great Britain
9licensed casinos in Belgium
17.1mcustomer visits to casinos in Great Britain in 2009/10
4% Estimated 4% of British adult population played table games in a casino in 2010
Rank’s position
35Casinos (incorporating 37 licences) operating in Great Britain
2Casinos operating in Belgium
42%of Group revenue in 2010
1.1mcustomers across Great Britain and Belgium
Outlook
– Limited growth in supply expected
– First 2005 Act casino licences awarded in Great Britain
– Further modernisation of casino regulations necessary
European casinos typically offer a range of table games (such as roulette and blackjack), community games (poker and mah jong) and gaming machines as well as licensed bars and restaurants. Regulatory oversight of casinos tends to be strict and the scale of venues is linked to the level of taxation applied, the restrictions imposed on electronic gaming and the availability of other forms of gambling in the local marketplace.
At 24 February 2011, Rank operated 37 casinos venues with 35 in Great Britain (incorporating 37 licences) and two in Belgium. The Group held a further ten licences in Great Britain that were not being utilised at that time.
Casinos – Great BritainLicensed casinos first appeared in Great Britain in 1970, following enactment of the 1968 Gaming Act (the ‘1968 Act’). Prior to this, many hundreds of informal private members clubs had offered casino-style games, some of them dating back to the early nineteenth century.
Customers must be at least 18 years of age to enter a casino. Most venues retain proof of identity as an entry requirement and offer high levels of supervision. As a consequence, the level of problem gambling in casinos is disproportionately low and the incidence of underage gambling is almost non-existent.
Despite some progress during the last decade, the operation of licensed casinos in Great Britain remains subject to a number of restrictive regulations which have served to inhibit the sector’s growth.
– There is a cap on the number of casino licences available, although at present only 150 of the 187 casino licences granted under the 1968 Act are in use;
– A casino may only be operated within the area governed by the local authority that originally granted the licence;
– Only 53 council areas in Great Britain were permitted to grant casino licences under the 1968 Act;
– A maximum of 20 gaming machines are permitted per casino, regardless of size or level of demand. There is no limit on the number of tables in operation;
– Casino games are (uniquely for any commercial sector in Great Britain) subject to a taxation regime based upon a sliding scale of duty from 15% to 50% of revenue (see tax fact file, pages 38 to 41).

23The Rank Group Plc: Annual report and financial statements 2010
Nevertheless, the sector is experiencing demand growth as a result of selective investment in larger and more attractive venues, the popularisation of casino games on the internet and the rescinding of anachronistic legislation.
The popularity of British casinos has grown in recent years, albeit from a low base. Between 2007 and 2010, the number of customer visits to casinos increased by 13.2% to 17.1 million a year. According to the British Gambling Prevalence Survey 2010, 4% of adults in Britain played table games in a casino during 2010 (6% of men and 2% of women).
During the year to 31 March 2010, casinos generated approximately £778m of gaming revenue with 82% generated by table games and the remaining 18% generated by machines.
08/09 121679
641 13709/10
Gaming revenue from casinos in Great Britain (£m)
Casino table games Gaming machines
Source: Gambling Commission.
SupplyDuring the 12 months to February 2011, the number of casino licences operating in Great Britain increased from 141 to 150. However, the increase was due in part to the development of small electronic casinos. These venues offer a limited range of electronic roulette and gaming machines rather than the full range of table games, card rooms, bars and restaurants provided by full-scale casinos. These electronic venues have grown up as a consequence of changes to casino duty introduced in 2007, which rendered many small traditional casinos uneconomic.
Three full casinos opened in the period, with independent operators commencing trading in Glasgow, Birmingham and Huddersfield (the last two were re-openings of venues closed in 2009). In addition, an independent poker club opened in central London under a casino licence.
Seven new electronic casinos opened during the period – three on a stand-alone basis and four co-located with existing casinos. Rank opened two stand-alone ‘e-casinos’ and co-located a second licence within its Walsall casino; Genting Stanley opened two (one stand-alone, one co-located); whilst small electronic casinos were co-located with the Casino at the Empire in London (London Clubs) and the Gala Casino in Bristol.
There were two closures during the period with the Grosvenor Casino in Hove and an independent operator in Aberdeen both closing their doors. London Clubs International sold a non-operating licence in Blackpool to an independent operator.
Casino operators – Great Britain (licences)
February 2011 February 2010
OperatingNon-
operating OperatingNon-
operating
Genting Stanley 46 9 44 11Grosvenor Casinos 37 10 35 12Gala Casinos 28 3 27 4London Clubs 10 0 9 2A&S Leisure 6 0 6 0Aspers/Aspinall’s 4 1 4 1Club 36 3 0 3 0Clockfair 2 0 2 0Guoco 1 5 1 5Others 13 9 10 11Total 150 37 141 46
Source: Gambling Commission/company research.
Table shows casino licences rather than venues. A growing number of venues incorporate more than one casino licence.
Ian Turver, Grosvenor Casinos ‘manager of the year’ at our Sheffield venue.
24 The Rank Group Plc: Annual report and financial statements 2010
Directors’ report: Operating review continued
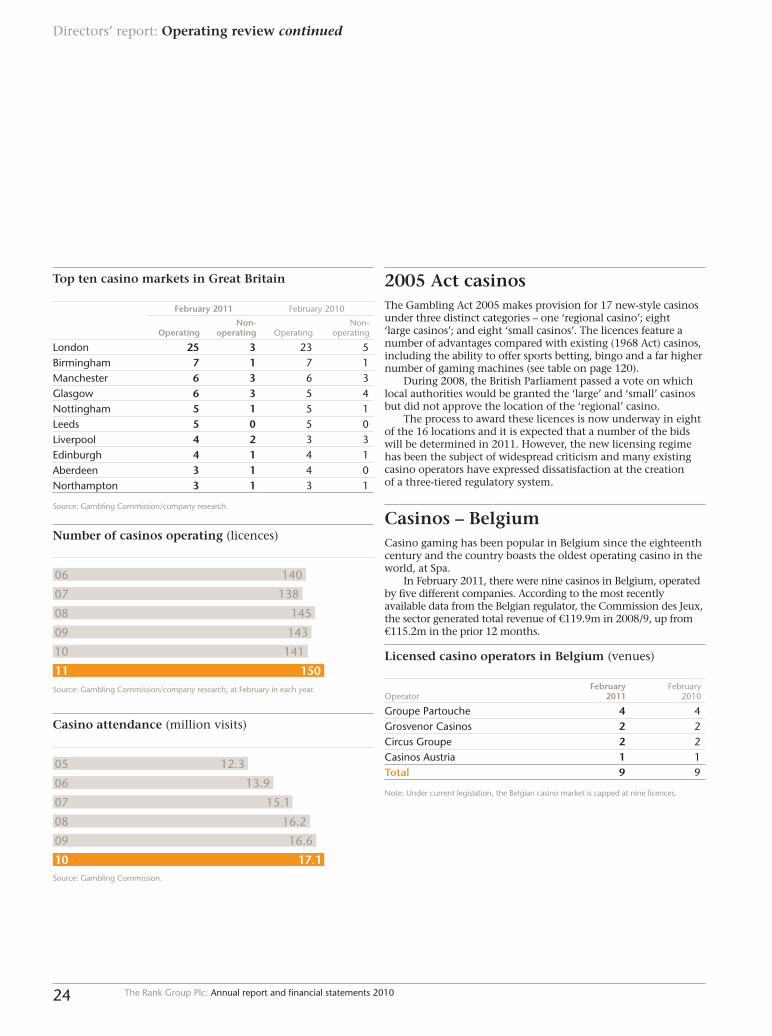
Top ten casino markets in Great Britain
February 2011 February 2010
OperatingNon-
operating OperatingNon-
operating
London 25 3 23 5Birmingham 7 1 7 1Manchester 6 3 6 3Glasgow 6 3 5 4Nottingham 5 1 5 1Leeds 5 0 5 0Liverpool 4 2 3 3Edinburgh 4 1 4 1Aberdeen 3 1 4 0Northampton 3 1 3 1
Source: Gambling Commission/company research.
06 140
138
145
143
141
150
07
08
09
10
11
Number of casinos operating (licences)
Source: Gambling Commission/company research; at February in each year.
05 12.3
13.9
15.1
16.2
16.6
17.1
06
07
08
09
10
Casino attendance (million visits)
Source: Gambling Commission.
2005 Act casinosThe Gambling Act 2005 makes provision for 17 new-style casinos under three distinct categories – one ‘regional casino’; eight ‘large casinos’; and eight ‘small casinos’. The licences feature a number of advantages compared with existing (1968 Act) casinos, including the ability to offer sports betting, bingo and a far higher number of gaming machines (see table on page 120).
During 2008, the British Parliament passed a vote on which local authorities would be granted the ‘large’ and ‘small’ casinos but did not approve the location of the ‘regional’ casino.
The process to award these licences is now underway in eight of the 16 locations and it is expected that a number of the bids will be determined in 2011. However, the new licensing regime has been the subject of widespread criticism and many existing casino operators have expressed dissatisfaction at the creation of a three-tiered regulatory system.
Casinos – BelgiumCasino gaming has been popular in Belgium since the eighteenth century and the country boasts the oldest operating casino in the world, at Spa.
In February 2011, there were nine casinos in Belgium, operated by five different companies. According to the most recently available data from the Belgian regulator, the Commission des Jeux, the sector generated total revenue of €119.9m in 2008/9, up from €115.2m in the prior 12 months.
Licensed casino operators in Belgium (venues)
OperatorFebruary
2011 February
2010
Groupe Partouche 4 4Grosvenor Casinos 2 2Circus Groupe 2 2Casinos Austria 1 1Total 9 9
Note: Under current legislation, the Belgian casino market is capped at nine licences.

25The Rank Group Plc: Annual report and financial statements 2010
GROSVENOR CASINOS
H1 08 12.5
13.4
14.7
16.2
17.6
18.4
H2 08
H1 09
H2 09
H1 10
H2 10
Operating profit** (£m) £36.0m
* All references to revenue in this section are before adjustments for free bets, promotions and customer bonuses.
** All references to operating profit and EBITDA in this section are before exceptional items.
Grosvenor Casinos produced a strong performance during 2010, finishing the year as the Group’s largest business in terms of revenue and operating profit. Revenue of £238.6m was up 8.5% on the prior year, driven by estate expansion and a 5.0% like-for-like improvement. Operating profit increased by 16.5% to £36.0m as a result of sustained growth across the year.
Financial performance
2010 2009
Revenue (£m) 238.6 220.0Like-for-like revenue 5.0%EBITDA (£m) 46.0 39.2Operating profit (£m) 36.0 30.9Operating margin 15.1% 14.0%
In line with our strategy, the strong financial performance of our casinos was based upon our success in broadening the appeal of our venues through service and amenity improvements – particularly those operating under the G Casino format.
Key performance indicators
2010 2009
Customers (000s)* 1,131 985Customer visits (000s) 5,414 4,825Spend per visit (£) 44.08 45.60Net promoter score 36% 37%
* Restated to include customers of two Grosvenor Casino venues in Belgium.
Over the course of the year, our casinos served more than 1 million customers – an increase of 14.8% compared with 2009 – while customer visits rose by 12.2% to 5.4 million. Spend per visit declined by 3.3% to £44.08, reflecting the growth in leisure customers in recently opened casinos. On a like-for-like basis, customer visits increased by 5.3% and spend per visit declined by 0.3%.
Our casinos achieved a net promoter score (which measures customer propensity to recommend our casinos) of 36%. Whilst this was below its 45% target, the business exited the year on an improving trend.
Revenue and margin improvements in our London casinos were the chief factors behind the strong growth in operating profit.
* Incorporating 37 licences.** Incorporating 38 licences.
H1 08 34
34
35
36*
36*
37**
FY 08
H1 09
FY 09
H1 10
FY 10
Clubs operating (venues) 37
H1 08 102.2
104.0
106.7
113.3
116.6
122.0
H2 08
H1 09
H2 09
H1 10
H2 10
Revenue* (£m) £238.6m

Directors’ report: Operating review continued
London – Our London casinos generated a 9.0% increase in revenue compared with 2009, with customer visits up 5.7% and spend per visit up 3.1%. This strong revenue performance, combined with the effect of cost reduction measures in 2009 led to a 33.3% increase in operating profit.
Provinces – Revenue from our casinos outside London increased by 10.2% as a result of 14.7% growth in customer visits and a 3.9% decline in spend per visit. On a like-for-like basis revenue increased by 3.3% with customer visits up 5.4% and spend per visit down 2.0%. Operating profit increased by 4.8% with costs relating to recently opened venues affecting operating margin performance.
Belgium – Revenue from our two Belgian casinos decreased by 5.8%, due to the relative weakness of the euro and a decline in average spending. In local currency, revenue decreased by 1.7% with customer visits up 3.6% and spend per visit down by 5.1%.
Revenue analysis – Great Britain
(£m) 2010 2009
Casino games 158.3 145.4Gaming machines 35.9 34.3Card room games 10.9 8.8Food & drink/other 17.3 14.3Total 222.4 202.8
Casino games – The 8.9% growth in casino games reflected the strong increase in customer visits. Our electronic roulette terminals performed particularly well as customers responded positively to equipment upgrades in 13 casinos.
Gaming machines – Revenue from gaming machines increased by 4.7%. Excluding the effect of the rise in the standard rate of VAT, revenue increased by 6.9%.
Card room games – Our casino card rooms (which offer games such as player-to-player poker and mah jong) increased revenue by 23.9%. Excluding the effect of tax changes introduced in 2009, revenue increased by 19.1%.
Food & drink/other – Revenue from food and drink increased by 21.0% as a result of growth in both customer visits and spend per visit as customers responded positively to improvements in our bar and restaurant operations – particularly in the G Casino format venues.
Segmental performance
Customer visits (000s)
Spend per visit (£)
Revenue (£m)
Operating profit (£m)
2010 2009 2010 2009 2010 2009 2010 2009
London 1,014 959 93.43 90.62 94.7 86.9 17.6 13.2Provinces 4,083 3,560 31.28 32.56 127.7 115.9 17.6 16.8Belgium 317 306 51.09 56.21 16.2 17.2 0.8 0.9Total 5,414 4,825 44.08 45.60 238.6 220.0 36.0 30.9
26 The Rank Group Plc: Annual report and financial statements 2010

27The Rank Group Plc: Annual report and financial statements 2010
REMOTE GAMING AND BETTING
Remote gamblingDespite the fact that internet-based gaming and betting have been in existence since the 1990s, only a small number of countries have established formal regulatory frameworks for its operation. During 2010, there were further signs in Europe and beyond that governments are starting to see legalisation as preferable to prohibition, both in terms of revenue generation and consumer protection.
Great BritainInternet-based betting and gaming have long been legal activities within Great Britain, although there are signs that the Government is now moving towards a less open system of regulation (and potentially a more efficient method of tax collection).
At present, companies based in Great Britain may legally promote online and mobile gambling to adult citizens under the regulatory supervision of the Gambling Commission. Companies licensed elsewhere in the European Union as well as certain ‘white-listed’ territories are subject to the same commercial freedoms but are not required to be licensed by the Gambling Commission; nor are they obliged to pay duty on UK revenue.
During 2010, the Department for Culture, Media and Sport initiated a review of the regulatory aspects of this system. The department is expected to announce the conclusions of this review during the first half of 2011.
According to the British Gambling Prevalence Survey 2010, 14% of adults gambled online. The most popular form of internet gambling is the National Lottery. Excluding this, participation is much lower at 7% of the adult population (compared with 6% in 2007).
Growth of online gambling in Great Britain(indexed)
100102104106108110112
1009080706Source: Gambling Commission, January 2011 (based upon percentage of adults playing online in a four-week period). Excludes National Lottery.
Overview and outlook
Overview
– European governments increasingly turning to regulation and taxation of activity in 2010
14%of adult population in Great Britain gambled online in 2010
Rank’s position
– Remote distribution of Mecca Bingo, Grosvenor Casinos and Blue Square brands
– Launch in Spain in 2011
10%of Group revenue in 2010
Outlook
– Regulation of activity expected in Belgium, Denmark, Greece and Spain in 2011
– Increased regulation of remote gaming and betting expected in Great Britain

Directors’ report: Operating review continued
Casino games 12%
10%
10%
7%
6%
National Lottery
Sports betting
Football pools
Bingo
Online-offline cross-over rates in Great Britain
Source: British Gambling Prevalence Survey 2010.
SpainAfter a number of years of delay, Spain now appears destined to pass legislation for internet gambling during 2011. It is anticipated that the government will license online and mobile sports betting, casino gaming, poker and possibly bingo. The proposed tax rate of 25% of gross profits is substantially lower than taxes typically applied to land-based gambling.
During 2009, the Spanish national lottery (LAE) generated €29.6m of revenue via the internet. However, the Spanish Association of Internet Gamblers estimates that the unlicensed market is worth significantly more, generating €315m in 2010.
BelgiumOn 2 January 2011, Belgium effectively legalised remote gambling. Whilst the full opening of the market is still subject to the passing of enabling legislation and a review by the European Union, it is expected that the first online and mobile sports betting licences will be granted during the first half of 2011 with online casino and games licences following later in the year. The proposed tax rates of 11% to 15% of gross profits are substantially lower than taxes currently applied to land-based gambling.
It is the intention of the Belgian government to restrict remote licences to holders of land-based licences. As such, only licensed casino companies would be permitted to operate online casinos and only licensed betting shop companies would be permitted to operate online sports betting.
According to estimates from the Commission des Jeux, the Belgian online gambling market may be worth as much as €229m in revenue.
As the holder of two of the country’s nine casino licences, Rank is following the regulatory process closely.
Other marketsItaly, France, Croatia and Ireland have all now established regimes for the regulation and taxation of remote gambling whilst the Netherlands, Denmark and Greece have set out plans to follow suit. In most other European states, lotteries remain the only permitted form of internet gambling.
In the USA there are signs that internet gambling may be legalised on a state-by-state basis. Legislatures in New Jersey, Florida and California have passed or are considering bills to license and tax intra-state online gaming. However, these processes remain open to Federal intervention and the regulation of remote gambling on a national basis is considered to be unlikely in the near term.
28 The Rank Group Plc: Annual report and financial statements 2010

29The Rank Group Plc: Annual report and financial statements 2010
RANK INTERACTIVE
Financial performance
2010 2009
Revenue (£m) 57.7 50.8Like-for-like revenue 13.6%EBITDA (£m) 11.4 11.4Operating profit (£m) 7.9 7.5Operating margin 13.7% 14.8%
Rank Interactive achieved a positive performance during 2010, producing strong growth in revenue, stepping up investment and improving operating profit.
Revenue of £57.7m was up 13.6% on the prior year as a result of increased investment in our brands and significant growth in customer referrals from our land-based bingo clubs and casinos. Operating profit of £7.9m was 5.3% higher than in 2009.
Rank Interactive enjoyed a strong second half on the back of successful first-half investment in marketing. Revenue accelerated strongly and operating margin expanded despite investment in international and the mobile channel.
Key performance indicators
2010 2009
Customers (000s) 261 212*Net promoter score 12% 32%
* Re-stated to adjust for customer cross-over between brands and channels.
During the course of the year, our brands served more than 261,000 customers via online and mobile channels – an increase of 23.1%. Net promoter score declined significantly, principally as a result of customer dissatisfaction with our online casino and sports betting sites.
Revenue analysis
(£m) 2010 2009
Bingo & games 42.0 34.3Casino 5.7 5.1Poker 1.8 2.9Sports betting 8.2 8.5Total 57.7 50.8
Bingo & games – Revenue from our bingo and games sites increased by 22.4% compared with 2009. This performance was largely due to sustained growth from meccabingo.com which benefited from strong brand awareness, the success of cross-selling to Mecca Bingo club customers and heightened investment in advertising and promotion.
Casino – Revenue from our casino websites increased by 11.8%. We perceive online casinos as a key area for online and mobile gaming growth.
Poker – Revenue from poker declined by 37.9% in highly competitive market conditions.
Sports betting – Revenue from Blue Square’s sportsbook decreased by 3.5% with a reduction in stakes being partially offset by growth in win margin.
H1 08 27.0
25.6
24.9
25.9
27.4
30.3
H2 08
H1 09
H2 09
H1 10
H2 10
Revenue* (£m) £57.7m
H1 08 3.5
4.1
3.0
4.5
2.3
5.6
H2 08
H1 09
H2 09
H1 10
H2 10
Operating profit (£m) £7.9m
* All references to revenue in this section are before adjustments for free bets, promotions and customer bonuses.

30 The Rank Group Plc: Annual report and financial statements 2010
Directors’ report: Operating responsibly
OPERATING RESPONSIBLY
This section of our report sets out our priorities in each of these areas, the progress we have made against them and the measurement of performance.
Our people
“ Our most important strength is the ability of our people to bring enjoyment to others. At Rank, we have been doing this for nearly three-quarters of a century.”
Our pledgeWe will provide fair, equal, safe, respectful and rewarding employment for people who share our commitment to making our customers feel valued.
Why this is important1. Our brands are only as strong as the team members who represent them. Our ability to entertain and delight our customers depends upon the quality of our people and their motivation to achieve.
2. Our recruitment and remuneration of employees and our investment in their development are the largest areas of expenditure within the Group, representing 39.1% of our total cost base in 2010. By raising engagement levels across our teams we aim to get best value through reduction in employee turnover and increased productivity.
Our priorities and progressOur engagement with employees is based upon our insight into what is important to them:
– To be valued as individuals;
– To be engaged within the business;
– To be recognised and rewarded for their talents;
– To feel safe at work.
Our people are individuals – we believe that encouraging workforce diversity is not simply fair but that it also has major benefits for the Group, particularly in helping our brands to understand the needs of a diverse base of customers.
We apply equal opportunities policies to recruitment, promotion and the provision of supportive working environments, regardless of gender, family status, creed, colour, ethnic origin, age, disability or sexual orientation.
During 2010, our diversity steering group contributed to the success of our brands by conducting focus groups with existing employees in order to develop a series of toolkits to increase awareness and support action to foster an increasingly more inclusive workplace.
Our people with disabilities are afforded equal rights across the Group specifically through the equal opportunities and employment of disabled person’s policies. Guidance and support are given to ensure that we create and promote an inclusive environment for current and future employees with disabilities. Our recruitment, development and assessment processes enable job candidates with disabilities to advise us of their requirements in advance so that we are able to ensure that, where possible, we are able to make reasonable adjustments for their individual needs which allows them to perform to the best of their ability.Should an employee become disabled during their employment with us, we actively engage with the individual to make any reasonable adjustments required in order to continue their employment with us.
Our people are engaged – the ability of our people to contribute to the evolution of our products and services, their affinity with our brands and their involvement in strategic discussions can be a source of competitive advantage.
We have developed our employee engagement programmes in order to engage with our people in all parts of the business to improve performance. These range from major culture change programmes such as ‘Hearts and Minds’ for managers at Grosvenor Casinos to the Mecca Bingo ‘WOW’ recognition scheme for all team members.
Our people are aware, consulted and informed about the Group’s performance via our regular briefings, communication meetings and podcasts providing access to the Group’s results.
Each part of the Group has an established mechanism via employee councils and business forums which allows employee representatives to engage with senior management on matters which may directly impact them and their roles within the Group.
At Rank we aim to operate in a fashion that is considerate towards our people, our customers, our communities and the natural environment. Our performance in these areas is critical to customer trust in our brands and broader society’s faith in our integrity and legitimacy.

Our people are talented – our employees see their own development as a critical aspect of what makes work fun and engaging. Our ability to help people achieve their potential through training, development and access to new opportunities is a major source of competitive advantage.
We are in the process of building an integrated talent management programme, which goes beyond the standard technical skills training required by our operations. The following are key features of this programme:
The Mecca Management Academy – offers a 16-month development programme for trainee managers in Mecca Bingo, focusing on leadership and tailored to meet the brand’s strategic goals. Upon successful completion of the course, candidates are awarded the Institute of Leadership and Management’s certificate in management. In 2010 there were 16 participants on the programme.
The Rank Leadership Programme – which has been created and delivered in conjunction with Cranfield University’s highly respected school of management provides development for some of our brightest prospects. During 2010 (its first year), 17 of our people completed the course; and a number of these have been able to move into new areas of operation or have achieved promotions as a consequence.
Leaders in Leisure Programme – we have reached agreement with Birmingham City Business School to launch our Leaders in Leisure programme which develops operational and functional leaders for the future. Upon successful completion of the course, participants will achieve a Post-Graduate Diploma in Leisure Leadership and Strategy and thereafter have the opportunity to pursue a further top-up course of study to obtain an MSc.
Group Mentoring Programme – as part of the Group’s culture change and development programme, we launched a progressive mentoring programme for which we expect to gain accreditation by the Internal Standards for Mentoring Programmes in Employment in 2011.
Henley Business School, University of Reading – our membership of The Henley Partnership provides continuous professional development and education for executives at all levels.
Institute for Work-Based Learning, Middlesex University – during the year the Group piloted a Masters degree programme through the Institute for Work-Based Learning. Participants on this programme will graduate with an MA in their area of professional practice in 2011.
Our people are protected – we believe that our employees have the right to feel safe and protected at work.
Our commitment to this aim is demonstrated by the level of scrutiny applied to this area. Rank’s chief executive takes responsibility for the Group’s health and safety policies and performance; and each of our managing directors accepts the same responsibility for their businesses. The board is informed of health and safety issues on a regular basis and we engage with the broader workforce on these matters.
Our performance – We have maintained our positive employee engagement results which are measured through rolling quarterly surveys;
– Employee turnover within our businesses has continued to trend at historically low levels;
– 15 graduates from the Mecca Academy achieved general manager roles;
– Award of British Safety Council’s prestigious ‘Sword of Honour’ in recognition of achievements in workplace safety.
Our customers
“ For most people, gambling is a fun and enjoyable social activity. For a few, gambling can become a preoccupation that starts to affect the rest of their lives. The Rank Group recognises how important it is that such individuals identify and acknowledge the problem, and know that there is professional help and support available. I appreciate the steps that the Rank Group have taken to put in place appropriate procedures to protect their players and to inform them about gambling responsibly and about GamCare’s help services. That is why Rank’s casinos, bingo clubs and online gambling sites have been awarded GamCare Certification.”
Andy McLellan, chief executive, GamCare
Our pledgeWe will bring enjoyment to our customers through leisure experiences that are fun, sociable and safe.
Why this is importantOur ability to entertain our customers in a safe and responsible fashion is the cornerstone of our business model, affecting both the popularity of our brands and (in extreme circumstances) our licence to operate.
Our responsible gaming policy
– Clear customer communication to promote responsible play and to provide advice for those concerned about problem gaming.
– Employee training to support our teams in identifying at risk customers and intervening to provide support. More than 5,800 of Rank’s 6,621 customer-facing employees in Great Britain have qualified from this training module.
– Requirement for customer-facing employees to undergo a responsible gaming assessment two years after qualifying from training.
– Proof of age requirements in our club venues (and age verification procedures online) to prevent under-age gambling.
31The Rank Group Plc: Annual report and financial statements 2010

32 The Rank Group Plc: Annual report and financial statements 2010
Directors’ report: Operating responsibly continued
Our priorities and our progressCustomer enjoyment – During 2010, we invested considerable resource in projects specifically designed to enhance our customers’ experience of our brands.
We continued to develop our customer engagement and insight programme: reaching out to 49,000 customers via our net promoter score survey; receiving more than 15,000 individual pieces of customer feedback; and undertaking more than 1,300 hours of focus group and immersion research.
Guided by this programme, we stepped up our investment in our venues and websites to deliver service improvements in the areas of greatest value to our customers. This included a major project to improve the quality of our food service in Mecca Bingo clubs.
Performance – During 2010, our brand teams served more than 2.5 million customers across our club venues and via our internet and mobile channels;
– Customer visits to our venues increased by 1.7% to more than 22 million;
– Customer satisfaction (as measured by net promoter score) increased to 38%;
– Our brands received a numbers of accolades in the year, reflecting efforts made to improve service to customers. These included the E-gaming review ‘Mobile Gaming Operator of the Year’ for BlueSq.com; and the ‘Loo of the Year Award (bingo sector)’ for Mecca Bingo;
– Rank was short-listed for the ‘social responsibility’ and ‘European casino operator of the year’ prizes at the International Gaming Awards 2011.
Customer protection – Our brands bring enjoyment to our customers through entertainment, based around games of chance. However, we recognise that for a small minority of people, involvement in such games may exacerbate personal problems*.
As a consequence, we balance our desire to provide entertainment for the majority of our customers with a responsibility to protect and assist those who may be vulnerable to gambling-related difficulties.
Our commitment to this aim is demonstrated by the high level of scrutiny that we apply to responsible gaming, with bi-annual reviews by the Group main board and audit committee and quarterly reviews by our responsible gambling committee.
Whilst we continue to strive for improvement, we are proud of our record in this area, which is built on a commitment to the welfare of our customers and a clear cross-Group policy for responsible gaming (see ‘Our responsible gaming policy’).
Our venues are considered to be amongst the safest environments for gaming to take place, featuring supervised entry (we require customers to be 18 years or older to enter our bingo clubs and casinos in Great Britain and Spain; in Belgium the minimum age is 21 years), specialised training for our team members; and a community ethos that encourages controlled play.
During 2010, we continued to invest significant resources in this area: – Sustained investment in responsible gambling training for employees;
– £306,000 contribution to The GREaT Foundation to fund counselling for problem gamblers and research into treatment (2009: £267,000);
– Senior management engagement with problem gambling charities, including an annual programme of visits to GamCare’s national helpline centre;
– Promotion of GamCare’s helpline and netline in our venues and interactive channels;
– Promotion of the Gambling Commission’s gambleaware.co.uk website on all Rank Interactive channels and within venues;
– Launch of the www.stayincontrol.rank.com website to promote responsible gaming.
Performance – GamCare accreditation achieved for Blue Square (from 2006), Grosvenor Casinos (from 2007) and Mecca Bingo (from 2008);
– Just 78 of the customers who decided to exclude themselves from our venues breached this exclusion in 2010 – 0.9% of the total number of self-exclusion breaches across the betting and gaming industry in Great Britain;
– 12 reported incidents of underage gambling within Rank’s club venues in Great Britain – just 0.02% of the national total.
* According to the British Gambling Prevalence Survey 2010, problem gambling in Great Britain (our principal market) occurs within 0.9% of the total adult population.
Our communities
“ Rank Group team members and customers have done a sterling job. We are thrilled to have their continued support in 2011 and look forward to working together.”
Fabian French, director of fundraising,
Marie Curie Cancer Care
Our pledgeWe will attempt to make a positive difference to the lives of people in the locations where we operate through local engagement, community involvement and economic contribution.
Why this is importantEarning the trust of our customers, team members, suppliers, councillors and neighbours is critical to our success.
Our priorities and our progress Community engagement – In many communities, our venues act as important social hubs where people can come together to share each other’s company. In particular, our Mecca Bingo clubs act as safe, warm and friendly places to meet, especially for women.
We are embracing the development of social media as another means of engaging with our communities. By the end of 2010, our brands had established a network of more than 31,000 ‘fans’ on Facebook; and 3,400 ‘followers’ on Twitter. Mecca Bingo was particularly successful, with more than 25,000 Facebook fans.
Community involvement – in order to gain acceptance and feel valued in our local markets, we go beyond ‘business as usual’ in an effort to make a broad contribution to life within the communities where we operate.
This takes the form of charitable fund-raising for local and national causes, the use of our venues for community events and participation in local business and community organisations, amongst other activities.

33The Rank Group Plc: Annual report and financial statements 2010
Our performance – Raising more than £288,000 to fund respite care for cancer patients in our communities through Marie Curie Cancer Care;
– Employment for more than 8,900 people across Great Britain, Spain and Belgium;
– 9% increase in average employee numbers;
– Investment of more than £51m in capital projects, leading to significant indirect job creation;
– £156m directly generated in taxes in 2010.
Our world
“ It is now over three years since we set up the Group Environmental Committee that I chair, which is responsible for our Group Environmental Policy. This helps us focus on reducing consumption, minimising waste, maximising recycling opportunities and promoting the efficient use of resources.”
Ian Burke, chief executive, The Rank Group Plc
Our pledgeWe will minimise the impact of our operations on the Earth’s natural environment; and where possible promote ‘Green’ behaviours to our customers, suppliers and our employees.
Why this is importantIt is important for our customers and our people – many of the people who enjoy our brands or work within the brand teams care passionately about the environment. Because ‘green living’
is important to them, it has to be important to us. By involving our customers and our people in our environmental programme, we build their pride in our brands and forge stronger relationships.
It is important for our investors – we believe that good environmental practice makes good business sense. By cutting out waste and reducing energy consumption we are improving both our environmental performance and our profit performance.
Our priorities and our progressThe prime objective of our environmental programme is to reduce energy consumption, which currently accounts for roughly 90% of the Group’s carbon footprint. Our secondary target is to reduce the amount of waste sent to landfill by improving our ability to recycle.
Our approach has been to identify the areas of greatest opportunity, to challenge our team members and our suppliers to deliver solutions and to monitor our performance closely. Highlights from 2010 included:
– The extension of automated meter reading to 90% of our properties in order to provide more detailed data on energy consumption and to encourage more efficient energy management;
– The replacement of 18,000 50-watt LED lights with 7-watt LED lights;
– The installation of photo-electric sensors to ensure that external signs are not illuminated under daylight conditions;
– The extension of power converters to 80% of our properties to optimise energy efficiency.
Performance – Supporting grass-roots football in Great Britain through Blue Square’s sponsorship of the Football Conference;
– 40% of the waste generated in the course of the Group’s operations was collected for recycling;
– Mecca Bingo and Grosvenor Casinos served more than 3.3 million cups of Kenco coffee and 0.8 million cups of Suchard hot chocolate, made from coffee and cocoa beans entirely sourced from Rainforest Alliance Certified™ farms.
For further information download Rank’s environment report from www.rank.com
The Rank Group Plc
Customers
served 2.5 million customers
Society
Social investments
£594,000 in charitable
contributions*
Employees
£188.7m in wages and
salaries
Suppliers
£173.5 in supplier payments**
Shareholders
£8.1m in dividend payments
Government
£156.2m in taxes and
duties
Investment activities
£51.6m capital
expenditure
* £306,000 contributed to GREaT and £288,000 raised for Marie Currie Cancer care.** Includes a small amount of other costs.
Our contribution to society

34 The Rank Group Plc: Annual report and financial statements 2010
Directors’ report: Finance review
FINANCE REVIEW
Key results (from continuing operations)
2010 2009
Group revenue £567.8m £540.0mGroup statutory revenue* £544.5m £520.5mOperating profit:– before exceptionals £62.0m £58.0m– after exceptionals £75.4m £60.8mAdjusted net interest payable (note 5) £(6.8)m £(9.5)mAdjusted profit before taxation** £55.2m £48.5mProfit before taxation:– before exceptionals £54.5m £49.2m– after exceptionals £73.5m £52.0mProfit after taxation:– before exceptionals £38.2m £34.9m– after exceptionals £48.9m £37.9mBasic earnings per share:– before exceptionals 9.8p 9.0p– after exceptionals 13.7p 9.9pAdjusted earnings per share (note 9) 10.2p 8.9pDividend per share 2.40p 1.35pGroup EBITDA before exceptional items*** £92.3m £83.9mNet debt £123.4m £186.8mNet debt to EBITDA ratio 1.3x 2.2xWeighted average number of ordinary shares in issue 389.5m 389.5m
“ Another year of strong financial performance, selective investment in our estate and a progressive increase in the dividend.”
Paddy Gallagherfinance director24 February 2011
* Statutory revenue is stated after adjustment for free bets, promotions and customer bonuses (see note 1.3(a) and note 2).** Adjusted profit before taxation is calculated by adjusting profit from continuing operations before taxation to exclude exceptional items, the unwinding of discount in disposal provisions,
other financial gains or losses and the amortisation of the equity component of the convertible bond.*** Group EBITDA before exceptional items is Group operating profit before interest, tax, depreciation and amortisation.
Key resultsGroup revenue from continuing operations rose by £27.8m to £567.8m whilst Group operating profit before exceptionals of £62.0m was £4.0m higher than in 2009 as a result of a strong performance from Grosvenor Casinos. A full description of the Group’s 2010 operating performance is set out in the ‘chief executive’s review’ on pages 5 to 6.
Adjusted net interest payable of £6.8m was £2.7m lower than in 2009, reflecting the Group’s substantially lower net debt (down £63.4m or 34%) and lower interest rates.
Adjusted Group profit before tax and exceptionals was £6.7m higher than in 2009.
Adjusted earnings per share of 10.2p (2009: 8.9p) reflects the higher adjusted pre-tax profit on an unchanged weighted average number of ordinary shares.
Effective tax rateThe Group’s effective corporation tax rate was 27.7% (2009: 29.0%) based on a tax charge of £15.3m on adjusted profit before taxation and exceptionals of £55.2m. This is in line with the Group’s anticipated effective tax rate of 26% to 28%. The Group’s effective corporation tax rate for 2011 is expected to remain around 28%. Further details on the taxation charge of £16.3m and the adjustment to tax of £(1.0)m are provided in notes 6 and 9(c) respectively.

35The Rank Group Plc: Annual report and financial statements 2010
Cash tax rateThe Group had an effective cash tax rate of 2.5% on adjusted profit following the utilisation of brought forward losses and capital allowances. The Group is expected to have a cash tax rate of 6% to 8% in 2011, excluding any tax payable on the resolution of a number of legacy issues.
DividendsThe Group is committed to a policy of paying out a progressively higher ratio of earnings in dividends, taking into consideration both the Group’s capital investment requirements and the stability of the wider economic environment. A final dividend of 1.35 pence per share for the year 2009 was paid on 5 May 2010 following the resumption of the payment of ordinary dividends.
An interim dividend of 0.74 pence per share was paid on 10 September 2010 and a final dividend of 1.66 pence per share for the year 2010 has been recommended, giving a total dividend of 2.40 pence per share for the 2010 year.
Exceptional itemsIn order to give a full understanding of the Group’s financial performance and aid comparability between periods, the Group reports certain items as exceptional to normal trading.
2010
£m2009
£m
Grosvenor Casinos (3.6) (1.5)Mecca Bingo 31.0 4.3Top Rank España (1.4) –Central costs (12.6) –Continuing operations 13.4 2.8Discontinued operations 0.6 0.8Total exceptional profit before financing and taxation 14.0 3.6
The key exceptional items are detailed below by business:
Grosvenor Casinos impaired the carrying value of its Belgian casino concessions by £11.2m following a re-evaluation of the anticipated process for concession renewal, expected useful lives and the associated cash flows. As a consequence, the concessions are no longer regarded as indefinite life assets and will be depreciated over their expected remaining useful lives.
Additionally a profit of £4.0m was made following refunds of overpaid VAT on amusement machine revenue and a profit of £4.5m recognised from the release of an accrual for irrecoverable input VAT. HMRC has challenged the method used by Grosvenor to calculate the amount of input VAT that could be recovered and an accrual was set up to cover the potential liability. Case law now indicates that Grosvenor’s position is correct and the accrual has therefore been released, however HMRC continues to appeal the lead case. Grosvenor has also incurred £0.9m in costs relating to the closure of its casino in Hove, East Sussex.
The Group received £42.5m from HMRC in refunds on overpaid VAT on main stage bingo and amusement machines revenue. After costs (including advisors fees and the cost of a third party cap for contingent tax liabilities) and taxes, this resulted in an exceptional profit of £30.1m in Mecca Bingo and £4.0m in Grosvenor Casinos (noted above). In addition Mecca Bingo recognised a £3.2m credit on the reversal of fixed asset impairments booked in prior years, a non-trading freehold site was written down by £1.5m following an independent valuation and a £0.8m increase in the onerous lease provision was booked.
Top Rank España incurred £1.4m in redundancy costs following a restructuring of operations.
Central costs comprise £12.4m in onerous lease provisions on sub-let sites and £0.2m in irrecoverable VAT (following the receipt of the VAT refunds identified above). The onerous lease provisions relate to sites where the Group holds the head lease but space is largely occupied by former Group companies or their successors. These sites have proved increasingly difficult to sub-let and a number of the tenants have gone in liquidation or have difficulty in paying their rents. The increases, which arise following a re-assessment of rental income, dilapidation estimates and lease surrender opportunities, mainly relate to sites at Southampton, Huddersfield and Romford.
Exceptional profit from discontinued businesses comprises the receipt of £0.6m in VAT following successful Conde Nast/Fleming claims relating to businesses no longer owned by the Group (details on this type of claim are provided in the tax fact file on page 39).
Further details on exceptional items, including 2009 exceptionals, are provided in note 4.
Disposal provisionsAt 31 December 2010, the Group held £10.7m in provisions for costs associated with disposed businesses, including outstanding industrial disease and personal injury claims arising from Rank’s legacy businesses, deferred payments arising from lease settlements and other directly attributable costs. The timing and exact amounts of the expenditure are uncertain as it is taking longer than originally anticipated to agree the settlement of remaining liabilities.
The provision reduced by £1.7m as a result of £2.1m in cash utilisation, offset by increases of £0.2m due to currency translation (predominantly relating to US Dollar liabilities) and £0.2m due to the unwinding of discount on the provision.
The major expenditures in the period comprised:
– £1.0m on property related costs;
– £0.7m on professional support with tax investigations by a number of regulatory authorities in Europe and North America; and
– £0.4m on outstanding industrial disease and personal injury claims.
Further details on provisions, including 2009 balances, are provided in note 21 to the Group financial statements.

36 The Rank Group Plc: Annual report and financial statements 2010
Directors’ report: Finance review continued
Cash flow and net debt
2010
£m2009
£m
Continuing operations Cash inflow from operations 93.1 87.3Capital expenditure (51.6) (34.3)Fixed asset disposals 0.1 1.6Operating cash inflow 41.6 54.6Acquisitions and disposals 0.8 (0.3)Net cash receipts (payments) in respect of provisions and exceptional items 26.4 (17.6) 68.8 36.7Interest, hedges and tax receipts (payments) 0.7 (4.4)Dividends paid (8.1) –Other (including foreign exchange translation) 2.0 7.4Decrease in net debt 63.4 39.7Opening net debt 186.8 226.5Closing net debt 123.4 186.8
At the end of December 2010, net debt was £123.4m compared with £186.8m at the end of December 2009. The net debt comprised syndicated loan facilities of £168.6m, £9.1m in fixed rate Yankee bonds, £13.2m in finance leases and £6.5m in overdrafts, partially offset by cash at bank and in hand of £74.0m.
Financial structure and liquidityThe Group’s syndicated banking facilities comprise a £100.0m term loan and a £200.0m multi-currency revolving credit facility, which were arranged in April 2007 and mature in April 2012. These facilities require the maintenance of a minimum ratio of earnings before interest, tax, depreciation and amortisation (EBITDA) to net interest payable and a maximum ratio of net debt to EBITDA, both of which are tested bi-annually at June and December. The Group has always fully complied with its banking covenants.
In addition, the Group has uncommitted borrowing facilities of £24m, repayable on demand but which are available for general use.
In May 2010, the Group reduced the revolving facility by £50.0m in order to minimise unutilised facility costs and in October 2010 repaid £50.0m of its term loan.
The Group’s facilities are provided by a panel of banks with no single bank providing more than 10% of the facility. The Group treasury function sets counterparty limits for the lending banks with which it trades and regularly monitors their credit ratings to minimise risk of financial loss.
The Group intends to negotiate replacement banking facilities during 2011 and has commenced initial discussions with its existing lenders. Based on these initial discussions and current market conditions, the Group does not envisage any difficulty in arranging new facilities.
The Group expects, over the medium term, to operate at around 2.5 times net debt to EBITDA. Rank is currently operating at 1.3 times net debt to EBITDA in order to retain balance sheet flexibility until such time as appeals from HMRC against the Group’s VAT refunds are fully and finally resolved.
Capital expenditureDuring 2010, the Group’s capital investment programme totalled £51.6m. Of this, more than 80% was invested in extending the reach and broadening the appeal of Rank’s two largest businesses, Grosvenor Casinos and Mecca Bingo.
2010 £m
2009 £m
Grosvenor Casinos 19.4 15.8Mecca Bingo 22.6 13.0Top Rank España 1.9 1.5Rank Interactive 6.2 3.3Others 1.5 0.7Total 51.6 34.3
Grosvenor Casinos spent £7.8m on electronic roulette terminals, £4.9m on converting three venues (Birmingham, Brighton and Newcastle) to the G Casino format and completing the Sheffield conversion, £1.3m on the new E Casinos in Scarborough and Liverpool and £1.2m on new site development. The balance of the expenditure was on minor capital works.
Capital expenditure for Mecca Bingo comprised £2.6m on the development of the new Full House Destination clubs in Dagenham and Southend-on-Sea, £3.1m on completing the Full House Destination clubs at Oldbury and Aberdeen, £3.8m on new mobile gaming terminals, £4.8m on amusement machines (including £1.4m of finance leases), £1.3m on club refurbishment, £0.8m on improving our food and drink offer, £0.8m on smoking shelters and the balance on minor capital works.
Rank Interactive spent £6.2m on website development (including £1.4m on international expansion) and Top Rank España £1.9m on minor capital works.
The only significant capital commitments at 31 December 2010 were £2.3m on mobile gaming terminals, £0.8m on interval bingo upgrades (both in Mecca) and £0.4m on the conversion of our Walsall Casino to the G Casino format.
In light of uncertain economic conditions, the Group continues to maintain strict control over committing expenditure to capital projects. Although we anticipate 2011 capital investment to be in the order of £50-55m, expenditure will be phased and dependent on operating performance and the success of the Mecca Full House conversions. This will allow quick reductions in the overall level of capital expenditure should business conditions deteriorate. The commitments to the 2011 G Casino conversions at Walsall and Plymouth and the new G Casino at Stockton are not affected by this policy.

37The Rank Group Plc: Annual report and financial statements 2010
Financial riskThe Group’s financial risk management strategy focuses on the minimisation of risks for the Group. The Group’s funding, foreign exchange, liquidity, counterparty and interest rate risks are managed by the Group’s treasury department in accordance with approved policies and are subject to internal audit review. All significant financing transactions and treasury policies are authorised by the board of directors. Implementation of these policies is closely managed by the finance director and the group treasury manager. The treasury function is not run as a profit centre.
The key financial risks impacting the Group are liquidity risk, interest rate risk and credit risk. The Group has limited exposure to foreign exchange and this is not considered a key risk.
i) Liquidity riskLiquidity risk is the risk that cash may not be available to pay obligations when they fall due. Quarterly cash flow forecasts are prepared that identify the requirements of the Group and these are regularly updated to ensure sufficient financial headroom exists for at least 12 months. This is coupled with a regular review of medium term funding requirements which, in particular, are updated alongside the Group’s strategic plan process. The Group negotiated new medium term facilities in 2007, as noted above, which mitigate the liquidity risk it may face.
ii) Interest rate riskThe Group’s operating cash flows are independent of changes in interest rates. The Group primarily finances itself through syndicated bank facilities and the public debt market. The bank facilities are multi-currency although borrowings are typically drawn in Sterling and euros at floating interest rates. The Group currently has only US $14.3m of public bonds outstanding, which mature in 2018. The Group normally uses interest rate swaps, caps and collars to manage its exposure to interest rate fluctuations and at the end of December 2010, 11% of the Group’s borrowings were at fixed rates. Group policy is to maintain between 40% and 60% of its borrowing at fixed rates. The current low interest rates combined with the high cost of moving to fixed rates have led the Group to continue to operate outside of this policy for the time being.
iii) Credit riskCredit risk is the risk that a counterparty may not be able to settle amounts owing in full, when due. Surplus cash is invested in short term financial instruments using a limited number of financial institutions with strong credit ratings. Counterparty credit ratings are reviewed regularly and credit limits set to avoid significant concentration of risk with any one counterparty.
Going concern In adopting the going concern basis for preparing the financial statements the directors have considered the issues impacting the Group during 2010 as detailed in the business review above and have reviewed the Group’s projected compliance with its banking covenants detailed above. Based on the Group’s cash flow forecasts and operating budgets, and assuming that trading does not deteriorate considerably from current levels, the directors believe that the Group will generate sufficient cash to meet its requirements for at least the next 12 months and comply with its banking covenants. Accordingly the adoption of the going concern basis remains appropriate.

38 The Rank Group Plc: Annual report and financial statements 2010
Directors’ report: Tax fact file
TAX FACT FILE
TaxationGreat Britain is Rank’s principal market. Our bingo clubs and casinos in England, Scotland and Wales account for more than 80% of Group revenue and operating profit (before central costs). During 2010, the Group’s businesses generated £156.2m (2009: £146.8m) for the Exchequer and local government in VAT, gaming taxes, income tax, National Insurance contributions and local business rates. The broader impact of Rank’s operations, including taxes paid by supplier companies and the economic consequences of providing employment to more than 8,100 (2009: 7,400) people in the UK, is harder to quantify but no less significant.
In 2010, the amount of VAT and gambling duties generated by Mecca Bingo and Grosvenor Casinos was 7% higher than in 2009, while aggregate revenue from the two businesses (excluding the two Belgian casinos) rose by 5%. We paid 21.2% of our gross revenue across to central government in VAT and gaming taxes (2009: 20.8%).
Tax generated 2010 (£m)
Employment taxes
VAT
Gambling taxes
Rates
£156.2m
44.2
24.674.6
12.8
Tax generated 2009 (£m) £146.8m
41.0
24.968.0
12.9Employment taxes
VAT
Gambling taxes
Rates
Tax strategyRank aims to manage and plan its tax affairs in the UK and Europe with a view to reducing the cash tax payable in each jurisdiction and minimising the Group effective tax rate; while fully complying with relevant legislation. In the UK the utilisation of brought forward losses and capital allowances has resulted in no cash tax payments for a number of years.
The Group tax strategy is regularly reviewed and approved by the Board and supported by the use of appropriate advice from reputable professional firms. Where disputes arise over the interpretation and application of tax legislation, the Group is committed to proactive discussion with the relevant authorities as soon as possible and only resorts to litigation once all other avenues are exhausted. An open dialogue is maintained with HMRC involving regular meetings to review tax issues and brief them on business issues.
Rank’s policy is to lobby the UK Government both directly and through trade bodies on tax matters that will impact our customers or shareholders and in particular respond to consultation documents where the impact could be substantial (see section below on ‘Future changes to gaming taxes’).
Effective tax rateThe Group’s effective corporation tax rate was 27.7% (2009: 29.0%) based on a tax charge of £15.3m on adjusted profit before taxation and exceptionals of £55.2m. This is in line with the Group’s anticipated effective tax rate of 26% to 28%. The effective corporation tax rate for 2011 is expected to remain around 28%. Further details on the taxation charge of £16.3m and the adjustment to tax of £(1.0)m are provided in notes 6 and 9(c) respectively.
Cash tax rateThe Group had an effective cash tax rate of 2.5% on adjusted profit following the utilisation of brought forward losses and capital allowances. The Group is expected to have a cash tax rate of 6% to 8% in 2011, excluding any tax payable on the resolution of a number of legacy issues.
Rank made a significant contribution to the British economy in 2010 through tax and employment, as well as benefiting the economies of Spain, Belgium and Alderney through businesses based in or operating in those territories.

39The Rank Group Plc: Annual report and financial statements 2010
VAT and fiscal neutralitySince 2006, Rank has invested significant resource in pursuing litigation to reclaim overpaid VAT. Following successful rulings in both the VAT Tribunal and the High Court, the Group has received from HMRC £101.6m in refunded VAT and a further £10.7m in associated interest (before costs and increases in gross profits tax). The Group has requested further repayments totalling approximately £76.0m before interest and expects to receive them in 2011.
The claims are based upon the European Union’s principle of fiscal neutrality, which requires that similar products and services be taxed on a consistent basis. Rank has contended that VAT has been applied inconsistently to both games of bingo and amusement machines in Great Britain.
HMRC has appealed the matter to the European Court of Justice (‘ECJ’) and Rank expects that the case will be heard in 2011, with a final ruling likely in 2012.
The table below sets out the value and status of the individual claims.
Conde Nast/FlemingIn 1997, HMRC introduced a three-year retrospective cap on claims for overpaid VAT. The effectiveness of this cap was successfully challenged in the courts (the Conde Nast/Fleming cases). As a result, Rank was able to re-visit VAT periods up to December 1996.
One of the Conde Nast/Fleming claims is for the repayment of output VAT on main stage and interval bingo covering the period from 1996 back to 1973. HMRC issued guidance in January 2010 that this type of claim could be paid once the amount has been verified. The Group anticipates receiving approximately £65m during 2011, excluding interest. The timing of the receipt will depend upon the successful resolution of a number of quantification and entitlement issues as well as the quantum of the claim. This claim relies on the court ruling that the inconsistent application of VAT to bingo breached the rules on fiscal neutrality and will therefore drop away should HMRC’s appeal against this ruling be successful. It also includes the £35m interval bingo claim disclosed in prior periods that has been delayed by quantification and entitlement issues raised by HMRC.
VAT reclaims
Claim Period Amount Status
Overpayment of output VAT on interval bingo
2003–2008 £59.1m Money received but HMRC has appealed to European Court Of Justice. Case expected to be heard in 2011
Overpayment of output VAT on machine income
2002–2005 £26.4m Money received but HMRC has appealed to European Court Of Justice. Case expected to be heard in 2011
Overpayment of output VAT on main stage bingo
2004–2009 £16.1m Money received but HMRC has appealed to European Court Of Justice. Case expected to be heard in 2011
Overpayment of output VAT on bingo
2002–2004 Approximately £11m plus interest covering the period of the claim to the present date
Claim lodged and £7.1m paid by HMRC in February 2011 with interest of £1.4m expected in March 2011. Balance of claim subject to HMRC validation of claim on this section only
Incorrect introduction of 3 year cap on VAT reclaims
various Not known at present
Claims lodged awaiting HMRC validation of calculations
Overpayment of output VAT on interval and main stage bingo impacted by 3 year cap on VAT reclaims
1980–1996 Approximately £65m plus interest covering the period of the claim to the present date
Claim lodged awaiting HMRC validation of calculations

40 The Rank Group Plc: Annual report and financial statements 2010
Directors’ report: Tax fact file continued
The potential benefits from the other claims being made under the Conde Nast/Fleming principles cannot be estimated as they depend upon the outcome of other litigation and the validation of the calculations by HMRC. The number of assumptions made in the calculations is large and the impact of any challenges to those assumptions by HMRC so significant that it is impossible to provide any meaningful range of outcomes at this time.
InterestRank is also entitled to interest on the claims above. At present, HMRC pays simple interest on repayments caused by HMRC’s error. However, there is ongoing litigation that such interest should be calculated on a compound basis. Rank has protected its position with regard to such claims as other tax payers are bringing litigation on this point.
Appeals processRank’s claims outlined above have been upheld by the VAT Tribunal and by the High Court. HMRC continues to appeal these decisions and in May this year, the Court of Appeal referred the matter to the ECJ. Rank anticipates the case will be heard in summer 2011, with a ruling from the ECJ by the summer of 2012 at the latest. If HMRC were successful, Rank would be required to repay the value of the payments received to date plus interest and HMRC’s costs. Rank has entered into an agreement with a third party to restrict the net liability on the interval bingo claim to £25.6m plus interest (rather than £66.1m plus interest) in the event that it lost at ECJ. This agreement does not cover a further £42.5m plus interest relating to overpaid VAT on games of main stage bingo and amusement machines.
Details of the claims are also set out in note 30 (‘Contingent assets’) and note 31 (‘Contingent liabilities’). The Group believes that it has a reasonable chance of success with each claim. The table on page 39 sets out the current position on the claims (excluding interest).
VAT and duty changesDuring 2009 and 2010, HM Treasury made a number of changes to taxation which affected our operations in Great Britain. These changes had a potential £4.1m net negative effect on 2010 Group operating profit before mitigating actions. We estimate the actual impact to be in the region of £2.3m. This effect is as follows:
Change
Date
Net effect on 2010
Change in card room taxation April 2009 £(0.6)mIncrease in bingo duty from 15% to 22%
April 2009 £(3.0)m
Decrease in bingo duty from 22% to 20%
April 2010 £1.6m
Bingo exemption from VAT (weeks 1-17 2010 following VAT Tribunal)
April 2010 £1.6m
Increase in standard rate of VAT from 15.0% to 17.5%
January 2010 £(3.7)m
Total £(4.1)m
The following changes made to taxation in 2010 and 2011 will impact Group operating profit in 2011:
– 1% increase in employer’s national insurance contributions; and
– Increase in standard rate of VAT from 17.5% to 20.0%.
Future changes to gaming taxesOn a longer term basis, we anticipate changes to the taxation of amusement machines (from the second half of 2012) and to the treatment of offshore remote gaming generating revenue from UK customers. Rank has indicated that it supports these changes so long as they are undertaken as part of a broader harmonisation of betting and gaming taxes in Great Britain.
In February 2010 Rank proposed a root and branch reform of gaming taxation in response to the increasingly volatile nature of the way that the industry is taxed. In a submission to HM Treasury, DCMS and the shadow teams, Rank has proposed that the current patchwork quilt of gambling taxes be replaced with a single rate of duty. The submission suggests that a single rate of duty would generate more sustainable income for the Exchequer, reduce administration costs and provide greater support for the Government’s social policies.
Rank’s submissions to HM Treasury are available from www.rank.com.
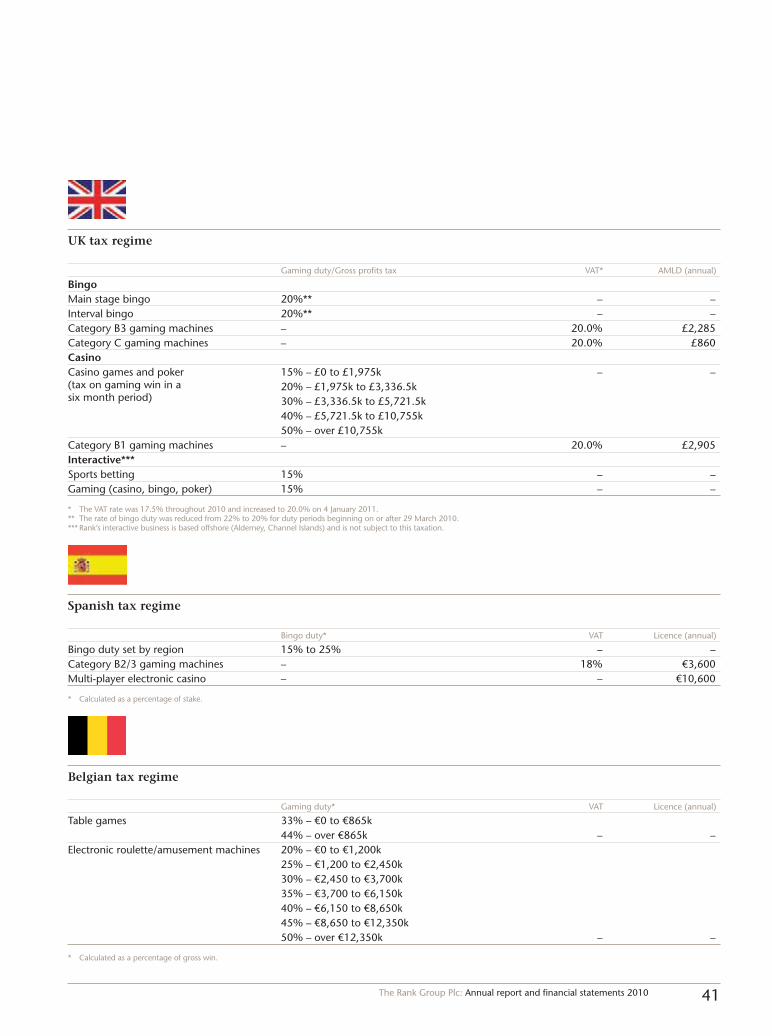
41The Rank Group Plc: Annual report and financial statements 2010
UK tax regime
Gaming duty/Gross profits tax VAT* AMLD (annual)
BingoMain stage bingo 20%** – –Interval bingo 20%** – –Category B3 gaming machines – 20.0% £2,285Category C gaming machines – 20.0% £860CasinoCasino games and poker (tax on gaming win in a six month period)
15% – £0 to £1,975k – –20% – £1,975k to £3,336.5k30% – £3,336.5k to £5,721.5k40% – £5,721.5k to £10,755k50% – over £10,755k
Category B1 gaming machines – 20.0% £2,905Interactive***Sports betting 15% – –Gaming (casino, bingo, poker) 15% – –
* The VAT rate was 17.5% throughout 2010 and increased to 20.0% on 4 January 2011.** The rate of bingo duty was reduced from 22% to 20% for duty periods beginning on or after 29 March 2010. *** Rank’s interactive business is based offshore (Alderney, Channel Islands) and is not subject to this taxation.
Spanish tax regime
Bingo duty* VAT Licence (annual)
Bingo duty set by region 15% to 25% – –Category B2/3 gaming machines – 18% €3,600Multi-player electronic casino – – €10,600
* Calculated as a percentage of stake.
Belgian tax regime
Gaming duty* VAT Licence (annual)
Table games 33% – €0 to €865k44% – over €865k – –
Electronic roulette/amusement machines 20% – €0 to €1,200k25% – €1,200 to €2,450k30% – €2,450 to €3,700k35% – €3,700 to €6,150k40% – €6,150 to €8,650k45% – €8,650 to €12,350k50% – over €12,350k – –
* Calculated as a percentage of gross win.
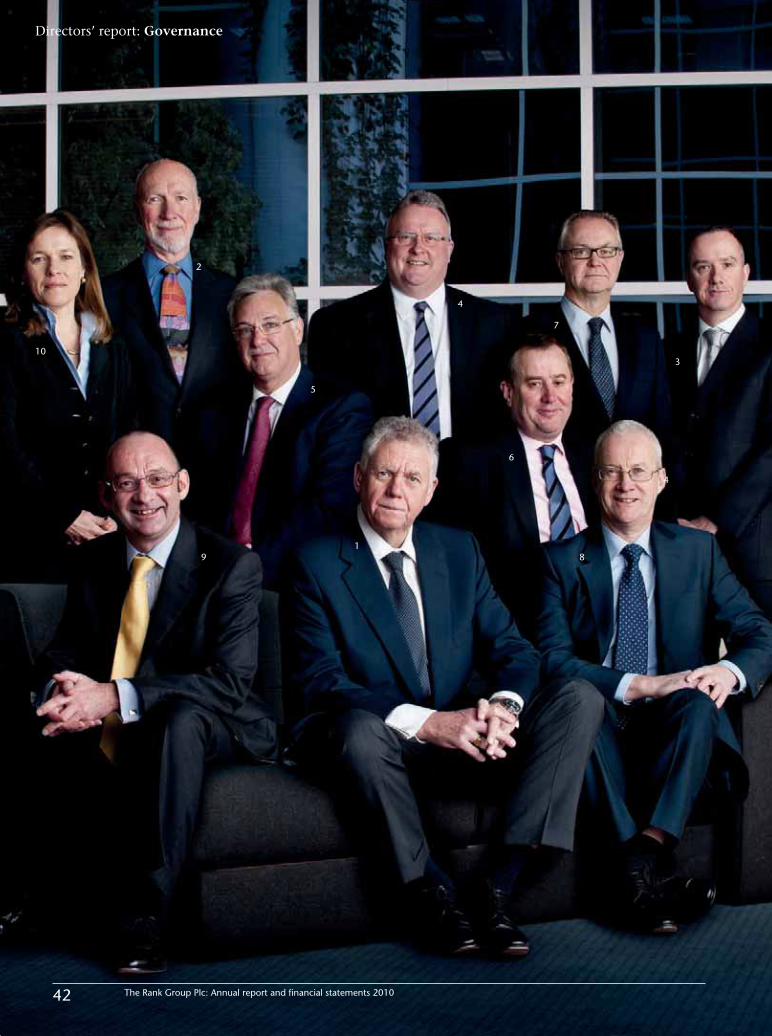
18
3
4
9
6
7
4
5
2
10
42 The Rank Group Plc: Annual report and financial statements 2010
Directors’ report: Governance

43The Rank Group Plc: Annual report and financial statements 2010
1. Peter Johnson Chairman
Appointment: January 2007 as deputy chairman and March 2007 as chairman Age: 63 Experience: Peter brings a wealth of experience to the board having been a director of companies involved in a diverse range of industries including international automotive services, multi-national specialist distribution and building and construction. Current roles: non-executive director of Bunzl plc since January 2006 and its senior independent director since April 2010; a vice-president of the Institute of the Motor Industry; a vice president of BEN, the charity of the Institute of the Motor Industry. Former roles: On the board of Inchcape plc from January 1998 to May 2009, initially as an executive director, then as chief executive and finally as chairman; and between September 2002 and April 2006 a non-executive director of Wates Group.
2. Richard Greenhalgh Senior independent non-executive director
Appointment: July 2004 Age: 66 Experience: Richard brings human resources and big brand expertise to the board, having spent more than 30 years with Unilever PLC including time as deputy director of personnel. He chairs Rank’s remuneration committee. Current roles: chairman of The Council for Industry and Higher Education since May 2003; chairman of CARE International UK since July 2004; chairman of Surrey and Borders Partnership NHS Foundation Trust since February 2011; a member of the advisory board of Liaison Financial Services Limited and of the Financial Reporting Council’s Standing Advisory Group on Proactivity; a director of British Youth Opera since October 2005; a Fellow of Green Templeton College, Oxford. Former roles: chairman of Unilever UK (July 1998 to July 2004); chairman of First Milk (November 2004 to October 2009).
3. Owen O’Donnell Independent non-executive director
Appointment: September 2008 Age: 44 Experience: Owen’s background is in online businesses including online media and online gaming. His expertise in these areas is key at a time when Rank is looking to exploit its brands and products across a broad range of channels. He is also a chartered accountant. Current roles: non-executive chairman of fanduel.com, the online fantasy sports site, since November 2009. Former roles: chief financial officer of Joost; finance director of King.com and of Betfair; director of finance and performance measurement of Pearson plc; chief financial officer of FT.com and Extel.
4. Tim Scoble Non-executive director
Appointment: April 2010 Age: 53 Experience: Tim is an experienced leisure operator, with particular expertise in developing consumer brands and service delivery. He is also a chartered accountant. Current roles: chief executive of GuocoLeisure Limited, a Singapore listed company controlled by Guoco Group Limited
(a parent company of the Company’s largest shareholder); UK chief executive of Guoman Hotels (formerly Thistle Hotels). Former roles: managing director of Moat House Hotels (2001 to 2003); chief executive of Little Chef and a director of Travelodge (2003 to 2005).
5. Bill Shannon Independent non-executive director
Appointment: April 2006 Age: 61 Experience: Bill’s background is in branded multi-site leisure retailing, having spent 30 years at Whitbread PLC during which he was a managing director of three major divisions. He is also a chartered accountant. Current roles: Aegon UK (non-executive director since 1997 and chairman since November 2005); non-executive director of Johnson Service Group PLC since May 2009; non-executive director and chairman designate of St. Modwen Properties PLC since November 2010; an operating executive at Tri-Artisan Partners LLC, a private equity house. Former roles: director of Whitbread PLC (December 1994 to June 2004); non-executive director of Barratt Developments PLC (September 2005 to October 2010); non-executive director of Matalan PLC (April 2005 to December 2006); chairman of the Gaucho Grill group of restaurants (June 2005 to August 2008).
6. Mike Smith Non-executive director
Appointment: April 2010 Age: 47 Experience: Mike has over 20 years’ finance experience in leisure, music and retailing businesses, 16 years of which were spent in senior finance roles in Whitbread PLC. He is a chartered accountant. Current roles: since March 2007 chief financial officer of Clermont Leisure (UK) Limited, a UK casino business controlled by Guoco Group Limited (a parent company of the Company’s largest shareholder). Former roles: senior finance roles in Whitbread PLC (1989 to 2005); finance director of Phonographic Performance Limited (2005 to 2006).
7. John Warren Independent non-executive director
Appointment: January 2006 Age: 57 Experience: John has more than 24 years’ experience in finance roles in consumer goods companies. He is a chartered accountant and chairs Rank’s audit committee. Current roles: non-executive director of Bovis Homes Group PLC since March 2006; non-executive director of Spectris plc since March 2006 and its senior independent director since November 2010; non-executive director of Uniq plc since March 2007 and its chairman since April 2010. Former roles: various roles at United Biscuits (Holdings) Plc including group finance director (1981 to 2000); group finance director of WH Smith PLC (September 2000 to March 2005); non-executive director of Rexam PLC (March 1994 to May 2003); non-executive director of RAC plc (September 2003 to June 2005); non-executive director of Arla Foods UK PLC (February 2006 to April 2007); non-executive director of BPP Holdings plc (May 2006 to July 2009).
8. Ian Burke Chief executive
Appointment: March 2006 Age: 54 Experience: Ian has spent the majority of his career in the leisure industry, initially in bingo clubs, then hotels and health and fitness clubs. He was chief executive of the Holmes Place Group from July 2003 to February 2006, chief executive of Thistle Hotels plc from May 1998 to May 2003 and held various roles with Bass plc from November 1991 to June 1995 including managing director of Gala Clubs and managing director of Holiday Inns.
9. Paddy Gallagher Finance director
Appointment: June 2008 Age: 47 Experience: A former finance director of Quadriga Worldwide Limited, Paddy previously held senior finance positions with information technology companies Dell Corporation, Wang and Sun Microsystems. Paddy is a chartered accountant.
10. Frances Bingham Company secretary
Appointment: May 2008 Age: 46 Experience: For eight years Frances was company secretary and legal director of the multi-national health and fitness group, Holmes Place Group, and prior to that she was a solicitor in private practice.
Board committees Audit: John Warren (chairman), Richard Greenhalgh, Owen O’Donnell, Bill Shannon Remuneration: Richard Greenhalgh (chairman), Owen O’Donnell, Bill Shannon, John WarrenNominations: Peter Johnson (chairman), Richard Greenhalgh, Bill Shannon, John Warren, Ian BurkeFinance: Peter Johnson (chairman), Ian Burke, Paddy Gallagher
Management team Our executive committee is not a board committee. It is responsible for day-to-day trading and is accountable to the chief executive for promoting and developing a profitable, long-term business.
Mecca BingoManaging director – Mark V Jones
Top Rank EspañaManaging director – Jorge Ibáñez
Grosvenor CasinosManaging director – Phil Urban
Rank InteractiveManaging director – Mark A Jones
Corporate Chief executive – Ian BurkeFinance director – Paddy GallagherCompany secretary – Frances BinghamCompliance director – Alan ArmstrongHuman resources director – Sue WaldockChief technology officer – Rob McDonaldStrategy director – Dan Waugh
BOARD OF DIRECTORS

44 The Rank Group Plc: Annual report and financial statements 2010
Directors’ report: Corporate governance
CORPORATE GOVERNANCE
Governance statementThe board is committed to ensuring that the Group is well managed and that rigorous and transparent procedures allow this to happen.
The principal governance rules applying to UK companies listed on the London Stock Exchange with accounting periods beginning before 29 June 2010 are contained in the Combined Code on Corporate Governance, revised by the Financial Reporting Council in June 2008 (“the Combined Code”). This report also includes the information that is required by the Financial Services Authority’s Disclosure Rules and Transparency Rules to be contained in the Company’s annual report.
The board confirms that it has fully complied with the provisions of the Combined Code throughout the financial year ended 31 December 2010.
This statement explains how we have applied the principles of the Combined Code, our governance policies and practices and how we run the business for the benefit of shareholders.
Combined Code main principlesA. DirectorsA.1 The board
“ Every company should be headed by an effective board, which is collectively responsible for the success of the company.”
Board compositionThe board consists of:
– a non-executive chairman;
– four independent non-executive directors;
– two non-independent non-executive directors; and
– two executive directors – the chief executive and finance director.
The names and biographies of all directors are published on page 43.
Key board responsibilitiesThe board is responsible for:
– Group strategy, objectives and policies;
– general and long-term progress within the political, economic, environmental and social setting of the day;
– financial performance, annual budgets and business plans;
– major capital expenditure, acquisitions and divestments;
– annual and half-year financial results and interim management statements;
– board committees and their terms of reference;
– internal controls and risk management;
– sound governance, health and safety, and environmental policies;
– board and company secretary appointments; and
– senior management structure, remuneration and succession.
Specific responsibilities are delegated to our four committees – audit (p50), remuneration (p48), nominations (p46) and finance (p45). They report to the board and operate within defined terms of reference, which can be obtained from our website at http://www.rank.com/governance/index.jsp or by writing to the company secretary.
Board meetingsBoard meetings allow for regular and frank discussion on strategy, trading, financial performance and risk management.
There were eight scheduled meetings during the year and four additional meetings to discuss specific issues. Our meeting in June, held away from our headquarters, was devoted entirely to strategy.
During the year, the board’s committees also met regularly to discharge their duties.
In exceptional circumstances when a director is unable to attend a meeting, his comments on briefing papers can be given in advance to the relevant chairman.
The directors’ attendance at 2010 board and committees meetings is recorded in the table below. It shows the number of meetings attended by each director compared with the number of meetings that director was eligible to attend.
BoardAudit
committeeRemuneration
committeeNominations
committeeFinance
committee
Ian Burke 12/12 n/a n/a 4/4 20/20Paddy Gallagher 11/12 n/a n/a n/a 20/20Richard Greenhalgh 12/12 3/3 6/6 3/3* n/aPeter Johnson 12/12 n/a n/a 4/4 20/20Owen O’Donnell 12/12 3/3 6/6 n/a n/aTim Scoble 5/5** n/a n/a n/a n/aBill Shannon 12/12 3/3 6/6 4/4 n/aMike Smith 5/5** n/a n/a n/a n/aJohn Warren 12/12 3/3 6/6 4/4 n/a
* Not eligible to attend one meeting as it related to his re-appointment.** Appointed by shareholders at the annual general meeting on 22 April 2010.

45The Rank Group Plc: Annual report and financial statements 2010
Insurance and indemnityThe Company has arranged insurance cover and indemnity in respect of legal action against its directors to the extent permitted by law.
Directors’ insurance and indemnity do not provide cover in situations where a director has acted fraudulently or dishonestly.
Conflicts of interestThe directors have a statutory duty to avoid conflicts of interest. In accordance with our articles of association, we have adopted a policy and procedure for managing and, if appropriate, authorising actual or potential conflicts of interest.
We review directors’ conflicts of interest once a year. Directors are required to disclose any other new appointments before agreeing to take them on, so that any conflicts of interest can be identified and addressed.
During the period under review, one non-executive director took on a position with an external organisation and no conflicts of interest in relation thereto have been identified.
The board also assesses conflicts of interest before making any new appointments.
Two board appointments were made at the 2010 annual general meeting and the board assessed the potential conflicts that could theoretically arise with regard to those individuals. The board is satisfied that its conflicts of interest procedure is sufficiently robust to deal with any potential conflicts that might arise in relation to these appointments.
A.2 Clear division of responsibilities
“ There should be a clear division of responsibilities at the head of the company between the running of the board and the executive responsibility for the running of the company’s business. No one individual should have unfettered powers of decision.”
We have approved a clear division of responsibilities for the chairman and chief executive.
ChairmanThe chairman is charged to:
– manage the business of the board, preside over meetings and seek prompt and appropriate decisions;
– work with the company secretary to ensure directors receive accurate and clear information for the proper execution of their duties;
– oversee effective communication with shareholders;
– keep the Group’s progress and development under review;
– ensure the chief executive’s Group objectives, policies and strategies are consistent with lasting shareholder value;
– evaluate the board and its committees; and
– ensure the Group’s governance is effective and in line with best practice.
Chief executiveThe chief executive’s role is to:
– manage and promote long-term profitable development;
– exercise stewardship of intellectual property, human and financial resources and ensure that the relevant policies are implemented;
– plan strategy and prepare objectives and policies for board approval;
– ensure action is taken to achieve strategies, objectives and policies, as approved by the board;
– ensure objectives, policies and strategies are adopted for each Group business, that appropriate budgets are set for them individually, that their performance is monitored, and that guidance is given when needed;
– take responsibility for Group health and safety policies;
– make sure the Group complies with all relevant legislation; and
– lead ongoing communication with employees.
Finance committeeThe board has established a finance committee which is comprised of the chairman, chief executive and finance director which is authorised to approve capital expenditure and make financing decisions for the Group up to authorised limits. On behalf of the board, the finance committee’s role includes setting, monitoring and reporting on:
– operating plans;
– monthly comparison of operating divisions’ actual financial performance against budget; and
– year-end forecasts.
The committee’s terms of reference are available from the Company’s website at http://www.rank.com/downloads/terms_of_reference/tor_finance_committee.pdf, or by writing to the company secretary.
The committee met on 20 occasions during the year and the issues it discussed included:
– assessing potential business expansion opportunities;
– capital expenditure requests for new sites and gaming equipment;
– the Group’s utilities requirement;
– insurance cover and uninsured risks;
– disposal of Blue Square on-course betting business;
– treasury matters; and
– non-executive directors’ fee review.

46 The Rank Group Plc: Annual report and financial statements 2010
Directors’ report: Corporate governance continued
A.3 Board balance and independence
“ The board should include a balance of executive and non-executive directors (and in particular independent non-executive directors) such that no individual or small group of individuals can dominate the board’s decision making.”
Size and structureDuring the year the nominations committee considered the board’s size and structure and concluded that it was well balanced providing a collective competence to suit the Group’s developing needs and an appropriate blend of executive and non-executive skill. We believe that all our directors are suitably qualified to help steer and challenge Group strategy.
Half of our board, excluding the chairman, is independent:
Name Independent 3-year term Appointed
ChairmanPeter Johnson* 2nd Jan 07Executive Ian Burke x n/a Mar 06Paddy Gallagher x n/a Jun 08Non-executiveRichard Greenhalgh** 3rd Jul 04Owen O’Donnell 1st Sep 08Tim Scoble x n/a Apr 10Bill Shannon 2nd Apr 06Mike Smith x n/a Apr 10John Warren 2nd Jan 06
* Peter Johnson was appointed chairman on 1 March 2007** Richard Greenhalgh is the senior independent director.
The board considers the chairman and four of the non-executive directors to be independent. Two of the non-executive directors are not independent – they are appointees of Guoco Group Limited, a parent company of Rank’s largest shareholder, which owns 114,235,699 ordinary shares in the Company, representing 29.25% of voting rights.
The principal terms and conditions of appointment for each director are set out on pages 57 to 59 and their interests in Rank shares are detailed on page 53.
Board diversityDuring the year the nominations committee also considered the issue of diversity in the context of the board. Whilst the board lacks diversity, the nominations committee was of the view that it was not appropriate to increase the size of the board merely in order to address diversity. Instead, it would be preferable to wait for a vacancy to arise on the board.
Senior independent directorAs senior independent director since April 2006, Richard Greenhalgh is available to talk with shareholders who have questions or concerns. He also chairs meetings when non-executive directors review the performance of the chairman.
Non-independent non-executive directorsAt the Company’s 2010 annual general meeting two individuals were, on the recommendation of the board, elected by shareholders as directors of the Company. Both individuals are appointees of Guoco Group Limited (“Guoco”), a parent company of Rank’s largest shareholder, which owns 114,235,699 ordinary shares in the Company, representing 29.25% of voting rights.
Clearly the presence of representatives of a significant shareholder, particularly one with the size of Guoco’s shareholding, on the board raises some important corporate governance issues. As a board we carefully considered these issues in detail and we believe that the decision to propose those individuals for election as directors was in the interests of all shareholders. Both Guoco appointed directors are experienced executives in the leisure industry and we believe their contribution is additive to the Group and therefore in the interests of all shareholders.
On 21 February 2011, Mike Smith tendered his resignation from the board with effect from 30 April 2011, when he will also leave his position as finance director of Clermont Leisure, a company within the Guoco group of companies. Tim Scoble will remain on the Rank board as a representative of Guoco and Rank anticipates that Guoco will propose the appointment of an additional representative to replace Mike Smith later in the year.
CommitteesThe composition and chairmanship of our board committees is considered annually. At its review in January 2011, the board was not of the view that it would be beneficial to make any changes to the chairmanship or membership of any of its committees.
A.4 Appointments to the board
“ There should be a formal, rigorous and transparent procedure for the appointment of new directors to the board.”
Nominations committeeWe have a thorough and transparent procedure for appointing new directors, supported by the formal terms of reference of the nominations committee which are available on our website at http://www.rank.com/downloads/terms_of_reference/tor_nominations_committee.pdf, or by written request to the company secretary.
The nominations committee is responsible for identifying relevant talent and nominating all board appointments. We believe it is sensible for the chairman and chief executive to sit on the committee and be fully involved in the process – except when their own re-appointment is discussed.
During 2010 the committee met formally on four occasions. The main issues which it discussed were:
– board composition;
– board diversity (see above for more information);
– appointment of additional non-executive directors (see above for more information);
– re-appointment of senior independent director (see p47 for more information);
– chairmanship and membership of board committees; and
– identification of directors’ for re-election by shareholders.

47The Rank Group Plc: Annual report and financial statements 2010
Terms of appointmentThe agreed terms and conditions for non-executive directors comply with the Combined Code and are available for inspection at the Company’s registered office.
Re-appointment of senior independent directorAs at 30 June 2010 Richard Greenhalgh had served his second three-year term as a non-executive director of the Company. The nominations committee considered the re-appointment of Richard Greenhalgh for a third and final three-year term and was of the view that continuity would be beneficial for the Group and recommended to the board that he be re-appointed. The board agreed the recommendation and Richard Greenhalgh was re-appointed as a non-executive director and the senior independent director for a further period of three years from 1 July 2010. In accordance with article 86 of the Company’s articles of association, Richard Greenhalgh is offering himself for re-election at the Company’s 2011 general meeting.
A.5 Information and professional development
“ The board should be supplied in a timely manner with information in a form and of a quality appropriate to enable it to discharge its duties. All directors should receive induction on joining the board and should regularly update and refresh their skills and knowledge.”
InformationAssisted by the company secretary, the chairman is responsible for ensuring that directors receive accurate and timely information on all relevant matters.
The directors receive a monthly report of current and forecast trading results and treasury positions, as well as updates on shareholder views.
A rolling programme of items sets the agenda for board discussion. This is regularly reviewed and updated to cover topical issues and developments.
Comprehensive briefing papers on substantive agenda items are circulated at least five working days before meetings where possible. These contain detailed background information, thus freeing valuable time for informed debate.
The core business of the board focuses on: strategy, capital expenditure, responsible operation, gaming industry issues, risk mitigation, succession planning and investor relations feedback.
We operate an open-door policy between the board and the executive. Members of the executive also make regular board presentations to ensure a flow of operational information reaches the directors in a timely way. During 2010, the director of strategy and the managing directors of Grosvenor Casinos, Mecca Bingo and Rank Interactive presented to the board at three meetings. The human resources director presented an update to the Group’s succession plan to the board in July and the new managing director of Top Rank España presented that business’s strategy to the board in October.
Informal dinners with management have proved an effective forum for open discussion and three were held during the year.
InductionDuring the year, two non-executive directors were appointed to the board. They were given a comprehensive induction programme, which included briefings on the Group’s trading environment, site visits and meetings with senior management.
Skills and knowledgeAll directors have access to the advice and services of the company secretary and, if required, may take independent advice and/or professional development at the Company’s expense.
During the year the human resources director met and corresponded individually with each non-executive director to discuss with them their training and development needs and how these might be met. Additionally, as part of the board effectiveness evaluation process, each director was invited to identify any desired skills and knowledge enhancements so that appropriate training could be arranged.
A.6 Board performance evaluation
“ The board should undertake a formal and rigorous annual evaluation of its own performance and that of its committees and individual directors.”
The board makes sure that the chairman has enough time to devote to his job. During the year we were unanimously satisfied that Peter Johnson’s other commitments had no material impact on the execution of his duties.
To monitor overall board performance, we use off-the-record questionnaires between the chairman and each director to evaluate individuals, the committees and the board as a whole.
The chairman conducts individual interviews with each board member to discuss their contributions during the year and any other issues arising out of the evaluation process.
The chairman’s performance is evaluated through a confidential questionnaire, completed by all non-executive and executive directors. The non-executive directors held their annual meeting to appraise the chairman’s effectiveness in January 2011.
At least once a year, the chairman holds a meeting solely with non-executive directors to consider the performance of executive directors. This meeting took place in January 2011.
We have reviewed the questionnaire reports and are agreed that:
– the board functioned effectively during 2010; and
– its committees continued to discharge their duties in line with their respective terms of reference.
A.7 Re-election of directors
“ All directors should be submitted for re-election at regular intervals, subject to continued satisfactory performance. The board should ensure planned and progressive refreshing of the board.”
All new directors must stand for election at the first annual general meeting after their appointment and, thereafter, at intervals of no more than three years. Non-executive directors are engaged for an initial period of three years and must stand for election and re-appointment in the same way.
Directors seeking re-election at 2011 AGMRank’s articles of association require one third of serving directors to retire annually and Paddy Gallagher, Owen O’Donnell and John Warren will be offering themselves for re-election at the forthcoming annual general meeting. Richard Greenhalgh will be seeking re-appointment following the board approving his re-appointment as a non-executive director and the senior independent director for a further period of three years from 1 July 2010.
48 The Rank Group Plc: Annual report and financial statements 2010
Directors’ report: Corporate governance continued
B. Remuneration“ There should be a formal and transparent procedure for developing policy on executive remuneration and for fixing the remuneration packages of individual directors. No director should be involved in deciding his or her own remuneration.”
The board has established a remuneration committee of four independent non-executive directors. A rolling agenda and topical items determine the committee’s discussions.
A separate remuneration report which gives more information on the work of the committee and how it has applied the provisions of the Combined Code in relation to the level and make-up of remuneration can be found on pages 56 to 65.
C. Accountability and auditC.1 Financial reporting
“ The board should present a balanced and understandable assessment of the company’s position and prospects.”
The directors’ responsibility statements can be found on page 55.
C.2 Internal control
“ The board should maintain a sound system of internal control to safeguard shareholders’ investment and the company’s assets.”
Internal control frameworkTo maintain control and direction over strategic, financial, operational and compliance issues, the board has put in place formally defined lines of responsibility and delegation of authority.
Established procedures are geared to identify, evaluate and manage significant risks and to monitor the Group’s businesses and performance.
This framework is reviewed annually and is designed to safeguard shareholders’ investments and the Group’s assets, while ensuring that proper accounting records are maintained. Senior management is responsible for making sure that controls and procedures are enforced and that the board is informed of any risks and control issues that arise.
Financial control: there is a comprehensive system for reporting financial results to the board, a budgeting process, an approved budget and quarterly re-forecasts. The chief executive and Group finance director hold monthly review meetings with managing directors and their respective finance directors.
Financial reporting control: detailed policies and procedures are in place to ensure the accuracy and reliability of financial reporting. We will be installing a new financial reporting system during the first half of 2011 which should enhance our reporting capability.
Strategic control: the board reviews the Group’s strategic plans annually and regularly reviews strategic progress.
Operational control: our procedures are laid down in detailed manuals and reinforced by employee training. Each business unit carries out a monthly self-audit to test key controls and report weaknesses to operational management.
Communication control: the executive directors and senior management meet regularly with representatives from the businesses to address financial, human resource, risk management and other control issues.
Our system of internal control is designed to manage rather than eliminate the risk of failure to achieve business objectives, and provides reasonable, not absolute, assurance against material misstatement or loss. It controls, rather than eliminates, any human error, deliberate misconduct or unforeseen events.
Internal auditOur internal audit team provides an objective and continuous stream of data and opinion on risk management and control. To avoid bias, it is entirely independent of the business operations under audit.
The team is responsible for a systematic appraisal of our adherence to policies and procedures. Its role is to safeguard Rank’s assets and interests from loss, including fraud, and to ensure the integrity of financial information.
The head of internal audit makes regular presentations to the committee and reporting includes comparative and trend analysis. During the year he had three closed sessions with the audit committee without anybody from executive management being present.
To embed control further, the scores used by internal audit to monitor each business unit’s reporting performance now also affect operational management bonuses.
ComplianceCompliance affects our reputation, legal position and financial sustainability. We are responsible for compliance across the Group and for ensuring that all Rank businesses meet local legal and regulatory requirements.
Compliance with the Gambling Act 2005 (and its forerunner, the Gaming Act 1968) is fundamental to the survival of Rank’s businesses, creating a heavily compliant culture within the Company.
A dedicated compliance team of 15 employees monitors day-to-day adherence to the provisions of the Act and other regulatory obligations.
Senior executives, the internal audit team and our external auditors are responsible for monitoring overall compliance. They report to the audit committee and the board.
Control cultureWe oversee a culture of strong control and risk management. This is reflected in:
– directors’ methods of enforcing control, some of which were established through Rank’s historical activities in the USA and the requirement to comply with the Sarbanes-Oxley Act 2002;
– management style and philosophy;
– dedicated teams for compliance and internal audit; and
– Rank’s organisational structure and clear lines of accountability, authority and responsibility.

49The Rank Group Plc: Annual report and financial statements 2010
Code of conductWe have an employee code of conduct that sets out our values and principles and guides everyone’s behaviour. Adherence to the code is important. It upholds our reputation and relationships, inside and outside the Company.
The audit committee is responsible for monitoring management reports on employee conduct, including our whistle-blowing programme.
Bribery Act 2010The board has been keeping under review management’s preparations for the forthcoming implementation of the Bribery Act 2010. At its meeting in September 2010, the board reviewed and approved the actions that had been taken by management to date, including an assessment of the potential risk areas for Rank and the associated mitigating actions. Our chief executive has been appointed as Rank’s main board Bribery Act 2010 ‘champion’. In terms of board and committee reporting, going forward, the Bribery Act 2010 will form part of the general risks and internal controls reporting to the board and form part of the bi-annual employee code of conduct reports to the audit committee.
Risk managementAs part of its risk oversight role, the board satisfies itself that the necessary steps are taken to foster a culture of risk-adjusted decision-making throughout the Group. The board strives to ensure that risk management is an integral component of the Group’s corporate strategy, culture and value generation process. The board’s view is that risk management should be neither an impediment to the conduct of business nor a mere supplement to the Group’s overall compliance programme.
The risk management process is reviewed by the audit committee on behalf of the board and monitored regularly by the chief executive, supported by the company secretary.
The Company’s risk management reporting provides knowledge of current and emerging risks, trends and opportunities that may colour strategic decisions. We communicate with regulators, Government, non-governmental organisations and other bodies who have opinions about our business, its future and effects.
In January 2010, Rank’s then external auditors assisted in undertaking an assurance mapping exercise in relation to the top 23 risks identified on Rank’s risk register and the results were reported to February 2010’s audit committee meeting.
Following a review of the results of the assurance mapping exercise and having regard to the fact that the Group, having stabilised, had now entered a new phase, the board was of the view that the execution of the Group’s strategic objectives should be the primary risk focus. To that end work started on a new externally facilitated risk assessment exercise in June 2010. In order to bring a fresh perspective to the exercise, the external facilitation was conducted by a firm who had not previously assisted Rank in a risk assessment exercise.
At its meetings in June and July 2010, the board considered and discussed its appetite for risk going forward. In recent years, due to the legacy business difficulties that Rank had faced and due to the global credit crisis, it had been appropriate to maintain a low risk appetite in order to maximise shareholder value.
However, in recognition of the fact that the Group had a stable business operation, the board was of the view that a greater degree of risk could be taken when appropriate. Given that Rank operates in an industry which is subject to government intervention, there would be a tendency towards a lower risk appetite than in some other businesses.
In September 2010, individuals from the firm engaged to facilitate the risk assessment exercise interviewed a selected number of employees from the Group’s operations and support functions.
In October 2010, the executive committee participated in an externally facilitated risk assessment workshop to consider the risks identified at the individual interviews and to rank them. Individual risk owners were then asked to develop mitigating actions, risk indicators and measurement criteria. A summary risk profile and action plans for the top ten risks were presented to the committee in December 2010 and reviewed by the board in January 2011.
During 2011 the executive committee will review the agreed measurement criteria for the risk indicators identified for the top ten risks on a quarterly basis and report to the board thereafter.
Principal risks and uncertaintiesWe outline below what we are doing to address our principal risks. The key financial risks facing the Group can be found on page 37.
Taxation and regulationAdverse change (fiscal and regulatory) in legislation continues to be our biggest risk. We participate actively in trade bodies’ presentations to Government and opposition parties. During the year we arranged key stakeholder familiarisation visits to some of our sites in order that stakeholders could have an opportunity to see our businesses in operation and gain a better understanding of the positive effect of our business activities, including the provision of a safe environment within which adults can enjoy gambling, the creation of employment and the generation of revenues for the Exchequer.
In February 2010, Rank published a report entitled ‘Responsible taxation: Fairness, Simplicity, Sustainability’ in which it outlined a proposal for a new simplified and coherent regime for betting and gaming. That report can be found at http://www.rank.com/downloads/responsible_taxation.pdf. We continue to engage with the Government and opposition parties on this subject.
Additionally, in March 2010, Rank published a further report entitled ‘Gaming and betting 2010: Fairness, Responsibility and Sustainability’ as an introduction to Rank commencing a process of working with politicians, the Gambling Commission and other stakeholders to shape a positive environment for gaming and betting in Great Britain. A copy of that report can be found on our website at http://www.rank.com/downloads/political_manifesto.pdf.

50 The Rank Group Plc: Annual report and financial statements 2010
Directors’ report: Corporate governance continued
IT securityIn keeping with our focus on customer and employee safety and given the predominantly cash-based nature of our businesses, our security function has a physical security bias. However, as our brands grow online, as we deploy more technology into our clubs and as we move to a more cashless society, the balance between our physical security resource requirements and our IT security resource requirements will shift. Our risk assessments undertaken during the year in this area have resulted in us increasing our IT security resource and we will continue to monitor resourcing requirements in the light of the changing nature of the environments in which we operate.
We have policies and procedures in place to safeguard our customer data and to respond swiftly to breaches and attempted breaches of our IT systems. Systems’ penetration testing is carried out regularly and our IT policies and procedures are regularly reviewed in the light of developments. Following a risk review earlier in the year, we are carrying out more rigorous due diligence exercises in relation to third party suppliers to our online businesses.
External eventsCustomers may be prevented or deterred from accessing our clubs due to factors such as extreme weather, illness or disease epidemics, terrorist threats, strikes and public transport system failures. Whilst these matters are outside our direct sphere of influence, we have during the year under review, worked hard to prepare ourselves better for such eventualities, particularly in terms of co-ordinating with our interactive businesses and making sure that employees can get to work. We learnt some important lessons from the first heavy snowfall in early 2010 which ensured that when the heavy snow fell again in November, we were well prepared in terms of making the interiors and immediate exteriors of our premises as safe as possible for those of our customers and employees who were able to reach them.
Loss of licencesRank’s gaming licences are fundamental to its operation and therefore the loss of them would be catastrophic for Rank. This fact has fostered a heavily compliant culture within Rank. Rank has a dedicated compliance function that is independent of operations and a separate internal audit function that is independent of both operations and the compliance function. Rank maintains a strong and open relationship with the Gambling Commission, the body responsible for regulating commercial gambling in the United Kingdom. Since entering the online gaming market, Rank has worked hard to build a similarly strong and open relationship with the Alderney Gambling Control Commission, which is responsible for the regulation of eGambling in the States of Alderney. Our responsible gambling and anti money laundering review committees meet quarterly to review topical issues, trends and statistics and their findings are reported to our audit committee. We also have a director of security who is supported by an experienced security team who have built informal relationships with police forces in the areas in which we operate so that if problems arise there are open channels of communication.
Economic environmentThe uncertain economic environment, higher indirect taxation and public sector job cuts could adversely affect our customers’ expenditure on leisure activities and we therefore monitor closely customer spending. We are constantly looking to identify ways to improve our offer so that we become our customers’ leisure destination of choice. Macro-economic factors could also impede our ability to secure new banking facilities when our existing facilities fall due for renewal in April 2012. We maintain a programme of active engagement with members of our banking syndicate and we check the bond and debt markets regularly for availability so that we can move quickly should they show signs of tightening.
C.3 Audit committee and auditors
“ The board should establish formal and transparent arrangements for considering how they should apply the financial reporting and internal control principles and for maintaining an appropriate relationship with the company’s auditors.”
Audit committee membership and meetingsThe board has established an audit committee of four independent non-executive directors. A rolling agenda and topical items determine the committee’s discussions.
Members of the audit committee are listed on page 43. The board is satisfied that the majority of the committee’s members has recent and relevant financial experience.
The chairman, chief executive, Group finance director, company secretary and Group financial controller normally attend committee meetings, as do the external auditors.
The committee met formally three times in the year. Its terms of reference are available from the Company’s website at http://www.rank.com/downloads/terms_of_reference/tor_audit_committee.pdf, or by writing to the company secretary.
Role of the audit committeeThe audit committee assists the board in reviewing and maintaining internal controls, the management of risk and our compliance with the law and regulation.
It monitors and reviews the effectiveness of the Group’s internal audit function.
It also assesses the integrity of all public financial statements before their submission to the board, ensuring we present a fair assessment of the Group’s ongoing position and prospects.
Any changes in accounting policies are authorised by the committee, which also reviews the objectivity and effectiveness of our external auditors every year.
The committee oversees the Company’s internal code of conduct and monitors our whistle-blowing programme through which employees may, in confidence, raise concerns about possible improprieties in areas of financial reporting, financial control and other ethical matters.
The committee is regularly updated on accounting and legislative changes through briefing papers from the Group finance director and others.

51The Rank Group Plc: Annual report and financial statements 2010
Audit committee activity in 2010At its meetings in 2010 the committee examined the effectiveness of the Group’s approach to:
– assessment of risk – by reviewing evidence of current and emerging risk and the Group’s risk management processes;
– internal control – by approving the internal audit plan and reviewing its findings, reviewing the annual and interim financial statements, reviewing the reports of the external auditors and reviewing the effectiveness of the Group’s internal audit function;
– action plans to address any failings or weaknesses of internal control; and
– action plans to manage significant risks.
This process has been in place during the year and up to the date of approval of the 2010 annual report and financial statements. It has been reviewed by the board and meets the Internal Control Guidance for directors contained in the Combined Code.
Audit committee evaluationThe audit committee’s performance was assessed by questionnaire to members and other executives who have dealings with the committee in December 2010. The board concluded that the committee continues to function effectively.
AuditorsAt last year’s annual general meeting, shareholders approved the appointment of Ernst & Young LLP as auditors to the Group at a remuneration to be agreed by the audit committee. Ernst & Young LLP are willing to continue in office and a resolution that they be re-appointed at a remuneration to be agreed by the audit committee will be proposed at the forthcoming annual general meeting.
Relations with external auditorsOur auditors are employed to express an opinion on the integrity of our financial statements. They review the systems of internal financial control and the data contained in the financial statements to the extent necessary to express opinion.
They discuss with management the reporting of operational results and the financial position of the Group, and present findings to the audit committee.
InformationThe directors in office at the date of this report are not aware of any relevant information that has not been made available to the auditors and each director has taken steps to be aware of all such information and to ensure it is available to the Company’s auditors.
Non-audit workThe audit committee oversees the nature and amount of any non-audit work undertaken by the auditors to ensure they remain independent. Consequently, the committee is required to approve in advance all non-audit services above a specified value. In view of the fact that the size of the Group has diminished over recent years and the audit fee reduced accordingly, in December 2010 the committee resolved to reduce the level of fees for non-audit work which required its prior consent from £50,000 to £25,000.
When seeking external accountancy advice in relation to non-audit matters, the Group’s policy is to invite competitive tenders where appropriate. It is also the Group’s policy to balance the need to maintain audit independence with the desirability of taking advice from the leading firm in the area of advice being sought and the desirability of being efficient.
Details of the year’s fees paid to Ernst & Young LLP are on page 84.
Auditor assessmentIn addition to a private meeting between the audit committee chair and the external audit partner, the committee meets with the auditors following each audit committee meeting in a closed session without executive directors to assess the objectivity and accuracy of financial reporting.
The committee generally reviews the external audit process and the auditor’s performance at least annually, providing feedback to the auditors from management assessments. In view of the fact that there was a change of auditors during the year, no review in respect of the outgoing auditor was undertaken and the review in respect of the incoming auditor will be undertaken following completion of the 2010 year-end audit formalities.
AssuranceThe internal audit function and the external auditors presented their findings to the committee in July and December 2010 and February 2011. We confirm that action plans to remedy identified weaknesses in internal control and risk management have been in place throughout the year.
Ernst & Young LLP’s audit report is published on page 66.
D. Relations with shareholdersD.1 Dialogue with institutional shareholders
“ There should be a dialogue with shareholders based on the mutual understanding of objectives. The board as a whole has responsibility for ensuring that a satisfactory dialogue with shareholders takes place.”
We speak with institutional shareholders and city analysts through a programme of investor relations and regular meetings with principal shareholders.
All directors receive reports to keep them in touch with shareholder opinion. During the year, a total of 62 meetings with 49 shareholders were attended by one or more of the chairman, senior independent director, chief executive and finance director.
Formal briefings on shareholder opinion are circulated to the board after presentation of the Company’s interim and annual results.
Since May 2010 the Group has circulated to institutional investors and other shareholders who have so requested, a monthly investor update newsletter covering broker research, consensus forecasts, share price performance, business news and industry information.
In March 2010 each of the Company’s then top seven institutional shareholders was contacted in order to discuss the board’s recommendation that two appointees of Rank’s largest shareholder be elected to the board of Rank at the 2010 annual general meeting and to obtain their views in relation thereto. All these institutional shareholders were offered face-to-face meetings with the chairman to discuss the implications of the elections.

52 The Rank Group Plc: Annual report and financial statements 2010
Directors’ report: Corporate governance continued
In addition, during 2010 one institutional shareholder availed itself of the opportunity to have a face-to-face meeting with the chairman of our remuneration committee to discuss remuneration issues relating to the Group. Additionally, during the year, the remuneration committee’s advisors, Towers Watson, have consulted our major institutional shareholders via the Association of British Insurers and Risk Metrics Group on matters relating to long-term incentives for executives.
The principal method of communicating with all our shareholders is via our corporate website, www.rank.com. Information can be provided in paper format but only when shareholders specifically request this.
Shareholders may also use electronic means to vote – or appoint a proxy to vote on their behalf – at the annual and other general meetings of the Company.
D.2 Constructive use of the annual general meeting
“ The board should use the annual general meeting to communicate with investors and to encourage their participation.”
All shareholders are welcome to attend our annual general meeting (“AGM”). Private investors are encouraged to ask questions following a summary business presentation of the Group’s results and development plans.
The chairman and chief executive and chairmen of the audit, remuneration, nominations and finance committees are all present.
Shareholders are invited to vote on the formal resolutions contained in the notice of meeting, which is published at least 20 working days beforehand. The business presentation, voting results and a summary of the questions and answers are made available at www.rank.com, or in printed format on request.
Next AGMThe 2011 annual general meeting will be held on 14 April 2011 and the full text of the notice of meeting, together with explanatory notes, is set out in a separate document at: http://www.rank.com/downloads/agm/nom_2011.pdf.
If you have elected for paper information, this will be enclosed with your hard copy of this annual report. Shareholders wishing to change that election may do so at any time by contacting the Company’s registrar (contact details are on page 119 and on our website at http://www.rank.com/investors/shareholder_faqs.jsp ).
Other disclosuresThe Companies Act 2006, the Large and Medium-sized Companies and Groups (Accounts and Reports) Regulations 2008, the Companies (Disclosure of Auditor Remuneration and Liability Limitation Agreements) Regulations 2008, the Financial Reporting Council’s Combined Code on Corporate Governance (June 2008), the Financial Services Authority’s Listing Rules and the Financial Services Authority’s Disclosure Rules and Transparency Rules (“DTR”) contain mandatory disclosure requirements in relation to this annual report in respect of the year ended 31 December 2010.
For ease of reference we have provided below details of the pages within this annual report and financial statements where you will find many of the mandatory disclosures, all of which are incorporated by reference and deemed to form part of our directors’ report:
Page number(s)
Accounting policies adopted 72–79Annual general meeting 52Auditors – disclosure of information to 51Auditors – reappointment 51Board of directors 43Business description GatefoldBusiness objectives, strategies and likely future developments 5-13Business overseas locations 8, 19 & 24Business trends and factors 16-29Change of control – significant agreements 54Change of control – directors’ and employees’ compensation 54Corporate responsibility: environment, employees and community 30-33Critical contractual and other arrangements 54Directors’ appointment and retirement 46 & 47Directors’ conflicts of interest 45Directors’ insurance and indemnity 45Directors’ interests in shares and share incentive plans 53 & 64-65Directors’ responsibility statements 55Dividends 35 & 90DTR responsibility statements 55Employee communications and consultations 30Employee numbers Gatefold & 118Employees with disabilities 30Equal opportunities 30Financial instruments – risk management 102-106Financial performance and position 1, 34-35Going concern 37 & 72Key performance indicators 5Political donations 55Post balance sheet events 117Principal risks and uncertainties 49-50Profits 34Share capital 53Shares – company own share purchases 54Shares – rights, restrictions, obligations and variations 54Significant shareholders 53Suppliers – payment policy and practice 54

53The Rank Group Plc: Annual report and financial statements 2010
Share capitalThe Company’s authorised share capital at 31 December 2010 was £180m, divided into 1,296,000,000 ordinary shares of 138/9p each. The ordinary shares are listed on the London Stock Exchange and can be held in certificated or uncertificated form. There were 390,529,314 shares in issue at the year-end, which were held by 19,085 registered shareholders.
Distribution of registered shareholders
Range
Total number of registered shareholders % of holders
Total number of shares
% of issued share capital
1 – 1,000 14,599 76.49% 3,788,288 0.97%1,001 – 5,000 3,650 19.13% 7,463,207 1.91%5,001 – 10,000 360 1.89% 2,543,690 0.65%10,001 – 100,000 330 1.73% 10,535,111 2.70%100,001 – 1,000,000 107 0.56% 34,882,577 8.93%1,000,000 and above 39 0.20% 331,316,441 84.84%Totals 19,085 100.00% 390,529,314 100.00%
Significant shareholders The following interests of 3% or more of the total voting rights attached to ordinary shares have been notified to the Company in accordance with the Financial Services Authority’s Disclosure Rules and Transparency Rules (“the DTRs”). Due to the fact that the DTRs only require notification where the percentage voting rights reaches, exceeds or falls below 3% and each 1% threshold above 3%, there is a difference between disclosures made pursuant to the DTRs and those disclosed on our website at http://www.rank.com/investors/major_shareholders.jsp which are based on responses to s.793 Companies Act 2006 (“CA 2006”) notices issued by the Company. For ease of reference, we have included below voting rights in respect of both DTRs disclosures and s. 793 CA 2006 responses up to and including the date of this report.
As per FSA DTRs disclosures
As per s.793 CA 2006 enquiry responses
Date last notified Shareholder % held Voting rights % held Voting rights
17.11.2009 Hong Leong Co. (Malaysia) Berhad 29.02% 113,313,388 29.25% 114,235,69907.02.2008 Genting Berhad 11.03% 43,092,136 11.59% 45,251,20315.02.2010 BlackRock, Inc. 4.92% 19,238,527 4.39% 17,134,54908.11.2010 Prudential Plc 4.56% 17,816,710 4.56% 17,816,71021.11.2008 Legal & General Group plc 3.99% 15,602,161 3.63% 14,193,72023.10.2009 Aviva plc 3.02% 11,805,912 3.46% 13,495,67822.02.2011 Mr Cheng Fu Zay 3.00% 11,718,122 2.70% 10,545,207
Directors’ interests in shares
Name
Ordinary 138/9p shares as at 31 Dec 10
and as at 24 Feb 11
Ordinary 138/9p shares as at
01 Jan 10
Chairman Peter Johnson 57,260 48,334Executive directors* Ian Burke 260,553 160,553
Paddy Gallagher 160,000 160,000Independent non-executive directors Richard Greenhalgh 37,564 30,511
Owen O’Donnell 17,022 11,674Bill Shannon 35,394 28,976John Warren 46,099 38,517
Non-independent non-executive directors** Tim Scoble – –Mike Smith – –
* The Rank Group Employee Benefit Trust (“The Trust”) holds shares to satisfy the vesting of long-term incentive plan awards. Executive directors are deemed to have an interest in the ordinary shares of the Company held by the Trust. As at each of 1 January 2010, 31 December 2010 and the date of this report, the Trust held 1,059,826 ordinary 138/9p shares.
** The non-independent non-executive directors are appointees of Guoco Group Limited, a parent company of Rank’s largest shareholder, which owns 114,235,699 ordinary shares in the Company, representing 29.25% of voting rights.

54 The Rank Group Plc: Annual report and financial statements 2010
Directors’ report: Corporate governance continued
Rights and restrictions attaching to sharesVoting rightsEach ordinary share carries the right to one vote at general meetings of the Company.
Meeting rightsRegistered holders of ordinary shares are entitled to attend and speak at general meetings and to appoint proxies.
Information rightsHolders of ordinary shares are entitled to receive the Company’s annual report and financial statements.
Share transfer restrictionsThere are no specific restrictions on the transfer of shares contained in the Company’s articles of association.
The Company is not aware of any agreements between the holders of Rank shares that may result in restrictions on the transfer of shares or that may result in restrictions on voting rights.
Variation of rightsSubject to applicable legislation, the rights attached to Rank’s ordinary shares may be varied with the written consent of the holders of at least three quarters in nominal value of those shares, or by a special resolution passed at a general meeting of the ordinary shareholders.
Directors’ powers in relation to sharesAllotment and issue of sharesSubject to the provisions of the CA 2006, and subject to any resolution passed by the Company pursuant to the CA 2006 and other shareholder rights, shares in Rank may be issued with such rights and restrictions as the Company may by ordinary resolution decide. If there is no such resolution or so far as the Company does not make specific provision, they may be issued as Rank’s board of directors may decide. Subject to the Company’s articles of association, the CA 2006 and other shareholder rights, unissued shares are at the disposal of the board.
The Company currently has no shareholder authority to allot and grant rights over any proportion of the Company’s unissued share capital, nor does it have shareholders’ authority to allot and grant rights over ordinary shares without first making a pro rata offer to all existing ordinary shareholders. Neither of these authorities is required for the purpose of allotting shares pursuant to employee share schemes. Since the board has no present intention of allotting shares for any other reason, these shareholder authorities will not be sought at the forthcoming annual general meeting.
Market purchases of own sharesThe Company currently has no shareholder authority to make market purchases of its own shares and it has no present intention of making any such purchases. Therefore the Company does not intend to seek such authority at the forthcoming annual general meeting.
Directors’ other powersSubject to legislation, the directors may exercise all the powers permitted by the Company’s memorandum and articles of association. A copy of these can be obtained by writing to the company secretary, or from Companies House.
The articles contain provisions to empower the directors on certain specific matters, including:
– appointment of directors, subject to subsequent shareholder approval;
– delegation of powers to a director, secretary or committee of one or more persons;
– the Company’s powers to borrow money; and
– the ability of a director to vote on matters in which he has an interest.
Changes to the Company’s articles of association can only be made by a resolution passed by a majority of no less than 75% of shareholders.
Change of controlOur principal loan term and credit facility agreement contains a provision that, on a change of control of Rank, immediate repayment can be demanded of all advances and any accrued interest.
We have arrangements with one employee to provide compensation for loss of employment in the event of a change of control at Rank, should no suitable role be offered by a new owner.
The provisions of the Company’s share schemes and incentive plans may cause options and awards granted to employees to vest in the event of a takeover.
A change of control may also affect licences to operate, as specified in the provisions of the Gambling Act 2005 and the Alderney eGambling Regulations 2009 and the Belgian Games of Chance Act 1999.
Critical contractual and other arrangementsWe assess and record any risks in our dealings with major suppliers as part of the Group’s overall risk management process. Contingency plans are in place to deal with events should key supply arrangements be terminated without due warning.
Our procurement team also reviews the financial health of our main suppliers. We have concluded that, while unexpected termination of any of the Group’s major contractors would be disruptive, it would not have a severe adverse effect.
Suppliers – payment policy and practiceRank’s individual businesses and intermediate holding companies agree terms and conditions for business transactions with their respective suppliers. Payments are made to suppliers once they have met these terms and conditions.
At 31 December 2010 the Group had an average of 38 days’ purchases owed to trade creditors (2009: 35).
The Company is the holding company of the Rank group of companies and as such has no trade creditors.

55The Rank Group Plc: Annual report and financial statements 2010
Charitable donationsIn 2010 we made, or committed, charitable donations in the UK of £360,000 (2009: £315,000), of which the largest was £306,000 (2009: £267,000) to The GREaT Foundation.
Further information can be found in the corporate responsibility section of this report, pages 30 to 33.
Political donationsWe made no political donations during the year.
It has been Rank’s long-standing practice not to make cash payments to political parties and the board intends that this will remain the case. However, the CA 2006 is very broadly drafted and could catch activities such as funding seminars and other functions to which politicians are invited, supporting certain bodies involved in policy review and law reform and matching employees’ donations to certain charities. Accordingly, as in previous years, the directors will be seeking shareholders’ authority for political donations and political expenditure at the forthcoming annual general meeting in case any of Rank’s activities are inadvertently caught by the legislation.
Responsibility statements under the DTREach of the directors named on page 43 confirms that to the best of his knowledge:
– the financial statements, prepared in accordance with IFRS as adopted by the European Union, give a true and fair view of the assets, liabilities, financial position and profit of the Company and the undertakings included in the consolidation taken as a whole; and
– the directors’ report (which incorporates the Group operating and financial review) includes a fair review of the development and performance of the business and the position of the Company and the undertakings included in the consolidation taken as a whole, together with a description of the risks and uncertainties that they face.
Directors’ responsibility statementsAnnual report and financial statementsThe directors are responsible for preparing the annual report, the directors’ remuneration report and the financial statements of the Group and the Company, in accordance with the law.
Company law requires the directors to prepare financial statements for each financial year. The financial statements must give a true and fair view of the state of affairs of the Company and the Group and of profit or loss for the period.
To prepare the financial statements, the directors are required to:
– select suitable accounting policies and apply them consistently;
– make judgements and estimates that are reasonable and prudent;
– confirm that the financial statements comply with International Financial Reporting Standards (IFRS) as adopted by the European Union; and
– prepare the financial statements for both the Company and the Group on the going concern basis, unless it is appropriate to presume that the Group will not continue in business, in which case there should be supporting assumptions or qualifications.
The directors confirm that they have complied with all of the above.
Accounting records The directors must keep proper accounting records that disclose with reasonable accuracy, at any time, the financial position of the Company and the Group and ensure that the financial statements and the directors’ remuneration report comply with the Companies Act 2006 and, for the Group financial statements, Article 4 of the International Accounting Standard (IAS) Regulation.
Safeguarding assetsThe directors are also accountable for safeguarding the assets of the Company and the Group and, therefore, for taking reasonable steps to prevent and detect fraud and other irregularities.
Corporate websiteThe maintenance and integrity of Rank’s corporate website, on which this annual report and financial statements are published, is the board’s responsibility. We would draw attention to the fact that legislation in the UK on the preparation and publication of financial statements may differ from other jurisdictions.
By order of the board
Frances Bingham Company secretary 24 February 2011

56 The Rank Group Plc: Annual report and financial statements 2010
Directors’ report: Remuneration report
REMUNERATION REPORT
IntroductionThis remuneration report has been prepared on behalf of the board by the remuneration committee, under the chairmanship of our senior independent director.
The committee has applied the principles of good governance set out in The Combined Code on Corporate Governance and, in preparing this report, has complied with Regulation 11 of The Large and Medium-sized Companies and Groups (Accounts and Reports) Regulations 2008 (“the Regulations”) and the United Kingdom Listing Authority listing rules (“the Listing Rules”).
Our external auditors are required to report to shareholders on the audited information contained in this report and to state whether, in their opinion, it has been prepared in accordance with the Regulations.
A resolution to approve this report will be proposed at the annual general meeting on 14 April 2011. A summary of the directors’ total emoluments in 2010 is set out in Table 1, page 64.
Remuneration committee membership
Committee member since
Richard Greenhalgh – committee chairman
1 July 2004 (chair since 27 April 2006)
John Warren 1 January 2006Bill Shannon 3 April 2006Owen O’Donnell 15 January 2010
Role and remit of the remuneration committeeThe remuneration committee assists the board in setting the remuneration packages for the Company’s chairman, executive directors and other executive committee members.
The committee has four scheduled meetings a year to discuss a rolling agenda of items. By invitation, the Company chairman, chief executive, human resources director and company secretary attend and contribute to meetings, but are not present at discussions regarding their own remuneration.
Additionally, the committee chairman attends an annual remuneration planning meeting with management and external advisors in order to agree the nature of the financial and other information to be produced for the committee at future meetings. This is to ensure that the committee has before it all information that it needs in order to have informed discussions about the setting of remuneration packages.
The committee’s formal terms of reference are available on our website at www.rank.com/downloads/terms_of_reference/tor_remuneration_committee.pdf, or by written request to the company secretary.
Remuneration committee evaluationThe committee’s performance during 2010 was assessed via confidential questionnaires with committee members and other individuals who support its work. Results were then reviewed by the committee chairman and discussed with the board.
The board agreed that the committee continued to perform effectively.
Remuneration policyThe performance of Rank is dependent upon the quality of its directors, senior executives and employees and therefore the Group seeks to attract, retain and motivate skilled directors and senior executives of the highest calibre, without paying more than is necessary. In order to attract such individuals the committee needs to ensure that the remuneration packages properly reflect an individual’s duties and responsibilities, are appropriate and competitive, sensitive to pay elsewhere within the Group and directly linked to performance.
Composition of chairman’s & non-executive directors’ remunerationRemuneration payable to the chairman and non-executive directors consists of fixed fees, which are set at a level to reflect the time and commitment they bring to their respective roles and to attract and retain relevant skills and experience.
The remuneration of the chairman and non-executive directors is determined by, respectively, the remuneration and finance committees and is reviewed annually.
No performance based fees are paid to the chairman and non-executive directors and they are not entitled to participate in any of the Group’s share plans.
Composition of executive directors’ remunerationFixed remunerationThe objective of fixed remuneration is to provide a base level of remuneration which is competitive in order to attract high calibre individuals and appropriate to the executive directors’ skills and responsibilities.
The committee takes advice from its independent remuneration advisors, Towers Watson, with regard to levels of fixed remuneration. These are determined with reference to available market data from comparator groups, taking into account sector, scale and area of operations. When agreeing individual base salaries, the committee considers comparable salary levels, individual performance, Group performance and across-the-board employee pay trends. Executive directors’ remuneration is reviewed annually by the committee.
Fixed remuneration comprises base salary, pension contributions and other benefits that are defined by market levels.

57The Rank Group Plc: Annual report and financial statements 2010
Performance based remunerationThe performance based components of executive directors’ remuneration seek to align the rewards attainable by executive directors with the achievement of particular annual and longer-term objectives of Rank and the creation of shareholder value over the short and long term.
Short-term incentivesRank operates an annual cash bonus scheme in which executive directors participate. This scheme rewards the executive directors for achieving strategic goals and stretching financial targets.
Long-term incentivesRank also operates a long-term incentive plan for the executive directors pursuant to which conditional share awards are made. These have the ability to vest after a given period (typically three years) on achievement of specified performance targets if the committee is of the view that it is appropriate for an award to vest. In deciding this, the committee considers the Group’s total shareholder return performance against the FTSE-350 over the relevant period. The committee believes that such awards are aligned with creating shareholder value over the long-term.
External advisors to the remuneration committeeAs at 1 January 2010 Towers Watson (known as Watson Wyatt until its merger with Towers Perrin) had been external remuneration advisors to the committee for three years. The committee therefore thought it appropriate to conduct a tender for the provision of remuneration advisory services to it.
Three firms (including the incumbent) were shortlisted to participate in the formal tender presentation to the remuneration committee chairman (on behalf of the committee), the company secretary, human resources director and head of compensation and benefits.
A number of factors resulted in Towers Watson being the preferred choice for the committee and it therefore approved the re-appointment of Towers Watson for a period of three years from 1 July 2010.
Towers Watson attended four out of the committee’s six meetings during the year and also attended the committee chairman’s remuneration planning meeting.
Towers Watson did not provide any other services to the Group during 2010.
Committee deliberations during 2010During the year there were six committee meetings, all of which were attended by all committee members.
Matters discussed by the committee during the year included the following:
– 2010 annual bonus payments p60 – 2011 annual bonus plan structure and targets p60 – 2011 fixed pay review p59 – Chairman’s fee review p57 – 2005 LTIP – vesting of awards p61 – 2010 LTIP – size and targets for 2010 award p62 – Review of shareholding guidelines p63 – Pensions – implications of new legislation – Implications of the new UK Corporate Governance Code on remuneration
– Annual review of remuneration policy and practices – Remuneration packages for new members of the executive committee
Chairman’s terms of appointment TermPeter Johnson had a letter of appointment dated 27 November 2006 to serve as deputy chairman of the Group with effect from 1 January 2007, taking over as chairman with effect from 1 March 2007. The initial appointment was for a period of three years and was extended for a further period of three years from 1 January 2010 by letter dated 22 October 2009. Either party can terminate the appointment on three months’ notice without liability for compensation.
RemunerationThe chairman’s annual fee had been £150,000 since 1 January 2007. In December 2010 the committee reviewed the level of this fee in conjunction with advice from Towers Watson. The committee considered this in the context of the four year period that had elapsed since the chairman had joined the Group without his fee being increased and having regard to the fact that only limited pay increases were proposed to be made throughout the Group with effect from 1 January 2011. Having regard to all the circumstances, the committee thought it appropriate to increase the chairman’s fee by £7,500 to £157,500. There was no increase made to his annual travel expense allowance, which remains at £10,000.

58 The Rank Group Plc: Annual report and financial statements 2010
Directors’ report: Remuneration report continued
ShareholdingThe chairman’s letter of appointment states that he is expected to acquire a sizeable shareholding in the Company. As at 31 December 2010 he was interested in 57,260 ordinary shares of 138/9p each, representing 48% of his annual fee as at that date. There has been no change to his shareholding since the year end.
Non-executive directors’ terms of appointment TermAll non-executive directors have letters of appointment with the Company for an initial three-year term, terminable on three months’ notice by either party without liability for compensation. Their dates of appointment are as follows:
NameOriginal letter of
appointment dateAppointment
dateNotice period
Richard Greenhalgh 05 Mar 2004 01 Jul 2004 3 monthsJohn Warren 19 Oct 2005 01 Jan 2006 3 monthsBill Shannon 28 Feb 2006 03 Apr 2006 3 monthsOwen O’Donnell 20 Aug 2008 11 Sep 2008 3 monthsTim Scoble 17 May 2010 22 Apr 2010 3 monthsMike Smith 17 May 2010 22 Apr 2010 3 months
RemunerationThroughout the five year period from 1 January 2006 to 31 December 2010, fees payable to non-executive directors were as follows:
– Base non-executive annual fee £38,000
– Audit committee chair £8,500
– Remuneration committee chair £7,500
– Senior independent director £2,500
In December 2010, the chairman and executive directors reviewed the level of fees payable to the non-executive directors, in conjunction with advice from Towers Watson. The committee considered this advice having regard to the fact that only limited pay increases were proposed to be made throughout the Group with effect from 1 January 2011 and in the context of a five-year period having elapsed since non-executive directors’ fees had last been increased. Having regard to all the circumstances, the committee thought it appropriate to increase the non-executives’ base annual fee by £2,000 to £40,000 with effect from 1 January 2011. There were no increases made to additional committee chair and senior independent director fees.
ShareholdingsUntil 1 January 2009, independent non-executive directors were required to use 30% of their base net fees (after tax) to purchase ordinary shares in the Company at quarterly intervals, such shares to be retained throughout their tenure of service. This requirement was relaxed with effect from 1 January 2009 but, nevertheless, all independent non-executive directors continue to make quarterly purchases of shares in this way and, with effect from 1 January 2011, Owen O’Donnell is applying 40% of his base net fees (after tax) in this way.
Name
Ordinary 138/9p shares as at
31 December 2010
and as at 24 February
2011
Ordinary 138/9p shares as at
1 January 2010
Independent non-executive directorsRichard Greenhalgh 37,564 30,511Owen O’Donnell 17,022 11,674Bill Shannon 35,394 28,976John Warren 46,099 38,517Non-independent non-executive directors*Tim Scoble Nil n/aMike Smith Nil n/a
* The non-independent non-executive directors are appointees of Guoco Group Limited, a parent company of Rank’s largest shareholder, which owns 114,235,699 ordinary shares in the Company, representing 29.25% of voting rights.
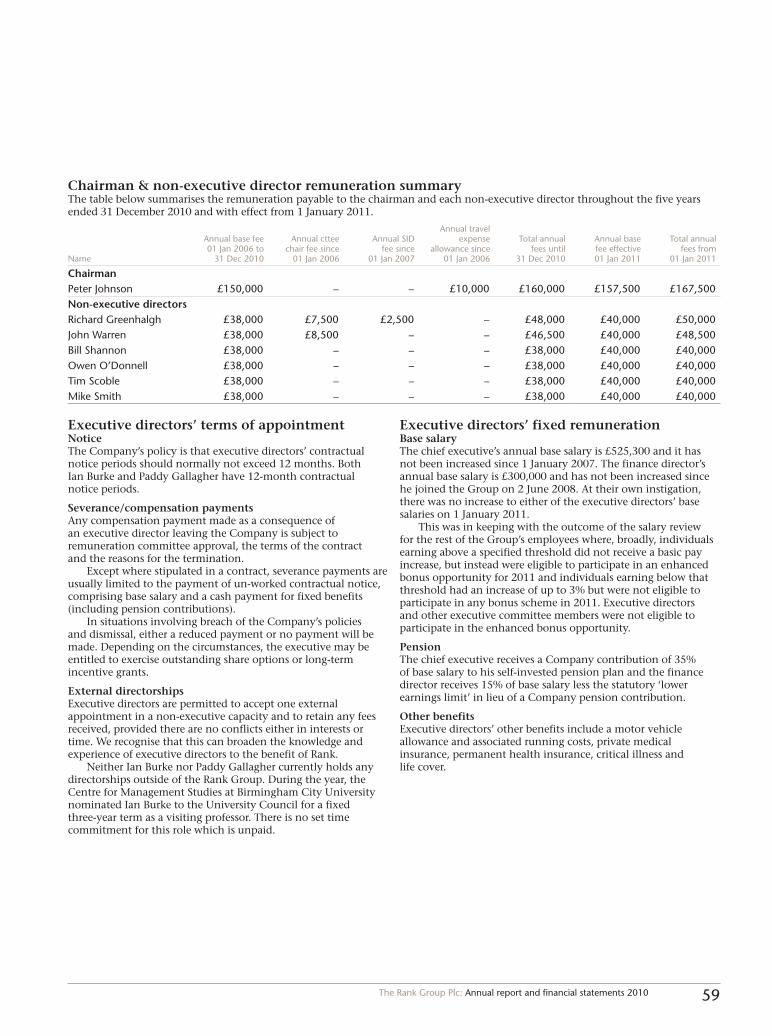
59The Rank Group Plc: Annual report and financial statements 2010
Chairman & non-executive director remuneration summaryThe table below summarises the remuneration payable to the chairman and each non-executive director throughout the five years ended 31 December 2010 and with effect from 1 January 2011.
Name
Annual base fee 01 Jan 2006 to
31 Dec 2010
Annual cttee chair fee since
01 Jan 2006
Annual SID fee since
01 Jan 2007
Annual travel expense
allowance since 01 Jan 2006
Total annual fees until
31 Dec 2010
Annual base fee effective 01 Jan 2011
Total annual fees from
01 Jan 2011
ChairmanPeter Johnson £150,000 – – £10,000 £160,000 £157,500 £167,500Non-executive directorsRichard Greenhalgh £38,000 £7,500 £2,500 – £48,000 £40,000 £50,000John Warren £38,000 £8,500 – – £46,500 £40,000 £48,500Bill Shannon £38,000 – – – £38,000 £40,000 £40,000Owen O’Donnell £38,000 – – – £38,000 £40,000 £40,000Tim Scoble £38,000 – – – £38,000 £40,000 £40,000Mike Smith £38,000 – – – £38,000 £40,000 £40,000
Executive directors’ terms of appointmentNoticeThe Company’s policy is that executive directors’ contractual notice periods should normally not exceed 12 months. Both Ian Burke and Paddy Gallagher have 12-month contractual notice periods.
Severance/compensation paymentsAny compensation payment made as a consequence of an executive director leaving the Company is subject to remuneration committee approval, the terms of the contract and the reasons for the termination.
Except where stipulated in a contract, severance payments are usually limited to the payment of un-worked contractual notice, comprising base salary and a cash payment for fixed benefits (including pension contributions).
In situations involving breach of the Company’s policies and dismissal, either a reduced payment or no payment will be made. Depending on the circumstances, the executive may be entitled to exercise outstanding share options or long-term incentive grants.
External directorshipsExecutive directors are permitted to accept one external appointment in a non-executive capacity and to retain any fees received, provided there are no conflicts either in interests or time. We recognise that this can broaden the knowledge and experience of executive directors to the benefit of Rank.
Neither Ian Burke nor Paddy Gallagher currently holds any directorships outside of the Rank Group. During the year, the Centre for Management Studies at Birmingham City University nominated Ian Burke to the University Council for a fixed three-year term as a visiting professor. There is no set time commitment for this role which is unpaid.
Executive directors’ fixed remuneration Base salaryThe chief executive’s annual base salary is £525,300 and it has not been increased since 1 January 2007. The finance director’s annual base salary is £300,000 and has not been increased since he joined the Group on 2 June 2008. At their own instigation, there was no increase to either of the executive directors’ base salaries on 1 January 2011.
This was in keeping with the outcome of the salary review for the rest of the Group’s employees where, broadly, individuals earning above a specified threshold did not receive a basic pay increase, but instead were eligible to participate in an enhanced bonus opportunity for 2011 and individuals earning below that threshold had an increase of up to 3% but were not eligible to participate in any bonus scheme in 2011. Executive directors and other executive committee members were not eligible to participate in the enhanced bonus opportunity.
PensionThe chief executive receives a Company contribution of 35% of base salary to his self-invested pension plan and the finance director receives 15% of base salary less the statutory ‘lower earnings limit’ in lieu of a Company pension contribution.
Other benefitsExecutive directors’ other benefits include a motor vehicle allowance and associated running costs, private medical insurance, permanent health insurance, critical illness and life cover.

60 The Rank Group Plc: Annual report and financial statements 2010
Directors’ report: Remuneration report continued
Executive directors’ performance-related remuneration Short-term incentives2010 annual cash bonus schemeProfitability remained the executive team’s main focus during 2010 and 106.6% of target was achieved. However, in recognition of the importance that meeting and exceeding customer expectations has for the generation of sustainable growth in earnings per share, an element of the 2010 annual cash bonus opportunity was linked to achieving a Group net promoter score (‘NPS’) of 50% across the Group (5% in excess of our stated 2010 target). Our ambitious NPS target for the year 2010 was not achieved and therefore this element of bonus opportunity was not earned by the directors.
Bonus measure
Target bonus (payable @ 100% of target)
% of salary
Maximum bonus (payable at 120% of target)
% of salaryActual bonus (paid)
% of salary
Chief executiveGroup operating profit 47.5% } 97.5% } 63.5% }
} 50% } 100% } 63.5%Net promoter score 2.5% } 2.5% } 0% }Finance directorGroup operating profit 37.5% } 77.5% } 50.5% }
} 40% } 80% } 50.5%Net promoter score 2.5% } 2.5% } 0% }
2011 annual cash bonus schemeThe committee has reviewed the operation of the current bonus scheme and concluded that, in the main, it remains appropriate for rewarding the executive directors for achieving strategic goals and stretching financial targets. Target and maximum levels of annual bonus payment remain unchanged from last year.
NPS continues to be an important tool in assessing our effectiveness in meeting and exceeding customer expectations. Therefore an element of the 2011 annual cash bonus opportunity is again being linked to achieving specific NPS targets.
Bonus measure
Maximum bonus (payable at 100% of target)
% of salary
Maximum bonus (payable at 120% of target)
% of salary
Chief executiveGroup operating profit 47.5% } 97.5% }Net promoter score 2.5% } 50% 2.5% } 100%Finance directorGroup operating profit 37.5% } 77.5% }Net promoter score 2.5% } 40% 2.5% } 80%
Long-term incentivesThe Group’s focus continues to be on generating positive returns for shareholders based upon sustainable growth in earnings per share and therefore the committee believes that long-term incentives offered to executives should be linked to earnings per share growth. The committee is of the view that targets should be robust, yet reasonably achievable.
Following a review by the committee of incentive arrangements for executives, at the Company’s 2010 annual general meeting shareholders approved a new ‘umbrella’ long-term incentive plan (“the 2010 LTIP”) to replace both the 2005 Long-Term Incentive Plan that expired in April 2010 (“the 2005 LTIP”) and the 2002 Executive Share Option Scheme (pursuant to which no awards had been made since 2006 and which in any event was due to expire in 2012).

61The Rank Group Plc: Annual report and financial statements 2010
All outstanding awards under the 2005 LTIP and the 2010 LTIP have absolute adjusted EPS as the primary measure with absolute adjusted EPS targets for both threshold and maximum vesting, pro-rated for performance at intermediate points between threshold and maximum. The choice of absolute adjusted EPS by the committee as the primary measure reflects in part Rank’s specialist sector and few publicly quoted direct competitors which make the selection of a relevant comparison problematic. However, when determining whether or not an award should vest, the committee also takes into account total shareholder return (“TSR”) over the performance period against the FTSE-350.
The remuneration committee recognises that some shareholders have concerns over the use of absolute adjusted EPS and wish to ensure that EPS provides a robust and transparent measure of executive performance which is well aligned with shareholder value creation. The remuneration committee believes that it is important that measures continue to be relevant and motivational and is of the view that EPS is the most appropriate measure for Rank’s long-term incentives at the present time.
The remuneration and audit committees will continue work to ensure the principles for fair treatment of exceptional items in the performance period are applied, the principle being that any adjustments make the measure no less stretching for the executives and are linked closely to the creation of shareholder value.
Targets for individual awards are set against a number of factors including analysts’ consensus forecasts for the Rank Group, rates of inflation, interest rates, the general economic environment and the expected impact of legislation.
The rules of the 2005 LTIP provide that the committee shall, as soon as possible after the expiry of the performance period, determine whether the awards should vest and if the committee so determines, the awards vest immediately upon such determination. The rules of the 2010 LTIP provide that awards vest as soon as practicable following the third anniversary of the date of grant.
Active LTIP awards and targets as at 31 December 20102007 award
4yr (2010 EPS target)2008 award
3yr (2010 EPS target)2009 award
3yr (2011 EPS target)2010 award
3yr (2012 EPS target)
Plan 2005 LTIP 2005 LTIP 2005 LTIP 2010 LTIPDate of grant 15 May 07 10 Sep 08 02 Sep 09 Various**Award size (% of base salary) 50% 100% 50% 75%Threshold vesting % 30% 30% 30% 25%Minimum EPS (threshold vest) 9.0p 6.0p 7.5p 9.5pMaximum EPS (100% vest) 12.0p 10.0p 8.5p 11.5pMean consensus EPS forecast prior to grant n/a* 6.2p 7.1p 9.5p
* There were no EPS consensus forecasts for 2010 as at the date of grant and therefore the minimum and maximum vesting targets were set at just over 15% ahead of those for the 2007 3-year award.
** The grant dates were 22 April 2010, 10 May 2010 and 1 August 2010.
The executive directors’ interests in the 2005 LTIP and the 2010 LTIP are detailed on Table 3, page 65.
LTIP awards with a performance period ended on 31 December 2010Following the year end, the committee considered whether the 2007 four-year and 2008 three-year awards should vest.
2007 award 4yr (2010 EPS target)
2008 award 3yr (2010 EPS target)
Minimum adjusted EPS (30% vest) 9.0p 6.0pMaximum adjusted EPS (100% vest) 12.0p 10.0pActual adjusted 2010 EPS 10.2p 10.2pPerformance period 01 Jan 07 to
31 Dec 1001 Jan 08 to
31 Dec 10
The committee decided that it would not be appropriate for any part of the four-year 2007 LTIP award to vest. Whilst, on the basis of the adjusted EPS measure alone, 58% of the award was due to vest, the committee considered the Group’s four-year TSR performance over the same period. Given Rank’s performance, relative to the FTSE-350, the committee was of the view that it was inappropriate for any part of the award to vest.
With regard to the three-year 2008 LTIP award, on the basis of the EPS measure, 100% of the award was eligible to vest and given the Group’s significantly improved three-year TSR performance over the same period, relative to the FTSE-350, the committee was of the view that the award should vest in full. On vesting, sufficient shares will be sold in order to meet the associated income tax and national insurance obligations and executives will be expected to retain the balance until they achieve and maintain their shareholding guideline for so long as they are employed by Rank in order to align their personal interests with those of Rank’s shareholders.

62 The Rank Group Plc: Annual report and financial statements 2010
Directors’ report: Remuneration report continued
LTIP awards made in 2010Following approval by shareholders of the 2010 LTIP at the annual general meeting in April 2010, a performance share award was made to the chief executive, finance director and other members of the executive committee.
2010 award 3yr (2012 EPS target)
Date of grant 22 Apr 10**Award size (% of base salary) 75%Threshold vesting percentage 25%Minimum EPS (threshold vest) 9.5pMaximum EPS (100% vest) 11.5pMean consensus EPS forecast prior to grant 9.5p
** Awards were made on 10 May 2010 and 1 August 2010 to two new members of the executive committee.
Summary of executive directors’ terms and remuneration The table below summarises the executive directors’ terms of appointment and remuneration in 2010.
Name Ian Burke Paddy GallagherPosition Chief executive Finance directorDate of appointment 6 March 2006 2 June 2008Notice period 12 months 12 monthsFixed remunerationBase salary £525,300 £300,000Pension £183,855 (35% of base salary) £44,246 (less LEL)Car allowance £18,500 £12,750Benefits £20,579 £10,045Performance based remunerationShort-term incentives – annual cash bonus £333,566 earned out of a maximum
opportunity of 100% of base salary£151,500 earned out of a maximum opportunity of 80% of base salary
Long-term incentives – restricted share awards made in 2010
Restricted share award equivalent to 75% of base salary with a three-year performance period ending 31 December 2012
Restricted share award equivalent to 75% of base salary with a three-year performance period ending 31 December 2012
Expected value of 38% of base salary Expected value of 38% of base salary
Comparison of fixed and variable payThe committee believes that performance-related pay should make up a significant element of the executive remuneration package and that, with executive shareholding requirements, this is the most appropriate way to motivate and reward people for meeting our short-term and long-term goals.
Chief executive Finance director
Fixed STI LTI Fixed STI LTI
2011 percentage breakdown of target remuneration 49% base salary
and 7% pension
20% 24% 43% base salary
and 15% pension
21% 21%
The committee considers the mix between fixed and variable pay to be appropriate and it continues to review this on an ongoing annual basis in the light of both market data and other internal factors.

63The Rank Group Plc: Annual report and financial statements 2010
Executive directors’ shareholdingsOur guidelines for executive shareholding are set as a percentage of base salary and are:
Chief executive 150%Finance director 100%Other executive committee members 50%
All executives are allowed five years from appointment to build up this level of share ownership.
Name Date of joining
No. of shares as at 31 Dec 10 and
21 Feb 11
Value of shares as at 21 Feb 11
Percentage of base gross salary as at
21 Feb 11
Value of shares as at
acquisition date(s)
Percentage of base gross salary as at
21 Feb 11
Chief executive 06.03.2006 260,553 £335,071 63.79% £267,053 50.84%Finance director 02.06.2008 160,000 £205,760 68.59% £96,064 32.02%
When the shareholding guidelines were originally set by the committee in 2007, the intention had been that shareholdings would be built up by retaining shares received under the Group’s share based long-term incentive arrangements. No such awards have vested since the 2002 award partly vested in 2005.
However, following the vesting of the 2008 three-year LTIP award, the chief executive’s total shareholding in Rank will be 587,406 with a market value (using Rank’s closing share price as at 21 February 2011 of 128.6p) of £755,404, representing more than 143% of his base salary. In the case of the finance director, his total shareholding in Rank immediately following the vesting of the 2008 three-year award will be 346,666 with a market value on 21 February 2011 of £445,812, representing more than 148% of his base salary.
The Rank Group Employee Benefit Trust (“The Trust”) holds shares to satisfy the vesting of LTIP awards. Executive directors are deemed to have an interest in the ordinary shares of the Company held by the Trust. As at each of 1 January 2010, 31 December 2010 and the date of this report, the Trust held 1,059,826 ordinary 138/9p shares.
Periodically, an estimate is made of the awards likely to vest in future and shares are purchased for that purpose.
Rank’s five-year TSR performanceThe Company’s TSR performance (shown in black on the chart below) compared with the FTSE-350 index (excluding investment companies) for the five years to 31 December 2010 is shown below. The committee has selected this index as the Company was a constituent of the FTSE-350 for the majority of this period.
Value of hypothetical £100 holding(Five years)
0255075100125150
100908070605Rank FTSE 350

64 The Rank Group Plc: Annual report and financial statements 2010
Directors’ report: Remuneration report continued
Audited information
Table 1: Directors’ remuneration summary
The detailed emoluments received by the directors for 2010 are shown below with the annual rate of base pay from 1 January 2011:
Base salary/fees
£000
Committee chair/SID
fees £000
Benefits £000
Expense allowances (including
car allowance)
£000
Annual bonus £000
SIPP/DC pension/
salary supplement
£000Termination
benefits
Total remuneration Annual rate of basic
pay from 01 Jan 2011
£000
Total 2010 £000
Total 2009 £000
Chairman: Peter Johnson 150 – – 10 – – – 160 160 158Executive directors: Ian Burke 525 – 21 19 334 184 – 1,083 1,110 525Paddy Gallagher 300 – 10 13 152 44 – 519 530 300Peter Gill (note 1) – – – – – – – – 112 –Non-executive directors: Richard Greenhalgh 38 10 – – – – – 48 48 40Owen O’Donnell 38 – – – – – – 38 38 40Tim Scoble (note 2) 38 – – – – – – 26 – 40Bill Shannon 38 – – – – – – 38 38 40Mike Smith (note 2) 38 – – – – – – 26 – 40John Warren 38 9 – – – – – 47 47 40Total 1,203 19 31 42 486 228 – 1,985 2,083 1,223
Notes: 1 Peter Gill left the Company on 1 June 2008. The payment made to him in 2009 represented payment for the balance of his notice period.2 Tim Scoble and Mike Smith were appointed as non-executive directors by shareholders at the Company’s annual general meeting on 22 April 2010. They are appointees of Guoco
Group Limited (“Guoco”), a parent company of Rank’s largest shareholder. Mr Scoble’s fees are paid to his employer, Guoman Hotels Management (UK) Limited, an indirect subsidiary of Guoco. Mr Smith’s fees are paid to his employer, Clermont Leisure (UK) Limited, also an indirect subsidiary of Guoco.
3 In addition to the above, the widow of John Garrett, a former executive director, received £38,306 (2009: £37,658) in respect of an unfunded pension obligation.
Table 2: Executive directors’ interests in options
SchemeDate
of grant
Exercise price
(p)Number at
01 Jan 2010
Number granted during
2010
Number (lapsed)
during 2010
Number at 31 Dec
2010
Earliest exercise
dateExercise period
end date
Ian Burke SAYE 03 Oct 2007 139.00 6,906 – – 6,906 01 Dec 2010 31 May 2011Paddy Gallagher – – – – – – – – –

65The Rank Group Plc: Annual report and financial statements 2010
Table 3: Executive directors’ interests in long-term incentive plans
Plan Date of award
Market price at award
(p)
Market price at release
(p)
Number at 01 Jan 2010
Number awarded
during 2010
Number (vested)
during 2010
Number (lapsed)
during 2010
Number at 31 Dec
2010
Status/Performance
period ending 31 Dec
Ian Burke 2005 LTIP 15 May 2007 195.50 – 134,271 – – (134,271) – Lapsed2005 LTIP 15 May 2007 195.50 – 134,271 – – – 134,271 2010
(note 2)2005 LTIP 10 Sep 2008 78.75 – 667,047 – – – 667,047 2010
(note 3)2005 LTIP 02 Sep 2009 77.75 – 337,813 – – – 337,813 20112010 LTIP 22 Apr 2010 117.90 – – 334,160 – – 334,160 2012
Paddy Gallagher 2005 LTIP 10 Sep 2008 78.75 – 380,952 – – – 380,952 2010(note 3)
2005 LTIP 02 Sep 2009 77.75 – 192,926 – – – 192,926 20112010 LTIP 22 Apr 2010 117.90 – – 190,840 – – 190,840 2012
Peter Gill (note 1) 2005 LTIP 15 May 2007 195.50 – 95,887 – – (95,887) – Lapsed2005 LTIP 15 May 2007 195.50 – 95,887 – – – 95,887 2010
(note 2)
Notes1 Peter Gill left the Company on 1 June 2008.2 At its meeting in February 2011, the committee determined that the award would not vest. For further information, please see page 61.3 At its meeting in February 2011, the committee determined that the award would vest in full. For further information, please see page 61.4 No variation was made to the terms of any LTIP awards during the year.
By order of the board
Frances Bingham Company secretary 24 February 2011

66 The Rank Group Plc: Annual report and financial statements 2010
We have audited the financial statements of The Rank Group Plc for the year ended 31 December 2010 which comprise the Group income statement, the Group statement of comprehensive income, the Group and Company balance sheets, the Group and Company statements of changes in equity, the Group and Company statements of cash flow, and the related notes 1 to 34. The financial reporting framework that has been applied in their preparation is applicable law and International Financial Reporting Standards (IFRSs) as adopted by the European Union and, as regards the Company financial statements, as applied in accordance with the provisions of the Companies Act 2006.
This report is made solely to the Company’s members, as a body, in accordance with Chapter 3 of Part 16 of the Companies Act 2006. Our audit work has been undertaken so that we might state to the Company’s members those matters we are required to state to them in an auditor’s report and for no other purpose. To the fullest extent permitted by law, we do not accept or assume responsibility to anyone other than the Company and the Company’s members as a body, for our audit work, for this report, or for the opinions we have formed.
Respective responsibilities of directors and auditorAs explained more fully in the directors’ responsibilities statement set out on page 55, the directors are responsible for the preparation of the financial statements and for being satisfied that they give a true and fair view. Our responsibility is to audit and express an opinion on the financial statements in accordance with applicable law and International Standards on Auditing (UK and Ireland). Those standards require us to comply with the Auditing Practices Board’s Ethical Standards for Auditors.
Scope of the audit of the financial statementsAn audit involves obtaining evidence about the amounts and disclosures in the financial statements sufficient to give reasonable assurance that the financial statements are free from material misstatement, whether caused by fraud or error. This includes an assessment of: whether the accounting policies are appropriate to the Group’s and the Company’s circumstances and have been consistently applied and adequately disclosed; the reasonableness of significant accounting estimates made by the directors; and the overall presentation of the financial statements.
Opinion on financial statementsIn our opinion:
– The financial statements give a true and fair view of the state of the Group’s and of the Company’s affairs as at 31 December 2010 and of the Group’s profit for the year then ended;
– The Group financial statements have been properly prepared in accordance with IFRSs as adopted by the European Union;
– The Company financial statements have been properly prepared in accordance with IFRSs as adopted by the European Union and as applied in accordance with the provisions of the Companies Act 2006; and
– The financial statements have been prepared in accordance with the requirements of the Companies Act 2006 and, as regards the Group financial statements, Article 4 of the IAS Regulation.
Opinion on other matters prescribed by the Companies Act 2006In our opinion:
– The part of the directors’ remuneration report to be audited has been properly prepared in accordance with the Companies Act 2006; and
– The information given in the directors’ report for the financial year for which the financial statements are prepared is consistent with the financial statements.
Matters on which we are required to report by exceptionWe have nothing to report in respect of the following:
Under the Companies Act 2006 we are required to report to you if, in our opinion:
– Adequate accounting records have not been kept by the Company, or returns adequate for our audit have not been received from branches not visited by us; or
– The Company financial statements and the part of the directors’ remuneration report to be audited are not in agreement with the accounting records and returns; or
– Certain disclosures of directors’ remuneration specified by law are not made; or
– We have not received all the information and explanations we require for our audit.
Under the Listing Rules we are required to review:
– The directors’ statement, set out on page 55, in relation to going concern;
– The part of the corporate governance statement relating to the Company’s compliance with the nine provisions of the June 2008 Combined Code specified for our review; and
– Certain elements of the report to shareholders by the board on directors’ remuneration.
Iain Wilkie (Senior statutory auditor)for and on behalf of Ernst & Young LLP, Statutory Auditor1 More London Place, London SE1 2AF24 February 2011
INDEPENDENT AUDITORS’ REPORT TO THE MEMBERS OF THE RANK GROUP PLC
Statutory reports and financial statements: Independent auditors’ report

67The Rank Group Plc: Annual report and financial statements 2010
GROUP INCOME STATEMENT for the year ended 31 December 2010
2010 2009
Note
Beforeexceptional
items£m
Exceptionalitems
(note 4)£m
Total£m
Before exceptional
items £m
Exceptionalitems
(note 4)£m
Total£m
Continuing operations Revenue before adjustment for free bets, promotions and customer bonuses 2 567.8 – 567.8 540.0 – 540.0Free bets, promotions and customer bonuses 2 (23.3) – (23.3) (19.5) – (19.5) Revenue 2 544.5 – 544.5 520.5 – 520.5Cost of sales 2 (296.1) – (296.1) (278.4) – (278.4)Gross profit 248.4 – 248.4 242.1 – 242.1Other operating costs 2 (186.4) (25.1) (211.5) (184.1) (0.5) (184.6)Other operating income 4 – 38.5 38.5 – 3.3 3.3Group operating profit 2,3 62.0 13.4 75.4 58.0 2.8 60.8Financing: – finance costs (7.5) – (7.5) (10.9) – (10.9)– finance income 0.5 5.6 6.1 0.9 – 0.9– other financial (losses) gains (0.5) – (0.5) 1.2 – 1.2Total net financing (charge) income 5 (7.5) 5.6 (1.9) (8.8) – (8.8)Profit before taxation 54.5 19.0 73.5 49.2 2.8 52.0Taxation 6 (16.3) (8.3) (24.6) (14.3) 0.2 (14.1)Profit for the year from continuing operations 38.2 10.7 48.9 34.9 3.0 37.9 Discontinued operations – 4.3 4.3 – 0.6 0.6 Profit for the year 38.2 15.0 53.2 34.9 3.6 38.5
Attributable to: Equity holders of the parent 38.2 15.0 53.2 34.9 3.6 38.5
Earnings per share attributable to equity shareholders – basic 9 9.8p 3.9p 13.7p 9.0p 0.9p 9.9p– diluted 9 9.8p 3.8p 13.6p 9.0p 0.9p 9.9pEarnings per share – continuing operations – basic 9 9.8p 2.8p 12.6p 9.0p 0.7p 9.7p– diluted 9 9.8p 2.7p 12.5p 9.0p 0.7p 9.7pEarnings per share – discontinued operations – basic 9 – 1.1p 1.1p – 0.2p 0.2p– diluted 9 – 1.1p 1.1p – 0.2p 0.2p
Details of dividends paid and payable to equity shareholders are disclosed in note 8.
Financial statements
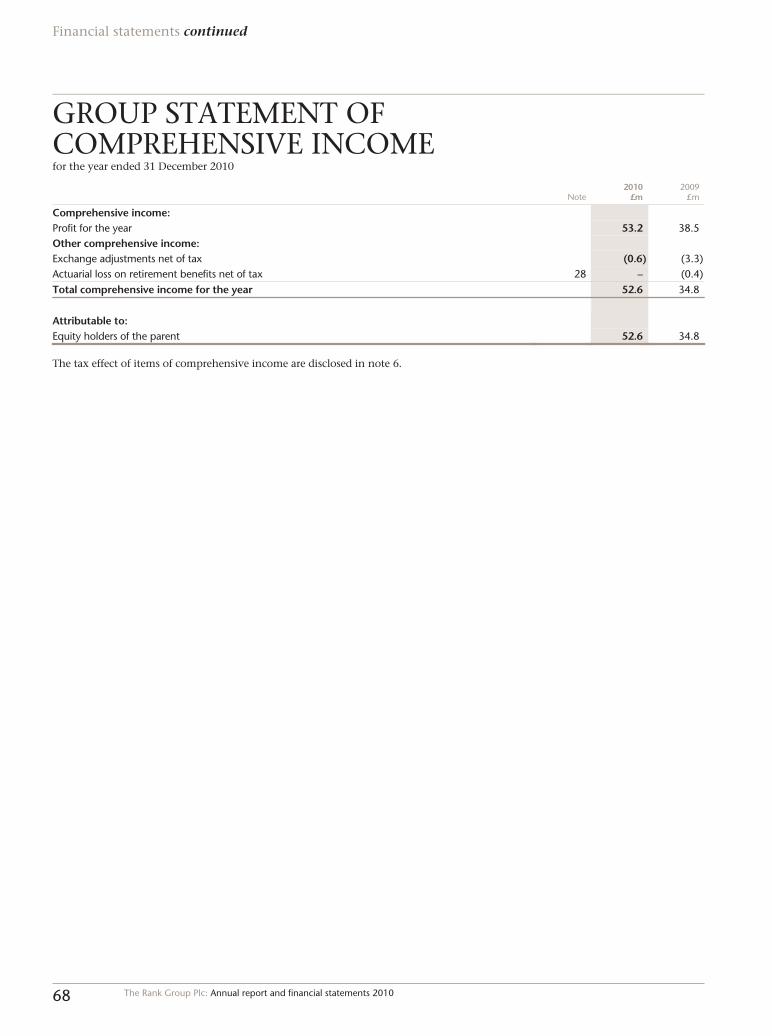
68 The Rank Group Plc: Annual report and financial statements 2010
Financial statements continued
GROUP STATEMENT OF COMPREHENSIVE INCOME for the year ended 31 December 2010
Note 2010
£m 2009
£m
Comprehensive income: Profit for the year 53.2 38.5Other comprehensive income: Exchange adjustments net of tax (0.6) (3.3)Actuarial loss on retirement benefits net of tax 28 – (0.4)Total comprehensive income for the year 52.6 34.8
Attributable to: Equity holders of the parent 52.6 34.8
The tax effect of items of comprehensive income are disclosed in note 6.

69The Rank Group Plc: Annual report and financial statements 2010
BALANCE SHEETS at 31 December 2010
Group Company
Note 2010
£m 2009
£m 2010
£m 2009
£m
Assets Non-current assets Intangible assets 10 167.4 178.0 – –Property, plant and equipment 11 203.0 187.5 – –Investments in subsidiaries 13 – – 1,027.6 1,026.3Deferred tax assets 20 22.1 23.5 0.4 –Trade and other receivables 15 2.1 2.1 – – 394.6 391.1 1,028.0 1,026.3Current assets Inventories 14 3.4 3.7 – –Trade and other receivables 15 27.0 26.0 43.6 43.6Income tax receivable 17 0.2 0.4 – –Cash and short-term deposits 25 74.0 64.1 – – 104.6 94.2 43.6 43.6Total assets 499.2 485.3 1,071.6 1,069.9 Liabilities Current liabilities Trade and other payables 16 (98.0) (105.9) (707.1) (752.7)Income tax payable 17 (28.5) (26.3) – –Financial liabilities – financial guarantees 29 – – (0.1) (1.4)– loans and borrowings 18 (8.1) (7.8) – –Provisions 21 (6.8) (9.0) – – (141.4) (149.0) (707.2) (754.1) Net current liabilities (36.8) (54.8) (663.6) (710.5) Non-current liabilities Trade and other payables 16 (0.2) (0.3) – –Income tax payable 17 (35.6) (18.5) – –Financial liabilities – loans and borrowings 18 (189.4) (242.3) – –Deferred tax liabilities 20 (6.1) (6.3) – –Provisions 21 (45.8) (34.6) – –Retirement benefit obligations 28 (3.0) (2.9) – – (280.1) (304.9) – –Total liabilities (421.5) (453.9) (707.2) (754.1) Net assets 77.7 31.4 364.4 315.8
Capital and reserves attributable to the Company’s equity shareholders Share capital 22 54.2 54.2 54.2 54.2Share premium 98.2 98.2 98.2 98.2Capital redemption reserve 33.4 33.4 33.4 33.4Exchange translation reserve 14.5 15.1 – –Retained (losses) earnings (122.6) (169.5) 178.6 130.0Total shareholders’ equity 77.7 31.4 364.4 315.8
These financial statements were approved by the Board on 24 February 2011 and signed on its behalf by:
Ian Burke, Paddy Gallagher, chief executive finance director
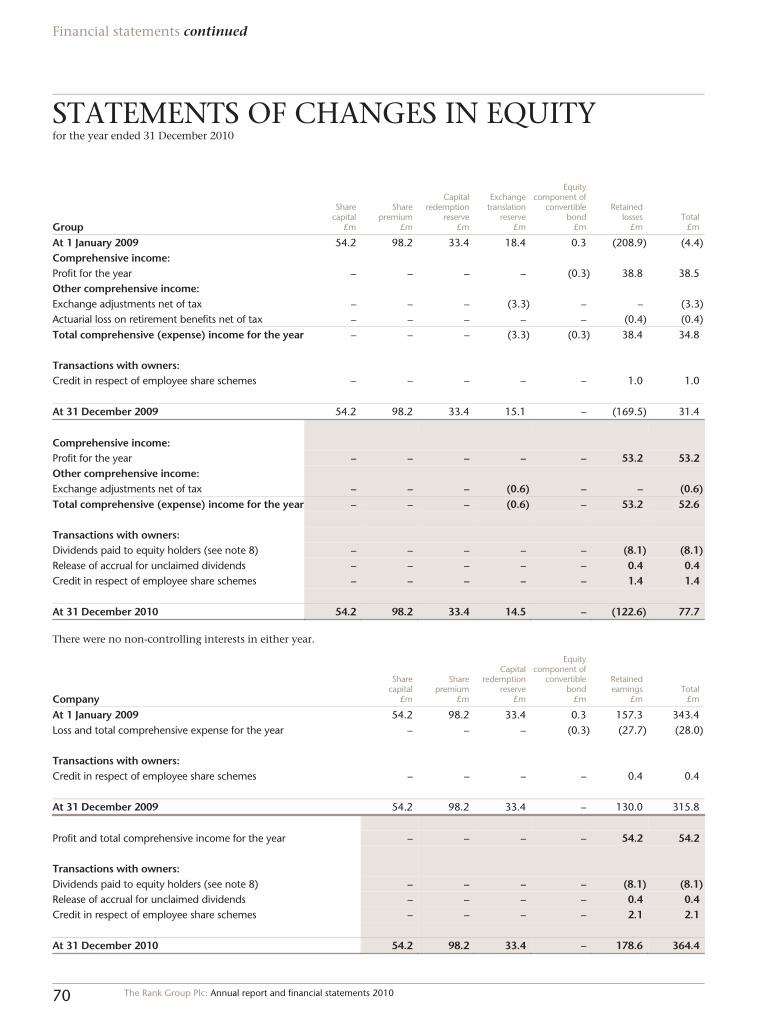
70 The Rank Group Plc: Annual report and financial statements 2010
Financial statements continued
STATEMENTS OF CHANGES IN EQUITY for the year ended 31 December 2010
Group
Sharecapital
£m
Sharepremium
£m
Capitalredemption
reserve£m
Exchangetranslation
reserve£m
Equity component of
convertible bond
£m
Retained losses
£m Total
£m
At 1 January 2009 54.2 98.2 33.4 18.4 0.3 (208.9) (4.4)Comprehensive income: Profit for the year – – – – (0.3) 38.8 38.5Other comprehensive income: Exchange adjustments net of tax – – – (3.3) – – (3.3)Actuarial loss on retirement benefits net of tax – – – – – (0.4) (0.4)Total comprehensive (expense) income for the year – – – (3.3) (0.3) 38.4 34.8 Transactions with owners: Credit in respect of employee share schemes – – – – – 1.0 1.0 At 31 December 2009 54.2 98.2 33.4 15.1 – (169.5) 31.4
Comprehensive income: Profit for the year – – – – – 53.2 53.2Other comprehensive income: Exchange adjustments net of tax – – – (0.6) – – (0.6)Total comprehensive (expense) income for the year – – – (0.6) – 53.2 52.6 Transactions with owners: Dividends paid to equity holders (see note 8) – – – – – (8.1) (8.1)Release of accrual for unclaimed dividends – – – – – 0.4 0.4Credit in respect of employee share schemes – – – – – 1.4 1.4 At 31 December 2010 54.2 98.2 33.4 14.5 – (122.6) 77.7
There were no non-controlling interests in either year.
Company
Sharecapital
£m
Sharepremium
£m
Capitalredemption
reserve£m
Equity component of
convertible bond
£m
Retained earnings
£m Total
£m
At 1 January 2009 54.2 98.2 33.4 0.3 157.3 343.4Loss and total comprehensive expense for the year – – – (0.3) (27.7) (28.0) Transactions with owners: Credit in respect of employee share schemes – – – – 0.4 0.4 At 31 December 2009 54.2 98.2 33.4 – 130.0 315.8
Profit and total comprehensive income for the year – – – – 54.2 54.2 Transactions with owners: Dividends paid to equity holders (see note 8) – – – – (8.1) (8.1)Release of accrual for unclaimed dividends – – – – 0.4 0.4Credit in respect of employee share schemes – – – – 2.1 2.1 At 31 December 2010 54.2 98.2 33.4 – 178.6 364.4

71The Rank Group Plc: Annual report and financial statements 2010
STATEMENTS OF CASH FLOW for the year ended 31 December 2010
Group Company
Note 2010
£m 2009
£m 2010
£m 2009
£m
Cash flows from operating activities Cash generated from operations 23 119.5 69.7 – 0.1Interest received 6.6 7.9 – –Interest paid (5.1) (11.4) – (3.0)Dividend received from subsidiary undertaking – – 77.5 –Tax (paid) received (0.8) 4.3 – –Net cash from (used in) operating activities 120.2 70.5 77.5 (2.9) Cash flows from investing activities Acquisition of businesses including deferred consideration 24 (0.1) (0.3) – –Disposal of business 24 0.9 – – –Net payments in respect of hedges – (5.2) – –Purchase of intangible assets (6.8) (3.6) – –Purchase of property, plant and equipment (43.4) (30.7) – –Proceeds from sale of property, plant and equipment 0.1 1.6 – –Net cash used in investing activities (49.3) (38.2) – – Cash flows from financing activities Dividends paid to equity holders 8 (8.1) – (8.1) –Repayment of Sterling borrowings – (158.2) – (158.2)Repayment of syndicated facilities (50.9) (21.8) – –Repayment of other facilities – (2.0) – –Drawdown on syndicated facilities – 101.2 – –Drawdown on other facilities – 2.0 – –Finance lease principal payments (1.0) (0.7) – –Amounts repaid to subsidiaries – – (77.5) –Amounts received from subsidiaries – – 8.1 161.1Net cash (used in) from financing activities (60.0) (79.5) (77.5) 2.9 Net increase (decrease) in cash, cash equivalents and bank overdrafts 10.9 (47.2) – –Effect of exchange rate changes (0.2) (0.8) – –Cash and cash equivalents at 1 January 56.8 104.8 – –Cash and cash equivalents at 31 December 25 67.5 56.8 – –

72 The Rank Group Plc: Annual report and financial statements 2010
Financial statements: Notes to the financial statements
NOTES TO THE FINANCIAL STATEMENTS
1 General information and accounting policies General information The Rank Group Plc (‘the Company’) and its subsidiaries (together ‘the Group’) operate gaming and betting services in Great Britain (including the Channel Islands), Spain and Belgium and provide business services to gaming operators in a number of additional markets.
The Company is a public limited company which is listed on the London Stock Exchange and is incorporated and domiciled in England and Wales under registration number 03140769. The address of its registered office is Statesman House, Stafferton Way, Maidenhead, Berkshire, SL6 1AY.
Summary of significant accounting policies The principal accounting policies applied in the preparation of these consolidated financial statements are set out below. These policies have been consistently applied to all years presented, unless otherwise stated.
1.1 Basis of preparation The consolidated and Company financial statements have been prepared under the historical cost convention, as modified by the revaluation of financial assets and financial liabilities (including derivative instruments) at fair value through profit or loss.
1.1.1 Statement of compliance The consolidated and Company financial statements have been prepared in accordance with International Financial Reporting Standards (‘IFRS’) and IFRIC Interpretations as adopted by the European Union, and the Companies Act 2006 applicable to companies reporting under IFRS.
1.1.2 Going concern In adopting the going concern basis for preparing the consolidated financial statements, the directors have considered the issues impacting the Group during 2010 as detailed in the directors’ report on pages 1 to 41 and have reviewed the Group’s projected compliance with its banking covenants detailed in the finance review on page 36. Based on the Group’s cash flow forecasts and operating budgets, and assuming that trading does not deteriorate considerably from current levels, the directors believe that the Group will generate sufficient cash to meet its borrowing requirements for at least the next 12 months and comply with its banking covenants.
1.1.3 Accounting estimates and judgements The preparation of financial statements in conformity with IFRS requires the use of certain critical accounting estimates. It also requires management to exercise its judgement in the process of applying the Group’s accounting policies. The resulting accounting estimates will, by definition, seldom equal the actual results. The areas involving a higher degree of judgement or complexity, where assumptions and estimates are significant to the consolidated financial statements, are set out below.
(a) Estimated impairment of intangible assets and property, plant and equipment The Group tests annually whether assets that have an indefinite useful life, including goodwill and gaming licences, have suffered any impairment. The Group also reviews assets that are subject to amortisation or depreciation for events or changes in circumstances that indicate the carrying amount of the asset may not be recoverable. Further details of the Group’s accounting policy in relation to impairment are disclosed in note 1.14.
The application of the policy requires the use of accounting estimates and judgements in determining the recoverable amount of cash-generating units to which the intangible assets and property, plant and equipment are associated. The recoverable amount is the higher of the fair value less costs to sell and value in use. Estimates of fair value less costs to sell are performed internally by experienced senior management supported by knowledge of similar transactions and advice from external estate agents or, if applicable, offers received. Value in use is calculated using estimated cash flow projections from financial budgets, discounted by selecting an appropriate rate for each cash-generating unit. Further details of the assumptions and estimates are disclosed in note 12.
(b) Classification of casino and other gaming licences as intangible assets with an indefinite life As disclosed in note 1.12 certain casino and other gaming licences have been classified as intangible assets with an indefinite life. This assumption is based on management’s belief that there is no foreseeable limit to the period over which the licences are expected to generate net cash inflows and that each licence holds a value outside the property in which it resides. As a consequence, each licence is reviewed annually for impairment.
(c) Recoverability of deferred tax assets Deferred tax assets are recognised to the extent that it is probable future taxable profit will be available against which the temporary differences can be utilised. The key area of judgement is therefore an assessment of whether it is probable that there will be suitable taxable profits against which any deferred tax assets can be utilised. Further details of deferred tax assets recognised are disclosed in note 20.
(d) Income taxes The Group is subject to income taxes in numerous jurisdictions, including jurisdictions from now discontinued operations. There are many transactions and calculations for which the ultimate tax determination is uncertain. The Group recognises liabilities for anticipated tax audit issues based on estimates of whether additional taxes will be due. Where the final outcome of these matters is different from the amount recognised, such differences will impact the financial statements in the period such determination is made.
(e) Provisions Provisions are recognised in accordance with the policy disclosed in note 1.10. In calculating onerous property lease provisions, estimates are made of the discounted cash flows derived from the property and its associated operations including sub-let income. Estimates have also been made in determining the amount and timing of disposal provisions, including legacy industrial disease and personal injury claims. Further details of provisions made are disclosed in note 21.

73The Rank Group Plc: Annual report and financial statements 2010
1 General information and accounting policies continued (f) Contingent assets and liabilities Management is required to apply judgement in assessing the probability of the occurrence or non-occurrence of one or more uncertain future events not wholly within the control of the Company. This judgement is supported by external advice and precedent case law where appropriate and is continually assessed to ensure that developments are appropriately reflected in the financial statements. Further details of contingent assets are disclosed in note 30 and contingent liabilities are disclosed in note 31.
1.1.4 Changes in accounting policy and disclosures (a) Standards, amendments and interpretations to existing standards adopted by the Group The following new standards and amendments to standards are mandatory for the first time for the financial year beginning 1 January 2010.
– IFRS 2 Share-based Payment (Amended) – The standard has been amended to clarify the accounting for group cash-settled share-based payment transactions. This amendment also supersedes IFRIC 8 and IFRIC 11. Although the adoption of this amendment did not have any impact on the financial position of the Group, it has resulted in an increase in the Company’s investments in subsidiary undertakings with a corresponding increase in equity. The impact of the adoption of the standard on prior years was not material.
– IFRS 3 Business Combinations (Revised) and IAS 27 Consolidated and Separate Financial Statements (Amended) – The revisions to the standards apply from 1 January 2010. IFRS 3 (Revised) introduces significant changes in the accounting for business combinations occurring after this date. Changes affect the valuation of non-controlling interests, the accounting for transaction costs, the initial recognition and subsequent measurement of contingent consideration and business combinations achieved in stages. These changes will impact the amount of goodwill recognised, the reported results in the period that an acquisition occurs and future reported results.
IAS 27 Consolidated and Separate Financial Statements (Amended) requires that a change in the ownership interest of a subsidiary (without loss of control) is accounted for as a transaction with owners in their capacity as owners. Therefore, such transactions will no longer give rise to goodwill, nor will they give rise to gains or losses. Furthermore, the amended standard changes the accounting for losses incurred by the subsidiary as well as the loss of control of a subsidiary.
The revisions will affect future acquisitions or loss of control of subsidiaries and transactions with non-controlling interests. The revisions have been applied prospectively and had no impact during the period.
– IAS 39 Financial Instruments: Recognition and Measurement – Eligible Hedged Items – The amendment addresses the designation of a one-sided risk in a hedged item, and the designation of inflation as a hedged risk or portion in particular situations. The amendment had no effect on the financial position or performance of the Group.
– IFRIC 17 Distribution of Non-cash Assets to Owners – The interpretation provides guidance on accounting for arrangements whereby an entity distributes non-cash assets to shareholders either as a distribution of reserves or as dividends. The interpretation had no effect on the financial position or performance of the Group.
– IFRIC 18 Transfers of Assets from Customers – The interpretation provides guidance on accounting for transfers of assets received from customers. The interpretation had no effect on the financial position or performance of the Group.
– Improvements to IFRSs (issued April 2009) – In April 2009 the second set of amendments to standards was issued, primarily with a view to removing inconsistencies and clarifying wording. The adoption of the amendments had no effect on the financial position or performance of the Group.
The Group has not early adopted any other standard, interpretation or amendment that was issued but is not yet effective.
(b) Standards, amendments and interpretations to existing standards that are not yet effective The following standards, amendments and interpretations to existing standards have been published and are mandatory for accounting periods beginning after 1 January 2010 or later periods, but they have not been early adopted by the Group:
– IAS 24 Related Party Disclosures (Amendment) – Effective 1 January 2011
– IAS 32 Financial Instruments: Presentation, Classification of Rights Issues – Effective 1 February 2010
– IFRIC 14 Prepayments of a Minimum Funding Requirement – Effective 1 January 2011
– IFRIC 19 Extinguishing Financial Liabilities with Equity Instruments – Effective 1 July 2010
– IFRS 9 Financial Instruments – Effective 1 January 2013
– Improvements to IFRSs (issued May 2010) – Effective either 1 July 2010 or 1 January 2011
It is not anticipated that the adoption of the above standards, amendments and interpretations of existing standards will have a material impact on the Group or Company financial statements in the period of initial application.
(c) Other future developments On 17 August 2010, the IASB and FASB released a joint exposure draft that would significantly change lease accounting for both lessees and lessors by requiring balance sheet recognition of all leases.
The majority of the Group’s properties are currently classified as operating leases and consequently the proposed changes would have a potential material impact on the balance sheet (with a grossing up of assets and liabilities upon recognition of the intangible asset and lease liability) and the income statement (with an increase in operating profit and finance costs). The Group currently recognises rental expenses under operating leases on a straight line basis within operating profit and provides additional disclosure of future minimum commitments under non-cancellable operating leases.

74 The Rank Group Plc: Annual report and financial statements 2010
Financial statements: Notes to the financial statements continued
1 General information and accounting policies continued It is not possible, at this time, to quantify the impact of the proposals as they have not yet been formalised and therefore, while the Group continues to monitor financial reporting developments and start preparations, the internal process for collating and calculating the impact has not commenced.
1.2 Consolidation Subsidiaries are entities over which the Group has the power to govern the financial and operating policies, generally accompanying a shareholding of more than one half of the voting rights. The existence and effect of potential voting rights that are currently exercisable or convertible are considered when assessing whether the Group controls another entity. All subsidiaries are fully consolidated from the date on which control is transferred to the Group. They are de-consolidated from the date that control ceases.
The purchase method of accounting is used to account for the acquisition of subsidiaries by the Group. The cost of an acquisition is measured as the fair value of the assets given, equity instruments issued and liabilities incurred or assumed at the date of exchange. Prior to 1 January 2010, the cost of acquisition also included costs directly attributable to the acquisition. Identifiable assets acquired, liabilities and contingent liabilities assumed in a business combination are measured initially at their fair values at the acquisition date, irrespective of the extent of any minority interest. The excess of the cost of acquisition over the fair value of the Group’s share of the identifiable net assets acquired is recorded as goodwill. If the cost of acquisition is less than the fair value of the net assets of the subsidiary acquired, the difference is recognised directly in the income statement.
Inter-company transactions, balances and unrealised gains on transactions between Group companies are eliminated. Unrealised losses are also eliminated unless the transaction provides evidence of an impairment of the asset transferred. Accounting policies as applied to subsidiaries have been changed where necessary to ensure consistency with the policies adopted by the Group.
The Group has no material associates or joint ventures.
1.3 Revenue recognition Revenue consists of the fair value of sales of goods and services net of VAT, rebates and discounts.
(a) Gaming win Revenue for casinos includes the gaming win before deduction of gaming duty. Revenue for bingo is net of prizes before deduction of gross profits tax. Revenue for Rank Interactive, including sports betting and interactive games, represents gaming win. All other revenue streams are stated net of VAT where applicable. The fair value of free bets, promotions and customer bonuses are also deducted from all revenue streams.
Although disclosed as revenue, gaming win is accounted for and meets the definition of a gain under IAS 39 Financial Instruments: Recognition and Measurement.
(b) Food and beverage Revenue from food and beverage sales is recognised at the point of sale.
(c) Finance income Interest income is recognised on a time proportion basis using the effective interest method.
1.4 Segment reporting Operating segments are reported in a manner consistent with the internal reporting provided to the chief operating decision maker. The chief operating decision maker, who is responsible for allocating resources and assessing performance of the operating segments, has been identified as the management team (the composition of which is disclosed on page 43) that makes strategic and operational decisions.
1.5 Foreign currency translation The consolidated financial statements are presented in UK Sterling, which is also the Company’s functional currency. Items included in the financial statements of each of the Group’s entities are measured using the currency of the primary economic environment in which the entity operates (‘the functional currency’).
(a) Transactions and balances Foreign currency transactions are translated into the functional currency using the exchange rates prevailing at the dates of the transactions. Foreign exchange gains and losses resulting from the settlement of such transactions and from the translation at year-end exchange rates of monetary assets and liabilities denominated in foreign currencies are recognised in the income statement in finance costs or income, except when deferred in equity where hedging criteria are met.
(b) Group companies The results and financial position of all the Group companies (none of which has the currency of a hyper-inflationary economy) that have a functional currency different from the presentation currency are translated into the presentation currency as follows:
(i) assets and liabilities for each balance sheet presented are translated at the closing rate on the balance sheet date. The closing euro rate against UK Sterling was 1.17 (2009: 1.13) and the closing US Dollar rate against UK Sterling was 1.57 (2009: 1.61);
(ii) income and expenses for each income statement are translated at average exchange rates unless this average is not a reasonable approximation of the cumulative effect of the rates prevailing on the transaction dates, in which case income and expenses are translated at the rates prevailing on the dates of the transactions. The average euro rate against UK Sterling was 1.17 (2009: 1.12) and the average US Dollar rate against UK Sterling in the year was 1.54 (2009: 1.57); and
(iii) all resulting exchange differences are recognised as a separate component of equity.

75The Rank Group Plc: Annual report and financial statements 2010
1 General information and accounting policies continued On consolidation, exchange differences arising from the translation of the net investment in foreign entities, and of borrowings and other currency instruments designated as hedges of such investments, are taken to shareholders’ equity. When a foreign operation is sold, such exchange differences are recognised in the income statement, net of hedging, as part of the gain or loss on sale. Goodwill and fair value adjustments arising on the acquisition of a foreign entity are treated as assets and liabilities of the foreign entity and translated at the closing rate.
1.6 Financial assets Financial assets within the scope of IAS 39 are classified as financial assets at fair value through profit or loss, loans and receivables, held to maturity investments, available for sale financial assets, or as derivatives designated as hedging instruments in an effective hedge, as appropriate. The Group determines the classification of its financial assets at initial recognition.
A financial asset is derecognised when the rights to receive the cash flows from the asset have expired, been transferred or an obligation to pay the cash flows received to a third party without material delay has been assumed, and either:
– Substantially all the risks and rewards of ownership have been transferred; or
– Substantially all the risks and rewards have neither been retained nor transferred, but control has been transferred.
The Group’s financial assets include loans and receivables and cash and cash equivalents.
(a) Loans and receivables Loans and receivables are non-derivative financial assets with fixed or determinable payments that are not quoted in an active market. They are included in current assets, except for maturities greater than 12 months after the balance sheet date. These are classified as non-current assets. Loans and receivables are classified as trade and other receivables in the balance sheet.
Trade receivables are recognised initially at fair value and subsequently measured at amortised cost using the effective interest method, less provision for impairment. A provision for impairment of trade receivables is established when there is objective evidence that the Group will not be able to collect all amounts due according to the original terms of the receivables. Significant financial difficulties of the debtor, probability that the debtor will enter bankruptcy or financial reorganisation, and default or delinquency in payments (more than 30 days overdue) are considered indicators that the trade receivable is impaired. The amount of the provision is the difference between the asset’s carrying amount and the present value of estimated future cash flows, discounted at the original effective interest rate. The carrying amount of the asset is reduced through the use of an allowance account, and the amount of the loss is recognised in the income statement within operating costs. When a trade receivable is uncollectible, it is written off against the allowance account for trade receivables. Subsequent recoveries of amounts previously written off are credited against operating costs in the income statement.
(b) Cash and cash equivalents Cash and short-term deposits in the balance sheet include cash at banks and in hand and short-term deposits with an original maturity of three months or less.
For the purpose of the cash flow statement, cash and cash equivalents consist of cash and short-term deposits as defined above, net of outstanding bank overdrafts. Bank overdrafts are shown within loans and borrowings in current liabilities on the balance sheet.
1.7 Financial liabilities Financial liabilities within the scope of IAS 39 are classified as financial liabilities at fair value through profit or loss, loans and borrowings, or as derivatives designated as hedging instruments in an effective hedge, as appropriate. The Group determines the classification of its financial liabilities at initial recognition.
A financial liability is derecognised when the obligation under the liability is discharged, cancelled or expires.
The Group’s financial liabilities include trade and other payables, loans and borrowings (including bank overdrafts), financial guarantee contracts and onerous contracts.
(a) Trade and other payables Trade payables are recognised initially at fair value and subsequently measured at amortised cost using the effective interest method.
(b) Loans and borrowings After initial recognition at fair value, interest bearing loans and borrowings are subsequently measured at amortised cost using the effective interest rate method. Gains and losses are recognised in the income statement when the liabilities are derecognised as well as through the effective interest rate method amortisation process.
Amortised cost is calculated by taking into account any discount or premium on acquisition and fees or costs that are an integral part of the effective interest rate method. The effective interest rate method amortisation is included in finance costs in the income statement.
The fair value of the liability portion of the convertible bond, which matured in January 2009, was determined on the date of issue. This amount was recorded as a liability and was held on an amortised cost basis until the redemption or maturity of the bonds. The remaining proceeds were allocated to the conversion option and were recognised in shareholders’ funds. This resulted in a higher interest cost over the life of the bond as an equal and opposite amount to the equity component was amortised through the income statement as a financing cost.
(c) Financial guarantee contracts (Company only) Financial guarantee contracts issued by the Company are those contracts that require a payment to be made to reimburse the holder for a loss it incurs because the specified debtor fails to make a payment when due in accordance with the terms of a debt instrument. Financial guarantee contracts are initially measured at fair value by applying the estimated probability of default to the cash outflow should default occur and subsequently amortising over the expected length of the guarantee.

76 The Rank Group Plc: Annual report and financial statements 2010
Financial statements: Notes to the financial statements continued
1 General information and accounting policies continued (d) Onerous contracts Details of the policy in respect of onerous contracts are disclosed in note 1.10.
1.8 Derivative financial instruments and hedging activities The Group held no derivative financial instruments at either reporting date.
The Group uses a loan as a hedge of its exposure to foreign exchange risk on its investments in foreign subsidiaries. The gains or losses on the hedging instrument relating to the effective portion of the hedge are recognised as other comprehensive income while any gains or losses relating to the ineffective portion are recognised in the income statement. On disposal of the foreign operation, the cumulative value of any such gains or losses recorded in equity is transferred to the income statement. Further details are disclosed in note 19.
1.9 Leases Leases are tested at inception to determine whether the lease is a finance or operating lease and treated accordingly. For leases entered into prior to 1 January 2005, inception is deemed to be 1 January 2005 in accordance with the transitional requirements of IFRIC 4. Property leases comprising a lease of land and a lease of buildings within a single contract are split into its two component parts before testing.
(a) Finance leases Leases of property, plant and equipment which transfer substantially all the risks and rewards of ownership to the Group are classified as finance leases. Finance leases are capitalised at the inception of the lease at the lower of the fair value of the leased property, plant and equipment or the present value of minimum lease payments. Each lease payment is allocated between the liability and finance charges so as to achieve a constant periodic rate of interest on the remaining balance of the liability for each period. The corresponding rental obligations, net of finance charges, are included in loans and borrowings. Finance charges are recognised in the income statement. The property, plant and equipment acquired under finance leases are depreciated over the shorter of the useful life of the asset or the lease term.
(b) Operating leases Leases of property, plant and equipment which do not transfer substantially all the risks and rewards of ownership to the Group are classified as operating leases. Operating lease payments (including any lease incentives or premiums) are recognised as an expense in the income statement on a straight line basis over the lease term.
1.10 Provisions Provisions are recognised when the Group has a present legal or constructive obligation as a result of past events if it is more likely than not that an outflow of resources will be required to settle the obligation and the amount can be reliably estimated. Provisions are measured at the best estimate of the expenditures required to settle the obligation. If the effect of the time value of money is material, provisions are discounted using a pre-tax rate that reflects, where appropriate, the risks specific to the liability. Where discounting is used, the increase in the provision due to passage of time is recognised as a finance cost.
(a) Onerous contracts The Group is party to a number of leasehold property contracts. Provision has been made against those leases where the property is now vacant and the unavoidable costs under the lease exceed the economic benefit expected to be derived from potential sub-letting arrangements. Provision has also been made against leases where impairment testing has indicated that, after recognising an impairment charge, the estimated discounted cash flows derived from the property and its associated operations are insufficient to cover the unavoidable lease costs and the lease is therefore deemed onerous.
(b) Provision on disposal Following the disposal of an operation, provision is made for the estimated future costs attributable to the disposal.
1.11 Property, plant and equipment Property, plant and equipment is stated at cost, net of accumulated depreciation and impairment. Such cost includes expenditure that is directly attributable to the acquisition of the items. Subsequent costs are included in the asset’s carrying amount or recognised as a separate asset, as appropriate, only when it is probable that future economic benefits associated with the item will flow to the Group and the cost of the item can be measured reliably. All other repairs and maintenance are charged to the income statement during the financial period in which they are incurred.
Depreciation is calculated on assets using the straight line method to allocate their cost less residual values over their estimated useful lives, as follows:
– freehold and leasehold property 50 years or lease term if less
– refurbishment of property five to 20 years
– fixtures, fittings, plant and machinery three to 20 years
Land is not depreciated.
Residual values and useful lives are reviewed at each balance sheet date, and adjusted prospectively, if appropriate.
An item of property, plant and equipment is derecognised upon disposal or when no future economic benefits are expected from its use or disposal. Any gain or loss on arising on derecognition of the asset (calculated as the difference between the net disposal proceeds and the carrying amount of the asset) is included in the income statement.
Pre-opening costs are expensed to the income statement as incurred.
1.12 Intangible assets (a) Goodwill Goodwill represents the excess of the cost of an acquisition over the fair value of the Group’s share of the net identifiable assets of the acquired subsidiary at the date of acquisition. Goodwill on acquisitions of subsidiaries is included in intangible assets. Goodwill is tested annually for impairment and carried at amortised cost as at 1 January 2004 plus cost for any acquisition completed after 1 January 2004 less accumulated impairment losses. Gains and losses on the disposal of an entity include the carrying amount of goodwill relating to the entity sold, except where goodwill has been previously written off directly to reserves under previous GAAP.

77The Rank Group Plc: Annual report and financial statements 2010
1 General information and accounting policies continued Goodwill is allocated to the relevant cash-generating unit or group of cash-generating units for the purpose of impairment testing. A cash-generating unit is the smallest identifiable group of assets that generates cash inflows that are largely independent of the cash inflows from other assets or groups of assets.
Goodwill arising on acquisitions made before 31 December 1997 has been written off directly to reserves.
(b) Casino and other gaming licences and concessions The Group capitalises acquired casino and other gaming licences and concessions. The amount capitalised is the difference between the price paid for a property or business and the associated licence, and the fair value of a similar property or business without a licence. Management believes that licences, with the exception of the two casino concessions in Belgium, have indefinite lives as there is no foreseeable limit to the period over which the licences are expected to generate net cash inflows and each licence holds a value outside the property in which it resides. Each licence is reviewed annually for impairment.
In respect of the two casino concessions in Belgium, the Group has previously treated the concessions as intangible assets with indefinite lives. However, following a change in the anticipated process for concession renewal in Belgium the directors no longer consider this appropriate. This has resulted in an impairment charge in 2010 of £11.2m. The residual carrying value will be amortised over the expected remaining useful life of nine years.
Any costs in renewing licences or concessions are expensed as incurred.
(c) Other Acquired computer software licences are capitalised on the basis of the costs incurred to acquire and bring to use the specific software. These costs are amortised on a straight line basis over their estimated useful lives (three to four years).
Costs associated with maintaining computer software programmes are recognised as an expense as incurred. Costs that are directly associated with the production and development of identifiable and unique software products controlled by the Group, and that will probably generate economic benefits exceeding costs beyond one year, are recognised as intangible assets for both externally purchased and internally developed software. Direct costs include specific employee costs for software development.
Computer software development costs recognised as assets are amortised over their estimated useful lives, estimated at between three to five years.
If acquired, the Group capitalises the costs of other intangible assets such as brands, trademarks and customer relationships. Costs incurred internally to generate these intangible assets are expensed as incurred. For business combinations occurring after 1 January 2004, purchased intangible assets are capitalised on the balance sheet at fair value on acquisition. Purchased intangible assets with finite lives are amortised over their useful economic lives, estimated at three years.
1.13 Borrowing costs Borrowing costs directly attributable to the acquisition, construction or production of an asset that necessarily takes a substantial period of time to get ready for its intended use or sale are capitalised, where material, as part of the cost of the respective assets. All other borrowing costs are expensed in the period they occur. Borrowing costs consist of interest and other costs that an entity incurs in connection with the borrowing of funds.
The Group capitalises borrowing costs for all qualifying assets where construction was commenced on or after 1 January 2009. The Group expensed borrowing costs relating to construction projects that commenced prior to 1 January 2009.
1.14 Impairment of intangible assets and property, plant and equipment Assets that have an indefinite useful life are not subject to amortisation and are tested annually for impairment. Assets that are subject to amortisation are reviewed for impairment whenever events or changes in circumstances indicate that the carrying amount may not be recoverable.
An impairment loss is recognised as the amount by which an asset’s carrying amount exceeds its recoverable amount. The recoverable amount is the higher of an asset’s fair value less costs to sell and value in use. For the purposes of assessing impairment, assets are grouped at the lowest levels for which there are separately identifiable cash inflows (cash-generating units). The expected cash flows generated by the assets are discounted using appropriate discount rates that reflect the time value of money and risks associated with the groups of assets.
If an impairment loss is recognised, the carrying amount of the asset (cash-generating unit) is reduced to its recoverable amount. An impairment loss is recognised as an exceptional expense in the income statement immediately.
Where an impairment loss subsequently reverses, the carrying amount of the asset (cash-generating unit) is increased to the revised estimate of its recoverable amount, but only to the extent that the increased carrying amount does not exceed the carrying amount that would have been determined had no impairment loss been recognised for the asset (cash-generating unit) in prior years.
A reversal of an impairment loss is recognised as exceptional income in the income statement immediately.
1.15 Employee benefit costs (a) Pension obligations The Group operates a defined contribution plan under which the Group pays fixed contributions to a separate entity. The Group has no further payment obligations once the contributions have been paid. The contributions are recognised as employee benefit expense when they are due.
The Group also has an unfunded pension commitment relating to three former executives of the Group. The amount recognised in the balance sheet in respect of the commitment is the present value of the obligation at the balance sheet date, together with adjustment for unrecognised actuarial gains or losses. The Group recognises actuarial gains and losses immediately in the statement of comprehensive income. The net cost arising on the commitment is recognised in net finance costs.
78 The Rank Group Plc: Annual report and financial statements 2010
Financial statements: Notes to the financial statements continued
1 General information and accounting policies continued (b) Share-based compensation The cost of equity-settled transactions with employees for awards granted after 7 November 2002 is measured by reference to the fair value at the date on which they are granted. The fair value is determined by using an appropriate pricing model, further details of which are given in note 27.
The cost of equity-settled transactions is recognised, together with a corresponding increase in equity, over the period in which the performance and/or service conditions are fulfilled. The cumulative expense recognised for equity-settled transactions at each reporting date until the vesting date reflects the extent to which the vesting period has expired and the Group’s best estimate of the number of equity instruments that will ultimately vest. The income statement expense or credit for a period represents the movement in cumulative expense recognised as at the beginning and end of that period.
No expense is recognised for awards that do not ultimately vest, except for equity-settled transactions where vesting is conditional upon a market or non-vesting condition, which are treated as vesting irrespective of whether or not the market or non-vesting condition is satisfied, provided that all other performance and/or service conditions are satisfied.
Where the terms of an equity-settled transaction award are modified, the minimum expense recognised is the expense as if the terms had not been modified, if the original terms of the award are met. An additional expense is recognised for any modification that increases the total fair value of the share-based payment transaction, or is otherwise beneficial to the employee as measured at the date of modification.
Where an equity-settled award is cancelled, it is treated as if it vested on the date of cancellation, and any expense not yet recognised for the award is recognised immediately. This includes any award where non-vesting conditions within the control of either the entity or the employee are not met. However, if a new award is substituted for the cancelled award, and designated as a replacement award on the date that it is granted, the cancelled and new awards are treated as if they were a modification of the original award, as described in the previous paragraph. All cancellations of equity-settled transaction awards are treated equally.
The dilutive effect of outstanding options is reflected as additional share dilution in the computation of diluted earnings per share.
The proceeds received net of any directly attributable transaction costs are credited to share capital (nominal value) and share premium when the options are exercised.
(c) Share-based compensation – Company The Company operates share-based payment schemes for employees of the Company and its subsidiaries. The fair value of shares awarded to employees of the Company is recognised as an employee expense with a corresponding increase in equity. The Company also makes awards of its own shares to employees of its subsidiaries and as such recognises an increase in the cost of
investment in its subsidiaries equivalent to the equity-settled share-based payment charge recognised in its subsidiaries’ financial statements with the corresponding credit being recognised directly in equity.
(d) Termination benefits Termination benefits are payable when employment is terminated before the normal retirement date, or whenever an employee accepts voluntary redundancy in exchange for these benefits. The Group recognises termination benefits when it is demonstrably committed to either terminating the employment of current employees according to a detailed formal plan; or providing termination benefits as a result of an offer made to encourage voluntary redundancy. If the effect of the time value of money is material, benefits falling due more than 12 months after the balance sheet date are discounted to present value.
(e) Bonus plans The Group recognises a liability and an expense for bonuses based on a formula that takes into consideration the profit attributable to the Company’s shareholders after certain adjustments. The Group recognises a provision where contractually obliged or where a past practice has created a constructive obligation.
1.16 Inventories Inventories are valued at the lower of cost and net realisable value. Cost of inventory is determined on a ‘first-in first-out’ basis.
The cost of finished goods comprises goods purchased for resale.
Net realisable value is the estimated selling price in the ordinary course of business. When necessary, provision is made for obsolete and slow-moving inventories.
1.17 Taxation (a) Current tax Current tax assets and liabilities for the current and prior periods are measured as the amount expected to be paid or to be recovered from the taxation authorities. The tax rates and tax laws used to compute the amount are those that are enacted or substantively enacted, by the reporting date, in the countries where the Group operates and generates taxable income.
Current tax relating to items recognised directly in equity is recognised in equity and not the income statement.
Management evaluates positions taken in the tax returns with respect to situations in which applicable tax regulations are subject to interpretation at each reporting date and establishes provisions where appropriate.
(b) Deferred tax Deferred tax is provided using the liability method on temporary differences arising between the tax bases of assets and liabilities and their carrying amounts in the financial statements. However, if deferred tax arises from the initial recognition of an asset or liability in a transaction, other than a business combination, that at the time of the transaction affects neither accounting nor taxable profit or loss, it is not accounted for. Deferred tax is determined using tax rates (and laws) that have been enacted or substantively enacted by the balance sheet date and are expected to apply when the related deferred tax asset is realised or the deferred tax liability is settled.

79The Rank Group Plc: Annual report and financial statements 2010
1 General information and accounting policies continued Deferred tax assets are recognised to the extent that it is probable that future taxable profit will be available against which the temporary differences can be utilised.
Deferred tax assets and liabilities are offset when there is a legally enforceable right to set off current taxation assets against current taxation liabilities and it is the intention to settle these on a net basis.
Deferred tax is provided on temporary differences arising on investments in subsidiaries and associates, except where the timing of the reversal of the temporary difference is controlled by the Group and it is probable that the temporary difference will not reverse in the foreseeable future.
(c) Sales tax Revenues, expenses and assets are recognised net of the amount of sales tax except:
– Where the sales tax incurred on a purchase of assets or services is not recoverable from the taxation authority, in which case the sales tax is recognised as part of the cost of acquisition of the asset or as part of the expense item as applicable; and
– Receivables and payables that are stated with the amount of sales tax included.
The net amount of sales tax recoverable from, or payable to, the taxation authority is included as part of receivables or payables in the balance sheet.
1.18 Share capital Ordinary shares are classified as equity.
Where any Group company purchases the Company’s equity share capital (treasury shares as defined by IAS 32), the consideration paid, including any directly attributable incremental costs (net of income taxes), is deducted from equity attributable to the Company’s equity holders until the shares are cancelled or reissued. Where such shares are subsequently sold or reissued, any consideration received, net of any directly attributable incremental transaction costs and the related income tax effects, is included in equity attributable to the Company’s equity holders.
1.19 Discontinued operations and non-current assets held for sale Operations of the Group are recognised as discontinued operations if the operations have been disposed of or meet the criteria to be classified as held for sale. Operations held for sale are held at the lower of their carrying amount on the dates they are classified as held for sale and fair value less costs to sell.
Non-current assets and disposal groups are classified as held for sale if their carrying amount will be recovered through a sale transaction rather than through continuing use. This condition is regarded as met only when the sale is highly probable and the asset (or disposal group) is available for immediate sale in its present condition. Management must be committed to the sale which should be expected to qualify for recognition as a completed sale within one year from the date of classification.
1.20 Dividends Dividends proposed by the board of directors and unpaid at the period end are not recognised in the financial statements until they have been approved by shareholders at the annual general meeting. Interim dividends are recognised when paid.
1.21 Exceptional items The Group defines exceptional items as those items which, by their size or nature in relation to both the Group and individual segments, are separately disclosed in order to give a full understanding of the Group’s financial performance and aid comparability of the Group’s result between periods. This would include, to the extent they are material, gains or losses on the disposal of assets, impairments (or subsequent reversal) of the carrying value of assets and associated onerous lease provisions, costs of club closures and restructurings, onerous lease provisions on vacant properties, disposal of businesses, changes in disposal provisions and VAT refunds (net of gross profits tax and associated costs) relating to previous periods.

80 The Rank Group Plc: Annual report and financial statements 2010
Financial statements: Notes to the financial statements continued
2 Segmental reporting (a) Segment information – business segments
Grosvenor Casinos
2010
£m 2009
£m
Continuing operations Group revenue reported in internal information 238.6 220.0Free bets, promotions and customer bonuses (1.0) (1.2)Segment revenue 237.6 218.8 Operating profit (loss) before exceptional items 36.0 30.9Exceptional operating (loss) profit (3.6) (1.5)Segment result 32.4 29.4Finance costs Finance income Other financial (losses) gains Profit before taxation Taxation Profit for the year from continuing operations
Assets and liabilities Intangible assets: Intangible assets with indefinite useful lives 76.0 94.3Intangible assets with finite useful lives 6.9 0.6Property, plant and equipment 80.7 71.8Other segment assets 9.8 9.4Segment assets 173.4 176.1Unallocated assets: Deferred tax assets Income tax receivable Cash and short-term deposits Total assets Segment liabilities (38.7) (42.3)Unallocated liabilities: Income tax payable Loans and borrowings Deferred tax liabilities Total liabilities Net assets
Other segment items – continuing operations Capital expenditure (19.4) (15.8)Depreciation and amortisation 10.0 8.3Impairment charges (see note 4) 11.2 1.5Impairment reversals (see note 4) – –Net charge (release) from provision for onerous leases (see note 4) 0.3 –Share-based payment charge 0.1 0.2
At 31 December 2010, the Group’s continuing operations are organised into four main business segments: Grosvenor Casinos, Mecca Bingo, Top Rank España and Rank Interactive. The activities of the segments are described in the Group overview section of the directors’ report. Costs that cannot be allocated on a reasonable basis are combined within Central costs.
There are immaterial sales between the business segments.

81The Rank Group Plc: Annual report and financial statements 2010
Mecca Bingo Top Rank España Rank Interactive Central costs Total
2010
£m 2009
£m 2010
£m 2009
£m 2010
£m 2009
£m 2010
£m 2009
£m 2010
£m 2009
£m
234.5 233.0 37.0 36.2 57.7 50.8 – – 567.8 540.0 (13.7) (12.3) – – (8.6) (6.0) – – (23.3) (19.5)
220.8 220.7 37.0 36.2 49.1 44.8 – – 544.5 520.5 29.7 32.3 6.8 5.6 7.9 7.5 (18.4) (18.3) 62.0 58.0 31.0 4.3 (1.4) – – – (12.6) – 13.4 2.8 60.7 36.6 5.4 5.6 7.9 7.5 (31.0) (18.3) 75.4 60.8 (7.5) (10.9) 6.1 0.9 (0.5) 1.2 73.5 52.0 (24.6) (14.1) 48.9 37.9
– – 20.5 21.3 53.853.4 – – 149.9 169.4 0.9 1.2 – – 7.7 5.5 2.0 1.3 17.5 8.6 91.3 83.1 27.9 29.7 2.1 2.1 1.0 0.8 203.0 187.5 13.9 13.2 2.4 2.9 3.5 3.0 2.9 3.3 32.5 31.8 106.1 97.5 50.8 53.9 66.7 64.4 5.9 5.4 402.9 397.3 22.1 23.5 0.2 0.4 74.0 64.1 499.2 485.3 (51.7) (56.8) (5.6) (5.5) (12.6) (11.7) (45.2) (36.4) (153.8) (152.7)
(64.1) (44.8) (197.5) (250.1) (6.1) (6.3) (421.5) (453.9) 77.7 31.4
(22.6) (13.0) (1.9) (1.5) (6.2) (3.3) (1.5) (0.7) (51.6) (34.3)
13.3 10.1 2.7 2.8 3.5 3.9 0.8 0.8 30.3 25.9 1.5 – – – – – – – 12.7 1.5 (3.2) – – – – – – – (3.2) – 0.7 (1.0) – – – – 12.5 – 13.5 (1.0) – 0.1 – 0.1 0.1 – 1.6 0.5 1.8 0.9
Segment assets include property, plant and equipment, intangible assets, inventories and trade and other receivables. Segment liabilities comprise trade and other payables, deferred consideration, provisions and retirement benefits. Intangible assets with indefinite useful lives include £53.4m (2009: £53.8m) of goodwill relating to Rank Interactive.
Capital expenditure comprises expenditure on property, plant and equipment and other intangible assets, including those acquired under finance leases.

82 The Rank Group Plc: Annual report and financial statements 2010
Financial statements: Notes to the financial statements continued
2 Segmental reporting continued (b) Segment information – geographical segments The Group’s business segments operate in two main geographical areas (UK and Continental Europe). The home country of the Company is the UK. The areas of operation are principally the operation of bingo clubs, casinos and online gaming and bookmaking services.
(i) Segment revenue from external customers by geographical area based on location of customer
2010
£m 2009
£m
UK 491.3 467.1Continental Europe 53.2 53.4Total revenue 544.5 520.5
(ii) Segment non-current assets by geographical area based on location of assets
2010
£m 2009
£m
UK 313.9 293.8Continental Europe 58.6 73.8Segment non-current assets 372.5 367.6Unallocated assets: Deferred tax assets 22.1 23.5Total non-current assets 394.6 391.1
With the exception of the UK and Spain, no individual country contributed more than 10% of consolidated sales or assets.
(c) Total revenue and profit from continuing and discontinued operations Revenue Profit for the year
Note 2010
£m 2009
£m 2010
£m 2009
£m
From continuing operations 544.5 520.5 48.9 37.9From discontinued operations 4 – – 4.3 0.6Total 544.5 520.5 53.2 38.5

83The Rank Group Plc: Annual report and financial statements 2010
2 Segmental reporting continued (d) Total cost analysis by segment To increase transparency, the Group has decided to include additional disclosure analysing total costs by type and segment. A reconciliation of total costs, before exceptional items, by type and segment is as follows:
2010
Grosvenor Casinos
£m
Mecca Bingo
£m
Top Rank España
£m
Rank Interactive
£m
Central costs
£m Total
£m
Employment and related costs 90.6 61.5 14.7 9.5 12.4 188.7Taxes and duties 48.7 37.3 2.0 1.3 0.7 90.0Direct costs 10.8 21.9 3.2 15.3 – 51.2Property costs 17.3 26.2 2.0 0.7 0.9 47.1Marketing 6.9 10.9 0.9 9.9 – 28.6Depreciation and amortisation 10.0 13.3 2.7 3.5 0.8 30.3Other 17.3 20.0 4.7 1.0 3.6 46.6Total costs before exceptional items 201.6 191.1 30.2 41.2 18.4 482.5
Cost of sales 296.1Operating costs 186.4Total costs before exceptional items 482.5
2009
Grosvenor Casinos
£m
MeccaBingo
£m
Top Rank España
£m
Rank Interactive
£m
Centralcosts
£m Total
£m
Employment and related costs 85.9 56.7 15.4 8.6 11.2 177.8Taxes and duties 45.9 36.7 1.6 0.3 0.7 85.2Direct costs 8.8 23.4 3.6 13.9 – 49.7Property costs 16.9 26.4 2.0 0.7 0.9 46.9Marketing 6.1 10.2 0.8 8.8 – 25.9Depreciation and amortisation 8.3 10.1 2.8 3.9 0.8 25.9Other 16.0 24.9 4.4 1.1 4.7 51.1Total costs before exceptional items 187.9 188.4 30.6 37.3 18.3 462.5
Cost of sales 278.4Operating costs 184.1Total costs before exceptional items 462.5

84 The Rank Group Plc: Annual report and financial statements 2010
Financial statements: Notes to the financial statements continued
3 Profit for the year – analysis by nature The following items have been charged (credited) in arriving at the profit for the year before financing and taxation from continuing operations:
Note 2010
£m 2009
£m
Employee benefit expense 26 179.8 167.2Cost of inventories recognised as expense 19.4 20.5Amortisation of intangibles (including £0.8m (2009: £0.6m) within cost of sales) 10 3.8 4.2Depreciation of property, plant and equipment 11 – owned assets (including £21.1m (2009: £19.0m) within cost of sales) 25.6 21.0– under finance leases (included within cost of sales) 0.9 0.7Operating lease rentals payable – minimum lease payments 44.5 40.4– sub-lease income (4.7) (6.0)Loss (profit) on sale of property, plant and equipment 0.1 (0.1)Exceptional operating costs 4 25.1 0.5Exceptional operating income 4 (38.5) (3.3)Auditors’ remuneration for audit services 0.3 0.4
In the year, the Group’s auditors, Ernst & Young LLP (2009: PricewaterhouseCoopers LLP), including its network firms, earned the following fees:
2010
£m 2009
£m
Audit services – Fees payable to the Company’s auditor for the parent company and consolidated financial statements 0.1 0.2 Other services Fees payable to the Company’s auditor and its associates for other services: – the audit of the Company’s subsidiaries pursuant to legislation 0.2 0.2– tax services 0.1 0.7– other services 0.1 –Total 0.5 1.1
£20,000 (2009: £35,000) of the audit fees related to the parent company.
It is the Group’s policy to balance the need to maintain auditor independence with the desirability of taking advice from the leading firm in the area of advice being taken and the desirability of being efficient.

85The Rank Group Plc: Annual report and financial statements 2010
4 Exceptional items
Note 2010
£m 2009
£m
Exceptional items relating to continuing operations Impairment charges 10,11,12 (12.7) (1.5)Impairment reversals 11,12 3.2 –Charge to provision for onerous leases 21 (17.8) –Release from provision for onerous leases 21 4.3 1.0VAT agreement cost 31 (4.6) –VAT partial exemption accrual release 4.5 –Restructuring costs (2.0) –Exceptional operating costs (25.1) (0.5) VAT refund net of gross profits tax and associated costs 38.5 1.9Net profit on sale of property less associated closure costs – 1.4Exceptional operating income 38.5 3.3 Finance income 5 5.6 –Taxation 6 (8.3) 0.2 Exceptional items relating to continuing operations 10.7 3.0 Exceptional items relating to discontinued operations Release from disposal provisions – 5.0Charge to disposal provisions – (4.2)Additional profit arising on previously disposed subsidiary 0.6 –Finance income 0.4 –Taxation 6 3.3 (0.2)Exceptional items relating to discontinued operations 4.3 0.6 Total exceptional items 15.0 3.6
The Group’s definition of exceptional items is disclosed in note 1.21.
2010 exceptional items Continuing operations Impairment charges The Group recognised an impairment charge of £1.5m against one vacant freehold property following an external market valuation of the Group’s freehold properties.
The Group also recognised an impairment charge of £11.2m against the carrying value of its two casino concessions in Belgium. The impairment charge has been recognised due to a reduction in the expected useful life of the concessions following a change in the anticipated process for concession renewal in Belgium. The residual carrying value will be amortised over the remaining expected useful life of nine years.
Impairment reversals The Group has reversed previous impairment charges of £3.2m in relation to seven Mecca Bingo clubs primarily where performance has seen a sustained improvement from the adverse impact of the smoking bans in the UK and the loss of section 21 gaming terminals in 2007.

86 The Rank Group Plc: Annual report and financial statements 2010
Financial statements: Notes to the financial statements continued
4 Exceptional items continued Onerous leases The Group recognised an additional charge of £17.8m in relation to the provision for onerous property leases. This included a charge of £15.9m primarily in relation to vacant sites following a reduction in the expected sub-let income. These sites have proved increasingly difficult to sub-let and a number of tenants have gone into liquidation or have difficulty in paying their rents. Further details are provided in note 21. The reduction in the discount rate used in the calculation of the onerous lease provisions also resulted in a £1.9m charge.
The Group also released £4.3m in relation to two Mecca Bingo leases where the discounted cash flows derived from the property are now expected to exceed the unavoidable lease costs.
VAT agreement cost Further details of the VAT agreement cost are disclosed in note 31.
VAT partial exemption accrual release The Group has been in negotiation with HMRC for several years on the means by which it calculates the amount of irrecoverable VAT in Grosvenor Casinos. Since July 2007, the Group has accounted for irrecoverable VAT on the basis that HMRC were correct. As a result, the amount of irrecoverable VAT suffered by Grosvenor Casinos exceeded the amount that the Group believed was due. In 2010, the point of dispute between the Group and HMRC was the subject of litigation by another, similar, taxpayer. In that case, the First-tier Tribunal and the Upper Tribunal have ruled that HMRC’s position was incorrect. While HMRC have appealed, precedent case law indicates that the Group’s position is correct and on that basis the irrecoverable VAT accrual has been reduced by £4.5m accordingly. However, it remains possible that this decision will be reversed on appeal. In that event the Group would have to pay the VAT in dispute plus interest (see note 31).
Restructuring costs The Group recognised an exceptional pre tax loss of £2.0m following the restructuring of the Top Rank España business and closure of one Grosvenor Casino at Hove, East Sussex.
VAT refund net of gross profits tax and associated costs On 21 May 2010, the Group received £42.5m in overpaid VAT from HMRC. The repayment covers VAT paid on games of main stage bingo (between 2004 and 2009) and amusement machines (between 2002 and 2005). On 7 June 2010, the Group received £5.6m of interest in respect of the repayment. The repayment follows successive rulings in the Group’s favour in both the First-tier Tribunal’s tax chamber (formerly the VAT and Duties Tribunal) and the Upper Tribunal. HMRC has appealed these rulings and the claims will now be considered by the European Court of Justice (ECJ). It is expected that this appeal will be heard in 2011. If HMRC is successful in its appeal, the Group will be required to return the payment with interest (see note 31). The claims concern the inconsistent application of VAT to revenue from Mecca Bingo and Grosvenor Casinos. It is the Group’s contention that this practice contravened the European Union principle of fiscal neutrality. Further details of the exceptional gain arising on the VAT refunded are disclosed in the table below:
Main stage bingo
£m
Amusement machines
£m Total
£m
Cash repayment received 16.1 26.4 42.5Increase in gross profits tax payable (2.5) – (2.5)Costs, including contingent fees (0.8) (0.3) (1.1)Irrecoverable input VAT (0.3) (0.1) (0.4)Exceptional gain before financing and taxation 12.5 26.0 38.5Finance income 1.2 4.4 5.6Taxation (3.8) (8.6) (12.4)Total exceptional gain on VAT refund 9.9 21.8 31.7
Discontinued operations Additional profit arising on previously disposed subsidiary The Group also recognised an exceptional profit of £0.6m, together with associated interest of £0.4m, following the successful outcome of certain VAT claims relating to a previously disposed subsidiary.
Taxation Details of exceptional taxation are disclosed in note 6.

87The Rank Group Plc: Annual report and financial statements 2010
4 Exceptional items continued 2009 exceptional items Continuing operations During 2009, the Group disposed of one previously closed Mecca Bingo property at Welling. The resulting profit on disposal of the property, net of costs, was £1.4m.
The Group also recognised an impairment charge of £1.5m against a non-operating casino licence at Liverpool. During 2010, the Group opened an electronic casino in Liverpool using the licence and the directors consider the impaired carrying value of the licence remains appropriate.
The increase in the discount rate used in the calculation of the onerous property lease provision resulted in a £1.0m release to the income statement.
An exceptional profit of £1.9m also arose following the partial refund of bingo gross profits tax accrued in 2008 and previously paid during 2009 in relation to the £59.1m VAT refund in 2008.
Discontinued operations A provision of £5.0m for an environmental warranty given at the time of the sale of Deluxe Film was released as no subsequent claim was received and the warranty period had expired.
In addition, a charge of £4.2m was made in relation to the settlement, and associated costs, of legal proceedings in the US brought by Paramount Home Entertainment.
5 Financing
2010
£m 2009
£m
Continuing operations Finance costs: Interest on debt and borrowings(1) (4.3) (7.2)Amortisation of issue costs on borrowings (0.9) (1.0)Interest payable on finance leases (0.9) (0.9)Unwinding of the discount in onerous lease provisions (1.2) (1.3)Unwinding of the discount in disposal provisions (0.2) (0.2)Amortisation of the equity component of the convertible bond – (0.3)Total finance costs (7.5) (10.9) Finance income: Interest income on short term bank deposits(1) 0.5 0.9Finance income 0.5 0.9 Other financial (losses) gains (0.5) 1.2 Total net financing cost for continuing operations before exceptional items (7.5) (8.8) Exceptional finance income 5.6 – Total net financing cost for continuing operations (1.9) (8.8)
(1) calculated using the effective interest method.
Further details of the exceptional finance income are disclosed in note 4.

88 The Rank Group Plc: Annual report and financial statements 2010
Financial statements: Notes to the financial statements continued
5 Financing continued A reconciliation of total net financing costs to adjusted net interest included in adjusted profit is disclosed below:
2010
£m 2009
£m
Total net financing cost for continuing operations before exceptional items (7.5) (8.8)Adjust for: Unwinding of the discount in disposal provisions 0.2 0.2Amortisation of the equity component of the convertible bond – 0.3Other financial losses (gains) – including foreign exchange 0.5 (1.2)Adjusted net interest payable (6.8) (9.5)
6 Taxation 2010 2009
Continuing operations
£m
Discontinued operations
£m Total
£m
Continuing operations
£m
Discontinued operations
£m Total
£m
Current income tax Current income tax – UK (13.1) – (13.1) 3.1 – 3.1Current income tax – overseas (1.8) – (1.8) (1.7) – (1.7)Current income tax (charge) credit (14.9) – (14.9) 1.4 – 1.4Current income tax on exceptional items (8.0) – (8.0) (0.8) 1.2 0.4Amounts (under) over provided in previous year (0.3) – (0.3) 1.3 – 1.3Amounts over provided in previous year on exceptional items – 2.8 2.8 0.6 – 0.6Total current income tax (charge) credit (23.2) 2.8 (20.4) 2.5 1.2 3.7 Deferred tax Deferred tax – UK (1.6) – (1.6) (18.7) – (18.7)Deferred tax – overseas (0.2) – (0.2) (0.3) – (0.3)Restatement of deferred tax from 28.0% to 27.0% (0.8) – (0.8) – – –Deferred tax on exceptional items (0.3) – (0.3) 0.4 (1.4) (1.0)Amounts over provided in previous year 1.5 – 1.5 2.0 – 2.0Amounts over provided in previous year on exceptional items – 0.5 0.5 – – –Total deferred tax (charge) credit (note 20) (1.4) 0.5 (0.9) (16.6) (1.4) (18.0) Tax (charge) credit in the income statement (24.6) 3.3 (21.3) (14.1) (0.2) (14.3)
The tax on the Group’s profit before taxation on continuing operations differs from the standard rate of UK corporation tax of 28.0% (2009: 28.0%). The differences are explained below:
2010
£m 2009
£m
Profit before taxation on continuing operations 73.5 52.0Tax charge calculated at 28.0% on profit before taxation on continuing operations (2009: 28.0%) (20.6) (14.6)Effects of: Expenses not deductible for tax purposes (5.0) (1.4)Difference in overseas tax rates 0.6 (1.9)Restatement of deferred tax from 28.0% to 27.0% (0.8) –Adjustments relating to prior years 1.2 3.9Utilisation of previously unrecognised tax losses – (0.3)Deferred tax movement on fair valued assets – 0.2Tax charge in the income statement on continuing operations (24.6) (14.1)
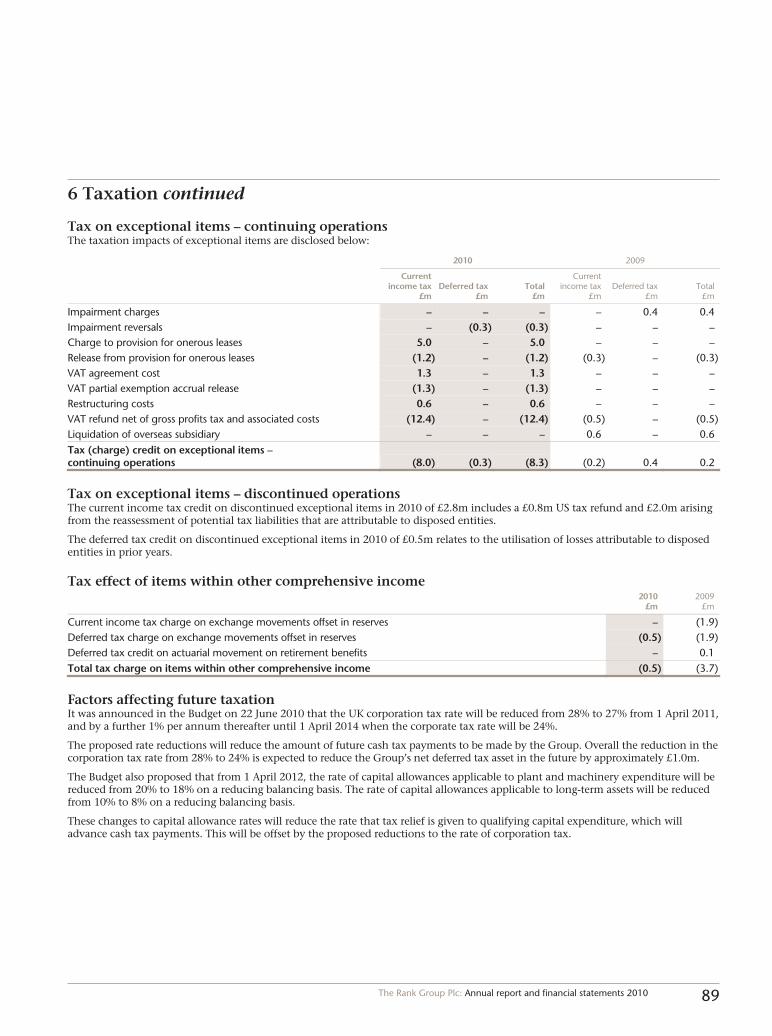
89The Rank Group Plc: Annual report and financial statements 2010
6 Taxation continued
Tax on exceptional items – continuing operations The taxation impacts of exceptional items are disclosed below:
2010 2009
Current income tax
£m Deferred tax
£m Total
£m
Current income tax
£m Deferred tax
£m Total
£m
Impairment charges – – – – 0.4 0.4Impairment reversals – (0.3) (0.3) – – –Charge to provision for onerous leases 5.0 – 5.0 – – –Release from provision for onerous leases (1.2) – (1.2) (0.3) – (0.3)VAT agreement cost 1.3 – 1.3 – – –VAT partial exemption accrual release (1.3) – (1.3) – – –Restructuring costs 0.6 – 0.6 – – –VAT refund net of gross profits tax and associated costs (12.4) – (12.4) (0.5) – (0.5)Liquidation of overseas subsidiary – – – 0.6 – 0.6Tax (charge) credit on exceptional items – continuing operations (8.0) (0.3) (8.3) (0.2) 0.4 0.2
Tax on exceptional items – discontinued operations The current income tax credit on discontinued exceptional items in 2010 of £2.8m includes a £0.8m US tax refund and £2.0m arising from the reassessment of potential tax liabilities that are attributable to disposed entities.
The deferred tax credit on discontinued exceptional items in 2010 of £0.5m relates to the utilisation of losses attributable to disposed entities in prior years.
Tax effect of items within other comprehensive income
2010
£m 2009
£m
Current income tax charge on exchange movements offset in reserves – (1.9)Deferred tax charge on exchange movements offset in reserves (0.5) (1.9)Deferred tax credit on actuarial movement on retirement benefits – 0.1Total tax charge on items within other comprehensive income (0.5) (3.7)
Factors affecting future taxation It was announced in the Budget on 22 June 2010 that the UK corporation tax rate will be reduced from 28% to 27% from 1 April 2011, and by a further 1% per annum thereafter until 1 April 2014 when the corporate tax rate will be 24%.
The proposed rate reductions will reduce the amount of future cash tax payments to be made by the Group. Overall the reduction in the corporation tax rate from 28% to 24% is expected to reduce the Group’s net deferred tax asset in the future by approximately £1.0m.
The Budget also proposed that from 1 April 2012, the rate of capital allowances applicable to plant and machinery expenditure will be reduced from 20% to 18% on a reducing balancing basis. The rate of capital allowances applicable to long-term assets will be reduced from 10% to 8% on a reducing balancing basis.
These changes to capital allowance rates will reduce the rate that tax relief is given to qualifying capital expenditure, which will advance cash tax payments. This will be offset by the proposed reductions to the rate of corporation tax.
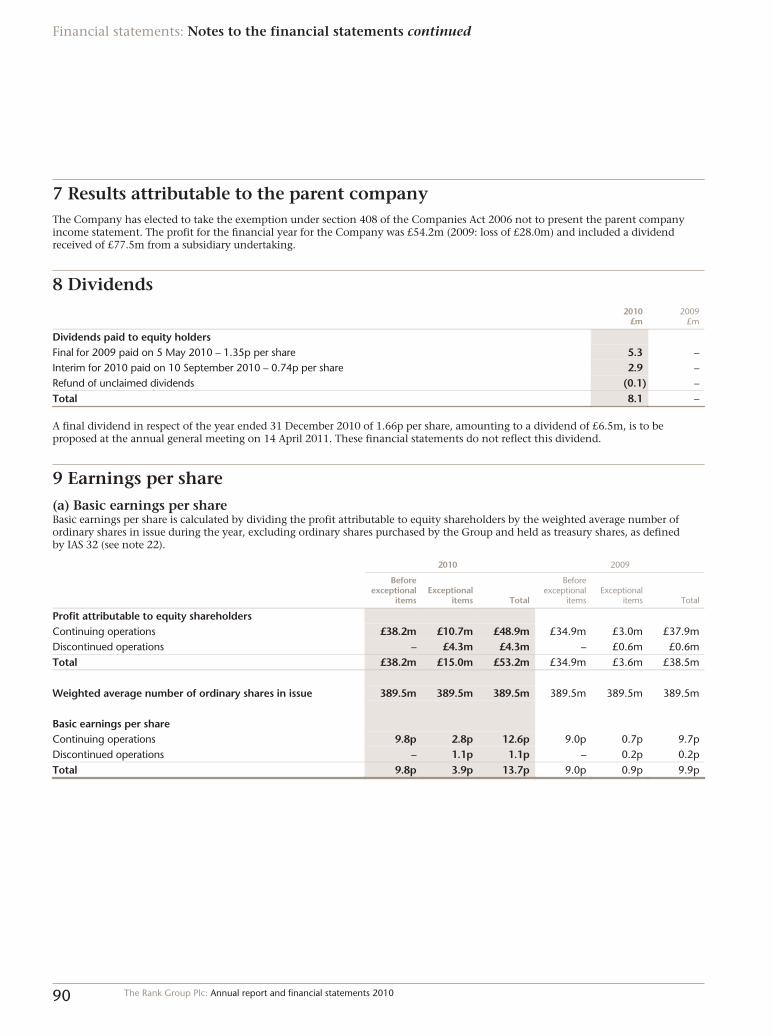
90 The Rank Group Plc: Annual report and financial statements 2010
Financial statements: Notes to the financial statements continued
7 Results attributable to the parent company The Company has elected to take the exemption under section 408 of the Companies Act 2006 not to present the parent company income statement. The profit for the financial year for the Company was £54.2m (2009: loss of £28.0m) and included a dividend received of £77.5m from a subsidiary undertaking.
8 Dividends
2010
£m 2009
£m
Dividends paid to equity holders Final for 2009 paid on 5 May 2010 – 1.35p per share 5.3 –Interim for 2010 paid on 10 September 2010 – 0.74p per share 2.9 –Refund of unclaimed dividends (0.1) –Total 8.1 –
A final dividend in respect of the year ended 31 December 2010 of 1.66p per share, amounting to a dividend of £6.5m, is to be proposed at the annual general meeting on 14 April 2011. These financial statements do not reflect this dividend.
9 Earnings per share (a) Basic earnings per share Basic earnings per share is calculated by dividing the profit attributable to equity shareholders by the weighted average number of ordinary shares in issue during the year, excluding ordinary shares purchased by the Group and held as treasury shares, as defined by IAS 32 (see note 22).
2010 2009
Beforeexceptional
items Exceptional
items Total
Before exceptional
items Exceptional
items Total
Profit attributable to equity shareholders Continuing operations £38.2m £10.7m £48.9m £34.9m £3.0m £37.9mDiscontinued operations – £4.3m £4.3m – £0.6m £0.6mTotal £38.2m £15.0m £53.2m £34.9m £3.6m £38.5m Weighted average number of ordinary shares in issue 389.5m 389.5m 389.5m 389.5m 389.5m 389.5m Basic earnings per share Continuing operations 9.8p 2.8p 12.6p 9.0p 0.7p 9.7pDiscontinued operations – 1.1p 1.1p – 0.2p 0.2pTotal 9.8p 3.9p 13.7p 9.0p 0.9p 9.9p

91The Rank Group Plc: Annual report and financial statements 2010
9 Earnings per share continued (b) Diluted earnings per share Diluted earnings per share is calculated by adjusting the weighted average number of ordinary shares in issue to assume conversion of all dilutive potential ordinary shares. The only category of dilutive potential ordinary shares are share options. For share options, a calculation is made to determine the number of shares that could have been acquired at fair value (determined as the average annual market share price of the Company’s shares) based on the monetary value of the subscription rights attached to outstanding share options. The number of shares calculated is compared with the number of shares that would have been issued assuming exercise of the share options.
There is no difference in the profit used to determine diluted earnings per share from that used to determine basic earnings per share. The potential dilutive impact of share options on the weighted average number of ordinary shares in issue and diluted earnings per share is shown below.
2010 2009
Beforeexceptional
items Exceptional
items Total
Before exceptional
items Exceptional
items Total
Weighted average number of ordinary shares in issue 389.5m 389.5m 389.5m 389.5m 389.5m 389.5mDilutive potential ordinary shares 2.1m 2.1m 2.1m – – –Total 391.6m 391.6m 391.6m 389.5m 389.5m 389.5m Diluted earnings per share Continuing operations 9.8p 2.7p 12.5p 9.0p 0.7p 9.7pDiscontinued operations – 1.1p 1.1p – 0.2p 0.2pTotal 9.8p 3.8p 13.6p 9.0p 0.9p 9.9p
(c) Adjusted earnings per share Adjusted earnings is calculated by adjusting profit attributable to equity shareholders to exclude discontinued operations, exceptional items, other financial gains or losses, unwinding of the discount in disposal provisions, amortisation of the equity component of the convertible bond and the related tax effects. Adjusted earnings is one of the business performance measures used internally by management to manage the operations of the business. Management believes that the adjusted earnings measure assists in providing a view of the underlying performance of the business.
Adjusted net earnings attributable to equity shareholders is derived as follows:
2010
£m 2009
£m
Profit attributable to equity shareholders 53.2 38.5Adjust for: Discontinued operations (net of taxation) (4.3) (0.6)Exceptional items after tax on continuing operations (10.7) (3.0)Other financial losses (gains) 0.5 (1.2)Amortisation of the equity component of the convertible bond – 0.3Unwinding of the discount in disposal provisions 0.2 0.2Taxation on adjusted items and impact of reduction in the tax rate to 27.0% 1.0 0.3Adjusted net earnings attributable to equity shareholders 39.9 34.5 Adjusted earnings per share (p) – basic 10.2p 8.9pAdjusted earnings per share (p) – diluted 10.2p 8.9p
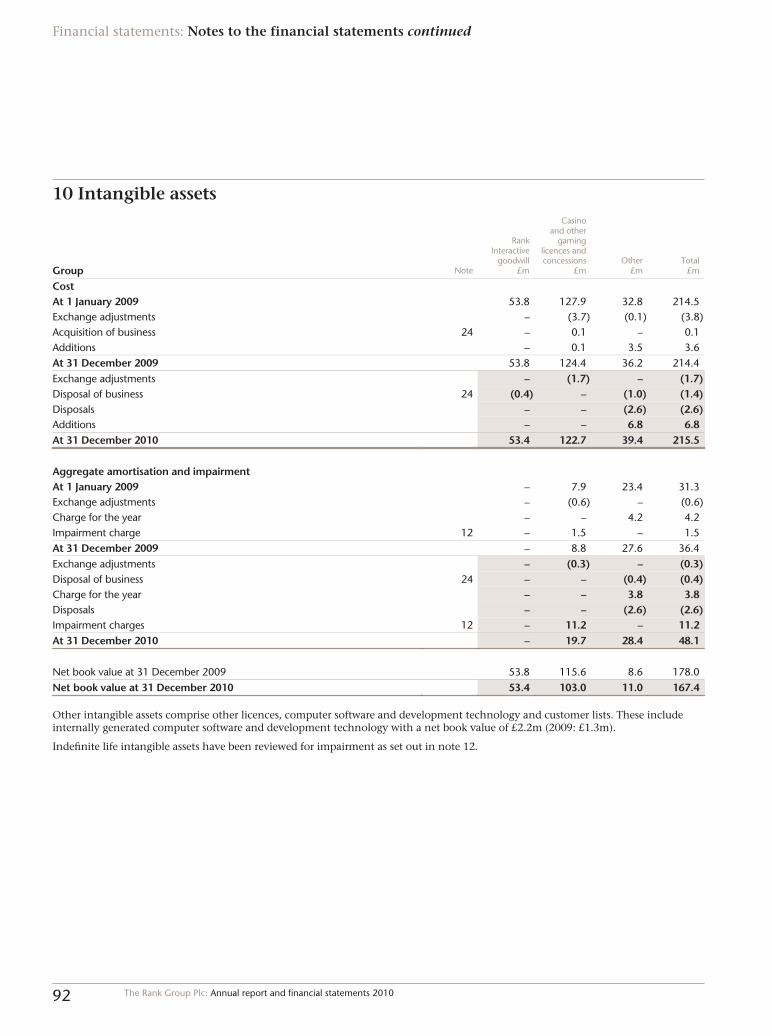
92 The Rank Group Plc: Annual report and financial statements 2010
Financial statements: Notes to the financial statements continued
10 Intangible assets
Group Note
Rank Interactive
goodwill£m
Casino and other
gaming licences and concessions
£m Other
£m Total
£m
Cost At 1 January 2009 53.8 127.9 32.8 214.5Exchange adjustments – (3.7) (0.1) (3.8)Acquisition of business 24 – 0.1 – 0.1Additions – 0.1 3.5 3.6At 31 December 2009 53.8 124.4 36.2 214.4Exchange adjustments – (1.7) – (1.7)Disposal of business 24 (0.4) – (1.0) (1.4)Disposals – – (2.6) (2.6)Additions – – 6.8 6.8At 31 December 2010 53.4 122.7 39.4 215.5
Aggregate amortisation and impairment At 1 January 2009 – 7.9 23.4 31.3Exchange adjustments – (0.6) – (0.6)Charge for the year – – 4.2 4.2Impairment charge 12 – 1.5 – 1.5At 31 December 2009 – 8.8 27.6 36.4Exchange adjustments – (0.3) – (0.3)Disposal of business 24 – – (0.4) (0.4)Charge for the year – – 3.8 3.8Disposals – – (2.6) (2.6)Impairment charges 12 – 11.2 – 11.2At 31 December 2010 – 19.7 28.4 48.1 Net book value at 31 December 2009 53.8 115.6 8.6 178.0Net book value at 31 December 2010 53.4 103.0 11.0 167.4
Other intangible assets comprise other licences, computer software and development technology and customer lists. These include internally generated computer software and development technology with a net book value of £2.2m (2009: £1.3m).
Indefinite life intangible assets have been reviewed for impairment as set out in note 12.

93The Rank Group Plc: Annual report and financial statements 2010
11 Property, plant and equipment
Group Note
Land and buildings
£m
Fixtures,fittings,
plant andmachinery
£m Total
£m
Cost At 1 January 2009 142.7 322.1 464.8Exchange adjustments (1.0) (4.1) (5.1)Acquisition of business 24 – 0.7 0.7Reclassification(1) (9.7) 9.7 –Additions 2.3 29.8 32.1Disposals (0.2) (1.1) (1.3)At 31 December 2009 134.1 357.1 491.2Exchange adjustments (0.4) (1.9) (2.3)Additions 2.5 39.5 42.0Disposals (0.4) (2.0) (2.4)At 31 December 2010 135.8 392.7 528.5
Accumulated depreciation At 1 January 2009 68.5 216.7 285.2Exchange adjustments (0.1) (2.2) (2.3)Charge for the year 3.1 18.6 21.7Reclassification(1) (0.9) 0.9 –Disposals – (0.9) (0.9)At 31 December 2009 70.6 233.1 303.7Exchange adjustments – (1.1) (1.1)Charge for the year 3.0 23.5 26.5Impairment charge 1.5 – 1.5Impairment reversals (2.0) (1.2) (3.2)Disposals (0.2) (1.7) (1.9)At 31 December 2010 72.9 252.6 325.5
Net book value at 31 December 2009 63.5 124.0 187.5Net book value at 31 December 2010 62.9 140.1 203.0
(1) A review of property, plant and equipment during 2009 resulted in a reallocation of £9.7m of assets at cost, together with associated accumulated depreciation of £0.9m, from land and buildings to fixtures, fittings, plant and machinery.

94 The Rank Group Plc: Annual report and financial statements 2010
Financial statements: Notes to the financial statements continued
11 Property, plant and equipment continued Finance leases The net book value of property, plant and equipment held under finance leases was:
2010
£m 2009
£m
Land and buildings 7.1 7.8Fixtures, fittings, plant and machinery 1.2 –Net book value at 31 December 8.3 7.8
There were £1.4m (2009: £nil) of additions under finance leases during the year.
Borrowing costs There were no qualifying assets in either period and therefore no borrowing costs have been capitalised in either year.
Assets under construction There were no material assets under construction at either reporting date.
12 Impairment review The pre-tax discount rate applied to all cash flow projections is 11.0% (2009: 12.2%). The discount rate calculation is based on the specific circumstances of the Group and its operating segments and derived from its weighted average cost of capital. Management believes that the discount rate is appropriate for each cash-generating unit (CGU) as they operate in gaming markets with similar risks as set out below.
(a) Impairment review of intangible assets with indefinite lives Assets that have an indefinite useful life are not subject to amortisation and are tested annually for impairment. In accordance with IAS 36, goodwill is reviewed annually for impairment. In addition, the Group classifies casino licences (with the exception of its concessions in Belgium) and Spanish bingo licences as intangible assets with an indefinite life.
(i) Goodwill At 31 December 2010, the Group has goodwill with a carrying value of £53.4m (2009: £53.8m) arising from the acquisition of Rank Interactive.
For impairment testing, the whole of Rank Interactive is treated as a single CGU. The recoverable amount has been determined based on a value in use calculation using cash flow projections from the Group’s budget for 2011, the Group’s strategic plan for the following two years and a growth rate of 2.0% (2009: 2.0%) thereafter. Both the Group’s budget and strategic plan have been approved by the board of directors.
The key assumptions in the calculation of value in use are settled stakes, gaming win margins and the discount rate. Settled stakes represent monies placed by customers for betting and interactive games and are estimated taking into account the product mix, major sporting events and industry developments. Gaming win margins are based on values achieved in the past and amended for any anticipated changes in the budget period. The calculation also assumes that revenue from UK domiciled customers is not subject to UK duty or VAT.
As a result of the impairment testing, the directors do not believe that the carrying value of the goodwill was impaired as the value in use significantly exceeded the carrying value of goodwill. However, there are possible changes which could adversely impact the key assumptions and cause the carrying value of the goodwill to exceed its recoverable amount. These include:
Possible change Key assumption impacted
Increased or improved competition Settled stakes, Gaming win margin Poor or decreased marketing Settled stakes Failure to respond to technological advances Settled stakes Deterioration in economic environment Settled stakes Changes in regulation Settled stakes, Gaming win margin Changes in taxation Gaming duty Prolonged period of adverse sporting results Gaming win margin
Changes in settled stakes and gaming win margin impact gaming win and consequently the cash flow projections used to determine the recoverable amount. Any change resulting in a decrease in excess of 56% (2009: 45%) in projected gaming win would cause the recoverable amount to equal the carrying value of the CGU.

95The Rank Group Plc: Annual report and financial statements 2010
12 Impairment review continued (ii) Casino licences and concessions The carrying value of indefinite life casino licences and concessions as at 31 December 2010 was £76.0m (2009: £94.3m).
The inherent value of casino licences and concessions is deemed to be an intrinsic part of the value of the operation of casinos as a whole and is therefore not split out from each Grosvenor casino in an impairment review. Each Grosvenor casino has been treated as a separate CGU, and tested for impairment on that basis. The recoverable amount of each Grosvenor casino, including the licence or concession, has been determined based on the higher of fair value less costs to sell and value in use. The value in use has been determined using cash flow projections from the Group’s budget for 2011, the Group’s strategic plan for the following two years and a growth rate of 2.0% (2009: 2.0%) thereafter. Both the Group’s budget and strategic plan have been approved by the board of directors. Estimates of the fair value less costs to sell are performed internally by experienced senior management supported by knowledge of similar transactions or, where applicable, offers received.
Any impairment is allocated equally across all assets in a CGU unless a fair market value exists for one or more assets. Once an asset has been written down to its fair value less costs to sell then any remaining impairment is allocated equally amongst all other assets. Casino licences are generally not impaired as they have an indefinite life and a fair market value in excess of their carrying value.
The key assumptions in the calculation of value in use are customer visits, spend per visit, casino duty, competition and the discount rate. Customer visits are the number of discrete visits by members to the casino and have been based on recent trends. Spend per visit comprises the average amount of money (net of winnings) spent per visit on gaming tables, machines and food and beverages. This has also been determined by recent trends. Casino duty is levied in bands of between 15% and 50% depending upon the level of gaming win at each casino. The bands and rates have been assumed to remain at current levels without indexation, details of which are provided on page 41.
As a result of the impairment review, the directors do not believe the carrying value of the UK casino licences to be impaired. However, there are possible changes in key assumptions that could cause the carrying value of individual licences to exceed their recoverable amount. These are:
Possible change Key assumption impacted
Increased or improved competition Customer visits Poor or decreased promotional activity Customer visits Failure to respond to technological advances Customer visits, Spend per visit Deterioration in economic conditions Customer visits, Spend per visit Changes in regulation Customer visits, Spend per visit Changes in taxation Casino duty
With the exception of a prolonged non-operation of a UK casino licence arising from one or more of the possible changes outlined above, the directors do not believe that there are any reasonably possible changes to the key assumptions that would result in a material impairment of a UK casino licence.
In respect of the two casino concessions in Belgium, the Group has previously treated the concessions as intangible assets with indefinite lives. However, following a re-evaluation of the anticipated process for concession renewal in Belgium, expected useful lives and the associated cash flows the directors no longer consider this appropriate. This has resulted in an impairment charge of £11.2m. The residual carrying value will be amortised over the expected remaining useful life of nine years.
(iii) Spanish bingo licences The carrying value of Spanish bingo licences as at 31 December 2010 was £20.5m (2009: £21.3m).
The inherent value of each Spanish bingo licence is deemed to be an intrinsic part of the value of a club as a whole and is not therefore split out from the assets of each individual bingo club in an impairment review. Each individual bingo club has been treated as a separate CGU, and tested for impairment on that basis. The recoverable amount of each Spanish bingo club, including the licence, has been determined based on the higher of fair value less costs to sell and value in use. The value in use has been determined using cash flow projections from the Group’s budget for 2011, the Group’s strategic plan for the following two years and a growth rate of 3.0% (2009: 3.0%) thereafter which reflects the long-term opportunity in Spain, local market conditions and the expected recovery from the short-term impacts of the full smoking ban implemented on 2 January 2011. Both the Group’s budget and strategic plan have been approved by the board of directors and take into account the implementation of a full smoking ban in Spain from 2 January 2011.
Any impairment is allocated equally across all assets in a CGU unless a fair market value exists for one or more assets. Once an asset has been written down to its fair value less costs to sell then any remaining impairment is allocated equally amongst all other assets. Bingo licences are generally not impaired as they have an indefinite life and a fair market value in excess of their carrying value.

96 The Rank Group Plc: Annual report and financial statements 2010
Financial statements: Notes to the financial statements continued
12 Impairment review continued The key assumptions in the calculation of value in use are customer visits, spend per visit, bingo duty, and the discount rate. Customer visits are the number of discrete visits to the bingo club and have been based on recent trends. Spend per visit comprises the average amount of money (net of winnings) spent by a member on bingo games, machines and food and beverages. This has been determined by recent trends.
As a result of the impairment review, the directors do not believe the carrying value of the bingo licences to be impaired. However, there are possible changes in the key assumptions that could cause further impairments. These are:
Possible change Key assumption impacted
Increased or improved competition Customer visits Poor or decreased promotional activity Customer visits Failure to respond to technological advances Customer visits, Spend per visit Deterioration in economic conditions Customer visits, Spend per visit Changes in regulation Customer visits, Spend per visit Changes in taxation Bingo duty
As outlined above, each Spanish bingo licence has been tested for impairment as part of the club as a whole. Accordingly, the sensitivity of each licence to future impairments, arising from changes in the key assumptions, varies at each club. The fall in gaming win required for the recoverable amount to equal the carrying value of the club, ranges between nil and in excess of 100%.
(b) Impairment review of property, plant and equipment Property, plant and equipment and intangible assets are grouped into CGUs which are defined as individual clubs for Mecca Bingo, Top Rank España and Grosvenor Casinos and the whole operation for Rank Interactive.
The key assumptions and sensitivities in the impairment reviews for Rank Interactive, Casinos and Bingo are the same as outlined above for intangible assets.
The recoverable amount of each CGU, including the licence if applicable, has been determined based on the higher of fair value less costs to sell and value in use. The value in use has been determined using cash flow projections from the Group’s budget for 2011, the Group’s strategic plan for the following two years and a growth rate of 2.0% (2009: 2.0%) thereafter (except for Top Rank España where a growth rate of 3.0% (2009: 3.0%) has been used. Both the Group’s budget and strategic plan have been approved by the board of directors. Estimates of the fair value less costs to sell are performed internally by an experienced surveyor supported by external estate agent advice or, where applicable, offers received.
Any impairment is allocated equally across all assets in a CGU unless a fair market value exists for one or more assets. Once an asset has been written down to its fair value less costs to sell then any remaining impairment is allocated equally amongst all other assets.
(c) Impairment recognised during the year Impairments of intangible assets and property, plant and equipment are recognised as an exceptional item in operating costs in the income statement. The impairments recognised during the year were as follows:
2010 Mecca Bingo The Group recognised an impairment charge of £1.5m against one vacant Mecca Bingo freehold property following an external market valuation of the Group’s freehold properties.
The Group also reversed previous impairment charges of £3.2m in relation to seven Mecca Bingo clubs primarily where performance has seen a sustained improvement from the adverse impact of the smoking bans in the UK and the loss of section 21 gaming terminals in 2007.
Grosvenor Casinos The Group recognised an impairment charge of £11.2m against the carrying value of its two casino concessions in Belgium. The impairment charge has been recognised due to a reduction in the expected useful life of the concessions following a change in the anticipated process for concession renewal in Belgium. The residual carrying value will be amortised over the remaining expected useful life of nine years.
2009 Grosvenor Casinos An impairment charge of £1.5m was recognised in 2009 in relation to a non-operating casino licence at Liverpool. The licence had been subject to a prolonged period of inactivity, and although the Group continued to investigate uses for the licence, the directors believed it was appropriate to recognise an impairment of £1.5m against the carrying value of £2.0m. During 2010, the Group opened an electronic casino in Liverpool using the licence and the directors consider the impaired carrying value of the licence of £0.5m remains appropriate.

97The Rank Group Plc: Annual report and financial statements 2010
13 Investments in subsidiaries
Company 2010
£m 2009
£m
Cost At 1 January 1,515.6 1,515.6Additions 1.3 –At 31 December 1,516.9 1,515.6
Provision for impairment At 1 January and 31 December 489.3 489.3
Net book amount at 31 December 1,027.6 1,026.3
The additions in the year relate to the fair value of services recognised by subsidiary undertakings arising from share options granted by the Company.
A list of the significant investments in subsidiaries, including the name, country of incorporation and proportion of ownership interest is given in note 33.
14 Inventories Group
2010
£m 2009
£m
Raw materials 0.3 0.3Finished goods 3.1 3.4Total 3.4 3.7
There were no write downs of inventory in either year.
15 Trade and other receivables Group Company
2010
£m 2009
£m 2010
£m 2009
£m
Current Trade receivables 2.5 2.1 – –Less: provisions for impairment of trade receivables (0.3) (0.1) – –Trade receivables – net 2.2 2.0 – –Prepayments 18.5 17.9 – –Other receivables 6.3 6.1 – –Amounts owed by subsidiary undertakings repayable on demand – – 43.6 43.6Trade and other receivables – current 27.0 26.0 43.6 43.6
Non-current Other receivables 2.1 2.1 – –Trade and other receivables – non-current 2.1 2.1 – –

98 The Rank Group Plc: Annual report and financial statements 2010
Financial statements: Notes to the financial statements continued
15 Trade and other receivables continued Group The carrying values of trade receivables are assumed to approximate to their fair values due to the short-term nature of trade receivables.
As at 31 December 2010, trade receivables of £0.3m (2009: £0.1m) were impaired. The amount of the provision was £0.3m (2009: £0.1m). The ageing of these receivables is as follows:
2010
£m 2009
£m
Up to 3 months – –3 to 6 months 0.3 –Over 6 months – 0.1 0.3 0.1
As at 31 December 2010, trade receivables of £0.7m (2009: £0.4m) were past due but not impaired. The ageing of these trade receivables is as follows:
2010
£m 2009
£m
Up to 3 months 0.3 0.23 to 6 months 0.3 0.2Over 6 months 0.1 – 0.7 0.4
The carrying amounts of the Group’s trade receivables are denominated in the following currencies:
2010
£m 2009
£m
UK Sterling 2.1 1.9Euro 0.1 0.1 2.2 2.0
The movements on the Group’s provision for impairment of trade receivables are as follows:
2010
£m 2009
£m
At 1 January (0.1) (1.0)Amounts released 0.1 0.1Provisions created (0.3) –Receivables written off during the year as uncollectible – 0.8At 31 December (0.3) (0.1)
The creation and release of provisions for impaired receivables have been included in other operating costs in the income statement. Amounts charged to the provision for impairment are generally written off when there is no expectation of recovering additional cash.
The other classes within trade and other receivables do not contain impaired assets.
The maximum exposure to credit risk at the reporting date is the fair value of each class of receivable mentioned above. The Group does not hold any collateral as security.
Company The carrying value of amounts due from subsidiary undertakings are assumed to equate to their fair value as all amounts are repayable on demand. The amounts are denominated in UK Sterling and relate to subsidiary undertakings for which there is no history of default.
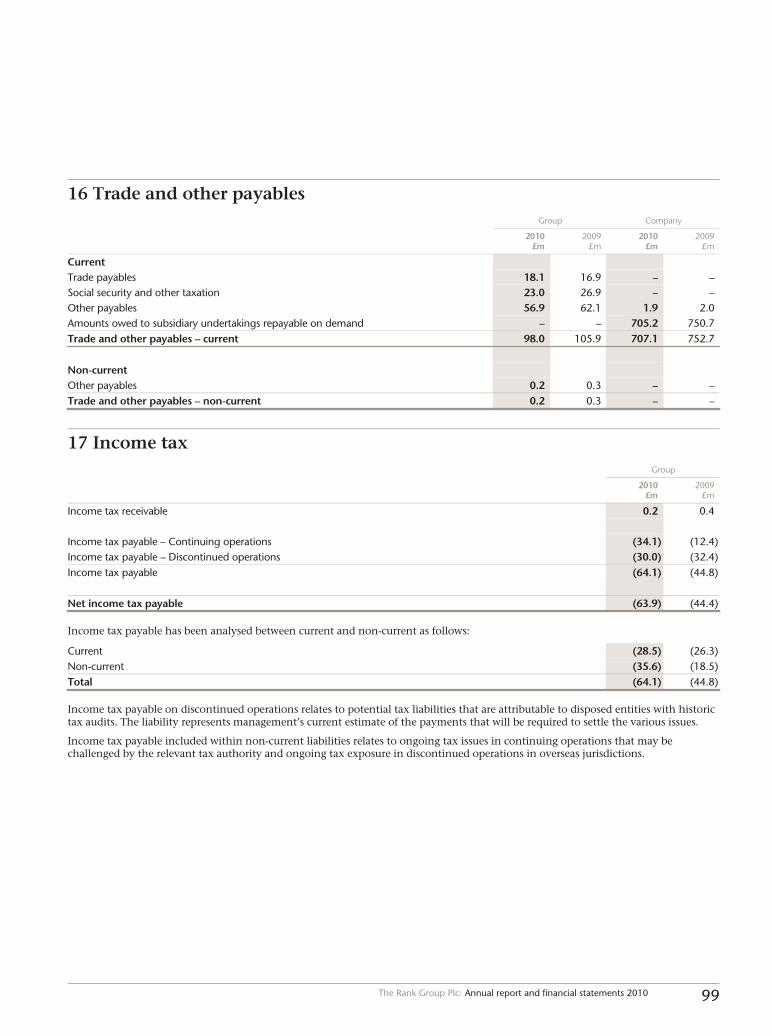
99The Rank Group Plc: Annual report and financial statements 2010
16 Trade and other payables Group Company
2010
£m 2009
£m 2010
£m 2009
£m
Current Trade payables 18.1 16.9 – –Social security and other taxation 23.0 26.9 – –Other payables 56.9 62.1 1.9 2.0Amounts owed to subsidiary undertakings repayable on demand – – 705.2 750.7Trade and other payables – current 98.0 105.9 707.1 752.7
Non-current Other payables 0.2 0.3 – –Trade and other payables – non-current 0.2 0.3 – –
17 Income tax Group
2010
£m 2009
£m
Income tax receivable 0.2 0.4 Income tax payable – Continuing operations (34.1) (12.4)Income tax payable – Discontinued operations (30.0) (32.4)Income tax payable (64.1) (44.8) Net income tax payable (63.9) (44.4)
Income tax payable has been analysed between current and non-current as follows:
Current (28.5) (26.3)Non-current (35.6) (18.5)Total (64.1) (44.8)
Income tax payable on discontinued operations relates to potential tax liabilities that are attributable to disposed entities with historic tax audits. The liability represents management’s current estimate of the payments that will be required to settle the various issues.
Income tax payable included within non-current liabilities relates to ongoing tax issues in continuing operations that may be challenged by the relevant tax authority and ongoing tax exposure in discontinued operations in overseas jurisdictions.

100 The Rank Group Plc: Annual report and financial statements 2010
Financial statements: Notes to the financial statements continued
18 Financial assets and liabilities (a) Interest bearing loans and borrowings
Group
Maturity 2010
£m 2009
£m
Current interest-bearing loans and borrowings Bank overdraft On demand 6.5 7.3Obligations under finance leases and hire purchase contracts Various 1.2 0.7 Other current loans Accrued interest January 2011 0.7 0.6Unamortised facility fees March 2011 (0.3) (0.8) Total current interest-bearing loans and borrowings 8.1 7.8 Non-current interest-bearing loans and borrowings 7.125% Yankee bonds 2018 9.1 8.9Syndicated loan facility 2012 168.6 222.0Obligations under finance leases and hire purchase contracts Various 12.0 12.0 Other non-current loans Unamortised facility fees 2018 (0.3) (0.6) Total non-current interest-bearing loans and borrowings 189.4 242.3 Total interest-bearing loans and borrowings 197.5 250.1
Sterling 119.8 169.2Euros 68.6 72.0US Dollars 9.1 8.9Total interest-bearing loans and borrowings 197.5 250.1
Bank overdrafts Bank overdrafts are for short-term funding and are repayable on demand.
Syndicated loan facility The five year facility was signed on 18 April 2007 and currently consists of a £100.0m term loan and a £200.0m multi-currency revolving credit facility. Interest is payable on a monthly or quarterly basis depending on the loan drawn. The facility carries a floating rate of interest which is LIBOR dependant.
On 3 May 2010, the Group voluntarily reduced its multi-currency revolving credit facility by £50.0m to £200.0m and on 20 October 2010 the Group voluntarily repaid £50.0m of its term loan, reducing it to £100.0m.
Yankee bonds Interest on the Yankee bonds is payable half yearly in January and July at a rate of 7.125%.
Covenant compliance The Group complied with all its covenants during the period.
Company The Company did not hold any interest bearing loans or borrowings at 31 December 2010 (2009: £nil).

101The Rank Group Plc: Annual report and financial statements 2010
18 Financial assets and liabilities continued (b) Hedging activities The Group uses foreign currency denominated borrowings to manage some of its translation exposure in relation to net investments in foreign operations.
Included in loans at 31 December 2010, was a borrowing of €80.0m (2009: €81.0m), which has been designated as a hedge of the net investment in the subsidiaries in Europe and is being used to hedge the Group’s exposure to foreign exchange risk on these investments. Gains or losses on the retranslation of this borrowing are transferred to equity to offset any gains or losses on the translation of the net investments in the subsidiaries. There was no ineffectiveness in either year.
(c) Fair values The table below is a comparison by class of the carrying amounts and fair value of the Group and Company’s financial instruments at 31 December.
Carrying amount Fair value
Group 2010
£m 2009
£m 2010
£m 2009
£m
Financial assets: Loans and receivables Trade and other receivables 2.5 2.1 2.5 2.1Cash and short-term deposits 74.0 64.1 74.0 64.1Total 76.5 66.2 76.5 66.2
Financial liabilities: Other financial liabilities Interest-bearing loans and borrowings
Obligations under finance leases and hire purchase contracts 13.2 12.7 13.2 12.7Floating rate borrowings 168.5 222.0 168.5 222.0Fixed rate borrowings 9.1 8.9 10.3 8.7Other 0.1 (0.8) 0.1 (0.8)
Trade and other payables 75.0 79.0 75.0 79.0Bank overdrafts 6.5 7.3 6.5 7.3Onerous property leases 41.9 31.2 41.9 31.2Lease disposal settlements 2.2 3.0 2.2 3.0Total 316.5 363.3 317.7 363.1
Carrying amount Fair value
Company 2010
£m 2009
£m 2010
£m 2009
£m
Financial assets: Loans and receivables Trade and other receivables 43.6 43.6 43.6 43.6Total 43.6 43.6 43.6 43.6
Financial liabilities: Other financial liabilities Trade and other payables 707.1 752.7 707.1 752.7Financial guarantee contracts 0.1 1.4 0.1 1.4Total 707.2 754.1 707.2 754.1

102 The Rank Group Plc: Annual report and financial statements 2010
Financial statements: Notes to the financial statements continued
18 Financial assets and liabilities continued (c) Fair values continued The fair value of the financial assets and liabilities are included at the amount at which the instrument could be exchanged in a current transaction between willing parties, other than in a forced or liquidation sale. The following methods and assumptions were used to estimate the fair values:
– Cash and short-term deposits, trade receivables and other current liabilities approximate their carrying amounts largely due to the short-term maturities of these instruments.
– The fair value of quoted bonds is based on price quotations at the reporting date.
– The fair value of loans from banks and other financial liabilities, obligations under finance leases, as well as other non-current financial liabilities is estimated at amortised cost using the effective interest rate method.
Fair value hierarchy As at 31 December 2010, the fair value of the $14.3m 7.125% Yankee bonds (2009: $14.3m) is a Level 1 financial instrument and has been throughout the whole of the financial year. Level 1 financial instruments are those valued based on quoted (unadjusted) prices in active markets for identical assets or liabilities.
19 Financial risk management objectives and policies Financial risk factors The Group’s principal financial liabilities comprise loans and borrowings, trade and other payables. The main purpose of these financial liabilities is to finance the Group’s operations. The Group has trade and other receivables, and cash and short-term deposits that derive directly from its operations.
The Group is exposed to market risk, credit risk and liquidity risk.
The Group’s overall financial risk management programme focuses on the unpredictability of financial markets and seeks to minimise potential adverse effects on the Group’s financial performance. The Group, where appropriate, uses financial instruments to hedge certain risk exposures.
The Group’s senior management oversees the management of these risks. The Group’s senior management is supported by the finance committee that advises on financial risks and the appropriate financial risk governance framework for the Group. The finance committee provides assurance to the Group’s senior management that the Group’s financial risk-taking activities are governed by appropriate policies and procedures and the financial risks are identified, measured and managed in accordance with Group policies and Group risk appetite.
The board of directors review and agree policies for managing each of these risks which are summarised below.
(a) Market risk Market risk is the risk that the fair value of future cash flows of a financial instrument will fluctuate because of changes in market prices. Financial instruments affected by market risk include loans and borrowings and deposits.
The sensitivity analyses in the following sections relate to the position at 31 December.
The sensitivity analyses have been prepared on the basis that the amount of net debt, the ratio of fixed to floating rates of the debt and the proportion of financial instruments in foreign currencies are all constant and on the basis of the hedge designations in place at 31 December.

103The Rank Group Plc: Annual report and financial statements 2010
19 Financial risk management objectives and policies continued (a) Market risk continued (i) Foreign currency risk Foreign currency risk is the risk that the fair value of future cash flows of a financial instrument will fluctuate because of changes in foreign exchange rates. The Group’s exposure to the risk of changes in foreign exchange rates relates primarily to the Group’s operating activities (when revenue or expense is denominated in a different currency from the Group’s functional currency) and the Group’s net investments in foreign subsidiaries.
The Group hedges its exposure to fluctuations on the translation of its euro denominated foreign operations by holding euro borrowings. Group policy is to hedge 90% of material, identified exposures.
Foreign currency sensitivity The following table demonstrates the sensitivity of a possible change in the US dollar, with all other variables held constant, to the Group’s profit before tax and the Group’s equity. The Group’s exposure to foreign currency changes for all other currencies is not material.
Change in
US$ rate
Effect on profit
before tax£m
Effect on equity
£m
2010 +3.0% (0.3) – -3.0% 0.3 –2009 +3.0% (0.3) – -3.0% 0.3 –
The Group’s exposure to un-hedged euro foreign currency changes is not material.
(ii) Cash flow and fair value interest rate risk Interest rate risk is the risk that the fair value or future cash flows of a financial instrument will fluctuate because of changes in market interest rates. The Group’s exposure to the risk of changes in market interest rates relates primarily to the Group’s long-term debt obligations with floating interest rates.
Historically the Group had managed its interest rate risk by having a balanced portfolio of fixed and variable rate loans and borrowings. Due to the current economic climate the Group has exercised its right to operate outside the Group policy of maintaining between 40% and 60% of its borrowings at fixed rates of interest. At 31 December 2010, 11% of the Group’s borrowings were at a fixed rate of interest (2009: 9%).
Interest rate sensitivity The table below demonstrates the sensitivity to a possible change in interest rates on income and equity for the year when this movement is applied to the carrying value of loans, borrowings and short-term deposits.
Increase/decrease in basis points
Effect on profit
before tax£m
2010 Sterling +100 (0.9)Euro +100 (0.7) Sterling -100 0.9Euro -100 0.72009 Sterling +100 (1.5)Euro +100 (0.7) Sterling -100 1.5Euro -100 0.7
The assumed movement in basis points for interest rate sensitivity analysis is based on the current observable market environment.

104 The Rank Group Plc: Annual report and financial statements 2010
Financial statements: Notes to the financial statements continued
19 Financial risk management objectives and policies continued (a) Market risk continued Interest rate sensitivity continued As the Group has no significant interest-bearing assets (excluding cash and short-term deposits), the Group’s income and operating cash flows are substantially independent of changes in market interest rates. The Group’s only interest-bearing assets are cash and short-term deposits (excluding cash floats), which earn floating rate interest.
The Group did not enter into any fixed-to-floating or floating-to-fixed interest rate swaps in either year.
(b) Credit risk Credit risk is the risk that a counterparty will not meet its obligations under a financial instrument or customer contract, leading to a financial loss. The Group is exposed to credit risk from its operating activities (primarily for trade receivables) and from its financing activities, including deposits with banks and financial institutions, foreign exchange transactions and other financial instruments.
Financial instruments and cash deposits Credit risk from balances with banks and financial institutions is managed by the Group’s treasury department in accordance with the Group’s policy. Investments of surplus funds are made only with approved counterparties and within credit limits assigned to each counterparty. Counterparty credit limits are reviewed by the finance director, and may be updated throughout the year subject to the approval of the Group’s finance committee. The limits are set to minimise the concentration of risks and therefore mitigate financial loss through potential counterparty failure.
The creditworthiness of each counterparty is checked against independent credit ratings on at least a weekly basis, with a minimum rating of ‘A’ required. The Group predominately uses ‘AAA’ rated Money Market funds when investing its surplus cash. In addition to investing the Group’s cash with Money Market funds, the Group invests with lending banks when appropriate.
Sales to retail customers are settled in cash or using major credit cards and therefore the exposure to credit risk is not considered significant.
No credit limits were exceeded during the reporting period and management does not expect any losses from non-performance of its counterparties.
Analysis of cash and short-term deposits by counterparty credit rating:
2010
£m 2009
£m
AAA 40.3 20.4AA – 14.0A – 1.2BBB 5.1 –Other 1.5 1.7Cash floats 27.1 26.8Cash and short-term deposits 74.0 64.1
(c) Liquidity risk Liquidity risk is the risk that the Group will not have sufficient funds to meet its liabilities. Cash forecasts identifying the liquidity requirements of the Group are produced quarterly. The cash forecasts are sensitivity tested for different scenarios and are reviewed regularly. Forecast financial headroom and debt covenant compliance is reviewed monthly during the month-end process to ensure sufficient financial headroom exists for at least a 12 month period.
Due to the dynamic nature of the underlying businesses, Group treasury aims to maintain flexibility in funding by keeping committed credit lines available. A four-year strategic forecast is prepared annually to facilitate planning for future financing needs. Management actively manages the Group’s financing requirements and the range of maturities on its debt.
The Group’s core debt facility is a £300.0m (2009: £400.0m) syndicated bank facility which expires in April 2012. The Group considers the counterparties to this facility to be of high quality and proactively manages its relationships with its lending group.
The funding policy of the Group is to maintain, as far as practicable, a broad portfolio of debt diversified by source and maturity, and to maintain committed facilities sufficient to cover seasonal peak anticipated borrowing requirements.

105The Rank Group Plc: Annual report and financial statements 2010
19 Financial risk management objectives and policies continued (c) Liquidity risk continued The table below summarises the maturity profile of the Group’s financial liabilities based on contractual undiscounted payments.
On demand
£m
Less than 12 months
£m 1 to 2 years
£m 2 to 5 years
£m >5 years
£m Total
£m
At 31 December 2010 Interest bearing loans and borrowings(1) 6.5 4.5 171.7 4.8 18.5 206.0Trade and other payables – 75.0 – – – 75.0Onerous lease payments – 3.6 3.8 9.5 49.9 66.8Lease disposal settlements – 0.7 0.7 1.0 – 2.4Total 6.5 83.8 176.2 15.3 68.4 350.2 At 31 December 2009 Interest bearing loans and borrowings 7.3 1.6 1.7 227.4 24.0 262.0Trade and other payables – 79.0 – – – 79.0Onerous lease payments – 3.2 2.4 6.9 38.9 51.4Lease disposal settlements – 0.9 0.8 1.5 – 3.2Total 7.3 84.7 4.9 235.8 62.9 395.6
(1) Interest payments on the Yankee bonds and the syndicated facility have been projected until the instruments mature and are based on current LIBOR rates.
Capital management As a result of the difficult conditions that developed in the global capital markets in recent years, the Group’s objectives when managing capital have been to ensure continuing access to existing debt facilities and to manage the borrowing cost of those facilities in order to minimise the Group’s interest charge. The Group’s leverage in 2010 was lower than its revised medium-term strategy, which was to maintain a leverage ratio of approximately 2.5 times. However, given the recent global financial crisis we have maintained sufficient liquidity that, should we have to repay the VAT claims received, we would operate at our leverage target.
Consistent with others in the gaming industry, the Group monitors capital on the basis of leverage ratio. The ratio is calculated as net debt divided by EBITDA. Net debt is calculated as total borrowings (including ‘loans and borrowings’ as shown in the consolidated balance sheet) less cash and short-term deposits, accrued interest and unamortised facility fees. EBITDA is calculated as operating profit before exceptional items plus depreciation and amortisation.
The leverage ratios at 31 December were as follows:
2010
£m 2009
£m
Total loans and borrowings (note 18) 197.5 250.1Less: Cash and short-term deposits (74.0) (64.1)Less: Accrued interest (0.7) (0.6)Less: Unamortised facility fees 0.6 1.4Net debt 123.4 186.8Continuing operations Operating profit before exceptionals 62.0 58.0Add: Depreciation and amortisation 30.3 25.9EBITDA 92.3 83.9 Leverage ratio 1.3 2.2
Taking into consideration both the Group’s capital investment requirements and the stability of the wider economic environment the Group considers its progressive dividend policy to be appropriate. The board sets dividends such that the Group achieves a dividend cover of at least 3 times over the medium-term.

106 The Rank Group Plc: Annual report and financial statements 2010
Financial statements: Notes to the financial statements continued
19 Financial risk management objectives and policies continued (c) Liquidity risk continued Collateral The Group did not pledge or hold any collateral at 31 December 2010 (2009: £nil).
Company The Company is exposed to credit risk on amounts owed by related undertakings. The performance of all subsidiary undertakings of the Group are monitored at Group level, including frequent projections of future performance to ensure funding to related undertakings provide a suitable return and remain recoverable. Where losses are forecast actions are taken to mitigate the loss and maximise the recoverability of receivables.
The maximum exposure to credit risk at the reporting date is the fair value of its receivables of £43.6m (2009: £43.6m).
The Company does not have any other significant exposure to financial risks.
20 Deferred tax The analysis of deferred tax included in the financial statements at the end of the year is as follows:
Group Company
2010
£m 2009
£m 2010
£m 2009
£m
Deferred tax assets: Accelerated capital allowances 31.0 34.6 – –Tax losses carried forward 10.9 10.1 – –Other UK temporary differences – – 0.4 –Deferred tax assets 41.9 44.7 0.4 – Deferred tax liabilities: Other overseas temporary differences (6.2) (6.3) – –Business combinations – non-qualifying properties (1.7) (1.8) – –Other UK temporary differences (18.0) (19.4) – –Deferred tax liabilities (25.9) (27.5) – – Net deferred tax asset 16.0 17.2 0.4 –
Deferred tax assets and liabilities are offset when there is a legally enforceable right to offset current tax assets and current tax liabilities and it is the intention to settle the balances on a net basis. Deferred tax assets and liabilities of £19.8m (2009: £21.2m) have been offset and disclosed on the balance sheet as follows:
Group
2010
£m 2009
£m
Deferred tax assets 22.1 23.5Deferred tax liabilities (6.1) (6.3)Net deferred tax asset 16.0 17.2
The deferred tax assets recognised are recoverable against future taxable profits that the directors consider more likely than not to occur on the basis of management forecasts.

107The Rank Group Plc: Annual report and financial statements 2010
20 Deferred tax continued The Group has overseas tax losses of £32.1m (2009: £33.3m) that are carried forward for offset against suitable future taxable profits. No deferred tax asset has been recognised in respect of these losses as their utilisation is not currently anticipated. The expiry of these losses are as follows:
Group
2010
£m 2009
£m
Expiring in 2017 31.6 32.6No expiry date 0.5 0.7Total 32.1 33.3
The Group has UK capital losses carried forward of £800m. These losses are available for offset against future UK chargeable gains. No deferred tax asset has been recognised in respect of these capital losses as no further utilisation is currently anticipated.
Temporary differences associated with Group investments There was no deferred tax liability recognised (2009: £nil) for taxes that would be payable on the unremitted earnings of certain subsidiaries. The Group has determined that any unremitted earnings that do not fall within the dividend exemption introduced in the Finance Act 2009 will not be distributed in the foreseeable future and the parent company does not foresee giving such consent at the balance sheet date.
The deferred tax included in the Group income statement is as follows:
Group
2010
£m 2009
£m
Deferred tax in the income statement Accelerated capital allowances (3.7) (6.8)Deferred tax movement on fair valued assets 0.1 0.2Tax losses 1.3 (3.6)Other temporary differences 1.4 (7.8)Total deferred tax charge (0.9) (18.0)
Continuing operations (1.4) (16.6)Discontinued operations 0.5 (1.4)Total deferred tax charge (0.9) (18.0)
The deferred tax movement on the balance sheet is as follows:
Group Company
2010
£m 2009
£m 2010
£m 2009
£m
Net deferred tax asset at 1 January 17.2 36.4 – –Exchange adjustments 0.2 0.6 – –Deferred tax (charge) credit (0.9) (18.0) 0.4 –Deferred tax charge on items included in equity (0.5) (1.8) – –Net deferred tax asset at 31 December 16.0 17.2 0.4 –

108 The Rank Group Plc: Annual report and financial statements 2010
Financial statements: Notes to the financial statements continued
21 Provisions
Group
Onerous leases
£m
Disposal provisions
£m Total
£m
At 1 January 2010 31.2 12.4 43.6Exchange adjustments – 0.2 0.2Unwinding of discount 1.2 0.2 1.4Impact of change in discount rate charged to the income statement – exceptional 1.9 – 1.9Charged to the income statement – exceptional 15.9 – 15.9Released to the income statement – exceptional (4.3) – (4.3)Released to the income statement – operating (0.4) – (0.4)Utilised in year (3.6) (2.1) (5.7)At 31 December 2010 41.9 10.7 52.6
Current 3.4 3.4 6.8Non-current 38.5 7.3 45.8Total 41.9 10.7 52.6
Provisions have been based on management’s best estimate of the future cash flows, taking into account the risks associated with each obligation, and have been discounted at a risk free interest rate of between 3.5% and 4.3% (2009: 4.1%) where the effects of inflation will have a material impact.
Onerous leases The Group is party to a number of leasehold property contracts. Provision has been made against those leases where the property is now vacant and the unavoidable costs under the lease exceed the economic benefit expected to be derived from potential sub-letting arrangements. Provision has also been made against leases where impairment testing has indicated that, after recognising an impairment charge, the estimated discounted cash flows derived from the property and its associated operations are insufficient to cover the unavoidable lease costs and the lease is therefore deemed onerous. These leases have a weighted average unexpired life of 26 years.
During 2010, the Group reassessed its estimate of the liability arising under certain onerous lease contracts taking account of changes in the expected benefits to be derived and costs incurred in relation to the contracts. The changes in estimates affected expected sub-let income, dilapidation estimates and lease surrender opportunities. The impact of these changes has been to increase the provision for onerous leases by £11.9m.
Disposal provisions Provision has been made for legacy industrial disease and personal injury claims, deferred payments arising from the settlement of property lease obligations and other directly attributable costs arising as a consequence of the sale or closure of the businesses. The timing of any legacy industrial disease and personal injury claims are uncertain and therefore these claims have been included in the maturity analysis based on management’s best estimates. The disposal provisions held at 31 December comprise the following:
2010
£m 2009
£m
Deferred payments arising on lease settlement and related costs 2.2 3.0Legacy industrial disease and personal injury claims 5.7 5.1Other 2.8 4.3Total disposal provisions 10.7 12.4

109The Rank Group Plc: Annual report and financial statements 2010
22 Share capital
2010
Authorised 2009
Authorised
Number
m
Nominal value
£m Number
m
Nominalvalue
£m
Ordinary shares of 138/9p each 1,296.0 180.0 1,296.0 180.0
2010
Issued and fully paid 2009
Issued and fully paid
Number
m
Nominal value
£m Number
m
Nominalvalue
£m
At 1 January and 31 December – Ordinary shares of 138/9p each 390.5 54.2 390.5 54.2
There were no movements in authorised or issued ordinary shares in either year.
1,059,826 (2009: 1,059,826) ordinary shares in the Company are held by the Rank Group Employee Benefit Trust (‘the Trust’). The amount paid to acquire the shares has been deducted from retained earnings within shareholders’ equity.
Dividends on the shares held by the Trust have been waived by the trustees with the exception of one penny in respect of each dividend that is paid by the Company. The Trust may make such investments in the shares of the Company or otherwise as the trustees may determine to provide benefits to any eligible employee. The benefits may be provided in the form of shares, cash or otherwise, although any share-related benefit will be provided in accordance with an appropriate employee share scheme or bonus scheme of the Company. The shares held by the Trust represent less than 0.3% (2009: 0.3%) of the Company’s called-up share capital. The costs of funding and administering the scheme are charged to the income statement of the Company in the period to which they relate. The market value of the shares at 31 December 2010 was £1.3m (2009: £0.9m).
23 Cash generated from operations Reconciliation of operating profit (loss) to cash generated from operations:
Group Company
2010
£m 2009
£m 2010
£m 2009
£m
Continuing operations Operating profit (loss) 75.4 60.8 0.3 (0.2)Exceptional items (13.4) (2.8) – –Operating profit (loss) before exceptional items 62.0 58.0 0.3 (0.2)Depreciation and amortisation 30.3 25.9 – –Decrease in inventories 0.2 – – –Increase in trade and other receivables (1.1) – – –Increase in trade and other payables 0.3 2.5 – 0.1Share-based payments and other 1.4 0.9 (0.3) 0.2 93.1 87.3 – 0.1Cash utilisation of provisions (5.7) (11.7) – –Cash payments in respect of exceptional items (6.3) (5.9) – –Cash receipts in respect of exceptional items 38.4 – – –Cash generated from operations 119.5 69.7 – 0.1
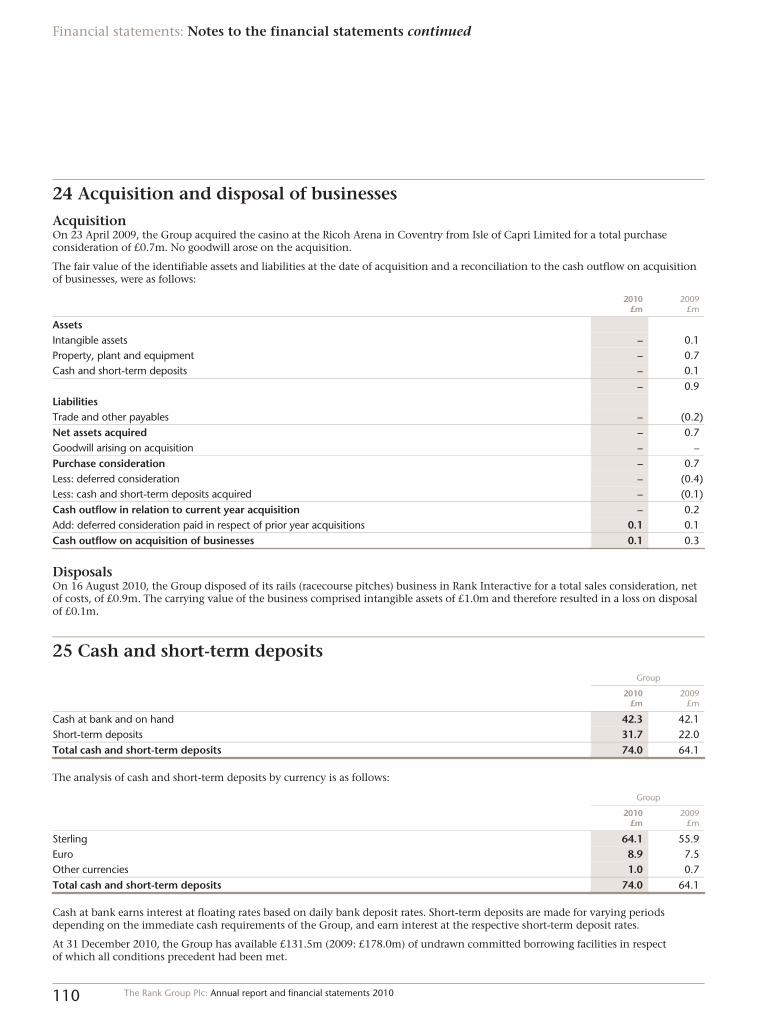
110 The Rank Group Plc: Annual report and financial statements 2010
Financial statements: Notes to the financial statements continued
24 Acquisition and disposal of businesses Acquisition On 23 April 2009, the Group acquired the casino at the Ricoh Arena in Coventry from Isle of Capri Limited for a total purchase consideration of £0.7m. No goodwill arose on the acquisition.
The fair value of the identifiable assets and liabilities at the date of acquisition and a reconciliation to the cash outflow on acquisition of businesses, were as follows:
2010
£m 2009
£m
Assets Intangible assets – 0.1Property, plant and equipment – 0.7Cash and short-term deposits – 0.1 – 0.9Liabilities Trade and other payables – (0.2)Net assets acquired – 0.7Goodwill arising on acquisition – –Purchase consideration – 0.7Less: deferred consideration – (0.4)Less: cash and short-term deposits acquired – (0.1)Cash outflow in relation to current year acquisition – 0.2Add: deferred consideration paid in respect of prior year acquisitions 0.1 0.1Cash outflow on acquisition of businesses 0.1 0.3
Disposals On 16 August 2010, the Group disposed of its rails (racecourse pitches) business in Rank Interactive for a total sales consideration, net of costs, of £0.9m. The carrying value of the business comprised intangible assets of £1.0m and therefore resulted in a loss on disposal of £0.1m.
25 Cash and short-term deposits Group
2010
£m 2009
£m
Cash at bank and on hand 42.3 42.1Short-term deposits 31.7 22.0Total cash and short-term deposits 74.0 64.1
The analysis of cash and short-term deposits by currency is as follows:
Group
2010
£m 2009
£m
Sterling 64.1 55.9Euro 8.9 7.5Other currencies 1.0 0.7Total cash and short-term deposits 74.0 64.1
Cash at bank earns interest at floating rates based on daily bank deposit rates. Short-term deposits are made for varying periods depending on the immediate cash requirements of the Group, and earn interest at the respective short-term deposit rates.
At 31 December 2010, the Group has available £131.5m (2009: £178.0m) of undrawn committed borrowing facilities in respect of which all conditions precedent had been met.

111The Rank Group Plc: Annual report and financial statements 2010
25 Cash and short-term deposits continued For the purpose of the statements of cash flow, cash and cash equivalents comprise the following at 31 December:
Group
2010
£m 2009
£m
Cash and short-term deposits 74.0 64.1Bank overdrafts (6.5) (7.3)Cash and cash equivalents 67.5 56.8
Company The Company did not hold any cash or short-term deposits at 31 December 2010 (2009: £nil).
26 Employees and directors (a) Employee benefit expense for the Group during the year
2010
£m 2009
£m
Wages and salaries 158.7 147.9Social security costs 16.7 15.9Pension costs 2.6 2.5Share-based payments 1.8 0.9Total 179.8 167.2
The Company has no employees. The directors of the Group are paid by a subsidiary undertaking.
(b) Average monthly number of employees by segment 2010 2009
Grosvenor Casinos 3,752 3,430Mecca Bingo 4,145 3,737Top Rank España 590 581Rank Interactive 197 192Central 253 245Total 8,937 8,185
(c) Key management compensation
2010
£m 2009
£m
Salaries and short-term employee benefits (including social security costs) 4.8 4.5Termination benefits 0.7 0.5Post-employment benefits 0.4 0.4Share-based payments 1.6 0.9Total 7.5 6.3
Included in key management compensation are bonuses of £0.9m in the respect of the current year that will be paid in 2011 (2009: £1.3m).
Key management is defined as the directors of the Group and the management team, details of which are set out on page 43. Further details of emoluments received by directors are included in the remuneration report.

112 The Rank Group Plc: Annual report and financial statements 2010
Financial statements: Notes to the financial statements continued
26 Employees and directors (d) Directors’ interests The directors’ interests in shares of the Company, including options to purchase ordinary shares under the terms of the Group’s Executive Share Option Scheme, and conditional awards under the Long Term Incentive Plans, are detailed in the remuneration report. Details of options to subscribe for ordinary shares of the Company granted to or exercised by directors in the year ended 31 December 2010 are also detailed in the remuneration report.
(e) Total emoluments of the directors of The Rank Group Plc
2010
£m 2009
£m
Aggregate emoluments 2.0 2.1
No director accrued benefits under defined benefit pension schemes or made gains on the exercise of share options during either year. Further details of emoluments received by directors are included in the remuneration report.
27 Share-based payments
During the year ended 31 December 2010, the Company operated the Save-As-You-Earn (‘SAYE’) share option scheme, the Executive Share Option Scheme (‘ESOS’) and the Long Term Incentive Plans (‘LTIP’). All of these schemes are equity settled. Further details of the LTIP are included in the remuneration report on pages 60 to 62. The SAYE scheme previously offered to all UK employees has now lapsed and all grants under the ESOS have been suspended.
The number and weighted average exercise prices (‘WAEP’) of, and movements in, each of the share option arrangements during the year are shown below:
Outstanding1 January
2010
Grantedduring
2010
Exercisedduring
2010
Expiredduring
2010
Forfeited during
2010
Outstanding 31 December
2010
Exercisable31 December
2010
ESOS Number of shares 280,219 – – (6,651) – 273,568 273,568WAEP 263.01p – – 271.00p – 262.82p 262.82pSAYE Number of shares 1,250,730 – – (311,427) (19,691) 919,612 625,858WAEP 157.18p – – 180.46p 184.91p 148.70p 146.21pLTIP Number of shares 4,733,532 1,609,969 – (465,036) (389,762) 5,488,703 –WAEP Nil Nil – Nil Nil Nil –
Outstanding1 January
2009
Grantedduring
2009
Exercisedduring
2009
Expiredduring
2009
Forfeited during
2009
Outstanding 31 December
2009
Exercisable31 December
2009
ESOS Number of shares 1,641,490 – – (1,361,271) – 280,219 280,219WAEP 243.99p – – 240.07p – 263.01p 263.01pSAYE Number of shares 2,151,602 – – (833,564) (67,308) 1,250,730 –WAEP 167.49p – – 183.40p 162.15p 157.18p –LTIP Number of shares 4,000,846 1,574,465 – (587,811) (253,968) 4,733,532 –WAEP Nil Nil – Nil Nil Nil –
There were no options exercised during either year.

113The Rank Group Plc: Annual report and financial statements 2010
27 Share-based payments continued The following table lists the maximum term of options granted under each scheme:
Maximum
term (years)
ESOS 10.0 SAYE 5.5 LTIP 4.0
The share options outstanding at the year end have the following range of exercise prices and expiry dates as follows:
Outstanding at 31 December 2010 Outstanding at 31 December 2009
Exercise prices
(range)
Weightedaverage
remainingcontractual
life
Numberof shares
underoption
Exercise prices (range)
Weightedaverage
remainingcontractual
life
Numberof shares
underoption
ESOS 187.50p–271.00p 1.3 years 273,568 187.50p–271.00p 2.3 years 280,219 SAYE 139.00p–225.00p 1.4 years 919,612 139.00p–268.00p 1.6 years 1,250,730 LTIP Nil 1.0 years 5,488,703 Nil 1.4 years 4,733,532
The fair values for each of the ESOS and SAYE awards granted were calculated using a Black-Scholes pricing model. The fair value of LTIP awards is calculated using a Monte Carlo simulation which allows for the incorporation of market performance conditions. For grants made subject to an EPS performance condition, the expense recognised is based on expectations of these conditions being met, which are reassessed at each balance sheet date.
There have been no ESOS or SAYE awards granted during either year.
The following table lists the inputs used for the LTIP grants during the year ended 31 December:
2010 2009
Risk free interest rate (%) 1.11–1.75 1.50Dividend yield (%) 2.50–2.90 3.00Expected volatilty (%) 49.00 48.00Years 3.00 2.33Weighted average share price (p) 115.20–118.90 76.50
The expected life of the awards is based on current expectations and is not necessarily indicative. The expected volatility reflects the assumption that the historical volatility over a period similar to the life of the award is indicative of future trends, which may not necessarily be the actual outcome.
The number of LTIP awards and the fair value per share of the LTIP awards during the year were as follows:
2010 2009
Number 1,609,969 1,574,465Weighted average fair value per share 85.6p 44.4p
The Group recognised a £1.8m (2009: £0.9m) charge in operating profit from accounting for share-based payments and related national insurance contributions in accordance with IFRS 2.
National Insurance contributions are payable in respect of some share-based payments. These contributions are payable on the date of exercise based on the intrinsic value of the share-based payments, and as such are treated as cash-settled awards. The Group has recorded liabilities at the end of 2010 of £0.5m (2009: £0.1m) of which £nil (2009: £nil) was in respect of vested grants.

114 The Rank Group Plc: Annual report and financial statements 2010
Financial statements: Notes to the financial statements continued
28 Retirement benefits Defined contribution scheme The Group operates the Rank Group Stakeholder Pension Plan (‘the Plan’) which is externally funded and the Plan’s assets are held separately from Group assets. During the year to 31 December 2010, the Group contributed a total of £2.6m (2009: £2.5m) to the Plan. There were no significant contributions outstanding at the balance sheet date in either year.
Other pension commitment The Group has an unfunded pension commitment relating to three former executives of the Group. At 31 December 2010, the Group’s commitment was £3.0m (2009: £2.9m). The Group paid £0.1m (2009: £0.1m) in pension payments during the year. The net cost arising on the commitment of £0.2m (2009: £nil) has been recognised in other financial losses in the income statement. The actuarial loss arising on the commitment, resulting from the changes in assumptions outlined below in 2010, was £nil (2009: £0.5m loss) before taxation and £nil after taxation (2009: £0.4m loss). The cumulative amount of actuarial losses on the commitment recognised in the statement of comprehensive income before taxation was £0.5m (2009: £0.5m).
Assumptions used to determine the obligations at 31 December:
2010
% p.a. 2009
% p.a.
Discount rate 5.4 5.7Pension increases 3.4 3.8
The mortality table used to determine the obligation in both years was the PA92 (YOB) mc with a 1.5% p.a. minimum improvement.
29 Commitments Group Operating lease commitments – Group as lessee The Group has entered into commercial leases on certain properties, plant and items of machinery. These leases have durations of from under one year to 54 years.
Future minimum rentals payable under non-cancellable operating leases are as follows:
2010
£m 2009
£m
Not later than one year 39.4 40.0After one year but not more than five years 137.6 140.0After five years 269.3 292.5Total 446.3 472.5
2010
£m 2009
£m
Total future minimum sub-lease payments expected to be received under non-cancellable sub-leases 37.8 53.2
Finance lease commitments – Group as lessee The minimum lease payments under finance leases, together with the present value of the net minimum lease payments, are as follows:
Minimum lease payments Present value of minimum
lease payments
2010
£m 2009
£m 2010
£m 2009
£m
Not later than one year 2.1 1.6 1.2 0.7After one year but not more than five years 7.2 6.5 4.2 3.5More than five years 10.3 11.9 7.8 8.5 19.6 20.0 13.2 12.7
Less: future finance charges (6.4) (7.3) Present value of minimum lease payments 13.2 12.7

115The Rank Group Plc: Annual report and financial statements 2010
29 Commitments continued
2010
£m 2009
£m
Total future minimum sub-lease payments expected to be received under non-cancellable sub-leases 0.8 0.8
Capital commitments At 31 December 2010, the Group has contracts placed for future capital expenditure, primarily relating to property, plant and equipment, of £5.9m (2009: £1.5m).
Company Financial guarantees The amortised value of financial guarantees issued by the Company is £0.1m (2009: £1.4m).
30 Contingent assets Group The Group has lodged a number of claims following the House of Lords decision in the Condé Nast/Fleming cases on the applicability of the three year cap that HMRC introduced to limit VAT reclaims. These claims, which had to be submitted by March 2009, are based on management’s best estimates from the information available and the Group expects HMRC to closely review both the Group’s right to the amounts claimed and the value of each claim before settlement. In a number of cases, the Condé Nast claims are subject to successful outcomes of other claims for the repayment of VAT (including the claims for interval bingo, main stage bingo and amusement machines already received by the Group) the outcome of which is not certain.
One of the claims identified above is for the repayment of VAT on some games of bingo covering the period from 1996 back to 1973, when VAT was introduced. This claim has been made under the Condé Nast/Fleming ruling detailed above and HMRC issued guidance in January 2010 that this type of claim could be paid once the amount has been verified. This claim is currently estimated to be worth approximately £65m plus interest covering the period of the claim to the present date but continues to be reviewed by HMRC. Consequently the Group is uncertain as to when or if it will be received.
The Group also submitted a claim in 2010 which extends its existing claims for overpaid VAT on bingo back to 2002. This claim could be worth approximately £11m plus interest covering the period of the claim to the present date. HMRC paid £7.1m in February 2011, with interest of £1.4m expected to be received in March 2011. The balance of the claim is subject to HMRC validation.
The Group has not recognised any gain in its financial statements at 31 December 2010 in respect of the above items.
Company The Company had no contingent assets at either reporting date.

116 The Rank Group Plc: Annual report and financial statements 2010
Financial statements: Notes to the financial statements continued
31 Contingent liabilities Group On 10 November 2008, the Group received £59.1m in overpaid VAT from HMRC, following the VAT and Duties Tribunal’s ruling in May 2008 that the application of VAT to some games of interval bingo contravened the European Union’s principle of fiscal neutrality. HMRC has appealed rulings from the VAT and Duties Tribunal and Upper Tribunal and the case has now been referred to the European Court of Justice (ECJ). The Group expects the case will be heard in 2011. In the event of an adverse ruling, Rank would be required to repay the £59.1m and amounts not paid over for the period from July 2008 to 26 April 2009 plus interest. In September 2010, the Group entered into an agreement with a third party that would result in the receipt of £40.5m in the event that the Court finds in favour of HMRC. This agreement was funded by a payment of £4.6m which has been recognised as an exceptional cost.
On 21 May 2010, the Group received £42.5m in overpaid VAT from HMRC relating to main stage bingo and amusement machines. This payment was made in response to HMRC’s stated guidance on settling main stage bingo claims and following the Tribunal’s ruling in 2009 that the application of VAT to certain types of amusement machine contravened the European Union’s principle of fiscal neutrality. HMRC continues to appeal the claim, with the case also referred to the ECJ and again expected to be heard in 2011. In the event of an adverse ruling, Rank would be required to repay the £42.5m plus interest.
The Group has been in negotiation with HMRC for several years on the means by which it calculates the amount of irrecoverable VAT in Grosvenor Casinos. Since July 2007 the Group has accounted for irrecoverable VAT on the basis that HMRC was correct. As a result, the amount of irrecoverable VAT suffered by Grosvenor Casinos exceeded the amount that the Group believed was due. The difference in the Group’s position as against HMRC’s position for the period under negotiation (July 2007 to December 2010) amounts to £6.3m. In 2010, the point of dispute between the Group and HMRC was the subject of litigation by another, similar, taxpayer. In that case, the First-tier Tribunal and the Upper Tribunal have ruled that HMRC’s position was incorrect. While HMRC has appealed, precedent case law indicates that the Group’s position is correct and on that basis the irrecoverable VAT charge has been adjusted accordingly. However, it remains possible that this decision will be reversed on appeal, in that event the Group would have to pay the VAT in dispute (see above) plus interest.
The directors consider that, in respect of all contingent liabilities disclosed above, it is more likely than not that no outflow will arise.
A summary of the various VAT claims is provided in the tax fact file on page 39.
Company At 31 December 2010, the Company has made guarantees of advances to subsidiary undertakings of £181.6m (2009: £236.8m).
32 Related party transactions Group Details of compensation of key management are disclosed in note 26.
Entities with significant influence over the Group At 31 December 2010, Guoco Group Limited (‘Guoco’), a parent company of Rank’s largest shareholder, owned 29.25% (2009: 29.25%) of the ordinary shares in The Rank Group Plc.
Tim Scoble and Mike Smith were appointed as non-executive directors by shareholders at the Company’s annual general meeting on 22 April 2010 as appointees of Guoco. Details of payments made during 2010 in relation to their fees are disclosed in the remunerationreport on page 64.
Company The following transactions with subsidiaries occurred in the year:
2010
£m 2009
£m
Dividend received from subsidiary undertaking 77.5 –Interest payable to subsidiary undertaking (23.9) (37.2)
During the year, Rank Group Finance Plc, a subsidiary of the Company, provided additional cash to the Company of £8.1m for the purpose of funding dividend payments. The Company used the cash received from the £77.5m dividend from another subsidiary undertaking to repay amounts due to Rank Group Finance Plc. Full details of how the cash funding was utilised are disclosed in the Company cash flow statement.

117The Rank Group Plc: Annual report and financial statements 2010
33 Principal subsidiaries The Company owns directly or indirectly 100% of the ordinary share capital and voting rights of the following companies(1):
Name Country of incorporation Principal activities
Mecca Bingo Limited England and Wales Social and bingo clubs Rank Leisure Limited England and Wales Adult gaming centres in Mecca Bingo and Grosvenor
Casinos Rank Holding España SA Spain Owns the Group’s investments in Top Rank España Grosvenor Casinos Limited England and Wales London and provincial casinos Blue Square Gaming (Alderney) Limited Alderney Interactive gaming and sports betting Rank Interactive Development Limited England and Wales Support services to interactive gaming Blue Square Limited(2) England and Wales Support services to interactive gaming Rank Group Gaming Division Limited England and Wales Intermediary holding company and provision of shared
services Rank Leisure Holdings Limited England and Wales Intermediary holding company and corporate activitiesRank Nemo (Twenty-Five) Limited(2) England and Wales Intermediary holding company Rank Overseas Holdings Limited England and Wales Intermediary holding company Rank Holdings (Netherlands) BV Holland Intermediary holding company Rank Group Finance Plc(2) England and Wales Funding operations for the Group
(1) The Group comprises a large number of companies and it is not practical to list all companies. The table above therefore includes those companies which the directors consider principally affect the consolidated results or financial position of the Group.
(2) Directly held by the Company.
The principal activities are carried out in the country of incorporation as indicated above. All subsidiary undertakings are included in the consolidation and have a 31 December year-end.
34 Post balance sheet event The Group submitted a claim in 2010 which extends its existing claims for overpaid VAT on bingo back to 2002. On 16 February 2011, HMRC paid £7.1m, with interest of £1.4m expected to be received in March 2011. As outlined in note 31, HMRC continues to appeal and in the event of an adverse ruling, Rank would be required to repay the £7.1m plus interest.

118 The Rank Group Plc: Annual report and financial statements 2010
Other information
FIVE YEAR REVIEW
Year ended 31 December
2010
£m 2009
£m 2008
£m 2007
£m 2006
£m
Continuing operations Revenue reported in internal information 567.8 540.0 522.2 534.4 549.6Free bets, promotions and bonuses (23.3) (19.5) (16.8) (23.4) (15.2)Revenue 544.5 520.5 505.4 511.0 534.4 Operating profit before exceptional items 62.0 58.0 60.3 68.3 73.2Exceptional items credited (charged) against operating profit 13.4 2.8 (69.4) (45.2) 53.7Group operating profit (loss) 75.4 60.8 (9.1) 23.1 126.9 Total net financing charge (1.9) (8.8) (17.0) (16.0) (34.0) Profit (loss) before taxation 73.5 52.0 (26.1) 7.1 92.9 Taxation (24.6) (14.1) 6.2 (12.4) 21.6 Profit (loss) after taxation from continuing operations 48.9 37.9 (19.9) (5.3) 114.5 Discontinued operations 4.3 0.6 15.0 316.8 4.5 Profit (loss) for the year 53.2 38.5 (4.9) 311.5 119.0
Adjusted earnings per share – basic 10.2p 8.9p 7.3p 7.4p 4.6pBasic earnings (loss) per ordinary share 13.7p 9.9p (1.3)p 72.4p 19.9pBasic earnings per ordinary share before exceptional items 9.8p 9.0p 6.5p 7.7p 11.8p
Total ordinary dividend (including proposed) per ordinary share 2.40p 1.35p – 2.00p 6.00p
Group funds employed Intangible assets and property, plant and equipment 370.4 365.5 362.8 358.2 377.0Investments – – – 0.1 0.5Defined benefit pension asset – – – 130.7 75.8Disposal groups – – – – 197.5Provisions (52.6) (43.6) (56.3) (80.4) (54.1)Other net liabilities (116.7) (103.7) (84.4) (105.0) (74.2)Total funds employed at year-end 201.1 218.2 222.1 303.6 522.5
Financed by Ordinary share capital and reserves 77.7 31.4 (4.4) (13.3) 75.3Net debt (note 19) 123.4 186.8 226.5 316.9 447.2 201.1 218.2 222.1 303.6 522.5
Average number of employees (000s) 8.9 8.2 7.8 9.3 19.0
119The Rank Group Plc: Annual report and financial statements 2010
Other information
SHAREHOLDER INFORMATION
2011 financial calendar1 April Record date for 2010 final dividend14 April Annual general meeting and interim
management statement4 May Payment date for 2010 final dividend28 July Interim results announcementOctober Interim management statement
RegistrarAll administrative enquiries relating to shares should, in the first instance, be directed to the Company’s registrar (quoting reference number 1235) and clearly state the registered shareholder’s name and address. Please write to The Rank Group Plc Registrar, Equiniti Limited, Aspect House, Spencer Road, Lancing, West Sussex BN99 6DA (Tel: from the UK 0871 384 2098 and from outside the UK +44 121 415 7047).
There is a text phone available on 0871 384 2255 for shareholders with hearing difficulties.
(Calls to both of the UK numbers are charged at 8p per minute from a BT landline. Other telephony provider costs may vary.)
ShareviewThe Shareview portfolio service from the Company’s registrar gives shareholders more control of their Rank shares and other investments including:
– direct access to data held for them on the share register including recent share movements and dividend details;
– a recent valuation of their portfolio; and
– a range of information and practical help for shareholders including how you can elect to receive communications electronically.
It is easy and free to set up a portfolio – shareholders will just need the shareholder reference printed on their proxy form or dividend stationery. Please visit the following website for more details: www.shareview.co.uk.
Payment of dividendsThe Company is no longer operating a dividend re-investment plan. Shareholders may find it more convenient to make arrangements to have dividends paid directly to their bank account. The advantages of this are that the dividend is credited to a shareholder’s bank account on the payment date, there is no need to present cheques for payment and there is no risk of cheques being lost in the post.
To set up a dividend mandate or to change an existing mandate please contact Equiniti Limited, our registrar, whose contact details are adjacent. Alternatively, shareholders who use Equiniti’s Shareview can log on to www.shareview.co.uk and follow the online instructions.
Shareholder informationA wide range of information for shareholders and investors is available in the Investors area of the Rank Group website: www.rank.com.
Frequently asked questionsWe have a shareholder ‘frequently asked questions’ section on our website which provides answers to many questions that shareholders have: www.rank.com/investor/shareholders/faqs.
Share price informationThe latest information on the Rank ordinary share price is available in the Investors area of the www.rank.com website. Closing share prices for the previous business day are quoted in most daily newspapers and, throughout the working day, time-delayed share prices are broadcast on the text pages of the principal UK television channels.
Capital gains taxFor the purpose of calculating UK capital gains tax on a disposal of ordinary shares in the Company held since 31 March 1982 (including shares held in the predecessor company, The Rank Organisation Plc), the price of the Company’s ordinary shares at that date was 190p per share. This price should be adjusted for the effects of the rights issue in January 1990, the enhanced share alternative in July 1993, the sub-division and consolidation of shares in March 1994, the enhanced scrip dividend in March 1998, and the 18 for 25 sub-division and share consolidation (aligned with the 65p special dividend payment) which took place in March 2007. More information regarding these adjustments is available on the www.rank.com website.
Shareholder securityShareholders are advised to be wary of any unsolicited advice, offers to buy shares at a discount, or offers of free reports about the Company. Details of any share dealing facilities that the Company endorses will be included in Company mailings or on our website. More detailed information can be found at www.moneymadeclear.fsa.gov.uk.
ShareGiftShareholders with a very small number of shares, the value of which may make it uneconomical to sell, may wish to consider donating them to charity through ShareGift, a registered charity administered by The Orr Mackintosh Foundation.
Further information about ShareGift is available at www.sharegift.org or by writing to:
ShareGift 17 Carlton House Terrace London SW1Y 5AH Tel: 020 7930 3737
For any other information please contact the following at our registered office:
Frances Bingham, company secretary Dan Waugh, director of strategy Philip Munn, investor relations officer
Registered officeThe Rank Group Plc, Statesman House, Stafferton Way, Maidenhead SL6 1AY Tel: 01628 504 000
The Rank Group Plc Registered in England and Wales No. 03140769

120 The Rank Group Plc: Annual report and financial statements 2010
Other Information continued
OUR GAMES
Brand distribution
Activity Description How we generate revenue Land based* Remote
Bingo Lottery-style community game– Main stage– Interval
Participation fee charged for arranging game
Mecca BingoTop Rank España
Mecca BingoBlue Square
Casino Table games played against the house e.g.– Roulette – Blackjack
Casino enjoys marginally greater probability of winning than losing (‘House edge’)
Grosvenor Casinos Grosvenor CasinosBlue Square
Card room games Community games– Poker– Mah Jong
Flat fee or percentage fee (‘rake’) charged for arranging game
Grosvenor Casinos Blue Square
Gaming machines – Reel-based – Video
Machines based on random number generator, configured to pay out less than amount staked over a cycle
Grosvenor CasinosMecca BingoTop Rank España
Grosvenor CasinosMecca BingoBlue Square
Sports betting Gambling on the outcome of uncertain events (e.g. sports results)
‘Odds’ set to give bookmaker statistical advantage
Blue Square
* Limited casino, poker and sports betting permitted in some of Top Rank España’s venues.
Gaming machine regulations in Great Britain 2010/11 Stakes and prizes
Machine category A* B1 B2 B3 B4 C D
Max stake Unlimited £2 £100 £1** £1 £1 10pMax prize Unlimited £4,000 £500 £500 £250 £70 £5
Maximum permitted per licensed establishment
Regional casino Up to 1,250 in aggregateLarge casino – Up to 150 in aggregateSmall casino – Up to 80 in aggregate1968 Act casino – Up to 20 in aggregate – –Betting office – – Up to 4 in aggregateBingo club – – – Up to 8 in aggregate** UnlimitedAdult gaming centre – – – Up to 4 in aggregate** Unlimited
* Category A machines are permitted only in the Regional Casino provided for within the 2005 Act. At present the Government has no plans to permit the development of the Regional Casino.
** HM Government has proposed to increase maximum stake on B3 machines to £2 and to permit a higher allocation in bingo clubs and adult gaming centres.

The Forest Stewardship Council (FSC) is an international network which promotes responsible management of the world’s forests. Forest certification is combined with a system of product labelling that allows consumers readily to identify timber-based products from certified forests.
Communications and consultancy by Black Sun plc Printed by Royle Print
Financial terminologyRevenue Income retained by Group after deductions for VAT and players’ winnings
Like-for-likeExcludes club openings, closures and relocations; and changes to gaming taxation
EBITDAEarnings before interest, tax, depreciation, amortisation and exceptional items
Operating marginOperating profit expressed as a percentage of revenue
KPI terminologyCustomersUnique customers visiting a bingo club or casino or operating an online or telephone betting account in the 12-month period
Customer visitsIndividual customer visits to bingo clubs and casinos
Spend per visitRevenue divided by customer visits
Online – offline crossover Percentage of adults participating in both remote and land-based gambling
Net promoter scoreA measure of a customer’s propensity to recommend
Gaming industry terminologyInterval games Automated game of bingo played in a licensed club
Adult gaming centre A licensed gaming machines arcade
Main stage bingo Traditional game of bingo played in a licensed club
Pari-mutuel gaming Gaming where players compete with each other to win prizes. The house may take a fee for organising the game but does not participate actively. Also called ‘player-to-player’ gaming
Remote betting and gamingGambling services offered to customers via the internet and mobile phone
Server based gaming machinesElectronic gaming machines where games may be loaded via an internet connection
Comisión Nacional del JuegoThe governing body for the gambling industry in Spain
Gambling Commission The governing body for all sectors of gambling in Great Britain, with the exceptions of the National Lottery and spread betting
GamCare A charitable organisation that provides counselling and other services to those with gambling-related problems
GREaTA charity that funds treatment, education and research related to problem gambling
GLOSSARY
Front cover:Rank gong appears courtesy of the London Film Museum.
Entertaining people since 1937:Rank Gong Man appears courtesy of ITV Studios Global Entertainment.

The Rank Group Plc Statesman House Stafferton Way Maidenhead SL6 1AY
Telephone 01628 504000
Web www.rank.com
Company registration number: 03140769