enterprise zones study - oregon state legislature
TRANSCRIPT

LEGISLATIVE REVENUE OFFICE State Capitol Building 900 Court Street NE, 143 Salem, Oregon 97301 (503) 986-1266 http://www.leg.state.or.us/comm/lro/home.htm
Research Report
Number 4-09 April 1, 2009 SB 151 Report
Enterprise Zones Study Highlights of Results:
• In general, the short-term analysis shows larger employment and payroll gains for firms in enterprise zones directly receiving property tax exemptions than for those in comparison areas.
• The short-term analysis shows no discernable difference in job growth for firms located in enterprise zones that did not receive tax exemptions and firms not located in enterprise zones.
• By all measures of economic activity used in the study—job growth, total payroll and average wage, firms in rural remote enterprise zones lagged behind comparison areas.
• The long-run analysis showed that in general, poverty rates and unemployment rates declined more in enterprise zones between 1990 and 2000 than for comparison areas, while household income and other measures did not show the same positive trend.
• An analysis of internal rate of return for sponsoring governments showed that it takes 7 years on average to recover the undiscounted value of property taxes forgiven.
• On average, internal rate of return calculations show that the cost of property tax exemptions per new full time job is about $11,200. When only non-power, non-waiver projects are included, property taxes forgiven per job drops to about $7,800.
Background SB 151 from the 2007 regular session directed the Legislative Revenue Officer to prepare a report that evaluates the performance of enterprise zones and related tax incentives under ORS 285C.050 to 285C.250. The bill specified that the effects of the property tax incentive on the state and local economies, public finance and government services be examined. The bill further specified that a statistical analysis of change in measures of community economic hardship over time for those local areas that have adopted enterprise zones be conducted. To provide direction for the study the Legislative Revenue Office established a study review team. In addition to Legislative Revenue Office staff, the review team consisted of the following members: Art Ayre, Employment Department Tony Rufolo, Portland State University Jon Hart, Department of Revenue Doris Penwell, Association of Oregon Counties Hasina Squires, Special Districts Association Andy Shaw/Willie Tiffany/Michael Novak, League of Oregon Cities

RR 4-09 Enterprise Zones
LRO Page 2 4/2/2009
The review team worked closely with Karen Goddin and Art Fish from the Department of Economic and Community Development to frame the analysis and gather the appropriate data. In July of 2008, the Legislative Revenue Office contracted with Ed Waters, a private consultant in Beaverton, Oregon, to conduct tests on the historical impact of enterprise zones on job growth, overall payrolls and socioeconomic characteristics of local economies sponsoring enterprise zones. The review team provided guidance, data and comments on drafts. The remainder of the report is mostly the product of Dr. Waters’ research amalgamated with input from the review team. This research has relied heavily on the Oregon Employment Department’s research section, and Art Ayre, the State Employment Economist, in particular to extract and analyze large amount of data and statistics. Similarly, The Economic and Community Development Department, and Art Fish in particular were instrumental in providing data, information and analysis. The efforts of both these departments were vital for the success of this research.
Introduction
In October 2008, the project advisory group approved an approach for examining enterprise zone costs and benefits. The approach for examining benefits analyzes data from two such stratified samples of enterprise zones (EZs1) at two points in time, and compares observed trends against trends for comparison areas (CAs2) selected to show strong correlation to the EZs in terms of employment, industrial and geographic similarities:
• One method compares direct change in employment and payroll from state databases at the Oregon Employment Department for the selected EZs and CAs over a rather short period of time (2003 to 2006). These state databases are for “covered employment”— i.e., those persons covered by unemployment insurance or other payroll withholdings. (Short Term)
• A second approach utilizes U.S. Census numbers from 1990 and 2000 to examine broad measures of economic welfare (e.g., poverty rates, unemployment rates, and household income) in sample EZs and comparison areas. (Long Term)
• Costs of tax incentives provided under the enterprise zone program are evaluated using estimates of historic tax exemptions by business firm projects and net employment gains associated with participating firms. These data are used to derive indicators of the Internal Rate of Return (IRR) by calculating abated property taxes per net job created and the number of years required to recover abated property taxes once EZ exemptions expire.
The project advisory group identified five categories (strata) of EZs based on geography, and approved two samples of EZs for examination under the two approaches. The five strata used for categorizing EZs in the two samples are as follows:
1. Urban Metro (Urban EZs in the Portland metro region) 1 EZ = Enterprise Zone, and the plural will be referred to as EZs from this point on. 2 CA = Comparison Area, and the plural will be referred to as CAs from this point on.

RR 4-09 Enterprise Zones
2. Urban Western Valley (Urban EZs outside Portland along the I-5 corridor) 3. Rural Westside (Non-urban EZs west of the Cascades) 4. Rural Eastside (Non-urban EZs located east of the Cascades) 5. Rural Remote (Rural Eastside EZs located far from population centers and major roads).
(Maps of all current Oregon EZs are available at: http://info.econ.state.or.us:591/ezones/zonew.htm).
Sample for short-term (2003-2006) comparison of direct employment effects:
Criteria used for selecting sample EZs for the short-term comparison include: (1) establishment prior to 2000, (2) still in existence in 2006; (3) continuous classification as EZ since inception; and (4) at least some utilization, the heavier the better, in order to gauge the relative impact of enterprise zone activity or utilization apart from the mere existence of a designated EZ.
The following table lists the sample of fifteen EZs selected for the short-term (2003-2006) comparison of direct employment effects (Note: this list was revised in October 2008).
Table 1. Short-term sample EZs
Stratum EZ Name Location Inception Date No.
Urban Metro N/NE Portland Multnomah Co. industrial/commercial 1986 1 Milwaukie/N
Clackamas Co. North Milwaukie, Johnson Cr., Int’l. Way 1998 2
Urban Western Valley
Salem Various commercial and industrial 1988 3
Springfield Western 2/3 of Springfield city limits 1989 4 Medford Urban I-5, 99 corridor + airport 1997 5 Rural Westside South Santiam Lebanon and some tracts near I-5 1986 6 Bay Area Coos Bay and North Bend 1986 7 Tillamook Rockaway B., Garibaldi, Bay City, Till. Co.
Creamery, Tillamook, Port of T.B. Industrial Park
1986 8
Rural Eastside Klamath Falls City of K.F. and UGB 1986 9 Pendleton/Pilot
Rock Pendleton I-84 - Hwy 11 corridor + northern Pilot Rock UGB
1987 10
The Dalles /Wasco Co.
Northern part of The Dalles between I-5/RR tracks and Col. R.
1986 11
Redmond City of Redmond and other industrial areas inside UGB
1988 12
Rural Remote Grant Co. Mount Vernon, John Day, Canyon City and Prairie City
1999 13
Harney Co, Hines UBG, Burns UBG and Airport 1996 14 Lakeview City of Lakeview and airport 1996 15
Sample for long-term (1990-2000) comparison of broad socioeconomic effects
The following table lists the sample of sixteen EZs selected for the long-term (1990-2000) comparison of broader measures of economic welfare. This sample differs slightly from the short-term sample due to a desire to include EZs with as long a history as possible and a relaxation of the requirement that the zone be utilized at some time. Note that several EZs in the
LRO Page 3 4/2/2009

RR 4-09 Enterprise Zones
LRO Page 4 4/2/2009
sample, including all EZs in the Rural Remote stratum, were established after 1990 (EZs established after 1990 are denoted by *).
Table 2. Long-term sample EZs
Stratum EZ Name Location Inception Date No.
Urban Metro N/NE Portland Multnomah Co. industrial/commercial 1986 1 Urban Western Valley
Salem Various commercial and industrial 1988 2
Springfield Western 2/3 of Springfield city limits 1989 3 Rural Westside South Santiam Lebanon and some tracts near I-5 1986 4 Bay Area Coos Bay and North Bend 1986 5 Tillamook Rockaway B., Garibaldi, Bay City, Till. Co.
Creamery, Tillamook, Port of T.B. Industrial Park
1986 6
Port Orford City of Port Orford, Curry Co Airport and areas in between along Hwy 101
1987 7
Oak Ridge Cities of Oakridge and Westfir and area below Hills Cr. Res. dam.
1987 8
Rural Eastside Klamath Falls City of K.F. and UGB 1986 9 Pendleton/Pilot
Rock Pendleton I-84 - Hwy 11 corridor + northern Pilot Rock UGB
1987 10
The Dalles /Wasco Co.
Northern part of The Dalles between I-5/RR tracks and Col. R.
1986 11
Redmond City of Redmond and other industrial areas inside UGB
1988 12
Madras / Jefferson Co.
Cities of Madras and Metolius 1994* 13
Rural Remote Grant Co. Mount Vernon, John Day, Canyon City and Prairie City
1999* 14
Harney Co, Hines UBG, Burns UBG and Airport 1996* 15 Lakeview City of Lakeview and airport 1996* 16 * Denotes EZ established after 1990
Selection of comparison areas: Comparison areas (CAs) were selected based on matching (using a simple correlation factor) the private sector industry employment profiles of the combined EZs in each short-term and long-term sample stratum against the private sector industry employment profiles of a list of candidate census tracts3. An aggregate of up to ten candidate census tracts with private industry employment profiles that most closely matched the combined sample EZs was selected as the CA for each stratum. Matching was determined by comparing the percentage distribution of employment by two-digit NAICS private industry category. Comparison areas were selected from among the candidate census tracts in each stratum that fall entirely outside existing EZ boundaries4. Table 3 lists the counties included for identifying potential comparison areas for each sample stratum.
3 Use of a Hachman index (a type of weighted location quotient) was initially considered for this purpose. However, calculation of Hachman indices proved problematic in cases where EZs or candidate areas had relatively non-diversified industry structures. Consequently, this approach was abandoned in favor of the easier to implement simple correlation factor. 4 Two census tracts in Malheur County (9701 and 9708) were assigned to the Rural Remote stratum. Also, there were an insufficient number of candidate census tracts in the Rural Remote stratum to find strong matches with EZs in the stratum.

RR 4-09 Enterprise Zones
LRO Page 5 4/2/2009
Table 3. List of counties corresponding to each sample stratum
Stratum Counties included for matching as possible CAs
1. Urban Metro Clackamas, Columbia, Multnomah, Washington, Yamhill
2. Urban Western Valley Benton, Jackson, Josephine, Lane, Marion, Polk
3. Rural Westside Clatsop, Coos, Curry, Douglas, Lincoln, Linn, Tillamook
4. Rural Eastside Baker, Deschutes, Gilliam, Hood River, Jefferson, Klamath, Malheur*, Morrow, Sherman, Umatilla, Union, Wasco
5. Rural Remote** Crook, Grant, Harney, Lake, Wallowa, Wheeler
* Two tracts in Malheur County (9701 and 9708) were assigned to the Rural Remote stratum. ** Due to data deficiencies, candidate areas for Rural Remote included tracts from Rural Eastside stratum.
The correlation factors for the aggregated candidate areas that provided the best matches for each combined sample EZ stratum are reported in Table 4.
Table 4. Correlation factors for CAs identified for each sample stratum*
Sample Urban Metro
Urban Western
Valley Rural
Westside Rural
Eastside Rural
Remote
Short-term (correlation in 2003) 0.897 0.890 0.755 0.875 0.904
Long-term (correlation in 1990) 0.987 0.992 0.982 0.978 0.962
* Scale of 0 to 1.00 where 1.00 = exact match.
Data collection and analysis
Sample EZ areas were defined with geo-coded data—geographic information system (GIS) shape files—as prepared by local governments and collected by the Oregon Economic and Community Development Department (OECDD). Geographic data are now available for a majority of the current enterprise zones in Oregon. These shape files represent the zone boundaries as they currently exist5.
Therefore, the pool of potential comparison areas for Rural Remote EZs was expanded to include candidate census tracts from the Rural Eastside stratum. 5 Changes in EZ boundaries since the period of the short-term sample are relatively minor and should not necessarily affect the validity of the analysis. For the long-term sample the changes to EZ boundaries are probably also acceptable, given caveats and recommendations on how to improve the approach taken in future investigations (see Summary and Conclusions).

RR 4-09 Enterprise Zones
Short-term employment and payroll data analysis Employment Department staff assembled geo-coded private sector payroll and employment data for 2003 and 2006 from confidential state databases. These data were then examined by the Employment Department to discern the change in payroll and employment over the data period for each sample stratum and corresponding CA. Government sector employment and payroll were removed from the data to reduce possible bias introduced in some years by assigning agency jobs to the agency centers rather than to field offices. Trends in total employment, total payroll and average payroll for EZ program beneficiaries in each stratum were compared against trends for all private sector employers located within EZ boundaries in the stratum (i.e., not just those receiving exemptions), trends for private sector employers in the corresponding aggregated comparison areas, and trends for the state as a whole.
In order to gain another perspective for comparison, data for census tracts that overlie EZs in each stratum were compared with data for census tracts that do not overlie EZs and with the state and as a whole. The same three variables (total employment, total payroll and average payroll) were examined.
Long-term socioeconomic data analysis Census data from 1990 and 2000 were assembled and analyzed by the Employment Department. Measures of economic welfare examined included poverty rate, unemployment rate, housing vacancy rate, total household income, and median gross rent as a share of median household income. Change in these variables over the data period (1990 to 2000) was calculated for EZs in each long-term sample stratum. Trends in these variables for EZs were compared against data trends for corresponding CAs in each stratum and against overall data trends for the entire state.
Internal rate of return data analysis Based on 12 years of annual reports from county assessors to the Oregon Department of Revenue, OECDD assembled estimates of property tax “savings” by project, for which new property was exempt for three to five years in EZs. OECDD also projected property tax payments on that property over years following the exemption period, as well as tabulating reconciled data for the net increase in full-time, year-round jobs in the EZ, as reported annually on property tax forms by the benefiting business while receiving tax abatement. These data included records for all 45 EZs that were active during the 1995–2006 period, comprising 460 separate exemptions or “projects”.
In order to compare EZ project data with what was in the short- and long-term samples, each EZ in the database was assigned to a stratum based on its primary county, as outlined in Table 3. For example, projects in the Albany EZ were assigned to the Rural Westside stratum because the Albany EZ boundaries lie within Linn County. While geographic delineation based on divisions finer than county boundaries may have helped to improve comparability, time constraints prevented exploring this.
These data were used to estimate the effect on property taxes due to exemptions granted to qualified businesses—i.e., property tax “savings” to the firms, or revenue “foregone” by the local governments/other taxpayers. They are also used to calculate two indicators of internal rate of return: (1) the approximate number of years required to recover the exempted property taxes once EZ exemptions expire, and (2) the amount of foregone taxes per net new job.
LRO Page 6 4/2/2009

RR 4-09 Enterprise Zones
The data for property taxes during the exemption period incorporate changes in property values that would have normally determined the property’s taxable value. For the purpose of forecasting taxes that the property will generate after the end of the exemption period, this rate of property value change for each investment was assumed to continue, integrating features of Oregon property taxation, such as the 3-percent-per-year cap on value appreciation for real property. On average, the assumed rate of depreciation for EZ projects could overstate the long-run decline in property value because of the near-term drop in value for various types of machinery & equipment during the exemption period.
Additional work by OECDD which wasn’t incorporated in this analysis but which might be utilized in a future assessment includes estimation of factors to account for (1) potential systemic errors in county assessment valuations, (2) the “shifting” of taxes under levies, and (3) present value calculations for local property tax amounts based on any chosen discount rate. While not directly addressed in this study, OECDD has also developed a method to illustrate the “but-for” issue of whether the property tax savings may have significantly induced the capital investment relative to what would otherwise have occurred. OECDD used the relative size of the capital investment of each project to derive a probability of that project not otherwise occurring. This probability factor can then be adjusted, not only to see how it changes estimated property taxes that are either lost or gained, but also to capture other benefits and costs for state & local public finances over a notional 20-year period.
Inferences and Results Short-term trends in employment, payroll and average pay per job
The following three tables show the results of examining short-term (2003-2006) trends in employment, total payroll and average pay per job in the short-term sample Enterprise Zones and Comparison Areas.
Table 5. Private sector employment in 2003 and 2006 in EZs and CAs by sample stratum
OregonUrban Metro
Urban Western
ValleyRural
WestsideRural
EastsideRural
RemoteEmployment in Firms Participating in EZ Program within Sample Ezs
2003 11,085 2,688 5,052 1,395 1,756 1942006 14,197 2,858 6,764 1,801 2,569 204
Change 3,112 170 1,712 407 813 10% Change 28% 6% 34% 29% 46% 5%
Employment in All Firms in Sample EZs2003 196,759 74,840 73,316 21,266 23,334 4,0042006 205,279 80,117 78,385 19,982 23,213 3,583
Change 8,520 5,277 5,069 -1,285 -121 -420% Change 4% 7% 7% -6% -1% -11%
Employment in Comparison Areas2003 104,864 49,018 24,450 7,743 21,174 2,4792006 107,533 52,865 26,218 7,794 17,675 2,981
Change 2,669 3,847 1,768 51 -3,499 502% Change 3% 8% 7% 1% -17% 20%
(Total Private-Sector Jobs Covered by Unemployment Insurance)
LRO Page 7 4/2/2009
RR 4-09 Enterprise Zones
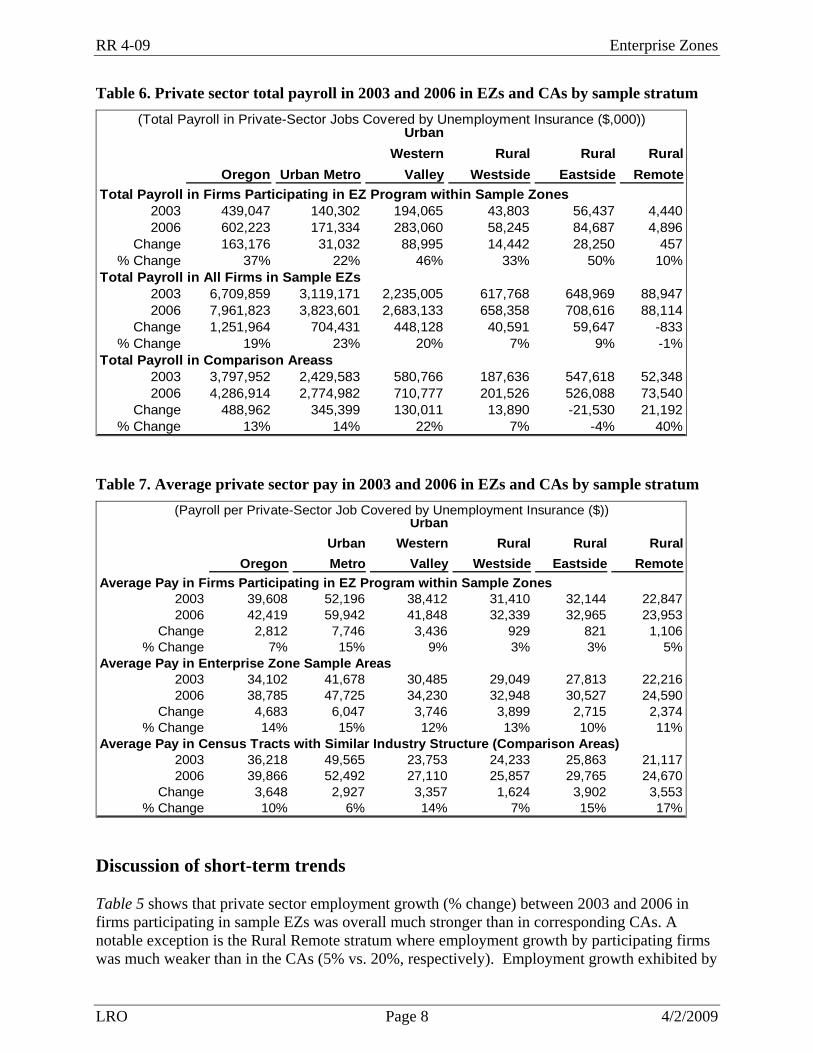
Table 6. Private sector total payroll in 2003 and 2006 in EZs and CAs by sample stratum
Oregon Urban Metro
Urban Western
ValleyRural
WestsideRural
EastsideRural
RemoteTotal Payroll in Firms Participating in EZ Program within Sample Zones
2003 439,047 140,302 194,065 43,803 56,437 4,4402006 602,223 171,334 283,060 58,245 84,687 4,896
Change 163,176 31,032 88,995 14,442 28,250 457% Change 37% 22% 46% 33% 50% 10%
Total Payroll in All Firms in Sample EZs2003 6,709,859 3,119,171 2,235,005 617,768 648,969 88,9472006 7,961,823 3,823,601 2,683,133 658,358 708,616 88,114
Change 1,251,964 704,431 448,128 40,591 59,647 -833% Change 19% 23% 20% 7% 9% -1%
Total Payroll in Comparison Areass2003 3,797,952 2,429,583 580,766 187,636 547,618 52,3482006 4,286,914 2,774,982 710,777 201,526 526,088 73,540
Change 488,962 345,399 130,011 13,890 -21,530 21,192% Change 13% 14% 22% 7% -4% 40%
(Total Payroll in Private-Sector Jobs Covered by Unemployment Insurance ($,000))
Table 7. Average private sector pay in 2003 and 2006 in EZs and CAs by sample stratum
OregonUrban Metro
Urban Western
ValleyRural
WestsideRural
EastsideRural
RemoteAverage Pay in Firms Participating in EZ Program within Sample Zones
2003 39,608 52,196 38,412 31,410 32,144 22,8472006 42,419 59,942 41,848 32,339 32,965 23,953
Change 2,812 7,746 3,436 929 821 1,106% Change 7% 15% 9% 3% 3% 5%
Average Pay in Enterprise Zone Sample Areas2003 34,102 41,678 30,485 29,049 27,813 22,2162006 38,785 47,725 34,230 32,948 30,527 24,590
Change 4,683 6,047 3,746 3,899 2,715 2,374% Change 14% 15% 12% 13% 10% 11%
Average Pay in Census Tracts with Similar Industry Structure (Comparison Areas)2003 36,218 49,565 23,753 24,233 25,863 21,1172006 39,866 52,492 27,110 25,857 29,765 24,670
Change 3,648 2,927 3,357 1,624 3,902 3,553% Change 10% 6% 14% 7% 15% 17%
(Payroll per Private-Sector Job Covered by Unemployment Insurance ($))
Discussion of short-term trends Table 5 shows that private sector employment growth (% change) between 2003 and 2006 in firms participating in sample EZs was overall much stronger than in corresponding CAs. A notable exception is the Rural Remote stratum where employment growth by participating firms was much weaker than in the CAs (5% vs. 20%, respectively). Employment growth exhibited by
LRO Page 8 4/2/2009

RR 4-09 Enterprise Zones
all firms in the sample EZs (i.e., not just those participating in the EZ program) was comparable to employment growth in CAs for the Urban Metro and Urban Western Valley strata, but considerably less favorable for the Rural Westside and Rural Remote strata. Employment by all firms in the Rural Eastside sample EZs declined slightly but much less drastically than did employment in the Rural Eastside CAs (-1% vs. -17%, respectively). Table 6 shows that growth in payroll between 2003 and 2006 in firms participating in sample EZs was generally much stronger than in corresponding CAs. Again, a notable exception is the Rural Remote stratum where payroll growth by participating firms was only one quarter that in the CAs (10% vs. 40%, respectively). Payroll growth exhibited by all firms in the sample EZs was comparable to payroll growth in CAs for the Urban Metro, Urban Western Valley and Rural Westside strata, and considerably better than in CAs in the Rural Eastside stratum. However payroll growth in the Rural Remote sample EZs significantly underperformed those in the corresponding CAs. Table 7 shows that growth in average pay between 2003 and 2006 in firms participating in sample EZs was generally weaker than in corresponding CAs, with the exception of Urban Metro where growth in average pay for participating firms was stronger than in the CAs (15% vs. 6%, respectively). Growth in average pay by all firms in the sample EZs was mixed in comparison to the CAs: stronger in the Urban Metro and Rural Westside strata but somewhat weaker in the Urban Western Valley, Rural Eastside and Rural Remote strata. The change in average pay was positive in all cases, although the weakest performers were participating firms in the Rural Westside, Rural Eastside and Rural Remote strata (growth in average pay of 3%, 3% and 5%, respectively). By and large, EZ firms start with higher average pay than what generally prevails. Aside from certain program criteria, this would reflect the bias of such jobs toward “traded sector” (e.g., industrial or manufacturing) occupations compared to retail and service-sector employment, which is more prevalent. Increases in non EZ average pay in metropolitan areas may relate to the growth of higher end service or professional level jobs. The exception, again, is the rural remote areas, where government employment (excluded from this analysis) will tend to dominate the higher-end of the covered pay scale. Additional short-term trends in employment, payroll and average pay per job
The following three tables show the results of examining short-term (2003-2006) trends in employment, total payroll and average pay per job by stratum in census tracts overlying EZs compared with census tracts that do not overlie EZs, and the state as a whole.
LRO Page 9 4/2/2009

RR 4-09 Enterprise Zones
Table 8. Private sector employment in 2003 and 2006 in tracts overlying EZs and in All Other Tracts by sample stratum
OregonUrban Metro
Urban Western
ValleyRural
WestsideRural
EastsideRural
RemoteEmployment in Census Tracts Overlying EZs
2003 325,622 138,717 116,437 36,390 31,527 2,5512006 356,346 153,728 129,039 39,042 31,901 2,636
Change 30,724 15,011 12,602 2,652 374 85% Change 9% 11% 11% 7% 1% 3%
Employment in Census Tracts Not Overlying EZs2003 962,743 561,359 215,670 77,844 99,135 8,7352006 1,047,475 604,202 233,155 83,752 116,200 10,166
Change 84,732 42,843 17,485 5,908 17,065 1,431% Change 9% 8% 8% 8% 17% 16%
Employment in All Census Tracts2003 1,288,365 700,076 332,107 114,234 130,662 11,2862006 1,403,821 757,930 362,194 122,794 148,101 12,802
Change 115,456 57,854 30,087 8,560 17,439 1,516% Change 9% 8% 9% 7% 13% 13%
(Total Private-Sector Jobs Covered by Unemployment Insurance)
Table 9. Total private sector payroll in 2003 and 2006 in tracts overlying EZs and in All Other Tracts by sample stratum
Oregon Urban Metro
Urban Western
ValleyRural
WestsideRural
EastsideRural
RemoteTotal Pay in Census Tracts Overlying Enterprise Zones
2003 10,992,427 5,600,455 3,453,153 1,043,109 837,140 58,5712006 13,522,145 7,005,976 4,274,348 1,259,792 916,574 65,455
Change 2,529,718 1,405,520 821,195 216,684 79,435 6,884% Change 23% 25% 24% 21% 9% 12%
Total Pay in Census Tracts Not Overlying Enterprise Zones2003 32,410,178 21,599,310 6,031,237 1,986,166 2,578,850 214,6162006 39,102,654 25,807,238 7,202,674 2,362,241 3,458,345 272,157
Change 6,692,476 4,207,928 1,171,437 376,075 879,495 57,541% Change 21% 19% 19% 19% 34% 27%
Total Pay in All Census Tracts2003 43,402,605 27,199,765 9,484,389 3,029,274 3,415,989 273,1862006 52,624,799 32,813,213 11,477,022 3,622,033 4,374,919 337,612
Change 9,222,195 5,613,448 1,992,632 592,759 958,930 64,425% Change 21% 21% 21% 20% 28% 24%
(Total Payroll in Private-Sector Jobs Covered by Unemployment Insurance ($,000))
LRO Page 10 4/2/2009

RR 4-09 Enterprise Zones
Table 10. Average private sector pay in 2003 and 2006 in tracts overlying EZs and in All Other Tracts by sample stratum
OregonUrban Metro
Urban Western
ValleyRural
WestsideRural
EastsideRural
RemoteAverage Pay in Census Tracts Overlying Enterprise Zones
2003 33,758 40,373 29,657 28,665 26,553 22,9602006 37,947 45,574 33,124 32,268 28,732 24,831
Change 4,188 5,201 3,468 3,603 2,179 1,871% Change 12% 13% 12% 13% 8% 8%
Average Pay in Census Tracts Not Overlying Enterprise Zones2003 33,664 38,477 27,965 25,515 26,014 24,5702006 37,330 42,713 30,892 28,205 29,762 26,771
Change 3,666 4,236 2,927 2,690 3,748 2,202% Change 11% 11% 10% 11% 14% 9%
Average Pay in All Census Tracts2003 33,688 38,853 28,558 26,518 26,144 24,2062006 37,487 43,293 31,687 29,497 29,540 26,372
Change 3,799 4,441 3,129 2,979 3,396 2,166% Change 11% 11% 11% 11% 13% 9%
(Payroll per Private-Sector Job Covered by Unemployment Insurance ($))
Table 8 shows percent change in employment in the broader census tracts that overlie EZ boundaries compared with tracts that do not overlie EZs. Employment growth in both categories was comparable for most strata except Rural Eastside and Rural Remote, where census tracts overlying EZs underperformed tracts that did not intersect EZ boundaries. The Employment trend in all census tracts combined was heavily weighted toward the tracts that did not intersect EZ boundaries. Table 9 shows percent change in payroll in the broader census tracts that overlie EZ boundaries compared with tracts that do not overlie EZs. Payroll growth in both categories was comparable for most strata except Rural Eastside and Rural Remote where census tracts overlying EZs underperformed tracts that did not intersect EZ boundaries. Payroll in all census tracts in the state was heavily weighted toward tracts that did not intersect EZ boundaries. Table 10 shows percent change in average pay in the broader census tracts that overlie EZ boundaries compared with tracts that do not overlie EZs. Growth in average pay for both categories was comparable for most strata, with growth in average pay somewhat higher for census tracts overlying EZs in Urban Metro, Urban Western Valley and Rural Westside strata, but weaker in the Rural Eastside and Rural Remote strata. Once again, average pay in all census tracts in the state was heavily weighted toward tracts that did not intersect EZ boundaries.
Long-term trends in socioeconomic indicators
The following five tables (Table 11 through Table 15) show the results of examining long-term (1990-2000) trends in poverty rate, unemployment rate, housing vacancy rate, total household income, and median gross rent, respectively, in the long-term sample Enterprise Zones and
LRO Page 11 4/2/2009

RR 4-09 Enterprise Zones
LRO Page 12 4/2/2009
Comparison Areas6. Unless otherwise indicated, “change” in these tables is reported in terms of the simple difference between the rates observed in 1990 and 2000 rather than as a percentage difference.
Poverty rate: Poverty rate is a measure of the percent of people living in households with income below the poverty level. Poverty rates in a region can vary due to net migration or to change in local income earning opportunities. In general, a lower poverty rate is considered to indicate relatively higher social welfare.
Unemployment rate: Unemployment rate measures the percent of the labor force that is jobless and actively seeking work at a point in time. Unemployment rates can vary due to multiple reasons including net migration of job seekers, change in local employment opportunities, or changes in the number of persons actively seeking employment at a point in time. So while the cause of observed changes in unemployment rates can be ambiguous, in general, a lower unemployment rate is considered to indicate relatively higher social welfare.
Household income: Household income is a measure of the total earned, unearned, pension and public assistance payments received by all members of all households in a region. As such it will vary with average household income, average size of households, and the number of households. While higher total household income may not necessarily indicate higher income per household, it is generally considered to be an indicator of a healthier local economy and higher social welfare for resident households.
Housing vacancy rate: Vacancy rates are a measure of the share of available housing units that are unoccupied at a point in time. Vacancy rates are affected by both the demand for and supply of housing stock. While a lower vacancy rate may indicate a healthier local economy, it also implies that demand is high relative to supply7. In turn this may indicate that housing rents are relatively high, which depending on income level, may not necessarily indicate higher social welfare for resident households.
Median rent: Median rents are a measure of the middle of the distribution of housing costs paid by renters, including utilities and fuels (i.e., one-half of cases fall above the median and the other half of cases all below the median). For comparison between strata, median housing rents were normalized by dividing by the median household income in each census tract to give a better indication of housing affordability. In general, lower median rent as a percent of median household income is an indicator of relatively greater housing affordability and higher social welfare.
6 For more detailed definitions of these and other Census variables see Appendix B in Public Use Microdata Sample for the 2000 Census of Population and Housing (PUMS/16-US (RV) at: http://www.census.gov/prod/cen2000/doc/pums.pdf 7 For rental markets, 5-6% is considered a “normal” number reflecting the frictional vacancy rate. For ownership markets, 1% is the norm. A discussion of the literature can be found in The Modern Economics of Housing: Guide to Theory and Policy for Finance and Real Estate Professionals by Randall Pozdena.

RR 4-09 Enterprise Zones
Table 11. Poverty rates in 1990 and 2000 in EZs and CAs by sample stratum
OregonUrban Metro
Urban Western
ValleyRural
WestsideRural
EastsideRural
RemoteState of Oregon
1990 12.4%2000 11.6%
Change -0.8%Enterprise Zone Sample Areas
1990 17.7% 25.9% 17.4% 15.6% 15.0% 12.1%2000 15.6% 18.7% 17.3% 13.7% 13.6% 13.1%
Change -2.1% -7.2% -0.1% -1.9% -1.5% 1.0%Census Tracts with Similar Industry Structure (CAs)
1990 11.9% 12.2% 10.1% 13.0% 10.4% 14.9%2000 11.2% 11.7% 10.5% 10.8% 10.2% 14.2%
Change -0.6% -0.5% 0.3% -2.3% -0.3% -0.7%
Table 12. Unemployment rates in 1990 and 2000 in EZs and CAs by sample stratum
OregonUrban Metro
Urban Western
ValleyRural
WestsideRural
EastsideRural
RemoteState of Oregon
1990 6.2%2000 6.5%
Change 0.3%Enterprise Zone Sample Areas
1990 8.8% 10.5% 7.9% 8.3% 8.5% 10.9%2000 8.0% 7.6% 8.7% 7.7% 7.5% 10.1%
Change -0.7% -2.9% 0.7% -0.6% -0.9% -0.8%Census Tracts with Similar Industry Structure (CAs)
1990 6.2% 5.1% 6.1% 6.7% 5.4% 9.2%2000 6.6% 6.3% 6.5% 6.4% 5.3% 10.2%
Change 0.5% 1.3% 0.4% -0.2% -0.1% 1.0%
Table 13. Household income in 1990 and 2000 in EZs and CAs by sample stratum ($ million)
OregonUrban Metro
Urban Western
ValleyRural
WestsideRural
EastsideRural
RemoteState of Oregon
1990 37,651$ 2000 70,515$
Change 32,865$ Pct. Change 87%
Enterprise Zone Sample Areas1990 4,297$ 718$ 1,270$ 1,117$ 969$ 223$ 2000 7,349$ 1,327$ 1,990$ 1,855$ 1,837$ 339$
Change 3,051$ 608$ 720$ 738$ 868$ 116$ Pct. Change 71% 85% 57% 66% 90% 52%
Census Tracts with Similar Industry Structure (CAs)1990 2,594$ 658$ 678$ 426$ 502$ 330$ 2000 4,852$ 1,093$ 1,407$ 687$ 1,089$ 577$
Change 2,258$ 435$ 729$ 261$ 586$ 247$ Pct. Change 87.0% 66.1% 107.5% 61.4% 116.6% 74.7%
LRO Page 13 4/2/2009
RR 4-09 Enterprise Zones
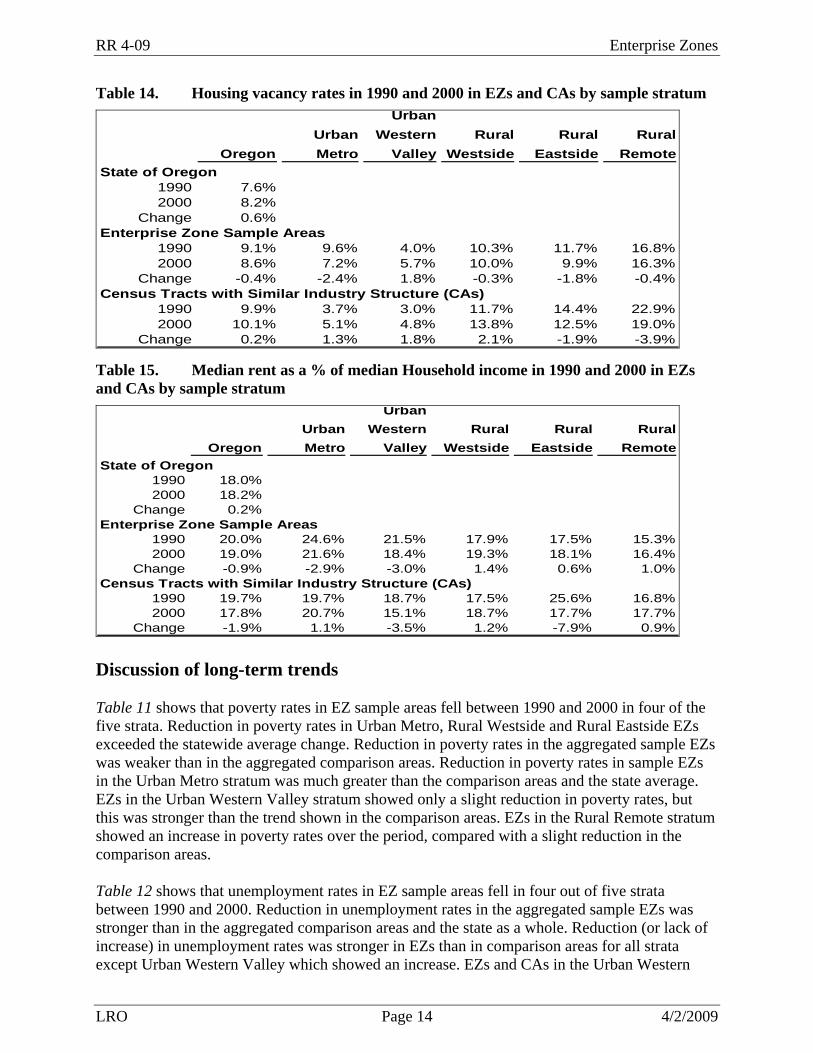
Table 14. Housing vacancy rates in 1990 and 2000 in EZs and CAs by sample stratum
OregonUrban Metro
Urban Western
ValleyRural
WestsideRural
EastsideRural
RemoteState of Oregon
1990 7.6%2000 8.2%
Change 0.6%Enterprise Zone Sample Areas
1990 9.1% 9.6% 4.0% 10.3% 11.7% 16.8%2000 8.6% 7.2% 5.7% 10.0% 9.9% 16.3%
Change -0.4% -2.4% 1.8% -0.3% -1.8% -0.4%Census Tracts with Similar Industry Structure (CAs)
1990 9.9% 3.7% 3.0% 11.7% 14.4% 22.9%2000 10.1% 5.1% 4.8% 13.8% 12.5% 19.0%
Change 0.2% 1.3% 1.8% 2.1% -1.9% -3.9%
Table 15. Median rent as a % of median Household income in 1990 and 2000 in EZs and CAs by sample stratum
OregonUrban Metro
Urban Western
ValleyRural
WestsideRural
EastsideRural
RemoteState of Oregon
1990 18.0%2000 18.2%
Change 0.2%Enterprise Zone Sample Areas
1990 20.0% 24.6% 21.5% 17.9% 17.5% 15.3%2000 19.0% 21.6% 18.4% 19.3% 18.1% 16.4%
Change -0.9% -2.9% -3.0% 1.4% 0.6% 1.0%Census Tracts with Similar Industry Structure (CAs)
1990 19.7% 19.7% 18.7% 17.5% 25.6% 16.8%2000 17.8% 20.7% 15.1% 18.7% 17.7% 17.7%
Change -1.9% 1.1% -3.5% 1.2% -7.9% 0.9% Discussion of long-term trends Table 11 shows that poverty rates in EZ sample areas fell between 1990 and 2000 in four of the five strata. Reduction in poverty rates in Urban Metro, Rural Westside and Rural Eastside EZs exceeded the statewide average change. Reduction in poverty rates in the aggregated sample EZs was weaker than in the aggregated comparison areas. Reduction in poverty rates in sample EZs in the Urban Metro stratum was much greater than the comparison areas and the state average. EZs in the Urban Western Valley stratum showed only a slight reduction in poverty rates, but this was stronger than the trend shown in the comparison areas. EZs in the Rural Remote stratum showed an increase in poverty rates over the period, compared with a slight reduction in the comparison areas. Table 12 shows that unemployment rates in EZ sample areas fell in four out of five strata between 1990 and 2000. Reduction in unemployment rates in the aggregated sample EZs was stronger than in the aggregated comparison areas and the state as a whole. Reduction (or lack of increase) in unemployment rates was stronger in EZs than in comparison areas for all strata except Urban Western Valley which showed an increase. EZs and CAs in the Urban Western
LRO Page 14 4/2/2009

RR 4-09 Enterprise Zones
Valley stratum also performed worse than the state average trend, which showed a slight increase in unemployment rate over the period (+0.3%). Unemployment rates in Urban Metro EZs fell by the largest percentage in any stratum (-2.9%). Table 13 shows that household income statewide and in the aggregated comparison areas increased 87% between 1990 and 2000. In the comparison areas, the greatest gains were seen in Rural Eastside and Urban Western Valley strata, where household income more than doubled. This level of increase was not achieved in any of the sample EZ strata, although EZs in the Rural Eastside and Urban Metro strata came closest with increases of 90% and 85%, respectively. Rates of increase in sample EZs exceeded the increase in comparison areas in two strata: Urban Metro and Rural Westside. In the other three strata rates of increase in sample EZs lagged behind those of the respective comparison areas by between 23 and 50 percentage points. Table 14 shows that in contrast to a rising statewide average trend, housing vacancy rates in EZ sample areas fell in aggregate and in four out of five strata (i.e., all except Urban Western Valley). Reduction in housing vacancy rates in sample EZs exceeded the reductions in comparison areas for the Urban Metro and Rural Westside strata. Trends in sample EZs in the Urban Western Valley and Rural Eastside strata were nearly identical to their respective comparison areas. Sample EZs in the Rural Remote stratum showed less reduction in housing vacancy rates than in the comparison area. Table 15 shows that statewide median rent as a share of median household income was nearly flat between 1990 and 2000, but fell by 2.9% and 3% in sample EZs in the Urban Metro and Urban Western Valley strata, respectively. Median rent as a share of median household income fell in the aggregated sample EZs but by less than in the aggregated comparison areas. Only EZs in the Urban Metro stratum showed a greater reduction (or smaller increase) in median rent as a share of median household income than in the respective comparison areas. In the four other strata, reductions (increases) in median rent as a share of median household income in the sample EZs were smaller (greater) than in the corresponding comparison areas. In summary, these results might be best characterized as preliminary and indicative of potential future investigations. In some cases, the data suggests that enterprise zones might be helping to mitigate poverty and unemployment for some economic hardship areas, especially given that some of the comparison groups started from an apparently advantageous economic position, even as this gave them less room to improve. Nevertheless the ability to draw inferences regarding the effects of enterprise zones is limited. In a future investigation 2010 census data could be used along with detailed geo-coding of all relevant enterprise zone boundaries. Using all enterprise zones (rather than a sample) not only provides more data to perform insightful analyses and statistical testing, but also (possibly) the means to evaluate whether enterprise zones influenced actual investment decisions. In addition, one could non-statistically evaluate local changes for every enterprise zone individually. Inclusion of the 2000–2010 period would also represent a meaningful time for many zones throughout the state to have had at least a chance to influence broad measures of socioeconomic conditions. Finer census unit delineations could also be compiled, tested and calibrated in terms of enterprise zone usage and changes over time. Also, comparison areas defined in terms of the
LRO Page 15 4/2/2009

RR 4-09 Enterprise Zones
LRO Page 16 4/2/2009
same socioeconomic variables that are being measured might be a more appropriate way to tease out questions of significance and sensitivity in the data.
Property tax exemptions and internal rate of return The following three tables present data summaries and results of the internal rate of return analysis. Table 16 shows the number of participating projects and new full-time jobs associated with projects in each category; the estimated undiscounted value of property tax exemptions granted to participating EZ businesses; and estimated undiscounted value of post-exemption property tax assessments on these same participating projects. Table 17 shows two estimates of the return on the public’s investment of foregoing business property taxes on EZ participants: (1) the approximate number of years required to recover undiscounted abated property taxes once EZ exemptions expire, and (2) the undiscounted value of property taxes foregone per net new job. Table 18 re-calculates return on investment measure (2) excluding projects that generate relatively few jobs, e.g., electricity-generating and other projects that were granted waivers from the statutory requirement that participants increase EZ employment by at least 10%.
Table 16. Summary of estimated property tax exemptions, job creation, and property tax recovery for Enterprise Zone projects* by stratum.
All StrataUrban Metro
Urban Western
ValleyRural
WestsideRural
EastsideRural
RemoteEnterprise Zones Included in the Samples
Number of Projects in the Category 238 28 86 26 86 12New Full-time Jobs 11,764 2,191 5,218 1,023 3,085 247Estimated Property Tax Exemptions ($ million) $86.6 $40.2 $37.7 $4.3 $4.2 $0.3Total Estimated post-Exemption Property Tax Assessments ($ million) $279.2 $88.8 $135.3 $22.3 $31.2 $1.5 Post-exemption years 1-6 $71.1 $23.4 $32.7 $6.2 $8.4 $0.5 Post-exemption years 7-12 $106.2 $35.7 $51.3 $7.8 $10.8 $0.5 Post-exemption years 13-18 $101.9 $29.8 $51.3 $8.4 $12.1 $0.5
Enterprise Zones not Included in the SamplesNumber of Projects in the Category 222 3 88 72 51New Full-time Jobs 9,111 10 4,875 2,362 1,717 147Estimated Property Tax Exemptions ($ million) $146.9 $0.1 $69.1 $19.5 $56.9 $1.3Total Estimated post-Exemption Property Tax Assessments ($ million) $441.7 $0.4 $110.1 $93.3 $232.1 $5.9 Post-exemption years 1-6 $134.4 $0.1 $53.8 $25.7 $53.6 $1.2 Post-exemption years 7-12 $154.3 $0.1 $30.8 $33.6 $87.6 $2.2 Post-exemption years 13-18 $153.0 $0.2 $25.5 $34.0 $90.8 $2.5
Combined Enterprise ZonesNumber of Projects in the Category 460 31 174 98 137 20New Full-time Jobs 20,875 2,201 10,093 3,385 4,802 394Estimated Property Tax Exemptions ($ million) $233.5 $40.3 $106.8 $23.8 $61.1 $1.6Total Estimated post-Exemption Property Tax Assessments ($ million) $720.9 $89.2 $245.4 $115.6 $263.3 $7.4 Post-exemption years 1-6 $205.5 $23.5 $86.6 $31.8 $62.0 $1.7 Post-exemption years 7-12 $260.5 $35.9 $82.1 $41.4 $98.4 $2.8 Post-exemption years 13-18 $254.8 $29.9 $76.7 $42.4 $102.9 $3.0
8

RR 4-09 Enterprise Zones
LRO Page 17 4/2/2009
Table 17. Number of years required to recover exempted property taxes and value of property tax exemptions per net new job for Enterprise Zone projects* by stratum.
All Strata
Urban Metro
Urban Western
ValleyRural
WestsideRural
EastsideRural
RemoteEnterprise Zones Included in the Samples
Number of Projects in the Category 238 28 86 26 86 1Estimated Property Tax Exemptions ($ million) $86.6 $40.2 $37.7 $4.3 $4.2 $0.3Estimated # of years to recover exempt Property Taxes 8 11 7 5 3Property tax exemption per new full time job ($) $7,364 $18,353 $7,222 $4,195 $1,350 $1,148
Enterprise Zones not Included in the SamplesNumber of Projects in the Category 222 3 88 72 51 8Estimated Property Tax Exemptions ($ million) $146.9 $0.06 $69.1 $19.5 $56.9 $1.3Estimated # of years to recover exempt Property Taxes 7 3 8 5 7Property tax exemption per new full time job ($) $16,125 $6,189 $14,174 $8,261 $33,168 $8,788
Combined Enterprise ZonesNumber of Projects in the Category 460 31 174 98 137 20Estimated Property Tax Exemptions ($ million) $233.5 $40.3 $106.8 $23.8 $61.1 $1.6Estimated # of years to recover exempt Property Taxes 7 11 8 5 6Property tax exemption per new full time job ($) $11,188 $18,297 $10,580 $7,033 $12,727 $3,998
2
3
7
6
* Enterprise Zone projects initiated since 1995.
Table 18. Estimated value of property tax exemptions per net new job for only non- power and non-waiver Enterprise Zone projects* by stratum.
All Strata
Urban Metro
Urban Western
ValleyRural
WestsideRural
EastsideRural
RemoteEnterprise Zones Included in the Samples
Number of Projects in the Category 232 25 84 25 86 1Estimated Property Tax Exemptions ($ million) $68.0 $25.0 $36.4 $2.2 $4.2 $0.3New Full-time Jobs 11,551 1,978 5,218 1,023 3,085 247Property tax exemption per new full time job ($) $5,891 $12,650 $6,973 $2,142 $1,350 $1,148
Enterprise Zones not Included in the SamplesNumber of Projects in the Category 208 3 86 66 45 8Estimated Property Tax Exemptions ($ million) $91.9 $0.1 $64.7 $14.7 $11.2 $1.3New Full-time Jobs 8,985 10 4,875 2,314 1,639 147Property tax exemption per new full time job ($) $10,230 $6,189 $13,271 $6,357 $6,806 $8,788
Combined Enterprise ZonesNumber of Projects in the Category 440 28 170 91 131 20Estimated Property Tax Exemptions ($ million) $160.0 $25.1 $101.1 $16.9 $15.3 $1.6New Full-time Jobs 20,536 1,988 10,093 3,337 4,724 394Property tax exemption per new full time job ($) $7,789 $12,617 $10,015 $5,065 $3,243 $3,998
2
* i.e., enterprise Zone projects initiated since 1995 excluding electricity-generating and other projects that were granted waivers from the statutory requirement that participants increase EZ employment by at least 10% (This removes the most capital-intensive investments that generate relatively few additional jobs).

RR 4-09 Enterprise Zones
Discussion of property tax exemptions and internal rate of return
Table 16 shows the number of projects and number of new full time jobs added by eligible projects in each enterprise zone stratum, the estimated undiscounted value of property taxes foregone by local government during the three to five year exemption periods, and the projected aggregate undiscounted value of property tax assessments on the previously exempt properties during the 18 years after exemptions expire. The total assessment amount during the 18-year period has also been subdivided into three six-year sub-periods.
Table 16 shows that $233.5 million estimated total property taxes were forgiven statewide on 460 EZ projects initiated since 1995. Nearly half (46%) of this was for the 174 projects in the Urban Western Valley stratum. Twenty-six percent was associated with 137 projects in the Rural Eastside stratum. Less than 1% of estimated total exemptions went to the 20 projects in the Rural Remote stratum. The 238 projects in EZs included in the samples accounted for about 37% of the estimated total exemption amount, with the largest portions of that accounted for by the Urban Metro (46%) and Urban Western Valley (43%) strata.
Table 16 also shows an estimated 20,875 new full-time jobs were associated with EZ projects statewide. The largest share (48%) is associated with projects in the Urban Western Valley stratum. This is also true for projects in the sample EZs, which accounted for more than half (56%) of the total new jobs.
Two rough indicators of return on the public’s investment in enterprise zones are (1) the number of years required to recover exempted property taxes, and (2) the ratio of exempted taxes per job created. Table 17 reports the results of these analyses by EZ stratum. The table shows it would take an estimated 7 post-exemption years to recover the (undiscounted) value of property taxes forgiven for all projects in all strata. The number of years required to recover property taxes ranges by stratum from 11 years to three years with the lowest values associated with projects in Rural Eastside and Rural Remote EZ sample strata, and the Urban Metro non-sample stratum (although this category includes only three projects with tax exemptions).
Table 17 also shows that the undiscounted value of statewide property tax exemptions per new full-time job created is $11,188. The range is from less than $1,400 per job in the Rural Remote and Rural Eastside sample strata, to more than $33,000 per job in the Rural Eastside non-sample stratum.
Table 18 shows that when adjustments are made to remove the 20 projects designed for power generation, which were granted waivers from EZ sponsors for lower employment creation, the statewide value falls to $7,789 per full-time job. With the range narrowing from less than $1,400 per job in the Rural Remote and Rural Eastside sample strata, to a high of just over $12,600 per job in the Urban Western Valley non-sample stratum and Urban Metro sample stratum. These results show that the tax/job ratio is very sensitive to the extreme variance that exists across actual projects.
LRO Page 18 4/2/2009

RR 4-09 Enterprise Zones
Summary and Conclusions:
Short-term trends (2003-2006) Indicators of trends in EZs were different by geographical strata. Growth in employment and payroll in participating firms in the aggregated sample EZs was considerably stronger than in the comparison areas. Short-term growth in employment and payroll by all firms in the aggregated sample EZs was also stronger than in the aggregated comparison areas but by a smaller margin. Most notable was probably the Rural Eastside stratum where EZs outperformed CAs by the widest margin. However, a notable exception was in the Rural Remote stratum where employment and payroll growth in Rural Remote EZs was considerably less than in Rural Remote CAs. It also may be noteworthy that growth in average pay was less for participating firms in EZs than in corresponding CAs in all strata except Urban Metro. However, in three of the five strata (i.e., all except Rural Eastside and Rural Remote) growth in average pay in census tracts overlying EZs was slightly greater than in census tracts not touching EZ boundaries.
Long-term trends (1990-2000)
Changes in socioeconomic indicators were also differentiated by geography. Poverty rates in EZs in Urban Metro, Urban Western Valley, and Rural Eastside strata declined by more than in CAs, but poverty rates declined by less than CAs in Rural Westside EZs. Poverty rates increased in EZs in the Rural Remote stratum. Unemployment rates in sample EZs either declined by more or rose by less than in CAs in every stratum except Urban Western Valley. Results for housing vacancy rates in sample EZs showed declines greater than in CAs in two strata but less than in CAs in two other strata. The rate of increase in household income in sample EZs exceeded the rate of increase in CAs in only two strata, and trailed in the other three strata and in aggregate. Finally, median rent as a share of median household income in sample EZs declined at a greater rate than in CAs in one stratum (Urban Metro).
Internal rate of return
The analysis of internal rate of return on property tax exemptions shows that on average (statewide) about seven years are needed to recover the full, undiscounted value of property tax exemptions, with a range from three years to 11 years, depending on stratum. The total value of property taxes foregone per net full-time job created is $11,188 statewide, ranging from $1,148 to $33,168 depending on stratum. When power-generating and waiver projects are removed from the data, the statewide value of foregone property taxes falls to $7,789 per full-time job and the range across strata narrows to from $1,148 to a maximum of $12,650 per job.
LRO Page 19 4/2/2009

RR 4-09 Enterprise Zones
Recommendations for Future Research:
1. Define geographic strata based on divisions smaller than counties (e.g., census tracts). This will improve the ability to both stratify EZs and increase the pool of candidate tracts available for identifying Comparison Areas.
2. Assign all existing EZs into strata rather than choosing only a sample of EZs, especially for long-term analysis of socioeconomic measures. This will eliminate potential bias introduced due to selection of a non-representative sample, and possibly enable statistical testing of results and other more sophisticated analyses.
3. Use a longer series of data as well as time-series methods to make the employment and payroll comparisons. (When this study began, 2003 and 2006 were the earliest and most recent, respectively, available and adequately geo-coded data years).
4. Consider selecting comparison areas for the long-term sample by matching socioeconomic characteristics rather than industry employment profiles.
5. Consider using time-series methods to examine the relationship between periodic changes in unemployment rates and EZ activity.
6. Consider normalizing vacancy rates and median rents by the number or change in the number of available rental units. These indices may provide a better indicator of welfare than the ones used in the analysis.
7. Include a fuller accounting of benefits and costs both in terms of effects on public finances, provision of services, and economic impacts from project investments and employment in the enterprise zone.
8. Examine the effect of discounting on property tax estimates and the return on investment analysis.
9. Consider incorporating results of the OECDD’s model regarding investigation of the likelihood that property tax savings may have significantly induced capital investment relative to what would otherwise have occurred.
LRO Page 20 4/2/2009

RR 4-09 Enterprise Zones
LRO Page 21 4/2/2009
Observations and notes
Notes on short-term sample analysis For most strata, the above results suggest significant performance in terms of employment variables for the enterprise zone firms themselves. However, it should be noted that the EZ businesses themselves tend to represent a rather small proportion of overall employment. Therefore, especially given the small number of sampled EZs in each stratum and the short time frame of only three years, one might not expect to see much evidence of larger economic forces at work Rural eastside and rural remote strata, aside from one notable eastside enterprise zone (Redmond), have been rather inactive. Consequently, the firm and employee samples for these strata are quite small compared to the rural Westside stratum, which has had a longer history of enterprise zone utilization. Rural remote designations are among the newest and least experienced EZs. Remote areas face unique logistical hurdles to development. While enterprise zones may foster reinvestment by traditional resource-based industries, available incentives might make little difference for other non-traditional types of businesses in remote locales. Urban (or more transportation-advantaged) areas have many more resources and opportunities available than most rural areas.
Notes on long-term sample analysis It should be noted that the three EZs in the rural remote stratum were not in existence for a meaningful length of time between 1990 and 2000. Two of the EZs were established in 1996 and the third in 1999, the year the 2000 census was administered.
Notes on return on investment analysis
Jobs counted in the return on investment analysis consist of employees working for business firms in eligible operations within the enterprise zones. These are supposed to include only full-time, year-round positions, and as such, are not directly comparable to employment data collected by the Employment Department.
Statutes prohibit and control for the relocation of jobs into the enterprise zone from elsewhere in the state. Reported job numbers are in addition to firms’ base employment level8 and have also been reconciled with respect to any multiple usage of an enterprise zone by business firms.
8 I.e., employment level during a base period anywhere from one to four years before the exemption begins. Base employment is zero in about one-third of cases.