enter title here - destination canada · (trading economics, 2015). australia's economy can...
TRANSCRIPT

Global Tourism Watch2014 Australia Summary Report

Canadian Tourism Commission i
Table of Contents
1. Introduction 1
2. Strategic Considerations 2
3. Key Observations 3
4. Market Health and Outlook 5
5. Market Potential 7
6. Competitive Environment 9
7. Perceptions of Canada 11
8. Trip Profiles 16
9. Attraction of Canada 22
10. Barriers to visiting Canada 24
11. Sources of information on Canada 26
12. Net Promoter Score (NPS) 28
13. Path to Purchase 30
Canadian Tourism Commission 1
1. Introduction
The Canadian Tourism Commission (CTC) began conducting the annual Global Tourism Watch (GTW) program in 2007. The primary purpose of this research program is to expand the base of consumer-based intelligence in twelve core markets around the world1.
The overall objectives of the GTW study are to:
1. Monitor awareness, travel intentions, and other key market indicators for Canada and the regions;
2. Assess perceptions of Canada and track brand performance against the competitive set over time;
3. Identify the general experiences sought by travellers, assess Canada’s competitive positioning on key products and identify growth opportunities;
4. Identify motivators and barriers for travel to Canada; and,
5. Explore the role of social media and advocacy in the tourism context.
In response to a rapidly changing travel marketplace, the CTC and TNS worked together to substantially revise and update the questionnaire prior to the 2014 fieldwork. This was done to better reflect current travel realities and to gather more in-depth information on Canada’s competitors in each market. The new GTW data permits direct comparison of Canada to those competitor countries unique to each market. The CTC has designated the US, Thailand, Italy, France, the UK and China as the competitive set for Canada in the Australian market, for 20142.
Methodology
In 2014, a web-based panel survey was conducted by TNS. The target population for the online survey was residents aged eighteen years and older, who had taken a long-haul pleasure trip outside of Australia, New Zealand and the Pacific Islands, where they had stayed at least four nights with a minimum of one night in paid accommodation in the past three years, or plan to take such a trip in the next two years.
Data was gathered from 1,498 respondents in Australia, including 299 recent visitors to Canada, in October 2014.
1 Identified by the CTC as the international ‘long-haul’ markets of: Australia, Brazil, China, the UK, Germany, France, India, Japan, Mexico and South Korea, as well as the US and the domestic Canadian market. 2 The competitive set for Australia in 2014 remains unchanged from that of 2012. The CTC continuously reviews the competitive set for each market, and from time to time, may update it to better reflect the current realities in the marketplace.

2 2014 Australia Summary Report
2. Strategic Considerations
The key strategic considerations for Canada, arising from the 2014 results of Australian long-haul travellers, can be summarised as:
1. While Australian long-haul travellers have a great appreciation of Canada’s natural beauty, there is less known about ‘what else’ it has to offer. There is certainly an appreciation of the fact that Canada can provide unique and authentic travel experiences, but this may be tied to brand imagery around scenery and outdoor adventures. This is particularly important in attracting younger Australians to Canada, who are looking for more than just beautiful scenery.
2. There is a clear opportunity to build on the high level of advocacy that Canada enjoys from Australian travellers who have already been here. Compared to the competing long-haul destinations, visitors to Canada have little reservation in recommending it to friends and family – the most influential source of information and advice on where to go and what to see. Sharing their experiences, particularly through social media and travel-review websites, should be encouraged.
3. The US has made significant advances around the perceptions of value, where Canada once enjoyed a competitive advantage. This is most noticeable when it comes to offering the experiences they are specifically looking for – where the US has overtaken Canada. Building awareness of the breadth of the experiences on offer will help drive perceptions of value.
4. While the US is clearly Canada’s main competitor for the Australian long-haul travellers, an opportunity exists to encourage visitors to North America to include destinations both sides of the border. Given the considerable travel distances involved, Australians considering a trip to the US should be encouraged to include a visit to Canada on their itinerary.
5. Australians, like most international travellers, enjoy visiting historical and cultural sites of interest and attractions on their vacation, but know very little about Canada’s offer in that respect. Even among those already considering taking a vacation here, very few are ‘excited or intrigued’ about that aspect of the trip. Historical and cultural attractions, as well as city experiences, are still perceived as somewhat of a weakness of the Canadian offer, whether through a lack of awareness, or through comparison with destinations such as the US and UK.
6. While Australians have been as keen as any to embrace the digital world, and are more than capable of researching and booking trips online, they still tend to turn to travel agents when booking long-haul travel. Travel-trade marketing remains key to promoting Canada to Australian travellers who have embarked on the path-to-purchase.

Canadian Tourism Commission 3
3. Key Observations
The following section summarises the key points of interest from the 2014 survey of Australian long-haul travellers.
Key findings:
Optimism around long-haul travel remained unchanged from 2012, with over a third (39%) believing that they would travel more in the next 2 to 3 years, and the same amount stating that they would spend a little more on travel outside of Australia in the next twelve months.
Knowledge of vacation opportunities in Canada has increased from just 24% in 2011 to 32% in 2014, and is now on a par with Italy and France, but still trails the US (44%) and UK (44%), which have also made notable gains since 2011.
The US remains the most popular destination among the set of competitive long-haul destinations for the Australian market, based on unaided consideration (27%), followed by the UK (16%), with Canada (10%) just ahead of Japan (9%) and Thailand (9%).
Asked specifically about Canada and the competing long-haul destinations, around 80% are interested in Canada (82%), the UK (81%) or the US (80%). The US has seen the biggest increase in destination interest since the survey began back in 2007, with a significant increase from just 64% to 80% in 20143.
The number of Australian long-haul travellers who say they are likely to visit Canada in the next two years has increased dramatically from just 20% in 2007 to 32% in 2014, with a notable increase from 2011 (24%).
Australian long-haul travellers have an immense appreciation for Canada’s outstanding natural beauty, which inspires them to explore its geography, far more so than when considering the US, or other long-haul destinations (Italy, France, the UK, Thailand and China). Canada is also rated extremely favourably as a destination where they can create extraordinary travel experiences, and one which offers authentic experiences which inspire them to meet and engage with its people.
Consideration and interest in Canada is significantly higher among those Australian long-haul travellers aged between 18 and 34 years. Not only are they more likely to be considering Canada for a trip in the next two years4, but are also more committed to making the journey. However, they are also more likely to mention barriers that might prevent them from making the trip, and were also more enthusiastic about all destinations in the competitive set.
The US has closed the gap on Canada significantly when it comes to perceptions around value, specifically as a destination with: unique features, travel experiences they are looking
3 By comparison, interest in Canada increased from 73% in 2007 to 82% in 2014. 4 Aided destination interest (Q5) and Likelihood of taking a trip to Canada in the next two years (Q14/Q15).

4 2014 Australia Summary Report
for, one which they would pay a little more for and a dream destination that I would visit if money were no object. Canada’s competitive advantage over the US has been eroded, with the US now ahead of Canada as a destination with the experiences they are particularly looking for.
Canada also trails the US on perceptions around price, especially when it comes to value for money and the cost of food, entertainment and accommodation. While the US is also considered a little more affordable to get to by air, Australian travellers are reluctant to agree that any long-haul destinations are ‘affordable’, the exception perhaps being Thailand.
The biggest barrier to visiting Canada, among those who are considering a trip here, is the cost. A third of Australian travellers contemplating coming here point to the fact that it might be too expensive, as a reason they may not follow through on their intentions. An unfavourable exchange rate and poor value for money were also noted, as was the travel distance involved.
Among those who are considering a visit to Canada, the most intriguing or exciting aspect of a trip here was the beautiful scenery and landscapes, particularly for those aged thirty-five years or older. They were also more likely to point to specific locations or places they were hoping to visit. Younger travellers seemed less sure about what exactly was the most exciting prospect, and were not so quick to point to the natural beauty or scenery.
More than half (54%) of Australian long-haul travellers, who have in fact been to Canada, would recommend it to friends and family – a level of advocacy significantly higher than visitors to Canada’s competitive set of long-haul destinations. In comparison, only 41% of Australian visitors to the US, would do the same, and Canada places ahead of both the UK (46%) and Italy (43%).
Advocacy is extremely important in helping travellers decide which destinations to visit. Recommendations by friends and family are the most influential source of information, whether in-person, or via social media. Australian travellers are also adept at conducting their own research, and will turn to the internet for information and reviews.
In addition to friends and family, TV programs, print articles and TV advertising are also key channels for generating awareness, though are not necessarily as influential as trusted sources, and those perceived to be independent.

Canadian Tourism Commission 5
4. Market Health and Outlook
Background
The Australian economy
Australia's economy is dominated by its services sector, yet its economic success is based on an abundance of agricultural and mineral resources. Australia's comparative advantage in the export of primary products is a reflection of the natural wealth of the Australian continent and its small domestic market. The country is a major regional financial centre and a vital component of the global financial system (Trading Economics, 2015).
Australia's economy can boast more than two decades of uninterrupted annual growth, low inflation and low unemployment. This is largely thanks to structural reforms made in the early 1980s and strong demand from Asia, particularly China, for the country's mineral and energy resources (The Economist, 2012).
Despite over two decades of uninterrupted annual growth, low inflation and low unemployment, which continued despite the financial crisis of 2007/08, Australia’s economy is facing a tough time and stagnated economic growth (The Economist, 2012).
2014 saw a decline in commodity prices, particularly in iron ore and coal, which put pressure on a currency which is heavily linked to the value of exports. Unemployment rose from 5.9% at the start of the year to 6.5% by the end of December and consumer confidence fell to 91.1 in the same month. In fact, consumer confidence is falling at the fastest rate since before the global financial crisis (Visit Britain, 2014).
Investment banks, including Goldman Sachs, Morgan Stanley and Deutsche Bank, have consistently warned of a dramatic slowdown this year and the possibility of rising unemployment. The investment banks forecast 2.0% GDP growth this year and 3.25% in 2016 (The Sydney Herald, 2015).
The Reserve Bank of Australia also revised forecasts for GDP growth downwards, to between 2.25% to 3.25% through 2015, down a quarter percentage point from its November outlook (The Wall Street Journal, 2015), and warned that the economy won’t grow sufficiently enough to prevent an increase in the rate of unemployment.
Travel Outlook
Australia is one of the largest outbound tourism markets, ranking 8th in the world with $27.3 billion in international tourism expenditures in 2013. Australians took 8.8 million international trips in 2013 – with France ranking as the most visited destination (Tourism Economics, 2015).
In 2014, Canada received a total of 280,000 overnight visitors from Australia, up from 264,000 in 2013, a 6.3% year-over-year increase (Statistics Canada, 2015).
Tourism flows outbound continued to rise in 2013 up 7%, following a 6% growth experienced in 2012. This growth occurred despite a depreciation of the Australian dollar,

6 2014 Australia Summary Report
which had the effect of making outbound travel more expensive. Those destinations that have driven this continued growth are those that continue to be affordable to Australian holidaymakers, whether because of the expansion of low cost carrier airlines (Indonesia, Singapore, Malaysia), because poor economic conditions at the destination have resulted in inexpensive travel packages (Greece, Italy) or because they are an inherently affordable destination regardless of the exchange rate (Cambodia) (Euromonitor International, 2014).
Outbound travel is expected to continue to grow in the future despite the apparent slowdown of the Australian economy. Outbound departures from Australia are projected to grow 3.8 per cent per annum on average to reach 12.3 million by 2022−23 (Tourism Research Australia, 2014)
The percentage of Australians intending to take a vacation in the next 12 months is at a five-year high. Compared to March 2013, overseas trips are on the rise with 11% of Australians planning to head abroad for the next vacation (Visit Britain, 2014).
Travel trends
According to research conducted by Roy Morgan, 22% of Australians would like to take a vacation to Melbourne, in the next two years, ahead of the Gold Coast, the UK, the US and New Zealand. Melbourne has remained the first-choice for Australian holidaymakers since 2006 (Visit Britain, 2014).
The general trend is for Australians to travel less over the course of the year and for shorter periods. This is attributed to less time available for vacations, and concerns over personal finances. Travel is becoming less of a priority for younger Australians and families are increasingly choosing to stay at home, reversing a long-running cultural trend towards overseas travel (Visit Britain, 2014).
In its inaugural ‘State of the Nation’ report, a study commissioned by Expedia (Australia) revealed that travellers under the age of twenty-five are shaping the future of Aussie travel: taking off earlier and travelling farther and more frequently. The study5 found that 18-24 year olds have travelled more than any other age group, and eight-in-ten (83%) intend to take an international holiday in the next 12 months – a rate of travel intentions that consistently diminishes with age (25-34 75%, 35-49 66%, 50+ 61%) (Expedia Australia), 2014).
5 The study was conducted among 2,567 Australian travellers aged 18 and older who have travelled in the past two years, or intend to travel internationally in the next 12 months.

Canadian Tourism Commission 7
5. Market Potential
Exhibit 5-1 provides an estimate of the size of the potential market for Canada in two ways – the macro target market and the immediate potential.
The target market is a broader estimate of the market size based on expressed interest among all Australian long-haul travellers (market size estimate derived from the 2010 omnibus study of the Australian adult population). The proportion of GTW respondents who are “definitely”, “very”, or “somewhat” interested in Canada in the next two years is applied to the broader traveller population to come up with a target market estimate of 6.8 million.
The immediate potential is a more conservative estimate based on GTW respondents who say they are “definitely” or “very likely” to visit Canada in the next two years. This translates into a market of 2.6 million travellers with more immediate potential for conversion.
Exhibit 5-1 Size of the potential market to Canada (next two years)
Measure Size of Potential Market To Canada
Total potential long-haul pleasure travellers (aged 18 plus) 8,325,000
Target market for Canada
Definitely / very / somewhat interested in visiting Canada in the next two years 82%
Size of the target market 6,826,000
Immediate potential for Canada
Will definitely / very likely visit Canada in the next two years6 32%
Immediate potential 2,664,000
Base: Long-haul pleasure travellers (n = 1,498) Q5: How interested are you in taking a trip to Canada in the next two years? Q14 / 15: Realistically, how likely are you to take a holiday trip of four or more nights to Canada in the next two years? And, how likely are you to take a holiday trip of one to three nights to Canada in the next two years? Please include trips to other countries (e.g., the United States) that would involve a stay of one to three nights in Canada.
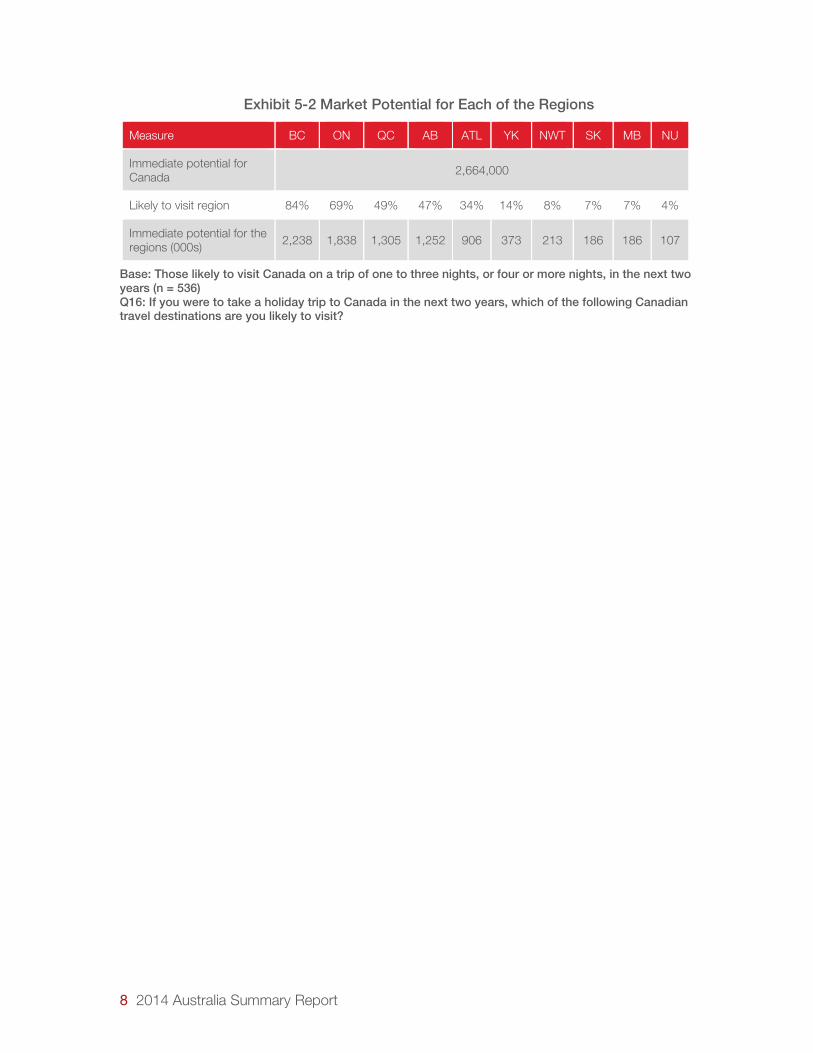
Exhibit 5-2 estimates the immediate potential for each of the regions, based on which Canadian travel destinations long-haul travellers are likely to visit in the next two years.
British Columbia has the highest potential for visitation, with 84% of Australian long-haul travellers, who are considering a trip to Canada in the next two years, citing BC as their most likely destination, followed by Ontario.
6 Includes respondents likely to visit Canada for a trip of one to three nights, or a trip of four nights or more.
8 2014 Australia Summary Report
Exhibit 5-2 Market Potential for Each of the Regions
Measure BC ON QC AB ATL YK NWT SK MB NU
Immediate potential for Canada 2,664,000
Likely to visit region 84% 69% 49% 47% 34% 14% 8% 7% 7% 4%
Immediate potential for the regions (000s) 2,238 1,838 1,305 1,252 906 373 213 186 186 107
Base: Those likely to visit Canada on a trip of one to three nights, or four or more nights, in the next two years (n = 536) Q16: If you were to take a holiday trip to Canada in the next two years, which of the following Canadian travel destinations are you likely to visit?

Canadian Tourism Commission 9
6. Competitive Environment
The GTW tracks key performance indicators (KPIs) for Canada in areas such as aided destination awareness, unaided and aided destination consideration, and market penetration. Exhibit 6-1 summarises the 2014 KPIs for Canada7.
Around a third (32%) of Australian long-haul travellers rate their knowledge of vacation opportunities in Canada as either ‘excellent’ or ‘good’ – an improvement over the level of familiarity recorded in 2012 (28%). This places Canada on par with Italy and France among the competitive set of long-haul destination in this market8, but some way behind the US (44%) and the UK (44%). However, there has been notable improvement since 2011 (24%).
Just over a fifth (21%) of long-haul travellers have already travelled to Canada (ever), the same number as those who have been to China. The US (43%) and the UK (42%) have the highest incidence of visitation, followed by France (37%), Thailand (36%) and Hong Kong (32%).
Canada appears high on their list of destinations being considered for pleasure travel, third behind the US (21%) and Europe (14%)9. One-in-ten travellers mentioned Canada when asked which destinations they were seriously considering visiting in the next two years – only the US (27%) and the UK (16%) placed higher, although Canada sat alongside Japan (9%), Thailand (9%) and China (8%), with similar levels of interest.
Asked specifically about their interest in visiting Canada (aided), Canada tops the list (82%) alongside the UK (81%) and the US (80%), in terms of those ‘definitely’, ‘very’ or ‘somewhat’ interested in visiting in the next two years. Interest in these long-haul destinations has been growing steadily since 201110.
Aided destination interest was significantly higher among those aged 18 to 34 years (88%), compared to those over the age of fifty-five (78%)11.
In fact, the likelihood they will take a trip here in the next two years has increased significantly from just 24% in 2011 to 32% in 2014, and again, the younger travellers are far more committed to visiting Canada (43%) than those over the age of fifty-five (23%)12.
7 Unaided destination awareness was dropped from the 2014 survey. 8 The competitive set of long-haul destinations for the Australian market are: the UK, the US, Italy, France, Thailand and China. 9 Based on unaided destination awareness – respondents are not presented with a list of destinations to choose from. 10 In 2011, interest in Canada was just 71%, the UK, 72% and the US 70%. 11 However, it should be noted that they were also more enthusiastic, compared to older travellers, on all the long-haul destinations presented to them. 12 Based on Q14/Q15 – Likelihood of taking a trip to Canada in the next two years. Percentage quoted is the number saying they were either ‘definitely’ or ‘very likely’ to take a trip here.

10 2014 Australia Summary Report
Exhibit 6-1 Key Performance Indicators (KPIs) for Canada – Summary
Key Performance Indicator Definition
All Long-Haul Travellers
Recent Visitors to Canada13
Interested in Canada14
n = 1,498 n = 299 n = 397
Destination awareness:
Aided awareness of travel opportunities in Canada
% with excellent / very good knowledge of travel opportunities in Canada
32% 73% 54%
Past visitation:
Overall market penetration % who have ever visited Canada for pleasure 21% 100% 29%
Intentions:
Unaided destination consideration
% who mentioned Canada or a destination in Canada on their consideration list15
10% 30% 29%
Competitive positioning on destination consideration
Rank on the consideration list relative to competitors (roll-up)
3rd 1st 2nd
Base: Long-haul pleasure travellers (n = 1,498), Recent visitors to Canada (n = 299) and those interested in visiting Canada (n = 397) Aided awareness (Q4) – “How would you rate your level of knowledge of vacation opportunities in each of the following destinations?” (Aided list of Canada plus six pre-defined long-haul competitors). Market penetration (ever visited) (Q11b) – “Which of the following countries have you ever visited while on a vacation trip?” (Aided list of long-haul destinations). Unaided destination consideration (Q2) – “Which destinations are you seriously considering for your trips in the next two years?” (Open-ended, coded responses).
13 Visited Canada in the past three years for a pleasure trip of four or more nights with one or more nights in paid accommodations. 14 Definitely interested in visiting Canada in the next two years. 15 For trips in the next two years.
Canadian Tourism Commission 11
7. Perceptions of Canada
To be successful, a destination must be perceived as offering value, relevant experiences, and unique tourism products to travellers. To assess brand, value, and price perceptions, respondents were asked to evaluate Canada relative to competing destinations on a number of attributes.
Brand perceptions
Exhibit 7-1 shows Canada’s competitive position based on Australian long-haul travellers’ perceptions around a number of brand-related attributes, whether they had been to Canada or not16.
Australians clearly appreciate Canada’s geography and outstanding natural beauty, placing it ahead of all other competing long-haul markets, by some way.
They also agree that it is a place where they can create extraordinary personal travel experiences (57%), which are authentic (55%) and where they are inspired to meet and engage with its people (51%). On all three of these brand attributes, Canada is second only to Italy.
For local ‘flavour’ and cuisine, Italy and France are some way ahead of the competing markets, while Canada is not well-recognised when it comes to exploring its cities or culture.
16 The base consists of all long-haul travellers, regardless of whether they have been to Canada or not, and is based on their perceptions of what Canada has to offer, regardless of their familiarity with Canada’s offer.

12 2014 Australia Summary Report
Exhibit 7-1 Brand perceptions
Brand Perceptions 1# 2# 3# 4# 5# 6# 7#
A place that inspires me to explore its geography CAN
61%
USA
57%
ITA
57%
FRA
49%
UK
47%
THA
47%
CHN
44%
A place where I can create extraordinary personal travel experiences
ITA
60%
CAN
57%
FRA
53%
USA
52%
UK
47%
CHN
44%
THA
42%
A place that offers an authentic experience* ITA
66%
CAN
55%
FRA
54%
CHN
51%
USA
51%
UK
50%
THA
48%
A place that inspires me to meet and engage with its people
ITA
55%
CAN
51%
USA
49%
UK
45%
FRA
45%
THA
41%
CHN
38%
A place that inspires me to sample local flavour and cuisine*
ITA
71%
FRA
59%
THA
50%
CAN
49%
USA
47%
CHN
46%
UK
42%
A place that inspires me to explore its cities* ITA
64%
USA
56%
FRA
55%
UK
54%
CAN
51%
THA
39%
CHN
39%
A place that inspires me to explore its culture ITA
66%
FRA
52%
UK
49%
CHN
49%
THA
48%
CAN
48%
USA
47%
Base: Long-haul pleasure travellers (n = 1,498) Q11: We are interested in your general impressions on [country] as a holiday destination, even if you have never been there. On a scale of 1 to 10, where 1 is ‘strongly disagree’ and 10 is ‘strongly agree’, how would you rate [country] on each of the following? Note: Scores shown are the ‘top-three-box scores’ i.e., the percentage of respondents who provided the destination with a rating of 8, 9 or 10, on a 1 to 10 scale of agreement with each statement. *Note: New attribute added for the 2014 survey.
The results support the product interests of Australian travellers, as identified in the 2012 survey, with Canada’s key strengths being: beautiful scenery, vibrant cities, exploring nature with city amenities nearby, visiting national parks and exploring wildlife.
Canada’s weaknesses were identified as those products where interest among travellers were high, but associations with the brand (Canada) were low, namely: unique character, historical and cultural attractions, sampling local flavours, city activities and city cultural experiences.
Canadian Tourism Commission 13
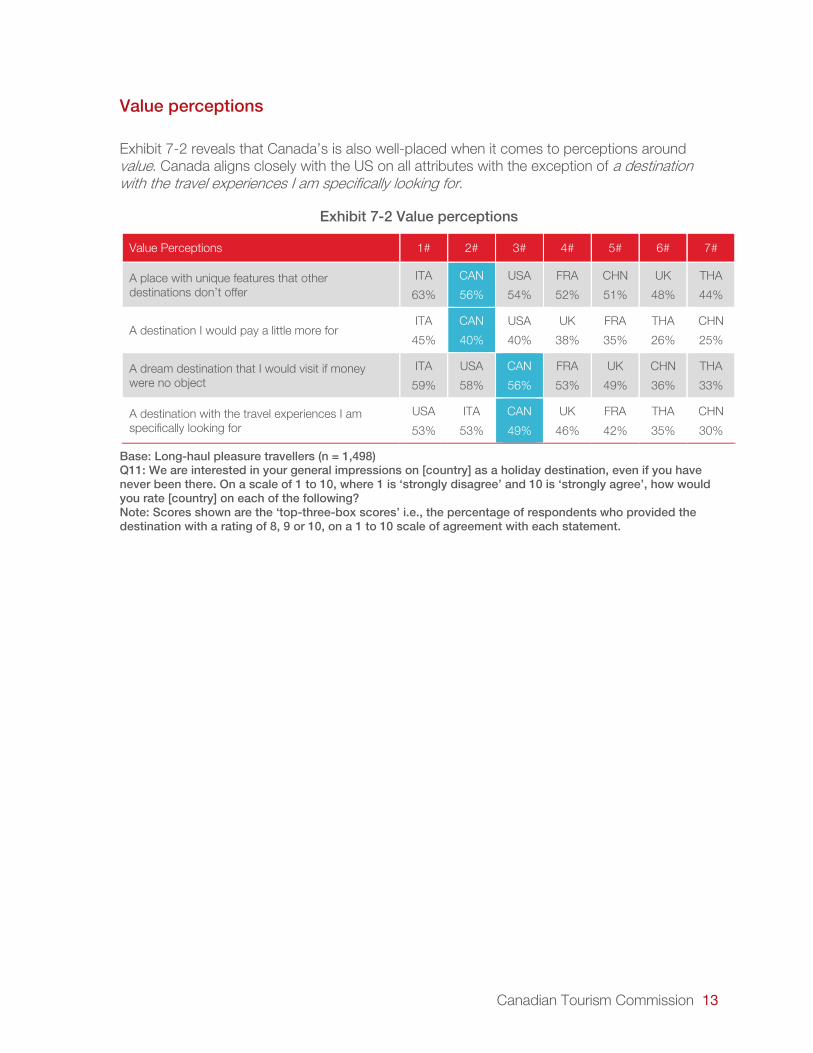
Value perceptions
Exhibit 7-2 reveals that Canada’s is also well-placed when it comes to perceptions around value. Canada aligns closely with the US on all attributes with the exception of a destination with the travel experiences I am specifically looking for.
Exhibit 7-2 Value perceptions
Value Perceptions 1# 2# 3# 4# 5# 6# 7#
A place with unique features that other destinations don’t offer
ITA
63%
CAN
56%
USA
54%
FRA
52%
CHN
51%
UK
48%
THA
44%
A destination I would pay a little more for ITA
45%
CAN
40%
USA
40%
UK
38%
FRA
35%
THA
26%
CHN
25%
A dream destination that I would visit if money were no object
ITA
59%
USA
58%
CAN
56%
FRA
53%
UK
49%
CHN
36%
THA
33%
A destination with the travel experiences I am specifically looking for
USA
53%
ITA
53%
CAN
49%
UK
46%
FRA
42%
THA
35%
CHN
30%
Base: Long-haul pleasure travellers (n = 1,498) Q11: We are interested in your general impressions on [country] as a holiday destination, even if you have never been there. On a scale of 1 to 10, where 1 is ‘strongly disagree’ and 10 is ‘strongly agree’, how would you rate [country] on each of the following? Note: Scores shown are the ‘top-three-box scores’ i.e., the percentage of respondents who provided the destination with a rating of 8, 9 or 10, on a 1 to 10 scale of agreement with each statement.

14 2014 Australia Summary Report
Exhibit 7-3 Year-on-year change in average rating for value attributes
Value 2012 2014 YOY change
Italy 7.1 7.4 +0.3
Canada 7.1 7.2 +0.1
US 6.4 7.0 +0.6
Base Long-haul pleasure travellers: 2012 n = 1,597, 2014 n = 1,498 Note: Average ratings for all value attributes, based on a ten-point scale on agreement with the statements presented to them.
The US appears to have closed the gap on Canada since 2012, with a significant increase in the average score for value attributes17, as shown in Exhibit 7-3. Australian perceptions around the US offer have significantly improved since 2012 and are now on a par with Canada, suggesting the competitive advantage we have enjoyed over the US has disappeared (see Exhibit 7-4).
Exhibit 7-4 Comparison of YOY change in value attributes: Canada versus the US
Value Perceptions
Canada US
2012 2014 YOY change 2012 2014 YOY
change
A place with unique features that other destinations don’t offer 59% 56% -3% 40% 54% +14%
A destination I would pay a little more for 39% 40% +1% 30% 40% +10%
A dream destination that I would visit if money were no object 56% 56% - 47% 58% +11%
A destination with the travel experiences I am specifically looking for 48% 49% +1% 40% 53% +13%
Base Long-haul pleasure travellers: 2012 n = 1,597, 2014 n = 1,498 Note: Average ratings for all value attributes, based on a ten-point scale on agreement with the statements presented to them.
Price perceptions
The concern with the recent gains made by US destinations around perceptions on value, is that the US leads Canada by some margin when it comes to the perceived cost of taking a vacation here, particularly with regard to the prices for food, entertainment and accommodation.
Only a third of Australian long-haul travellers believe that Canada is affordable to get to by air, with the US fairing only slightly better (39%).
17 Attributes are scored on a scale of 1 to 10, based on the level of ‘agreement’ with each of the statements presented.

Canadian Tourism Commission 15
Overall, however, the US leads Canada as a destination that offers good value for money, although it should be noted that Italy, so highly acclaimed by Australians on brand attributes, share a similar position when it comes to ‘getting the most from your budget’.
Exhibit 7-5 Price perceptions
Price Perceptions 1# 2# 3# 4# 5# 6# 7#
A destination with reasonable prices for food, entertainment and accommodation
THA
59%
USA
50%
CHN
39%
CAN
38%
ITA
34%
UK
33%
FRA
28%
A place that offers good value for money THA
59%
USA
49%
CHN
38%
CAN
38%
ITA
36%
UK
31%
FRA
27%
A destination that is affordable to get to by air THA
52%
USA
39%
CHN
37%
ITA
34%
UK
33%
CAN
33%
FRA
29%
Base: Long-haul pleasure travellers (n = 1,498) Q11: We are interested in your general impressions on [country] as a holiday destination, even if you have never been there. On a scale of 1 to 10, where 1 is ‘strongly disagree’ and 10 is ‘strongly agree’, how would you rate [country] on each of the following? Note: Scores shown are the ‘top-three-box scores’ i.e., the percentage of respondents who provided the destination with a rating of 8, 9 or 10, on a 1 to 10 scale of agreement with each statement.

16 2014 Australia Summary Report
8. Trip Profiles
The following section describes the most recent long-haul trip taken by Australian travellers18, in the past three years. Where that trip might have included more than one destination, the results refer to the destination they spent the most time in.
Most recent destination visited
The UK was the destination most likely to have been visited on their most recent trip (16%), while collectively, the same number of Australian long-haul travellers visited either Cambodia, Indonesia, Malaysia, the Philippines or Vietnam19. Thailand is by far the most popular destination in South East Asia, with 12% having taken their last trip there. The other popular destination was the US (14% excluding Hawaii), with a further 7% having visited Hawaii.
By comparison, only 5% visited Canada on their last trip, which may or may not have included a visit to the US.
Type of vacation taken
Based on their most recent long-haul vacation, almost a quarter (23%) of long-haul travellers took a trip to visit friends or family, particularly those aged between 35 and 54 years (28%). The next most popular ‘type’ of vacation was a touring vacation (19%), driven by travellers aged fifty-five years or older (28%).
Over a third (37%) of recent visitors to Canada in fact took a touring vacation on their last trip, and were less likely to have enjoyed a city vacation (7%), compared to all long-haul travellers (13%).
Travellers who are interested in visiting Canada are also likely to have friends and family here (21%), or are interested in a touring vacation (22%).
Activities participated in
The most popular activities participated in while on their last vacation were guided city tours (30%), guided excursions beyond the city (26%), day cruises (20%) and trips which involved wildlife viewing (19%).
Those travellers who have recently been to Canada, or are interested in Canada, were particularly interested in all four of those activities.
18 Based on Q26: ‘Which of these destinations [in the past three years] did you visit on your most recent trip?’ and Q27: ‘Which destination did you spend the most time in?’ 19 Collectively referred to in the reports as ‘other Southeast Asia’, because it excludes Thailand, which is reported separately.

Canadian Tourism Commission 17
There were, however, some marked difference in the activities enjoyed when age was taken into consideration. Interest in the four most popular activities were driven by the older traveller (55+).
Exhibit 8-1 Most recent trip: Activities participated in (Top-ten)
Activity Participated in
All Long-Haul Travellers
Recent Visitors to Canada20
n = 1,187 n = 299
Guided city tour 30% 34%
Guided excursion beyond the city 26% 29%
Day cruise 20% 24%
Wildlife viewing 19% 34%
Hiking 11% 15%
Cycling or biking 9% 9%
Flightseeing (by plane or helicopter) 8% 18%
Snorkeling 8% 7%
Marine life viewing (whale-watching or other sea life) 7% 13%
Cooking class 6% 8%
Base: Those who have taken a long-haul pleasure trip in the past 3 years (n = 1,187) QPT2: Did you participate in any of the following activities during your last holiday? Note: New question added for 2014.
Places visited
More than half (53%) of long-haul travellers visited a historic site or building on their last trip, and it is a key interest for those interested in visiting Canada (see Exhibit 8-2).
Other popular attractions were city parks (43%), museums (42%), botanical gardens (32%) and world heritage sites (30%).
Again, these attractions were far more likely to have been visited by those travellers over the age of fifty-five years. Two-thirds of these travellers would have been to a historical site or building. Compared to the older traveller, those aged between 18 and 34 years were more likely to enjoy an amusement park (19%), casino (18%), or brewery (12%).
20 Visited Canada in the past three years for a pleasure trip of four or more nights with one or more nights in paid accommodations.

18 2014 Australia Summary Report
Exhibit 8-2 Most recent trip: Places visited (Top-ten)
Places Visited on Vacation
All Long-Haul Travellers
Recent Visitors to Canada21
n = 1,187 n = 299
Historic site or building 53% 48%
City park 43% 56%
Museum 42% 43%
Botanical garden 32% 46%
World heritage site 30% 32%
National or State park 29% 52%
Art gallery 25% 24%
Amusement or theme park 18% 14%
Casino 13% 23%
Winery 11% 25%
Base: Those who have taken a long-haul pleasure trip in the past 3 years (n = 1,187) QPT3: Did you visit any of the following types of places during your last holiday? Please select all that apply. Note: New question added for 2014.
Vacation experiences
As shown in Exhibit 8-3, more than two-thirds (69%) of long-haul travellers tried local cuisine, and it is reasonable to expect that most travellers would, at some point – 82% of those over the age of fifty-five did so. Slightly fewer (39%) took a meal at a highly-regarded restaurant, but this increased to over 40% among 35 to 44 year olds (45%) and those over fifty-five (42%).
21 Visited Canada in the past three years for a pleasure trip of four or more nights with one or more nights in paid accommodations.

Canadian Tourism Commission 19
Exhibit 8-3 Most recent trip: Experiences (Top-ten)
Experience
All Long-Haul Travellers
Recent Visitors to Canada
n = 1,187 n = 299
Tried local cuisine 69% 63%
Dined at a highly-regarded restaurant 39% 41%
Attended a live show (e.g., comedy, musical or theatre show) 25% 22%
Rented a car 25% 32%
Took a tour or visited a museum to learn about aboriginal people 19% 34%
Visited a spa or wellness centre 16% 16%
Participated in a guided tour by train 13% 27%
Tried agritourism (e.g., visited a farm) 9% 14%
Attended a music festival 9% 15%
Northern (or Southern) lights 7% 18%
Base: Those who have taken a long-haul pleasure trip in the past 3 years (n = 1,187) QPT4: Did you see or experience any of the following during your last holiday? Please select all that apply. Note: New question added for 2014
Type of accommodation
Australian travellers were almost as likely to stay with friends and family (29%) as they were to stay at a mid-priced hotel (32%), while around a quarter (24%) chose a resort hotel, on their last trip.
Luxury hotels (19%) and budget hotels (19%) were also popular among all long-haul travellers (regardless of age), depending on household income22.
22 Those earning in excess of AUS $100,000 were more likely to stay in luxury hotels (23%), while those earning less than AUS $50,000 were more likely to stay at budget hotels (23%) or resort hotels (28%).

20 2014 Australia Summary Report
Travel party
More than half (54%) of travellers travelled with their spouse or partner, although this figure rises to 71% of those who have recently visited Canada. Exhibit 8-4 shows the significant differences in travel party, according to the age of the traveller.
Exhibit 8-4 Most recent trip: Travel party
Travel party TOTAL 18 to 34 year
olds 35 to 54 year
olds 55 years plus
Spouse or partner 54% 37% 62% 66%
Child (under 18 years) 17% 15% 30% 2%
Friend(s) 16% 19% 14% 15%
Travelling alone 12% 11% 15% 11%
Other family members 12% 14% 8% 13%
Parent(s) 11% 23% 7% 1%
Child (over 18 years) 6% 7% 6% 6%
Base: Those who have taken a long-haul pleasure trip in the past 3 years (n = 1,187) QPT6: With whom did you travel with? Note: New question added for 2014. Note: Results highlighted are statistically significantly greater than at least one other result for that activity i.e., significantly higher than at least one other age group.
Almost one-in-three (30%) of Australian travellers between the ages of 35 and 54 travel with children under the age of 18 years, and almost two-thirds of them (62%) are likely to be travelling with their spouse or partner.
Sharing experiences during the trip
More than half (51%) of 18 to 34 year olds shared photos or videos through a social media site while still on their trip, either to share their experiences or seek advice. This number drops to less than a third (30%) for those over the age of fifty-five.
If not sharing photos and / or video through social media, 28% would use email instead / as well as, with email the preferred means for those over fifty-five years.
A third of travellers also turned to the internet to research what to see and do, while on their vacation, but while older travellers were surfing the web, younger travellers were also using mobile applications or social media to do the same.
Not everyone was turning to the web while on their holiday – 29% did not use the internet to research what to see and do, or share their experiences, or even contact a local tourism organisation.

Canadian Tourism Commission 21
Sharing experiences after the trip
On returning from their vacation, 70% of long-haul travellers will talk to their friends and family about their trip, although this number is significantly lower among those aged 18 to 34 years, who are more likely to turn to social media to share photos, videos or opinions, as shown in Exhibit 8-5.
Exhibit 8-5 Most recent trip: Sharing experiences after the trip
Sharing experiences after the trip TOTAL 18 to 34 year
olds 35 to 54 year
olds 55 years plus
Talked to friends and family about the trip 70% 56% 69% 89%
Shared photos, videos or opinion via social networks 36% 47% 33% 27%
Shared photos, videos or opinions via email 28% 25% 25% 36%
Submitted your opinions to a travel review website 16% 17% 16% 14%
Blogged about the trip 9% 14% 9% 4%
Base: Those who have taken a long-haul pleasure trip in the past 3 years (n = 1,187) Q32: After returning from your recent trip, did you share your trip experiences with anyone? Note: New question added for 2014. Note: Results highlighted are statistically significantly greater than at least one other result for that activity i.e., significantly higher than at least one other age group.
Booking travel
While only 38% of travellers employed a travel agent to help them book their flights or accommodation, this figure rises to 60% among recent visitors to Canada.
Over half (54%) of long-haul travellers over the age of fifty-five had a travel agent book their flight and / or accommodation, compared to just 29% of 18 to 34 year olds. Younger travellers may have sought information from a travel agent, but then opted to make the bookings themselves. This was also true of those travelling with children.
Of the 50% who did not use a travel agent at all to help them, almost two-thirds (65%) booked their flights directly with the airline, and 42% booked accommodation directly with the provider.
Around a fifth (21%) of those not seeking help or advice from a travel agent, did not require any accommodation, suggesting perhaps that they were staying with friends and family.
Among those who have travelled to Canada in the past three years, 60% used a travel agent, compared to just 36% who travelled to other destinations – this suggests that when travelling to Canada, or a trip including Canada, they may be more inclined to seek help with their booking.

22 2014 Australia Summary Report
9. Attraction of Canada
A new question for 201423 asked those travellers considering a trip to Canada what intrigued or excited them most about a potential visit to Canada?24.
Exhibit 9-1 shows the coded results, grouped by common themes, revealing those aspects of a potential trip to Canada which Australian long-haul travellers were most enthused about.
Exhibit 9-1 What intrigues or excites you most about a potential trip to Canada? – Top mentions by Australian travellers considering a trip to Canada
Base: Respondents considering a trip to Canada (n = 657) QTI1: “What intrigues or excites you most about a potential visit to Canada?” Note: New question for 2014 Note: Open-ended question – results shown are the coded (grouped) responses)
Almost half (46%) of those considering a trip to Canada cited the scenery or natural environment, as the aspect of their potential trip they were most intrigued or excited about. Australian long-haul travellers have a great appreciation of what Canada can offer, in terms of its natural beauty and outdoor experiences, and this was by far the most appealing facet of a trip here.
Specifically, they mentioned beautiful scenery and the landscape (24%), though older travellers also mentioned ‘The Rockies’ by name25.
Almost a third (30%) of travellers between the ages of 18 and 34 simply ‘didn’t know’ what intrigued or excited them the most – perhaps because they were not familiar enough with the Canadian offer, or perhaps because they simply couldn’t name anything in particular.
23 QTI1 – “What intrigues or excites you most about a potential visit to Canada?” 24 Asked as an open-ended question, without prompt 25 12% of Australian travellers aged fifty-five or older specifically mentioned the Rockies.
46%
18%
11%
7%
7%
5%
3%
3%
2%
20%
19%
Nature / scenery
Locations / places to visit
Attractions
History / culture
Social gatherings
Atmosphere
Experiences
Specific activities
Food & drink
Miscellaneous
Don't know

Canadian Tourism Commission 23
While visiting historic sites or building was a key activity for Australian travelers on their vacations, only 7% were excited about the opportunities for such trips when visiting Canada. A low level of familiarity with such attractions may be partially to blame for this, or it may be that they do not feel Canada has a strong offer in this regard.

24 2014 Australia Summary Report
10. Barriers to visiting Canada
Among those Australian travellers who are considering a trip to Canada, the main deterrent from visiting remains the perception that it is too expensive, as shown in Exhibit 10-1 - a third said the cost might discourage them from making the trip, while 15% also mentioned that an unfavourable exchange rate might prevent them from following through on their intentions.
Just over a quarter (27%) of potential visitors said there were no real reasons not to visit Canada in the next two years, with the remaining three-quarters (73%) all pointing to at least one potential barrier which might discourage them from visiting.
Aside from potential barriers associated with cost, or the long travel distances involved, other potential concerns were perceptions around the poor weather (13%), safety concerns (12%), or simply that it was not the right time to visit (13%).
Exhibit 10-1 Top-ten barriers to visiting Canada, among those considering a trip to Canada
Base: Those who are considering a trip to Canada (n = 657) QTI3: Which of the following factors might discourage you from visiting Canada?
There is little that can be done regarding the cost of travel, and Canada is certainly not seen as a particularly affordable option compared to the US, or other travel destinations in the competitive set (see Exhibit 7-5).
While the younger travellers (18 to 34 years) seemed the most enthusiastic about potentially visiting Canada, they were also far more likely to point to barriers which might prevent them
33%
17%
15%
14%
13%
13%
12%
10%
9%
8%
27%
Too Expensive
Too Far
Unfavorable Exchange Rate
Poor Value For Money
Poor Weather
Not the Right Time
Safety Concerns
Not Enough Time to Take a Vacation
Other Places Would Rather Visit
Delays And Hassles At Airports And Borders
No Reasons Not To Visit Canada

Canadian Tourism Commission 25
from coming. Only 10% said there was nothing that would prevent me from travelling to Canada, compared to 34% for 35 to 54 year-olds and 39% of those over fifty-five.
Compared to those older travellers, 18 to 34 year olds were more likely to point to: not the right time (18%), safety concerns (18%), don’t know enough about it (11%), poor previous experience with Canada (8%), no real reason to go (6%), too boring (7%), no unique history or culture (7%) and nothing to do there (5%).

26 2014 Australia Summary Report
11. Sources of information on Canada
Source of awareness
The most common means by which Australian travellers heard about vacation opportunities in Canada was through friends and family (24%), closely followed by TV programs (22%) such as travel or entertainment shows. How they heard about Canada very much depended on their age, as revealed in Exhibit 11-1.
Exhibit 11-1 Source of awareness of Canada vacation opportunities, by age (Top-five)
18 to 34 year-olds 35 to 54 year-olds 55 plus
Friends and family in person
(18%)
TV program
(24%)
TV program
(35%)
Friends and family via social media
(14%)
Friends and family in person
(22%)
Friends and family in person
(33%)
TV advertising
(13%)
TV advertising
(20%) Magazine or newspaper article
(30%)
Travel booking website
(12%)
Traveller review websites
(11%)
TV advertising
(24%)
Traveller review websites
(12%) Brochure from a travel agency
(11%)
Magazine or newspaper advertising
(24%)
None (37%) None (37%) None (17%)
Base: Long-haul pleasure travellers (n = 1,498) Q20C: Through which of the following sources, if any, have you seen or heard about travel to Canada / Canadian destinations, in the past year?
Most influential sources
Almost three quarters (74%) of long-haul travellers believe that friends and family are the most influential source of information, when deciding where to go on vacation, followed by traveller review websites (64%) and a travel agent (in person) (60%) or websites dedicated to visitors and tourists (60%). Collectively, the most influential sources are trusted sources – those seen to be independent, unbiased, and not sponsored by one particular organisation or destination.
Compared to older travellers, 18 to 34 year olds are more likely to be influenced by friends and family via social media (62%), online articles in magazines and newspapers (61%), magazine or newspaper advertising (54%) and online advertising (30%).
There are many notable differences according to age, but friends and family in-person are perceived to be the most influential, regardless of age.

Canadian Tourism Commission 27
Among those travellers who are considering a trip to Canada, friends and family were the source of information that was most likely to have encouraged them to visit Canada specifically26 - almost half (43%).
They were also confident in their own abilities to research Canada on the web, with 30% turning to search engine queries, travel review websites, travel booking websites and online travel guides.
Again there were very notable differences by the age of the traveller, with younger travellers far more likely to investigate on the internet or use social networking sites, predominantly Facebook.
26 QTI2 – ‘Where did you see, read or hear the information that encouraged you to seriously consider visiting or returning to Canada in the next two years?’

28 2014 Australia Summary Report
12. Net Promoter Score (NPS)
The Net Promoter Score (NPS) is an established tool to measure a respondent’s likelihood to recommend a product or service to friends and family. Data was gathered among all respondents, but results from past visitors to each destination are the most telling and are presented below.
Of the 493 Australian travellers who had actually visited Canada, 54% would recommend it to friends, family and colleagues, while 17% would not – resulting in an NPS score of +3727.
Exhibit 12-1 Net Promoter Score (NPS) results (Ever Visited)
Q3: Whether you have visited or not, how likely are you to recommend each of the following holiday destinations to a friend, family member or colleague? Base for each country is filtered to only those respondents who had actually visited that country. Note: Results ranked in descending order according to the overall NPS score.
More than half (54%) of Australian visitors to Canada would recommend Canada to their friends, family or colleagues – the highest score among the competitive set of long-haul destinations, by some margin, and significantly higher than for the US.
In fact, many visitors to Australia’s most coveted long-haul destinations are reluctant to recommend their experience there28. Less than half (43%) of those who have visited Italy would
27 That is 54% minus 17% = 37%, or +37 as we report it. Note that negative NPS scores are possible. 28 More than three-quarters (78%) of Australian long-haul travellers said they were ‘somewhat’, ‘very’ or definitely’ interested in visiting Italy.
34%
34%
39%
41%
43%
46%
54%
33%
33%
34%
33%
31%
33%
29%
33%
32%
27%
27%
26%
21%
17%
0% 20% 40% 60% 80% 100
Thailand (n = 548)
China (n = 333)
France (n = 625)
United States (n = 719)
Italy (n = 531)
United Kingdom (n = 706)
Canada (n = 493)
Promoters Passives Detractors
+37
+25
+18
+14
+12
+2
+0

Canadian Tourism Commission 29
actually recommend it – this is quite astonishing given the perceptions around the brand attributes, and the level of interest in visiting Italy. Just over a quarter (26%) of visitors to Italy would in fact be classed as ‘detractors’, saying very little positive about their experience.
The level of advocacy, among Australian travelers who have actually been to these destinations, suggests that their expectations were far higher than the reality of their trip – but not so with those visiting Canada.
The NPS scores are extremely encouraging for Canada, for two reasons:
1. Compared to the competitive set of destinations, visitors from Australia are clearly satisfied with their experience sufficiently enough to recommend it to friends and family – a key indicator of how satisfied they were with their experience; and,
2. A relatively large proportion of Australian visitors will advocate a trip to Canada, to their friends and relatives, with such recommendations found to be the most influential source of information and advice when it comes to choosing where to go.
Clearly, when it comes to Canada’s competitors, their high expectations are not always being met – there is a disconnect between perception and the reality.
Canada has a great opportunity from a marketing perspective to highlight the fact that ‘Canada delivers’, when it comes to the vacation experiences here.

30 2014 Australia Summary Report
13. Path to Purchase
Like any other expensive and discretionary consumer product, there is a purchasing or decision-making cycle associated with long-haul travel: consumers move through various stages from not knowing anything about a destination to actually booking a trip.
Through additional research, the CTC has developed a Path to Purchase (P2P) model for long-haul travel and identified where the organization can have the greatest influence in converting those with potential interest in Canada to actual visitors.
These include the consideration, evaluation and purchase stages of the P2P cycle, starting with awareness of the opportunity and interest in a destination, through to booking their itinerary, travel and accommodations.
Exhibit 13-1 Stage in the path-to-purchase
Have never thought of taking a trip to this destination
Not interested in visiting / returning in the foreseeable future
Dreaming about visiting / returning someday
Seriously considering visiting / returning in the next two years
Have started to gather some travel information for a trip to this country
Am planning the itinerary for a trip to this country
Am currently making transportation and accommodation arrangements
Have already booked my transportation and accommodations
Base: Long-haul pleasure travellers (n = 1,498). Q3: Which of the following best describes your current situation when thinking about each of the following countries for a holiday trip? Note: Additional stage on the ‘path to purchase model’ was added for 2014 – ‘Have never thought of taking a trip to this destination’. Results not directly comparable to previous years. Note: Results ranked in descending order according to the number of travellers who: are planning the itinerary for their trip, making transportation and / or accommodation arrangements for their trip, or have already booked transportation and accommodations.
8%
9%
12%
14%
13%
19%
28%
17%
16%
14%
20%
15%
31%
30%
27%
29%
33%
32%
38%
18%
17%
21%
21%
17%
16%
15%
14%
10%
9%
10%
10%
7%
7%
7%
5%
8%
7%
6%
5%
6%
4%
4%
5%
5%
3%
5%
3%
4%
4%
4%
4%
4%
3%
3%
4%
2%
United States
UnitedKingdom
Canada
France
Italy
Thailand
China

Canadian Tourism Commission 31
Exhibit 13-1 shows the percentage of Australian long-haul travellers at each stage of the P2P, for both Canada and the competitive set of long-haul destinations.
The results are extremely encouraging for Canada – one-in-five travellers are on the latter stage of the P2P with regards to Canada i.e., they have at least started to gather information for a trip here. Only the US (27%) and the UK (26%) have a higher percentage of travellers at this evaluation stage.
A third of travellers dream of visiting or returning to Canada someday, ahead of the US (27%) and the UK (29%). Where these two competing destinations do have a jump on Canada is in the number of travellers who are seriously considering visiting or returning in the next two years. This suggests that when it comes to Canada, many Australians remain in this ‘dream’ stage, and require more encouragement in moving along the P2P to seriously considering Canada in the near future.

32 2014 Australia Summary Report
Sources29:
Euromonitor International. (2014). Tourism Flows Outbound In Australia.
Expedia Australia). (2014). Roaming Aussies: Taking Flight Younger, Going Farther And More Frequently.
Statistics Canada. (2015). International Travel Survey.
The Economist. (2012). Australia's Economy.
The Sydney Herald. (2015). More rate cuts, lower growth for Australia, predicts Goldman Sachs.
The Wall Street Journal. (2015). Australia’s Central Bank Cuts Growth, Inflation Forecasts.
Tourism Economics. (2015). Tourism Decision Metrics.
Tourism Research Australia. (2014). Tourism Forecasts Autumn 2014.
Tourism Research Australia. (2014). Australians travelling overseas.
Trading Economics. (2015). Australia GDP Growth Rate.
Visit Britain. (2014). Market and Trade Profile: Australia.
29 Sources are documented according to the guidelines described in the fifth edition of the APA’s ‘Publication manual’, a recognised international standard for social and behavioural sciences.