ensuring fair and effective carbon pricing of ...imers.org/docs/rm_side_event_doha.pdf · details...
TRANSCRIPT
IMERS International Maritime Emission Reduction Scheme
Ensuring Fair and Effective Carbon Pricing
of International Transport
COP 18 side event, 27 Nov 2012
Andre Stochniol ([email protected])
Panel:
Edward Cameron, World Resource Institute
Erik Haites, Margaree Consultants
Mark Lutes, WWF International
Negotiators/experts from certain countries

Agenda
• Background
• Rebate Mechanism to unlock a compromise
• Summary and Conclusions
• Panel Views, and Debate
2

Two Multilateral Problems ... in this order
1. How to mobilize significant financing for climate action in developing
countries? (UNFCCC) • Current mechanisms are inadequate, both in scale and design
• Yet “the writing is on the wall” regarding contribution from international transport:
• Practically every independent report on the topic highlights carbon pricing
of emissions from international shipping (and aviation) as an
important/promising source of public finance (see AGF and IMF/WB
reports, and recently LTF).
• Global and complex
• Outside current regime (Kyoto Protocol)
• Significant and rapidly growing
• Double aviation emissions
• The 2011 IMO EEDI & SEEMP regulations
will only slow their growth
• All uniform proposals on the table are
unacceptable to developing countries (as
contrary to the UNFCCC principle of CBDR)
Example Issue How to attribute emissions of a ship that is:
• Swiss owned, • Flying Liberia flag, • Chartered by Danish
company, • Leaving Saudi Arabia, with • Cargo for NY, and Shanghai, • Via international waters?
2. How to address international shipping CO2 emissions?
(UNFCCC/IMO)
3

Carbon pricing / Market Based Measures at the IMO
• At the IMO focus is though on emission reductions, not financing
– Shipping stakeholders wary of shipping becoming “cash cow”, thus talk about
“proportionality” of effort (expressed simply as % of total emissions)
– Many would prefer to keep the money in the sector, rather than direct to climate
financing; but are even more against money going to national coffers as tax or similar
– The simpler the better attitude to avoid bureaucracy (thus the levy/contribution is
supported more than ETS); situation is dynamic as nothing is agreed yet
• The deadlock between developed & developing countries remains
– Namely, whether and how to apply the UNFCCC principle of common but
differentiated responsibilities and respective capabilities (CBDR) to global shipping
(the same issue is true for negotiations at the UNFCCC)
– At MEPC 63 & 64, lack of the promised resolution on technical co-operation led to
delaying also the proposed impact assessment of the MBMs
• Market-Based Measures (MBMs) to
address shipping GHG emissions
discussed in details since MEPC 56
(July 2007)
• Slow pace, but steady progress – 10
proposals made, and assessed
4

• Not whether, but how to reconcile
– Differentiated climate principles (CBDR), with
– Uniform policies of shipping (IMO)
• A global approach is needed, as regional or national approaches will
not work
• Carbon price/MBM would be regressive, impacting less developed
countries, often heavily relying on international transport, most
• RM is the only differentiation option being currently
considered to address potential adverse impacts of a
global MBM scheme on the poor countries
– An alternative option based on exempting the less developed
countries, by covering only goods carried to developed countries, is
too complex, especially for container ships
– RM with climate financing would make them better off
5
Rationale for the rebate mechanism (RM)

Strong Case for Rebates
6
Source: “Fair Finance” briefing, CAFOD & A. Stochniol, 2011
Updated map is available that takes into account long trading distances (minor map changes).
For calculations and a map showing estimated cost burden as % of GDP see the RM Fact Sheet.
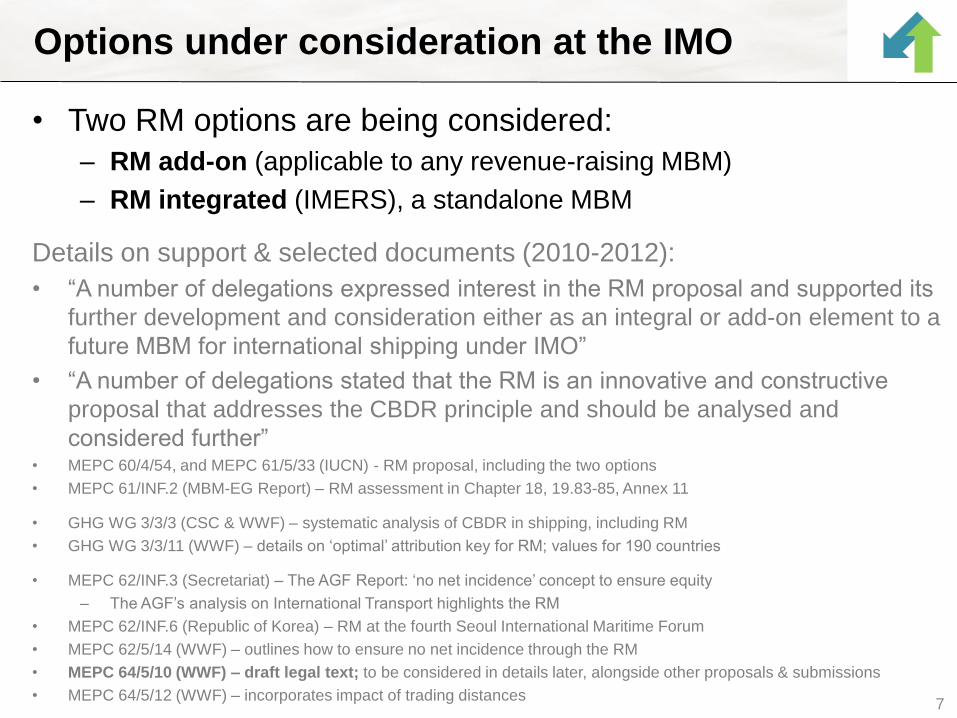
Options under consideration at the IMO
• Two RM options are being considered:
– RM add-on (applicable to any revenue-raising MBM)
– RM integrated (IMERS), a standalone MBM
7
Details on support & selected documents (2010-2012):
• “A number of delegations expressed interest in the RM proposal and supported its
further development and consideration either as an integral or add-on element to a
future MBM for international shipping under IMO”
• “A number of delegations stated that the RM is an innovative and constructive
proposal that addresses the CBDR principle and should be analysed and
considered further” • MEPC 60/4/54, and MEPC 61/5/33 (IUCN) - RM proposal, including the two options
• MEPC 61/INF.2 (MBM-EG Report) – RM assessment in Chapter 18, 19.83-85, Annex 11
• GHG WG 3/3/3 (CSC & WWF) – systematic analysis of CBDR in shipping, including RM
• GHG WG 3/3/11 (WWF) – details on ‘optimal’ attribution key for RM; values for 190 countries
• MEPC 62/INF.3 (Secretariat) – The AGF Report: ‘no net incidence’ concept to ensure equity
– The AGF’s analysis on International Transport highlights the RM
• MEPC 62/INF.6 (Republic of Korea) – RM at the fourth Seoul International Maritime Forum
• MEPC 62/5/14 (WWF) – outlines how to ensure no net incidence through the RM
• MEPC 64/5/10 (WWF) – draft legal text; to be considered in details later, alongside other proposals & submissions
• MEPC 64/5/12 (WWF) – incorporates impact of trading distances

Add-on option (in 140 characters)
All ships/planes pay for their emissions. Certain countries
obtain rebates, and the remaining revenue goes to climate
change action. (including in the sector)
8
Detailed points:
1. Ensures that developing countries are not worse
2. Reconciles a global approach, which is required for international
shipping, with the principles of equity and CBDR
3. Can apply to any revenue raising MBM
1. Such as a levy/contribution and ETS
2. Already integrated with the IMERS proposal
4. Highlighted in the AGF, and the IMF/WB reports; rebating mentioned in
the LTF report
5. Rebates to developing countries may amount to 1/3 of revenue raised,
the remaining 2/3 will be a predictable and affordable source of climate
change financing and R&D for clean shipping

RM versions and applicability
1. RM add-on can apply to any revenue raising MBM, in principle
2. RM integrated (aka IMERS) is a complete proposal with the RM built-in
More details see
the Study issued
9
Quantity Price Efficiency
ETS PSL SECT
No
net i
ncid
ence
on
deve
lopi
ng c
ount
ries
Ens
ured
N
ot e
nsur
ed
IMERS RM integrated
GHG
FundEIS
RM
add-on
MBM
These were
modified in
2012, given the
confirmation by
MEPC 63 that
EEDI must
apply to new
ships only.

Integrated option (IMERS)
A levy on fuel for international shipping with RM, applied
globally, collected centrally*, likely to contribute $10bn+ to
GCF.** (in 140 characters)
10
Key points:
1. The levy is market-based with shipping facing the same carbon price as
other modes of transport
• The levy is however set constant for at least a quarter, and
bounded within a price floor and ceiling set for many years
• There is no cap on emissions (but a % of mitigation finance is determined)
2. The scheme is based on a central emissions registry, holding an
emission account for each ship, and a global bank providing a
payment account for each ship (other proposals also assume global approach!)
3. As per RM, a developing country is entitled to an annual rebate in
relation to its share of global seaborne imports, and will further benefit
from financing for climate change action
* Flexible for domestic collection, where required (i.e. potential opt-out for the USA)
** If so decided

11
EMISSIONS
REGISTRY 4. Enforcement
LEVY
3. Status Check
1. Reporting (of fuel bunkered)
Commercial
Agreement
(Who pays )
2. Payment (of the levy) *2.1 Optional national collection
(may be unused as in the IOPC Funds)
Flag & Port
States
BANK
(Fund)
6. Disbursement
6.1 Rebates to developing countries
6.2 Climate and R&D financing
5. Certification
&
How would it work? Direct/global approach
• Disbursement of MBM revenue is to comprise two steps:
– Cost burden incurred by a developing country Party participating in
the MBM is rebated (paid) to it
– The remaining revenue (net revenue), is disbursed by the agreed
entity or entities (i.e. GCF, IMO)
• For details & options see the draft legal text
12
Compliance with UNFCCC Convention
Consequently (details):
1. Net revenue for climate change action would come from consumers in
developed countries only, complying with the UNFCCC principles
2. Developing countries would be beneficiaries of the MBM, with the
most vulnerable countries to benefit most through the relevant rules
and provisions applied at the 2nd step (SIDS, LDCs, African countries)
– LDCs circa tenfold
3. The shipping sector would also benefit at the 2nd step, potentially
through a new global Maritime Technology Fund, or similar

1. “Voluntary” agreement: foregoing of the rebate, or part of it (with such money potentially flowing to South-South collaboration)
2. Capacity-based: securing commitment based on or
scaling through a capacity factor, such as GDP per capita
• Certain views on burden (incidence) per country categorizations:
– Economies (UNCTAD categorization)
• Developed 56.7%, Transition 3.1%, Developing 40.2% – Of developing: Africa 3.4%, Americas: 5.4%, Asia: 31.3%, Oceania: 0.1% (all 40.2%)
– Income based (World Bank categorization)
• High Income: 70%, Upper Middle Income: 22%,
• Lower Middle Income: 7%, Low Income: 1% (subtotal 8%)
• Thus the “real” rebates are very likely to be somewhere between 10%
and 30% of total costs (depending on the agreement reached)
– Thus 30% on the next page should be treated as for illustration only … 13
Approaches to high income developing countries?

Additional information
• Draft legal text (doc 1)
– http://imers.org/docs/mepc64-5-10.pdf
• RM Fact Sheet (doc 2)
– http://imers.org/docs/RM_Fact_Sheet.pdf
14

• The RM is practical and potentially transformative
– It creatively reconciles the shipping and climate principles
– It is fair and efficient
– It may generate $10bn+ annually, from developed countries, and
additional cooperative contribution from developing countries, able to
do that
• Can be implemented as:
– RM add-on, by integrating with any revenue raising MBM
– RM integrated (IMERS), with its unique features (price collar etc.)
• Enough has been on technical analysis
– Additional technical sharing/discussion could be arranged at Doha
• It is high time for a political decision how to reconcile the
UNFCCC and ICAO/IMO/ICAO principles:
– How to get such agreement ,or at least a signal, here in Doha? 15
Conclusions, Q&A

IMERS International Maritime Emission Reduction Scheme
Debate on Fair and Effective Carbon
Pricing of International Transport
Feel free to ask any questions
16

6.6
23.9
24.2
12.6
0.9
2.9
68.3
60.5
0 20 40 60 80 100
South Africa
Bangladesh
Seaborne imports by sectorShare of total value of seaborne imports(percent; estimated)
Food Fuels Minerals Manufactures (HS 28-97)
Detailed Analysis Supports Global Action with RM
1. Country Trade-Weighted Distance
17
2. Impact analysis by country & regions
Small Island Developing State (SIDS)Least Developed Country (LDC) Any other country/region
LDC
LDC
SIDS
SIDS
SIDS
SIDS
SIDS
SIDS
SIDS
SIDS
SIDS
SIDS
SIDS
SIDS
SIDS
SIDS
0 2,000 4,000 6,000 8,000
Philippines
Hungary
Côte d'Ivoire
Senegal
Italy
Slovakia
Sweden
Venezuela …
Ecuador
Lebanon
Solomon Islands
Panama
Costa Rica
Canada
Burundi
Estonia
Armenia
Guyana
Ireland
Spain
Belarus
Slovenia
Nicaragua
Guatemala
Vanuatu
Turkey
El Salvador
Malta
Luxembourg
Syrian Arab …
Barbados
Greece
Algeria
Colombia
Moldova, Rep. of
Iceland
Maldives
Bulgaria
Cape Verde
Cyprus
Norway
Honduras
Belize
Lithuania
Romania
Croatia
Portugal
Trinidad and …
Dominican …
Morocco
Jamaica
Serbia
Aruba
Macedonia (the …
Latvia
Dominica
Bosnia and …
Montserrat
Russian Federation
Albania
Tunisia
Bahamas
nautical miles
Trade-Weighted Distance (TWD)
LDC
LDC
LDC
LDC
LDC
LDC
LDC
LDC
LDC
LDC
LDC
LDC
LDC
SIDS
SIDS
SIDS
0 2,000 4,000 6,000 8,000
Chile
South Africa
Bangladesh
Argentina
Uruguay
Brazil
Australia
Mozambique
Namibia
New Zealand
Qatar
Bolivia
China
Mongolia
Nigeria
Germany
Saudi Arabia
Madagascar
Togo
China, Macao SAR
Ghana
United Arab …
Mauritius
Oman
Peru
Niger
Malaysia
China, Hong Kong …
Japan
Kenya
United States of …
Netherlands
Poland
India
Thailand
Czech Republic
Mali
Switzerland
United Kingdom
Belgium
Tanzania, United …
Austria
Pakistan
Sri Lanka
Singapore
Jordan
Korea, Rep. of
Israel
Viet Nam
France
Georgia
Finland
Azerbaijan
Mexico
Denmark
Fiji
Ethiopia
Yemen
Guinea
Rwanda
Malawi
Sudan
nautical miles
Trade-Weighted Distance (TWD)
Bangladesh South Africa
0.19% 0.14%
Maximum cost impact on import prices (example; excluding rebates & any benefits)
Available at:
http://imers.org/docs/bottom-up_analysis_BGD_ZAF.pdf

18
EMISSIONS
REGISTRY
LEVY
3. Status Check
Air traffic
control
BANK
(Fund)
6. Disbursement
6.1 Rebates to developing countries
6.2 Climate and R&D financing
How may it work for aviation? (fuel/emission levy)
4. Enforcement
1. Reporting (of fuel use per period)
Commercial
Agreement
(Who pays )
2. Payment (of the levy) *2.1 Optional national collection
(may be unused as in the IOPC Funds)

Alternatives for rebates – Aviation
(work in progress)
19
Aviation - selected options/proxies
Option A B C
Economies Fuel (IEA) RTK (ICAO) Imports by sea/air
Developed 54.2 57.5 56.7
Transition 4.8 2.0 3.1
Developing 41.0 40.5 40.2
TOTAL 100.0 100.0 100.0
Details
Africa 4.3 2.8 3.4
Americas 5.4 3.7 5.4
Asia 31.1 33.8 31.3
Oceania - 0.2 0.1
All Developing 40.8 40.5 40.2