ensuring emergency power for critical municipal services with natural gas-fired combined heat and...
TRANSCRIPT
ARTICLE IN PRESS
0301-4215/$ - se
doi:10.1016/j.en
�Tel.: +1 979
E-mail addr
Energy Policy 35 (2007) 5931–5937
www.elsevier.com/locate/enpol
Ensuring emergency power for critical municipal services with naturalgas-fired combined heat and power (CHP) systems: A cost–benefit
analysis of a preemptive strategy
Jerry Jackson�
Texas A&M University, 3137 TAMU, College Station, TX, 77843, USA
Received 10 March 2007; accepted 18 July 2007
Available online 30 August 2007
Abstract
Electric power failures in the aftermath of disasters cripple the delivery of critical emergency services. While emergency generators are
available in some facilities, these systems are designed for short-term use and support limited functions. The substantial investment
required to ensure emergency power for all critical services is difficult to justify because of the uncertainty associated with the likelihood
and magnitude of future disasters. Investment evaluations change when a new source of emergency power is considered. This study
evaluates the costs and benefits of a program to preemptively install new building-sited electric combined heat and power (CHP)
generation technologies to ensure reliable long-term power for critical municipal services in hurricane-prone regions of the US. Three
municipalities are selected for this analysis: Houston, Texas; Miami, Florida; and Charleston, South Carolina. Analysis indicates that
costs of such a program can, in some cases, provide net energy bill savings regardless of the occurrence of a disaster.
r 2007 Elsevier Ltd. All rights reserved.
Keywords: CHP; Distributed generation; Emergency power
1. Introduction
Emergency generators in disaster-prone areas are typi-cally designed for short-term use for only the most vitalmunicipal services. Post-disaster health care, shelter andpublic safety are extremely limited and in some casesvirtually non-existent, largely due to electric system failures(US House of Representatives, 2006). Evaluating the futurebenefits of more extensive emergency power systems as partof a risk management process is difficult because ofuncertainty associated with the likelihood and magnitudeof future natural disasters. The expected benefit ofadditional investments in emergency generation equalsthe product of estimated benefits and the probability ofoccurrence. The probability of a disaster at any one specificlocation is exceedingly small, resulting in limited expectedbenefits. Consequently, existing emergency generation
e front matter r 2007 Elsevier Ltd. All rights reserved.
pol.2007.07.012
845 2532; fax: +1 979 862 1572.
ess: [email protected]
systems are typically determined by minimal requirementsspecified in existing health and safety codes.Cost–benefit calculations for expanding municipal emer-
gency power capabilities can change substantially, how-ever, by considering a different source of emergency poweravailable with new building-sited combined heat and power(CHP) electric generation (US Department of Energy,2000, 2002). Instead of traditional emergency generatorapplications, these technologies are integrated in buildingenergy systems to continuously provide some portion of afacility’s electricity and thermal energy needs, includingspace heating, water heating and air conditioning. In theevent of a power outage, these systems continue to operate,providing power for critical services. The economic benefitduring normal daily operation helps offset some or all oftheir costs.While CHP systems are widely recognized as useful for
emergency power applications (Hordeski, 2005; Gulf CoastCHP Application Center, 2006), no analysis has beenconducted to evaluate the costs and benefits of a programto preemptively install CHP systems to provide critical
ARTICLE IN PRESS
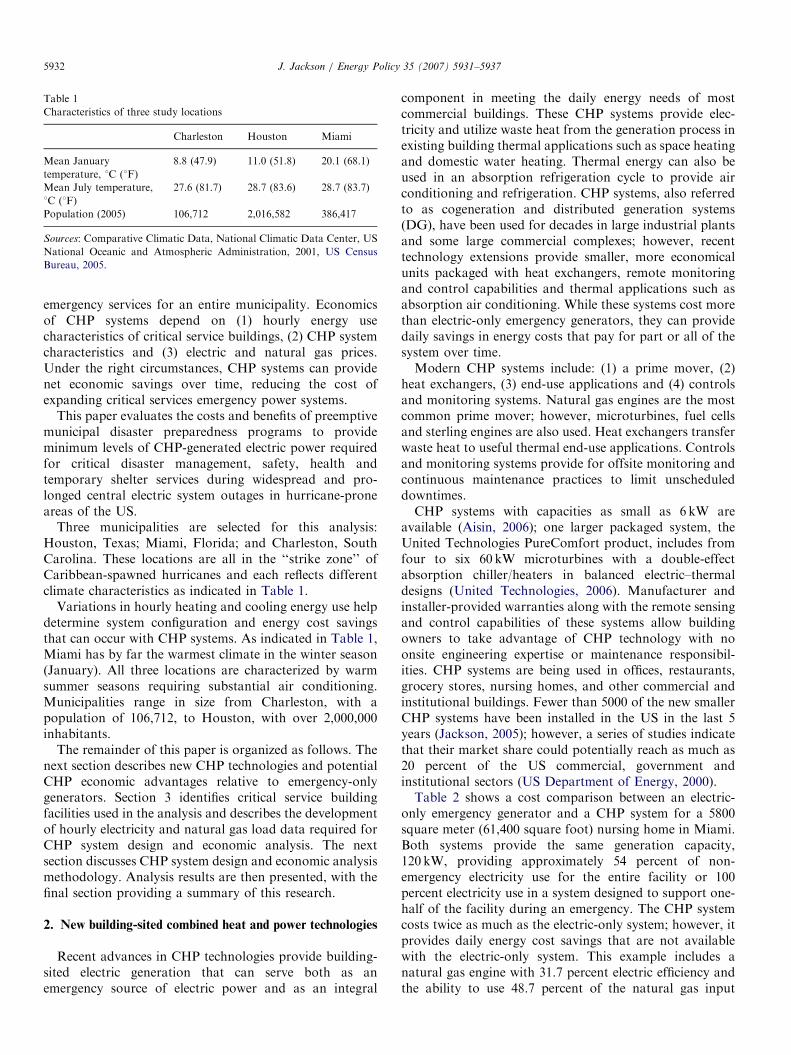
Table 1
Characteristics of three study locations
Charleston Houston Miami
Mean January
temperature, 1C (1F)
8.8 (47.9) 11.0 (51.8) 20.1 (68.1)
Mean July temperature,
1C (1F)
27.6 (81.7) 28.7 (83.6) 28.7 (83.7)
Population (2005) 106,712 2,016,582 386,417
Sources: Comparative Climatic Data, National Climatic Data Center, US
National Oceanic and Atmospheric Administration, 2001, US Census
Bureau, 2005.
J. Jackson / Energy Policy 35 (2007) 5931–59375932
emergency services for an entire municipality. Economicsof CHP systems depend on (1) hourly energy usecharacteristics of critical service buildings, (2) CHP systemcharacteristics and (3) electric and natural gas prices.Under the right circumstances, CHP systems can providenet economic savings over time, reducing the cost ofexpanding critical services emergency power systems.
This paper evaluates the costs and benefits of preemptivemunicipal disaster preparedness programs to provideminimum levels of CHP-generated electric power requiredfor critical disaster management, safety, health andtemporary shelter services during widespread and pro-longed central electric system outages in hurricane-proneareas of the US.
Three municipalities are selected for this analysis:Houston, Texas; Miami, Florida; and Charleston, SouthCarolina. These locations are all in the ‘‘strike zone’’ ofCaribbean-spawned hurricanes and each reflects differentclimate characteristics as indicated in Table 1.
Variations in hourly heating and cooling energy use helpdetermine system configuration and energy cost savingsthat can occur with CHP systems. As indicated in Table 1,Miami has by far the warmest climate in the winter season(January). All three locations are characterized by warmsummer seasons requiring substantial air conditioning.Municipalities range in size from Charleston, with apopulation of 106,712, to Houston, with over 2,000,000inhabitants.
The remainder of this paper is organized as follows. Thenext section describes new CHP technologies and potentialCHP economic advantages relative to emergency-onlygenerators. Section 3 identifies critical service buildingfacilities used in the analysis and describes the developmentof hourly electricity and natural gas load data required forCHP system design and economic analysis. The nextsection discusses CHP system design and economic analysismethodology. Analysis results are then presented, with thefinal section providing a summary of this research.
2. New building-sited combined heat and power technologies
Recent advances in CHP technologies provide building-sited electric generation that can serve both as anemergency source of electric power and as an integral
component in meeting the daily energy needs of mostcommercial buildings. These CHP systems provide elec-tricity and utilize waste heat from the generation process inexisting building thermal applications such as space heatingand domestic water heating. Thermal energy can also beused in an absorption refrigeration cycle to provide airconditioning and refrigeration. CHP systems, also referredto as cogeneration and distributed generation systems(DG), have been used for decades in large industrial plantsand some large commercial complexes; however, recenttechnology extensions provide smaller, more economicalunits packaged with heat exchangers, remote monitoringand control capabilities and thermal applications such asabsorption air conditioning. While these systems cost morethan electric-only emergency generators, they can providedaily savings in energy costs that pay for part or all of thesystem over time.Modern CHP systems include: (1) a prime mover, (2)
heat exchangers, (3) end-use applications and (4) controlsand monitoring systems. Natural gas engines are the mostcommon prime mover; however, microturbines, fuel cellsand sterling engines are also used. Heat exchangers transferwaste heat to useful thermal end-use applications. Controlsand monitoring systems provide for offsite monitoring andcontinuous maintenance practices to limit unscheduleddowntimes.CHP systems with capacities as small as 6 kW are
available (Aisin, 2006); one larger packaged system, theUnited Technologies PureComfort product, includes fromfour to six 60 kW microturbines with a double-effectabsorption chiller/heaters in balanced electric–thermaldesigns (United Technologies, 2006). Manufacturer andinstaller-provided warranties along with the remote sensingand control capabilities of these systems allow buildingowners to take advantage of CHP technology with noonsite engineering expertise or maintenance responsibil-ities. CHP systems are being used in offices, restaurants,grocery stores, nursing homes, and other commercial andinstitutional buildings. Fewer than 5000 of the new smallerCHP systems have been installed in the US in the last 5years (Jackson, 2005); however, a series of studies indicatethat their market share could potentially reach as much as20 percent of the US commercial, government andinstitutional sectors (US Department of Energy, 2000).Table 2 shows a cost comparison between an electric-
only emergency generator and a CHP system for a 5800square meter (61,400 square foot) nursing home in Miami.Both systems provide the same generation capacity,120 kW, providing approximately 54 percent of non-emergency electricity use for the entire facility or 100percent electricity use in a system designed to support one-half of the facility during an emergency. The CHP systemcosts twice as much as the electric-only system; however, itprovides daily energy cost savings that are not availablewith the electric-only system. This example includes anatural gas engine with 31.7 percent electric efficiency andthe ability to use 48.7 percent of the natural gas input

ARTICLE IN PRESS
Table 2
Economics of standby electric-only and combined heat and power systems
Emergency electric
generation only
Combined heat and
power
Capacity (kW) 120 120
Installed cost ($/kw) 450 953
Installed cost ($) 54,000 114,360
Avoided costs
Electric ($) 79,534
Natural gas ($) 32,357
Operating cost ($) 12,007
Natural gas gen. cost ($) 66,976
Annual savings ($) 32,908
Net present value of
investment ($)
(54,000) 170,531
Simple payback (years) 3.5
J. Jackson / Energy Policy 35 (2007) 5931–5937 5933
energy for thermal applications. The system has an overallefficiency of 80.4 percent. These cost and efficiency data aretaken from US Department of Energy (2002). By generat-ing electricity on site, annual utility electric bills arereduced by $79,500. Use of waste heat in the buildingsaves an additional $32,357 in annual natural gas bills.Deducting $66,976 in natural gas costs to fuel the primemover and operating and maintenance costs of $12,007provides a net annual energy cost savings of $32,908. Theseannual cost savings along with the installation cost providea net present value of $170,531 and a payback of 3.5 years,assuming constant costs and a discount rate of 3 percent.
As indicated in the Table 2 example, savings in avoidednatural gas and electricity costs are critical components inthe economic analysis that are offset, to some extent, bynatural gas fuel used to run the onsite generator and otheroperating and maintenance costs. The onsite electricgeneration process can be more or less efficient andtherefore more or less costly to generate a single kWh ofelectricity compared to purchase from the local utility;however, the overall economic attractiveness of CHPsystems depends to a large extent on avoided natural gascosts resulting from the onsite use of waste heat.
The relationship between utility-provided electric andnatural gas prices also plays an important role in CHPeconomics. The relationship between these two energyprices depends primarily on the mix of generating fuelsused by the utility. Systems with heavy oil and natural gasuse generally provide the most attractive (largest) elec-tric–natural gas price spreads. The extent to which naturalgas price increases impact CHP system economics dependson the impact these prices have on the price of utility-generated electricity. For example, an increase of 20percent in natural gas prices without any increase inelectricity prices boosts the payback in Table 2—4.4 years,an increase of 27 percent. However, if the 20 percentnatural gas price increase also causes utility-generatedelectricity prices to increase by 10 percent, the paybackactually falls by 3 percent to 3.4 years. Thus, in areas whereCHP economics are attractive because of heavy reliance on
natural gas and oil as utility-generating fuels, the temporalcorrelation of fossil fuel prices with utility-generatedelectric prices provides reasonably stable economics overtime.CHP waste heat utilization provides overall system
efficiencies as much as 80–90 percent (Maine PublicUtilities Commission, 2001). The extent to which onsitewaste heat can offset the cost of CHP equipment isdetermined by the nature of hourly electric and thermaldemands in the building across all hours of the year.Different building types have distinctive hourly energy useprofiles reflecting building functions and weather impacts;consequently, the economics of preemptively developingemergency power capabilities with CHP systems dependson detailed hourly building analysis of the individualbuilding types used to provide critical services.Most hurricane damage to electric systems occurs
because of wind and wind-related damage without inter-rupting natural gas delivery. Consequently, supply relia-bility is not considered in this study.
3. Critical service facility requirements and hourly energy
use characteristics
Critical disaster mitigation functions considered in thisanalysis include: (1) disaster management and publicsafety, (2) health and (3) shelter services. We assume thatdisaster management and public safety functions of localgovernments can be met in disaster situations with 10percent of total municipal floor space. Required health careneeds are specified as 50 percent of hospital beds and 50percent of nursing home beds. Shelter requirements for 5percent of the population are met with approximately 25percent of existing school buildings. These specificationsreflect input assumptions in the analysis. As indicatedbelow, the assumptions are converted to building require-ments, or, more specifically, to the number of buildingsconsistent with typical building sizes in the individualbuilding-type categories. Detailed results of analysis foreach of the individual functions/building type are reportedin a later section to allow analysis using alternative inputassumptions on minimal critical services requirements.Detailed energy use and other characteristics of repre-
sentative buildings in these locations were developed fromthe US Department of Energy’s Commercial BuildingsEnergy Consumption Survey (CBECS, US Department ofEnergy, 1992, 1995). While more recent CBECS data areavailable, we had access to detailed billing information foronly the 1992 and 1995 data. CBECS data were pooled,and a proportional post-stratification using US CommerceDepartment county-level data on establishments by em-ployee size categories (County Business Patterns, 2000) wasused to develop a national sample of 12,499 commercialbuildings across the US. Average local government,hospital, nursing home and school buildings withinmetropolitan statistical areas were developed with datafor the largest half of the building population in each

ARTICLE IN PRESS
Table 3
Number of facilities and square feet required to support 100,000 population center
Building type Building size Number of buildings
Square meters Square feet Charleston Houston Miami
Disaster mgmnt/Pub safety 19,881 214,000 1 1 5
Hospital 65,030 700,000 1 2 3
Nursing homes 8,826 95,000 2 5 24
Shelter (schools) 11,520 124,000 5 16 82
J. Jackson / Energy Policy 35 (2007) 5931–59375934
building category consistent with a program that installsCHP systems in larger buildings.
Table 3 shows the size of each of the representativebuildings. In this preliminary analysis, a single-buildingcharacterization was used for each of the three locations, inpart, to provide economic comparisons where only weatherand energy prices varied across locations. Buildingsconsistent in size exist in all three municipalities. Thenumber of buildings required to meet the capacity targetsabove was developed using information from the CBECSsurvey data and the US Commerce Department’s Statis-tical Abstract of the US (2006). For example, there areapproximately 278 hospital beds per 100,000 people in theUS, requiring 139 hospital beds to meet the 50 percentcapacity figure used in the analysis. CBECS data indicatethat approximately 93 square meters (1000 square feet) arerequired per bed, yielding a hospital floor space require-ment of 13,000 square meters or 139,931 square feet per100,000 population. Since the representative hospital usedin this analysis has 65,030 square meters, one hospital isrequired in Charleston, two in Miami and three in Houstonto meet the minimum capacity requirements.
Approximately 5000 square meters (53,820 square feet)per 100,000 people are required to meet the 10 percent oftotal municipal floor space required for disaster manage-ment and public safety operations, requiring one represen-tative municipal building in Charleston and Miami and fivein Houston.
The US nursing home ratio of 672 beds per 100,000people yields a 50 percent capacity requirement of 336 bedsper 100,000 people. A CBECS-based floor space per bedratio of 29 square meters per bed (311 square feet/bed)requires two, five and 24 nursing homes in the three cities.
The analysis assumes that schools can most easily beequipped for emergency shelter with a space requirement of9.3 square meters (100 square feet) per person. This per-person space requirement is 63 percent of CBECS hotel/motel space requirements assuming a room occupancy offour people; it is also the same as the per-student spacerequirement in the CBECS school data. Approximately 25percent of a city’s educational floor space is required foremergency shelter under these assumptions. Five schoolsare required in Charleston, 16 in Miami and 82 schoolsin Houston.
The economics of using CHP to provide emergencypower depends in part on hourly electric and thermal
energy use in each of these facility types in each of the threelocations. Energy use characteristics of the representativebuildings were developed from a sample of office buildings,hospitals, nursing homes and schools extracted from thenational CBECS database for regions and climate char-acteristics consistent with the three locations. Energy usedetail for each of the representative buildings includeshourly whole-building electric and natural gas use, alongwith space heating, air conditioning and water heatinghourly energy use for each of the 8760 h in the year.
4. CHP system design and economic analysis methodology
CHP system designs can be complicated. The primemover in this study has been restricted to natural gasengines, the most frequently selected prime mover. Naturalgas engines apply a reliable technology that has been usedfor decades and, more importantly for most of the facilitytypes, has higher electric generation efficiency. That is, theratio of generated electricity to waste heat is higher andmore compatible with the end-use (space heat, water heat,etc.) needs of most of the facility types considered here.Natural gas systems are also less expensive.Limiting the prime mover choice to a natural gas engine
does not resolve all system design issues, however. Largerengines cost less per kW capacity; however, CHP systemsmust be sized to maximize the cost savings from onsite useof waste heat and avoided electricity costs. These calcula-tions depend on natural gas prices and electric ratestructures. US utilities charge commercial, governmentand institutional facilities based on monthly electricity use,maximum monthly 15-min electricity use and monthlynatural gas use with rate structures that include decliningblocks. Waste heat can be applied to space heating anddomestic water heating and to at least a portion of the airconditioning loads. Other uses of waste heat, such asdesiccant dehumidification, are not yet fully commercia-lized and are not included in this analysis.The analysis in this study extracted survey records from
the CBECS databases and conducted analysis of monthlybilling data to determine hourly load profiles for a sampleof facilities consistent with the representative buildingsidentified in Table 3 for each of the three locations. Facilitydata included whole building hourly electric loads, airconditioning hourly electric loads and hourly thermal loadsfor domestic water heating and space heating.

ARTICLE IN PRESSJ. Jackson / Energy Policy 35 (2007) 5931–5937 5935
Alternate prime mover sizes provide different levels andratios of electric and thermal energy; consequently, systemsize and hourly end-use energy requirements determine theappropriate electric–thermal balance. CHP designs con-sidered (1) water heating, (2) space heating and absorptionand (3) air conditioning thermal application separately andin combination. Various-sized prime movers were consid-ered along with waste heat applications to offset thermaluses in the buildings. An optimal system design wasdetermined for each representative building in eachmunicipality based on economic analysis that consideredavoided electricity and natural gas costs, operating costsand installation costs. All data on CHP system character-istics and costs were taken from the US Department ofEnergy 2002 study.
2004 electricity and natural gas rates for local utilitieswere applied for the three locations. 2004 was selectedrather than 2005 to avoid the energy price spikes caused byHurricane Katrina damage to natural gas delivery systems.
5. Cost–benefit analysis
Cost–benefit analyses of CHP applications for each ofthe representative schools, nursing homes, hospitals andmunicipal buildings were conducted at each of the threelocations. A net present value analysis is used. Net presentvalue is calculated by summing the discounted stream offinancial benefits over the life of the equipment andsubtracting the installation cost. A positive net presentvalue indicates beneficial investment and shows the presentvalue of future savings. The stream of benefits includesavoided electric and natural gas cost minus natural gas cost
Table 4
Analysis of emergency power CHP systems in three locations
Total (Including
Charleston
Annual kWh use before CHP 37,225,801
Savings—kWh 20,290,648
System size (kW) 2960
Annual operating benefits
Avoided kWh costs ($) 1,035,977
Avoided natural gas costs ($) 471,133
Annual operating costs
Generator fuel costs ($) 2,008,364
O&M costs ($) 243,482
Total net annual operating benefits �924,527
System installation cost 1,918,830
Benefit/cost analysis
Net present value (3% rate, 10 years, $) �9,922,654
Simple payback (years) N/A
$/kW �3352
Marginal energy prices
Electricity ($/kWh) 0.051
Natural gas ($/MMBtu) 8.57
of fuel used to run the CHP generator and annualoperating and maintenance costs. CHP systems areassumed to have 10-year service lives and 5 percent is usedas the discount factor. Each of these factors is included inTables 4 and 5. This analysis uses 2004 electric and naturalgas prices; alternative price and cost assumptions can beevaluated by adjusting components of the NPV calcula-tions in Tables 4 and 5.Results summed across all critical service buildings in
each of the three geographic locations are shown in Table4. It is important to note that only energy savings areincluded as benefits in this analysis; no attempt is made toquantify benefits resulting from extended availability ofemergency power in the event of a disaster situation.Consequently, the estimated benefits reported below areactually a lower bound on benefits.Total installed generation capacity of the systems ranges
from 2960 to 21,420 kW across the three municipalities.The CHP emergency systems contribute at least 50 percentof the normal electricity requirements in the buildings; thislevel of electric service was considered sufficient in allfacilities to meet critical needs. Total net annual operatingbenefits (avoided electric and natural gas costs minusnatural gas costs to run the generator minus operatingand maintenance costs—operating benefits do not includecost of the equipment) are negative in Charleston(�$924,527) but are sizeable and positive in both Houstonand Miami.Existing rate structures in all three locations are used to
calculate marginal increases or decreases in electricity andnatural gas costs; these rates can differ significantly fromaverage rates computed by dividing the total bill by total
multiple buildings within categories)
Houston Miami
224,221,813 82,171,677
138,990,827 54,070,048
21,420 6720
12,643,443 3,797,808
1,871,807 917,054
8,336,406 3,730,098
1,654,980 514,490
4,523,864 470,274
19,843,323 4,654,230
19,320,718 �582,969
4.4 9.9
902 �87
0.091 0.070
6.25 7.42
ARTICLE IN PRESSTable
5
Cost–benefitanalysisofcriticalbuildingem
ergency
power
CHPsystem
s
Shelter
Nursinghome
Hospitals
Office
Charleston
Houston
Miami
Charleston
Houston
Miami
Charleston
Houston
Miami
Charleston
Houston
Miami
AnnualkWhuse
before
CHP
941,303
951,596
1,064,754
1,925,800
2,364,319
2,873,295
24,186,544
22,643,605
22,952,634
4,481,142
4,303,294
4,863,870
Savings—
kWh
467,174
556,498
638,372
1,005,789
1,328,894
1,436,504
14,892,000
16,097,155
16,887,380
1,051,200
2,634,614
2,898,816
System
size
(kW)
170
120
120
120
170
170
1,750
1750
1750
120
450
450
Annualoperatingbenefits
Avoided
kWhcosts($)
41,518
63,267
56,353
67,355
126,930
113,891
623,870
1,021,608
1,041,533
69,807
268,881
243,639
Avoided
naturalgascosts($)
8240
2,531
21,605
46,197
41,610
44,221
134,124
142,330
128,965
23,624
47,727
92,339
Annualoperatingcosts
Generatorfuel
costs($)
46,063
37,228
65,138
101,643
95,134
93,502
1,468,210
707,338
975,992
106,553
175,696
268,396
O&M
costs($)
5606
9090
7660
12,069
15,947
17,238
178,700
131,714
138,376
12,614
26,346
28,988
Totalnet
annualoperatingbenefits
�1911
19,480
5160
�160
57,459
47,372
�888,916
324,886
56,130
�25,736
114,566
38,594
System
installationcost
149,600
150,849
114,360
114,360
149,600
149,600
827,750
928,435
928,435
114,360
219,600
219,600
System
efficiency
0.82
0.90
0.67
0.55
0.56
0.53
0.90
0.80
0.87
0.78
0.73
0.66
Benefit/cost
analysis
Net
presentvalue(3%
rate,10years,$)�166,143
17,794
�69,688
�115,745
347,835
260,510
�8,523,282
1,884,172
�442,505
�337,161
772,223
114,517
Sim
ple
payback
(years)
N/A
7.7
22.2
N/A
2.6
3.2
N/A
2.9
16.5
N/A
1.9
5.7
J. Jackson / Energy Policy 35 (2007) 5931–59375936
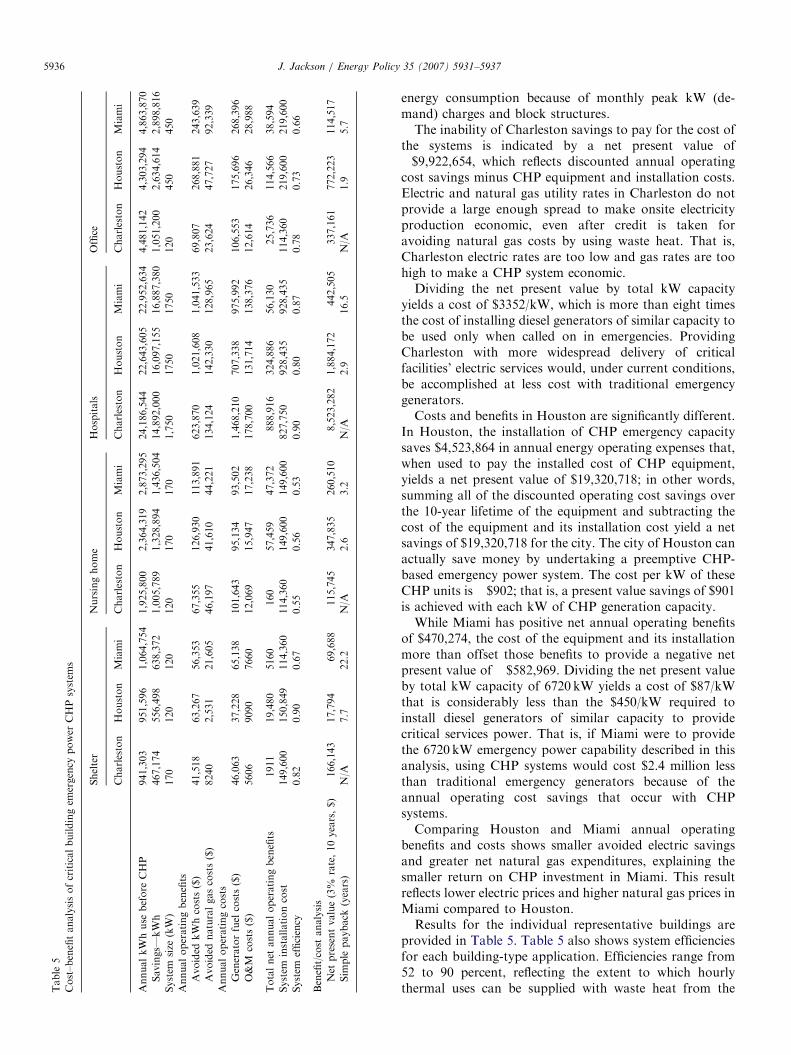
energy consumption because of monthly peak kW (de-mand) charges and block structures.The inability of Charleston savings to pay for the cost of
the systems is indicated by a net present value of�$9,922,654, which reflects discounted annual operatingcost savings minus CHP equipment and installation costs.Electric and natural gas utility rates in Charleston do notprovide a large enough spread to make onsite electricityproduction economic, even after credit is taken foravoiding natural gas costs by using waste heat. That is,Charleston electric rates are too low and gas rates are toohigh to make a CHP system economic.Dividing the net present value by total kW capacity
yields a cost of $3352/kW, which is more than eight timesthe cost of installing diesel generators of similar capacity tobe used only when called on in emergencies. ProvidingCharleston with more widespread delivery of criticalfacilities’ electric services would, under current conditions,be accomplished at less cost with traditional emergencygenerators.Costs and benefits in Houston are significantly different.
In Houston, the installation of CHP emergency capacitysaves $4,523,864 in annual energy operating expenses that,when used to pay the installed cost of CHP equipment,yields a net present value of $19,320,718; in other words,summing all of the discounted operating cost savings overthe 10-year lifetime of the equipment and subtracting thecost of the equipment and its installation cost yield a netsavings of $19,320,718 for the city. The city of Houston canactually save money by undertaking a preemptive CHP-based emergency power system. The cost per kW of theseCHP units is �$902; that is, a present value savings of $901is achieved with each kW of CHP generation capacity.While Miami has positive net annual operating benefits
of $470,274, the cost of the equipment and its installationmore than offset those benefits to provide a negative netpresent value of �$582,969. Dividing the net present valueby total kW capacity of 6720 kW yields a cost of $87/kWthat is considerably less than the $450/kW required toinstall diesel generators of similar capacity to providecritical services power. That is, if Miami were to providethe 6720 kW emergency power capability described in thisanalysis, using CHP systems would cost $2.4 million lessthan traditional emergency generators because of theannual operating cost savings that occur with CHPsystems.Comparing Houston and Miami annual operating
benefits and costs shows smaller avoided electric savingsand greater net natural gas expenditures, explaining thesmaller return on CHP investment in Miami. This resultreflects lower electric prices and higher natural gas prices inMiami compared to Houston.Results for the individual representative buildings are
provided in Table 5. Table 5 also shows system efficienciesfor each building-type application. Efficiencies range from52 to 90 percent, reflecting the extent to which hourlythermal uses can be supplied with waste heat from the

ARTICLE IN PRESSJ. Jackson / Energy Policy 35 (2007) 5931–5937 5937
generating process. No single Charleston facility typeprovides operating cost savings whereas all Houstoncritical building types show a net present value. Two ofthe four Miami critical services building types have anegative net present value in Miami.
6. Summary
This paper presents the results of a research studydesigned to assess costs and benefits of using new combinedheat and power (CHP) systems to provide electricity forcritical municipal services in the aftermath of hurricanedamage on the US Gulf and Southeastern coasts. CHPsystems generate electricity at building sites and applywaste heat for domestic water heating, space heating,absorption air conditioning and other uses. These technol-ogies are now available in small sizes and are provided withheat exchangers and controls, simplifying applications incommercial and institutional buildings such as schools,nursing homes, offices and hospitals. These systems can beinstalled and maintained by third parties requiring noonsite engineering expertise. CHP systems are increasinglybeing installed because of their economic benefits in manyUS locations.
A combination of shelter, nursing home, hospital andadministrative facilities types are specified to accommodatecritical service needs in three municipalities: Houston,Texas; Miami, Florida; and Charleston, South Carolina.These locations are all in the ‘‘strike zone’’ of Caribbean-spawned hurricanes. Building structure and energy useinformation for representative critical service facilities inthree municipalities was developed from a US Departmentof Energy database extended to provide hourly electric andthermal loads required to analyze CHP system design andperformance.
Detailed CHP design and economic analyses wereconducted for the representative facilities in each of thelocations including use of local utility rate structures,including peak kW (demand) charges and decliningblock rates.
Analysis results show that CHP systems installed in allfour critical service facility types can, under the rightcircumstances, provide a positive net present value. That is,avoided electricity and natural gas costs associated withwaste heat applications can more than offset the cost of theinstalled equipment and operating costs, providing a neteconomic benefit to municipal governments who decide toundertake a preemptive CHP-based emergency powercapability initiative.
This preliminary analysis found a net present value ofmore than $19 million for the city of Houston. While thenet present value was �$582,969 for Miami, that cost isonly 20 percent of the cost of expanding emergency powerservices with traditional diesel emergency generators.Analysis of a Charleston program showed no economicbenefit from installation of CHP systems.Differences in the economic results for the three
locations were determined to result primarily fromdifferences in utility electricity rates and natural gas prices.The results of this study suggest that municipalities should
consider utilizing new CHP technologies to extend criticalservices emergency power capabilities. Depending on hourlyenergy use characteristics of critical service buildings andelectric and natural gas prices, achieving this disasterpreparedness goal can potentially pay for itself and evenprovide net economic benefit to municipal governments.
References
Aisin Seiki Company Ltd., 2006. CHP system specifications at /http://
www.aisin.co.jp/life/ghp/english/pdf_img/cogene2.pdfS.
County Business Patterns, 2000. US Department of Commerce. Available
at /http://www.census.gov/epcd/cbp/view/cbpview.htmlS.
Gulf Coast CHP Application Center, 2006 /http://www.gulfcoastchp.org/
Markets/EmergencyS.
Hordeski, M.F., 2005. Emergency and Backup Power Sources: Preparing
for Blackouts and Brownouts. The Fairmont Press, Inc., Lilburn,
Georgia.
Jackson, J., 2005. Concurrent Engineering: The Missing Ingredient in CHP
Market Development. Cogeneration and Onsite Power Production.
Maine Public Utility Commission, 2001. Assessment of Distributed
Generation Technology Applications.
Statistical Abstract of the United States, 2006. Dept. of the Treasury. Bureau
of Statistics, United States. Bureau of Foreign and Domestic Commerce,
United States. Bureau of the Census, US Census Bureau, 2006.
United Technologies, 2006. Web site description of PureComfort systems
/http://www.utcpower.com/fs/com/bin/fs_com_Page/0,9235,03200,00.
htmlS.
US Census Bureau, 2005. Annual Estimates of the Population for
Incorporated Places over 100,000, Ranked by July 1, 2005 Population:
April 1, 2000–July 1, 2005 (SUB-EST2005-01) /http://www.census.
gov/popest/cities/SUB-EST2005.htmlS.
US Department of Energy, 1992, 1995. Commercial Buildings Energy
Consumption Survey (CBECS).
US Department of Energy, 2000. The Market and Technical Potential for
Combined Heat and Power in the Commercial/Institutional Sector.
January 2000.
US Department of Energy, 2002. Integrated Energy Systems (IES) for
Buildings: A Market Assessment. Oak Ridge National Laboratory,
Ornl/Sub/409200.
US House of Representatives, 2006. A Failure of Initiative, Final Report
of the Select Bipartisan Committee to Investigate the Preparation for
and Response to Hurricane Katrina, US Government Printing Office.
Available at /http://www.gpoaccess.gove/congress/index.htmlS.