enstar annual report 2020
TRANSCRIPT

Enstar Annual Report 2020

1 Non-GAAP Operating Income attributable to Enstar ordinary shareholders is a non-GAAP financial measure that is calculated by the addition or subtraction of certain items from within our consolidated statements of earnings to or from net earnings (loss) attributable to Enstar ordinary shareholders, the most directly comparable GAAP financial measure. A complete reconciliation of our Non-GAAP operating income attributable to Enstar ordinary shareholders to net earnings (loss) attributable to Enstar ordinary shareholders is set forth on the financial calculations schedule on page vi. 2 During a period of loss, the basic weighted average ordinary shares outstanding is used in the denominator of the diluted loss per ordinary share computation as the effect of including potentially dilutive securities would be anti-dilutive. 3 Calculations setting forth the breakdown of these items are set forth on the financial calculations schedule on page vi.
2020 2019 2018Net Segment Contribution:
Non-life Run-off $ 1,866.1 1,059.8 25.2
Atrium 15.9 12.1 9.0
StarStone (81.5) (100.7) (158.6)
Other (81.2) (69.0) (38.0)
Net Earnings (Loss) Attributable to Enstar Ordinary Shareholders $ 1,719.3 902.2 (162.4)
Non-GAAP Operating Income Attributable to Enstar Ordinary Shareholders 1 $ 1,552.1 558.0 58.1
Fully Diluted Earnings (Loss) Per Ordinary Share 2 $ 78.80 41.43 (7.84)
Weighted Average Fully Diluted Ordinary Shares Outstanding 21,818,294 21,775,066 20,904,176
Ordinary Shareholders’ Equity Attributable to Enstar 3 $ 6,164.4 4,332.2 3,392.0
Return on Opening Ordinary Shareholders’ Equity Attributable to Enstar 39.7% 26.6% (5.2)%
Fully Diluted Book Value Per Ordinary Share 3 $ 281.20 197.93 155.94
Fully Diluted Ordinary Shares Outstanding 3 21,993,598 21,989,971 21,881,063
Percent Change in Fully Diluted Book Value Per Ordinary Share 42.1% 26.9% (2.0)%
FINANCIAL RESULTS (Expressed in millions of U.S. Dollars, except Share and Per Share Data)

i
Annual CEO letterFrom Dominic Silvester, Chief Executive Officer
Enstar had another impressive year, one characterised by profitable growth, new partnerships and high-quality investments. We delivered record-high net earnings as our book value per share reached a new peak.
However, 2020 was not without challenges - we remain in the midst of the biggest public health crisis for a century. A key concern throughout has been the health and welfare of everyone in the Enstar family, including our shareholders and business partners. I sincerely hope that you are well. In terms of operations, I extend my personal thanks to every employee across the globe for responding to the crisis with flexibility and resilience. These efforts carried us through the year and leave us ideally positioned in 2021 to continue our significant contribution to the legacy market.
2020 Financial Results
Enstar delivered another year of excellent results. We achieved record net earnings of $1.7 billion in 2020, or $78.80 per fully diluted ordinary share. Our fully diluted book value per share was up 42% to $281.20 from $197.93 at year-end 2019, a new high.
Our investment performance dominated our net earnings, with net realised and unrealised investment gains of $1.6 billion. We strive to achieve above-average investment returns whilst maintaining an asset-preservation strategy appropriate to the duration of the liabilities we have acquired. The success of our asset management strategies has led to well-capitalised companies positioned to take on new investment opportunities and continue to grow our balance sheet.
Strategic Developments
From early 2020, we have continuously assessed the impact and potential impact of COVID-19 under a number of stress scenarios, and Enstar performed well to date under this real-life stress test. We incurred net underwriting losses of $89 million, for which our share was $56 million, from active underwriting operations, primarily arising in StarStone’s international portfolios which are now in run-off. To date, we have not assumed third-party legacy portfolios containing COVID-19-related liabilities, although we have declined some. We expect the market for COVID-19-impacted risk portfolios to evolve during the year ahead, and present potentially attractive opportunities to Enstar.
With regard to active underwriting through StarStone and Atrium, we reduced our direct exposure, whilst retaining meaningful minority investment stakes alongside trusted equity partners:• We recapitalised StarStone U.S., through a sale to Core Specialty, a new entity of which
Enstar owns 25%. Core Specialty will benefit from its extensive distribution into the hardening specialty property & casualty insurance market under proven leadership with CEO Jeff Consolino and his executive team forging the way ahead.
• In addition, Enstar entered into a loss portfolio transfer with respect to StarStone U.S.’ legacy liabilities.
• Meanwhile we swapped the majority of Enstar’s shares in Atrium for Stone Point Capital funds’ ownership interests in Core Specialty, leaving Enstar with 13.8% of Atrium (previously 54%).
• StarStone International (which covers non-US) was placed into orderly run-off, and optimised its Lloyd’s platform, StarStone Underwriting Limited, through a sale to Inigo, a new specialty (re)insurance company led by founders and seasoned executives, Richard Watson, Russell Merrett and Stuart Bridges, in which we now own a minority interest.
All of this serves to diversify our remaining live underwriting holdings during an increasingly encouraging international market cycle, whilst retaining the economic interest in StarStone portfolios as a significant asset within our core run-off business.
Dear Fellow Shareholders,
$21.6bnAssets
$6.7bnTotal shareholders’ equity
$17.3bnTotal cash and investments
$33.2bnTotal assets acquired since inception
ii
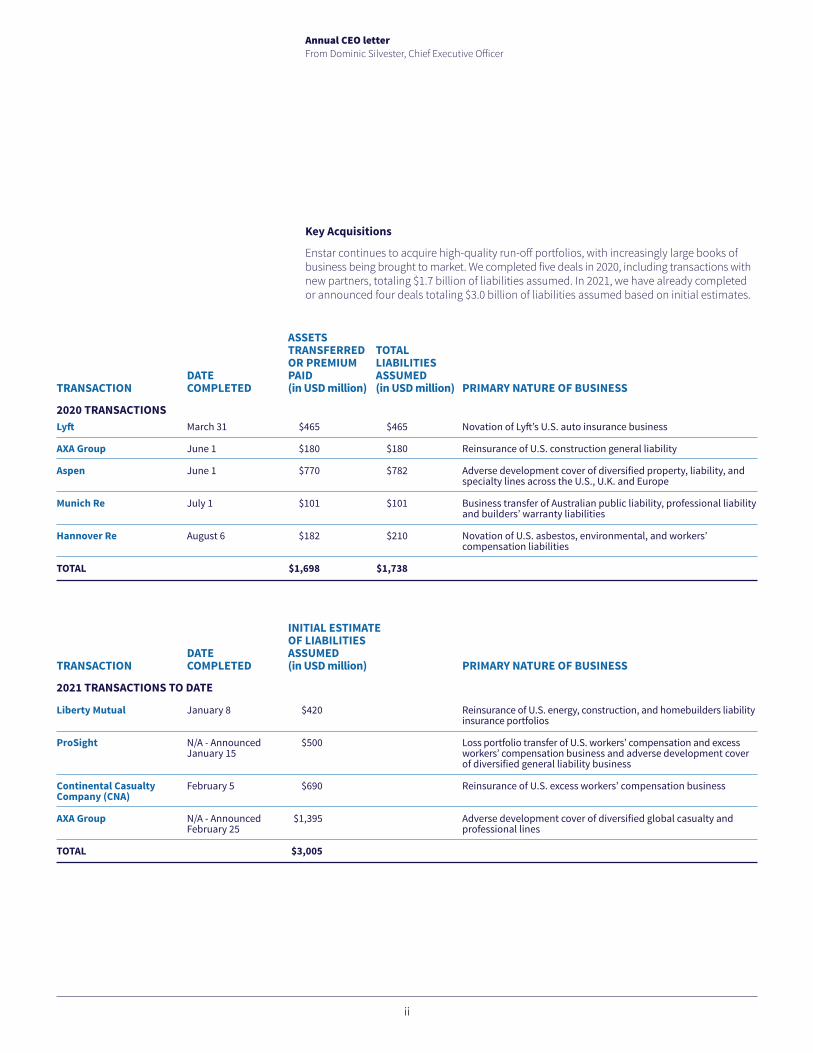
ASSETS TRANSFERRED TOTAL OR PREMIUM LIABILITIES DATE PAID ASSUMED TRANSACTION COMPLETED (in USD million) (in USD million) PRIMARY NATURE OF BUSINESS
2020 TRANSACTIONSLyft March 31 $465 $465 Novation of Lyft’s U.S. auto insurance business
AXA Group June 1 $180 $180 Reinsurance of U.S. construction general liability
Aspen June 1 $770 $782 Adverse development cover of diversified property, liability, and specialty lines across the U.S., U.K. and Europe
Munich Re July 1 $101 $101 Business transfer of Australian public liability, professional liability and builders’ warranty liabilities
Hannover Re August 6 $182 $210 Novation of U.S. asbestos, environmental, and workers’ compensation liabilities
TOTAL $1,698 $1,738
INITIAL ESTIMATE OF LIABILITIES DATE ASSUMED TRANSACTION COMPLETED (in USD million) PRIMARY NATURE OF BUSINESS
2021 TRANSACTIONS TO DATE
Liberty Mutual January 8 $420 Reinsurance of U.S. energy, construction, and homebuilders liability insurance portfolios
ProSight N/A - Announced $500 Loss portfolio transfer of U.S. workers’ compensation and excess January 15 workers’ compensation business and adverse development cover of diversified general liability business
Continental Casualty February 5 $690 Reinsurance of U.S. excess workers’ compensation business Company (CNA)
AXA Group N/A - Announced $1,395 Adverse development cover of diversified global casualty and February 25 professional lines
TOTAL $3,005
ii
Annual CEO letterFrom Dominic Silvester, Chief Executive Officer
Key Acquisitions
Enstar continues to acquire high-quality run-off portfolios, with increasingly large books of business being brought to market. We completed five deals in 2020, including transactions with new partners, totaling $1.7 billion of liabilities assumed. In 2021, we have already completed or announced four deals totaling $3.0 billion of liabilities assumed based on initial estimates.
iii
Annual CEO letterFrom Dominic Silvester, Chief Executive Officer
The Adverse Development Cover arrangements we entered with Aspen, AXA Group and ProSight are a point of focus. In securing these multi-layer solutions, our clients were able to meet their capital and risk management objectives through bespoke structures that draw on Enstar’s expertise in understanding diverse and complex portfolios. Together, these transactions equal $2.7 billion of ceded loss reserves and place Enstar as a first-choice partner for the growing number of primary insurers seeking this kind of large legacy solution.
Another stand-out transaction in 2020 was our completion of the first-ever U.S. insurance business transfer. By undergoing a rigorous statutory and judicial process, we successfully transferred direct liability for policies from one of our insurers to another via a single court order, improving our capital position and flexibility to create value. Our leadership role in this new route to capital relief for U.S. insurers signals Enstar’s expanding toolbox of solutions. We anticipate greater demand for such U.S. deals, which are common elsewhere in the world, as insurers, including captives, seek to free-up balance sheet capital, potentially unlocking billions in U.S. run-off opportunities.
Several new run-off players were launched in recent years, which is a sign of a healthy and expanding marketplace that brings more opportunities for companies who have proven they can be successful. Whilst their entry has increased competition, our highly disciplined underwriting approach, pricing and claims handling expertise differentiate our business. We have demonstrated our ability to agree large deals with new and existing partners around the world, and to achieve strong overall results.
The non-life run-off market remains robust, with a strong pipeline. Given our longevity in the legacy space, we have previously experienced upturns during times of market volatility or dislocation, such as the 2008/9 global financial crisis, and I remain optimistic about the continued flow of attractive non-life run-off opportunities in the years ahead.
Non-life Run-off
Enstar’s core Non-life Run-off business performed well again in 2020, contributing $1.9 billion to our consolidated results in 2020, up by $806 million from 2019. Run-off profitability relies both on the successful reduction of liabilities and on the effective growth through investment of remaining, offsetting assets. The improvement in part reflects increases in net realised and unrealised investment gains of $660 million, and increased earnings from equity investments of $182 million.
In 2020, Enstar paid $1.1 billion in claims to our Non-life Run-off policyholders, as we continue to meet obligations assumed from our partners. Enstar’s claims specialists constantly review each book of business and deploy a variety of settlement strategies to close claims and optimise each outcome. Our ability to manage claims effectively remains a critical pillar of the Enstar business model. A long and proven track record in the successful management of favourable claims outcomes allows Enstar to achieve reserve savings, and therefore to recycle capital to fuel future acquisitions and investments.
We achieved reserve / claims savings1 of $230 million in 2020, which includes a reduction in estimates of net ultimate losses on prior periods of $127 million, and $103 million for defendant asbestos and environmental liabilities. This metric shows the change in our ultimate claims outcomes and indicates the technical performance of our claims and reserving functions.
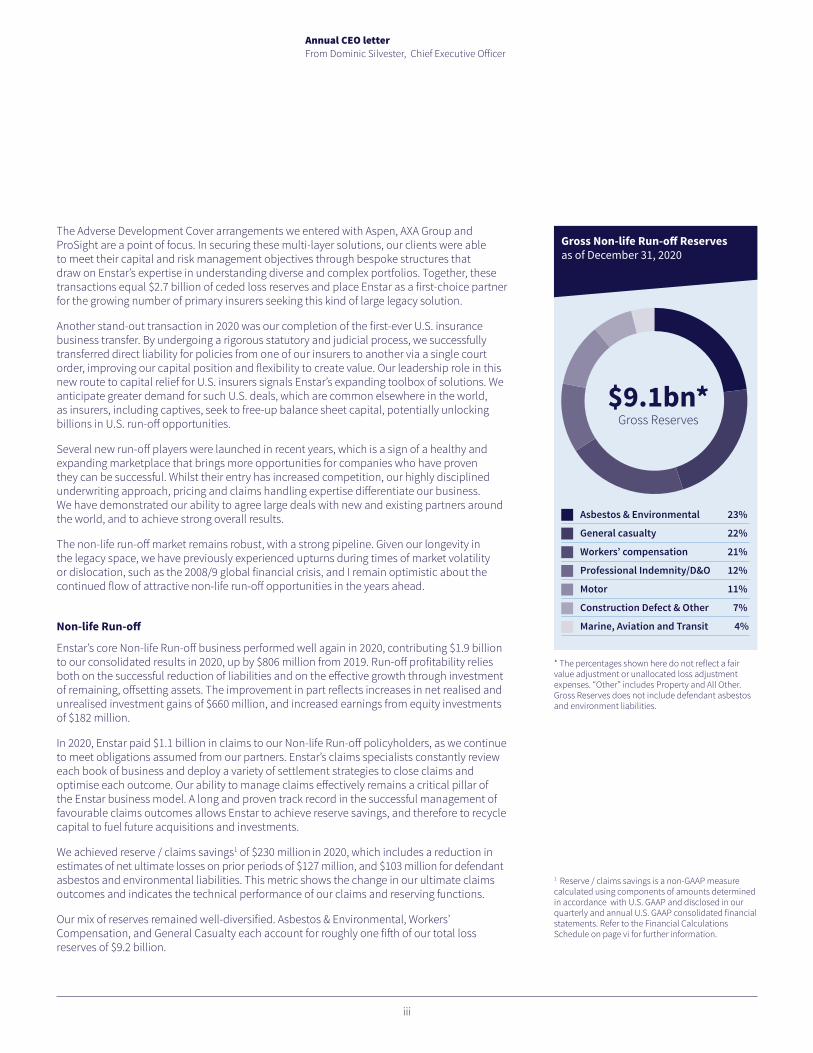
Our mix of reserves remained well-diversified. Asbestos & Environmental, Workers’ Compensation, and General Casualty each account for roughly one fifth of our total loss reserves of $9.2 billion.
1 Reserve / claims savings is a non-GAAP measure calculated using components of amounts determined in accordance with U.S. GAAP and disclosed in our quarterly and annual U.S. GAAP consolidated financial statements. Refer to the Financial Calculations Schedule on page vi for further information.
Asbestos & Environmental 23%
General casualty 22%
Workers’ compensation 21%
Professional Indemnity/D&O 12%
Motor 11%
Construction Defect & Other 7%
Marine, Aviation and Transit 4%
$9.1bn*Gross Reserves
Gross Non-life Run-off Reserves as of December 31, 2020
* The percentages shown here do not reflect a fair value adjustment or unallocated loss adjustment expenses. “Other” includes Property and All Other. Gross Reserves does not include defendant asbestos and environment liabilities.

iv
Annual CEO letterFrom Dominic Silvester, Chief Executive Officer
Investments
2020 was marked by significant volatility in global financial markets. The global economy grounded to a halt and stock markets plummeted in the first quarter, as businesses were forced to close, and consumers were placed under strict lockdowns to contain the spread of COVID-19. The year also demonstrated the resilience of people, institutions, and financial markets. Central banks around the globe brought interest rates to near zero, flooded financial markets with ample liquidity and backstopped risk assets.
The sharp drawdown and subsequent recovery experienced by the broader financial markets was also reflected in Enstar’s investment portfolio in 2020. We experienced significant unrealised losses during the first quarter, but our portfolio outperformed during the subsequent nine months relative to broader markets, to achieve a total investment return of 13% over the course of the year. Total investment return included in earnings for 2020 is $1.9 billion, including total net investment income of $303 million, realised gains of $179 million, and unrealised gains of $1.5 billion.
Fixed Income Investments This asset class, which includes government and corporate bonds with an A+ average credit rating, comprised 61.1% of Enstar’s investment portfolio at December 31, 2020, and delivered $575 million in income and realised and unrealised gains over the year, for a book yield of 2.53%. In the prevailing low interest rate environment, the share of fixed income securities in the portfolio dropped from 71.6% at year-end 2019 due to the appreciation of our alternatives portfolio. Given the low interest rate environment worldwide, attractive reinvestment yields in this class are challenging to achieve, prompting Enstar to make allocation changes that swap near-term liquidity for the greater yield available in certain less liquid asset classes such as private credit.
Hedge Fund Investments Enstar increased its allocation to hedge funds in 2020, to reach 17.3% of investments at year end. Our investment in the InRe Fund was valued at $2.4 billion as of December 31, 2020, which reflects unrealised gains of $1.2 billion during the year. These unrealised gains account for a considerable share of the overall net realised and unrealised gains on our investment portfolio for 2020.
Equities and Other Investments Our equity holdings remained roughly stable at 5% of the invested portfolio, as did our investments in equity and credit funds. Earnings from equity method investments were $239 million in 2020. Along with providing diversification, these assets, which include our equity investments in Enhanzed Re and Monument Re (and from 2021, Core Specialty), are expected to generate higher returns, and have a longer investment time-horizon than our fixed income portfolio.
A long and proven track record in the successful management of favourable claims outcomes allows Enstar to achieve reserve savings, and therefore to recycle capital to fuel future acquisitions and investments.

v
Annual CEO letterFrom Dominic Silvester, Chief Executive Officer
Capital Management
Enstar’s balance sheet ended 2020 in a strong position, with $21.7 billion in total assets and total shareholders’ equity of $6.7 billion at December 31, up from $4.9 billion at the end of 2019. Meanwhile, during 2020, we successfully executed a public offering of $350 million of fully guaranteed 5.75% fixed-rate reset junior subordinated notes due 2040. The proceeds have been used to repay a similar amount of outstanding borrowing under our term loan facility. The result of these transactions increased regulatory capital and diversified our capital base. We also undertook a share buyback program, repurchasing $26 million from shareholders.
Looking Ahead
As programs to inoculate against COVID-19 are rolled out across the globe, a return to business and life as usual is in our sights. The impact on Enstar has been relatively minimal so far, but the scope, duration and magnitude of any future effects are difficult to anticipate. I am confident that Enstar will continue to endure and thrive in a market increasingly eager to release capital through partnership with reliable, financially strong third-party run-off specialists.
As a result of the pandemic we moved seamlessly to working from home. Our flexible working and telecommuting policies pre-crisis put us in good stead and laid the groundwork for Enstar’s future operational model of agile working. In all of this, employee welfare and staying connected will be key to Enstar’s ongoing success. To that end, we have taken initiatives that prioritise mental and physical wellbeing, increase interaction and digital communication, and celebrate the differences among all our employees. These important measures help ensure that Enstar attracts and retains the wide range of talented people we need to accomplish our strategic ambitions.
As always, I remain grateful for the commitment of our staff around the world, our shareholders and our business partners. I thank you for your continued support and wish you and your families good health.
Sincerely,
Dominic SilvesterApril 26, 2021
I am confident that Enstar will continue to endure and thrive in a market increasingly eager to release capital through partnership with reliable, financial strong third-party run-off specialists.

vi
FINANCIAL CALCULATIONS SCHEDULE
2020 2019 2018
Net earnings (loss) attributable to Enstar ordinary shareholders $ 1,719,344 902,175 (162,354)
Adjustments:
Net realised and unrealised (gains) losses on fixed maturity investments and funds held - directly managed 1 (306,284) (515,628) 237,262
Change in fair value of insurance contracts for which we have elected the fair value option 119,046 117,181 6,664
Gain on sale of subsidiary (3,375) - -
Net earnings from discontinued operations (16,251) (7,375) (1,489)
Tax effects of adjustments 2 27,534 47,091 (15,364)
Adjustments attributable to noncontrolling interest 3 12,087 14,524 (6,665)
Non-GAAP operating income attributable to Enstar ordinary shareholders 4 $ 1,552,101 557,968 58,054
Non-GAAP Operating Income
Non-GAAP operating income (loss) attributable to Enstar ordinary shareholders is calculated by the addition or subtraction of certain items from within our consolidated statements of earnings to or from net earnings (loss) attributable to Enstar ordinary shareholders, the most directly comparable GAAP financial measure, as illustrated in the table below, for the years ending December 31, 2020, 2019 and 2018 in thousands of U.S. dollars.
Reserve / Claims Savings
Reserve / claims savings is calculated by adding (i) the reduction (increase) in estimates of net ultimate losses relating to prior periods, included in net incurred losses and LAE, and (ii) the reduction (increase) in estimates of ultimate net defendant asbestos and environmental (“Defendant A&E”) liabilities relating to prior periods, included in other income (expense). Because the reduction (increase) in estimates of ultimate Defendant A&E liabilities for prior periods is presented as a component of other income (expense) in our consolidated statement of earnings, there is not a U.S. GAAP measure that is directly comparable to reserve / claims savings presented on a non-GAAP basis. However, we believe reserve / claims savings provides investors with a meaningful measure of claims management performance within our Non-life Run-off segment that is consistent with management’s view of the business because it combines the reduction (increase) in estimates of net ultimate losses related to our direct exposure to certain acquired asbestos and environmental liabilities with the reduction (increase) in estimates of net ultimate losses related to liabilities that we have insured.
2020
Reduction in estimates of net ultimate losses - prior periods = (A) $ 127,116
Reduction in estimates of ultimate net defendant A&E liabilities - prior periods = (B) 103,166
Reserve / claims savings: total reduction in net ultimate losses = (A) + (B) $ 230,282
1 Represents the net realised and unrealised gains and losses related to fixed maturity securities recognised in net earnings (losses). Our fixed maturity securities are held directly on our balance sheet and also within the “Funds held - directly managed” balance. Refer to Note 6 - “Investments” in the notes to our consolidated financial statements included within Item 8 of our Annual Report on Form 10-K for the year ended December 31, 2020 for further details on our net realised and unrealised gains and losses. 2 Represents an aggregation of the tax expense or benefit associated with the specific country to which the pre-tax adjustment relates, calculated at the applicable jurisdictional tax rate. 3 Represents the impact of the adjustments on the net earnings (loss) attributable to noncontrolling interest associated with the specific subsidiaries to which the adjustments relate.4 Non-GAAP financial measure.

vii
Cautionary Statement
This letter contains certain forward-looking statements within the meaning of the Private Securities Litigation Reform Act of 1995. These statements include statements regarding the intent, belief or current expectations of Enstar and its management team. Investors are cautioned that any such forward-looking statements speak only as of the date they are made, are not guarantees of future performance and involve risks and uncertainties, and that actual results may differ materially from those projected in the forward-looking statements as a result of various factors. Important risk factors regarding Enstar can be found under the heading “Risk Factors” in our Annual Report on Form 10-K for the year ended December 31, 2020 and are incorporated herein by reference. Furthermore, Enstar undertakes no obligation to update any written or oral forward-looking statements or publicly announce any updates or revisions to any of the forward-looking statements contained herein, to reflect any change in its expectations with regard thereto or any change in events, conditions, circumstances or assumptions underlying such statements, except as required by law.
1 As of December 31, 2020 there were warrants outstanding to acquire 175,901 Series C Non-Voting Ordinary Shares for an exercise price of $115.00 per share, subject to certain adjustments (the “Warrants”). The Warrants were issued in April 2011 and were exercised in March 2021. The Warrant holder was entitled, at its election, to satisfy the exercise price of the Warrants on a cashless basis by surrender of shares otherwise issuable upon exercise of the Warrants in accordance with a formula set forth in the Warrants.2 Ordinary shares outstanding includes voting and non-voting shares but excludes ordinary shares held in the Enstar Group Limited Employee Benefit Trust (the “EB Trust”) in respect of awards made under our Joint Share Ownership Plan, a sub-plan to our Amended and Restated 2016 Equity Incentive Plan (the “JSOP”). 3 Share-based dilutive securities include restricted shares, restricted share units, and performance share units (“PSUs”). The amounts for PSUs, and for ordinary shares held in the EB Trust in respect of the JSOP, are adjusted at the end of each period end to reflect the latest estimated performance multipliers for the respective awards. The JSOP shares did not have a dilutive effect as of December 31, 2020.
The table below summarises the calculation of our fully diluted book value per ordinary share as of December 31, 2020, 2019 and 2018 in thousands of U.S. dollars, including the calculation of ordinary shareholders’ equity and fully diluted ordinary shares outstanding. 2020 2019 2018Numerator: Total Enstar shareholder’s equity $ 6,674,395 4,842,183 3,901,933 Less: Series D and E preferred shares 510,000 510,000 510,000 Total Enstar ordinary shareholders’ equity (A) 6,164,395 4,332,183 3,391,933 Proceeds from assumed conversion of warrants 1 20,229 20,229 20,229 Numerator for fully diluted book value per ordinary share calculations (B) $ 6,184,624 4,352,412 3,412,162
Denominator: Ordinary shares outstanding (C) 2 21,519,602 21,511,505 21,459,997 Effect of dilutive securities:
Share-based compensation plans 3 298,095 302,565 245,165Warrants 1 175,901 175,901 175,901
Fully diluted ordinary shares outstanding (D) 21,993,598 21,989,971 21,881,063
Book value per ordinary share:Basic book value per ordinary share = (A) / (C) $ 286.45 201.39 158.06
Fully diluted book value per ordinary share = (B) / (D) $ 281.20 197.93 155.94

UNITED STATES SECURITIES AND EXCHANGE COMMISSIONWashington, D.C. 20549
FORM 10-K ANNUAL REPORT PURSUANT TO SECTION 13 OR 15(d) OF THE SECURITIES EXCHANGE ACT OF 1934
For the fiscal year ended December 31, 2020 Commission File Number 001-33289
ENSTAR GROUP LIMITED(Exact name of Registrant as specified in its charter)
BERMUDA N/A(State or other jurisdiction of incorporation or organization) (I.R.S. Employer Identification No.)
Windsor Place, 3rd Floor, 22 Queen Street, Hamilton HM JX, Bermuda (Address of principal executive offices, including zip code)
Registrant’s telephone number, including area code: (441) 292-3645 Securities registered pursuant to Section 12(b) of the Act:
Title of Each Class Trading Symbol(s) Name of Each Exchange on Which RegisteredOrdinary shares, par value $1.00 per share ESGR The NASDAQ Stock Market LLCDepositary Shares, Each Representing a 1/1,000th Interest in a 7.00% ESGRP The NASDAQ Stock Market LLCFixed-to-Floating Rate Perpetual Non-Cumulative Preferred Share, Series D, Par Value $1.00 Per ShareDepositary Shares, Each Representing a 1/1,000th Interest in a 7.00% ESGRO The NASDAQ Stock Market LLCPerpetual Non-Cumulative Preferred Share, Series E, Par Value $1.00 Per Share
Securities registered pursuant to Section 12(g) of the Act: NoneIndicate by check mark if the registrant is a well-known seasoned issuer, as defined in Rule 405 of the Securities Act. Yes ☒ No ☐Indicate by check mark if the registrant is not required to file reports pursuant to Section 13 or Section 15(d) of the Act. Yes ☐ No ☒Indicate by check mark whether the registrant (1) has filed all reports required to be filed by Section 13 or 15(d) of the Securities
Exchange Act of 1934 during the preceding 12 months (or for such shorter period that the registrant was required to file such reports), and (2) has been subject to such filing requirements for the past 90 days. Yes ☒ No ☐
Indicate by check mark whether the registrant has submitted electronically every Interactive Data File required to be submitted pursuant to Rule 405 of Regulation S-T during the preceding 12 months (or for such shorter period that the registrant was required to submit such files). Yes ☒ No ☐
Indicate by check mark whether the registrant is a large accelerated filer, an accelerated filer, a non-accelerated filer, a smaller reporting company, or emerging growth company. See the definitions of “large accelerated filer,” “accelerated filer,” “smaller reporting company,” and "emerging growth company" in Rule 12b-2 of the Exchange Act.
Large accelerated filer
☒ Accelerated filer ☐ Non-accelerated filer ☐ Smaller reporting company
☐ Emerging growth company ☐
If an emerging growth company, indicate by check mark if the registrant has elected not to use the extended transition period for complying with any new or revised financial accounting standards provided pursuant to Section 13(a) of the Exchange Act. ☐
Indicate by check mark whether the registrant has filed a report on and attestation to its management’s assessment of the effectiveness of its internal control over financial reporting under Section 404(b) of the Sarbanes-Oxley Act (15 U.S.C. 7262(b)) by the registered public accounting firm that prepared or issued its audit report. ☒
Indicate by check mark whether the registrant is a shell company (as defined in Rule 12b-2 of the Act). Yes ☐ No ☒The aggregate market value of the registrant's voting and non-voting common equity held by non-affiliates as of June 30, 2020 was
$1.63 billion based on the closing price of $152.77 per ordinary share on the NASDAQ Stock Market on that date. Shares held by officers and directors of the registrant and their affiliated entities have been excluded from this computation. Such exclusion is not intended, nor shall it be deemed, to be an admission that such persons are affiliates of the registrant.
As of February 25, 2021, the registrant had outstanding 18,585,678 voting ordinary shares and 3,509,682 non-voting convertible ordinary shares, each par value $1.00 per share.
DOCUMENTS INCORPORATED BY REFERENCEPortions of the registrant’s definitive proxy statement to be filed with the Securities and Exchange Commission pursuant to
Regulation 14A relating to its 2021 annual general meeting of shareholders are incorporated by reference in Part III of this Form 10-K

Enstar Group LimitedAnnual Report on Form 10-K
For the Fiscal Year Ended December 31, 2020
Table of Contents
Page
PART I
Item 1. Business . . . . . . . . . . . . . . . . . . . . . . . . . . . . . . . . . . . . . . . . . . . . . . . . . . . . . . . . . . . . . . . . . 1Item 1A. Risk Factors . . . . . . . . . . . . . . . . . . . . . . . . . . . . . . . . . . . . . . . . . . . . . . . . . . . . . . . . . . . . . . . 21Item 1B. Unresolved Staff Comments . . . . . . . . . . . . . . . . . . . . . . . . . . . . . . . . . . . . . . . . . . . . . . . . . . 38Item 2. Properties . . . . . . . . . . . . . . . . . . . . . . . . . . . . . . . . . . . . . . . . . . . . . . . . . . . . . . . . . . . . . . . . . 38Item 3. Legal Proceedings . . . . . . . . . . . . . . . . . . . . . . . . . . . . . . . . . . . . . . . . . . . . . . . . . . . . . . . . . . 39Item 4. Mine Safety Disclosures . . . . . . . . . . . . . . . . . . . . . . . . . . . . . . . . . . . . . . . . . . . . . . . . . . . . . 39
PART II
Item 5. Market for the Registrant’s Common Equity, Related Stockholder Matters and Issuer Purchases of Equity Securities . . . . . . . . . . . . . . . . . . . . . . . . . . . . . . . . . . . . . . . . . . . . . . . .
40
Item 6. Selected Financial Data . . . . . . . . . . . . . . . . . . . . . . . . . . . . . . . . . . . . . . . . . . . . . . . . . . . . . . 41Item 7. Management’s Discussion and Analysis of Financial Condition and Results of Operations . . 42Item 7A. Quantitative and Qualitative Disclosures About Market Risk . . . . . . . . . . . . . . . . . . . . . . . . . . 92Item 8. Financial Statements and Supplementary Data . . . . . . . . . . . . . . . . . . . . . . . . . . . . . . . . . . . 96Item 9. Changes in and Disagreements with Accountants on Accounting and Financial Disclosure . 253Item 9A. Controls and Procedures . . . . . . . . . . . . . . . . . . . . . . . . . . . . . . . . . . . . . . . . . . . . . . . . . . . . . 253Item 9B. Other Information . . . . . . . . . . . . . . . . . . . . . . . . . . . . . . . . . . . . . . . . . . . . . . . . . . . . . . . . . . . 255
PART III
Item 10. Directors, Executive Officers and Corporate Governance . . . . . . . . . . . . . . . . . . . . . . . . . . . . 255Item 11. Executive Compensation . . . . . . . . . . . . . . . . . . . . . . . . . . . . . . . . . . . . . . . . . . . . . . . . . . . . . 255Item 12. Security Ownership of Certain Beneficial Owners and Management and Related
Stockholder Matters . . . . . . . . . . . . . . . . . . . . . . . . . . . . . . . . . . . . . . . . . . . . . . . . . . . . . . . . . 255Item 13. Certain Relationships and Related Transactions, and Director Independence . . . . . . . . . . . . 255Item 14. Principal Accounting Fees and Services . . . . . . . . . . . . . . . . . . . . . . . . . . . . . . . . . . . . . . . . . 255
PART IV
Item 15. Exhibits, Financial Statement Schedules . . . . . . . . . . . . . . . . . . . . . . . . . . . . . . . . . . . . . . . . . 255Item 16. Form 10-K Summary . . . . . . . . . . . . . . . . . . . . . . . . . . . . . . . . . . . . . . . . . . . . . . . . . . . . . . . . 255

CAUTIONARY STATEMENT REGARDING FORWARD-LOOKING STATEMENTS AND SUMMARY OF RISK FACTORS
This annual report and the documents incorporated by reference herein contain statements that constitute "forward-looking statements" within the meaning of Section 21E of the Securities Exchange Act of 1934, as amended, or the Exchange Act, with respect to our financial condition, results of operations, business strategies, operating efficiencies, competitive positions, growth opportunities, plans and objectives of our management, as well as the markets for our securities and the (re)insurance sectors in general. Statements that include words such as "estimate," "project," "plan," "intend," "expect," "anticipate," "believe," "would," "should," "could," "seek," "may" and similar statements of a future or forward-looking nature identify forward-looking statements for purposes of the federal securities laws or otherwise. All forward-looking statements are necessarily estimates or expectations, and not statements of historical fact, reflecting the best judgment of our management and involve a number of risks and uncertainties that could cause actual results to differ materially from those suggested by the forward-looking statements. These forward looking statements should, therefore, be considered in light of various important risk factors, including those set forth in this annual report and the documents incorporated by reference herein, which could cause actual results to differ materially from those suggested by the forward-looking statements. These risk factors include:
Risks Relating to our Run-off Business• changes in our plans, strategies, objectives, expectations or intentions, which may happen at any time at
management’s discretion;
• the adequacy of our loss reserves and the need to adjust such reserves as claims develop over time;
• risks relating to our acquisitions, including our ability to evaluate opportunities, successfully price acquisitions, address operational challenges, support our planned growth and assimilate acquired companies into our internal control system in order to maintain effective internal controls, provide reliable financial reports and prevent fraud;
• emerging claim and coverage issues and disputes that could impact reserve adequacy;• lengthy and unpredictable litigation affecting the assessment of losses and/or coverage issues;
• increased competitive pressures, including increased competition in the market for run-off business that aligns with our strategic objectives;
• risks relating to our ability to obtain regulatory approvals, including the timing, terms and conditions of any such approvals, and to satisfy other closing conditions in connection with our acquisition agreements, which could affect our ability to complete acquisitions;
• risks relating to our subsidiaries with liabilities arising from legacy manufacturing operations;
• the impact of the COVID-19 pandemic and the resulting disruption and economic turmoil, such as increased volatility in global financial markets, could adversely impact our investment returns, financial condition, and liquidity and capital resources, and any future impact on our business is difficult to predict at this time;
Risks Relating to Liquidity and Capital Resources • risks relating to the variability of statutory capital requirements and the risk that we may require additional
capital in the future, which may not be available or may be available only on unfavorable terms;
• the risk that our reinsurance subsidiaries may not be able to provide the required collateral to ceding companies pursuant to their reinsurance contracts, including through the use of letters of credit;
• changes and uncertainty in economic conditions, including interest rates, inflation, currency exchange rates, equity markets and credit conditions, which could affect our investment portfolio, our ability to finance future acquisitions and our profitability;
• risks relating to the availability and collectability of our reinsurance;
• the ability of our subsidiaries to distribute funds to us and the resulting impact on our liquidity;
• losses due to foreign currency exchange rate fluctuations;
• our ability to comply with covenants in our debt agreements;
Table of Contents
Risk Relating to our Investments• the risk that the value of our investment portfolios and the investment income that we receive from these
portfolios may decline materially as a result of market fluctuations and economic conditions, including those related to interest rates, credit spreads, and the phase out of the London Interbank Offered Rate ("LIBOR");
• risks relating to the performance of our investment portfolio and our ability to structure our investments in a manner that recognizes our liquidity needs;
• risks relating to our strategic investments in alternative asset classes, such as hedge funds, and joint ventures, which are illiquid and may be volatile;
Risks Relating to Laws and Regulations• risks relating to the complex regulatory environment in which we operate, including that ongoing or future
industry regulatory developments will disrupt our business, affect the ability of our subsidiaries to operate in the ordinary course or to make distributions to us, or mandate changes in industry practices in ways that increase our costs, decrease our revenues or require us to alter aspects of the way we do business;
Risks Relating to our Operations• loss of key personnel;
• operational risks, including cybersecurity events, external hazards, human failures or other difficulties with our information technology systems that could disrupt our business or result in the loss of critical and confidential information, increased costs;
Risks Relating to Taxation • tax, regulatory or legal restrictions or limitations applicable to us or the (re)insurance business generally;
• changes in tax laws or regulations applicable to us or our subsidiaries, or the risk that we or one of our non-U.S. subsidiaries become subject to significant, or significantly increased, income taxes in the United States or elsewhere;
Risks Relating to the Ownership of our Shares• risk relating to the ownership of our shares resulting from certain provisions of our bye-laws and our
status as a Bermuda company.
The risk factors listed above should be not construed as exhaustive and should be read in conjunction with the Risk Factors that are included in Item 1A below. We undertake no obligation to publicly update or review any forward-looking statement, whether to reflect any change in our expectations with regard thereto, or as a result of new information, future developments or otherwise, except as required by law.
Table of Contents

PART I
ITEM 1. BUSINESSCompany Overview
Enstar Group Limited ("Enstar") is a Bermuda-based holding company. We are a leading global insurance group that offers innovative capital release solutions through our network of group companies in Bermuda, the United States, the United Kingdom, Continental Europe, Australia, and other international locations. Enstar is listed on the NASDAQ Global Select Market under the ticker symbol "ESGR". In this report, the terms "Enstar," "the Company," "us," and "we" are used interchangeably to describe Enstar and our subsidiary companies.
Our core focus is acquiring and managing (re)insurance companies and portfolios of (re)insurance business in run-off. Since the formation of our Bermuda-based holding company in 2001, we have completed or announced over 100 acquisitions or portfolio transfers. The substantial majority of our acquisitions have been in the Non-life Run-off business, which generally includes property and casualty, workers’ compensation, asbestos and environmental, construction defect, marine, aviation and transit, and other closed and discontinued blocks of business.
Our primary corporate objective is growing our book value per share. We strive to achieve this primarily through growth in net earnings derived from both organic and accretive sources, such as the completion of new acquisitions, the generation of claims savings and investment income through the effective management of companies and portfolios in run-off, and returns on strategic investments.
As a result of the sale and recapitalization of StarStone US Holdings, Inc. and its subsidiaries ("StarStone U.S."), the sale of the majority of our interest in Atrium Underwriting Group Limited and its subsidiaries ("Atrium") and the placing of StarStone's business outside the United States into run-off, we have largely exited our previously controlled active underwriting platforms. While we maintain strategic minority interests in these businesses, our primary focus is on our core business of acquiring and managing (re)insurance companies or portfolios of (re)insurance business in run-off.
For further information on strategic developments, refer to Note 5 - "Divestitures, Held-for-Sale Businesses and Discontinued Operations" in the notes to our consolidated financial statements included within Item 8 of this Annual Report on Form 10-K.
Business StrategyEnstar aims to maximize growth in book value per share by employing the following strategies:
We Leverage Management’s Experience and Industry Relationships to Solidify Enstar’s Position in the Run-Off Market. Enstar leverages the extensive experience and relationships of our senior management team to solidify our position as a leading run-off acquirer and generate future growth opportunities.
We Engage in Highly Disciplined Acquisition Practices. Enstar is highly selective and disciplined when assessing potential acquisition targets, carefully analyzing risk exposures, claims practices and reserve requirements as part of a detailed due diligence process. We believe this decreases risk and increases the probability that we can deliver positive operating results from the companies and portfolios acquired.
We Prudently Manage Investments and Capital. In managing investments and deploying group capital, Enstar strives to achieve superior risk-adjusted returns, while growing profitability and generating long-term growth in shareholder value.
We Manage Claims Professionally, Expeditiously, and Cost-Effectively. Enstar aims to generate reserve/claims savings by managing claims in a professional and disciplined manner, drawing on in-house expertise to dispose of claims efficiently. We strive to pay valid claims on a timely basis, while relying on well-documented policy terms and exclusions where applicable, and litigation when necessary, to defend against paying invalid claims.
We Manage Assumed Liabilities and (Re)insurance Assets Cost Effectively. Using detailed claims analysis and actuarial projections, Enstar seeks to negotiate with policyholders and reinsurers with a goal of settling existing (re)insurance liabilities and monetizing (re)insurance assets in a cost efficient manner.
Table of Contents
1

Strategic GrowthEnstar transactions typically take the form of either acquisitions or portfolio transfers. In an acquisition, we
acquire a (re)insurance company and manage the run-off. In a portfolio transfer, a reinsurance contract transfers risk from the initial (re)insurance company to a company in the Enstar group. Enstar also enters into reinsurance to close ("RITC") transactions with Lloyd's of London ("Lloyd's") (re)insurance syndicates in run-off, whereby a portfolio of run-off liabilities is transferred from one Lloyd’s syndicate to another.
On October 15, 2020, we completed an insurance business transfer (“IBT”) in the U.S., having received judicial approval from the Oklahoma County District Court. An IBT is similar to the Part VII transfer process in the U.K. where the insurance liability is novated from one insurance party to another, providing legal finality to the party transferring the liability. The transaction occurred between two of our subsidiaries and, although common in many parts of the world, it was the first of its kind to occur in the U.S. The IBT mechanism provides another option as to how we might structure U.S. transactions in the future.
For further information on recent acquisitions and significant new business, please refer to Note 3 - "Business Acquisitions" and Note 4 - "Significant New Business" in the notes to our consolidated financial statements included within Item 8 of this Annual Report on Form 10-K.
Operating SegmentsWe have historically had three reportable segments of business that were each managed, operated and
separately reported: (i) Non-life Run-off; (ii) Atrium; and (iii) StarStone. Our other activities, which do not qualify as a reportable segment, include our corporate expenses, debt servicing costs, preferred share dividends, holding company income and expenses, foreign exchange and other miscellaneous items.
As discussed above, the strategic transactions related to our Atrium and StarStone segments will enable us to focus on our core Non-life Run-off business. We will review and assess our segment structure in 2021 to reflect the changes to the StarStone and Atrium segments that occurred in the fourth quarter of 2020 and the first quarter of 2021, respectively.
For additional information and financial data relating to our segments, see "Item 7. Management’s Discussion and Analysis of Financial Condition and Results of Operations - Results of Operations by Segment," "Item 7. Management’s Discussion and Analysis of Financial Condition and Results of Operations - Investments," Note 5 - "Divestitures, Held-for-Sale Businesses and Discontinued Operations" and Note 24 - "Segment Information" in the notes to our consolidated financial statements included within Item 8 of this Annual Report on Form 10-K.
Non-life Run-offOur Non-life Run-off segment comprises the operations of our subsidiaries that are running off their property
and casualty and other non-life lines of business.
In the primary (or direct) insurance business, the insurer assumes risk of loss from persons or organizations that are directly subject to the given risks. In the reinsurance business, the reinsurer agrees to indemnify an insurance or reinsurance company, referred to as the ceding company, against all or a portion of the insurance risks arising under the policies the ceding company has written or reinsured. When an insurer or reinsurer stops writing new insurance business, either entirely or with respect to a particular line of business, the insurer, reinsurer, or the line of discontinued business is in run-off.
Participants in the insurance industry often have portfolios of business that become inconsistent with their core competency, provide excessive exposure to a particular risk or segment of the market and/or absorb capital that the company may wish to deploy elsewhere. These non-core and/or discontinued portfolios are often associated with potentially large exposures and lengthy time periods before resolution of the last remaining insured claims, resulting in significant uncertainty to the insurer or reinsurer covering those risks. These factors can distract management, drive up the cost of capital and surplus for the (re)insurer and negatively impact the (re)insurer’s rating, which makes the disposal of the unwanted company or reinsurance of the portfolio an attractive option to free-up capital and reduce further downside risk. The (re)insurer may engage with a third party that specializes in run-off management, such as Enstar, to purchase the company or assume the portfolio in run-off via reinsurance or a novation of the insurance liabilities.
In the sale of a company in run-off, a purchaser, such as Enstar, may pay a discount to the book value of the company based on the risks assumed and the relative value to the seller of no longer having to manage the company in run-off. Such a transaction can be beneficial to the seller because it receives an up-front payment for the company, eliminates the need for its management to devote any attention to the disposed company, reduces the expense in managing the company and removes the risk that the established reserves related to the run-off business may prove to be inadequate. The seller is also able to redeploy its management and financial resources to
Table of Contents
2

its core businesses.
In some situations, a (re)insurer may wish to divest itself of a portfolio of non-core legacy business that may have been underwritten alongside other ongoing core business that the (re)insurer does not want to dispose of. In such instances, we are able to provide economic finality for the (re)insurer by providing a loss portfolio reinsurance contract to protect the (re)insurer against deterioration of the non-core portfolio of loss reserves. In the Lloyd's market, we provide similar solutions through RITCs as described above.
Overall, the focus of our Non-life Run-off segment is to acquire companies or portfolios in run-off and to effectively manage that business in ways that further our primary corporate objective of growing Enstar's book value per share.
Acquisition Process
We evaluate each acquisition and loss portfolio transfer opportunity presented by carefully reviewing and analyzing the portfolio’s risk exposures, claim practices, reserve requirements and outstanding claims. Based on this initial analysis, we can determine if a company or portfolio of business would add value to our current portfolio of run-off businesses. If we decide to pursue the purchase of a company in run-off, we then proceed to price the acquisition in a manner we believe will result in positive operating results based on certain assumptions including, without limitation, our ability to favorably resolve claims, negotiate with direct insureds and reinsurers, manage the investments associated with the portfolio and otherwise manage the nature of the risks posed by the business.
At the time we acquire a company in run-off, we estimate the fair value of assets and liabilities acquired based on actuarial advice and our views of the exposures assumed. We primarily earn our total return on an acquisition from disciplined claims management and/or commuting the liabilities that we have assumed, maximizing reinsurance recoveries on the assumed portfolio of business and investment returns from the acquired investment portfolios.
Run-off Management
We consider claims management to be a core competency. Following the acquisition of a company or portfolio of business in run-off, we strive to conduct the run-off in a disciplined and professional manner to efficiently discharge the liabilities associated with the business while preserving and maximizing its assets. Our approach to managing our companies and portfolios of business in run-off includes, where possible, negotiating with third-party (re)insureds to commute their (re)insurance agreement (sometimes called policy buy-backs for direct insurance) for an agreed upon up-front payment by us and to more efficiently manage payment of (re)insurance claims. We attempt to commute policies with direct insureds or reinsureds to eliminate uncertainty over the amount of future claims. Commutations and policy buy-backs provide an opportunity for the company to exit exposures to certain policies and insureds generally at a discount to the ultimate liability and provide the ability to eliminate exposure to further losses. Commutations can also reduce the duration, administrative burden and ultimately the future cost of the run-off.
In certain lines of business, such as direct workers’ compensation insurance, commutations and policy buy-back opportunities are not typically available, and our strategy with respect to these businesses is to derive value through efficient and effective management of claims.
Integral to our success is our ability to analyze, administer, and settle claims while managing related expenses, such as loss adjustment expenses ("LAE"). We have implemented claims handling guidelines along with claims reporting and control procedures in all of our claims units. All claims matters are reviewed regularly, with all material claims matters being circulated to and authorized by management prior to any action being taken. Our claims management processes also include leveraging our extensive relationships and developed protocols to more efficiently manage outside counsel and other third parties to reduce expenses. With respect to certain lines of business, we have agreements with third-party administrators to manage and pay claims on our subsidiaries’ behalf and advise with respect to case reserves. These agreements generally set forth the duties of the third-party administrators, limits of authority, indemnification language designed for our protection and various procedures relating to compliance with laws and regulations. These arrangements are also subject to review by our relevant claims departments, and we actively monitor and manage these administrators on an ongoing basis.
We provide consultancy services to third parties in the (re)insurance industry primarily through our subsidiaries, the Cranmore companies, Enstar Limited, Enstar (US), Inc., Enstar EU, Paladin Managed Care Services, Inc. ("Paladin") and Kinsale Brokers Limited. In addition to third-party engagements, our consultancy companies also perform these services in-house for our Enstar companies, using their expertise to assist in managing our run-off portfolios and performing certain due diligence matters relating to acquired businesses. The services range from full-service incentive-based or fixed fee run-off management to bespoke solutions such as
Table of Contents
3

claims inspection, claims validation, reinsurance asset collection and IT consulting services. Paladin provides medical bill review, utilization review, physician case management and related services in the workers’ compensation area.
Following the acquisition of a company or the assumption of a portfolio of business through a reinsurance transaction, we analyze the acquired exposures and reinsurance receivables on a policyholder-by-policyholder basis to identify (re)insurance policies that may be beneficial to us if commuted and commence commutation discussions with the counterparty. In addition, policyholders and reinsurers often approach us requesting a commutation solution. We then carry out a full analysis of the underlying exposures in order to determine the attractiveness of a proposed commutation. From the initial analysis of the underlying exposures, it may take several months, or even years, before a commutation is completed. In certain cases, if we and the policyholder or reinsurer are unable to reach a commercially acceptable settlement, the commutation may not be achievable, in which case we will continue to settle valid claims from the policyholder, or collect reinsurance receivables from the reinsurer, as they arise or become due.
Certain (re)insureds are often willing to commute with us, subject to receiving an acceptable settlement, as this provides certainty of recovery of what otherwise may be claims that are disputed in the future, and often provides a meaningful up-front cash receipt that, with the associated investment income, can provide funds to meet future claim payments or even commutation of their underlying exposure. Therefore, subject to negotiating an acceptable settlement, many of our (re)insurance liabilities and reinsurance receivables can be either commuted or settled by way of a policy buy-back over time. Properly priced commutations may reduce the expense of adjusting direct claims and pursuing collection of reinsurance, realize savings, remove the potential future volatility of claims and reduce required regulatory capital.
We manage cash flow with regard to reinsurance recoverables by working with reinsurers, brokers and professional advisors to achieve fair and prompt payment of reinsured claims, and we take appropriate legal action to secure receivables when necessary. We also attempt where appropriate to negotiate favorable commutations with our reinsurers by securing a lump sum settlement from reinsurers in complete satisfaction of the reinsurer’s past, present and future liability in respect of such claims.
As a result of the number of transactions we have completed over the years, our organizational structure consists of licensed entities across many jurisdictions. In managing our group, we continue to look for opportunities to simplify our legal structure by way of company amalgamations and mergers, reinsurance, or other transactions to improve capital efficiency and decrease ongoing compliance and operational costs over time. In addition, we seek to pool risk in areas where we maintain the expertise to manage such risk to achieve operational efficiencies, which allows us to most efficiently manage our assets to achieve capital diversification benefits.
AtriumOur Atrium segment is comprised of the active underwriting operations and financial results of Northshore
Holdings Limited ("Northshore"), a holding company that owns Atrium and Arden Reinsurance Company Ltd. ("Arden"). Enstar acquired Arden and Atrium on September 9, 2013 and November 25, 2013, respectively, in partnership with Trident V, L.P., Trident V Parallel Fund, L.P. and Trident V Professionals Fund, L.P. (collectively, the "Trident V Funds") managed by Stone Point Capital LLC ("Stone Point"). Dowling Capital Partners I, L.P. and Capital City Partners LLC (collectively, the "Dowling Funds") also have minority investments in Northshore.
Atrium is a managing general agent at Lloyd's, which manages Syndicate 609. Through our Lloyd's corporate member, SGL No. 1 Limited ("SGL No. 1"), we provide 25% of the syndicate’s underwriting capacity and capital (with the balance provided by traditional Lloyd’s Names).
Arden is a Bermuda-based reinsurance company that primarily provides reinsurance to Atrium, which has been eliminated upon consolidation, and is currently in the process of running off certain other discontinued business. Results related to Arden’s discontinued business are included within our Non-life Run-off segment.
Strategic Development
On January 1, 2021, we completed a transaction (the "Exchange Transaction") in which we exchanged the majority of our indirect interest in Northshore for all of Trident V Funds' indirect interest in Core Specialty Insurance Holdings, Inc. ("Core Specialty"). Following completion of the Exchange Transaction, we now own 13.8% of Northshore. As a result, Northshore will be deconsolidated and our investment will be accounted for as a privately held equity investment and carried at fair value beginning in the first quarter of 2021. For further information, refer to Note 5 - "Divestitures, Held-for-Sale Businesses and Discontinued Operations" in the notes to our consolidated financial statements included within Item 8 of this Annual Report on Form 10-K.
Table of Contents
4

Business Lines
Syndicate 609 provides (re)insurance on a worldwide basis including in the United States, Europe, the Far East and Australasia. Atrium specializes in a wide range of industry classes, including marine, aviation and transit, property and casualty binding authorities, reinsurance, accident and health and non-marine direct and facultative covers. Lloyd’s business is often underwritten on a subscription basis across the insurance market. Atrium is the lead underwriter in 43% of the business it underwrites.
Lloyd’s is a surplus lines insurer and an accredited reinsurer in all U.S. states and territories, and a licensed (or admitted) insurer in Illinois, Kentucky and the U.S. Virgin Islands.
Distribution
All of the business in the Atrium segment is placed through (re)insurance brokers, and a key distribution channel for Syndicate 609 is the managing general agent binding authorities. Atrium seeks to develop relationships with (re)insurance brokers, (re)insurance companies, large global corporations and financial intermediaries to develop and underwrite business. Independent broker Marsh Inc. accounted for 11% of Atrium’s gross premiums written in 2020. Other brokers (each individually less than 10%) accounted for the remaining 89% of gross premiums written.
Atrium’s proprietary online platform, AUGold, provides end-to-end processing, quote and policy production for managing general agents across a range of classes of business. The platform provides agents with efficient and cost effective access to Lloyd’s binding authorities and is designed to enable Atrium to compete more effectively with North American excess and surplus lines carriers.
Managing Agency Services
Atrium receives a managing agency fee of 0.7% of Syndicate 609 capacity and a 20% profit commission based on the net earnings of Syndicate 609, pursuant to its management contract. Atrium also receives management fees and profit commission from the management of underwriting consortiums. These fees and profit commission are included within fees and commission income in our consolidated statement of earnings.
Claims Management
Claims in respect of business written by Syndicate 609 are primarily notified by various central market bureaus. Where a syndicate is a "leading" syndicate on a Lloyd’s policy, its underwriters and claims adjusters work directly with the broker or insured on behalf of itself and the "following market" for any particular claim. This may involve appointing attorneys or loss adjusters. The claims bureaus and the leading syndicate advise movement in loss reserves to all syndicates participating on the risk. If necessary, Atrium's claims department may adjust the case reserves it records from those advised by the bureaus.
Reinsurance Ceded
On an annual basis Atrium purchases a tailored outwards reinsurance program designed to manage its risk profile. The majority of Atrium’s third-party reinsurance cover is with Lloyd’s Syndicates or other highly rated reinsurers.
StarStoneOur StarStone segment includes the results of StarStone Insurance Bermuda Limited and its subsidiaries
("StarStone") and StarStone Specialty Holdings Limited ("StarStone Group"), a holding company that owns StarStone. Our StarStone segment also includes intra-group reinsurance cessions which are eliminated on consolidation.
We acquired StarStone (formerly known as Torus) on April 1, 2014 in partnership with Trident V Funds managed by Stone Point. The Dowling Funds also have a minority investment. During 2020, we completed a strategic review of the StarStone segment. Following this review, we have taken various actions to position ourselves for improved profitability going forward, as further described below.
Strategic Developments
On June 10, 2020, we announced that we placed StarStone's non-U.S. operations ("StarStone International") into an orderly run-off (the "StarStone International Run-Off").
Recent developments relating to StarStone International include:
• On October 2, 2020, StarStone International sold the renewal rights for its financial lines portfolio;
• On October 14, 2020, we completed the sale of Vander Haeghen & Co. SA ("VdH"), a Belgium-based insurance agency majority owned by StarStone International entities;
Table of Contents
5

• On November 17, 2020, we announced an agreement to sell StarStone Underwriting Limited ("SUL"), a Lloyd's managing agency, together with the right to operate Lloyd's Syndicate 1301, to Inigo Limited ("Inigo") in exchange for consideration in the form of Inigo shares. Upon closing, we expect to own 5.4% of Inigo, which includes an additional investment from us. As a result, our investment in Inigo will be accounted for as a privately held equity investment and carried at fair value. In conjunction with the transaction, Enstar, the Trident V Funds and the Dowling Funds will retain the economics of Syndicate 1301’s 2020 and prior years’ underwriting portfolios as this business runs off; and
• On February 11, 2021, we entered into an agreement to sell Arena N.V., a Belgium-based specialist accident and health managing general agent.
We continue to evaluate strategic options for StarStone's European platform.
On November 30, 2020, we completed the sale and recapitalization of StarStone U.S. through the sale of StarStone U.S. to Core Specialty, a newly formed entity with equity backing from funds managed by SkyKnight Capital, L.P., Dragoneer Investment Group and Aquiline Capital Partners LLC. We received consideration of $282.0 million inclusive of $235.0 million of common shares of Core Specialty and cash of $47.0 million. The $235.0 million of common shares of Core Specialty represents a 25.23% interest in Core Specialty on a fully diluted basis. Our investment in Core Specialty is accounted for as an equity method investment and we record our proportionate share of the net earnings on a one quarter lag.
For further information, refer to Note 5 - "Divestitures, Held-for-Sale Businesses and Discontinued Operations" in the notes to our consolidated financial statements included within Item 8 of this Annual Report on Form 10-K.
Business Lines
Previously, StarStone offered a broad range of property, casualty and specialty insurance products, including marine, aerospace, and workers' compensation, to both large multi-national and small and middle-market clients around the world.
Distribution
Business in the StarStone segment was generally placed through (re)insurance brokers and managing general agents. Independent brokers Marsh Inc. and Ryan Specialty Group accounted for 15% and 12%, respectively, of StarStone’s gross premiums written for the year ended December 31, 2020. Other brokers and managing general agents (each individually less than 8%) accounted for the remaining 73% of gross premiums written. StarStone International is no longer writing new business, however a de-minimis amount of premium is still subject to mandatory renewal or adjustments.
Claims Management
Claims in respect of business written by Syndicate 1301, as well as in respect of StarStone’s other London market business, are primarily notified by various central market bureaus whereby the leading syndicate or company advise all participants of movement in loss reserves. StarStone’s claims department adjusts bureau claims in respect of coverages where StarStone is the lead underwriter and may choose to adjust the case reserves it records from those advised by the bureaus.
Claims in respect of non-bureau business are handled by StarStone’s experienced claims professionals. StarStone uses claims handling guidelines along with a global claims management system to review, report and administer claims. With respect to certain lines of business, StarStone may use third-party administrators to manage and pay claims on its behalf and advise with respect to case reserves. StarStone also utilizes Enstar’s experience in claims management.
Reinsurance Ceded
StarStone purchases an annual tailored outwards reinsurance program designed to manage its risk profile. The majority of StarStone’s third party reinsurance cover is with highly rated reinsurers or is collateralized.
Table of Contents
6

Liability for Losses and Loss Adjustment Expenses The liability for losses and LAE, also referred to as loss reserves, represents our gross estimates before
reinsurance for unpaid reported losses and losses that have been incurred but not reported ("IBNR") for our Non-life Run-off, Atrium (classified as held-for-sale as of December 31, 2020) and StarStone segments using a variety of actuarial methods. We recognize an asset for the portion of the liability that we expect to recover from reinsurers. LAE reserves include allocated loss adjustment expenses ("ALAE") and unallocated loss adjustment expenses ("ULAE"). ALAE are linked to the settlement of an individual claim or loss, whereas ULAE are based on our estimates of future costs to administer the claims. IBNR represents reserves for loss and LAE that have been incurred but not yet reported to us. This includes amounts for unreported claims, development on known claims and reopened claims.
We establish reserves for individual claims incurred and reported, as well as IBNR claims. We use considerable judgment in estimating losses for reported claims on an individual claim basis based upon our knowledge of the circumstances surrounding the claim, coverage limits and coverage eligibility, the severity of the injury or damage, the jurisdiction of the occurrence, the potential for ultimate exposure, the type of loss, and our experience with the line of business and policy provisions relating to the particular type of claim. We also use considerable judgment to establish reserves for IBNR claims using a variety of generally accepted actuarial methodologies and procedures to estimate the ultimate cost of settling IBNR claims.
The estimation of unpaid claim liabilities at any given point in time is subject to a high degree of uncertainty. Consequently, our subsequent estimates of ultimate losses and LAE, and our liability for losses and LAE, may deviate materially from our initial ultimate loss estimates.
For further information regarding: i) the liability for net losses and LAE, including loss development tables and a reconciliation of activity, refer to Note 10 - "Losses and Loss Adjustment Expenses" in the notes to our consolidated financial statements included within Item 8 of this Annual Report on Form 10-K; ii) net incurred losses and LAE, refer to "Item 7. Management’s Discussion and Analysis of Financial Condition and Results of Operations - Results of Operations by Segment"; and iii) our loss reserving process, refer to "Item 7. Management’s Discussion and Analysis of Financial Condition and Results of Operations - Critical Accounting Estimates - Losses and Loss Adjustment Expenses."
Table of Contents
7

10 Year Acquisition Loss Development for our Non-life Run-off segment The table below sets forth a summary of acquired and assumed net reserves and the resulting development for the 10 most recent acquisition years for our
Non-life Run-off segment:
Total Net Incurred Losses and LAE
Acquisition Year
Acquired and
Assumed Net
ReservesNet Paid Losses
Net (Favorable)
Adverse Loss
Development
Net Losses recognized
on Acquired Unearned Premium
Amortization of Deferred
Charge Assets and
Deferred Gain
Liabilities
Change in provisions
for bad debt
Change in provisions for ULAE
Amortization of Fair Value Adjustments
Change in Fair Value -
FVO
Total Net Incurred
losses and LAE
Retro-cession of reserves Other
Effect of Exchange
Rate Movement
Closing Net Reserves
(in thousands of U.S. dollars)2011 712,867 (94,399) (316,736) — — (31,096) (55,044) (18,934) — (421,810) (90,104) — (2,278) 104,276
2012 422,476 (243,922) (86,337) — — (242) (8,607) (9,132) — (104,318) (3,990) 208 (24,541) 45,913
2013 657,982 (512,039) (115,486) 110,285 — (127) (7,415) (29,912) — (42,655) (28,391) — (3,983) 70,914
2014 465,395 (366,282) (19,621) 62,404 — 1,752 4,367 (45,449) — 3,453 — 40 (3,815) 98,791
2015 1,491,256 (832,807) (487,395) 53,493 229,372 56 (81,033) 17,592 — (267,915) (50,466) — (11,019) 329,049
2016 1,350,463 (556,799) (13,683) — 4,838 (542) (7,937) — — (17,324) — 44 12,744 789,128
2017 1,504,561 (435,997) (181,889) — — 125 (42,043) (1) 178,851 (44,957) — — 84,102 1,107,709
2018 2,873,675 (1,312,235) (201,460) 69,328 10,857 — (66,175) 53,025 80,700 (53,725) — — (16,082) 1,491,633
2019 1,586,993 (406,140) (62,018) 82,572 49,272 — (13,441) — (88) 56,297 (47,018) 166 17,794 1,208,092
2020 2,186,024 (253,931) 66,835 1,729 1,657 — (5,201) — 13,684 78,704 (17,968) — 8,533 2,001,362
$ 13,251,692 $ (5,014,551) $ (1,417,790) $ 379,811 $ 295,996 $ (30,074) $ (282,529) $ (32,811) $ 273,147 $ (814,250) $ (237,937) $ 458 $ 61,455 $ 7,246,867 2010 and prior 341,933
Total Net Non-life Run-off Liability for Losses and LAE $ 7,588,800
The above table presents our Non-life Run-off segment's assumed and acquired net loss reserves in the year they were assumed or acquired, including the impact of any fair value adjustments arising from business combination transactions or our election of the fair value option, deferred charge assets and gain liabilities and unallocated LAE. The table relates to policyholder obligations and therefore excludes defendant asbestos and environmental liabilities, which are non-insurance liabilities, and as such are recorded and presented separately on our consolidated balance sheets. The table presents the cumulative roll forward of our acquired and assumed net loss reserves from the year of acquisition to December 31, 2020. As such, each acquisition year reflects a different time period and therefore impacts the comparability between acquisition years. Our net loss development, favorable or adverse, will occur over time as we execute on our disciplined claims management strategies through continual detailed review of all open and new claims, investigating opportunities to settle claims, effectively managing legal and claims handling expenses, commuting liabilities and maximizing reinsurance recoveries. In addition, we seek to maximize the investment returns on the investment portfolio supporting the assumed net loss reserves.
During 2020, we experienced adverse development on an assumed loss portfolio transfer transaction within the motor line of business due to higher than expected severity. For further information refer to "Item 7. Management's Discussion and Analysis of Financial Condition and Results of Operations - Results of Operations by Segment - Non-life Run-off Segment."
Table of Contents
8

InvestmentsOur key investment objectives are as follows:
• To follow an investment strategy designed to emphasize the security and growth of our invested assets that also meet our credit quality and diversification objectives.
• To provide sufficient liquidity for the prompt payment of claims and contract liabilities.
• To seek superior risk-adjusted returns, by allocating a portion of our portfolio to non-investment grade securities, including alternative investment classes, in accordance with our investment guidelines.
• To consider the duration characteristics of our liabilities in determining the extent to which we correlate with assets of comparable duration depending on our other investment strategies and to the extent practicable.
• To allocate a portion of our investment portfolio to strategic investments, including minority interests in live underwriting companies, that provide diversification to our overall investment portfolio.
We generally seek to maintain investment portfolios that are shorter or of equivalent duration to liabilities in order to provide liquidity for the settlement of losses and, where possible, to avoid having to liquidate longer-dated investments. In the Non-life Run-off segment, the settlements of liabilities also have the potential to accelerate the natural payout of losses, which requires liquidity.
Our fixed maturity securities include U.S. government and agency investments, highly rated sovereign and supranational investments, high-grade corporate investments, and mortgage-backed and asset-backed investments. We allocate a portion of our investment portfolio to other investments, including hedge funds, private equity funds, fixed income funds, equity funds, CLO equities, CLO equity funds, real estate debt fund and private credit funds. We utilize and pay fees to various companies to provide investment advisory and/or management services. These fees are predominantly based upon the amount of assets under management and in some instances are performance-based. Fees are either expensed as a reduction to investment income or have the effect of reducing the net asset value of the managed assets.
Our investment performance is subject to a variety of risks, including risks related to general economic conditions, market volatility, interest rate fluctuations, foreign exchange risk, inflation risk, liquidity risk and credit and default risk. Interest rates are highly sensitive to many factors, including governmental monetary policies, domestic and international economic and political conditions and other factors beyond our control. An increase in interest rates could result in significant losses, realized or unrealized, in the value of our investment portfolio. A portion of our non-investment grade securities consists of alternative investments that subject us to restrictions on redemption, which may limit our ability to withdraw funds for some period of time after the initial investment. The values of, and returns on, such investments may also be more volatile. For more information on these risks, refer to "Item 1A. Risk Factors - Risks Relating to Our Investments" and "Item 7A. Quantitative and Qualitative Disclosures About Market Risk."
Our allocation to other investments and equity method investments collectively constituted 29.4% of our investable assets as of December 31, 2020 (2019: 20.2%). The increase was primarily attributable to significant unrealized gains in our hedge fund managed by AnglePoint Asset Management Ltd. and other alternative investments, as well as additional deployment of capital to these strategies. We believe our other investments and equity method investments provide diversification in our overall investment portfolio since they are generally not correlated with our fixed income investments and provide an opportunity for improved risk-adjusted rates of return. The returns of our hedge fund investments may be volatile, and we may experience significant unrealized gains or losses in a particular quarter or year.
For information regarding our investment portfolio and results, refer to "Item 7. Management’s Discussion and Analysis of Financial Condition and Results of Operations - Investable Assets" and Note 21 “Related Party Transactions” in the notes to our consolidated financial statements included within Item 8 of this Annual Report on Form 10-K.
Table of Contents
9

CompetitionOur Non-life Run-off segment competes in the global insurance market with domestic and international
reinsurance companies to acquire and manage (re)insurance companies in run-off and portfolios of (re)insurance business in run-off. The acquisition and management of companies and portfolios in run-off is highly competitive, and driven by a number of factors, including proposed acquisition price, reputation, and financial resources including new capital and alternative forms of capital entering the markets. Some of these competitors may have greater financial resources or lower operational costs than we do, may have been operating for longer than we have and may have established long-term and continuing business relationships throughout the (re)insurance industries, which can be a significant competitive advantage. As a result, we may not be able to compete successfully in the future for suitable acquisition candidates or run-off portfolio management engagements. The Non-life Run-off space has seen a number of new entrants to the market over the recent years which has increased competition in the overall market.
Human Capital ResourcesAs of December 31, 2020, we had 1,189 employees, as compared to 1,444 as of December 31, 2019. The
reduction was driven by the sale of StarStone U.S., which closed in the fourth quarter of 2020. Upon closing of the Atrium Exchange Transaction on January 1, 2021, we had 1,008 employees.
We seek to attract, retain and motivate a specialized workforce that supports our culture, target operating model and business performance. We do this by making use of a range of hiring channels and approaches and through a total reward offering that includes market competitive salaries, an annual bonus plan tied to both business results and individual performance as well as comprehensive benefits to protect employee health, wellness and financial security. We also promote alignment of interests with investors through the use of an employee share purchase plan and long-term equity-based incentives. In addition, we encourage our employees to periodically review development areas with their managers to identify appropriate learning opportunities to better equip our workforce with the skills necessary for near- and long-term success. We offer an array of professional development programs and initiatives to support our employees' career aspirations and enhance our leadership and management capabilities—creating a pipeline of talent able to deliver on our long-term strategic objectives and developing a skilled workforce with succession capabilities. To measure our progress, we use a variety of human capital measures in managing our business, including workforce demographics and diversity metrics, attrition and retention metrics, and hiring metrics.
We are committed to fostering a culture that treats all employees fairly and with respect, promotes inclusivity and diversity, and provides equal opportunities for professional development and merit-based advancement. To formalize these values, we have adopted a Board Diversity Policy and Group Diversity and Inclusion Policy. As of December 31, 2020, women comprised 45% of our global headcount. In addition, as of December 31, 2020, 35% of our workforce was located in the United States, of whom 34% self-identified as being part of an ethnic and/or racial minority group.1 We intend to continue conducting all human capital management activities, including recruitment, career development and advancement, role design and compensation in a manner reflective of our commitment to diversity and inclusion.
During the COVID-19 pandemic, we have focused on the safety of our employees, and in response to the pandemic, we transitioned primarily to a remote working environment to minimize the risk to our staff. Throughout the pandemic, we have sought to provide employees with the tools and technology to enable them to effectively perform their respective job functions. In addition, we have also launched various initiatives designed to mitigate the challenges of working remotely.
Enterprise Risk Management Effective risk oversight is an important priority for our management and our Boards of Directors (both at the
Company level and at a subsidiary level), and we place strong emphasis on ensuring we have a comprehensive risk management framework to identify, measure, manage, monitor and report on risks that affect the achievement of our strategic, operational and financial objectives.
An effective enterprise risk management ("ERM") framework contributes to the strength of our overall group (the "Group"). The value of having effective risk management can positively impact many areas of the business such as setting and achieving business strategy and objectives, capital management decision making, efficiency and effectiveness in operations and processes, financial performance and reliable financial reporting, regulatory
Table of Contents
10
1 Global racial and ethnic diversity information is not available due to limitations on our ability to maintain such details about our employees in in certain jurisdictions in which we operate.

compliance, good reputation with key stakeholders and business continuity planning. Our objective is to integrate risk management through our ERM function into all aspects of our business.
Risk Management StrategyOur risk management strategy is to:
• engage in highly disciplined acquisition, management and (re)insurance practices across a diverse portfolio of loss reserves;
• seek investment risk where it is adequately rewarded;
• maintain reserving risk at low to moderate levels; and
• maintain capital, liquidity, credit, operational and regulatory risks at low levels.
These strategies are pursued through the use of appropriate controls, analytics including scenario testing, governance structures and highly skilled teams effectively working together.
We embed our risk strategy in our organization by promoting a culture of high risk awareness. This is achieved in the demonstration of our day-to-day approach in how we manage our business and in how we manage and assess challenges and opportunities.
Risk AppetiteThe primary objective of our risk appetite framework is to monitor and protect the Group from an
unacceptable level of loss, compliance failures and adverse reputational impact. It considers material risks in the business relating to: strategy, capital adequacy, insurance, investment/market, reinsurance counterparty/credit, regulatory, tax and operational risk. Risk appetite and tolerance is set by our Board and reviewed annually. It represents the amount of risk that we are willing to accept as a Group compared to risk metrics based on our shareholders' equity, capital resources, potential financial loss, and other risk-specific measures.
Accountability for the implementation, monitoring and oversight of risk appetite is assigned to individual corporate executives and monitored and maintained by the Risk Management function. Risk tolerance levels are monitored and deviations from pre-established levels are reported in order to facilitate responsive action.
Our subsidiary companies’ risk appetite frameworks are aligned with the risk appetite framework of the Group, while local company appetite and tolerances are set by the local boards. A review is undertaken annually to confirm the subsidiary risk appetite does not in the aggregate exceed the Group risk appetite.
Risk metrics levels are set and monitored regularly by an appointed owner for respective areas of the business and reported to management committees and to our Board and Risk Committee on at least a quarterly basis. Stress and scenario tests are key tools within our risk appetite framework, used as risk indicators across risk categories and to support a forward looking assessment of risk. As part of monitoring and aggregating risk exposures across the Group, capital impact assessments are performed for risks that are deemed material.
Risk Governance and Risk Management OrganizationOur ERM framework consists of numerous processes and controls that have been designed by management,
with oversight by the Board of Directors and its committees, and implemented by employees across the organization. The purpose of our ERM framework is to appropriately assess and manage risk as we continue to take opportunities to meet our business objectives. Senior executives are ultimately accountable for key defined risks and are responsible for providing regular reporting to the Group Executive Team (our "executives"), Management Risk Committee ("MRC"), Board Risk Committee and Board; and to facilitate the same to subsidiary committees and boards to support decision making and strong risk governance. The collective boards, management and employees are responsible for the effective implementation and/or operation of processes and controls.
Board of DirectorsOur Board and its committees (and subsidiary boards of directors) receive management information from our
executives, Board committees and management committees relating to performance against strategy and regularly review information regarding, among other things, acquisitions, loss reserves, credit, liquidity and investments, operations and information security and the risks associated with each.
Our Risk Committee has responsibility to assist the Board in overseeing the integrity and effectiveness of the Company’s ERM framework, including by reviewing and evaluating the risks to which the Company is exposed, as well as monitoring and overseeing the guidelines and policies that govern the processes by which the Company identifies, assesses and manages its exposure to risk. Our Audit Committee, comprised entirely of independent directors, oversees our accounting and financial reporting-related risks and internal control environment, receiving
Table of Contents
11
regular reports via the annual internal and external audit process. Our Investment Committee is responsible for overseeing the Company’s investment portfolio and investment-related risk, determining the Group’s investment strategy and guidelines and approving investment transactions in accordance with these guidelines. Our Compensation Committee oversees compensation-related risks. On an annual basis, the Compensation Committee undertakes a risk assessment of our compensation programs to ensure they do not provide incentives for our employees to take inappropriate or excessive risks. Our Nominating and Governance Committee considers risk relating to management succession planning and other corporate governance matters.
Executive and Risk Management OrganizationIn addition to the director oversight provided by our Risk Committee, our ERM governance structure is
supported by our MRC comprising executives and members of senior management who are responsible for the management of key risks and representatives from assurance functions. At the operating subsidiary level, risks relating to our individual (re)insurance subsidiaries are also overseen by the subsidiary boards of directors, subsidiary risk committees and other committees, and management teams, consistent with applicable regulatory requirements and our ERM framework.
The MRC is chaired by the Chief Operating Officer and meets regularly. The MRC discusses, challenges and debates the risks in the business and those emerging and where required recommends changes to the course of activity in reacting to these risks. The MRC also provides oversight and governance of ERM matters for the Group, monitoring risk assumption and risk mitigation activities and their consistency with the Risk Appetite Framework while promoting and sponsoring risk culture and awareness throughout the Group.
Risk Ownership, Accountability and AssuranceWe have adopted the "three lines of defense" model. Our first line consists of our executives and members of
senior management and their function as leaders and risk owners. They are responsible for executing the risk management strategy and appropriately managing the activities and conduct of the business functions, as well as promoting staff understanding of the business strategy, risk mitigating policies and procedures and overall governance framework.
Our second line comprises our various risk, control and compliance oversight functions. Our Risk Management function reports to our executives, the MRC and our Risk Committee and focuses primarily on implementing and overseeing the administration of the MRC and Risk Committee directives and facilitating an efficient, effective and consistent approach to risk management across the Group. Our management assurance is further complemented by our compliance function which seeks to mitigate legal and regulatory compliance risks and provides a framework such that appropriate, effective and responsive compliance services are available to the business units across the Group. Other second line functions include certain activities of our actuarial function and other Group functions contributing to our management assurance.
Our third line of defense comprises our internal audit function which independently reviews the effectiveness of our ERM framework. The results of audits are monitored and assessed by the Audit Committee. Independent assurance from external third parties (e.g., independent actuarial services, etc.) also sits within our third line of defense.
Entity Level ManagementAt the operating subsidiary level, risks relating to our individual (re)insurance subsidiaries are also overseen
by the subsidiary boards of directors, subsidiary risk committees and other committees, and management teams, consistent with applicable regulatory requirements and our overall ERM framework that is embedded at local levels and throughout the business.
The Group and each regulated insurance entity have a risk register documenting its risk landscape, with risk, key risk metric, and designated control owners, which is maintained through a risk management software system. Specific functions, such as IT, maintain risk registers with greater detail and increased specificity of risks and controls as needed to govern such function's particular risk profile. The risk and control assessment process is carried out on a quarterly basis using a risk management software system.
Risk CategoriesWe manage our ERM process based on the major categories of risk within our business discussed below. Our
ERM is a dynamic process, with updates continually being made as a result of changes in our business, industry, investment strategy and the economic environment. This process and our controls cannot provide absolute assurance that our risk management objectives will be met or that all risks will be appropriately identified and managed, and accordingly, the possibility of material adverse effects on our company remains. See "Item 1A. Risk Factors" for important information on the risks we face.
Table of Contents
12

Strategic Risk. Strategic risk is the risk of unintended adverse impact on the business plan objectives arising from business decisions, improper implementation of those decisions, inability to adapt to changes in the external environment, or circumstances that are beyond our control. We manage strategic risk by utilizing a strategic business planning process involving our executives and Board. Our annual business plan is reviewed and overseen by our executives and Board, and actual performance, trends, and uncertainties are monitored in comparison to the plan throughout the year. We specifically evaluate acquisition opportunities pursuant to a detailed and proprietary process that takes into account, among other things, the risk of the transaction and potential returns, the portfolio’s risk exposures, claims management practices, reserve requirements and outstanding claims and potential collateral requirements, as well as risks specifically related to our ability to integrate the acquired business and the impact it may have on our risk appetite framework and related tolerances. Our governance process, led by our Board of Directors and including management's Peer Review Committee and process and the Risk Management function, reviews newly proposed transaction opportunities, capital matters, and other significant business initiatives. In order to effectively participate in future opportunities and manage downside risks (due to external events) we review and monitor our liquidity and available financing. We rely on our processes to help us to anticipate potential adverse changes and, where possible, avoid or mitigate them.
Capital Adequacy Risk. Capital adequacy risk is the risk that capital levels are or become insufficient to ensure our insurance obligations will be met and policyholders are protected. We have a low appetite for capital adequacy risk. As well as meeting our regulatory and rating agency obligations, the ability to effectively participate in future opportunities is dependent upon the Group and its subsidiaries continually meeting (and/or exceeding) solvency requirements. We endeavor to manage our capital such that all of our regulated entities meet local regulatory capital requirements at all times and maintain adequate capital to enable our insurance obligations to be met while taking into account the risks faced. We aim to deploy capital efficiently and to establish adequate loss reserves that we believe will protect against future adverse developments. Capital adequacy and the need for our capital to continuously support the business under adverse circumstances is assessed via stress and scenario testing. Specific scenarios are mandated under the various regulatory regimes in which the Group and its subsidiaries operate. User-defined scenarios have also been developed and are regularly tested and reported on.
Investment/Market Risk. Investment / Market risk is the risk of loss resulting from under-performing investment returns, dilution of investment capital, or adverse financial market movements (such as interest rates or exchange rates). Investment / Market risk can be broken down into the following sub-risks which may threaten our ability to effectively manage the investment portfolio: interest rate risk, credit spread risk, public equity risk, alternative investment risk, inflation risk and concentration risk. We manage Investment / Market risk in a number of ways, including through our investment policy; regular reviews of investment opportunities; market conditions; portfolio duration; concentration limitations; oversight of the selection and performance of external asset managers; regular stress testing of the portfolio against known and hypothetical scenarios; and established risk tolerance levels. Any changes to our established investment policy or risk tolerance levels are approved by our board of directors. In addition, we manage foreign currency exposure through management of asset/liability matching and use of derivatives. Investments are primarily managed by our Investment function, which is overseen by the Investment Committee of our board of directors.
Insurance Risk. Insurance risk spans many aspects of our insurance operations, including underwriting risk, risk assumed upon acquisitions/portfolio transfers and risk associated with our reserving assumptions.
Acquisition Risk. We manage acquisition risks through our acquisition evaluation process and our reserving practices discussed above in "Liability for Losses and Loss Adjustment Expenses." Acquisition pricing risk can arise from a potential loss in value following an acquisition due to an underestimation of liabilities, a failure to generate assumed future cash flows that supported the pricing analysis (due to an underperformance of investments and/or underestimation of expenses) or an unexpected increase in capital requirements necessary to support the transaction due to unanticipated regulatory changes. We rely on due diligence to strategically select risks, and assume only select portfolios when our due diligence supports our negotiated pricing and meet our result targets. In aggregate, we have a high risk appetite to continue to execute transactions, with no express restrictions on the size, geography or lines of business that we will review and consider. However, we have a low aggregate risk appetite for transactions that could ultimately have a negative impact on book value per share.
Table of Contents
13

Reserving Risk. Reserving risk is the risk that a Company's reserves are not sufficient to cover its unpaid loss and loss adjustment expense costs. The estimation of reserves is subject to uncertainty because the ultimate cost of settling claims is dependent upon future events and loss development trends that can vary with the impact of economic, social, and legal and regulatory matters. We manage reserving risk through our reserving practices, our commutation and policy buy-back strategy, and our claims management practices. We also have local and group Reserving Committees that are responsible for managing reserving risk and making recommendations to our Chief Financial Officer on the appropriate level of reserves to include in our consolidated financial statements. For additional information relating to our loss reserving processes and our loss reserves by segment, see "Item 7. Management’s Discussion and Analysis of Financial Condition and Results of Operations - Critical Accounting Estimates."
Liquidity Risk. Liquidity risk is the risk that we are unable to realize investments and other assets in order to settle financial obligations when they fall due or that we would have to incur excessive cost to do so. We manage this risk generally by following an investment strategy designed to emphasize the preservation of our invested assets and provide sufficient liquidity for the prompt payment of claims and contract liabilities, as well as for settlement of commutation payments. Liquidity risk also includes the risk of our dependence of our future cash flows upon the availability of dividends or other statutorily permissible payments from our subsidiaries, which is limited by applicable laws and regulations. Due to our acquisitive strategy, liquidity risk at the Group level also includes immediate cash needs as a result of the purchase of (re)insurance portfolios and/or capital injections into a new or existing subsidiary to support associated solvency requirements as a direct result of merger and acquisition activity or other significant changes. We manage this risk through our capital management and planning processes, which include reviews of minimum capital resources requirements at our regulated subsidiaries and anticipated distributions, regular stress testing of our subsidiaries' solvency and collateral requirements against known and hypothetical scenarios; as well as anticipated capital needs. We also seek to maintain the ability to draw on our Group revolving credit facility or access the capital markets to meet liquidity needs, as appropriate.
Credit / Counterparty Risk. Credit risk relates to the uncertainty of a counterparty’s ability to make timely payments in accordance with contractual terms of the instrument or contract. We are exposed to direct credit risk primarily within our portfolios of fixed maturity and short-term investments, and through customers, brokers and reinsurers in the form of premiums receivable and reinsurance recoverables. In addition, we are exposed to credit risk through our funds withheld arrangements if the reinsured company is unable to honor the value of the funds held balances, such as in the event of insolvency. We manage credit risk with respect to our reinsurance recoverables by ongoing monitoring of counterparty ratings and working to achieve prompt payment of reinsured claims, as well as through our commutation strategy. For funds withheld arrangements, we generally have the contractual ability to offset any shortfall in the payment of the funds held balances with amounts owed by us to the reinsured for losses payable and other amounts contractually due. Where reinsurance is placed to mitigate any remaining active exposures in select portfolios, we firstly mitigate credit risk through our reinsurance purchasing process, where reinsurers are subject to financial security and rating requirements prior to approval and by limiting exposure to individual reinsurers. Thereafter we manage credit risk by the regular monitoring of reinsurance recoveries and premium due directly or via brokers and other intermediaries. In our fixed maturity and short-term investment portfolios, we attempt to mitigate credit risk through diversification and issuer exposure limitation.
Operational Risk. Operational risk is the risk of a loss arising from inadequate or failed internal processes, or from external events, personnel, systems or third parties. Due to our acquisitive strategy, operational risk also includes risks and challenges associated with integrating new companies or portfolios into the Group. We seek to mitigate operational risks through the application of our policies and procedures and internal control and compliance processes throughout the Group and a focus on acquisition integration and assimilation of new companies into our internal control systems, including but not limited to operational incident management, business continuity planning, information security procedures, financial reporting controls and a review process for material third-party vendor usage.
Table of Contents
14
Cyber and Information Security Risk. Cyber and information security risk is the risk that our IT infrastructure could be breached, resulting in a loss of confidential information, damage to our reputation, financial liability and/or a disruption to business operations, including an inability to access the underlying data. Cybersecurity threats extend from individual attempts to gain unauthorized access to our information technology systems to coordinated, elaborate, targeted or opportunistic attempts via a third party supplier's compromised IT environment. We have in place, and seek to continuously improve, a comprehensive system of security controls that are implemented by dedicated staff. Control activities are designed to prevent, detect and mitigate such threats. Such control activities include independent and in-house vulnerability assessments, access controls, data encryption, continuous monitoring of our information technology networks and systems, desktop testing of our cyber response plan, regular security risk education awareness and training sessions for all staff including on-going phishing testing, maintenance of backup and protective systems and embedding IT security assessments into the third party due diligence and oversight program.
Regulatory Risk. Regulatory risk is the risk of legal or regulatory sanctions resulting in a financial loss, or loss of reputation as a result of an insurer’s failure to comply with laws, regulations, rules, related self-regulatory organization standards, and codes of conduct. We manage regulatory risk through a focus on compliance with laws and regulations, adherence to our policies and procedures (including our Code of Conduct) and our internal controls, an established corporate governance framework and practices, and communication and engagement with external stakeholders.
Tax Risk. Tax risk is the risk that tax requirements are not adhered to accurately or in a timely manner resulting in a financial loss. We proactively seek to identify, evaluate, manage, monitor and mitigate tax risks. We are committed to complying with all tax laws, rules and regulations applicable to the Group. In evaluating potential transactions we consider the overall commercial, financial and tax aspects. Where there is uncertainty or complexity in relation to a tax risk, we may seek external advice and, where appropriate, we may obtain tax clearances from relevant tax authorities.
Emerging RisksAs part of our ERM Framework, we maintain a Framework for the Management of Emerging Risk, which sets
out the minimum standards by which emerging risks are identified, analyzed, evaluated, treated and reported on. Pursuant to this framework, the MRC and our Board Risk Committee continually monitor emerging risks and oversee changes to our ERM Framework to react to these risks, where appropriate. Emerging risks are defined as risks which may develop or which already exist but are difficult to quantify. They are marked by a high degree of uncertainty, and may or may not fall within the categories outlined above under "Risk Categories." While emerging risks are not fully understood or explicitly considered within the day-to-day operation of our business due to the lack of quantifiable data, we expect that the potential impacts of these risks may crystallize over time and therefore merit additional analysis, monitoring, evaluation and, when appropriate, management of the emerging risk. Recent examples of emerging risks that we review and consider include:
• Risks relating to the recalculation and/or transition from LIBOR to alternative benchmark rates;
• Risks relating to developing tax frameworks such as the OECD Pillar II Blueprint framework;
• Risks relating to our claims management activities, including social inflation, increased litigation funding, latent injury claims (e.g. Talcum powder, Glyphosate, Opioids) and laws that impose absolute liability for certain types of claims;
• Risks relating to climate change, including as a result of our investments, to transition risk (which arises from our efforts to mitigate the physical risks posed by climate change, for example by increasing our internal business investment to support transition to a low carbon economy or by incurring higher costs when using carbon intensive products); and
• Risks arising from the ongoing uncertainty in markets and other matters related to the COVID-19 global pandemics.
Table of Contents
15

RegulationGeneral
The business of (re)insurance is regulated in most countries, although the degree and type of regulation varies significantly from one jurisdiction to another. Our material operations are in Bermuda, the United Kingdom, the United States, Australia and several Continental European countries. We are subject to extensive regulation under the applicable statutes in these countries and any others in which we operate. In addition, the Bermuda Monetary Authority ("BMA") acts as group supervisor of our (re)insurance companies (our "Group"). A summary of the material regulations governing us in these countries is set forth below.
We may become subject in the future to regulation in new jurisdictions or additional regulations in existing jurisdictions depending on the location and nature of any companies acquired and the volume and location of business being transacted by our existing companies.
Bermuda Group Supervision
The BMA’s group supervision objective is to provide a coordinated approach to the regulation of an insurance group and its supervisory and capital requirements. Bermuda has been recognized by the U.S. National Association of Insurance Commissioners ("NAIC") as a qualified jurisdiction, and the E.U. recognizes Bermuda's full equivalence under Solvency II.
We are group supervised by the BMA. As our Group supervisor, the BMA performs a number of functions including: (i) coordinating the gathering and dissemination of information for other regulatory authorities; (ii) carrying out a supervisory review and assessment of our Group; (iii) carrying out an assessment of our Group's compliance with the rules on solvency, risk concentration, intra-group transactions and appropriate governance procedures; (iv) planning and coordinating, through regular meetings with other authorities, supervisory activities in respect of our Group; (v) coordinating any enforcement action that may need to be taken against our Group or any Group members; and (vi) coordinating meetings of colleges of supervisors in order to facilitate the carrying out of these functions. Cavello Bay Reinsurance Limited ("Cavello") serves as our Group’s Designated Insurer. As Designated Insurer, Cavello is required to facilitate compliance by our Group with the insurance solvency and supervision rules.
On an annual basis, the Group is required to file Group statutory financial statements, a Group statutory financial return, a Group capital and solvency return, audited Group financial statements, a Group Solvency Self-Assessment ("GSSA"), and a financial condition report with the BMA. The GSSA is designed to document our perspective on the capital resources necessary to achieve our business strategies and remain solvent, and to provide the BMA with insights on our risk management, governance procedures and documentation related to this process. In addition, the Group is required to file a quarterly financial return with the BMA.
We are required to maintain available Group statutory capital and surplus in an amount that is at least equal to the group enhanced capital requirement ("Group ECR"). The BMA has also established a group target capital level equal to 120% of the Group ECR.
The BMA also maintains supervision over the controllers of all Bermuda registered insurers, and accordingly, any person who, directly or indirectly, becomes a holder of at least 10%, 20%, 33% or 50% of our ordinary shares must notify the BMA in writing within 45 days of becoming such a holder (or ceasing to be such a holder). The BMA may object to such a person and require the holder to reduce its holding of ordinary shares and direct, among other things, that voting rights attaching to the ordinary shares shall not be exercisable.
Operating Subsidiaries
The Insurance Act 1978 of Bermuda and related regulations, as amended (together, the "Insurance Act"), regulate the (re)insurance business of our operating subsidiaries in Bermuda. The Insurance Act imposes certain solvency and liquidity standards and auditing and reporting requirements and grants the BMA powers to supervise, investigate, require information and the production of documents and intervene in the affairs of insurance companies.
Significant requirements pertaining to our regulated Bermuda subsidiaries vary depending on the class in which our company is registered, but generally include the appointment of a principal representative in Bermuda, the appointment of an independent auditor, the appointment of an approved loss reserve specialist, the filing of annual statutory and GAAP financial statements, the filing of annual statutory financial returns, the filing of quarterly financial returns, compliance with group solvency and supervision rules, and compliance with the Insurance Code of Conduct (relating to corporate governance, risk management and internal controls).
Table of Contents
16

Our regulated Bermuda subsidiaries must also comply with a minimum liquidity ratio and minimum solvency margin. The minimum liquidity ratio requires that the value of relevant assets must not be less than 75% of the amount of relevant liabilities. The minimum solvency margin, which varies depending on the class of the insurer, is determined as a percentage of either net reserves for losses and LAE or premiums. Each of our regulated Bermuda-domiciled insurers is also subject to an enhanced capital requirement ("ECR") determined pursuant to a risk-based capital measure and are required to file a Commercial Insurer’s Solvency Self-Assessment (“CISSA”), and a financial condition report with the BMA. As of December 31, 2020, each of our Bermuda-based (re)insurance subsidiaries exceeded their respective minimum solvency and liquidity requirements.
Each of our regulated Bermuda subsidiaries would be prohibited from declaring or paying any dividends if it were in breach of its minimum solvency margin or liquidity ratio or if the declaration or payment of such dividends would cause it to fail to meet such margin or ratio. In addition, each of our regulated Bermuda subsidiaries is prohibited, without the prior approval of the BMA, from reducing by 15% or more its total statutory capital, or from reducing by 25% of more its total statutory capital and surplus, as set out in its previous year’s statutory financial statements. Our Bermuda insurance companies that are in run-off are required to seek BMA approval for any dividends or distributions.
Economic Substance Act
The Economic Substance Act 2018 (the “ESA”) was passed in Bermuda in December 2018. Under the provisions of the ESA, any Bermuda-registered entity engaged in a “relevant activity” (which includes insurance business and holding entity activities) must maintain a substantial economic presence in Bermuda. To the extent that the ESA applies to our entities registered in Bermuda, we are required to demonstrate compliance with economic substance requirements by filing an annual economic substance declaration with the Registrar of Companies in Bermuda.
United Kingdom and Lloyd’s United Kingdom
Our U.K.-based insurance subsidiaries consist of wholly-owned run-off companies. These subsidiaries are authorized by the U.K. Prudential Regulation Authority (the "PRA"), and are also regulated by the Financial Conduct Authority (the "FCA", together with the PRA, the "U.K. Regulator"). Our U.K. run-off subsidiaries may not underwrite new business without the approval of the U.K. Regulator.
The United Kingdom left the European Union on January 31, 2020 (commonly referred to as “Brexit”). The 11-month transition period, during which European Union rules remained in force, ended on December 31, 2020. For a discussion of the impact of Brexit on our operations, refer to "Item 1A. Risk Factors - Risks Relating to Laws and Regulation."
Our U.K.-based insurance subsidiaries are required to maintain adequate financial resources in accordance with the requirements of the U.K. Regulator. The calculation of the minimum capital resources requirements in any particular case depends on, among other things, the type and amount of insurance business written and claims paid by the insurance company. As of December 31, 2020, each of our U.K.-based insurance subsidiaries maintained capital in excess of the minimum capital resources requirements.
The Solvency II framework sets out requirements on capital adequacy and risk management for insurers. To the extent that Solvency II was already adopted by U.K. legislation, it remains in force post-Brexit. Insurers must comply with a Solvency Capital Requirement ("SCR"), which is calculated using either the Solvency II standard formula or a bespoke internal model. Our non-Lloyd's U.K. companies use the standard formula. It remains to be seen to what extent (if any) the U.K. will depart from the requirements of Solvency II post-Brexit in any new U.K. legislation that may be introduced.
The U.K. Regulator’s rules require our U.K. insurance subsidiaries to obtain regulatory approval for any proposed or actual payment of a dividend. The U.K. Regulator uses the SCR, among other tests, when assessing requests to make distributions.
Under the Financial Services and Markets Act of 2000 ("FSMA"), any company or individual (together with its concert parties) proposing to directly or indirectly acquire "control" over a U.K. authorized insurance company (which is generally defined as acquiring 10% or more of the shares or voting power in a U.K. authorized insurance company or its parent company) must seek prior approval of the U.K. Regulator of its intention to do so. A person who is already deemed to have "control" will require prior regulatory approval if the person increases the level of "control" beyond 20%, 30% and 50%.
Table of Contents
17

Lloyd’s
As of December 31, 2020, we participated in the Lloyd’s market through our interests in: (i) Atrium's Syndicate 609, which is managed by Atrium Underwriters Limited ("AUL"), a Lloyd's managing agent; (ii) StarStone's Syndicate 1301, which is managed by SUL, a Lloyd's managing agent; and (iii) Syndicate 2008, a syndicate that has permission to underwrite RITC business and other run-off or discontinued business type transactions with other Lloyd’s syndicates. SUL serves as managing agent for Syndicate 2008. All of the Group's underwriting by these syndicates is supported by a single corporate member. On January 1, 2021, we sold the Atrium business as discussed in Note 5 - "Divestitures, Held-for-Sale Businesses and Discontinued Operations" in the notes to our consolidated financial statements included within Item 8 of this Annual Report on Form 10-K.
Our Lloyd’s operations are subject to authorization and regulation by the U.K. Regulator and compliance with the Lloyd’s Act(s) and Byelaws and regulations, as well as the applicable provisions of the FSMA. The Council of Lloyd’s has wide discretionary powers to regulate its members, and its exercise of these powers might affect the return on an investment of the corporate member in a given underwriting year. This discretion includes the ability to assess up to 3% of a member’s underwriting capacity in any one year as a Central Fund contribution.
The underwriting capacity of a corporate member of Lloyd’s must be supported by providing a deposit (referred to as "Funds at Lloyd’s") in the form of cash, securities, letters of credit or other approved capital instrument in satisfaction of its capital requirement. The amount of the Funds at Lloyd’s is assessed annually and is determined by Lloyd’s in accordance with applicable capital adequacy rules.
Business plans, including maximum underwriting capacity, for Lloyd’s syndicates requires annual approval by the Lloyd’s Franchise Board, which may require changes to any business plan or additional capital to support underwriting plans.
In order to achieve finality and to release their capital, Lloyd’s members are usually required to have transferred their liabilities through an approved RITC, such as those offered by Syndicate 2008. RITC is generally put in place after the third year of a syndicate year of account. On successful conclusion of RITC, any profit from the syndicate for that year of account can be fully remitted by the managing agent to the syndicate’s members.
The Lloyd’s market has applied the Solvency II internal model under Lloyd’s supervision, and our Lloyd’s operations are required to meet Solvency II standards. The Society of Lloyd's has received approval from the PRA to use its internal model under the Solvency II regime.
Lloyd’s approval is required before any person can acquire control of a Lloyd’s managing agent or Lloyd’s corporate member.
United States Our insurance and reinsurance companies domiciled in the United States consist of property and casualty
companies in run-off. Our U.S. insurers are subject to extensive governmental regulation and supervision by the states in which they are domiciled, licensed and/or eligible to conduct business. The insurance laws and regulations of the state of domicile have the most significant impact on operations. We currently have U.S. insurers and reinsurers domiciled in Texas, New York, Missouri, Oklahoma and Rhode Island and minority owned affiliates in Delaware and Pennsylvania.
Generally, regulatory authorities have broad regulatory powers over such matters as licenses, standards of solvency, premium rates and policy forms (except for excess and surplus lines insurers), marketing practices, claims practices, investments, security deposits, restrictions on size of risks that may be insured under a single policy, methods of accounting, form and content of financial statements, corporate governance, enterprise risk management, reserves and provisions for unearned premiums, unpaid losses and LAE, reinsurance, minimum capital and surplus requirements, dividends and other distributions to shareholders, periodic examinations, annual and other report filings, and transactions among affiliates.
U.S. insurers are also required to maintain minimum levels of solvency and liquidity as determined by law, and to comply with risk-based capital requirements and licensing rules. Insurers having less statutory surplus than required by the risk-based capital calculation will be subject to varying degrees of regulatory action. If any of our U.S. insurers were to have risk-based capital levels that are below required levels, they would be subject to increased regulatory scrutiny and control by their domestic and possibly other insurance regulators. As of December 31, 2020, all of our U.S. insurers exceeded their required levels of risk-based capital.
Applicable insurance laws also limit the amount of dividends or other distributions our U.S. insurers can pay to us. The insurance regulatory limitations on dividends are generally based on statutory net income and/or certain levels of statutory surplus as determined by the insurer’s state or states of domicile and approval must be obtained before an insurer may pay a dividend or make a distribution above these thresholds.
Table of Contents
18

All states have enacted legislation regulating insurance holding company systems that requires each insurance company in the system to register with the insurance department of its state of domicile and furnish information concerning the operations of companies within the holding company system that may materially affect the operations, management or financial condition of the insurers within the system. The NAIC has adopted amendments to the Insurance Holding Company System Regulatory Act and associated regulations, which all states in which our U.S. insurers are domiciled have adopted. The amendments provide the regulators with additional tools to evaluate risks to an insurance company within the insurance holding company system. They impose more extensive informational requirements on parents and other affiliates of licensed insurers with the purpose of protecting them from enterprise risk, including requiring an annual enterprise risk report by the ultimate controlling person of the insurers identifying the material risks within the insurance holding company system that could pose enterprise risk to the insurers and requiring a person divesting its controlling interest to make a confidential advance notice filing.
The NAIC has also adopted the Risk Management and Own Risk and Solvency Assessment Model Act, which requires insurers to maintain a risk management framework and establishes a legal requirement for insurers or their insurance group to conduct an Own Risk and Solvency Assessment ("ORSA") in accordance with the NAIC’s ORSA Guidance Manual. The ORSA Model Act has been adopted in all of the states in which our U.S. insurers are domiciled, and our insurers in these states may be subject to ORSA requirements if certain premium thresholds are exceeded. Where applicable, we must regularly conduct an ORSA consistent with the ORSA Model Act, including undertaking an internal risk management review no less often than annually and preparing a summary report assessing the adequacy of risk management and capital in light of our insurers’ current and future business plans.
In addition, the NAIC’s Corporate Governance Annual Disclosure (“CGAD”) Model Act and Regulation requires the annual filing of a disclosure describing the insurance group’s corporate governance structure, policies, and practices. The Model Act and Regulation have been adopted in most of the states in which we have insurers domiciled. There are no premium thresholds for CGAD.
Before a person can acquire control of a domestic insurer (including a reinsurer) or any person controlling such insurer (including acquiring control of Enstar Group Limited), prior written approval must be obtained from the insurance commissioner of the state in which the domestic insurer is domiciled and, under certain circumstances, from insurance commissioners in other jurisdictions. Generally, state statutes and regulations provide that "control" over a domestic insurer or person controlling a domestic insurer is presumed to exist if any person, directly or indirectly, owns, controls, holds with the power to vote, or holds proxies representing, 10% or more of the voting securities or securities convertible into voting securities of the domestic insurer or of a person who controls the domestic insurer.
Australia Our Australian regulated insurance entities (which include our insurance subsidiary and our non-operating
holding company) are subject to prudential supervision by the Australian Prudential Regulation Authority ("APRA"). APRA is the primary regulatory body responsible for regulating compliance with the Insurance Act 1973. APRA has issued prudential standards that apply to general insurers in relation to capital adequacy, the holding of assets in Australia, risk management, business continuity management, reinsurance management, outsourcing, audit and actuarial reporting and valuation, the transfer and amalgamation of insurance businesses, governance, and the fit and proper assessment of the insurer’s responsible persons.
APRA’s prudential standards require that all insurers maintain and meet prescribed capital adequacy requirements designed to ensure that insurers meet their insurance obligations under a wide range of scenarios.
APRA also prescribes prudential standards on risk management and governance. These requirements include the need for regulated insurance entities to have a risk management framework that is consistent and integrated with its risk profile and capital strength, supported by a risk management function and subject to comprehensive review. APRA’s risk management requirements also include the need for regulated insurance entities to have a board risk committee that provides the Board with objective non-executive oversight of the implementation and on-going operation of its risk management framework, and the requirement that regulated insurance entities designate a chief risk officer who is involved in, and provides effective challenge to, activities and decisions that may materially affect the regulated insurance entities’ risk profile. Our Australian regulated insurance entities are compliant with these requirements.
An insurer must obtain APRA’s written consent prior to making any capital releases, including any payment of dividends in excess of current year earnings. Our insurance subsidiary must provide APRA a valuation prepared by an appointed actuary that demonstrates that the tangible assets of the insurer, after the proposed capital reduction,
Table of Contents
19

are sufficient to cover its insurance liabilities to a 99.5% level of sufficiency of capital before APRA will consent to a capital release or dividend above the prescribed limit.
Under the Financial Sector (Shareholdings) Act 1998, the interest of an individual shareholder or a group of associated shareholders in an insurer is generally limited to a 15% "stake" of the insurer. A person’s stake is the aggregate of the person’s voting power and the voting power of the person’s associates. A higher percentage limit may be approved by the Treasurer of the Commonwealth of Australia on national interest grounds. Any shareholder of Enstar Group Limited with a "stake" greater than 15% has received approval to hold that stake from the Treasurer of the Commonwealth of Australia.
EuropeWe have subsidiaries in Belgium, as well as StarStone Insurance SE, a Liechtenstein-based company that is
regulated by the Financial Markets Authority. Our subsidiaries and branches in European jurisdictions such as Belgium and Liechtenstein are regulated in their respective home countries. The application of the Solvency II framework across such European jurisdictions generally results in a more uniform approach to regulation. Typically, such regulation is for the protection of policyholders and ceding insurance companies rather than shareholders. Regulatory authorities generally have broad supervisory and administrative powers over such matters as licenses, standards of solvency including minimum capital and surplus requirements, investments, reporting requirements relating to capital structure, ownership, financial condition and general business operations, special reporting and prior approval requirements with respect to certain transactions among affiliates, reserves for unpaid losses and LAE, reinsurance, dividends and other distributions to shareholders, periodic examinations and annual and other report filings.
Available InformationWe maintain a website with the address http://www.enstargroup.com. The information contained on our
website is not included as a part of, or incorporated by reference into, this filing. We make available free of charge through our website our annual report on Form 10-K, quarterly reports on Form 10-Q, current reports on Form 8-K, and all amendments to these reports, as soon as reasonably practicable after the material is electronically filed with or otherwise furnished to the U.S. Securities and Exchange Commission, (the "SEC"). Our annual reports on Form 10-K, quarterly reports on Form 10-Q, current reports on Form 8-K, and amendments to those reports are also available on the SEC’s website at http://www.sec.gov. In addition, copies of our Code of Conduct and the governing charters for the Audit, Compensation, Nominating and Governance, Investment, Risk, and Executive Committees of our Board of Directors are available free of charge on our website.
Table of Contents
20
ITEM 1A. RISK FACTORS Any of the following risk factors could cause our actual results to differ materially from historical or anticipated
results. These risks and uncertainties are not the only ones we face. There may be additional risks that we currently consider not to be material or of which we are not currently aware, and any of these risks could cause our actual results to differ materially from historical or anticipated results.
You should carefully consider these risks along with the other information included in this document, including the matters addressed above under "Cautionary Note Regarding Forward-Looking Statements and Summary of Risk Factors" before investing in any of our securities. We may amend, supplement or add to the risk factors described below from time to time in future reports filed with the SEC.
A summary of our risk factors is included above under the heading "Cautionary Note Regarding Forward-Looking Statements and Summary of Risk Factors."
We have categorized our risk factors into the following areas:
• Risks Relating to our Run-off Business
• Risks Relating to Liquidity and Capital Resources
• Risks Relating to our Investments
• Risks Relating to Laws and Regulations
• Risks Relating to our Operations
• Risks Relating to Taxation
• Risks Relating to Ownership of our Shares
Risks Relating to our Run-off BusinessInadequate loss reserves could reduce our net earnings and capital surplus, which could have a
materially adverse impact on our results of operations and financial condition.Our success is dependent upon our ability to assess accurately the risks associated with the business that we
have acquired or will acquire in the future. We are required to maintain a best estimate of reserves to cover the estimated ultimate liability for losses and LAE for both reported and unreported incurred claims. As of December 31, 2020, gross reserves for losses and LAE reported on our balance sheet were $10.6 billion. The process of establishing these reserves includes a significant level of judgment. As a result, these reserves are only estimates of what we expect the settlement and administration of claims will cost based on facts and circumstances known to us, as well as actuarial methodologies, historical industry loss ratio experience, loss development patterns, estimates of future trends and developments and other variable factors such as inflation. We cannot be certain that ultimate losses will not exceed our estimates of losses and LAE because of the uncertainties and inherent judgements that surround the estimation process (which are discussed in "Item 7. Management’s Discussion and Analysis of Financial Condition and Results of Operations - Critical Accounting Estimates - Losses and Loss Adjustment Expenses"). As a result, actual losses and LAE paid will deviate, perhaps substantially, from the reserve estimates reflected in our financial statements due to legal, judicial, social, technological or other factors, including changes in loss inflation. If our reserves are insufficient to cover our actual losses and LAE, we would have to augment our reserves and incur a charge to our earnings. These charges could be material and would reduce our net earnings and capital and surplus.
In our Non-life Run-off business, loss reserves include asbestos and environmental ("A&E") liabilities and liabilities associated with personal injury A&E claims from acquired companies with legacy manufacturing businesses. Ultimate values for A&E claims cannot be estimated using traditional reserving techniques, and there are significant uncertainties in estimating losses for these claims. Factors contributing to the uncertainty include long waiting periods, reporting delays and difficulties identifying contamination sources and allocating damage liability. Developed case law and adequate claim history do not always exist for A&E claims, and changes in the legal and tort environment affect the development of such claims. To further understand this risk, see "Item 7. Management’s Discussion and Analysis of Financial Condition and Results of Operations - Critical Accounting Estimates - Losses and Loss Adjustment Expenses - Non-Life Run-off - Loss Reserving (Latent Claims)".
Table of Contents
21

Emerging claim and coverage issues could adversely affect the adequacy of our provision for losses and LAE.
As industry practices and legal, judicial, social and other environmental conditions change, unexpected and unintended issues related to claims and coverage may emerge. These issues may adversely affect the adequacy of our provision for losses and LAE by either extending coverage beyond the envisioned scope of insurance policies and reinsurance contracts, or by increasing the number or size of claims. Our exposure to these uncertainties could be exacerbated by an increase in insurance and reinsurance contract disputes, arbitration and litigation, as well as social inflation trends, including expanded theories of liability and higher jury awards. Increasingly, the handling of insurance claims can also lead to bad faith or other forms of extra-contractual damages. The full effects of these and other unforeseen emerging claim and coverage issues are extremely hard to predict. In some instances, these changes may not become apparent until long after we have acquired or issued the affected contracts. As a result, the full extent of liability under these insurance or reinsurance contracts may not be known for many years after a contract has been issued.
We may not be able to sustain our growth through acquisitions. We have pursued and, as part of our strategy, will continue to pursue growth through financially beneficial
acquisitions of insurance companies and portfolios of insurance and reinsurance business in run-off (“run-off business”), including through reinsurance. Because the execution of our claims management strategies naturally results in the reduction of our losses and LAE over time (with associated assets including cash and investment reducing commensurately as claims are paid), we must continually acquire an adequate amount of run-off business that aligns with our strategic objectives. However, the acquisition of suitable run-off business is highly competitive and driven by several factors, including proposed acquisition price, reputation, collateral arrangements, and financial resources. In recent years, new competitors have entered the insurance run-off space, including through the formation of reinsurance companies or the use of other financial products intended to acquire insurance liabilities in run-off. We expect competition from these sources and others to continue to increase over time. As a result, we may be unable to source an adequate amount of favorable acquisition transactions at acceptable prices with acceptable terms, which could prevent us from achieving future growth.
Our acquisitions may not be financially beneficial to us or our shareholders.The evaluation and negotiation of potential acquisitions, as well as the integration of acquired businesses or
portfolios, can be complex and costly and requires substantial management resources. Our acquisitions could involve numerous additional risks that we may not be able to identify during the due diligence process, such as potential losses from unanticipated litigation, levels of covered claims or other liabilities and exposures, an inability to generate sufficient investment income and other revenue to offset acquisition costs and financial exposures in the event that sellers breach their representations and warranties and/or are unable or unwilling to meet their indemnification, reinsurance and other contractual obligations to us.
Our run-off business entails acquiring and managing insurance and reinsurance companies, portfolios of insurance and reinsurance, and companies with liabilities related to legacy manufacturing operations. Unlike traditional insurers and reinsurers, our companies and portfolios in run-off no longer underwrite new policies and their stated provisions for losses and LAE may not be sufficient to cover future losses and the cost of run-off. Because our non-life companies and portfolios in run-off generally no longer collect underwriting premiums, our resources to cover losses are limited to our assets backing stated reserves and our equity.
To achieve positive operating results from an acquisition, we must first price the transaction on favorable terms relative to the risks posed by the acquired business and then successfully manage the acquired reserves by efficiently managing claims, collecting from insurers or reinsurers, generating investment returns on the assets supporting the acquired business and controlling expenses. Failure to successfully perform these activities in line with our pricing assumptions could result in us having to cover losses sustained with capital, which would materially and adversely impact our ability to grow our business and may result in material losses.
We may not be able to realize the anticipated benefits of acquisitions, which may result in underperformance relative to our expectations and have a material adverse effect on our business, financial condition or results of operations.
The acquisitions we have made and expect to make in the future may pose operational challenges that divert management’s time and energy and expose us to risks relating to:
• the value of liabilities assumed being greater than expected;
Table of Contents
22
• the value of assets or our anticipated return on assets being lower than expected or diminishing for reasons including credit defaults, changes in interest rates, declines in the market value, inflation or delays in implementation of our intended investment strategies;
• funding cash flow shortages that may occur if anticipated revenues are not realized or are delayed, if expenses are greater than anticipated, or if assets are not liquid;
• integrating financial and operational reporting systems and internal controls of acquired businesses, including compliance with Section 404 of the Sarbanes-Oxley Act of 2002 and our reporting requirements under the Exchange Act;
• leveraging our existing capabilities and expertise into the business acquired and establishing synergies within our organization;
• funding increased capital needs and overhead expenses;
• integrating technology platforms and managing any increased cybersecurity risk;
• the timely transfer and integrity of data needed to manage acquired business;
• obtaining and retaining management personnel required for expanded operations;
• fluctuating foreign currency exchange rates relating to the assets and liabilities we may acquire;
• goodwill and intangible asset impairment charges; and
• complying with applicable laws and regulations.
If we are unable to address some or all of these challenges, our acquisitions may underperform relative to our expectations and our business may be materially and adversely affected.
We may not complete future acquisitions within the time frame we anticipate or at all, which could have a negative effect on our business, financial condition or results of operations.
Once we have signed a definitive agreement to acquire a business or portfolio, conditions to closing, such as obtaining regulatory approvals or shareholder approvals, must be met before the acquisition can be completed. These and other closing conditions may not be satisfied at all, or may cause a material delay in the anticipated timing of closing. In addition, our ability to complete the acquisition on the originally anticipated terms, or at all, could be jeopardized if a seller receives competing proposals, if litigation is brought challenging the transaction or certain of its terms, or if regulators impose unexpected burdensome terms and conditions on the transaction. Failure to complete an acquisition on the originally anticipated terms, or a significant delay in the closing, could result in significant expense, diversion of time and resources, reputational damage, litigation and a failure to realize the anticipated benefits of the acquisition, all of which could materially adversely impact our business, financial condition and results of operations.
The impact of COVID-19 and related risks could adversely affect our business, results of operations, financial condition, and liquidity and capital resources, and any future impact on our business is difficult to predict at this time.
The ongoing COVID-19 pandemic has caused significant disruption to the economy and financial markets globally, and the full extent of the impacts of COVID-19 are not yet known. Our results of operations, financial condition, and liquidity and capital resources have been adversely impacted by the COVID-19 pandemic, and the future impact of the pandemic is difficult to predict. Uncertainty in a global economic recovery is high, principally due to the varying abilities of individual countries to manage and contain new outbreaks of COVID-19, which has led to a wide range of economic responses. We are unable to predict what the long-term economic impact of the COVID-19 pandemic will be and how that will impact our business. In addition, we believe we are subject to the following heightened risks related to the COVID-19 pandemic:
• Investments. Due in large part to the uncertainty caused by the COVID-19 pandemic in global financial markets, our investment portfolio has experienced significant volatility. In the first quarter of 2020, we experienced significant unrealized losses (largely due to widening credit spreads on fixed income investments and changes in the fair value of our equity and fund investments), heightened credit risk, and declines in yields on our fixed income investments. Although these unrealized losses reversed since the first quarter of 2020, our investment portfolios may continue to experience significant volatility and could be adversely impacted by unfavorable market conditions caused by the COVID-19 pandemic, which could cause continued volatility in our results of operations and negatively impact our financial condition.
• Debt and Equity Financing. As a result of the economic uncertainty caused by the COVID-19 pandemic, capital and debt markets continue to experience volatility that could negatively impact our ability to raise
Table of Contents
23

additional capital through the debt or equity capital markets or through bank or other debt financing. If we are unable obtain adequate capital on suitably attractive terms (or at all), we may be unable to implement our future growth or operating plans to their fullest potential (or at all), and our business, financial condition, and results of operations could be materially adversely affected.
• Liquidity. Due to the change in fair value of our investments caused by the COVID-19 pandemic, we and our insurance and reinsurance subsidiaries may need additional capital to maintain compliance with regulatory capital requirements and/or be required to post additional collateral under existing debt facilities and/or reinsurance arrangements, which could reduce our liquidity. If market conditions deteriorate, we may not be able to secure letters of credit to satisfy certain of our existing collateral obligations, whether because we cannot obtain new letter of credit facilities, extend or renew existing letter of credit facilities, or negotiate favorable or acceptable pricing or other terms or conditions. In addition, we may experience a reduction in the amount of available dividend or capital distribution capacity from our regulated insurance and reinsurance subsidiaries, which would also reduce our available liquidity resources.
• Operational Disruptions. We rely on the continued productivity of our senior executive team, our employees, and our third party administrators, suppliers and outsourcing providers to carry out our operations. If any of these people are unable to continue to work productively, or at all, due to illness, government restrictions, remote working conditions, or other disruptions related to the COVID-19 pandemic, our ability to conduct our operations may be adversely affected.
• Cybersecurity. Like many other companies, most of our employees are working remotely, and we are therefore more dependent on our information technology systems and the continued access by our employees and service providers to reliable internet and telecommunications systems. We will be adversely affected if these systems do not function effectively or are disrupted due to heightened demand, cybersecurity attacks and data security incidents, or for any other related reason. These types of operational and technological disruptions that impact our people and/or systems and others we may not foresee, would negatively impact our ability to settle claims efficiently, complete acquisitions, integrate our acquired businesses, manage our investments, or otherwise conduct our business.
Circumstances caused by the COVID-19 pandemic are complex, uncertain and continuing to evolve. We therefore may not be able to accurately predict the extent the COVID-19 pandemic adversely affects our financial condition or results of operations, and it may also have the effect of heightening additional risks described herein.
Risks Relating to Liquidity and Capital Resources The amount of statutory capital that we must hold in order to maintain our financial strength and
credit ratings and meet certain regulatory requirements can vary significantly from time to time and is sensitive to several factors.
Statutory capital requirements for our insurance subsidiaries are prescribed by the applicable insurance regulators in the jurisdictions in which we operate, including Bermuda, the United States, the United Kingdom, the European Union and Australia. Insurance regulators have established risk-based capital adequacy measures, such as the Bermuda Solvency Capital Requirement ("BSCR") in Bermuda and the Solvency II regime in the European Union and United Kingdom, which provide minimum solvency and liquidity requirements for insurance companies. The amount of capital that we and/or our insurance subsidiaries are required to hold may increase or decrease depending on a variety of factors including the amount of statutory income or losses generated by our insurance subsidiaries (which itself is sensitive to equity market and credit market conditions), the amount of capital needed to support future growth through acquisitions, changes in the value of investments, changes in interest rates and foreign currency exchange rates, as well as changes to the relevant regulatory capital adequacy measures and frameworks. Many of these factors are outside of our control, and our overall liquidity and credit ratings are significantly influenced by the level of statutory capital and surplus in our insurance subsidiaries. If statutory capital requirements increase or if our insurance subsidiaries' solvency decreases, our subsidiaries would be required to hold more capital, and our ability to obtain distributions from these subsidiaries could be limited. If we fail to maintain adequate statutory capital, the regulators may restrict our activities and prohibit us and our subsidiaries from completing acquisitions without raising additional capital.
We may require additional capital and credit in the future that may not be available or may only be available on unfavorable terms.
Our future capital requirements depend on many factors, including acquisition and investment activity, our ability to manage the run-off of our assumed liabilities, our ability to establish reserves at levels sufficient to cover losses, and our obligations to satisfy statutory capital requirements. We may need to raise additional capital and liquidity through equity or debt financings in the future. Our ability to secure this financing may be affected by a
Table of Contents
24
number of factors, including volatility in the global financial markets, the strength of our capital position and operating results. In addition, an unfavorable change or downgrade of our issuer credit ratings could increase the interest rate or commission rate charged under our debt facilities and may make it more expensive for us to access capital markets. Any equity or debt financing, if available at all, may be on terms that are not favorable to us, and could limit our strategic, financial and operational flexibility, including as a result of the need to dedicate a greater portion of our cash flows from operations to preferred share dividends and interest and principal payments on our debt financing and to comply with more burdensome covenant restrictions from our various debt and letter of credit facilities.
In addition, we may not achieve the desired regulatory capital treatment for any potential issuance of debt or equity securities due to changing solvency capital eligibility requirements under the Bermuda Insurance (Group Supervision) Rules 2011 (the "Group Supervision Rules") to which we are subject. For example, our outstanding preferred shares and junior subordinated notes qualify as Tier 2 capital and our outstanding senior notes qualify as Tier 3 capital, in accordance with the Group Supervision Rules. For these instruments to continue to receive the intended regulatory capital treatment, their terms must reflect the criteria contained in the Group Supervision Rules and any amendments thereto. If the BMA applies any changes to the Group Supervision Rules governing eligible capital such that our outstanding preferred shares and notes no longer receive their intended capital treatment under the Group Supervision Rules, we may be unable to maintain adequate regulatory capital. If we cannot obtain adequate capital or credit, our business, results of operations and financial condition could be adversely affected by, among other things, our inability to finance future acquisitions.
Our reinsurance subsidiaries may be required to provide collateral to ceding companies pursuant to their reinsurance contracts. Their ability to conduct business could be significantly and negatively affected if they are unable to do so or if any letters of credit posted as collateral cannot be renewed or are drawn upon by a ceding company.
Our reinsurance subsidiaries are often required to post collateral in the form of letters of credit, trust funds or other assets in order to provide security for their reinsurance obligations and to provide ceding companies with statutory credit for such reinsurance. If our reinsurance subsidiaries are unable to post the required collateral or the cost of providing such collateral materially increases, their operations could be significantly and negatively affected, which in turn could limit our ability to complete certain run-off acquisitions on favorable terms, which could negatively impact our business, financial condition and results of operations. Depending on economic, credit market and regulatory factors, our reinsurance subsidiaries may not be able to secure letters of credit to satisfy requirements to post collateral in support of their reinsurance obligations. If our reinsurance subsidiaries cannot post collateral in the form of letters of credit, then our reinsurance subsidiaries will have to post a greater amount of collateral in the form of trust funds or other assets, limiting our ability to invest (and consequently derive investment income from) such assets and constrain our liquidity, which could negatively impact our business, financial condition and results of operations. In addition, if the beneficiary of any letter of credit draws funds against the letter of credit, we would be obligated to immediately repay the bank that issued the letter of credit the amount of such drawn funds, which could increase our indebtedness and significantly and negatively affect our liquidity and financial condition.
Uncertain conditions in the global economy generally may materially adversely affect our business, results of operations and financial condition.
In the event of financial turmoil affecting the global banking system and global financial markets (which may result from a variety of events such as natural or man-made disasters, including global pandemic, war, or terrorism) or significant financial service institution failures, there could be a new or incremental tightening in the credit markets, low liquidity, and extreme volatility in fixed maturity, credit, currency, and equity markets. This could have several effects on our business, including our ability to obtain financing for future acquisitions. Even if financing is available, it may only be available on terms that are not favorable to us, which would decrease our profitability.
Global and local economic conditions could also increase the number and size of claims made under our policies, our counter-party credit risk, and the ability of our counterparties to establish or maintain their relationships with us.
Net investment income and net realized and unrealized gains or losses also could vary materially from expectations depending on market conditions; impairment charges resulting from revaluations of debt and equity securities and other investments; interest rates; inflation; cash balances; and changes in the fair value of financial and derivative instruments. Increased volatility in the financial markets and overall economic uncertainty would increase the risk that the actual amounts realized in the future on our financial instruments could differ significantly from the fair values currently assigned to them.
Table of Contents
25

Reinsurers may not satisfy their obligations to our (re)insurance subsidiaries, which could result in significant losses or liquidity issues for us.
Our (re)insurance subsidiaries are subject to credit risk with respect to their reinsurers because the transfer of risk to a reinsurer does not relieve our subsidiaries of their liability to the insured. Reinsurance companies may be negatively impacted or downgraded during difficult financial and economic conditions in the global capital markets and economies. In addition, reinsurers may be unwilling to pay our subsidiaries even though they are able to do so, or disputes may arise regarding payment obligations. The failure of one or more of our subsidiaries’ reinsurers to honor their obligations in a timely fashion may affect our cash flows and liquidity, reduce our net earnings or cause us to incur a significant loss. Disputes with our reinsurers may also result in unforeseen expenses relating to litigation or arbitration proceedings. A reinsurer’s inability or unwillingness to honor its obligations may negate the intended risk-reducing impact of our reinsurance.
Exposure to reinsurers who from time to time represent meaningful percentages of our total reinsurance balances recoverable on paid and unpaid losses may increase the risks described above. For information on reinsurance balances recoverable on paid and unpaid losses, see "Item 7. Management’s Discussion and Analysis of Financial Condition and Results of Operations - Liquidity and Capital Resources - Reinsurance Balances Recoverable on Paid and Unpaid Losses."
We are a holding company, and we are dependent on the ability of our subsidiaries to distribute funds to us.
We are a holding company and therefore we are dependent on distributions of funds from our operating subsidiaries to fund acquisitions, fulfill financial obligations in the normal course of our business, including payments on our outstanding notes, and pay dividends to our shareholders, including holders of our preferred shares and, in turn, the related depositary shares. The ability of our (re)insurance subsidiaries to make distributions to us may be limited by various business considerations and applicable insurance laws and regulations in jurisdictions in which we operate (which are described in "Item 1. Business - Regulation"). The ability of our subsidiaries to make distributions to us may also be restricted by, among other things, other applicable laws and regulations and the terms of our debt obligations and our subsidiaries’ debt obligations. If our subsidiaries are restricted from making distributions to us, we may be unable to maintain adequate liquidity to fund acquisitions or fulfill our financial obligations.
Fluctuations in currency exchange rates may cause us to experience losses. We maintain a portion of our investments, insurance liabilities and insurance assets denominated in
currencies other than U.S. dollars. Consequently, we and our subsidiaries may experience foreign exchange losses, which could adversely affect our results of operations. Additionally, we publish our consolidated financial statements in U.S. dollars. Therefore, fluctuations in exchange rates used to convert other currencies used by our subsidiaries, particularly Australian dollars, Canadian dollars, British pounds and Euros, into U.S. dollars will impact our reported financial condition, results of operations and cash flows from year to year.
Our failure to comply with covenants contained in our credit facilities or in the indentures governing our outstanding notes could trigger repayment obligations, which could adversely affect our results of operations and financial condition.
We and our subsidiaries currently have a revolving credit facility, several outstanding letter of credit facilities and outstanding senior and junior notes. We depend on access to our credit facilities and the capital provided by our outstanding notes in operating our business. The credit facilities and the indentures governing our outstanding notes contain various business and financial covenants that impose requirements with respect to our financial condition and restrictions on us and certain of our subsidiaries with respect to, among other things, mergers and consolidations, acquisitions, amalgamations and sales of substantially all assets, indebtedness and guarantees, dispositions, dividends and stock repurchases, investments and liens. We may also enter into future debt arrangements containing similar or different restrictive business and financial covenants. Our failure to comply with these covenants could result in an event of default under the credit facilities or the indentures governing our outstanding notes, which could result in us being required to repay any amounts outstanding under our revolving credit facility or the outstanding notes prior to maturity and/or post alternative collateral in respect of outstanding letters of credit that support reinsurance obligations. These obligations could have an adverse effect on our results of operations and financial condition, including our capital and liquidity. In addition, complying with these covenants could limit our financial and operational flexibility. Our credit facilities and our outstanding notes are described in more detail in "Item 7. Management’s Discussion and Analysis of Financial Condition and Results of Operations - Liquidity and Capital Resources - Debt Obligations."
Table of Contents
26

Risks Relating to our Investments The value of our (re)insurance subsidiaries’ investment portfolios and the investment income that our
(re)insurance subsidiaries receive from these portfolios may decline materially as a result of market fluctuations and economic conditions, including those related to interest rates and credit spreads.
We derive a significant portion of our income from our invested assets, which consist primarily of investments in fixed maturity securities. The value of our subsidiaries’ investments in fixed maturity securities will generally increase or decrease with changes in interest rates and credit spreads. Interest rates are highly sensitive to many factors, including governmental monetary policies, domestic and international economic and political conditions and other factors beyond our control. A rise in interest rates would, all else being equal (i.e. no movement in credit spreads), increase net unrealized losses, which would decline over time as the security approaches maturity. Conversely, a decline in interest rates, all else being equal (i.e. no movement in credit spreads) would increase net unrealized gains, which would decline over time as the security approaches maturity. Additionally, new investments of cash or the reinvestment of proceeds from sales of securities would likely be invested at lower interest rates thereby decreasing net investment income on those proceeds. The fair market value can also decrease as a result of a deterioration of the credit quality of those securities. Any perceived decrease in credit quality may cause credit spreads to widen, all else equal, and this would result in an increase in net unrealized losses. A deterioration of credit ratings on our fixed maturity security investments may result in a preference to liquidate these securities in the financial markets. If we liquidate these securities during a period of deteriorating credit, we may realize a significant loss.
The Financial Conduct Authority of the United Kingdom plans to phase out LIBOR by the end of 2021. A significant portion of our investments in fixed maturities is in LIBOR-based instruments. There is currently no definitive replacement rate for LIBOR, and we therefore are unable to determine the potential impact of the LIBOR change on our investment results.
Some of our fixed maturity securities, such as mortgage-backed and other asset-backed securities, carry prepayment risk, or the risk that principal will be returned more rapidly or slowly than expected, as a result of interest rate fluctuations. When interest rates decline, consumers tend to make prepayments on their mortgages (often through refinancing), causing us to be repaid more quickly than we might have originally anticipated, meaning that our opportunities to reinvest these proceeds back into the investment markets may be at reduced interest rates (with the converse being true in a rising interest rate environment). Mortgage-backed and other asset-backed securities are also subject to default risk on the underlying securitized mortgages, which would decrease the value of our investments.
The changes in the market value of our securities that are classified as trading or available-for-sale ("AFS") are reflected in our financial statements. Other-than-temporary impairment losses in the value of our fixed maturity securities are also reflected in our financial statements. As a result, a decline in the value of the securities in our investment portfolios may materially reduce our net income and shareholders’ equity, and may cause us to incur a significant loss. For more information on our investment portfolios, see "Item 7. Management’s Discussion and Analysis of Financial Condition and Results of Operations - Investable Assets."
Our investments in alternative investments may be illiquid and volatile in terms of value and returns.In addition to fixed maturity securities, we have invested, and may from time to time continue to invest, in
alternative investments such as hedge funds, fixed income funds, equity funds, private equity funds and co-investments, collateralized loan obligation ("CLO") equities, CLO equity funds, real estate funds and other alternative investments. These and other similar investments may be illiquid due to restrictions on sales, transfers and redemption terms, may have different, more significant risk characteristics than our investments in fixed maturity securities and may also have significantly more volatile values and returns, all of which could negatively affect the market value of our investments, our investment income, and our overall portfolio liquidity. Alternative or "other" investments may not meet regulatory admissibility requirements or may result in increased regulatory capital charges to our insurance subsidiaries that hold these investments, which could limit those subsidiaries’ ability to pay dividends and make capital distributions to us and, consequently, negatively impact our liquidity. For more information on our alternative investments, see "Item 7. Management’s Discussion and Analysis of Financial Condition and Results of Operations - Investable Assets."
Table of Contents
27

A significant amount of our investments in alternative investments are contained in the InRe Fund, a hedge fund managed by AnglePoint, which exercises broad discretionary authority to determine how the underlying funds are invested. The performance of such investments is dependent on the manager’s ability to select and manage appropriate investments and the ability of its key personnel to develop and implement appropriate investment strategies.
We have made significant direct investments in the InRe Fund, L.P. (the “InRe Fund”), a hedge fund managed by AnglePoint Asset Management Ltd. ("AnglePoint"), an affiliate of Hillhouse Capital Management, Ltd. and Hillhouse Capital Advisors, Ltd. (together, "Hillhouse Capital"). Our investment in the InRe Fund had a carrying value of $2.4 billion as of December 31, 2020 (December 31, 2019: $918.6 million). Funds managed by Hillhouse Capital collectively own 9.4% of our voting ordinary shares.
Subject to certain limitations, AnglePoint has broad discretionary authority to determine how our investments in the InRe Fund are invested. As a result, the success of our investment in the InRe Fund is dependent on AnglePoint’s ability to select and manage appropriate investments and the ability of AnglePoint’s key personnel to develop and implement appropriate investment strategies. The failure of AnglePoint or any of its key personnel to perform adequately (or a loss or diminution of the services provided by AnglePoint’s key personnel) could result in losses or lower than expected profits, either of which could significantly and negatively affect our investment returns and results of operations.
Like our other alternative investments, our investments in the InRe Fund may have different, more significant risk characteristics than our investments in fixed maturity securities and may also have more volatile values and returns than the broader equity markets, all of which could negatively affect our investment income and overall portfolio liquidity. Furthermore, the InRe Fund employs investment strategies and trading techniques that involve the use of margin, derivatives and other forms of financial leverage or short sales, all of which could result in significant or outsized realized or unrealized losses and negatively affect the value and liquidity of our investment portfolio, which could materially adversely impact our financial condition and results of operations.
Past performance is not indicative of future results, and our investment in the InRe Fund may not achieve future results that are comparable to historical results. Additionally, because the performance of our investments in the InRe Fund is only one component of our overall results, the performance of an investment in our shares may not correlate with the performance of this investment. For more information about our investment in the InRe Fund refer to Note 21 “Related Party Transactions” in the notes to our consolidated financial statements included within Item 8 of this Annual Report on Form 10-K.
Our strategic investments in joint ventures and/or entities accounted for using the equity method are illiquid and may be volatile in terms of value and returns.
We have also invested, and we expect to continue to make significant investments, in joint ventures and in other entities that we do not control. In these investments, many of which are accounted for using the equity method, we may lack management and operational control over the entities in which we are invested, which may limit our ability to take actions that could protect or increase the value of our investment. These investments are typically illiquid due to contractual provisions that restrict our ability to transfer our interest. In addition, our lack of operational control and the financial condition and performance of these businesses at any given time may prevent us from obtaining liquidity through distributions from these investments in a timely manner or on favorable terms.
The valuation of our investments may include methodologies, estimations and assumptions that are subject to differing interpretations and could result in changes to investment valuations that may materially adversely affect our financial condition or results of operations.
Fixed maturity and alternative investments, such as hedge funds, fixed income funds, equity funds, private equity funds and co-investments, CLO equities, CLO equity funds and real estate funds represent the majority of our total cash and invested assets. These investments are reported at fair value on our consolidated balance sheet. Fair value prices for all trading and AFS securities in the fixed maturities portfolio are independently provided by our investment accounting service providers, investment managers, fund administrators, and investment custodians, each of which utilize internationally recognized independent pricing services. We record the unadjusted price provided by our accounting service providers, managers or custodians, after we perform an internal validation process. Fair value for our alternative investments is estimated based primarily on the most recently reported net asset values reported by the fund manager, which we may adjust following our internal review. Additionally, for some strategic investments for which we have elected the fair value option, our valuations of these investments is based on internal valuation models and methodologies that are subject to estimates and judgements that can vary from quarter to quarter.
These valuation procedures involve estimates and judgments, and during periods of market disruptions (such
Table of Contents
28

as periods of significantly rising or high interest rates, rapidly widening credit spreads or illiquidity), it may be difficult to value certain of our securities if trading becomes less frequent or market data becomes less observable. In addition, there may be certain asset classes that are now in active markets with significant observable data that become illiquid due to changes in the financial environment. In these cases, the valuation of a greater number of securities in our investment portfolio may require more subjectivity and management judgment. As a result, valuations may include inputs and assumptions that are less observable or require greater estimation as well as valuation methods that are more sophisticated or require greater estimation, which may result in valuations greater than the value at which the investments could ultimately be sold. Further, rapidly changing and unpredictable credit and equity market conditions could materially affect the valuation of securities carried at fair value as reported within our consolidated financial statements and the period-to-period changes in value could vary significantly. Decreases in value could have a material adverse effect on our financial condition and results of operations.
The nature of our business liquidity demands and the structure of our entities’ investment portfolios may adversely affect the performance of our investment portfolio and financial results and our investing flexibility.
We strive to structure the duration of our investments in a manner that recognizes our liquidity needs to satisfy future liabilities. Because of the unpredictable nature of losses and associated collateral provisions that may arise under the (re)insurance policies issued by certain of our subsidiaries and as a result of our opportunistic commutation strategy, our liquidity needs can be substantial and may arise at any time. In that regard, we attempt to correlate the maturity and duration of our investment portfolio to our general liability profile. If we are unsuccessful in managing our investment portfolio within the context of this strategy, we may be forced to liquidate our investments at times and at prices that are not optimal, and we may have difficulty liquidating some of our alternative investments due to restrictions on sales, transfers and redemption terms. This could have a material adverse effect on the performance of our investment portfolio. Alternatively, we may forego investment income if the asset duration is shorter than our liability duration profile which could negatively impact our earnings.
We have many individual portfolios of cash and investments from our acquired companies and portfolios. Each investment portfolio has its own regulatory admissibility requirements, and each run-off entity is likely to have negative operating and financing cash flows due to commutation activity, claims settlements and capital distributions. These factors reduce our overall investing flexibility.
Risks Relating to Laws and Regulations Insurance laws and regulations restrict our ability to operate, and any failure to comply with these
laws and regulations, or any investigations, inquiries or demands by government authorities, may have a material adverse effect on our business.
We are subject to the insurance laws and regulations of a number of jurisdictions worldwide. Existing laws and regulations, among other things, limit the amount of dividends and capital that can be paid to us by our (re)insurance subsidiaries, prescribe solvency and capital adequacy standards, impose restrictions on the amount and type of investments that can be held to meet solvency and capital adequacy requirements, require the maintenance of reserve liabilities, and require pre-approval of acquisitions, reinsurance transactions and certain affiliate transactions. Failure to comply with these laws and regulations or to maintain appropriate authorizations, licenses, and/or exemptions under applicable laws and regulations may cause governmental authorities to preclude or suspend our insurance or reinsurance subsidiaries from carrying on some or all of their activities, place one or more of them into rehabilitation or liquidation proceedings, impose monetary penalties or other sanctions on them or our affiliates, or commence insurance company delinquency proceedings against our insurance or reinsurance subsidiaries. The application of these laws and regulations by various governmental authorities may affect our liquidity and restrict our ability to expand our business operations through acquisitions or to pay dividends on our ordinary or preferred shares. Furthermore, compliance with legal and regulatory requirements may result in significant expenses, which could have a negative impact on our profitability. To further understand these regulatory requirements, see "Item 1. Business - Regulation."
In the United States, the Dodd-Frank Act addresses the entire financial services industry and includes initiatives such as the creation of a Federal Insurance Office and other federal oversight agencies, the requiring of more transparency, accountability and focus in protecting investors and businesses, the input of shareholders regarding executive compensation, and the enhanced empowerment of regulators to punish fraud and unethical business practices. Continued compliance with these laws and regulations is likely to result in additional regulation and additional costs for us. In addition, the (re)insurance industry has experienced volatility as a result of investigations, litigation and regulatory activity by various insurance, governmental and enforcement authorities concerning certain practices within the (re)insurance industry. (Re)insurance companies that we have acquired, or may acquire in the future, may have been or may become involved in these or other investigations, litigation or
Table of Contents
29
regulatory activity and may have lawsuits filed or other regulatory actions taken against them. Our involvement in any such activity would cause us to incur legal costs and, if we or any of our insurance or reinsurance subsidiaries were found to have violated any laws or regulations, we could be required to pay fines and damages and incur other sanctions, perhaps in material amounts, which could have a material negative impact on our profitability.
Political, regulatory and industry initiatives could materially adversely affect our business by increasing the amount of regulation we face or changing the nature of the regulations that apply to us in operating our insurance businesses or acquiring new insurance businesses.
Increasingly, governmental authorities have taken interest in the potential systemic risks posed by the (re)insurance industry as a whole. The insurance regulatory environment has become subject to increased scrutiny across a number of jurisdictions, and authorities regularly consider enhanced or new regulatory requirements and seek to exercise their supervisory authority in new and more extensive ways. Regulators are generally concerned with the protection of policyholders above other constituencies, including our shareholders. Additional laws and regulations have been and may continue to be enacted that may have adverse effects on our operations, financial condition, statutory capital adequacy, and liquidity. We cannot predict the exact nature, timing or scope of these initiatives; however, we believe it is likely there will continue to be increased regulatory intervention in our industry in the future, and these initiatives could adversely affect our business.
In many of the jurisdictions in which we operate, including Bermuda, there are increased regulations relating to group supervision though cooperation and coordination among insurance regulators regardless of an individual company’s domiciliary jurisdiction. The BMA acts as our Group supervisor, as described in "Item 1. Business - Regulation" which has led to increased regulatory reporting and oversight.
The implementation of Solvency II, an E.U.-wide directive covering the capital adequacy, risk management and regulatory reporting for insurers, requires significant resources to ensure compliance by our E.U. companies. Additionally, if our non-E.U. subsidiaries engage in E.U. insurance or reinsurance business, additional capital requirements may be imposed for such companies to continue to insure or reinsure E.U.-domiciled risk or cedants if their regulatory regime is not deemed to have Solvency II equivalence. Bermuda has gained Solvency II equivalence, and our Bermuda reinsurers are subject to requirements in line with a Solvency II framework.
In the United States, the Dodd-Frank Act addresses the entire financial services industry and includes initiatives such as the creation of a Federal Insurance Office and other federal oversight agencies, the requiring of more transparency, accountability and focus in protecting investors and businesses, the input of shareholders regarding executive compensation, and the enhanced empowerment of regulators to punish fraud and unethical business practices. Continued compliance with these laws and regulations is likely to result in additional regulation and additional costs for us.
In addition, increased scrutiny by insurance regulators of investments in or acquisitions of insurers or insurance holding companies by private equity firms or hedge funds may result in imposition of additional regulatory requirements and restrictions. We have in the past partnered with private equity firms in making acquisitions and may do so in the future. This increased scrutiny may make it difficult to complete acquisitions with private equity or hedge funds should we seek to do so. In addition, private equity firms and hedge funds have invested in Enstar and may seek to do so in the future. This increased scrutiny may materially adversely impact our ability to raise capital through transactions with these types of investors.
Our business is subject to laws and regulations relating to sanctions and foreign corrupt practices, the violation of which could adversely affect our financial condition and results of operations.
We are legally required to comply with all applicable economic sanctions and anti-bribery laws and regulations of the jurisdictions in which we operate. U.S. laws and regulations applicable to our U.S. subsidiaries include the economic trade sanctions laws and regulations administered by the Treasury’s Office of Foreign Assets Control, as well as certain laws administered by the U.S. Department of State. New sanction regimes may be initiated, or existing sanctions expanded, at any time, which can impact our business activities. In addition, our companies are subject to the U.S. Foreign Corrupt Practices Act and other anti-bribery laws such as the Bermuda Bribery Act and the U.K. Bribery Act that generally bar corrupt payments or unreasonable gifts to foreign governments or officials. Although we have policies and controls in place that are designed to ensure compliance with these laws and regulations, it is possible that an employee or intermediary could fail to comply with applicable laws and regulations. In such event, we could be exposed to civil penalties, criminal penalties and other sanctions, including fines or other punitive actions. Such civil or criminal penalties, sanctions, fines or other punitive actions, and the possibility of resulting damage to our business and/or reputation, could have a material adverse effect on our financial condition and results of operations.
Table of Contents
30

The United Kingdom’s referendum vote to leave the European Union ("Brexit") could adversely affect our business.
There has been volatility in the global financial markets, including the foreign exchange markets, following the advisory referendum held on June 23, 2016, in which the United Kingdom voted to leave the European Union (commonly referred to as “Brexit”), and this is expected to continue. On March 29, 2017, Article 50 of the Lisbon Treaty was triggered, and following the successful passing of the Withdrawal Agreement Bill by the U.K. Parliament, the United Kingdom left the European Union on January 31, 2020. There was then an 11-month transition period during which European Union rules remained in force, which ended on December 31, 2020. On December 24, 2020, the United Kingdom and the European Union announced a Trade and Cooperation Agreement which took effect from January 1, 2021. However, the Trade and Cooperation Agreement did not address financial services in any material way, with the effect that there has been a “hard” Brexit in respect of financial services. The United Kingdom and the European Union are to negotiate and agree a Memorandum of Understanding in relation to financial services by March 31, 2021. It remains uncertain whether this will address issues such as market access or equivalence. For insurance/reinsurance companies based in the United Kingdom, there continues to be uncertainty regarding the nature of future insurance and reinsurance trading relationships with the European Union.
Risks Relating to our Operations We are dependent on our executive officers, directors and other key personnel and the loss of any of
these individuals could adversely affect our business. Our success depends on our ability to attract and retain qualified employees and upon the ability of our senior
management and other key employees to implement our business strategy. We believe that there are only a limited number of available qualified personnel in the businesses in which we compete, and the pool of highly skilled employees available to fill key positions at our companies may fluctuate based on market conditions. We rely substantially upon the services of our executive officers and our subsidiaries’ executive officers and directors, as well as our local management teams, to implement our business strategies. The loss of the services of any of our management or other key personnel, or the loss of the services of or our relationships with any of our directors, could have a material adverse effect on our business. Higher demand for employees with appropriate skills could lead to increased compensation expectations for existing and prospective personnel across our organization, which could also make it difficult to maintain compensation expenses at desired levels.
Some of our directors, large shareholders and their affiliates have interests and/or other involvement with entities that can create conflicts of interest, through related party transactions or competition.
We have participated in transactions, investments and investment management arrangements in which one or more of our directors, large shareholders or their affiliates has an interest, and we may continue to do so in the future. These matters, called related party transactions, are described in Note 21 - "Related Party Transactions" in the notes to our consolidated financial statements included in Item 8 of this Annual Report. In addition, some of our directors, large shareholders or their affiliates from time to time have ownership interests or other involvement with entities that compete against us or otherwise have interests that could, at times, be considered potentially adverse to us, either in the pursuit of acquisition targets, investments or in our business operations. The interests of our directors, large shareholders or their affiliates in related party transactions or competitive businesses may create the potential for, or result in, conflicts of interests.
Cybersecurity events or other difficulties with our information technology systems could disrupt our business, result in the loss of critical and confidential information, increased costs, and adversely impact our reputation and results of operations.
We rely heavily on the successful, uninterrupted functioning of our information technology systems, as well as those of any third-party service providers we use. We rely on these systems to securely and accurately process, store, and transmit confidential and other data in connection with our critical operational functions such as paying claims, performing actuarial and other modeling, pricing, quoting and processing policies, cash and investment management, acquisition analysis, financial reporting and other necessary support functions. Our information may also be exposed to the risk of a data breach or cyber-security incident through a breach or failure of our systems or a breach or failure of the systems of third parties where we rely on such parties for outsourced functions or services. A failure of our information technology systems or those of our third-party service providers could materially impact our ability to perform the critical functions described above, affect the confidentiality, availability or integrity of our proprietary information and expose us to litigation and increase our administrative expenses.
Computer viruses, cyber-attacks, phishing scams and other external hazards, as well as any internal process or employee failures, could expose our information technology systems to security breaches that may cause critical data to be corrupted or confidential or proprietary information to be exposed, cause system disruptions or shut-
Table of Contents
31
downs, or expose us to financial fraud. In addition to our own information, we receive and may be responsible for protecting confidential or personal information of ceding companies, policyholders, employees, and other third parties, which could also be compromised in the event of a security breach.
Although we utilize numerous controls, protections and risk management strategies to attempt to mitigate these risks, and management is not aware of a material cyber-security incident to date, the sophistication and volume of these security threats continues to increase. We may not have the technical expertise or resources to successfully prevent every data breach or cyber-security incident. The potential consequences of a data breach or cyber-security incident could include claims against us, significant reputational damage to our company, damage to our business as a result of disclosure of proprietary information, and regulatory action against us, which may include fines and penalties. Such an incident could cause us to lose business and commit resources, management time and money to remediate these breaches and notify aggrieved parties, any of which in turn could have an adverse impact on our business. We may also experience increasing costs associated with implementing and maintaining adequate safeguards against these types of incidents and attacks.
In addition, the information security and data privacy regulatory environment is increasingly demanding. We are subject to numerous laws and regulations in multiple jurisdictions governing the protection of the personal and confidential information of our clients and/or employees, including in relation to medical records and financial information. These laws and regulations are rapidly expanding, increasing in complexity and sometimes conflict between jurisdictions. For example, the E.U. General Data Protection Regulation ("GDPR") creates rights for individuals to control their personal data and sets forth the requirements with which companies handling the personal data of E.U.-based data subjects have to comply (regardless of whether such data handling involves E.U.-based operations). We are also subject to the GDPR through our handling of the personal data of E.U.-based subjects in connection with our ordinary course operations. If any person, including any of our employees or those with whom we share such information, negligently disregards or intentionally breaches our established controls with respect to our client data, or otherwise mismanages or misappropriates that data, we could be subject to significant monetary damages, regulatory enforcement actions, fines and/or criminal prosecution in one or more jurisdictions, including as a result of a violation of the GDPR.
If outsourced providers such as third-party administrators, investment managers or other service providers were to breach obligations owed to us, our business and results of operations could be adversely affected.
We outsource certain business functions to third-party providers, and these providers may not perform as anticipated or may fail to adhere to their obligations to us. For example, certain of our subsidiaries rely on relationships with a number of third-party administrators under contracts pursuant to which these third-party administrators manage and pay claims on our subsidiaries’ behalf and advise with respect to case reserves. In these relationships, we rely on controls incorporated in the provisions of the administration agreement, as well as on the administrator’s internal controls, to manage the claims process within our prescribed parameters. We also rely on external investment managers to provide services pursuant to the terms of our investment management agreements, including following established investment guidelines. Although we monitor these administrators, agents and producers, and investment managers on an ongoing basis, our monitoring efforts may not be adequate or our service providers could exceed their authorities or otherwise breach obligations owed to us, which, if material, could adversely affect our business and results of operations.
Risks Relating to Taxation U.S. tax reform legislation, various international tax transparency and economic substance initiatives,
and possible future tax reform legislation and regulations could materially affect us and our shareholders.On December 22, 2017, the US government enacted comprehensive tax legislation commonly referred to as
the Tax Cuts and Jobs Act (the “Tax Act”). The Tax Act is broad and contains many provisions that have significant implications on us, and potentially on our shareholders.
In particular, the Tax Act includes modifications of the taxation of non-U.S. companies owned by U.S. shareholders. Certain aspects of the Tax Act require clarification through future regulatory action and accordingly, we are still unable to definitively determine the impact to our shareholders. The Tax Act has increased the likelihood that we or our non-U.S. subsidiaries or joint ventures managed by us will be deemed a “controlled foreign corporation” (CFC) within the meaning of the Internal Revenue Code of 1986, as amended (the “Code”) for U.S. federal tax purposes. Specifically, the Tax Act expands the definition of “United States shareholder” for CFC purposes to include U.S. persons who own, directly or constructively, 10% or more of the value of a non-U.S. corporation’s shares, rather than looking only to voting power held. The Tax Act also expands certain attribution rules for share ownership in a way that would cause non-U.S. subsidiaries to now be treated as CFCs if owned in a
Table of Contents
32

group, such as Enstar, that has a non-U.S. parent company and also includes at least one U.S. subsidiary. In the event a corporation is characterized as a CFC, any “United States shareholder” of the CFC is required to include in taxable income each year the shareholder’s proportionate share of certain insurance and related investment income for the taxable year, even if such income is not distributed.
The Tax Act also contains modifications to certain provisions relating to passive foreign investment company (“PFIC”) status including an exception for foreign insurance companies ("PFIC insurance exception"). PFIC characterization of the Company under these rules could result in adverse tax consequences to U.S. persons who own our ordinary shares. On July 10, 2019, the U.S. Internal Revenue Service and Department of the Treasury released proposed regulations relating to PFICs with potential impact on foreign insurance companies and their investors, and other participants in transactions involving foreign insurers. On December 4, 2020, the U.S. Internal Revenue Service and Department of Treasury issued final and newly proposed regulations relating to PFIC status that finalized many of the July 10, 2019 proposed rules. In particular, the proposed rules (i) modify the active conduct percentage test to include a lower threshold for attributing the activities of related parties, (ii) include a safe harbor test, and (iii) provide for an alternative facts-and-circumstances test. Under the Tax Act, and final and newly proposed regulations if they are assumed to be effective today, we believe that the Company is not a PFIC as our non-U.S. subsidiaries that are insurance companies meet the PFIC insurance exception as they are qualifying insurance companies whose income is derived in the "active conduct of an insurance business". Enstar and our domestic insurance companies meet the qualifying domestic company exception.
The United States and other countries and governing bodies have also enacted reform legislation aimed at increasing transparency on companies’ global tax footprint and profile. The Organization for Economic Co-operation and Development (the "OECD") is an intergovernmental economic organization founded to stimulate economic progress and trade. It develops economic policy recommendations to encourage policy reform in member countries. Created by the OECD under the initiative known as the “Base Erosion and Profit Shifting Project (“BEPS”), the OECD Pillar I and Pillar II initiatives are intended to address the growing digital economy and move the traditional physical-based taxing schemes to a more nexus-based taxing scheme (Pillar I) coupled with a minimum tax (Pillar II). The OECD working groups introduced a proposed framework for the Pillar I and Pillar II rules on October 12, 2020. While the Pillar I framework suggests a new revenue-based approach for a country to impose taxing rights over a company, insurance and other finance companies are expressly exempt from the rules. The proposed framework for Pillar II provides a sweeping minimum tax for a multinational group that is either collected at the top group company to the extent located in a taxing jurisdiction, or provides mechanisms to allow taxing jurisdictions of subsidiaries to collect the tax liability of the group, subject to certain limitations. There may be a possibility that we will be subject to the minimum tax rules under Pillar II. Much is unknown about the Pillar II rules at this time, including the agreed upon minimum tax rate, specifics related to the calculation of the potential minimum tax base, and whether the Pillar II rules would be unanimously agreed upon by OECD member nations and adopted globally. Accordingly, should we become subject to the Pillar II rules in the future, this could have a material adverse impact on our business operations.
We are currently not subject to tax in Bermuda. Under the Exempted Undertakings Tax Protection Act 1996, we have assurance that any legislation imposing an income, capital, or similar tax before March 31, 2035 will not apply to us. Given limitations imposed under this assurance, we cannot be certain that we will not be subject to tax after March 31, 2035. If we are subject to tax in Bermuda, this could have a material adverse impact on our business operations.
U.S. persons who own our ordinary shares might become subject to adverse U.S. tax consequences as a result of "related person insurance income," if any, of our non-U.S. insurance company subsidiaries.
For any of our wholly-owned non-U.S. insurance company subsidiaries, if (1) U.S. persons are treated as owning 25% or more of our shares, (2) the related person insurance income ("RPII") of that subsidiary were to equal or exceed 20% of its gross insurance income in any taxable year, and (3) direct or indirect insureds of that subsidiary (and persons related to such insureds) own (or are treated as owning) 20% or more of the voting power or value of our shares, then a U.S. person who owns our shares directly, or indirectly through non-U.S. entities, on the last day of the taxable year would be required to include in income for U.S. federal income tax purposes that person's pro rata share of the RPII of such a non-U.S. insurance company for the entire taxable year, whether or not any such amounts are actually distributed. In the case of any of our partially-owned non-U.S. insurance company subsidiaries, the RPII provisions apply similarly, except that the percentage share ownership thresholds described in the preceding sentence are measured in terms of indirect ownership of the subsidiary’s shares rather than in terms of ownership of our shares.
Moreover, if the RPII rules of the Code were to apply to any of our non-U.S. insurance company subsidiaries, any RPII that is includible in the income of a U.S. tax-exempt organization would generally be treated as unrelated
Table of Contents
33
business taxable income. We and our subsidiaries may not be able to operate in a manner such that we avoid exceeding the foregoing thresholds for application of the RPII rules. Accordingly, U.S. persons who own our ordinary shares may be required to recognize gross income inclusions attributable to RPII.
In addition, the RPII rules provide that if a shareholder who is a U.S. person disposes of shares in a foreign insurance company that has RPII and in which U.S. persons collectively own 25% or more of the total combined voting power of all classes of stock entitled to vote, or the total value of the stock, any gain from the disposition will generally be treated as dividend income to the extent of the shareholder’s share of the corporation’s undistributed earnings and profits that were accumulated during the period that the shareholder owned the shares (whether or not those earnings and profits are attributable to RPII). Such a shareholder would also be required to comply with certain reporting requirements, regardless of the amount of shares owned by the shareholder. These rules should not apply to dispositions of our ordinary shares because we will not be directly engaged in the insurance business. The RPII rules have not been interpreted by the courts or the IRS and regulations interpreting the RPII rules exist only in proposed form. Accordingly, our views as to the inapplicability of these rules to a disposition of our ordinary shares may not be accepted by the IRS or a court.
We might incur unexpected U.S., U.K., Australia, or other tax liabilities if companies in our group that are incorporated outside those jurisdictions are determined to be carrying on a trade or business in such jurisdictions.
We and a number of our subsidiaries are companies formed under the laws of Bermuda or other jurisdictions that do not impose income taxes, and it is our contemplation that these companies will not incur substantial income tax liabilities from their operations. Because the operations of these companies generally involve, or relate to, the insurance or reinsurance of risks that arise in higher tax jurisdictions, such as the United States, the United Kingdom and Australia, it is possible that the taxing authorities in those jurisdictions may assert that the activities of one or more of these companies creates a sufficient nexus in that jurisdiction to subject the company to income tax in such jurisdiction. There are uncertainties in how the relevant rules apply to insurance businesses, and in our eligibility for favorable treatment under applicable tax treaties. Accordingly, it is possible that our tax liabilities could be adversely impacted, which could reduce our net earnings.
Risks Relating to Ownership of our Shares The market price for our ordinary shares and the depositary shares representing our preferred shares
may experience volatility, thereby causing a potential loss of value to our investors.The market price for our ordinary shares may fluctuate substantially and could cause investment losses due
to, among other things, the following factors:
• announcements with respect to an acquisition or investment;
• changes in the value of our assets;
• our financial condition, performance and prospects, including our quarterly and annual operating results;
• sales, or the possibility or perception of future sales, by our existing shareholders;
• changes in general conditions in the economy and the insurance industry;
• economic, financial, geopolitical, regulatory or judicial events that affect us or the financial markets generally; and
• adverse press or news announcements.
The market price for our depositary shares representing our preferred shares may fluctuate substantially and could cause investments losses due to, among other things and in addition to the factors listed above, the following:
• whether dividends have been declared and are likely to be declared on the preferred shares from time to time;
• whether the ratings on the depositary shares representing our preferred shares provided by any ratings agency have changed;
• changes in our credit ratings or the ratings of our insurance subsidiaries’ financial strength and claims paying ability published by major credit ratings agencies;
• the amount of total indebtedness we have outstanding;
• the level, direction and volatility of market interest rates generally;
Table of Contents
34

• the effect on dividend yield of any of the alternative methods described in the certificate of designations relating to our series D preferred shares for determining the applicable based rate used to calculate the dividend rate on such preferred shares following the discontinuation of LIBOR; and
• the market for similar securities.
A few significant shareholders may influence or control the direction of our business. If the ownership of our ordinary shares continues to be highly concentrated, it may limit the ability of other shareholders to influence significant corporate decisions.
We have several shareholders with large interests, including several that may be affiliated with members of our Board of Directors. The interests of certain significant shareholders, including those affiliated with members of our Board of Directors, may not be fully aligned with those of other shareholders, and this may lead to a strategy that is not in such other shareholders’ best interests. As of December 31, 2020, CPPIB, funds managed by Hillhouse Capital Advisors Ltd. and its affiliates, funds managed by Stone Point and its affiliates, Beck Mack & Oliver, and two of Enstar's executive officer co-founders (collectively) beneficially owned 12.1%, 9.4%, 8.8%, 3.8% and 4.5%, respectively, of our outstanding voting ordinary shares. CPPIB owns additional non-voting ordinary shares that, together with its voting shares, represented an economic interest of 17.4% as of December 31, 2020. Hillhouse owns additional non-voting shares and warrants that, together with its voting shares, represented an economic interest of 16.6% as of December 31, 2020.
Although they do not act as a group, the shareholders identified above may exercise significant influence over matters requiring shareholder approval, and their concentrated holdings may delay or deter possible changes in control of Enstar, which may reduce the market price of our ordinary shares.
Some aspects of our corporate structure may discourage third-party takeovers and other transactions or prevent the removal of our board of directors and management.
Some provisions of our bye-laws have the effect of making more difficult or discouraging unsolicited takeover bids from third parties or preventing the removal of our current board of directors and management. In particular, our bye-laws provide for a classified board, whose members may be removed by our shareholders only for cause by a majority vote, and contain restrictions on the ability of shareholders to nominate persons to serve as directors, submit resolutions to a shareholder vote and request special general meetings. In addition, our board of directors may limit a shareholder’s exercise of voting rights where it deems it necessary to do so to avoid adverse tax, legal or regulatory consequences. We also have the authority under our bye-laws to reasonably request information from any shareholder for the purpose of determining whether a shareholder’s voting rights are to be limited pursuant to the bye-laws. If a shareholder fails to respond to our request for information or submits incomplete or inaccurate information in response to a request by us, we may, in our reasonable discretion, eliminate the shareholder’s voting rights. These provisions may encourage persons seeking to acquire control of us to negotiate with our directors, which we believe would generally best serve the interests of our shareholders. In addition, these bye-law provisions may prevent the removal of our current board of directors and management. To the extent these provisions discourage takeover attempts, they may deprive shareholders of opportunities to realize takeover premiums for their shares or may depress the market price of the shares.
There are regulatory limitations on the ownership and transfer of our ordinary shares. Insurance laws and regulations in the jurisdictions in which our (re)insurance subsidiaries operate require
prior notices or regulatory approval of changes in control of an insurer or its holding company. Different jurisdictions define changes in control differently, and generally any purchaser of 10% or more of the vote or value of our ordinary shares could become subject to regulation and be required to file certain notices and reports with the applicable insurance authorities. These laws may discourage potential acquisition proposals and may delay, deter or prevent a change in control of us, including transactions that some shareholders might consider to be desirable.
Our board of directors may decline to register a transfer of our ordinary shares under certain circumstances.
Our board of directors may decline to register a transfer of ordinary shares under certain circumstances, including if it has reason to believe that any non-de minimis adverse tax, regulatory or legal consequences to us, any of our subsidiaries or any of our shareholders may occur as a result of such transfer. Further, our bye-laws provide us with the option to repurchase, or to assign to a third party the right to purchase, the minimum number of shares necessary to eliminate any such non-de minimis adverse tax, regulatory or legal consequence. In addition, our board of directors may decline to approve or register a transfer of shares unless all applicable consents, authorizations, permissions or approvals of any governmental body or agency in Bermuda, the United States, the United Kingdom and other applicable jurisdictions required to be obtained prior to such transfer shall have been
Table of Contents
35

obtained. The proposed transferor of any shares will be deemed to own those shares for dividend, voting and reporting purposes until a transfer of such shares has been registered on our shareholder register. It is our understanding that while the precise form of the restrictions on transfer contained in our bye-laws is untested, as a matter of general principle, restrictions on transfers are enforceable under Bermuda law and are not uncommon. These restrictions on transfer may also have the effect of delaying, deferring or preventing a change in control.
Our ordinary shares are thinly traded, and the market value of our ordinary shares may decline if large numbers of shares are sold.
Pursuant to our contractual obligations, on October 10, 2017, we filed a resale registration statement covering 9.8 million ordinary shares (including voting ordinary shares issuable upon conversion of outstanding non-voting ordinary shares) primarily held by CPPIB, Hillhouse and Trident. Upon effectiveness of the resale registration statement on December 13, 2018, a large number of ordinary shares became freely tradable without restrictions under the Securities Act. Our ordinary shares have in the past been, and may from time to time continue to be, thinly traded, and significant sales could adversely affect the market price for our ordinary shares and impair our ability to raise capital through offerings of our equity securities.
Shareholders who own our shares may have more difficulty in protecting their interests than shareholders of a U.S. corporation.
The Bermuda Companies Act (the "Companies Act"), which applies to us, differs in certain material respects from laws generally applicable to U.S. corporations and their shareholders. As a result of these differences, shareholders who own our shares may have more difficulty protecting their interests than shareholders who own shares of a U.S. corporation. For example, class actions and derivative actions are generally not available to shareholders under Bermuda law. Under Bermuda law, only shareholders holding collectively 5% or more of our outstanding ordinary shares or groups of shareholders numbering 100 or more are entitled to propose a resolution at our general meeting.
In addition, certain of our officers and directors reside in countries outside the United States. A substantial portion of our assets and the assets of these officers and directors are located outside the United States. Investors may therefore have difficulty effecting service of process within the United States on our directors and officers who reside outside the United States or recovering against us or these directors and officers on judgments of U.S. courts based on civil liabilities provisions of the U.S. federal securities laws even though we have appointed an agent in the United States to receive service of process. Further, no claim may be brought in Bermuda against us or our directors and officers for violation of U.S. federal securities laws, as such laws do not have force of law in Bermuda.
Further, we believe that there is doubt as to whether the courts of Bermuda would enforce judgments of U.S. courts obtained in actions against us or our directors and officers, as well as our independent auditors, predicated upon the civil liability provisions of the U.S. federal securities laws or original actions brought in Bermuda against us or these persons predicated solely upon U.S. federal securities laws. There is no treaty in effect between the United States and Bermuda providing for the enforcement of judgments of U.S. courts, and there are grounds upon which Bermuda courts may not enforce judgments of U.S. courts. Some remedies available under the laws of U.S. jurisdictions, including some remedies available under the U.S. federal securities laws, may not be allowed in Bermuda courts as they may be contrary to that jurisdiction’s public policy. Because judgments of U.S. courts are not automatically enforceable in Bermuda, it may be difficult for you to recover against us based upon such judgments.
Certain regulatory and other constraints may limit our ability to pay dividends on our securities.We do not currently intend to pay a cash dividend on our ordinary shares. Our strategy is to retain earnings
and invest distributions from our operating subsidiaries into our business. As a result, capital appreciation, if any, on our ordinary shares may be your sole source of gain for the foreseeable future. In the event our Board decided to commence a dividend program in the future, we are subject to significant regulatory and other constraints that affect our ability to pay dividends and make other distributions on our ordinary and preferred shares. For example, under the Bermuda Companies Act, we may declare or pay a dividend or distribution out of contributed surplus only if we have reasonable grounds to believe that we are, and would after the payment be, able to meet our liabilities as they become due or that the realizable value of our assets would thereby not be less than our liabilities. In addition, as described above under “Risks Relating to Liquidity and Capital Resources,” we are a holding company that is dependent upon distributions from our operating subsidiaries for liquidity, which may not be available.
Table of Contents
36
Dividends on our preferred shares are non-cumulative.Dividends on our preferred shares are non-cumulative and payable only out of available funds under
Bermuda law. If our board of directors (or a duly authorized committee of the board) does not authorize and declare a dividend for any dividend period, holders of our preferred shares and, in turn, the depositary shares representing preferred shares, would not be entitled to receive any such dividend, and such unpaid dividend will not accrue and will not be payable at any time. We will have no obligation to pay dividends for a dividend period on or after the dividend payment date for such period if our board of directors (or a duly authorized committee of the board) has not declared such dividend before the related dividend payment date, whether or not dividends are declared for any subsequent dividend period with respect to any outstanding preferred shares and/or our ordinary shares.
Our ordinary and preferred shares are subordinate to our existing and future indebtedness.Our preferred shares are equity interests and do not constitute indebtedness. As such, the preferred shares,
in addition to our ordinary shares, will rank junior to all of our indebtedness and other non-equity claims with respect to assets available to satisfy our claims, including in our liquidation. The preferred shares are also contractually subordinated in right of payment to all obligations of our subsidiaries including all existing and future policyholder obligations of our subsidiaries. Additionally, neither our ordinary shares nor our preferred shares represent an interest in any of our subsidiaries, and accordingly, are structurally subordinated to all obligations of our subsidiaries.
There is no limitation on our issuance of securities that rank equally with or senior to the preferred shares.
We may issue, without limitation, (1) additional depositary shares representing additional preferred shares that would form part of one of the series of depositary shares representing our outstanding preferred shares, and (2) additional series of securities that rank equally with or senior to the outstanding preferred shares. The issuance of additional preferred shares on par with or senior to the outstanding preferred shares would dilute the interests of the holders of our preferred shares, and any issuance of preferred shares senior to our outstanding preferred shares or of additional indebtedness could affect our ability to pay dividends on, redeem or pay the liquidation preference on our preferred shares, or to make payments to holders of our ordinary shares from remaining assets of the Company, in the event of a liquidation, dissolution or winding-up of Enstar.
Our ordinary shares rank junior to our outstanding preferred shares in the event of a liquidation, winding up or dissolution of the Company.
In the event of a liquidation, winding up or dissolution of the Company, our ordinary shares rank junior to our outstanding preferred shares. In such an event, there may not be sufficient assets remaining after payments to holders of our outstanding preferred shares to ensure payments to holders of ordinary shares.
Under certain limited circumstances, the terms of the preferred shares may change without the holders’ consent or approval.
Under the terms of our outstanding preferred shares, at any time following specified tax or capital disqualification events, we may, without the consent of any holders of the preferred shares, vary the terms of the preferred shares such that they remain securities, or exchange the preferred shares for new securities, which (i) in the case of a tax event, would eliminate the substantial probability that we or any successor company would be required to pay any additional amounts with respect to such preferred shares as a result of a change in tax law or (ii) in the case of a capital disqualification event, for purposes of determining the solvency margin, capital adequacy ratios or any other comparable ratios, regulatory capital resource or level of Enstar Group or any member thereof, where subdivided into tiers, qualify as Tier 2 capital securities under then-applicable capital adequacy regulations imposed upon us by the BMA (or any successor agency or then-applicable regulatory authority) which would include, without limitation, the ECR. However, our exercise of this right is subject to certain conditions, including that the terms considered in the aggregate cannot be less favorable to the holders of the applicable preferred shares than the terms of such securities prior to being varied or exchanged.
The voting rights of holders of our preferred shares and, in turn, the depositary shares representing the preferred shares are limited.
Holders of our outstanding preferred shares and, in turn, the depositary shares representing the preferred shares have no voting rights with respect to matters that generally require the approval of voting shareholders. In addition, if dividends on any of our outstanding preferred shares have not been declared or paid for the equivalent of six dividend payments, whether or not for consecutive dividend periods, holders of the outstanding preferred shares and, in turn, the depositary shares, will, subject to the terms and conditions contained in the certificates of designation governing the preferred shares, be entitled to vote for the election of two additional directors to our
Table of Contents
37

board of directors. The holders shall be divested of the foregoing voting rights if and when dividends for at least four dividend periods, whether or not consecutive, following a nonpayment event have been paid in full (or declared and a sum sufficient for such payment shall have been set aside). In addition, holders of the depositary shares must act through the depositary to exercise any voting rights in respect of the preferred shares. Although each depositary share is entitled to 1/1,000th of a vote, the depositary can vote only whole preferred shares. While the depositary will vote the maximum number of whole preferred shares in accordance with the instructions it receives, any remaining votes of holders of the depositary shares will not be voted.
We have no obligation to maintain any listing of the depositary shares representing our outstanding preferred shares.
Although the depositary shares representing our outstanding preferred shares are listed on NASDAQ, such listings may not provide significant liquidity, and transaction costs in any secondary market could be high. The difference between bid and ask prices in any secondary market could be substantial. As a result, holders of depositary shares representing our preferred shares (which do not have a maturity date) may be required to bear the financial risks of an investment in the depositary shares representing preferred shares for an indefinite period of time. We do not expect that there will be any separate public trading market for the preferred shares except as represented by the depositary shares. In addition, we undertake no obligation, and expressly disclaim any obligation, to maintain the listing of the depositary shares representing our preferred shares on NASDAQ or any other stock exchange. If we elect to discontinue the listing at any time or the depositary shares representing the preferred shares otherwise are not listed on an applicable stock exchange, the dividends paid after the delisting would not constitute qualified dividend income for U.S. federal income tax purposes. This is because dividends paid by a Bermuda corporation are qualified dividend income only if the stock with respect to which the dividends are paid is readily tradable on an established securities market in the United States.
A classification of the depositary shares representing our preferred shares by the National Association of Insurance Commissioners may impact U.S. insurance companies that purchase our preferred shares.
The National Association of Insurance Commissioners (the “NAIC”) may from time to time, in its discretion, classify securities in U.S. insurers’ portfolios as debt, preferred equity or common equity instruments. The NAIC’s written guidelines for classifying securities as debt, preferred equity or common equity include subjective factors that require the relevant NAIC examiner to exercise substantial judgment in making a classification. There is therefore a risk that the depositary shares representing our preferred shares may be classified by the NAIC as common equity instead of preferred equity. The NAIC classification determines the amount of risk-based capital (“RBC”) charges incurred by insurance companies in connection with an investment in a security. Securities classified as common equity by the NAIC carry RBC charges that can be significantly higher than the RBC requirement for debt or preferred equity. Therefore, any classification of the depositary shares representing our preferred shares as common equity may adversely affect U.S. insurance companies that hold depositary shares representing our preferred shares. In addition, a determination by the NAIC to classify the depositary shares representing our preferred shares as common equity may adversely impact the trading of the depositary shares representing our preferred shares in the secondary market.
Our preferred shares are subject to our rights of redemption.Our preferred shares are redeemable pursuant to the terms set forth in the certificate of designations
governing such series. Whenever we redeem preferred shares held by the depositary, the depositary will, as of the same redemption date, redeem the number of depositary shares representing preferred shares so redeemed. We have no obligation to redeem or repurchase the preferred shares under any circumstances. If the preferred shares are redeemed by us, you may not be able to reinvest the redemption proceeds in a comparable security at a similar return on your investment.
ITEM 1B. UNRESOLVED STAFF COMMENTSNot applicable.
ITEM 2. PROPERTIESWe renew and enter into new leases in the ordinary course of our business. We lease office space in
Hamilton, Bermuda, where our principal executive office is located. We also lease office space in a number of U.S. states, the United Kingdom, Australia and several Continental European countries. We believe that this office space is sufficient for us to conduct our current operations for the foreseeable future, although in connection with future acquisitions from time to time, we may expand to different locations or increase space to support any such growth.
Table of Contents
38

In connection with the acquisition of DCo, LLC ("DCo") in December 2016, we acquired properties in the United States. The acquired properties have no present value and are not used to run our operations.
ITEM 3. LEGAL PROCEEDINGSFor a discussion of legal proceedings, see Note 23 - "Commitments and Contingencies" in the notes to our
consolidated financial statements included in Item 8 of this Annual Report on Form 10-K, which is incorporated herein by reference.
ITEM 4. MINE SAFETY DISCLOSURESNot applicable.
Table of Contents
39
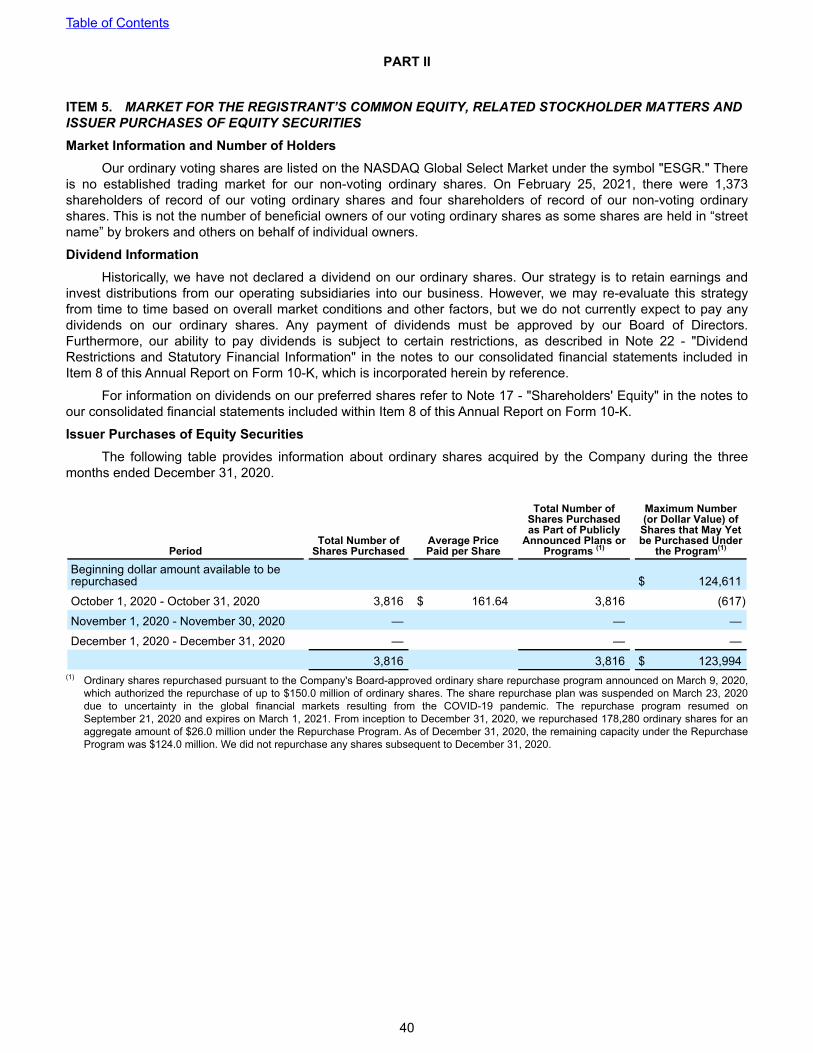
PART II
ITEM 5. MARKET FOR THE REGISTRANT’S COMMON EQUITY, RELATED STOCKHOLDER MATTERS AND ISSUER PURCHASES OF EQUITY SECURITIESMarket Information and Number of Holders
Our ordinary voting shares are listed on the NASDAQ Global Select Market under the symbol "ESGR." There is no established trading market for our non-voting ordinary shares. On February 25, 2021, there were 1,373 shareholders of record of our voting ordinary shares and four shareholders of record of our non-voting ordinary shares. This is not the number of beneficial owners of our voting ordinary shares as some shares are held in “street name” by brokers and others on behalf of individual owners.
Dividend InformationHistorically, we have not declared a dividend on our ordinary shares. Our strategy is to retain earnings and
invest distributions from our operating subsidiaries into our business. However, we may re-evaluate this strategy from time to time based on overall market conditions and other factors, but we do not currently expect to pay any dividends on our ordinary shares. Any payment of dividends must be approved by our Board of Directors. Furthermore, our ability to pay dividends is subject to certain restrictions, as described in Note 22 - "Dividend Restrictions and Statutory Financial Information" in the notes to our consolidated financial statements included in Item 8 of this Annual Report on Form 10-K, which is incorporated herein by reference.
For information on dividends on our preferred shares refer to Note 17 - "Shareholders' Equity" in the notes to our consolidated financial statements included within Item 8 of this Annual Report on Form 10-K.
Issuer Purchases of Equity SecuritiesThe following table provides information about ordinary shares acquired by the Company during the three
months ended December 31, 2020.
PeriodTotal Number of
Shares PurchasedAverage Price Paid per Share
Total Number of Shares Purchased as Part of Publicly
Announced Plans or Programs (1)
Maximum Number (or Dollar Value) of
Shares that May Yet be Purchased Under
the Program(1)
Beginning dollar amount available to be repurchased $ 124,611
October 1, 2020 - October 31, 2020 3,816 $ 161.64 3,816 (617)
November 1, 2020 - November 30, 2020 — — —
December 1, 2020 - December 31, 2020 — — —
3,816 3,816 $ 123,994 (1) Ordinary shares repurchased pursuant to the Company's Board-approved ordinary share repurchase program announced on March 9, 2020,
which authorized the repurchase of up to $150.0 million of ordinary shares. The share repurchase plan was suspended on March 23, 2020 due to uncertainty in the global financial markets resulting from the COVID-19 pandemic. The repurchase program resumed on September 21, 2020 and expires on March 1, 2021. From inception to December 31, 2020, we repurchased 178,280 ordinary shares for an aggregate amount of $26.0 million under the Repurchase Program. As of December 31, 2020, the remaining capacity under the Repurchase Program was $124.0 million. We did not repurchase any shares subsequent to December 31, 2020.
Table of Contents
40

Performance GraphThe following performance graph compares the cumulative total return on our ordinary shares with the
cumulative total return on the NASDAQ Composite Index, NASDAQ Insurance Index, S&P 500 Index and the S&P Property & Casualty Insurance Index for the period that commenced December 31, 2015 and ended on December 31, 2020. The performance graph shows the value as of December 31 of each calendar year of $100 invested on December 31, 2015 in our ordinary shares, and the indices listed above, assuming the reinvestment of dividends. Returns have been weighted to reflect relative market capitalization. This information is not necessarily indicative of future returns.
Comparison of 5 Year Cumulative Total Return
Enstar Group Limited NASDAQ Composite IndexNASDAQ Insurance Index S&P 500 IndexS&P Property & Casualty Index
2015 2016 2017 2018 2019 2020$100
$125
$150
$175
$200
$225
$250
$275
Indexed Returns* for Years Ended December 31,2015 2016 2017 2018 2019 2020
Enstar Group Limited 100.00 131.76 133.80 111.68 137.87 136.56 NASDAQ Composite Index 100.00 108.87 141.13 137.12 187.44 271.64 NASDAQ Insurance Index 100.00 120.29 135.28 122.28 159.58 165.14 S&P 500 Index 100.00 111.96 136.40 130.42 171.49 203.04 S&P Property & Casualty Index 100.00 117.57 143.23 133.47 168.46 179.76
*$100 invested on December 31, 2015 in stock or index, including reinvestment of dividends.
In addition to the NASDAQ Composite and Insurance Indices, we have added the S&P 500 and S&P Property & Casualty Indices to the 2020 performance graph. The NASDAQ Composite Index is more heavily weighted to the technology sector as compared to the S&P 500 Index, so we believe the S&P 500 Index is a more appropriate benchmark. Furthermore, the majority of our peers benchmark against both the S&P 500 and S&P Property & Casualty Indices.
ITEM 6. SELECTED FINANCIAL DATAOmitted at the Company's option.
Table of Contents
41

ITEM 7. MANAGEMENT’S DISCUSSION AND ANALYSIS OF FINANCIAL CONDITION AND RESULTS OF OPERATIONS
The following discussion and analysis of our financial condition and results of operations should be read in conjunction with our consolidated financial statements and the related notes included elsewhere in this annual report. Some of the information contained in this discussion and analysis or included elsewhere in this annual report, including information with respect to our plans and strategy for our business, includes forward-looking statements that involve risks, uncertainties and assumptions. Our actual results and the timing of events could differ materially from those anticipated by these forward-looking statements as a result of many factors, including those discussed under "Cautionary Statement Regarding Forward-Looking Statements", "Item 1A. Risk Factors" and elsewhere in this annual report.
The StarStone U.S. business qualifies as a discontinued operation; therefore, prior period amounts have been reclassified to conform to the current period presentation. For further information, refer to Note 5 - "Divestitures, Held-for-Sale Businesses and Discontinued Operations" in the notes to our consolidated financial statements included within Item 8 of this Annual Report on Form 10-K. These reclassifications had no impact on net earnings, the Non-life Run-off segment, the Atrium segment or other activities; however, these reclassifications did impact our consolidated results of operations and our StarStone segment results of operations.
For a comparison of our results of operations for the Non-life Run-off segment, the Atrium segment and other activities for the fiscal years ended December 31, 2019 and 2018, see Part II, Item 7. Management’s Discussion and Analysis of Financial Condition and Results of Operations of our annual report on Form 10-K for the fiscal year ended December 31, 2019, filed with the Securities and Exchange Commission ("SEC") on February 27, 2020.
Table of Contents
Section PageBusiness Overview . . . . . . . . . . . . . . . . . . . . . . . . . . . . . . . . . . . . . . . . . . . . . . . . . . . . . . . . . . . . . . . . . 42
Key Performance Indicator . . . . . . . . . . . . . . . . . . . . . . . . . . . . . . . . . . . . . . . . . . . . . . . . . . . . . . . . . 42Non-GAAP Financial Measure . . . . . . . . . . . . . . . . . . . . . . . . . . . . . . . . . . . . . . . . . . . . . . . . . . . . . . . 44Underwriting Ratios . . . . . . . . . . . . . . . . . . . . . . . . . . . . . . . . . . . . . . . . . . . . . . . . . . . . . . . . . . . . . . . 45Current Outlook . . . . . . . . . . . . . . . . . . . . . . . . . . . . . . . . . . . . . . . . . . . . . . . . . . . . . . . . . . . . . . . . . . 45
Consolidated Results of Operations — for the Years Ended December 31, 2020, 2019 and 2018 . . . . 47Results of Operations by Segment — for the Years Ended December 31, 2020, 2019 and 2018 . . . . 49
Non-life Run-off Segment . . . . . . . . . . . . . . . . . . . . . . . . . . . . . . . . . . . . . . . . . . . . . . . . . . . . . . . . . . 50Atrium Segment . . . . . . . . . . . . . . . . . . . . . . . . . . . . . . . . . . . . . . . . . . . . . . . . . . . . . . . . . . . . . . . . . . 55StarStone Segment . . . . . . . . . . . . . . . . . . . . . . . . . . . . . . . . . . . . . . . . . . . . . . . . . . . . . . . . . . . . . . . 58
Other Activities . . . . . . . . . . . . . . . . . . . . . . . . . . . . . . . . . . . . . . . . . . . . . . . . . . . . . . . . . . . . . . . . . . . . 62Investable Assets . . . . . . . . . . . . . . . . . . . . . . . . . . . . . . . . . . . . . . . . . . . . . . . . . . . . . . . . . . . . . . . . . . 63Liquidity and Capital Resources . . . . . . . . . . . . . . . . . . . . . . . . . . . . . . . . . . . . . . . . . . . . . . . . . . . . . . . 72Critical Accounting Estimates . . . . . . . . . . . . . . . . . . . . . . . . . . . . . . . . . . . . . . . . . . . . . . . . . . . . . . . . . 78
Business Overview For information on the Company and our business strategy, refer "Item 1. Business - Company Overview"
and "- Business Strategy."
Key Performance IndicatorOur primary corporate objective is growing our book value per share, and we believe that long-term growth in
fully diluted book value per share is the most appropriate measure of our financial performance. We create growth in our book value through the execution of the strategies discussed in "Item 1. Business - Business Strategy."
During 2020, our book value per share on a fully diluted basis increased by 42.1% to $281.20 per share. The increase was primarily due to our net earnings for the year ended December 31, 2020, which was primarily the result of net realized and unrealized investment gains and earnings from equity method investments, as discussed more fully below.
Table of Contents
42

The growth of our fully diluted book value per share over the last 10 years is shown in the table below.
YEAR
FULL
Y D
ILU
TED
BO
OK
VA
LUE
PER
SH
AR
EGrowth in Fully Diluted Book Value Per Share
$82.97$93.30
$105.20$119.22
$129.65$143.68
$159.19 $155.94
$197.93
$281.20
2011 2012 2013 2014 2015 2016 2017 2018 2019 2020$0
$20$40$60$80
$100$120$140$160$180$200$220$240$260$280$300
The table below summarizes the calculation of our fully diluted book value per ordinary share as of December 31, 2020 and 2019:
2020 2019 Change(In thousands of U.S. dollars, except share
and per share data)Numerator:Total Enstar shareholder's equity $ 6,674,395 $ 4,842,183 $ 1,832,212 Less: Series D and E preferred shares 510,000 510,000 — Total Enstar ordinary shareholders' equity (A) 6,164,395 4,332,183 1,832,212 Proceeds from assumed conversion of warrants (1) 20,229 20,229 — Numerator for fully diluted book value per ordinary share calculations (B) $ 6,184,624 $ 4,352,412 $ 1,832,212
Denominator:Ordinary shares outstanding (C) (2) 21,519,602 21,511,505 8,097 Effect of dilutive securities:
Share-based compensation plans (3) 298,095 302,565 (4,470) Warrants(1) 175,901 175,901 —
Fully diluted ordinary shares outstanding (D) 21,993,598 21,989,971 3,627
Book value per ordinary shareBasic book value per ordinary share = (A) / (C) $ 286.45 $ 201.39 $ 85.06 Fully diluted book value per ordinary share = (B) / (D) $ 281.20 $ 197.93 $ 83.27
(1) There are warrants outstanding to acquire 175,901 Series C Non-Voting Ordinary Shares for an exercise price of $115.00 per share, subject to certain adjustments (the "Warrants"). The Warrants were issued in April 2011 and expire in April 2021. The Warrant holder may, at its election, satisfy the exercise price of the Warrants on a cashless basis by surrender of shares otherwise issuable upon exercise of the Warrants in accordance with a formula set forth in the Warrants.
(2) Ordinary shares outstanding includes voting and non-voting shares but excludes ordinary shares held in the Enstar Group Limited Employee Benefit Trust (the "EB Trust") in respect of awards made under our Joint Share Ownership Plan, a sub-plan to our Amended and Restated 2016 Equity Incentive Plan (the "JSOP").
(3) Share-based dilutive securities include restricted shares, restricted share units, and performance share units ("PSUs"). The amounts for PSUs, and for ordinary shares held in the EB Trust in respect of the JSOP, are adjusted at the end of each period end to reflect the latest estimated performance multipliers for the respective awards. The JSOP shares did not have a dilutive effect as of December 31, 2020.
Table of Contents
43

Non-GAAP Financial MeasureIn addition to presenting net earnings (losses) attributable to Enstar ordinary shareholders and diluted
earnings (losses) per ordinary share determined in accordance with U.S. GAAP, we believe that presenting non-GAAP operating income (loss) attributable to Enstar ordinary shareholders and non-GAAP diluted operating income (loss) per ordinary share provides investors with valuable measures of our performance.
Non-GAAP operating income (loss) attributable to Enstar ordinary shareholders is calculated by the addition or subtraction of certain items from within our consolidated statements of earnings to or from net earnings (loss) attributable to Enstar ordinary shareholders, the most directly comparable GAAP financial measure, as illustrated in the table below, for the years ending December 31, 2020, 2019 and 2018:
2020 2019 2018(in thousands of U.S. dollars, except share and
per share data)Net earnings (loss) attributable to Enstar ordinary shareholders $ 1,719,344 $ 902,175 $ (162,354) Adjustments:
Net realized and unrealized (gains) losses on fixed maturity investments and funds held - directly managed (1) (306,284) (515,628) 237,262 Change in fair value of insurance contracts for which we have elected the fair value option 119,046 117,181 6,664 Gain on sale of subsidiary (3,375) — — Net earnings from discontinued operations (16,251) (7,375) (1,489) Tax effects of adjustments (2) 27,534 47,091 (15,364) Adjustments attributable to noncontrolling interest (3) 12,087 14,524 (6,665)
Non-GAAP operating income attributable to Enstar ordinary shareholders (4) $ 1,552,101 $ 557,968 $ 58,054
Diluted net earnings (loss) per ordinary share (5) $ 78.80 $ 41.43 $ (7.84) Adjustments:
Net realized and unrealized (gains) losses on fixed maturity investments and funds held - directly managed (1) (14.04) (23.68) 11.42 Change in fair value of insurance contracts for which we have elected the fair value option 5.46 5.38 0.32 Gain on sale of subsidiary (0.15) — — Net earnings from discontinued operations (0.74) (0.34) (0.07) Tax effects of adjustments (2) 1.26 2.16 (0.73) Adjustments attributable to noncontrolling interest (3) 0.55 0.67 (0.32)
Diluted non-GAAP operating income per ordinary share (4) $ 71.14 $ 25.62 $ 2.78
Weighted average ordinary shares outstanding:Basic 21,551,408 21,482,617 20,698,310 Diluted 21,818,294 21,775,066 20,904,176
(1) Represents the net realized and unrealized gains and losses related to fixed maturity securities recognized in net earnings (losses). Our fixed maturity securities are held directly on our balance sheet and also within the "Funds held - directly managed" balance. Refer to Note 6 - "Investments" in the notes to our consolidated financial statements included within Item 8 of this Annual Report on Form 10-K for further details on our net realized and unrealized gains and losses.
(2) Represents an aggregation of the tax expense or benefit associated with the specific country to which the pre-tax adjustment relates, calculated at the applicable jurisdictional tax rate.
(3) Represents the impact of the adjustments on the net earnings (loss) attributable to noncontrolling interest associated with the specific subsidiaries to which the adjustments relate.
(4) Non-GAAP financial measure.(5) During a period of loss, the basic weighted average ordinary shares outstanding is used in the denominator of the diluted loss per ordinary
share computation as the effect of including potentially dilutive securities would be anti-dilutive.
Table of Contents
44
Basis of Non-GAAP Operating Income (Loss) financial measure
Our non-GAAP measure shown above, as defined in Item 10(e) of Regulation S-K, enables readers of the consolidated financial statements to analyze our results in a way that is more aligned with the manner in which our management measures our underlying performance. We believe that presenting this non-GAAP financial measure, which may be defined and calculated differently by other companies, improves the understanding of our consolidated results of operations. This measure should not be viewed as a substitute for those calculated in accordance with U.S. GAAP.
Non-GAAP operating income (loss) is net earnings attributable to Enstar ordinary shareholders excluding: (i) net realized and unrealized (gains) losses on fixed maturity investments and funds held - directly managed included in net earnings (loss); (ii) change in fair value of insurance contracts for which we have elected the fair value option; (iii) gain (loss) on sale of subsidiaries, if any; (iv) net earnings (loss) from discontinued operations, if any; (v) tax effect of these adjustments, where applicable; and (vi) attribution of share of adjustments to noncontrolling interest, where applicable. We eliminate the impact of net realized and unrealized (gains) losses on fixed maturity investments and funds held - directly managed and change in fair value of insurance contracts for which we have elected the fair value option because these items are subject to significant fluctuations in fair value from period to period, driven primarily by market conditions and general economic conditions, and therefore their impact on our earnings is not reflective of the performance of our core operations. We eliminate the impact of gain (loss) on sale of subsidiaries and net earnings (loss) on discontinued operations because these are not reflective of the performance of our core operations. Diluted Non-GAAP operating income (loss) per ordinary share is diluted net earnings per ordinary share excluding the per diluted share amounts of each of the adjustments used to calculate non-GAAP operating income.
Underwriting RatiosIn presenting our results for the Atrium and StarStone segments, we discuss the loss ratio, acquisition cost
ratio, operating expense ratio, and the combined ratio of our active underwriting operations within these segments. Management believes that these ratios provide the most meaningful measure for understanding our underwriting profitability. These measures are not defined in GAAP, but are calculated using GAAP figures presented on the statements of earnings for both Atrium and StarStone.
The loss ratio is calculated by dividing net incurred losses and LAE by net premiums earned. The acquisition cost ratio is calculated by dividing acquisition costs by net premiums earned. The operating expense ratio is calculated by dividing operating expenses by net premiums earned. The combined ratio is the sum of the loss ratio, the acquisition cost ratio and the operating expense ratio.
The Atrium segment also includes corporate expenses that are not directly attributable to the underwriting results in the segment and are not included in the insurance ratios. The corporate expenses include general and administrative expenses related to amortization of the definite-lived intangible assets in the holding company, and expenses relating to Atrium Underwriters Limited ("AUL") employee salaries, benefits, bonuses and current year share grant costs. The AUL general and administrative expenses are incurred in managing the syndicate. These are principally funded by the profit commission fees earned from Syndicate 609, which is a revenue item not included in the insurance ratios.
The StarStone segment also includes corporate expenses that are not directly attributable to the underwriting results in the segment and are not included in the insurance ratios. The corporate expenses include non-recurring expenses, reorganization expenses and holding company expenses.
Current OutlookThe evolving COVID-19 pandemic has caused significant disruption in global financial markets and
economies worldwide. Although the overall financial and operational impact to us has been minimal to-date, with virtually all of our employees working remotely, the scope, duration and magnitude of the direct and indirect effects of the COVID-19 pandemic are changing rapidly and are difficult to anticipate. As with others in our industry, we are subject to economic factors such as interest rates, inflationary pressures, market volatility, foreign exchange rates, underwriting events, regulation, tax policy changes, political risks and other market risks that can impact our strategy and operations. For additional information on the risks posed by the COVID-19 pandemic, refer to "Item 1A. Risk Factors - Risks Relating to our Run-off Business."
The value of our investment portfolio has been impacted by the ongoing uncertainty and volatility in financial markets caused by the COVID-19 pandemic. For our fixed income portfolio, the COVID-19 pandemic has resulted in interest rates dropping to historically low levels which, in conjunction with credit spreads remaining largely unchanged year-over-year, has contributed to net unrealized gains for the year ended December 31, 2020. As of
Table of Contents
45

December 31, 2020, our fixed income portfolio remained well-positioned with an A+ average credit rating. The COVID-19 pandemic has increased the risk of defaults and downgrades across many industries, and we continue to monitor credit risk during this time of volatility. We expect interest rates and credit spreads will remain volatile in the near-term.
Our other investments, including equities, hedge funds, equity method investments and other non-fixed income investments, are expected to generate higher expected returns, have a longer investment time horizon, and provide diversification to our fixed income portfolio. Given their higher risk and return profile, we expect these returns to be more volatile over the short-term relative to our fixed income investments. Heightened volatility in equity markets was introduced during the COVID-19 pandemic, though equity prices have recovered from the sharp declines experienced in the first quarter of 2020. This improvement has resulted in unrealized gains in our equity and other investments for the year ended December 31, 2020. We anticipate continued volatility in the global investment markets as a result of the economic conditions caused by the COVID-19 pandemic.
Our results for the year ended December 31, 2020 included the impact of unrealized investment gains of $1.5 billion, driven primarily by increases in the valuation of our other investments, predominantly hedge fund investments, and earnings from equity method investments of $238.6 million. Investments that are accounted for under the equity method typically report their results on a three month lag. Accordingly, the potential effects of volatility across global financial markets, including the impact of COVID-19, on our equity method investments is generally reflected in our consolidated financial statements on a quarter lag basis.
During the year ended December 31, 2020, the Atrium and StarStone segments have incurred COVID-19 related net underwriting losses of $18.4 million and $70.7 million, respectively, for which our share was $10.9 million and $45.4 million, respectively. COVID-19 net underwriting losses for the Atrium segment primarily included losses in the accident and health lines of business, whereas losses in the StarStone segment included losses primarily in the casualty and property lines of business. Our Non-life Run-off segment had no underwriting losses related to the COVID-19 pandemic; however, as a result of the loss portfolio transfer and adverse development cover reinsurance agreement with StarStone U.S., as further described in Note 5 - "Divestitures, Held-for-Sale Businesses and Discontinued Operations" in the notes to our consolidated financial statements included within Item 8 of this Annual Report on Form 10-K, the Non-life Run-off segment assumed $10.0 million of COVID-19 related loss reserves from StarStone U.S. The amounts of Non-life Run-off, Atrium and StarStone losses referenced herein represent our estimate of underwriting losses related to the COVID-19 pandemic incurred through December 31, 2020. Given the uncertainties associated with the COVID-19 pandemic and its impact, and the limited information upon which our current estimates have been made, our preliminary reserves and the estimated liability for losses and LAE arising from the COVID-19 pandemic may materially change.
We expect to see continued opportunities in the NLRO market with companies looking for alternative and optimized capital solutions and greater certainty around incurred losses on books of business that are in run-off. Our strategy is to administer the run-off of claims profitably through closing claims in an efficient and effective manner. However, there may be increased competition in the NLRO market and increased volatility in run-off portfolios that have come to market. We believe we have a competitive advantage in the run-off market and will continue to apply our disciplined approach to underwriting and pricing transactions.
Strategic Developments
As a result of the sale and recapitalization of StarStone U.S., the sale of the majority of our interest in Atrium and the placing of StarStone International into run-off, we have largely exited our previously controlled active underwriting platforms. While we maintain strategic minority interests in these businesses, our primary focus is on our core business of acquiring and managing (re)insurance companies or portfolios of (re)insurance business in run-off. For further information on our strategic developments, refer to Note 5 - "Divestitures, Held-for-Sale Businesses and Discontinued Operations" in the notes to our consolidated financial statements included within Item 8 of this Annual Report on Form 10-K.
Non-life Run-off Business Opportunities
On October 15, 2020, we completed an IBT in the U.S., having received judicial approval from the Oklahoma County District Court. The transaction occurred between two of our subsidiaries and, although common in many parts of the world, it was the first of its kind to occur in the U.S. The IBT mechanism provides another option for structuring U.S. transactions in the future which provides legal finality to the seller of transferred insurance liabilities.
Our acquisition activity in the Non-life Run-off segment remains strong. We announced transactions with AXA XL and ProSight and completed transactions with CNA, Liberty Mutual, Hannover Re, Munich Re, AXA Group, Aspen and Lyft. Collectively, these transactions represent $4.7 billion of assets and liabilities. Refer to Note 4 -
Table of Contents
46

"Significant New Business" in the notes to our consolidated financial statements included within Item 8 of this Annual Report on Form 10-K for further information on these transactions.
Consolidated Results of Operations - For the Years Ended December 31, 2020, 2019 and 2018The following table sets forth our consolidated statements of earnings for the years ended December 31,
2020, 2019 and 2018.
The StarStone U.S. business qualifies as a discontinued operation; therefore, certain prior period amounts have been reclassified to conform to the current period presentation. These reclassifications had no impact on net earnings. For further information, refer to Note 5 - "Divestitures, Held-for-Sale Businesses and Discontinued Operations" in the notes to our consolidated financial statements included within Item 8 of this Annual Report on Form 10-K.
For a discussion of the critical accounting estimates that affect the results of operations, see "Critical Accounting Estimates" below.
2020 2019 Change 2018 Change (in thousands of U.S. dollars)INCOME
Net premiums earned $ 572,092 $ 804,047 $ (231,955) $ 695,779 $ 108,268 Fees and commission income 42,446 28,453 13,993 35,088 (6,635) Net investment income 302,817 308,271 (5,454) 261,698 46,573 Net realized and unrealized gains (losses) (1) 1,642,019 1,011,966 630,053 (407,532) 1,419,498 Other income 101,132 37,070 64,062 34,073 2,997
2,660,506 2,189,807 470,699 619,106 1,570,701 EXPENSES
Net incurred losses and LAE 415,926 614,179 (198,253) 323,722 290,457 Acquisition costs 171,020 240,609 (69,589) 177,855 62,754 General and administrative expenses 501,479 413,084 88,395 348,786 64,298 Interest expense 59,308 52,541 6,767 25,696 26,845 Net foreign exchange (gains) losses 16,393 (7,912) 24,305 2,644 (10,556)
1,164,126 1,312,501 (148,375) 878,703 433,798 EARNINGS (LOSS) BEFORE INCOME TAXES 1,496,380 877,306 619,074 (259,597) 1,136,903 Income tax benefit (expense) (23,827) (12,372) (11,455) 3,689 (16,061) Earnings from equity method investments 238,569 55,910 182,659 42,147 13,763 NET EARNINGS (LOSS) FROM CONTINUING OPERATIONS 1,711,122 920,844 790,278 (213,761) 1,134,605 Net earnings from discontinued operations, net of income taxes 16,251 7,375 8,876 1,489 5,886 NET EARNINGS (LOSS) 1,727,373 928,219 799,154 (212,272) 1,140,491 Net loss attributable to noncontrolling interest 27,671 9,870 17,801 62,051 (52,181) NET EARNINGS (LOSS) ATTRIBUTABLE TO ENSTAR 1,755,044 938,089 816,955 (150,221) 1,088,310 Dividends on preferred shares (35,700) (35,914) 214 (12,133) (23,781) NET EARNINGS (LOSS) ATTRIBUTABLE TO ENSTAR ORDINARY SHAREHOLDERS $ 1,719,344 $ 902,175 $ 817,169 $ (162,354) $ 1,064,529
(1) This includes amounts relating to both fixed income securities and other investments. We have historically accounted for our fixed income securities as a trading portfolio, whereby unrealized amounts are reflected in earnings. However, from October 1, 2019 we have elected to use AFS accounting and, as trading fixed income securities mature or are disposed of, to the extent the proceeds are reinvested in fixed income securities, the investments will be classified as AFS securities for the Non-life Run-off and StarStone segments. For a breakdown between realized and unrealized gains and losses, refer to Note 6 - "Investments" in the notes to our consolidated financial statements included within Item 8 of this Annual Report on Form 10-K.
Table of Contents
47

HighlightsConsolidated Results of Operations for 2020:
• Consolidated net earnings attributable to Enstar ordinary shareholders of $1.7 billion and basic and diluted earnings per share of $79.78 and $78.80, respectively, a year-over-year increase of $817.2 million or $37.37 per diluted share.
• Non-GAAP operating income attributable to Enstar ordinary shareholders of $1.6 billion and diluted non-GAAP operating income per ordinary share of $71.14 compared to $558.0 million and $25.62, respectively, for 2019. For a reconciliation of non-GAAP operating income attributable to Enstar ordinary shareholders to net earnings attributable to Enstar ordinary shareholders calculated in accordance with GAAP, and diluted non-GAAP operating income per ordinary share to diluted net earnings per ordinary share calculated in accordance with GAAP, see "Non-GAAP Financial Measure" above.
• Net earnings from Non-life Run-off segment of $1.9 billion, which included the impact of net realized and unrealized gains of $1.6 billion, comprised of $168.5 million of net realized gains and $1.5 billion of net unrealized gains, driven primarily by increases in the valuation of our other investments, predominantly hedge fund investments, as discussed below in the "Investment Results - Consolidated" section. Also contributing to net earnings was $238.6 million of earnings from equity method investments, driven primarily by our investments in Enhanzed Re and Monument Re.
• Combined ratio of 91.2% for our Atrium segment, with net premiums earned of $175.4 million. Excluding the estimated underwriting losses related to the COVID-19 pandemic, the combined ratio for the Atrium segment was 80.7%.
• Combined ratio of 138.1% for our StarStone segment, with net premiums earned of $318.1 million. Excluding the estimated underwriting losses related to the COVID-19 pandemic and exit costs associated with the StarStone International Run-Off, the combined ratio for the StarStone segment was 112.1%.
Consolidated Financial Condition as of December 31, 2020:
• Total investable assets of $17.3 billion, an increase of 22.7% year-over-year.
• Total reinsurance balances recoverable on paid and unpaid losses of $2.1 billion was relatively unchanged from 2019.
• Total assets of $21.6 billion compared to $19.8 billion in 2019.
• Total gross and net reserves for losses and LAE of $10.6 billion and $8.5 billion, respectively. During 2020, our Non-life Run-off segment assumed and ceded net reserves of $2.2 billion and $154.9 million, respectively.
• Total capital of $8.4 billion, including common equity of $6.2 billion, preferred equity of $510.0 million, noncontrolling interests of $379.0 million, and debt of $1.4 billion.
• Fully diluted book value per ordinary share of $281.20, an increase of 42.1% since December 31, 2019, which was primarily the result of net realized and unrealized investment gains and earnings from equity method investments.
Consolidated Overview2020 versus 2019: Consolidated net earnings attributable to Enstar ordinary shareholders increased by
$817.2 million from 2019. The most significant drivers of the change in our financial performance included:
• Non-life Run-off Segment - Net earnings attributable to the Non-life Run-off segment increased by $806.3 million, primarily due to:
◦ An increase in net realized and unrealized gains of $659.2 million. Net realized and unrealized gains in 2020 were driven by an increase in the valuation of our other investments, predominantly in a hedge fund, as discussed below in the "Investment Results - Consolidated" section;
◦ An increase in earnings from equity method investments of $182.4 million, driven primarily by our investments in Enhanzed Re and Monument Re; and
◦ An increase in other income of $65.1 million driven by a change in actuarial estimates of our defendant asbestos and environmental liabilities; partially offset by,
◦ An increase in net underwriting losses of $50.9 million.
Table of Contents
48

• Atrium - Net earnings attributable to the Atrium segment increased by $3.8 million, primarily due to higher fees and commission income and foreign exchange gains in the current period, partially offset by higher corporate expenses and a lower investment return in the current period.
• StarStone - Net losses attributable to the StarStone segment decreased by $19.2 million, primarily as a result of lower underwriting losses due to the impact of underwriting remediation activity and the gain on the sale of StarStone U.S. (included in net earnings from discontinued operations, net of income taxes), partially offset by exit costs associated with the StarStone International Run-Off and a lower investment return in the current period.
• Non-GAAP operating income - Our non-GAAP operating income, which excludes the impact of realized and unrealized losses on fixed maturity securities and other items, increased by $994.1 million. The increase was primarily attributable to net realized and unrealized gains on our other investments of $1.3 billion and earnings from equity method investments of $238.6 million, as discussed above. For a reconciliation of non-GAAP operating income attributable to Enstar ordinary shareholders to net earnings attributable to Enstar ordinary shareholders calculated in accordance with GAAP, see "Non-GAAP Financial Measures" above.
2019 versus 2018: Consolidated net earnings attributable to Enstar ordinary shareholders increased by $1.1 billion. The most significant drivers of the change in our financial performance included:
• Non-life Run-off Segment - Net earnings attributable to the Non-life Run-off segment increased by $1.0 billion, primarily due to:
◦ An increase in net realized and unrealized gains on our investment portfolio of $1.4 billion. Net realized and unrealized gains in 2019 were driven primarily by higher valuations due to declining interest rates and tighter credit spreads; compared to lower valuations in 2018 due to higher interest rates and wider credit spreads; partially offset by
◦ An increase in net incurred losses and LAE of $357.7 million primarily due to higher losses related to i) net premiums earned in 2019 and ii) changes in the fair value of liabilities related to our assumed retroactive reinsurance agreements for which we have elected the fair value option, primarily due to narrowing credit spreads on corporate bond yields in 2019.
• StarStone - Net losses attributable to the StarStone segment decreased by $57.8 million primarily due to a reduction in underwriting losses and an increase in net realized and unrealized gains in 2019 compared to losses in 2018.
• Non-GAAP operating income - Our non-GAAP operating income, which excludes the impact of unrealized gains and losses on fixed maturity securities and other items, increased by $499.9 million primarily due to our other investments results in 2019. For a reconciliation of non-GAAP operating income attributable to Enstar ordinary shareholders to net earnings attributable to Enstar ordinary shareholders calculated in accordance with GAAP, see "Non-GAAP Financial Measures" above.
Results of Operations by Segment - For the Years Ended December 31, 2020, 2019 and 2018We have three reportable segments of business that are each managed, operated and reported on
separately: (i) Non-life Run-off; (ii) Atrium; and (iii) StarStone. Our other activities, which do not qualify as a reportable segment, include our corporate expenses, debt servicing costs, preferred share dividends, holding company income and expenses, foreign exchange and other miscellaneous items. For a description of our segments, see "Item 1. Business - Operating Segments."
As discussed in Item 1. Business - Company Overview and Note 5 - "Divestitures, Held-for-Sale Businesses and Discontinued Operations" in the notes to our consolidated financial statements included within Item 8 of this Annual Report on Form 10-K, the strategic transactions related to our Atrium and StarStone segments will enable us to focus on our core Non-life Run-off business. We will review and assess our segment structure in 2021 to reflect the changes to the StarStone and Atrium segments in the fourth quarter of 2020 and the first quarter of 2021, respectively.
Table of Contents
49

The below table provides a split by operating segment of the net earnings attributable to Enstar ordinary shareholders for the years ended December 31, 2020, 2019 and 2018:
2020 2019 Change 2018 Change (in thousands of U.S. dollars)Segment split of net earnings (loss) attributable to Enstar:
Non-life Run-off $ 1,866,127 $ 1,059,804 $ 806,323 $ 25,222 $ 1,034,582 Atrium 15,924 12,125 3,799 8,997 3,128 StarStone (81,547) (100,733) 19,186 (158,580) 57,847
Other (81,160) (69,021) (12,139) (37,993) (31,028) Net earnings (loss) attributable to Enstar ordinary shareholders $ 1,719,344 $ 902,175 $ 817,169 $ (162,354) $ 1,064,529
The following is a discussion of our results of operations by segment.
Non-life Run-off SegmentFor a description of our Non-life Run-off segment, see "Item 1. Business - Operating Segments - Non-life
Run-off." The following is a discussion and analysis of the results of operations for our Non-life Run-off segment.
2020 2019 Change(in thousands of U.S. dollars)
Gross premiums written $ 5,191 $ (25,069) $ 30,260
Net premiums written $ 2,987 $ (25,338) $ 28,325
Net premiums earned $ 58,695 $ 168,496 $ (109,801) Net incurred losses and LAE (1) (44,995) (51,625) 6,630 Acquisition costs (20,177) (73,642) 53,465 Operating expenses (200,990) (199,756) (1,234)
Underwriting loss (207,467) (156,527) (50,940) Net investment income 282,048 275,236 6,812 Net realized and unrealized gains (2) 1,627,526 968,350 659,176 Fees and commission income 19,462 18,293 1,169 Other income 99,940 34,809 65,131 Corporate expenses (97,727) (70,689) (27,038) Interest expense (67,195) (62,055) (5,140) Net foreign exchange gains (losses) (13,214) 9,918 (23,132)
EARNINGS BEFORE INCOME TAXES 1,643,373 1,017,335 626,038 Income tax expense (17,412) (7,250) (10,162) Earnings from equity method investments 238,569 56,128 182,441
NET EARNINGS 1,864,530 1,066,213 798,317 Net (earnings) loss attributable to noncontrolling interest 1,597 (6,409) 8,006
NET EARNINGS ATTRIBUTABLE TO ENSTAR ORDINARY SHAREHOLDERS $ 1,866,127 $ 1,059,804 $ 806,323
(1) Comparability between periods is impacted by the current period net incurred losses and LAE as acquired unearned premium is earned, and by changes in fair value due to the election of the fair value option on certain business. Refer to Net Incurred Losses and LAE table for further details.
(2) This includes amounts relating to both fixed income securities and other investments. We have historically accounted for our fixed income securities as a trading portfolio, whereby unrealized amounts are reflected in earnings. However, from October 1, 2019, we have elected to use AFS accounting and, as trading fixed income securities mature or are disposed of, to the extent the proceeds are reinvested in fixed income securities, the investments will be classified as AFS securities for the Non-life Run-off segment.
Table of Contents
50
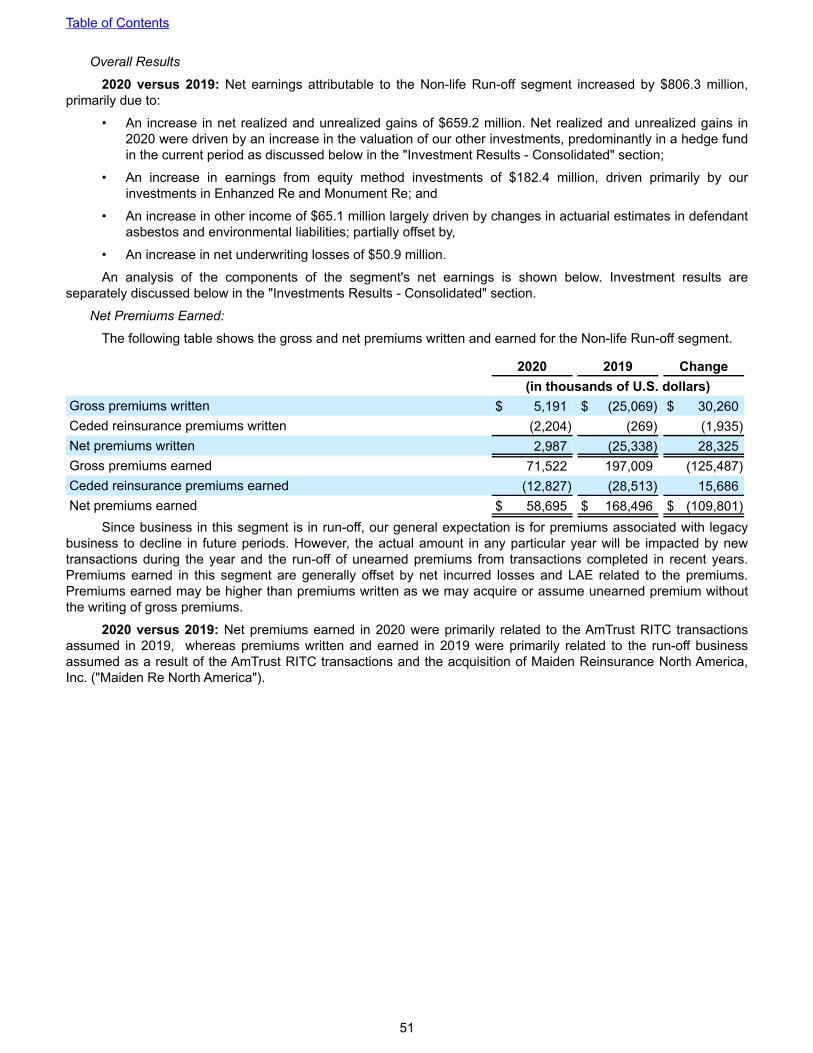
Overall Results
2020 versus 2019: Net earnings attributable to the Non-life Run-off segment increased by $806.3 million, primarily due to:
• An increase in net realized and unrealized gains of $659.2 million. Net realized and unrealized gains in 2020 were driven by an increase in the valuation of our other investments, predominantly in a hedge fund in the current period as discussed below in the "Investment Results - Consolidated" section;
• An increase in earnings from equity method investments of $182.4 million, driven primarily by our investments in Enhanzed Re and Monument Re; and
• An increase in other income of $65.1 million largely driven by changes in actuarial estimates in defendant asbestos and environmental liabilities; partially offset by,
• An increase in net underwriting losses of $50.9 million.
An analysis of the components of the segment's net earnings is shown below. Investment results are separately discussed below in the "Investments Results - Consolidated" section.
Net Premiums Earned:
The following table shows the gross and net premiums written and earned for the Non-life Run-off segment.
2020 2019 Change (in thousands of U.S. dollars)Gross premiums written $ 5,191 $ (25,069) $ 30,260 Ceded reinsurance premiums written (2,204) (269) (1,935) Net premiums written 2,987 (25,338) 28,325 Gross premiums earned 71,522 197,009 (125,487) Ceded reinsurance premiums earned (12,827) (28,513) 15,686 Net premiums earned $ 58,695 $ 168,496 $ (109,801)
Since business in this segment is in run-off, our general expectation is for premiums associated with legacy business to decline in future periods. However, the actual amount in any particular year will be impacted by new transactions during the year and the run-off of unearned premiums from transactions completed in recent years. Premiums earned in this segment are generally offset by net incurred losses and LAE related to the premiums. Premiums earned may be higher than premiums written as we may acquire or assume unearned premium without the writing of gross premiums.
2020 versus 2019: Net premiums earned in 2020 were primarily related to the AmTrust RITC transactions assumed in 2019, whereas premiums written and earned in 2019 were primarily related to the run-off business assumed as a result of the AmTrust RITC transactions and the acquisition of Maiden Reinsurance North America, Inc. ("Maiden Re North America").
Table of Contents
51

Net Incurred Losses and LAE:
The following table shows the components of net incurred losses and LAE for the Non-life Run-off segment.
2020 2019
Prior
PeriodsCurrentPeriod Total
PriorPeriods
CurrentPeriod Total
(in thousands of U.S. dollars)Net losses paid $ 1,064,911 $ 9,990 $ 1,074,901 $ 1,182,804 $ 64,820 $ 1,247,624 Net change in case and LAE reserves (1) (449,610) (3,470) (453,080) (553,996) 23,105 (530,891) Net change in IBNR reserves (2) (742,417) 24,003 (718,414) (847,893) 35,194 (812,699) Increase (reduction) in estimates of net ultimate losses (127,116) 30,523 (96,593) (219,085) 123,119 (95,966) Increase (reduction) in provisions for unallocated LAE (3) (48,407) (358) (48,765) (57,844) 440 (57,404) Amortization of deferred charge assets and deferred gain liabilities (4) 42,640 — 42,640 37,744 — 37,744 Amortization of fair value adjustments (5) 28,667 — 28,667 50,070 — 50,070 Changes in fair value - fair value option (6) 119,046 — 119,046 117,181 — 117,181 Net incurred losses and LAE $ 14,830 $ 30,165 $ 44,995 $ (71,934) $ 123,559 $ 51,625
(1) Comprises the movement during the year in specific case reserve liabilities as a result of claims settlements or changes advised to us by our policyholders and attorneys, less changes in case reserves recoverable advised by us to our reinsurers as a result of the settlement or movement of assumed claims.
(2) Represents the gross change in our actuarial estimates of IBNR, less amounts recoverable. (3) Represents the change in the estimate of the total future costs to administer the claims.(4) Relates to the amortization of deferred charge assets and deferred gain liabilities on retroactive reinsurance contracts.(5) Relates to the amortization of fair value adjustments associated with the acquisition of companies.(6) Represents the changes in the fair value of liabilities related to our assumed retroactive reinsurance agreements for which we have elected the
fair value option.
2020 versus 2019: Net incurred losses and LAE decreased by $6.6 million primarily due to a lower amount of premium earned for which current period losses were recognized, partially offset by a lower reduction in estimates of net ultimate losses related to prior periods in 2020.
The following table shows the components of the 2020 reduction in estimates of net ultimate losses related to prior periods by line of business for the Non-life Run-off segment.
2020
Net losses paidNet change in case and LAE reserves
Net change in IBNR reserves
Increase (reduction) in estimates of net ultimate losses
Asbestos $ 132,853 $ (1,300) $ (150,054) $ (18,501) Environmental 23,866 (266) (36,362) (12,762) General Casualty 170,502 (68,744) (127,421) (25,663) Workers' Compensation 142,790 (176,927) (149,198) (183,335) Marine, aviation and transit 33,927 (14,458) (50,558) (31,089) Construction defect 27,476 (6,092) (13,382) 8,002 Professional indemnity/ Directors & Officers 63,878 3,698 (79,181) (11,605) Motor 349,366 (106,561) (95,040) 147,765 Property 71,422 (24,356) (64,331) (17,265) All Other 48,831 (54,604) 23,110 17,337 Total $ 1,064,911 $ (449,610) $ (742,417) $ (127,116)
The significant drivers of the 2020 reduction in estimates of net ultimate losses are explained below.
Workers' Compensation - The workers’ compensation line of business experienced a $183.3 million reduction in estimates of net ultimate losses as a result of favorable actual development versus expected development across nearly all our acquired companies and assumed portfolios. We continue to drive favorable loss experience by proactively settling claims for less than the current case reserves. During 2020, we paid net losses of $142.8 million
Table of Contents
52

and released case and LAE reserves of $176.9 million. This represents a decrease in reported losses of $34.1 million for the year. As a result of the favorable development in our data, our actuarial analyses indicated and resulted in a release of $149.2 million of IBNR reserves, primarily attributed to a settlement of an outwards reinsurance agreement resulting in the reduction in gross ultimate losses inuring to our benefit.
We also continue to actively seek to commute policies in our workers' compensation line of business when possible, and where the commutation of the policy is settled at a level below the carried value of the loss reserves, we record a reduction in our estimates of net ultimate losses. Included in the net paid losses and released case and LAE reserves were 10 commutations that resulted in a net reduction of ultimate losses of $10.8 million.
Marine, aviation and transit - We experienced $31.1 million of favorable development in our marine, aviation and transit line of business. The reduction in net ultimate loss reserves was driven by a number of favorable outcomes on certain large claims from our U.K.-based portfolios and better actual than expected experience of reported losses across most reserve segments which led to releases of IBNR reserves as a result of our annual actuarial analyses.
General casualty - Our general casualty line of business experienced $25.7 million in favorable loss development which was the result of better actual than expected claim emergence across several portfolios including a new portfolio acquired in 2020 that underwent its first actuarial analysis by our outside actuarial consultant. To date, we have not experienced adverse social inflation in our general casualty line of business since we are generally proactive in settling claims early for fair value which reduces legal costs for both the defendant and plaintiff.
Motor - The experience in the motor line was adverse by $147.8 million due to higher than expected severity related to a recent assumed loss portfolio transfer transaction. The case reserves were significantly strengthened when we transferred the claims handling to a new third-party administrator with specialist experience in commercial automobile exposures. Along with the new third-party administrator, we have implemented several claim initiatives aimed at reducing defense costs, settling claims earlier, lowering claims severity and increased governance and technical oversight.
Other significant components of the 2020 net incurred losses and LAE include losses related to 2020 net earned premium of $30.2 million, an increase in the fair value of liabilities of $119.0 million related to our assumed retroactive reinsurance agreements for which we have elected the fair value option, primarily due to narrowing credit spreads on corporate bond yields in 2020, and 15 commutations in lines other than workers’ compensation resulting in a decrease of $12.3 million.
The following table shows the components of the 2019 reduction in estimates of net ultimate losses related to prior periods by line of business for the Non-life Run-off segment.
2019
Net losses paidNet change in case and LAE reserves
Net change in IBNR reserves
Increase (reduction) in estimates of net ultimate losses
Asbestos $ 118,557 $ 35,003 $ (146,749) $ 6,811 Environmental 16,899 13,796 (15,707) 14,988 General Casualty 175,044 (89,968) (91,818) (6,742) Workers' Compensation 208,961 (156,435) (188,944) (136,418) Marine, aviation and transit 82,058 (77,958) (24,508) (20,408) Construction defect 32,078 (8,313) (25,025) (1,260) Professional indemnity/ Directors & Officers 103,413 (36,986) (104,984) (38,557) Motor 276,563 (134,127) (179,887) (37,451) Property 94,093 (73,259) (7,358) 13,476 All Other 75,138 (25,749) (62,913) (13,524) Total $ 1,182,804 $ (553,996) $ (847,893) $ (219,085)
The significant drivers of the 2019 reduction in estimates of net ultimate losses are explained below.
Table of Contents
53

Workers' Compensation - A $136.4 million reduction in estimates of net ultimate losses in our workers' compensation line of business arose across multiple portfolios, where reported loss development was generally significantly less than expected development. The lower than expected actual development was driven by significant proactive settlement activity on individual claimants where we were able to settle claims lower than the case reserve estimates. For example, in two of our portfolios we observed favorable reported loss development, where we paid $39.3 million in loss payments to release a corresponding $53.6 million of associated case reserves resulting in $14.3 million in favorable reported loss development. These settlement activities and the favorable actual loss development versus expected loss development, led to a change in the actuarial assumptions in the annual reserve study that reflect this favorable loss development.
We also continue to actively seek to commute policies in our workers' compensation line of business when possible, and where the commutation of the policy is settled at a level below the carried value of the loss reserves, we record a reduction in our estimates of net ultimate losses. During 2019, we completed 6 commutations across several workers' compensation portfolios that contributed to a $6.1 million reduction in estimates of net ultimate losses.
Professional Indemnity/Directors & Officers - A $38.6 million reduction in estimates of net ultimate losses in our professional indemnity/directors’ & officers’ line of business arose from the annual actuarial analysis which reflected the better than expected loss development during 2019. As part of the reserve analysis, an in-depth review of recently acquired portfolios’ ceded reinsurance programs led to an increase in the ceded reinsurance asset of $13.5 million, which results in a reduction in net ultimate losses.
Asbestos - A $6.8 million increase in estimates of net ultimate losses in our asbestos line of business was driven primarily from changes in our actuarial assumptions related to dismissal rates. During 2019, the number of new defendants and filed claims was less than expected, but this was offset by a lowering of the dismissal rate. In asbestos, the dismissal rates are extremely high as many of the claims do not have merit against the insured. However, we have seen a trend in both US and UK exposure of the dismissal rate decreasing in the range of 2 to 3 percentage points.
Similar to workers’ compensation business, during 2019, we completed 6 commutations across several portfolios that contributed to a $9.8 million reduction in estimates of net ultimate losses.
Other - All other line of business changes in estimates of net ultimate losses were primarily due to the application of our reserving methodologies, favorable actual versus expected loss development and proactive claim management.
Other significant components of the 2019 net incurred losses and LAE include losses related to 2019 net earned premium of $123.6 million and an increase in the fair value of liabilities of $117.2 million related to our assumed retroactive reinsurance agreements for which we have elected the fair value option, primarily due to narrowing credit spreads on corporate bond yields in 2019.
Other Items:
2020 versus 2019:• The reduction in acquisition costs of $53.5 million in 2020 was due to a lower level of net premiums earned
and lower associated acquisition costs in respect of the run-off business assumed through the AmTrust RITC transactions and the acquisition of Maiden Re North America.
• The increase in other income of $65.1 million was primarily driven by other income from our defendant asbestos and environmental liabilities companies of $99.3 million in 2020 due to a reduction in the actuarially estimated ultimate net liabilities as a result of a lower than expected number of asbestos claims filed against us; lower than expected paid indemnity and defense costs; the collection of disputed insurance recoveries that were carried on our balance sheet at $166.7 million, net of fair value adjustments, for consideration of $179.6 million; and recovery of $19.3 million on insurance payments previously written-off prior to our acquisition of the companies.
• General and administrative expenses consist of operating and corporate expenses. General and administrative expenses increased by $28.3 million primarily due higher performance-based compensation costs as a result of higher earnings in 2020.
• Net foreign exchange losses were $13.2 million for 2020 compared to gains of $9.9 million in 2019. The unfavorable change of $23.1 million was primarily driven by increased volatility in foreign exchange markets associated with the COVID-19 pandemic and the resulting impact on non-U.S. dollar denominated investments and technical balances in 2020.
Table of Contents
54

• The income tax benefit (expense) is generally driven by the geographical distribution of pre-tax earnings (loss) between taxable and non-taxable jurisdictions.
• Earnings from equity method investments increased by $182.4 million in 2020, primarily due to an increase in earnings from our investments in Enhanzed Re and Monument Re.
• The change in net earnings attributable to noncontrolling interest of $8.0 million was due to lower earnings for those companies where there is a noncontrolling interest.
Atrium SegmentFor a description of our Atrium segment, including strategic developments, see "Item 1. Business - Operating
Segments - Atrium." The following is a discussion and analysis of the results of operations for our Atrium segment.
2020 2019 Change(in thousands of U.S. dollars)
Gross premiums written $ 206,656 $ 192,373 $ 14,283
Net premiums written $ 183,194 $ 172,356 $ 10,838
Net premiums earned $ 175,393 $ 164,059 $ 11,334 Net incurred losses and LAE (87,226) (77,276) (9,950) Acquisition costs (59,611) (56,956) (2,655) Operating expenses (13,078) (14,452) 1,374 Underwriting income 15,478 15,375 103 Net investment income 5,542 7,049 (1,507) Net realized and unrealized gains (1) 4,165 6,195 (2,030) Fees and commission income 22,984 10,160 12,824 Other income 131 140 (9) Corporate expenses (21,522) (13,825) (7,697) Net foreign exchange gains (losses) 4,327 (504) 4,831 EARNINGS BEFORE INCOME TAXES 31,105 24,590 6,515 Income tax expense (4,122) (4,033) (89) NET EARNINGS 26,983 20,557 6,426 Net earnings attributable to noncontrolling interest (11,059) (8,432) (2,627) NET EARNINGS ATTRIBUTABLE TO ENSTAR ORDINARY SHAREHOLDERS $ 15,924 $ 12,125 $ 3,799
Underwriting ratios: (2)
Loss ratio 49.7 % 47.1 % 2.6 %Acquisition cost ratio 34.0 % 34.7 % (0.7) %Operating expense ratio 7.5 % 8.8 % (1.3) %Combined ratio 91.2 % 90.6 % 0.6 %
(1) For the Atrium segment, we utilize trading accounting, where unrealized amounts are reflected in earnings.(2) Refer to "Underwriting Ratios" for a description of how these ratios are calculated.
Overall Results
2020 versus 2019: Net earnings attributable to the Atrium segment increased by $3.8 million, primarily due to higher fees and commission income and foreign exchange gains in the current year, partially offset by higher corporate expenses and a lower investment return in the current year.
An analysis of the components of the segment's net earnings before the attribution of net (earnings) to noncontrolling interest is shown below. Investment results are separately discussed below in the "Investments Results - Consolidated" section.
Table of Contents
55

Gross Premiums Written:
The following table provides gross premiums written by line of business for the Atrium segment.
2020 2019 Change (in thousands of U.S. dollars)Marine, aviation and transit $ 58,081 $ 49,275 $ 8,806 Binding authorities 86,944 78,825 8,119 Reinsurance 16,906 17,778 (872) Accident and health 14,778 21,585 (6,807) Non-marine direct and facultative 29,947 24,910 5,037 Total $ 206,656 $ 192,373 $ 14,283
2020 versus 2019: The increase in gross premiums written was driven predominantly by increases across the marine, aviation and transit, binding authorities and non-marine direct and facultative lines of business. The marine, aviation and transit and non-marine direct and facultative lines of business continue to benefit from an increase in rates, while the binding authorities line of business benefited from new opportunities to write business. The reduction in the accident and health line of business was largely driven by the impact of the COVID-19 pandemic as well as underwriting actions to not renew certain contracts in 2020.
Net Premiums Earned:
The following table provides net premiums earned by line of business for the Atrium segment.
2020 2019 Change (in thousands of U.S. dollars)Marine, aviation and transit $ 44,127 $ 36,312 $ 7,815 Binding authorities 79,246 75,142 4,104 Reinsurance 13,793 14,433 (640) Accident and health 14,841 18,922 (4,081) Non-marine direct and facultative 23,386 19,250 4,136 Total $ 175,393 $ 164,059 $ 11,334
2020 versus 2019: The increase in net premiums earned was primarily due to ongoing growth in the marine, aviation and transit, non-marine direct and facultative and binding authorities lines of business.
Net Incurred Losses and LAE:
The following table shows the components of net incurred losses and LAE for the Atrium segment.
2020 2019
Prior
PeriodsCurrentPeriod Total
PriorPeriods
CurrentPeriod Total
(in thousands of U.S. dollars)Net losses paid $ 40,196 $ 33,724 $ 73,920 $ 43,572 $ 34,617 $ 78,189 Net change in case and LAE reserves (1) (14,145) 21,390 7,245 (13,278) 16,812 3,534 Net change in IBNR reserves (2) (31,773) 38,434 6,661 (38,380) 33,598 (4,782) Increase (reduction) in estimates of net ultimate losses (5,722) 93,548 87,826 (8,086) 85,027 76,941 Amortization of fair value adjustments (3) (571) — (571) 335 — 335 Increase (reduction) in provisions for unallocated loss adjustment expense liabilities (4) 48 (77) (29) — — — Net incurred losses and LAE $ (6,245) $ 93,471 $ 87,226 $ (7,751) $ 85,027 $ 77,276
(1) Comprises the movement during the period in specific case reserve liabilities as a result of claims settlements or changes advised to us by our policyholders and attorneys, less changes in case reserves recoverable advised by us to our reinsurers as a result of the settlement or movement of assumed claims.
(2) Represents the gross change in our actuarial estimates of IBNR reserves, less amounts recoverable.(3) Relates to the amortization of fair value adjustments associated with the acquisition of companies.(4) Represents the change in the estimate of the total future costs to administer the claims.
Table of Contents
56

2020 versus 2019: The increase in net incurred losses and LAE of $10.0 million in 2020 was primarily driven by $18.4 million of losses related to the COVID-19 pandemic, primarily from accident and health business, partially offset by overall improved loss experience in other lines of business and lower catastrophe activity on the business written by Atrium.
The loss ratios were 49.7% and 47.1% for 2020 and 2019, respectively. Excluding the impact of losses related to the COVID-19 pandemic, the loss ratio for 2020 was 39.2%.
Other Items
2020 versus 2019: • The reduction in the acquisition cost ratio of 0.7% was primarily due to agreed reductions in brokerage rates
for certain accounts in 2020.
• The reduction in the operating expense ratio of 1.3% was primarily driven by an increase in net premiums earned and a reduction in operating expenses in 2020.
• Fees and commission income increased by $12.8 million primarily due to higher profit commissions from Syndicate 609 and the space consortium in 2020.
• The increase in corporate expenses of $7.7 million was primarily attributable to higher variable compensation costs from improved performance in the Atrium segment in 2020.
• Net foreign exchange gains were $4.3 million in 2020 compared to losses of $0.5 million in 2019. The favorable change of $4.8 million was primarily due to the strengthening of the Euro and the Canadian dollar against the U.S. dollar during 2020.
• Net earnings attributable to noncontrolling interest in the Atrium segment increased by $2.6 million, primarily due to higher earnings, as discussed above. As of December 31, 2020, the Trident V Funds and the Dowling Funds had a combined 41.0% noncontrolling interest in the Atrium segment.
Table of Contents
57

StarStone Segment For a description of our StarStone segment, including strategic developments, see "Item 1. Business -
Operating Segments - StarStone."
The following is a discussion and analysis of the results of operations for our StarStone segment. As a result of the impact from the strategic developments in the segment, we have updated the presentation of the following tables. In previous reports, we had distinguished the results of sub-components of the segment between StarStone Group and Intra-group reinsurances, and between core and exited lines of business, which is no longer considered to be as meaningful. Under U.S. GAAP, StarStone U.S. qualified as a discontinued operation whereas StarStone International (non-U.S.) qualified as a continuing operation. As a result, certain prior period amounts have been reclassified to conform to the current period presentation. These reclassifications had no impact on net earnings. For further information, refer to Note 5 - "Divestitures, Held-for-Sale Businesses and Discontinued Operations" in the notes to our consolidated financial statements included within Item 8 of this Annual Report on Form 10-K.
The following is a discussion and analysis of the results of operations for the StarStone segment. Current and prior period results are not indicative of future results.
2020 2019 Change 2018 Change(in thousands of U.S. dollars)
Gross premiums written $ 326,695 $ 472,815 $ (146,120) $ 622,570 $ (149,755)
Net premiums written $ 233,202 $ 379,523 $ (146,321) $ 478,009 $ (98,486)
Net premiums earned $ 318,115 $ 451,112 $ (132,997) $ 515,163 $ (64,051) Net incurred losses and LAE (266,738) (469,240) 202,502 (543,080) 73,840 Acquisition costs (90,797) (109,369) 18,572 (120,517) 11,148 Operating expenses (81,853) (60,627) (21,226) (98,137) 37,510
Underwriting loss (121,273) (188,124) 66,851 (246,571) 58,447 Net investment income 27,443 34,396 (6,953) 27,000 7,396 Net realized and unrealized gains (losses) (1) 10,328 31,572 (21,244) (12,320) 43,892 Other income 3,734 329 3,405 (550) 879 Corporate expenses (42,011) (7,790) (34,221) — (7,790) Interest expense (2,110) (475) (1,635) (103) (372) Net foreign exchange losses (10,140) (1,505) (8,635) (2,832) 1,327
(12,756) 56,527 (69,283) 11,195 45,332 LOSS BEFORE INCOME TAXES (134,029) (131,597) (2,432) (235,376) 103,779
Income tax expense (902) (1,004) 102 3,892 (4,896) Losses from equity method investments — (218) 218 — (218)
NET LOSS FROM CONTINUING OPERATIONS (134,931) (132,819) (2,112) (231,484) 98,665 Net earnings from discontinued operations, net of income taxes 16,251 7,375 8,876 1,489 5,886 NET LOSS (118,680) (125,444) 6,764 (229,995) 104,551 Net loss attributable to noncontrolling interest 37,133 24,711 12,422 71,415 (46,704)
NET LOSS ATTRIBUTABLE TO ENSTAR ORDINARY SHAREHOLDERS $ (81,547) $ (100,733) $ 19,186 $ (158,580) $ 57,847
Underwriting ratios: (2)
Loss ratio 83.8 % 104.0 % (20.2) % 105.4 % (1.4) %Acquisition cost ratio 28.5 % 24.2 % 4.3 % 23.4 % 0.8 %Operating expense ratio 25.8 % 13.5 % 12.3 % 19.1 % (5.6) %Combined ratio 138.1 % 141.7 % (3.6) % 147.9 % (6.2) %
(1) This includes amounts relating to both fixed income securities and other investments. We have historically accounted for our fixed income securities as a trading portfolio, whereby unrealized amounts are reflected in earnings. However, from October 1, 2019, we have elected to use AFS accounting and, as trading fixed income securities mature or are disposed of, to the extent the proceeds are reinvested in fixed income securities, the investments will be classified as AFS securities for the StarStone segment.
(2) Refer to "Underwriting Ratios" for a description of how these ratios are calculated.
Table of Contents
58
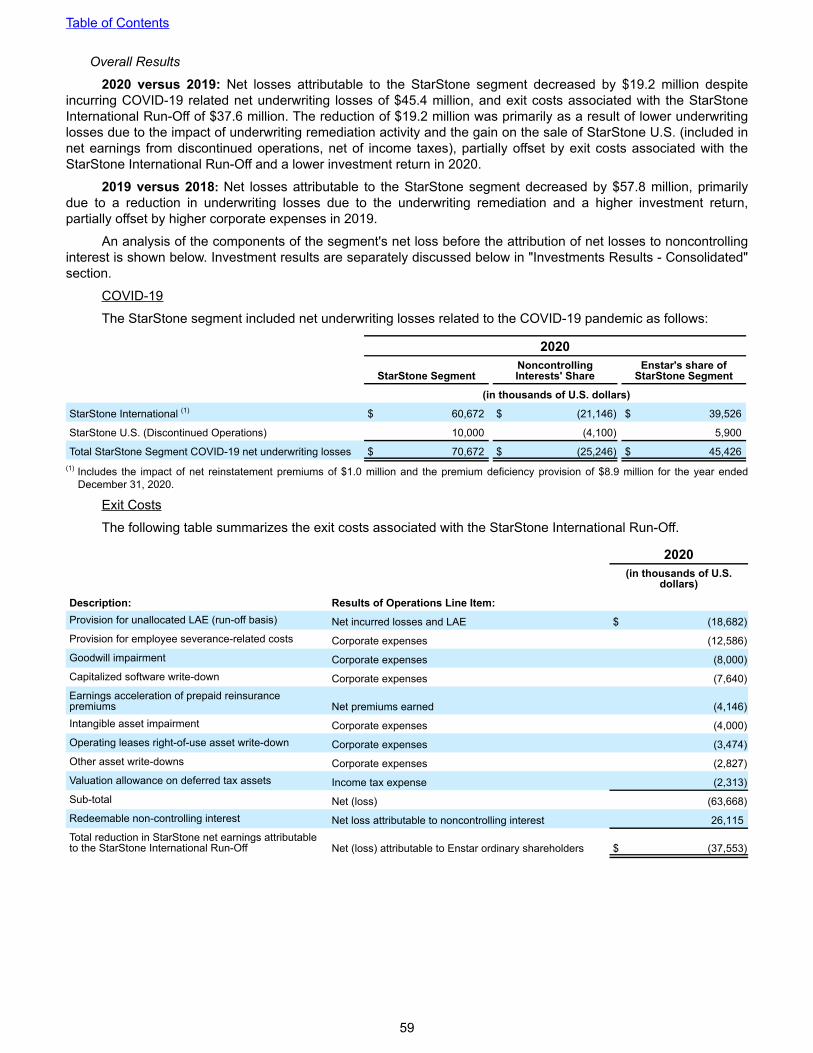
Overall Results
2020 versus 2019: Net losses attributable to the StarStone segment decreased by $19.2 million despite incurring COVID-19 related net underwriting losses of $45.4 million, and exit costs associated with the StarStone International Run-Off of $37.6 million. The reduction of $19.2 million was primarily as a result of lower underwriting losses due to the impact of underwriting remediation activity and the gain on the sale of StarStone U.S. (included in net earnings from discontinued operations, net of income taxes), partially offset by exit costs associated with the StarStone International Run-Off and a lower investment return in 2020.
2019 versus 2018: Net losses attributable to the StarStone segment decreased by $57.8 million, primarily due to a reduction in underwriting losses due to the underwriting remediation and a higher investment return, partially offset by higher corporate expenses in 2019.
An analysis of the components of the segment's net loss before the attribution of net losses to noncontrolling interest is shown below. Investment results are separately discussed below in "Investments Results - Consolidated" section.
COVID-19
The StarStone segment included net underwriting losses related to the COVID-19 pandemic as follows:
2020
StarStone SegmentNoncontrolling Interests' Share
Enstar's share of StarStone Segment
(in thousands of U.S. dollars)
StarStone International (1) $ 60,672 $ (21,146) $ 39,526
StarStone U.S. (Discontinued Operations) 10,000 (4,100) 5,900
Total StarStone Segment COVID-19 net underwriting losses $ 70,672 $ (25,246) $ 45,426 (1) Includes the impact of net reinstatement premiums of $1.0 million and the premium deficiency provision of $8.9 million for the year ended
December 31, 2020.
Exit Costs
The following table summarizes the exit costs associated with the StarStone International Run-Off.
2020(in thousands of U.S.
dollars)
Description: Results of Operations Line Item:Provision for unallocated LAE (run-off basis) Net incurred losses and LAE $ (18,682) Provision for employee severance-related costs Corporate expenses (12,586) Goodwill impairment Corporate expenses (8,000) Capitalized software write-down Corporate expenses (7,640) Earnings acceleration of prepaid reinsurance premiums Net premiums earned (4,146) Intangible asset impairment Corporate expenses (4,000) Operating leases right-of-use asset write-down Corporate expenses (3,474) Other asset write-downs Corporate expenses (2,827) Valuation allowance on deferred tax assets Income tax expense (2,313) Sub-total Net (loss) (63,668) Redeemable non-controlling interest Net loss attributable to noncontrolling interest 26,115 Total reduction in StarStone net earnings attributable to the StarStone International Run-Off Net (loss) attributable to Enstar ordinary shareholders $ (37,553)
Table of Contents
59

Underwriting Impact of Exit Costs:
The underwriting impact of the exit costs relating to net premiums earned and net incurred losses and LAE as shown in the table above, are summarized in the following table.
2020Subtotal Before Exit
Costs Exit Costs Total(in thousands of U.S. dollars)
Net premiums earned $ 322,261 $ (4,146) $ 318,115 Net incurred losses and LAE (248,056) (18,682) (266,738) Acquisition costs (90,797) — (90,797) Operating expenses (81,753) (100) (81,853)
Underwriting income (loss) $ (98,345) $ (22,928) $ (121,273)
Underwriting ratios(1):Loss ratio 77.0 % 83.8 %Acquisition cost ratio 28.2 % 28.5 %Operating expense ratio 25.3 % 25.8 %Combined ratio 130.5 % 138.1 %
(1) Refer to "Underwriting Ratios" for a description of how these ratios are calculated.
Gross Premiums Written:
The following table provides gross premiums written by line of business for the StarStone segment.
2020 2019 Change 2018 Change (in thousands of U.S. dollars)Casualty $ 81,661 $ 97,355 $ (15,694) $ 88,701 $ 8,654 Marine 141,361 215,520 (74,159) 248,308 (32,788) Property 49,417 102,718 (53,301) 217,858 (115,140) Aerospace 52,967 54,245 (1,278) 61,528 (7,283) Workers' Compensation 1,289 2,977 (1,688) 6,175 (3,198) Total $ 326,695 $ 472,815 $ (146,120) $ 622,570 $ (149,755)
2020 versus 2019: Gross premiums written decreased by $146.1 million with all lines of business decreasing due to StarStone International being placed into an orderly run-off.
In light of the decision to implement the StarStone International Run-Off, gross premiums written will decline materially in future periods.
2019 versus 2018: Gross premiums written decreased by $149.8 million due to our strategy to exit certain lines of business.
Net Premiums Earned:
The following table provides net premiums earned by line of business for the StarStone segment.
2020 2019 Change 2018 Change (in thousands of U.S. dollars)Casualty $ 84,360 $ 86,509 $ (2,149) $ 121,373 $ (34,864) Marine 133,966 199,700 (65,734) 176,189 23,511 Property 68,681 121,644 (52,963) 144,933 (23,289) Aerospace 29,343 43,545 (14,202) 56,098 (12,553) Workers' Compensation 1,765 (286) 2,051 16,570 (16,856) Total $ 318,115 $ 451,112 $ (132,997) $ 515,163 $ (64,051)
2020 versus 2019: Net premiums earned decreased by $133.0 million due to StarStone International being placed into an orderly run-off.
Table of Contents
60

As noted above with respect to gross premiums written, in light of the decision to implement the StarStone International Run-Off, net premiums earned will decline materially in future periods.
2019 versus 2018: Net premiums earned decreased by $64.1 million due to our strategy to exit certain lines of business.
Net Incurred Losses and LAE:
The following table shows the components of net incurred losses and LAE for the StarStone segment.
2020 2019 2018
Prior
PeriodsCurrentPeriod Total
PriorPeriods
CurrentPeriod Total
PriorPeriods
CurrentPeriod Total
(in thousands of U.S. dollars)Net losses paid $ 300,037 $ 26,831 $ 326,868 $ 375,377 $ 75,458 $ 450,835 $ 289,981 $ 137,390 $ 427,371
Net change in case and LAE reserves (1) (130,502) 35,458 (95,044) (95,183) 90,497 (4,686) (77,821) 141,682 63,861
Net change in IBNR reserves (2) (165,909) 183,563 17,654 (163,340) 185,361 22,021 (87,963) 134,464 46,501
Increase in estimates of net ultimate losses 3,626 245,852 249,478 116,854 351,316 468,170 124,197 413,536 537,733
Increase (reduction) in provisions for unallocated LAE (3) (466) 17,710 17,244 (2,666) 3,568 902 (3,042) 8,655 5,613
Amortization of deferred charge assets and deferred gain liabilities (4) 606 — 606 — — — — — —
Amortization of fair value adjustments (5) (590) — (590) 168 — 168 (266) — (266)
Net incurred losses and LAE $ 3,176 $ 263,562 $ 266,738 $ 114,356 $ 354,884 $ 469,240 $ 120,889 $ 422,191 $ 543,080 (1) Comprises the movement during the period in specific case reserve liabilities as a result of claims settlements or changes advised to us by our
policyholders and attorneys, less changes in case reserves recoverable advised by us to our reinsurers as a result of the settlement or movement of assumed claims.
(2) Represents the gross change in our actuarial estimates of IBNR reserves, less amounts recoverable.(3) Represents the change in the estimate of the total future costs to administer the claims.(4) Relates to the amortization of deferred charge assets and deferred gain liabilities on retroactive reinsurance contracts.(5) Relates to the amortization of fair value adjustments associated with the acquisition of companies.
2020 versus 2019: The decrease in net incurred losses and LAE of $202.5 million in 2020 was mainly driven by our strategy to exit certain lines of business in 2019 and StarStone International being placed into an orderly run-off in 2020.
The loss ratios for the StarStone segment were 83.8% and 104.0% in 2020 and 2019, respectively. Net incurred losses and LAE for 2020 were $266.7 million and included $52.8 million of COVID-19 related losses, mainly related to casualty and property business, and $18.7 million of exit costs associated with the StarStone International Run-Off. Excluding the impact of COVID-19 losses and exit costs, the loss ratio for 2020 was 60.8%.
2019 versus 2018: The decrease in net incurred losses and LAE of $73.8 million was primarily driven by our strategy to exit certain lines of business.
Other Items
2020 versus 2019:• The increase in the acquisition cost ratio of 4.3% was primarily driven by the reduction in net premiums
earned and the impact of the COVID-19-related premium deficiency of $8.9 million in 2020.
• The increase in the operating expense ratio of 12.3% was due to restructuring costs and the reduction in net premiums earned in 2020.
• Corporate expenses increased by $34.2 million primarily due to exit costs associated with the StarStone International Run-Off of $38.5 million, which are summarized above.
• Net foreign exchange losses were $10.1 million in 2020 compared to $1.5 million in 2019. The unfavorable change of $8.6 million was primarily driven by the strengthening of the British pound and Euro against the U.S. dollar in 2020.
2019 versus 2018:• The reduction in the operating expense ratio of 5.6% was mainly due to a reduction in underwriting
expenses.
• Corporate expenses increased by $7.8 million primarily due to reorganization and remediation initiatives, which were not a cost of underwriting, as well as certain holding company expenses in 2019.
Table of Contents
61

Discontinued Operations (StarStone U.S.):
2020 versus 2019: The increase in net earnings from discontinued operations, net of income taxes of $8.9 million was driven primarily by the gain on the sale of StarStone U.S. of $16.1 million, partially offset by a reduction in income tax benefits in 2020.
Net earnings from discontinued operations, net of income taxes included $10.0 million net incurred losses and LAE related to the COVID-19 pandemic, with Enstar's share totaling $5.9 million, primarily related to casualty business.
2019 versus 2018: The increase in net earnings from discontinued operations, net of income taxes of $5.9 million was primarily due an increase in income tax benefits in 2019.
The StarStone U.S. business, included in discontinued operations, includes the results of intra-group reinsurance cessions which were non-renewed as of January 1, 2018. The effect of these intra-group reinsurance cessions on net earnings, net of income taxes for the StarStone U.S. business was as follows:
2020 2019 2018StarStone U.S. Group net earnings (loss) before Intra-Group Cessions $ 25,900 $ (48,164) $ (21,983) Intra-Group Cessions (25,763) 55,539 23,472 StarStone U.S. net earnings, net of income taxes $ 137 $ 7,375 $ 1,489
Noncontrolling Interest:
As of December 31, 2020 and 2019, the Trident V Funds and the Dowling Funds had a combined 41.0% noncontrolling interest in the StarStone segment. The net loss attributable to them is based on their proportionate share of loss.
OtherOur other activities, which do not qualify as a reportable segment, include our corporate expenses, debt
servicing costs, preferred share dividends, holding company income and expenses, foreign exchange and other miscellaneous items.
The following is a discussion and analysis of our results of operations for our other activities.
2020 2019 Change(in thousands of U.S. dollars)
Net premiums earned $ 19,889 $ 20,380 $ (491) Net incurred losses and LAE (16,967) (16,038) (929) Acquisition costs (435) (642) 207
Underwriting income 2,487 3,700 (1,213) Net investment (losses) income (12,216) (8,410) (3,806) Net realized and unrealized gains — 5,849 (5,849) Other income (losses) (2,673) 1,792 (4,465) Corporate expenses (44,298) (45,945) 1,647 Interest income 9,997 9,989 8 Net foreign exchange gains 2,634 3 2,631
LOSS BEFORE INCOME TAXES (44,069) (33,022) (11,047) Income tax expense (1,391) (85) (1,306) NET LOSS ATTRIBUTABLE TO ENSTAR (45,460) (33,107) (12,353) Dividends on preferred shares (35,700) (35,914) 214
NET LOSS ATTRIBUTABLE TO ENSTAR ORDINARY SHAREHOLDERS $ (81,160) $ (69,021) $ (12,139)
Overall Results:
2020 versus 2019: The increase in net losses from other activities of $12.1 million was primarily driven by a lower investment return and other losses, partially offset by net foreign exchange gains in 2020. Investment results are separately discussed below in the "Investment Results - Consolidated" section.
Table of Contents
62

Investable AssetsWe define investable assets as the sum of total investments, cash and cash equivalents, restricted cash and
cash equivalents and funds held. Investments consist primarily of investment grade, liquid, fixed maturity securities of short-to-medium duration, equities and other investments. Cash and cash equivalents and restricted cash and cash equivalents is comprised mainly of cash, high-grade fixed deposits, and other highly liquid instruments such as commercial paper with maturities of less than three months at the time of acquisition and money market funds. Funds held primarily consists of investment grade, liquid, fixed maturity securities of short-to-medium duration.
Investable assets were $17.3 billion as of December 31, 2020 as compared to $14.1 billion as of December 31, 2019, an increase of 22.7%, primarily due to assets acquired in relation to the Hannover Re, Munich Re, Lyft, Aspen and AXA Group transactions, as well as unrealized gains on investments.
For information regarding our investment strategy, refer to "Item 1. Business - Investments."
Composition of Investable Assets By SegmentAcross all of our segments, we strive to structure our investment holdings and the duration of our investments
in a manner that recognizes our liquidity needs, including our obligation to pay losses. We consider the duration characteristics of our liabilities in determining our selection of asset durations depending on our other investment strategies and to the extent practicable. If our liquidity needs or general liability profile change unexpectedly, we may adjust the structure of our investment portfolio to meet our revised expectations. Schedules of contractual maturities for our short-term and fixed maturity securities are included in Note 6 - "Investments" in the notes to our consolidated financial statements included within Item 8 of this Annual Report on Form 10-K.
The following tables summarize the composition of total investable assets by segment as of December 31, 2020 and 2019:
2020Non-life Run-
off StarStone Other Total (1)
(in thousands of U.S. dollars)
Short-term investments, trading, at fair value $ 5,129 $ — $ — $ 5,129
Short-term investments, AFS, at fair value 263,795 — — 263,795
Fixed maturities, trading, at fair value 4,145,956 448,936 — 4,594,892
Fixed maturities, AFS, at fair value 3,194,327 200,773 — 3,395,100
Funds held - directly managed 1,074,890 — — 1,074,890
Equities, at fair value 773,744 73,051 — 846,795
Other investments, at fair value 4,146,271 97,763 — 4,244,034
Equity method investments 597,295 235,000 — 832,295
Total investments 14,201,407 1,055,523 — 15,256,930
Cash and cash equivalents (including restricted cash) 1,104,401 260,843 7,872 1,373,116
Funds held by reinsured companies 546,471 81,846 7,502 635,819
Total investable assets $ 15,852,279 $ 1,398,212 $ 15,374 $ 17,265,865
Duration (in years) (2) 5.09 1.96 — 4.82
Average credit rating (3) A+ AA- AAA A+(1) The Atrium segment is not shown above as its investments were classified as held-for-sale as at December 31, 2020.(2) The duration calculation includes cash and cash equivalents, short-term investments, fixed maturities and the fixed maturities within our funds
held - directly managed portfolios at December 31, 2020 and 2019.(3) The average credit ratings calculation includes cash and cash equivalents, short-term investments, fixed maturities and the fixed maturities
within our funds held - directly managed portfolios at December 31, 2020 and 2019.
Table of Contents
63

2019Non-life Run-off Atrium StarStone Other Total
(in thousands of U.S. dollars)
Short-term investments, trading, at fair value $ 50,268 $ 1,222 $ — $ — $ 51,490
Short-term investments, AFS, at fair value 121,780 — 6,555 — 128,335
Fixed maturities, trading, at fair value 5,378,533 155,510 609,292 — 6,143,335
Fixed maturities, AFS, at fair value 1,446,912 15,310 75,830 — 1,538,052
Funds held - directly managed 1,187,552 — — — 1,187,552
Equities, at fair value 576,893 22,079 127,749 — 726,721
Other investments, at fair value 2,386,776 7,417 123,838 — 2,518,031
Equity method investments 326,277 — — — 326,277
Total investments 11,474,991 201,538 943,264 — 12,619,793
Cash and cash equivalents (including restricted cash) 666,705 58,369 241,708 4,567 971,349
Funds held by reinsured companies 336,470 27,451 103,191 8,620 475,732
Total investable assets $ 12,478,166 $ 287,358 $ 1,288,163 $ 13,187 $ 14,066,874
Duration (in years) (1) 5.24 1.86 2.07 — 4.86
Average credit rating (2) A+ AA- A+ AAA A+(1)The duration calculation includes cash and cash equivalents, short-term investments, fixed maturities and the fixed maturities within our funds
held - directly managed portfolios at December 31, 2020 and 2019.(2) The average credit ratings calculation includes cash and cash equivalents, short-term investments, fixed maturities and the fixed maturities
within our funds held - directly managed portfolios at December 31, 2020 and 2019.
As of both December 31, 2020 and 2019, our investment portfolio, including funds held - directly managed had an average credit quality rating of A+. As of December 31, 2020 and 2019, our fixed maturity investments (classified as trading and AFS and our fixed maturity investments included within funds held - directly managed) that were non-investment grade (i.e. rated lower than BBB- and non-rated securities) comprised 3.7% and 4.5% of our total fixed maturity investment portfolio, respectively. A detailed schedule of average credit ratings by asset class as of December 31, 2020 is included in Note 6 - "Investments" in the notes to our consolidated financial statements included within Item 8 of this Annual Report on Form 10-K.
Table of Contents
64

Composition of Investment Portfolio by Asset ClassThe following tables summarize the composition of our investment portfolio by asset class as of December
31, 2020 and 2019:
2020
AAA Rated AA Rated A Rated BBB Rated
Non-investment
Grade Not Rated Total %(in thousands of U.S. dollars, except percentages)
Fixed maturity and short-term investments, trading and AFS and funds held - directly managedU.S. government & agency $ 951,048 $ — $ — $ — $ — $ — $ 951,048 6.2 %U.K. government — 43,199 7,883 — — — 51,082 0.3 %Other government 244,041 159,095 42,337 51,413 5,267 — 502,153 3.3 %Corporate 172,718 607,796 2,646,602 1,960,971 287,363 11,282 5,686,732 37.3 %Municipal 8,270 78,585 55,631 20,183 — — 162,669 1.1 %Residential mortgage-backed 544,545 — 2,195 2,615 2,472 2,118 553,945 3.6 %Commercial mortgage-backed 591,396 115,114 74,615 61,730 3,961 7,274 854,090 5.6 %Asset-backed 239,733 84,058 119,757 89,898 24,014 — 557,460 3.7 %
Total 2,751,751 1,087,847 2,949,020 2,186,810 323,077 20,674 9,319,179 61.1 %
Other assets included within funds held - directly managed 14,627 0.1 %
EquitiesPublicly traded equities 260,767 1.7 %Exchange-traded funds 311,287 2.0 %Privately held equities 274,741 1.8 %
Total 846,795 5.5 %
Other investmentsHedge funds 2,638,339 17.3 %Fixed income funds 552,541 3.6 %Private equity funds 363,103 2.4 %Private credit funds 192,319 1.3 %Equity funds 190,767 1.3 %CLO equity funds 166,523 1.1 %CLO equities 128,083 0.8 %Other 12,359 0.1 %
Total 4,244,034 27.9 %
Equity method investments 832,295 5.4 %
Total investments $ 2,751,751 $ 1,087,847 $ 2,949,020 $ 2,186,810 $ 323,077 $ 20,674 $ 15,256,930 100.0 %
Table of Contents
65

2019
AAA Rated AA Rated A Rated BBB Rated
Non-investment
GradeNot
Rated Total %(in thousands of U.S. dollars, except percentages)
Fixed maturity and short-term investments, trading and AFS and funds held - directly managedU.S. government & agency $ 696,077 $ — $ — $ — $ — $ — $ 696,077 5.5 %U.K. government — 161,772 — — — — 161,772 1.3 %Other government 316,150 154,072 63,270 144,557 24,807 — 702,856 5.6 %Corporate 140,889 600,081 2,759,671 1,634,572 311,167 1,890 5,448,270 43.2 %Municipal 10,088 56,389 50,938 23,272 — — 140,687 1.1 %Residential mortgage-backed 310,595 47,474 2,295 1,882 34,055 4,613 400,914 3.2 %Commercial mortgage-backed 567,453 80,517 87,081 63,565 5,556 9,574 813,746 6.4 %Asset-backed 304,542 79,930 159,087 110,201 15,694 781 670,235 5.3 %
Total 2,345,794 1,180,235 3,122,342 1,978,049 391,279 16,858 9,034,557 71.6 %
Other assets included within funds held - directly managed 14,207 0.1 %
EquitiesPublicly traded equities 327,875 2.6 %Exchange-traded funds 133,047 1.1 %Privately held equities 265,799 2.1 %
Total 726,721 5.8 %
Other investmentsHedge funds 1,121,904 8.9 %Fixed income funds 481,039 3.8 %Equity funds 410,149 3.3 %Private equity funds 323,496 2.5 %CLO equities 87,555 0.7 %CLO equity funds 87,509 0.7 %Other 6,379 — %
Total 2,518,031 19.9 %
Equity method investments 326,277 2.6 %
Total investments $ 2,345,794 $ 1,180,235 $ 3,122,342 $ 1,978,049 $ 391,279 $ 16,858 $ 12,619,793 100.0 %
A description of our investment valuation processes is included in "Item 7. Management's Discussion and Analysis of Financial Condition and Results of Operations - Critical Accounting Estimates - Investments" and Note 12 - "Fair Value Measurements" in the notes to our consolidated financial statements included within Item 8 of this Annual Report on Form 10-K.
The amortized cost, gross unrealized gains and losses and the fair value of our short-term investments and fixed maturity investments were as follows:
Gross Unrealized Losses
As of December 31, 2020Amortized
Cost
Gross Unrealized
Gains
Non-Credit Related Losses
Allowance for Credit
Losses(1) Fair ValueU.S. government and agency $ 935,014 $ 17,148 $ (1,114) $ — $ 951,048 U.K. government 46,988 4,094 — — 51,082 Other government 463,765 38,460 (72) — 502,153 Corporate 5,226,238 463,459 (2,784) (181) 5,686,732 Municipal 145,469 17,210 (10) — 162,669 Residential mortgage-backed 545,628 9,640 (1,323) — 553,945 Commercial mortgage-backed 828,155 37,318 (11,250) (133) 854,090 Asset-backed 567,638 3,682 (13,852) (8) 557,460
$ 8,758,895 $ 591,011 $ (30,405) $ (322) $ 9,319,179 (1)The Company adopted ASU 2016-13 and the related amendments on January 1, 2020. Refer to Note 2 - "Significant Accounting Policies" in the
notes to our consolidated financial statements included within Item 8 of this Annual Report on Form 10-K for further details.
Table of Contents
66

As of December 31, 2019Amortized
Cost
GrossUnrealized
Gains
GrossUnrealized
LossesNon-OTTI
FairValue
U.S. government and agency $ 690,343 $ 6,663 $ (929) $ 696,077 U.K. government 155,261 6,628 (117) 161,772 Other government 684,116 24,994 (6,254) 702,856 Corporate 5,231,512 235,406 (18,648) 5,448,270 Municipal 131,130 9,595 (38) 140,687 Residential mortgage-backed 396,331 5,981 (1,398) 400,914 Commercial mortgage-backed 796,730 20,673 (3,657) 813,746 Asset-backed 674,250 1,806 (5,821) 670,235
$ 8,759,673 $ 311,746 $ (36,862) $ 9,034,557
We have historically accounted for our fixed income securities as a trading portfolio, whereby unrealized gains are reflected in earnings. However, from October 1, 2019, we have elected to use AFS accounting and, as trading fixed income securities mature or are disposed, to the extent the proceeds are reinvested in fixed income securities, the investments will be classified as AFS securities for the Non-life Run-off and StarStone segments. The difference in the treatment of the fixed income securities is that unrealized changes on investments classified as trading are recorded through earnings, whereas unrealized changes on investments classified as AFS are recorded directly to shareholders' equity as a component of other comprehensive income. We may experience unrealized losses on our fixed maturity investments, depending on investment conditions and general economic conditions. Unrealized amounts would only become realized in the event of a sale of the specific securities prior to maturity, allowances for credit losses or a credit default. For further information on the sensitivity of our portfolio to changes in interest rates, refer to the Interest Rate Risk section within "Item 7A. Quantitative and Qualitative Disclosures About Market Risk", included within this Annual Report on Form 10-K.
The following table summarizes the composition of our top ten corporate issuers included within our short-term investments and fixed maturity investments, classified as trading and AFS and the fixed maturity investments included within our funds held - directly managed balance as of December 31, 2020:
Fair ValueAverage Credit
Rating(in thousands of U.S.
dollars)
Bank of America Corp $ 110,894 AMorgan Stanley 101,614 ACitigroup Inc 96,346 A-JPMorgan Chase & Co 93,275 AComcast Corp 89,995 A-Wells Fargo & Co 87,733 AApple Inc 71,006 AA+HSBC Holdings PLC 56,849 AAT&T Inc 55,829 BBBOracle Corp 49,765 A-
$ 813,306
Table of Contents
67

Investment Results - ConsolidatedComparability of our investment results between periods is impacted by our acquisitions and significant new
business as described in Note 3 - "Business Acquisitions" and Note 4 - "Significant New Business" in the notes to our consolidated financial statements included within Item 8 of this Annual Report on Form 10-K.
The following tables summarize our consolidated investment results.
2020Non-Life Run-off Atrium StarStone Other Total
Net investment income:
Fixed income securities (1) $ 242,571 $ 4,440 $ 21,732 $ — $ 268,743
Cash and restricted cash 1,844 813 811 103 3,571
Other investments, including equities 51,478 492 6,742 (12,319) 46,393
Less: Investment expenses (13,845) (203) (1,842) — (15,890)
Total net investment income (expense) $ 282,048 $ 5,542 $ 27,443 $ (12,216) $ 302,817
Net realized gains (losses):
Fixed income securities (1) $ 146,673 $ (275) $ 8,027 $ — $ 154,425
Other investments, including equities 21,800 482 2,144 — 24,426
Total net realized gains $ 168,473 $ 207 $ 10,171 $ — $ 178,851
Net unrealized gains (losses):
Fixed income securities, trading (1) $ 153,519 $ 3,552 $ (5,212) $ — $ 151,859
Other investments, including equities 1,305,534 406 5,369 — 1,311,309
Total net unrealized gains $ 1,459,053 $ 3,958 $ 157 $ — $ 1,463,168
Total investment return included in earnings (A) $ 1,909,574 $ 9,707 $ 37,771 $ (12,216) $ 1,944,836
Other comprehensive income:Unrealized gains (losses), on fixed income securities, AFS, net of reclassification adjustments excluding foreign exchange (B) (1) $ 66,745 $ (17) $ 2,277 $ — $ 69,005
Total investment return = (A) + (B) $ 1,976,319 $ 9,690 $ 40,048 $ (12,216) $ 2,013,841
Income from fixed income assets (2) $ 244,415 $ 5,253 $ 22,543 $ 103 $ 272,314
Average aggregate fixed income assets, at cost (2)(3) 9,490,830 207,671 1,038,522 16,809 10,753,832
Investment book yield 2.58 % 2.53 % 2.17 % 0.61 % 2.53 %
Average aggregate invested assets, at fair value (3) $ 13,490,472 $ 235,649 $ 1,225,503 $ 16,809 $ 14,968,433
Investment return included in net earnings 14.15 % 4.12 % 3.08 % (72.68) % 12.99 %
Total investment return 14.65 % 4.11 % 3.27 % (72.68) % 13.45 %(1) Fixed income securities includes both trading and AFS short-term and fixed maturity investments as well as funds held - directly managed,
whereas fixed income securities, trading excludes AFS investments and fixed income, AFS excludes trading investments. (2) Fixed income assets includes fixed income securities and cash and restricted cash.(3) These amounts are an average of the amounts disclosed in our quarterly and annual U.S. GAAP consolidated financial statements.
Table of Contents
68

2019Non-Life Run-off Atrium StarStone Other Total
Net investment income:
Fixed income securities (1) $ 249,677 $ 5,422 $ 24,579 $ 567 $ 280,245
Cash and restricted cash 8,600 870 4,116 417 14,003
Other investments, including equities 29,576 1,047 7,364 (9,524) 28,463
Less: Investment expenses (12,617) (290) (1,663) 130 (14,440)
Total net investment income (expense) $ 275,236 $ 7,049 $ 34,396 $ (8,410) $ 308,271
Net realized gains (losses):
Fixed income securities (1) $ 78,573 $ 75 $ 3,646 $ 4,151 $ 86,445
Other investments, including equities (691) 126 191 — (374)
Total net realized gains $ 77,882 $ 201 $ 3,837 $ 4,151 $ 86,071
Net unrealized gains:
Fixed income securities, trading (1) $ 402,006 $ 4,321 $ 22,856 $ — $ 429,183
Other investments, including equities 488,462 1,673 4,879 1,698 496,712
Total net unrealized gains $ 890,468 $ 5,994 $ 27,735 $ 1,698 $ 925,895
Total investment return included in earnings (A) $ 1,243,586 $ 13,244 $ 65,968 $ (2,561) $ 1,320,237
Other comprehensive income:Unrealized gains (losses), on fixed income securities, AFS, net of reclassification adjustments excluding foreign exchange (B) (1) $ (1,064) $ 288 $ (24) $ (1,072) $ (1,872)
Total investment return = (A) + (B) $ 1,242,522 $ 13,532 $ 65,944 $ (3,633) $ 1,318,365
Income from fixed income assets (2) $ 258,277 $ 6,292 $ 28,695 $ 984 $ 294,248
Average aggregate fixed income assets, at cost (2)(3) 9,031,708 256,109 1,158,237 72,045 10,518,099
Investment book yield 2.86 % 2.46 % 2.48 % 1.37 % 2.80 %
Average aggregate invested assets, at fair value (3) $ 11,799,264 $ 270,590 $ 1,347,215 $ 79,478 $ 13,496,547
Investment return included in net earnings 10.54 % 4.89 % 4.90 % (3.22) % 9.78 %
Total investment return 10.53 % 5.00 % 4.89 % (4.57) % 9.77 %(1) Fixed income securities includes both trading and AFS short-term and fixed maturity investments as well as funds held - directly managed,
whereas fixed income securities, trading excludes AFS investments and fixed income, AFS excludes trading investments. (2) Fixed income assets includes fixed income securities and cash and restricted cash.(3) These amounts are an average of the amounts disclosed in our quarterly and annual U.S. GAAP consolidated financial statements.
Table of Contents
69

2018Non-Life Run-off Atrium StarStone Other Total
Net investment income:
Fixed income securities (1) $ 202,203 $ 4,696 $ 22,680 $ 1,397 $ 230,976
Cash and restricted cash 5,187 525 2,326 154 8,192
Other investments, including equities 25,469 739 4,033 1,370 31,611
Less: Investment expenses (6,572) (274) (2,039) (196) (9,081)
Total net investment income (expense) $ 226,287 $ 5,686 $ 27,000 $ 2,725 $ 261,698
Net realized gains (losses):
Fixed income securities (1) $ (26,845) $ (485) $ (4,087) $ 6 $ (31,411)
Other investments, including equities 3,272 226 518 — 4,016
Total net realized gains (losses) $ (23,573) $ (259) $ (3,569) $ 6 $ (27,395)
Net unrealized gains:
Fixed income securities, trading (1) $ (195,597) $ (2,029) $ (8,225) $ — $ (205,851)
Other investments, including equities (162,542) (963) (526) (10,255) (174,286)
Total net unrealized gains $ (358,139) $ (2,992) $ (8,751) $ (10,255) $ (380,137)
Total investment return included in earnings (A) $ (155,425) $ 2,435 $ 14,680 $ (7,524) $ (145,834)
Other comprehensive income:Unrealized gains (losses), on fixed income securities, AFS, net of reclassification adjustments excluding foreign exchange (B) (1) $ (44) $ (243) $ — $ (1,375) $ (1,662)
Total investment return = (A) + (B) $ (155,469) $ 2,192 $ 14,680 $ (8,899) $ (147,496)
Income from fixed income assets (2) $ 207,390 $ 5,221 $ 25,006 $ 1,551 $ 239,168
Average aggregate fixed income assets, at cost (2)(3) 7,537,621 265,238 1,535,360 160,359 9,498,578
Investment book yield 2.75 % 1.97 % 1.63 % 0.97 % 2.52 %
Average aggregate invested assets, at fair value (3) $ 9,041,377 $ 272,386 $ 1,670,240 $ 222,822 $ 11,206,825
Investment return included in net earnings (1.72) % 0.89 % 0.88 % (3.38) % (1.30) %
Total investment return (1.72) % 0.80 % 0.88 % (3.99) % (1.32) %(1) Fixed income securities includes both trading and AFS short-term and fixed maturity investments as well as funds held - directly managed
whereas, fixed income securities, trading excludes AFS investments and fixed income, AFS excludes trading investments. (2) Fixed income assets includes fixed income securities and cash and restricted cash.(3) These amounts are an average of the amounts disclosed in our quarterly and annual U.S. GAAP consolidated financial statements.
Net Investment Income:
2020 versus 2019: Net investment income decreased by $5.5 million for 2020 compared to 2019. There was a decrease of $11.5 million in net investment income from fixed maturities and a $17.9 million increase in other investment income and equities, partly offset by a decrease of $10.4 million in net investment income from cash and cash equivalents. There was an increase of $235.7 million in our average aggregate fixed maturities and cash and cash equivalents. The increase in our average aggregate fixed maturities and cash and cash equivalents was primarily due to the Hannover Re, Munich Re, Lyft, Aspen and AXA Group transactions in 2020 and the AmTrust RITC, Amerisure, Zurich and Maiden Re transactions in 2019. The book yield decreased by 27 basis points, primarily due to lower rates.
2019 versus 2018: Net investment income increased by $46.6 million for 2019 compared to 2018. There was an increase of $49.3 million in net investment income from fixed maturities and a $5.8 million in net investment income from cash and cash equivalents, partly offset by a $3.1 million decrease in other investment income and equities. There was an increase of $1.0 billion in our average aggregate fixed maturities and cash and cash equivalents. The increase in our average aggregate fixed maturities and cash and cash equivalents was primarily due to the Morse TEC, Zurich, Maiden Re Bermuda, Amerisure and the AmTrust RITC transactions in 2019. The book yield increased by 28 basis points, primarily due to the contractual yield received on the 2019 transactions.
Table of Contents
70

Net Realized and Unrealized Gains (Losses):
2020 versus 2019: Net realized and unrealized gains were $1.6 billion for 2020 compared to net realized and unrealized gains of $1.0 billion for 2019, an increase of $0.6 billion. Included in net realized and unrealized gains (losses) are the following items:
• Net realized and unrealized gains on fixed income securities, including fixed income securities within our funds held portfolios, of $306.3 million for 2020, compared to net realized and unrealized gains of $515.6 million for 2019, a decrease of $209.3 million. The gains in 2020 were primarily driven by a decline in interest rates, whereas the gains in 2019 were due to a combination of lower interest rates and tightening credit spreads;
• Net realized and unrealized gains on other investments, including equities of $1.3 billion for 2020 compared to $496.3 million for 2019, an increase of $839.4 million. The unrealized gains for 2020 primarily comprised unrealized gains of $1.2 billion in the hedge fund managed by AnglePoint. These unrealized gains were driven by strong performance in equity markets across multiple sectors, including consumer discretionary, communication services, information technology and consumer staples. Historical performance on these investments may not be indicative of future returns. The fund utilizes prime brokerage borrowings and derivatives for both hedging and investment purposes as part of a strategy that can generate significant returns. Funds that employ leverage through borrowings and derivatives can generate outsized returns but can also experience greater levels of volatility. The unrealized gains for 2019 primarily comprised unrealized gains in our hedge funds, equities, equity funds, fixed income funds, and private equity funds principally driven by declining interest rates, tightening credit spreads, and a favorable movement in equity markets.
2019 versus 2018: Net realized and unrealized gains were $1.0 billion for 2019 compared to net realized and unrealized losses of $407.5 million for 2018, an increase of $1.4 billion. Included in net realized and unrealized gains (losses) are the following items:
• Net realized and unrealized gains on fixed income securities, including fixed income securities within our funds held portfolios, of $515.6 million for 2019, compared to net realized and unrealized losses of $237.3 million for 2018, an increase of $752.9 million. The gains in 2019 were primarily driven by a decline in interest rates and tighter credit spreads, whereas the losses in 2018 were due to higher interest rates and wider credit spreads; and
• Net realized and unrealized gains on other investments, including equities of $496.3 million for 2019 compared to net realized and unrealized losses of $170.3 million for 2018, an increase of $666.6 million. The unrealized gains for 2019 primarily comprised unrealized gains in our hedge funds, equity funds, fixed income funds and private equity funds principally driven by declining interest rates, tighter credit spreads, and a more favorable movement in global equity markets in 2019. The unrealized losses in 2018 primarily comprised unrealized losses in our equity funds, call options on equity, hedge funds, fixed income funds and CLO equities, partially offset by unrealized gains on our private debt and private equities principally driven by higher interest rates and wider credit spreads.
Table of Contents
71

Liquidity and Capital ResourcesOverview
We aim to generate cash flows from our (re)insurance operations and investments, preserve sufficient capital for future acquisitions, and develop relationships with lenders who provide borrowing capacity at competitive rates.
Our capital resources as of December 31, 2020 included ordinary shareholders' equity of $6.2 billion, preferred equity of $510.0 million, redeemable noncontrolling interest of $365.4 million, our debt obligations of $1.4 billion. Based on our current loss reserves position, our portfolios of in-force (re)insurance business, and our investment positions, we believe we are well capitalized.
The following table details our capital position as of December 31, 2020 and 2019:
2020 2019 Change(in thousands of U.S. dollars)
Ordinary shareholders' equity $ 6,164,395 $ 4,332,183 $ 1,832,212 Series D and E Preferred Shares 510,000 510,000 — Total Enstar Group Limited Shareholders' Equity (A) 6,674,395 4,842,183 1,832,212 Noncontrolling interest 13,609 14,168 (559) Total Shareholders' Equity (B) 6,688,004 4,856,351 1,831,653
Senior Notes 843,447 842,216 1,231 Junior Subordinated Notes 344,812 — 344,812 Revolving credit facility 185,000 — 185,000 Term loan facility — 348,991 (348,991) Total debt (C) 1,373,259 1,191,207 182,052
Redeemable noncontrolling interest (D) 365,436 438,791 (73,355)
Total capitalization = (B) + (C) + (D) $ 8,426,699 $ 6,486,349 $ 1,940,350
Total capitalization attributable to Enstar = (A) + (C) $ 8,047,654 $ 6,033,390 $ 2,014,264
Debt to total capitalization 16.3 % 18.4 % (2.1) %Debt and Series D and E Preferred Shares to total capitalization 22.3 % 26.2 % (3.9) %
Debt to total capitalization attributable to Enstar 17.1 % 19.7 % (2.6) %
Debt and Series D and E Preferred Shares to total capitalization attributable to Enstar 23.4 % 28.2 % (4.8) %
As of December 31, 2020, we had $901.2 million of cash and cash equivalents, excluding restricted cash that supports (re)insurance operations, and included in this amount was $677.7 million held by our foreign subsidiaries outside of Bermuda. Based on our group's current corporate structure with a Bermuda domiciled parent company and the jurisdictions in which we operate, if the cash and cash equivalents held by our foreign subsidiaries were to be distributed to us, as dividends or otherwise, such amount would not be subject to incremental income taxes; however, in certain circumstances withholding taxes may be imposed by some jurisdictions, including by the United States. Based on existing tax laws, regulations and our current intentions, there were no accruals as of December 31, 2020 for any material withholding taxes on dividends or other distributions, as described in Note 20 - "Income Taxation" in the notes to our consolidated financial statements included within Item 8 of this Annual Report on Form 10-K.
DividendsHistorically, Enstar has not declared a dividend on its ordinary shares. The strategy has been to retain
earnings and invest distributions from operating subsidiaries into our business. We may re-evaluate this strategy from time to time based on overall market conditions and other factors, but we do not currently expect to pay any dividends on our ordinary shares.
On June 28, 2018, we issued 16,000 Series D Preferred Shares with an aggregate liquidation value of $400.0 million. On November 21, 2018, we issued 4,400 Series E Preferred Shares with an aggregate liquidation value of
Table of Contents
72

$110.0 million. The dividends on the Series D and E Preferred Shares are non-cumulative and may be paid quarterly in arrears on the first day of March, June, September and December of each year, only when, as and if declared. For further information on preferred share dividends, refer to Note 17 - "Shareholders' Equity" in the notes to our consolidated financial statements included within Item 8 of this Annual Report on Form 10-K.
Any payment of common or preferred dividends must be approved by our Board of Directors. Our ability to pay ordinary and preferred dividends is subject to certain restrictions, as described in Note 22 - "Dividend Restrictions and Statutory Financial Information" in the notes to our consolidated financial statements included within Item 8 of this Annual Report on Form 10-K.
Sources and Uses of CashHolding Company Liquidity
The potential sources of cash flows to Enstar as a holding company consist of cash flows from our subsidiaries including dividends, advances and loans, and interest income on loans to our subsidiaries. We also utilize our credit and loan facilities, and we have issued senior notes and preferred shares and guaranteed junior subordinated notes issued by one of our subsidiaries.
We use cash to fund new acquisitions of companies and significant new business. We also utilize cash for our operating expenses associated with being a public company and to pay dividends on our preference shares and interest and principal on loans from subsidiaries and debt obligations, including loans under our credit facilities, our 4.50% senior notes due 2022 (the “2022 Senior Notes”), our 4.95% senior notes due 2029 (the "2029 Senior Notes” and, together with the 2022 Senior Notes, the "Senior Notes") and our 5.75% Junior Subordinated Notes due 2040 (the “Junior Subordinated Notes”), as well as for ordinary share repurchases. Under the eligible capital rules of the Bermuda Monetary Authority, the Senior Notes qualify as Tier 3 capital and the Preferred Shares and Junior Subordinated Notes qualify as Tier 2 capital when considering the BSCR.
Our holding company cash flows are summarized in "Item 8. Financial Statements and Supplementary Data - Schedule II - Condensed Financial Information of Registrant - Statements of Cash Flows - Parent Company Only" for the years ended December 31, 2020, 2019 and 2018" and the notes thereto.
We may, from time to time, raise capital from the issuance of equity, debt or other securities as we continuously evaluate our strategic opportunities. We filed an automatic shelf registration statement on August 17, 2020 with the U.S. Securities and Exchange Commission ("SEC") to allow us to conduct future offerings of certain securities, if desired, including debt, equity and other securities.
As we are a holding company and have no substantial operations of our own, our assets consist primarily of investments in subsidiaries and our loans and advances to subsidiaries. Dividends from our (re)insurance subsidiaries are restricted by (re)insurance laws and regulations, as described below. The ability of all of our subsidiaries to make distributions and transfers to us may also be restricted by, among other things, other applicable laws and regulations and the terms of our credit facilities and our subsidiaries’ bank loans and other issued debt instruments.
U.S. Finance Company Liquidity
Enstar Finance LLC ("Enstar Finance") is a wholly-owned finance subsidiary and is dependent upon funds from other subsidiaries to pay any amounts due under the Junior Subordinated Notes. In addition, as noted above, we are a holding company that conducts substantially all of our operations through our subsidiaries. Our only significant assets are the capital stock of our subsidiaries. Because substantially all of our operations are conducted through our (re)insurance subsidiaries, substantially all of our consolidated assets are held by our subsidiaries and most of our cash flow, and, consequently, our ability to pay any amounts due under the guaranty of the Junior Subordinated Notes, is dependent upon the earnings of our subsidiaries and the transfer of funds by those subsidiaries to us in the form of distributions or loans.
In addition, the ability of our (re)insurance subsidiaries to make distributions or other transfers to Enstar Finance or us is limited by applicable insurance laws and regulations, as described below. These laws and regulations and the determinations by the regulators implementing them may significantly restrict such distributions and transfers, and, as a result, adversely affect the overall liquidity of Enstar Finance or us. The ability of all of our subsidiaries to make distributions and transfers to Enstar Finance and us may also be restricted by, among other things, other applicable laws and regulations and the terms of our credit facilities and our subsidiaries’ bank loans and other issued debt instruments.
Operating Company Liquidity
The ability of our (re)insurance subsidiaries to pay dividends and make other distributions is limited by the
Table of Contents
73

applicable laws and regulations of the jurisdictions in which our (re)insurance subsidiaries operate, including Bermuda, the United Kingdom, the United States, Australia and Continental Europe, which subject these subsidiaries to significant regulatory restrictions. These laws and regulations require, among other things, certain of our (re)insurance subsidiaries to maintain minimum capital requirements and limit the amount of dividends and other payments that these subsidiaries can pay to us, which in turn may limit our ability to pay dividends and make other payments. For more information on these laws and regulations, see "Item 1. Business - Regulation." As of December 31, 2020, all of our (re)insurance subsidiaries’ capital requirement levels were in excess of the minimum levels required. The ability of our subsidiaries to pay dividends is subject to certain restrictions, as described in Note 22 - "Dividend Restrictions and Statutory Financial Information" in the notes to our consolidated financial statements included within Item 8 of this Annual Report on Form 10-K. Our subsidiaries’ ability to pay dividends and make other forms of distributions may also be limited by our repayment obligations under certain of our outstanding credit facility agreements and other debt instruments. Variability in ultimate loss payments may also result in increased liquidity requirements for our subsidiaries. During 2020 and 2019, our regulated subsidiaries paid aggregate capital distributions and dividends of $706.9 million and $530.6 million, respectively.
In the Non-life Run-off segment, sources of funds primarily consist of cash and investment portfolios acquired on the completion of acquisitions and loss portfolio transfer reinsurance agreements. Cash balances acquired upon our purchase of insurance or reinsurance companies are classified as cash provided by investing activities. Cash acquired from loss portfolio transfers and other reinsurance agreements is classified as cash provided by operating activities. We expect to use funds acquired from cash and investment portfolios, collected premiums, collections from reinsurance debtors, fees and commission income, investment income and proceeds from sales and redemptions of investments to meet expected claims payments and operational expenses, with the remainder used for acquisitions and additional investments. In the Non-life Run-off segment, we generally expect negative operating cash flows to be met by positive investing cash flows; however, cash provided by operating activities was positive for 2020 and 2019 as the proceeds from sales and maturities of trading securities exceeded cash used in the purchase of trading securities, with the net proceeds being used in the purchase of AFS securities included within investing cash flows.
In the Atrium segment, we expect positive cash flows from operations as investment income earned and collected premiums should generally be in excess of total net claim payments, losses incurred on earned premiums and operating expenses. As a result of the sale of StarStone U.S. and the decision to place StarStone International into run-off, we expect net neutral cash flows from operations as net claim payments, losses incurred on earned premiums and operating expenses are met by cash inflows from investment income, collection of premium receivable and proceeds from sales and maturities of investments.
Overall, we expect our cash flows, together with our existing capital base and cash and investments acquired on the acquisition of business, to be sufficient to meet cash requirements and to operate our business.
Cash Flows
The following table summarizes our consolidated cash flows provided by (used in) operating, investing and financing activities.
2020 2019 Change 2018 Change(in thousands of U.S. dollars)
Cash provided by (used in):Operating activities $ 2,786,366 $ 1,424,449 $ 1,361,917 $ (141,609) $ 1,566,058 Investing activities (2,335,436) (1,603,310) (732,126) (827,085) (776,225) Financing activities 117,406 248,538 (131,132) 701,986 (453,448)
Net cash flows from discontinued operations (21,996) 3,840 (25,836) 33,868 (30,028) Effect of exchange rate changes on cash (5,800) (324) (5,476) 2,588 (2,912) Net increase (decrease) in cash and cash equivalents 540,540 73,193 467,347 (230,252) 303,445 Cash and cash equivalents, beginning of year 971,349 901,996 69,353 1,166,116 (264,120) Net change in cash of businesses held-for-sale (138,773) (3,840) (134,933) (33,868) 30,028 Cash and cash equivalents, end of year $ 1,373,116 $ 971,349 $ 401,767 $ 901,996 $ 69,353
Details of our consolidated cash flows are included in "Item 8. Financial Statements and Supplementary Data - Consolidated Statements of Cash Flows for the years ended December 31, 2020, 2019 and 2018" of this Annual Report on Form 10-K.
2020 versus 2019: Cash and cash equivalents increased by $540.5 million in 2020 compared to $73.2 million during 2019.
Table of Contents
74

Cash and cash equivalents increased by $540.5 million in 2020, as cash provided by operating and financing activities of $2.8 billion and $117.4 million, respectively, was partially offset by cash used in investing activities of $2.3 billion. Cash provided by operations in 2020 was predominantly driven by: (i) the proceeds from net sales and maturities of trading securities of $1.7 billion; and (ii) cash and restricted cash acquired in Non-life Run-off reinsurance transactions of $1.6 billion; partially offset by the timing of paid losses. Cash provided by financing activities in 2020 was primarily attributable to net inflows of $179.5 million from loan obligations, partially offset by share repurchases and preferred share dividends. Cash used in investing activities in 2020 primarily related to net purchases of AFS securities of $1.9 billion and net subscriptions of other investments of $380.3 million. Change in cash of business held-for-sale is due to the classification of the assets and liabilities of Northshore as held-for-sale as of December 31, 2020 and the disposal of StarStone U.S.
Cash and cash equivalents increased by $73.2 million in 2019, as cash provided by operating and financing activities of $1.4 billion and $248.5 million, respectively, was partially offset by cash used in investing activities of $1.6 billion. Cash provided by operations in 2019 was largely the result of: (i) the proceeds from net sales and maturities of trading securities of $956.5 million; and (ii) cash and restricted cash acquired in Non-life Run-off reinsurance transactions of $1.2 billion; partially offset by the timing of paid losses. Cash provided by financing activities in 2019 was primarily attributable to an increase in debt obligations of $327.9 million due to the issuance of the 2029 Senior Notes, partially offset by a $150.0 million repayment of the 2018 EGL Term Loan Facility. Cash used in investing activities in 2019 was primarily related to net purchases of AFS securities of $1.5 billion and net subscriptions of other investments of $213.0 million, partially offset by cash acquired on the acquisition of Morse TEC.
2019 versus 2018: Cash and cash equivalents increased by $73.2 million in 2019 compared with a decrease of $230.3 million during 2018.
Cash and cash equivalents decreased by $230.3 million in 2018, as cash used in investing and operating activities of $827.1 million and $141.6 million, respectively, was partially offset by cash provided by financing activities of $702.0 million. Cash used in investing activities in 2018 was primarily related to net subscriptions of other investments of $466.0 million, cash paid on acquisitions, net of cash acquired of $245.2 million and the purchase of equity method investments of $155.4 million. Cash used in operations was largely the result of net purchases of trading securities of $637.6 million and the timing of paid losses, partially offset by cash and restricted cash acquired in Non-life Run-off reinsurance transactions of $652.0 million. Cash provided by financing activities in 2018 primarily related to net proceeds of $495.4 million from the issuance of the Series D and E Preferred Shares, net inflows of $218.2 million from our credit facilities, which were principally used to fund new business and acquisitions, $55.4 million of inflows in respect of contributions by noncontrolling interests, partially offset by dividends paid on preferred shares of $12.1 million and to noncontrolling interests of $3.9 million.
Investable AssetsWe define investable assets as the sum of total investments, cash and cash equivalents, restricted cash and
cash equivalents and funds held. Investable assets were $17.3 billion as of December 31, 2020 as compared to $14.1 billion as of December 31, 2019, an increase of 22.7%. The increase was primarily due to assets acquired and unrealized gains on investments. For information regarding our investment strategy and our portfolio and results, refer to "Item 1. Business - Investments" and to "Item 7. Management’s Discussion and Analysis of Financial Condition and Results of Operations - Investable Assets," respectively.
Reinsurance Balances Recoverable on Paid and Unpaid LossesAs of December 31, 2020 and 2019, we had reinsurance balances recoverable on paid and unpaid losses of
$2.1 billion and $2.2 billion, respectively.
Our (re)insurance run-off subsidiaries and portfolios, prior to acquisition, used retrocessional agreements to reduce their exposure to the risk of (re)insurance assumed. On an annual basis, both Atrium and StarStone purchased a tailored outwards reinsurance program designed to manage their risk profile. The majority of Atrium's and StarStone's third-party reinsurance is with highly rated reinsurers or is collateralized by letters of credit.
We remain liable to the extent that retrocessionaires do not meet their obligations under these agreements, and therefore, we evaluate and monitor concentration of credit risk among our reinsurers. Provisions are made for amounts considered potentially uncollectible.
For further information regarding our reinsurance balances recoverable on paid and unpaid losses, refer to Note 8 - "Reinsurance Balances Recoverable on Paid and Unpaid Losses" in the notes to our consolidated financial statements included within Item 8 of this Annual Report on Form 10-K.
Table of Contents
75
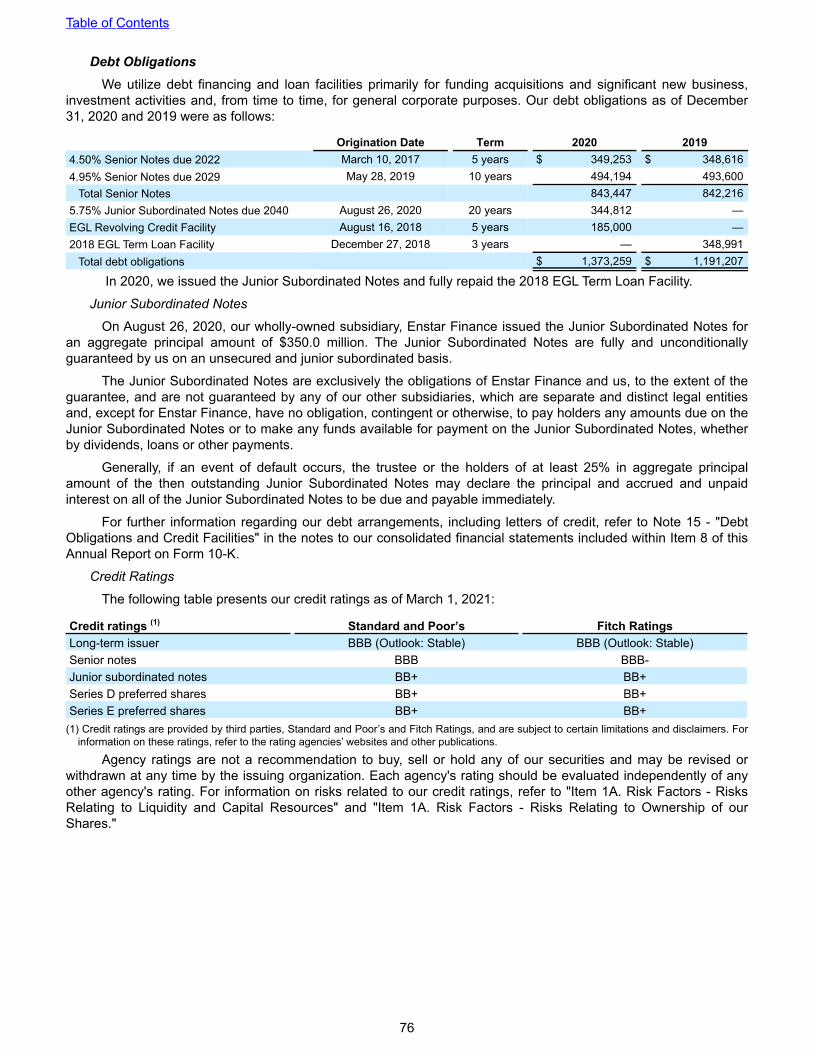
Debt ObligationsWe utilize debt financing and loan facilities primarily for funding acquisitions and significant new business,
investment activities and, from time to time, for general corporate purposes. Our debt obligations as of December 31, 2020 and 2019 were as follows:
Origination Date Term 2020 20194.50% Senior Notes due 2022 March 10, 2017 5 years $ 349,253 $ 348,616 4.95% Senior Notes due 2029 May 28, 2019 10 years 494,194 493,600
Total Senior Notes 843,447 842,216 5.75% Junior Subordinated Notes due 2040 August 26, 2020 20 years 344,812 — EGL Revolving Credit Facility August 16, 2018 5 years 185,000 — 2018 EGL Term Loan Facility December 27, 2018 3 years — 348,991
Total debt obligations $ 1,373,259 $ 1,191,207
In 2020, we issued the Junior Subordinated Notes and fully repaid the 2018 EGL Term Loan Facility.
Junior Subordinated Notes
On August 26, 2020, our wholly-owned subsidiary, Enstar Finance issued the Junior Subordinated Notes for an aggregate principal amount of $350.0 million. The Junior Subordinated Notes are fully and unconditionally guaranteed by us on an unsecured and junior subordinated basis.
The Junior Subordinated Notes are exclusively the obligations of Enstar Finance and us, to the extent of the guarantee, and are not guaranteed by any of our other subsidiaries, which are separate and distinct legal entities and, except for Enstar Finance, have no obligation, contingent or otherwise, to pay holders any amounts due on the Junior Subordinated Notes or to make any funds available for payment on the Junior Subordinated Notes, whether by dividends, loans or other payments.
Generally, if an event of default occurs, the trustee or the holders of at least 25% in aggregate principal amount of the then outstanding Junior Subordinated Notes may declare the principal and accrued and unpaid interest on all of the Junior Subordinated Notes to be due and payable immediately.
For further information regarding our debt arrangements, including letters of credit, refer to Note 15 - "Debt Obligations and Credit Facilities" in the notes to our consolidated financial statements included within Item 8 of this Annual Report on Form 10-K.
Credit Ratings
The following table presents our credit ratings as of March 1, 2021:
Credit ratings (1) Standard and Poor’s Fitch RatingsLong-term issuer BBB (Outlook: Stable) BBB (Outlook: Stable)Senior notes BBB BBB- Junior subordinated notes BB+ BB+Series D preferred shares BB+ BB+Series E preferred shares BB+ BB+
(1) Credit ratings are provided by third parties, Standard and Poor’s and Fitch Ratings, and are subject to certain limitations and disclaimers. For information on these ratings, refer to the rating agencies’ websites and other publications.
Agency ratings are not a recommendation to buy, sell or hold any of our securities and may be revised or withdrawn at any time by the issuing organization. Each agency's rating should be evaluated independently of any other agency's rating. For information on risks related to our credit ratings, refer to "Item 1A. Risk Factors - Risks Relating to Liquidity and Capital Resources" and "Item 1A. Risk Factors - Risks Relating to Ownership of our Shares."
Table of Contents
76

Contractual ObligationsThe following table summarizes, as of December 31, 2020, our future payments under material contractual
obligations and estimated payments for losses and LAE by expected payment date. The table includes only obligations that are expected to be settled in cash.
Total
Less than
1 Year1 - 3
years3 - 5
years6 - 10years
More than
10 Years (in millions of U.S. dollars)Operating Activities
Estimated gross reserves for losses and LAE (1)
Asbestos $ 1,778.5 $ 145.6 $ 263.0 $ 216.9 $ 337.8 $ 815.2 Environmental 302.9 34.1 58.5 44.5 60.8 105.0 General Casualty 1,890.4 261.1 380.5 462.9 659.6 126.3 Workers' compensation/personal accident 2,005.6 175.7 319.7 336.1 415.1 759.0 Marine, aviation and transit 344.6 73.3 90.6 54.1 66.6 60.0 Construction defect 109.0 28.4 39.0 21.1 13.3 7.2 Professional indemnity/ Directors & Officers 1,101.5 187.4 262.6 254.6 326.0 70.9 Motor 974.7 346.7 283.7 95.3 92.0 157.0 Property 152.2 51.4 47.0 22.3 19.3 12.2 Other 422.5 107.2 86.7 58.5 68.0 102.1
Total Non-Life Run-off 9,081.9 1,410.9 1,831.3 1,566.3 2,058.5 2,214.9 StarStone International (Non-U.S.) 1,293.2 438.7 456.1 208.4 152.2 37.8 Other 30.3 8.1 8.2 5.1 8.9 — ULAE 385.7 67.0 87.1 60.7 75.8 95.1
Estimated gross reserves for losses and LAE (1) 10,791.1 1,924.7 2,382.7 1,840.5 2,295.4 2,347.8
Investing ActivitiesInvestment commitments 1,049.2 442.7 298.4 181.1 127.0 —
Financing ActivitiesLoan repayments (including estimated interest payments) 2,034.6 66.1 640.2 89.8 687.3 551.2
Total $ 13,874.9 $ 2,433.5 $ 3,321.3 $ 2,111.4 $ 3,109.7 $ 2,899.0 (1) The reserves for losses and LAE represent management’s estimate of the ultimate cost of settling losses. The estimation of losses is based on
various complex and subjective judgments. Actual losses paid may differ, perhaps significantly, from the reserve estimates reflected in our financial statements. Similarly, the timing of payment of our estimated losses is not fixed and there may be significant changes in actual payment activity. The assumptions used in estimating the likely payments due by period are based on our historical claims payment experience and industry payment patterns, but due to the inherent uncertainty in the process of estimating the timing of such payments, there is a risk that the amounts paid in any such period can be significantly different from the amounts disclosed above. The amounts in the above table represent our estimates of known liabilities as of December 31, 2020 and do not take into account corresponding reinsurance recoverable amounts that would be due to us. Furthermore, certain of the reserves included in the audited consolidated financial statements as of December 31, 2020 were acquired by us and initially recorded at fair value with subsequent amortization, whereas the expected payments by period in the table above are the estimated payments at a future time and do not reflect the fair value adjustment in the amount payable.
As of December 31, 2020, excluding fair value adjustments, we expect to pay estimated gross losses and LAE of $1.9 billion in the short-term (less than one year) and $8.9 billion in the long-term (more than one year). We generally attempt to match the duration of our investment portfolio to the duration of our general liability profile. We generally seek to maintain investment portfolios that are shorter or of equivalent duration to the liabilities in order to provide liquidity for the settlement of losses and, where possible, to avoid having to liquidate longer-dated investments. In the Non-life Run-off segment, the settlement of liabilities also have the potential to accelerate the natural payout of losses, which may require additional liquidity.
Table of Contents
77

In addition to the contractual obligations noted in the table above, as of December 31, 2020, we had the right to purchase the RNCI related to Atrium and StarStone from the Trident V Funds and the Dowling Funds after a certain time in the future (a "call right") and the RNCI holders had the right to sell their RNCI interests to us after a certain time in the future (a "put right"). Following closing of the Exchange Transaction described in Note 21 - "Related Party Transactions" in the notes to our consolidated financial statements included within Item 8 of this Annual Report on Form 10-K, we hold a call right over the remaining portion of StarStone owned by the Trident V Funds and the Dowling Funds, and they hold a put right to transfer those interests to us.
For additional information relating to our commitments and contingencies, see Note 23 - "Commitments and Contingencies" in the notes to our consolidated financial statements included within Item 8 of this Annual Report on Form 10-K. For information relating to our defendant asbestos and environmental liabilities, see Note 11 - "Defendant Asbestos and Environmental Liabilities" in the notes to our consolidated financial statements included within Item 8 of this Annual Report on Form 10-K.
Off-Balance Sheet Arrangements As of December 31, 2020, we did not have any off-balance sheet arrangements, as defined by SEC rules and
regulations.
Critical Accounting EstimatesWe believe the following accounting policies impact the most significant judgments and estimates used in the
preparation of our financial statements.
Losses and LAENon-Life Run-off
For a breakdown of our Non-Life Run-off gross and net losses and LAE reserves, including Outstanding Loss Reserves ("OLR") and IBNR by line of business, fair value adjustments resulting from business combinations, adjustments related to retroactive reinsurance contracts for which we have elected the fair value option, deferred charge assets and gain liabilities and ULAE, as of December 31, 2020 and 2019, refer to Note 10 - "Losses and Loss Adjustment Expenses" in the notes to our consolidated financial statements included within Item 8 of this Annual Report on Form 10-K.
As of December 31, 2020 and 2019, IBNR reserves (net of reinsurance balances recoverable) accounted for $4.1 billion, or 54.1%, and $3.3 billion, or 48.8%, respectively, of our total Non-life Run-off net losses and LAE reserves, excluding the fair value adjustments, deferred charge assets and gain liabilities and ULAE.
Our primary objective in running off the operations of acquired companies and portfolios of (re)insurance business in run-off is to increase our book value by settling loss reserves below their acquired fair value and earning investment income on the cash and investments backing the loss reserves. The earnings generated from each acquired company or portfolio of (re)insurance business, together with the related decrease in loss reserves, leads to a reduction in the capital required for each company, thereby providing the ability to distribute both earnings and excess capital to us to finance the new business acquisitions and reinsurance transactions and for general corporate purposes.
We adopt a disciplined claims management approach to pay only valid claims and pay such claims on a timely basis and endeavor to reduce the level of acquired LAE provisions by streamlining claims handling procedures. We also actively pursue commutations of both our acquired LAE provisions and reinsurance recoverable assets.
We would expect that over the targeted duration of the run-off of our acquired companies and portfolios of (re)insurance business, the acquired ultimate loss reserves would settle below the acquired fair value, resulting in reductions in ultimate losses and LAE liabilities resulting in earnings to us. There can be no assurance, however, that we will successfully implement our run-off strategy.
Commutations of blocks of policies, along with disciplined claims management, have the potential to produce favorable claims development compared to established reserves. For each newly-acquired company and assumed (re)insurance business in run-off, we determine a commutation strategy that broadly identifies commutation targets using the following criteria:
• previous commutations completed by existing portfolio companies with policyholders of the newly-acquired company or assumed (re)insurance business in run-off;
• nature of liabilities;
• size of incurred loss reserves;
Table of Contents
78

• recent loss development history; and
• targets for claims audits.
Once commutation targets are identified, they are prioritized into target years of completion. At the beginning of each year, the approach to commutation negotiations is determined by the commutation team, including claims and exposure analysis and broker account reconciliations. On completion of this analysis, settlement parameters are set around incurred liabilities. Commutation discussions can take many months or even years to come to fruition. Commutation targets not completed in a particular year are re-prioritized for the following year.
Every commutation, irrespective of value, requires the approval of our senior management. The impact of the commutation activity on the IBNR reserve is reflected as part of our annual actuarial reviews of reserves. However, if a significant commutation is completed during the year, loss reserves will be adjusted in the corresponding quarter to reflect management’s then best estimate of the impact of the commutation on the remaining IBNR reserves.
Commutations of our acquired LAE provisions provide an opportunity for us to exit exposures to entire policies with (re)insureds for an agreed upon payment, or payments, often at a discount to the previously estimated ultimate liability. As a result of exiting all exposures to such policies, all advised case reserves and IBNR reserves relating to the insured or reinsured are eliminated. A commutation is recognized upon the execution of a commutation release agreement. Following completion of a commutation, all the related balances, including insurance and reinsurance balances payable and/or receivable, funds held by ceding companies, and losses and LAE (including fair value adjustments and estimated IBNR), are written off with the corresponding gain or loss recorded in the net reduction of ultimate losses. A commutation may result in a net gain irrespective of whether the settlement exceeds the advised case reserves. Advised case reserves are those reserve estimates for a specific loss or losses reported by either the broker or (re)insured.
Commutations of outward reinsurance business provide an opportunity for us to accelerate the collection of our ceded reinsurance asset in exchange for assuming the previously reinsured risk. In such instance, we receive a cash payment from our reinsurer, which is recorded as a negative paid loss and the ceded case and IBNR reserves attributable to the commuted business will be written down to zero, resulting in an increase to our net case and IBNR reserves. If we are successful in executing on our claims management strategies, we may realize the benefit of settling these assumed claims for less than their acquired value; however, there is no assurance that we will be successful in executing these strategies.
IBNR reserves are established at a class of business level. A commutation settlement is a negotiated settlement of both the advised case reserves and an estimate of the IBNR reserves that relate to the policies being commuted.
For latent exposures with a long reporting tail, the estimated level of IBNR reserves may be significantly higher than the advised case reserves. In such an instance, the commutation settlement of a block of such policies may be greater than the advised case reserves but less than the aggregate of the advised case reserves plus the estimated related IBNR reserves, resulting in overall savings being realized on the total recorded ultimate liability.
On a quarterly basis, we adjust our estimates of ultimate loss and LAE liabilities in the quarter that any significant commutation is concluded. The agreed commutation settlement is recorded in net losses paid.
To the extent that commuted policies are protected by reinsurance, then we will, on completion of a commutation with an (re)insured, negotiate with the reinsurers to contribute their share of the commutation settlement. Any amounts received from such reinsurers will be recorded in net losses paid and the impact of any savings or loss on reinsurance recoverable on unpaid losses will be included in the actuarial reassessment of net ultimate liabilities.
Annual Losses and Loss Adjustment Reviews
Because a significant amount of time can lapse between the assumption of risk, the occurrence of a loss event, the reporting of the event to an (re)insurance company and the ultimate payment of the claim on the loss event, the liability for unpaid losses and LAE is based largely upon estimates. On a quarterly basis, our management must use considerable judgment in the process of developing these estimates. Management reviews the actual loss development in the quarter and receives input from the actuarial, claims and legal staff on the drivers of any favorable or unfavorable loss emergence. The liability for unpaid losses and LAE for property and casualty business includes amounts determined from loss reports on individual cases and amounts for IBNR reserves.
Loss advices or reports from ceding companies are generally provided via the placing broker and comprise treaty statements, individual claims files, electronic messages and large loss advices or cash calls.
Table of Contents
79

• Large loss advices and cash calls are provided to us as soon as practicable after an individual loss or claim is made or settled by the insured.
• The remaining broker advices are issued monthly, quarterly or annually depending on the provisions of the individual policies or the ceding company’s practice.
• For certain direct insurance policies where the claims are managed by Third Party Administrators (TPAs) and Managing General Agents (MGAs), loss bordereaux are received either monthly or quarterly depending on the arrangement with the TPA and MGA. Loss advices for direct insurance policies may be received from the broker, agent or directly from the insured.
Where we provide reinsurance or retrocession reinsurance protection, the process of claims advice from the direct insurer to the reinsurers and/or retrocessionaires naturally involves more levels of communication, which inevitably creates delays or lags in the receipt of loss advice by the reinsurers/retrocessionaires relative to the date of first advice to the direct insurer. Certain types of exposure, typically latent health exposures such as asbestos-related claims, have inherently long reporting delays, in some cases many years, from the date a loss occurred to the manifestation and reporting of a claim and ultimately until the final settlement of the claim.
An industry-wide weakness in cedant reporting affects the adequacy and accuracy of reserving for advised claims. We attempt to mitigate this inherent weakness as follows:
• We closely monitor cedant loss reporting and, for those cedants identified as providing inadequate, untimely or unusual reporting of losses, we conduct, in accordance with the provisions of the insurance and (re)insurance contracts, detailed claims audits at the (re)insured’s premises. Such claims audits have the benefit of validating advised claims, determining whether the cedant’s loss reserving practices and reporting are adequate and identifying potential loss reserving issues of which our actuaries need to be made aware. Any required adjustments to advised claims reserves reported by cedants identified during the claims audits will be recorded as an adjustment to the advised case reserve.
• Onsite claims audits are often supplemented by further reviews by our internal and external legal advisors to determine the reasonableness of advised case reserves and, if considered necessary, an adjustment to the reported case reserve will be recorded.
• Our actuaries project expected paid and incurred loss development for each class of business, which is monitored on a quarterly basis. Should actual paid and incurred development differ significantly from the expected paid and incurred development, we will investigate the cause and, in conjunction with our actuaries, consider whether any adjustment to total loss reserves is required.
• Our actuaries consider the quality of ceding company data as part of their ongoing evaluation of the liability for ultimate losses and LAE, and the methodologies they select for estimating ultimate losses inherently compensate for potential weaknesses in this data, including weaknesses in loss reports provided by cedants.
We strive to apply the highest standards of discipline and professionalism to our claims adjusting, processing and settlement, and disputes with cedants are rare. However, we are from time to time involved in various disputes and legal proceedings in the ordinary course of our claims adjusting process. We are often involved in disputes commenced by other co-insurers who act in unison with any litigation or dispute resolution controlled by the lead underwriter. Coverage disputes arise when the insured/reinsured and insurer/reinsurer cannot reach agreement as to the interpretation of the policy and/or application of the policy to a claim. Most (re)insurance policies contain dispute resolution clauses requiring arbitration or mediation. In the absence of a contractual dispute resolution process, civil litigation would be commenced. We aim to reach a commercially acceptable resolution to any dispute, using arbitration or litigation as a last resort. We regularly monitor and provide internal reports on disputes involving arbitration and litigation and engage external legal counsel to provide professional advice and assist with case management.
In establishing reserves, management includes amounts for IBNR reserves using information from the actuarial estimates of ultimate losses. We use generally accepted actuarial methodologies to estimate ultimate losses and LAE and those estimates are reviewed by our management. On an annual basis, independent actuarial firms are retained by management to provide their estimates of ultimate losses and to review the estimates developed by our actuaries.
Nearly all of our unpaid claims liabilities are considered to have a long claims payout tail. Net loss reserves, excluding the fair value adjustments, deferred charge assets and gain liabilities and ULAE, for our Non-life Run-off subsidiaries relate primarily to casualty exposures, including latent claims, of which 24.2% in 2020 (2019: 31.0%) related to asbestos and environmental ("A&E") exposures.
Table of Contents
80

Within the annual loss reserve studies produced by either our actuaries or independent actuaries, exposures for each subsidiary are separated into homogeneous reserving categories for the purpose of estimating IBNR. Each reserving category contains either direct insurance or assumed reinsurance reserves and groups relatively similar types of risks and exposures (for example, asbestos, environmental, casualty, property) and lines of business written (for example, marine, aviation, non-marine). Based on the exposure characteristics and the nature of available data for each individual reserving category, a number of methodologies are applied. Recorded reserves for each category are selected from the actuarial indications produced by the various methodologies after consideration of exposure characteristics, data limitations and strengths and weaknesses of each method applied. This approach to estimating IBNR has been consistently adopted in the annual loss reserve studies for each period presented.
Our management, through the loss reserving committees, considers the reasonableness of loss reserves recommended by our actuaries, including actual loss development during the year, using the following reports produced internally on a quarterly basis for each of our (re)insurance subsidiaries:
• Gross, ceded and net incurred loss report - This report provides, for each reporting period, the total (including commuted policies) gross, ceded and net incurred loss development for each company and a commentary on each company’s loss development. The report highlights the causes of any unusual or significant loss development activity (including commutations).
• Actual versus expected gross incurred loss development schedule - This schedule provides a summary, and commentary thereon, of each company’s (excluding companies or portfolios of business acquired in the current year) non-commuted incurred gross losses compared to the estimate of the development of non-commuted incurred gross losses provided by our actuaries at the beginning of the year as part of the prior year’s reserving process.
• Commutations summary schedule - This schedule summarizes all commutations completed during the year for all companies, and identifies the policyholder with which we commuted, the incurred losses settled by the commutation (comprising outstanding unpaid losses and case reserves) and the amount of the commutation settlement.
• Analysis of paid, incurred and ultimate losses - This analysis for each company, and in the aggregate, provides a summary of the gross, ceded and net paid and incurred losses and the impact of applying our actuaries’ recommended loss reserves. This report, reviewed in conjunction with the previous reports, provides an analytical tool to review each company’s incurred loss or gain and reduction or increase in IBNR reserves to assess whether the ultimate reduction or increase in loss reserves appears reasonable in light of known developments within each company.
The above reports provide management with the relevant information to determine whether loss development (including commutations) during the year has, for each company, been sufficiently meaningful so as to warrant an adjustment to the reserves recommended by our actuaries in the most recent actuarial study.
When establishing loss reserves we have an expectation that, in the absence of commutations and significant favorable or unfavorable non-commuted loss development compared to expectations, loss reserves will not exceed the high, or be less than the low, end of the following ranges of gross losses and LAE reserves implied by the various methodologies used by each of our (re)insurance subsidiaries as of December 31, 2020.
Table of Contents
81

The range of gross loss and LAE reserves implied by the various methodologies used by each of our (re)insurance subsidiaries as of December 31, 2020 and 2019 is presented in the following table ("Range of Outcomes"):
2020 2019Low Selected High Low Selected High
(in thousands of U.S. dollars)Asbestos $ 1,530,983 $ 1,778,539 $ 2,162,145 $ 1,639,077 $ 1,916,359 $ 2,447,051 Environmental 261,105 302,894 366,789 296,253 343,286 413,991 General casualty 1,513,079 1,890,428 2,229,347 875,288 990,992 1,116,946 Workers' compensation/personal accident 1,674,984 2,005,562 2,281,656 1,983,940 2,248,338 2,555,782 Marine, aviation and transit 305,496 344,550 387,300 368,090 411,644 480,875 Construction defect 97,304 108,958 124,341 112,549 128,084 145,253 Professional indemnity/Directors & Officers 960,300 1,101,473 1,241,179 876,445 959,250 1,062,111 Motor 850,161 974,726 1,105,808 633,338 714,474 800,217 Property 135,688 152,230 168,983 184,028 204,224 226,688 Other 363,350 422,565 486,125 380,793 435,838 520,909
7,692,450 9,081,925 10,553,673 7,349,801 8,352,489 9,769,823 Fair value adjustments (125,423) (142,854) (163,303) (147,158) (170,689) (194,310) Fair value adjustments - fair value option (47,286) (54,589) (62,491) (190,549) (217,933) (265,609) ULAE 303,527 350,600 399,895 291,696 331,494 385,762 Total $ 7,823,268 $ 9,235,082 $ 10,727,774 $ 7,303,790 $ 8,295,361 $ 9,695,666
Quarterly Reserve Reviews
In addition to an in-depth annual review, we also perform quarterly reserve reviews. This is done by examining quarterly paid and incurred loss development to determine whether it is consistent with reserves established during the preceding annual reserve review and with expected development. Loss development is reviewed separately for each major exposure type (e.g., asbestos, environmental, etc.), for each of our relevant subsidiaries, and for large "wholesale" commutation settlements versus "routine" paid and advised losses. This process is undertaken to determine whether loss development experience during a given quarter warrants any change to held reserves.
Loss development is examined separately by exposure type because different exposures develop differently over time. For example, the expected reporting and payout of losses for a given amount of asbestos reserves can be expected to take place over a different time frame and in a different quarterly pattern from the same amount of environmental reserves.
In addition, loss development is examined separately for each of our relevant subsidiaries. Companies can differ in their exposure profile due to the mix of insurance versus reinsurance, the mix of primary versus excess insurance, the underwriting years of participation and other criteria. These differing profiles lead to different expectations for quarterly and annual loss development by company.
Once the data has been analyzed, an in-depth review is performed on classes of exposure with significant loss development. Discussions are held with appropriate personnel, including individual company managers, claims handlers and attorneys, to better understand the causes. If it were determined that development differs significantly from expectations, reserves would be adjusted.
As described above, our management regularly reviews and updates reserve estimates using the most current information available and employing various actuarial methods. Adjustments resulting from changes in our estimates are recorded in the period when such adjustments are determined. The ultimate liability for losses and LAE is likely to differ from the original estimate due to a number of factors, primarily consisting of the overall claims activity occurring during any period, including the completion of commutations of assumed liabilities and ceded reinsurance receivables, policy buy-backs and general incurred claims activity.
Loss Reserving (All Classes, except Latent Claims)
For our "All Other" (non-latent) loss exposure, including workers' compensation, our actuaries apply a range of traditional loss development extrapolation techniques. These methods assume that cohorts, or groups, of losses
Table of Contents
82

from similar exposures will increase over time in a predictable manner. Historical paid, incurred, and outstanding loss development experience is examined for earlier years to make inferences about how later years’ losses will develop. The application and consideration of multiple methods is consistent with the Actuarial Standards of Practice.
When determining which loss development extrapolation methods to apply to each company and each class of exposure within each company, we consider the nature of the exposure for each specific subsidiary and reserving segment and the available loss development data, as well as the limitations of that data. In cases where company-specific loss development information is not available or reliable, we select methods that do not rely on historical data (such as incremental or run-off methods) and consider industry loss development information published by industry sources such as the Reinsurance Association of America. In determining which methods to apply, we also consider cause of loss coding information when available.
A brief summary of the methods that are considered most frequently in analyzing non-latent exposures is provided below. This summary discusses the strengths and weaknesses of each method, as well as the data requirements for each method, all of which are considered when selecting which methods to apply for each reserve segment.
1. Cumulative Reported and Paid Loss Development Methods. The Cumulative Reported (Case Incurred) Loss Development method relies on the assumption that, at any given state of maturity, ultimate losses can be predicted by multiplying cumulative reported losses (paid losses plus case reserves) by a cumulative development factor. The validity of the results of this method depends on the stability of claim reporting and settlement rates, as well as the consistency of case reserve levels. Case reserves do not have to be adequately stated for this method to be effective; they only need to have a fairly consistent level of adequacy at all stages of maturity. Historical "age-to-age" loss development factors ('LDFs') are calculated to measure the relative development of an accident year from one maturity point to the next. Age-to-age LDFs are then selected based on these historical factors. The selected age-to-age LDFs are used to project the ultimate losses. The Cumulative Paid Loss Development Method is mechanically identical to the Cumulative Reported Loss Development Method described above, but the paid method does not rely on case reserves or claim reporting patterns in making projections. The validity of the results from using a cumulative loss development approach can be affected by many conditions, such as internal claim department processing changes, a shift between single and multiple payments per claim, legal changes, or variations in a company’s mix of business from year to year. Typically, the most appropriate circumstances in which to apply a cumulative loss development method are those in which the exposure is mature, full loss development data is available, and the historical observed loss development is relatively stable.
2. Incremental Reported and Paid Loss Development Methods. Incremental incurred and paid analyses are performed in cases where cumulative data is not available. The concept of the incremental loss development methods is similar to the cumulative loss development methods described above, in that the pattern of historical paid or incurred losses is used to project the remaining future development. The difference between the cumulative and incremental methods is that the incremental methods rely on only incremental incurred or paid loss data from a given point in time forward, and do not require full loss history. These incremental loss development methods are therefore helpful when data limitations apply. While this versatility in the incremental methods is a strength, the methods are sensitive to fluctuations in loss development, so care must be taken in applying them.
3. IBNR-to-Case Outstanding Method. This method requires the estimation of consistent cumulative paid and reported (case) incurred loss development patterns and age-to-ultimate LDFs, either from data that is specific to the segment being analyzed or from applicable benchmark or industry data. These patterns imply a specific expected relationship between IBNR, including both development on known claims (bulk reserve) and losses on true late reported claims, and reported case incurred losses. The IBNR-to-Case Outstanding method can be used in a variety of situations. It is appropriate for loss development experience that is mature and possesses a very high ratio of paid losses to reported case incurred losses. The method also permits an evaluation of the difference in maturity between the business being reviewed and benchmark development patterns. Depending on the relationship of paid to incurred losses, an estimate of the relative maturity of the business being reviewed can be made and a subsequent estimate of ultimate losses driven by the implied IBNR to case outstanding ratio at the appropriate maturity can be derived. This method is also useful where loss development data is incomplete and only the case outstanding amounts are determined to be reliable. This method is less reliable in situations where relative case reserve adequacy has been changing over time.
4. Bornhuetter-Ferguson Expected Loss Projection Reported and Paid Methods. The Bornhuetter-Ferguson Expected Loss Projection Method based on reported loss data relies on the assumption that remaining unreported losses are a function of the total expected losses rather than a function of currently reported losses. The expected
Table of Contents
83

losses used in this analysis are based on initial selected ultimate loss ratios by year. The expected losses are multiplied by the unreported percentage to produce expected unreported losses. The unreported percentage is calculated as one minus the reciprocal of the selected cumulative incurred LDFs. Finally, the expected unreported losses are added to the current reported losses to produce ultimate losses. The calculations underlying the Bornhuetter-Ferguson Expected Loss Projection Method based on paid loss data are similar to the Bornhuetter-Ferguson calculations based on reported losses, with the exception that paid losses and unpaid percentages replace reported losses and unreported percentages. The Bornhuetter-Ferguson method is most useful as an alternative to other models for immature years. For these immature years, the amounts reported or paid may be small and unstable and therefore not predictive of future development. Therefore, future development is assumed to follow an expected pattern that is supported by more stable historical data or by emerging trends. This method is also useful when changing reporting patterns or payment patterns distort historical development of losses. Similar to the loss development methods, the Bornhuetter-Ferguson method may be applied to loss and ALAE on a combined or separate basis. The Bornhuetter-Ferguson method may not be appropriate in circumstances where the liabilities being analyzed are very mature, since it is not sensitive to the remaining amount of case reserves outstanding, or the actual development to date.
5. Reserve Run-off Method. This method first projects the future values of case reserves for all underwriting years to future ages of development. This is done by selecting a run-off pattern of case reserves. The selected case run-off ratios are selected based on the observed run-off ratios at each age of development. Once the ratios have been selected, they are used to project the future values of case reserves. A paid on reserve factor is selected in a similar way. The ratios of the observed amounts paid during each development period to the respective case reserves at the beginning of the periods are used to estimate how much will be paid on the case reserves during each development period. These paid on reserve factors are then applied to the case reserve amounts that were projected during the first phase of this method. A summation of the resulting paid amounts yields an estimate of the liability. The Reserve Run-off Method works well when the historical run-off patterns are reasonably stable and when case reserves ultimately show a decreasing trend. Another strength of this method is that it only requires case reserves at a given point in time and incremental paid and incurred losses after that point, meaning that it can be applied in cases where full loss history is not available. In cases of volatile data where there is a persistent increasing trend in case reserves, this method will fail to produce a reasonable estimate. In several cases, reliance upon this method was limited due to this weakness.
Our actuaries select the appropriate loss development extrapolation methods to apply to each company and each class of exposure, and then apply these methods to calculate an estimate of ultimate losses. Our management, which is responsible for the final estimate of ultimate losses, reviews the calculations of our actuaries, considers additional information that may not be evident in the data used by the actuaries, such as, but not limited to, recent judicial decisions, inflation, and adjusts the estimate of ultimate losses as it deems necessary. Paid-to-date losses are then deducted from the estimate of ultimate losses to arrive at an estimated total loss reserve, and reported outstanding case reserves are then deducted from estimated total loss reserves to calculate the estimated IBNR reserve.
Loss Reserving (Latent Claims)
Asbestos Claims
Asbestos continues to be the most significant and difficult mass tort for the insurance industry in terms of claims volume, legal expense and indemnity payments. In the United States, asbestos-related lawsuits emerged in the early 1970s, accelerated through the 1980s and continue today, over fifty years after the first significant lawsuit against an asbestos manufacturer was filed. A unique feature of U.S. asbestos litigation is that a plaintiff will identify numerous defendants, often over 50, in a lawsuit, creating additional expense to defend the suit. Asbestos lawsuits have led to many of the traditional defendants filing for bankruptcy. We believe the insurance industry has been adversely affected by judicial interpretations that had the effect of maximizing insurance recoveries from both a coverage and liability perspective for these plaintiffs.
A number of our subsidiaries, and counterparties who wrote portfolios we assumed, have exposure to bodily injury claims from alleged exposure to asbestos. The United States asbestos exposure arises mainly from general liability insurance policies underwritten prior to 1986, which our subsidiaries or counterparties either wrote directly, on a primary or excess basis, or as reinsurance. Our United Kingdom asbestos exposures emanates from Employers Liability insurance policies. Asbestos bodily injury claims differ from other bodily injury claims due to the long latency period for asbestos, which often triggers a policyholder’s coverage over multiple policy periods. The long latency period, combined with the lack of clear judicial precedent with respect to coverage interpretations and expanded theories of liability, increase the uncertainty of the asbestos claim reserve estimates.
Table of Contents
84

The following table provides a reconciliation of our gross and net loss and ALAE reserves from asbestos exposures and the movement in gross and net reserves for the years ended December 31, 2020 and 2019:
2020 2019(in thousands of U.S. dollars)
Balance as of January 1 $ 1,916,359 $ 1,617,020 Less: reinsurance reserves recoverable 154,260 123,910 Net balance as of January 1 1,762,099 1,493,110 Total net incurred losses and LAE (18,501) 6,811 Total net paid losses (132,853) (118,557) Effect of exchange rate movement 38,932 37,249 Assumed business — 382,474 Ceded business (63,554) (38,988) Net balance as of December 31 1,586,123 1,762,099 Plus: reinsurance reserves recoverable 192,416 154,260 Balance as of December 31 $ 1,778,539 $ 1,916,359
The liability for unpaid losses and ALAE for asbestos reserves reflects our best estimate for future amounts needed to pay losses and related ALAE as of each of the balance sheet dates reflected in the financial statements herein in accordance with U.S. GAAP. As of December 31, 2020 and 2019, the net loss reserves for asbestos-related claims comprised 20.8% and 26.3%, respectively, of total Non-life Run-off net reserves for losses and LAE liabilities excluding the fair value adjustments, deferred charge assets and gain liabilities and ULAE. In addition, we also have defendant asbestos liabilities, as described in Note 11 - "Defendant Asbestos and Environmental Liabilities" in the notes to our consolidated financial statements included within Item 8 of this Annual Report on Form 10-K.
Environmental Claims
Environmental pollution claims represent another exposure where we believe the insurance industry has been adversely affected by various legislative changes and judicial interpretations. Unlike asbestos claims which are generated primarily from injured individuals, environmental claims generally result from state or federal government activities initiated against a commercial enterprise. The most well-known legislation, passed in 1980, is the Comprehensive Environmental Restoration, Compensation and Liability Act (“CERCLA”, also known as Superfund). CERCLA imposed strict and retroactive liability on potentially responsible parties (“PRP”), which expanded in the court system to be interpreted as joint and several liability.
Our subsidiaries and counterparties who wrote portfolios we assumed have exposure to environmental claims from general liability insurance policies written prior to the mid-1980s, that were not specifically written to cover damage to the environment from gradual releases of pollutants. Similar to asbestos, there is additional uncertainty with respect to environmental reserves as compared to other general liability exposures. This added uncertainty is due to the multiple policy periods and allocation of claims to policy years, number of solvent PRPs at any site, ultimate cost of the remediation, the number of ultimate sites and changes to judicial precedence.
Table of Contents
85
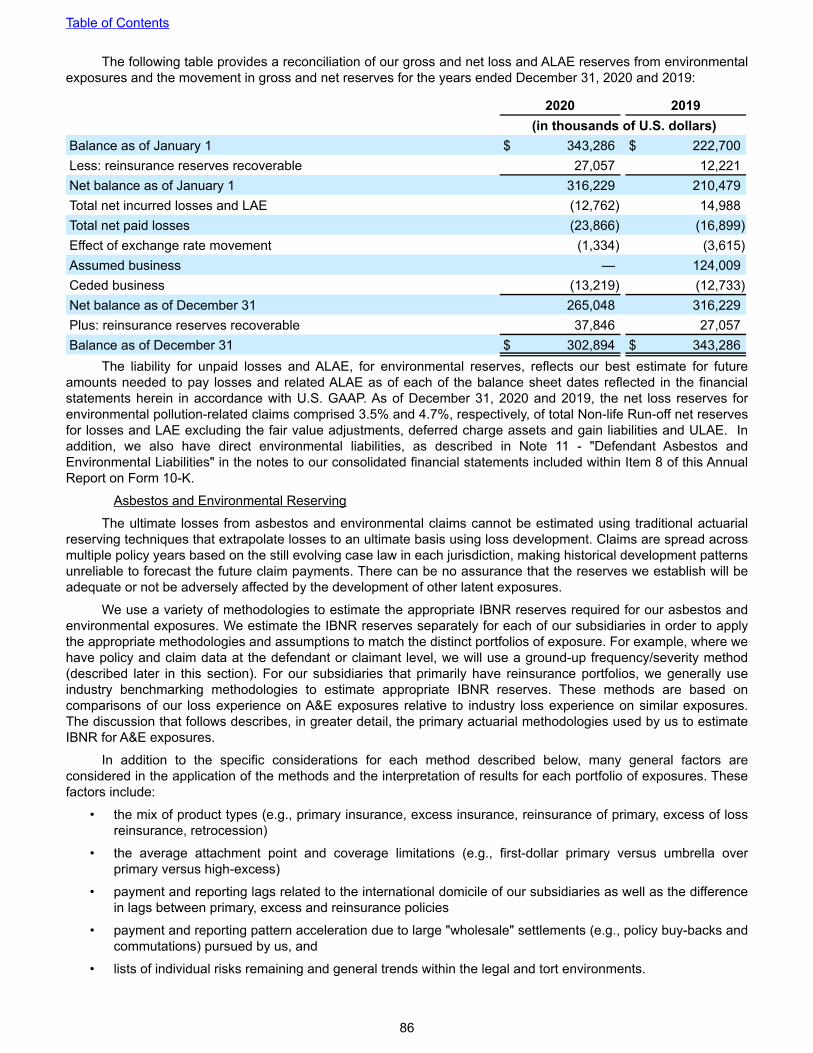
The following table provides a reconciliation of our gross and net loss and ALAE reserves from environmental exposures and the movement in gross and net reserves for the years ended December 31, 2020 and 2019:
2020 2019(in thousands of U.S. dollars)
Balance as of January 1 $ 343,286 $ 222,700 Less: reinsurance reserves recoverable 27,057 12,221 Net balance as of January 1 316,229 210,479 Total net incurred losses and LAE (12,762) 14,988 Total net paid losses (23,866) (16,899) Effect of exchange rate movement (1,334) (3,615) Assumed business — 124,009 Ceded business (13,219) (12,733) Net balance as of December 31 265,048 316,229 Plus: reinsurance reserves recoverable 37,846 27,057 Balance as of December 31 $ 302,894 $ 343,286
The liability for unpaid losses and ALAE, for environmental reserves, reflects our best estimate for future amounts needed to pay losses and related ALAE as of each of the balance sheet dates reflected in the financial statements herein in accordance with U.S. GAAP. As of December 31, 2020 and 2019, the net loss reserves for environmental pollution-related claims comprised 3.5% and 4.7%, respectively, of total Non-life Run-off net reserves for losses and LAE excluding the fair value adjustments, deferred charge assets and gain liabilities and ULAE. In addition, we also have direct environmental liabilities, as described in Note 11 - "Defendant Asbestos and Environmental Liabilities" in the notes to our consolidated financial statements included within Item 8 of this Annual Report on Form 10-K.
Asbestos and Environmental Reserving
The ultimate losses from asbestos and environmental claims cannot be estimated using traditional actuarial reserving techniques that extrapolate losses to an ultimate basis using loss development. Claims are spread across multiple policy years based on the still evolving case law in each jurisdiction, making historical development patterns unreliable to forecast the future claim payments. There can be no assurance that the reserves we establish will be adequate or not be adversely affected by the development of other latent exposures.
We use a variety of methodologies to estimate the appropriate IBNR reserves required for our asbestos and environmental exposures. We estimate the IBNR reserves separately for each of our subsidiaries in order to apply the appropriate methodologies and assumptions to match the distinct portfolios of exposure. For example, where we have policy and claim data at the defendant or claimant level, we will use a ground-up frequency/severity method (described later in this section). For our subsidiaries that primarily have reinsurance portfolios, we generally use industry benchmarking methodologies to estimate appropriate IBNR reserves. These methods are based on comparisons of our loss experience on A&E exposures relative to industry loss experience on similar exposures. The discussion that follows describes, in greater detail, the primary actuarial methodologies used by us to estimate IBNR for A&E exposures.
In addition to the specific considerations for each method described below, many general factors are considered in the application of the methods and the interpretation of results for each portfolio of exposures. These factors include:
• the mix of product types (e.g., primary insurance, excess insurance, reinsurance of primary, excess of loss reinsurance, retrocession)
• the average attachment point and coverage limitations (e.g., first-dollar primary versus umbrella over primary versus high-excess)
• payment and reporting lags related to the international domicile of our subsidiaries as well as the difference in lags between primary, excess and reinsurance policies
• payment and reporting pattern acceleration due to large "wholesale" settlements (e.g., policy buy-backs and commutations) pursued by us, and
• lists of individual risks remaining and general trends within the legal and tort environments.
Table of Contents
86

1. Paid Survival Ratio Method. In this method, our expected annual average payment amount is multiplied by an expected future number of payment years to develop an indicated reserve. Our historical calendar year payments are examined to determine an expected future annual average payment amount. This amount is multiplied by an expected number of future payment years to estimate a reserve. Trends in calendar year payment activity are considered when selecting an expected future annual average payment amount. Accepted industry benchmarks are used in determining an expected number of future payment years. Each year, annual payment data is updated, trends in payments are re-evaluated and changes to benchmark future payment years are reviewed. Advantages of this method are ease of application and simplicity of assumptions. A potential disadvantage of the method is that results could be misleading for portfolios of high excess exposures where significant payment activity has not yet begun.
2. Paid Market Share Method. In this method, our estimated market share is applied to the industry estimated unpaid losses or estimate of industry ultimate losses. The ratio of our historical calendar year payments to industry historical calendar year payments is examined to estimate our market share. This ratio is then applied to the estimate of industry unpaid losses or estimate of industry ultimate losses. Each year, calendar year payment data is updated (for both us and industry), estimates of industry unpaid losses are reviewed and the selection of our estimated market share is revisited. This method has the advantage that trends in calendar year market share can be incorporated into the selection of company share of remaining market payments. A potential disadvantage of this method is that it is particularly sensitive to assumptions regarding the time-lag between industry payments and our payments.
3. Reserve-to-Paid Method. In this method, the ratio of estimated industry reserves to industry paid-to-date losses is multiplied by our paid-to-date losses to estimate our reserves. Specific considerations in the application of this method include the completeness of our paid-to-date loss information, the potential acceleration or deceleration in our payments (relative to the industry) due to our claims handling practices, and the impact of large individual settlements. Each year, paid-to-date loss information is updated (for both us and the industry) and updates to industry estimated reserves are reviewed. This method has the advantage of relying purely on paid loss data and so is not influenced by subjectivity of case reserve loss estimates. A potential disadvantage is that the application to our portfolios that do not have complete inception-to-date paid loss history could produce misleading results. To address this potential disadvantage, a variation of the method is also considered by multiplying the ratio of estimated industry reserves to industry losses paid during a recent period of time (e.g., 3 years) by our paid losses during that period.
4. IBNR: Case Ratio Method. In this method, the ratio of estimated industry IBNR reserves to industry case reserves is multiplied by our case reserves to estimate our IBNR reserves. Specific considerations in the application of this method include the presence of policies reserved at policy limits, changes in overall industry case reserve adequacy and recent loss reporting history. Each year, our case reserves are updated, the estimate of industry reserves is updated and the applicability of the industry IBNR: Case Ratio is reviewed. This method has the advantage that it incorporates the most recent estimates of amounts needed to settle open cases included in current case reserves. A potential disadvantage is that results could be misleading where our case reserve adequacy differs significantly from overall industry case reserve adequacy. In these instances, the industry IBNR: Case Ratios were adjusted to reflect our portfolio case reserve adequacy.
5. Ultimate-to-Incurred Method. In this method, the ratio of estimated industry ultimate losses to industry incurred-to-date losses is applied to our incurred-to-date losses to estimate our IBNR reserves. Specific considerations in the application of this method include the completeness of our incurred-to-date loss information, the potential acceleration or deceleration in our incurred losses (relative to the industry) due to our claims handling practices and the impact of large individual settlements. Each year incurred-to-date loss information is updated (for both us and the industry) and updates to industry estimated ultimate losses are reviewed. This method has the advantage that it incorporates both paid and case reserve information in projecting ultimate losses. A potential disadvantage is that results could be misleading where cumulative paid loss data is incomplete or where our case reserve adequacy differs significantly from overall industry case reserve adequacy. In these instances, the industry IBNR: Case Ratios were adjusted to reflect our portfolio case reserve adequacy.
6. Decay Factor Method. In this method, a decay factor is directly applied to our payment data to estimate future payments. The decay factors were selected based on a review of our own decays and industry decays. This method is most useful where our data shows a decreasing pattern and is credible enough to be reliable.
7. Asbestos Ground-up Exposure Analysis Using Frequency-Severity Method. This method is used when we have policy and claim data at the defendant or claimant level. In a frequency-severity method there are two components that need to be estimated, namely, (1) the number of claims that will ultimately be settled with payment and (2) the severity of these claims including legal costs. The estimate of future settled claims is based on the
Table of Contents
87

historical claim filing rates, historical claim dismissal rates, current pending claims and epidemiological forecasts of asbestos disease incident for future claim filings. The average severity is based on historical average settlement amounts trended for inflation to the expected year of settlement for claims that close with an indemnity payment. Loss adjustment expenses are added to the projected ultimate losses based on historical expense to indemnity ratios. Multiplying the number of expected future claims settled with payments by the average severity results in an estimate of the ground-up losses at the defendant level. At this point, the defendant’s insurance coverage is considered to determine the allocation of the ground-up estimate to policy years and policy within the insurance coverage as well as the amount retained by the defendant.
Atrium (classified as held-for-sale) and StarStone
The reserve for losses and loss expenses includes reserves for unpaid reported losses and for IBNR reserves. The reserves for unpaid reported losses and loss expenses are established by management based on reports from brokers, ceding companies and insureds and represent the estimated ultimate cost of events or conditions that have been reported to, or specifically identified by us. The reserve for incurred but not reported losses and loss expenses is established by management based on actuarially determined estimates of ultimate losses and loss expenses. Inherent in the estimate of ultimate losses and loss expenses are expected trends in claim severity and frequency and other factors which may vary significantly as claims are settled. Accordingly, ultimate losses and loss expenses may differ materially from the amounts recorded in the consolidated financial statements. These estimates are reviewed regularly and, as experience develops and new information becomes known, the reserves are adjusted as necessary. Such adjustments, if any, will be recorded in earnings in the period in which they become known. Prior period development arises from changes to loss estimates recognized in the current year that relate to loss reserves established in previous calendar years.
For a breakdown of the gross and net losses and LAE by line of business and the fair value adjustments resulting from business combinations and ULAE as of December 31, 2020 and 2019 for the Atrium and StarStone segments, refer to Note 10 - "Losses and Loss Adjustment Expenses" in the notes to our consolidated financial statements included within Item 8 of this Annual Report on Form 10-K.
Quarterly Reserve ReviewsThe reserve for losses and loss expenses is reviewed on a quarterly basis. Each quarter, paid and incurred
loss development is reviewed to determine whether it is consistent with expected development. Loss development is examined separately by class of business, and large individual losses or loss events are examined separately from regular attritional loss development. Discussions are held with appropriate personnel including underwriters, claims adjusters, actuaries, accountants and attorneys to fully understand quarterly loss development and implications for the quarter-end reserve balances. Based on analysis of the loss development data and the associated discussions, management determines whether any adjustment is necessary to quarter-end reserve balances.
Defendant asbestos and environmental liabilitiesFor information on our defendant asbestos and environmental liabilities, refer to Note 11 - "Defendant
Asbestos and Environmental Liabilities" and Note 2 - "Significant Accounting Policies" in the notes to our consolidated financial statements included within Item 8 of this Annual Report on Form 10-K.
Reinsurance Balances Recoverable on Paid and Unpaid LossesOur acquired (re)insurance subsidiaries in all three of our operating segments have retrocessional
agreements to reduce exposure to the risk of (re)insurance they have assumed. Loss reserves represent total gross losses, and reinsurance balances recoverables represent anticipated recoveries of a portion of those loss reserves, as well as amounts receivable from reinsurers with respect to claims that have already been paid. While reinsurance arrangements are designed to limit losses and to permit recovery of a portion of loss reserves, reinsurance does not relieve us of our liabilities to our (re)insureds. Therefore, we evaluate and monitor concentration of credit risk among our reinsurers, including companies that are insolvent, in run-off or facing financial difficulties. Provisions are made for amounts considered potentially uncollectible. In addition to the acquired retrocessional agreements, on an annual basis, our active underwriting subsidiaries purchase tailored outwards reinsurance programs designed to manage their risk profiles. The majority of the total third-party reinsurance for our active underwriting subsidiaries is with Lloyd’s Syndicates or other reinsurers rated A- or better. For reinsurers that are not rated, the reinsurer provides collateral in the form of letters of credit, trust funds or funds withheld.
For further information, refer to Note 8 - "Reinsurance Balances Recoverable on Paid and Unpaid Losses" and Note 2 - "Significant Accounting Policies" in the notes to our consolidated financial statements included within Item 8 of this Annual Report on Form 10-K.
Table of Contents
88

Valuation Allowances on Reinsurance Balances Recoverable and Deferred Tax AssetsValuation Allowances on Reinsurance Balances Recoverable
Refer to Note 8 - "Reinsurance Balances Recoverable on Paid and Unpaid Losses" and Note 2 - "Significant Accounting Policies" in the notes to our consolidated financial statements included within Item 8 of this Annual Report on Form 10-K for information on the allowance for estimated uncollectible reinsurance balances recoverable on paid and unpaid losses.
Valuation Allowances on Deferred Tax Assets
For information on valuation allowances on deferred tax assets, refer to "Income Taxes" within Note 2 - "Significant Accounting Policies" in the notes to our consolidated financial statements included within Item 8 of this Annual Report on Form 10-K.
Deferred Charge Assets and Deferred Gain LiabilitiesRefer to "Retroactive Reinsurance" within Note 2 - "Significant Accounting Policies" in the notes to our
consolidated financial statements included within Item 8 of this Annual Report on Form 10-K for information on deferred charge assets and gain liabilities.
Premium Revenue RecognitionRefer to "Premiums" within Note 2 - "Significant Accounting Policies" in the notes to our consolidated financial
statements included within Item 8 of this Annual Report on Form 10-K for information on premium revenue recognition.
InvestmentsValuation of Investments
Our Non-life Run-off and active underwriting businesses invest in trading portfolios of fixed maturity and short-term investments and equities, and an AFS portfolio of fixed maturity and short-term investments. We record both the trading and AFS portfolios at fair value on our balance sheet. For our trading portfolios, the unrealized gain or loss associated with the difference between the fair value and the amortized cost of the investments is recorded in net earnings. For our AFS portfolios, the unrealized gain or loss (other than credit losses) is excluded from net earnings and reported as a separate component of accumulated other comprehensive income.
Our other investments comprise investments in various private equity funds, fixed income funds, hedge funds, equity funds, private credit funds and CLO equity funds, as well as direct investments in CLO equities. All of these other investments are recorded at fair value.
We measure fair value in accordance with ASC 820, Fair Value Measurements. The guidance dictates a framework for measuring fair value and a fair value hierarchy based on the quality of inputs used to measure fair value. The hierarchy gives the highest priority to unadjusted quoted prices in active markets for identical assets or liabilities (Level 1 measurements) and the lowest priority to unobservable inputs (Level 3 measurements). The three levels of the fair value hierarchy are described below:
• Level 1 - Valuations based on unadjusted quoted prices in active markets for identical assets or liabilities that we have the ability to access. Valuation adjustments and block discounts are not applied to Level 1 instruments.
• Level 2 - Valuations based on quoted prices in active markets for similar assets or liabilities, quoted prices for identical assets or liabilities in inactive markets, or for which significant inputs are observable (e.g. interest rates, yield curves, prepayment speeds, default rates, loss severities, etc.) or can be corroborated by observable market data.
• Level 3 - Valuations based on unobservable inputs where there is little or no market activity. Unadjusted third party pricing sources or management's assumptions and internal valuation models may be used to determine the fair values.
In addition, certain of our other investments are measured at fair value using net asset value ("NAV") per share (or its equivalent) as a practical expedient and have not been classified within the fair value hierarchy above.
When the inputs used to measure fair value fall within different levels of the hierarchy, the level within which the fair value measurement is categorized is based on the lowest level input that is significant to the fair value measurement in its entirety. Thus, a Level 3 fair value measurement may include inputs that are observable (Level 1 and 2) and unobservable (Level 3).
The use of valuation techniques may require a significant amount of judgment. During periods of market
Table of Contents
89

disruption, including periods of rapidly widening credit spreads or illiquidity, it may be difficult to value certain of our securities if trading becomes less frequent or market data becomes less observable.
Short-Term and Fixed Maturity Investments
Short-term and fixed maturity investments are subject to fluctuations in fair value due to changes in interest rates, changes in issuer-specific circumstances such as credit rating and changes in industry-specific circumstances such as movements in credit spreads based on the market’s perception of industry risks. As a result of these potential fluctuations, it is possible to have significant unrealized gains or losses on a security. At maturity, absent any credit loss, fixed maturity investments’ amortized cost will equal their fair value and no realized gain or loss will be recognized in income. If, due to an unforeseen change in loss payment patterns, we need to sell any AFS investments before maturity, we could realize significant gains or losses in any period, which could have a meaningful effect on reported net income for such period.
At every reporting period, we perform a detailed analysis to identify any credit losses on our AFS portfolios. For further information on the allowance for credit losses and other-than temporary impairment losses on our AFS investments, refer to Note 2 - "Significant Accounting Policies" and Note 6 - "Investments" in the notes to our consolidated financial statements included within Item 8 of this Annual Report on Form 10-K.
For information on our valuation methodologies for short-term and fixed maturity investments, refer to Note 12 - "Fair Value Measurements" in the notes to our consolidated financial statements included within Item 8 of this Annual Report on Form 10-K.
Other investments, including equities
For information on our valuation methodologies for other investments, including equities, refer to Note 12 - "Fair Value Measurements" in the notes to our consolidated financial statements included within Item 8 of this Annual Report on Form 10-K.
Accounting for Business Combinations - Fair Value MeasurementThe most significant liabilities and assets of an acquired company are typically the liability for losses and LAE,
and the assets related to cash, investments and any reinsurance balances recoverable on paid and unpaid losses that may be contractually due to the acquired entity. The market for acquisition of run-off companies is not always sufficiently active and transparent to enable us to identify reliable, market exit values for acquired assets and liabilities. Accordingly, consistent with provisions of U.S. GAAP, we have developed internal models that we believe allow us to determine fair values that are reasonable proxies for market exit values. We are familiar with the major participants in the acquisition run-off market and believe that the key assumptions we make in valuing acquired assets and liabilities are consistent with the kinds of assumptions made by such market participants. Furthermore, in our negotiation of purchase prices with sellers, it is frequently clear to us that other bidders in the market are using models and assumptions similar in nature to ours during the competitive bid process. The majority of acquisitions are completed following a public tender process whereby the seller invites market participants to provide bids for the target acquisition.
We account for business combinations using the acquisition method of accounting, which requires that the acquirer record the assets and liabilities acquired at estimated fair value. The fair values of each of the (re)insurance assets and liabilities acquired are derived from probability-weighted ranges of the associated projected cash flows, based on actuarially prepared information and management’s run-off strategy. Our run-off strategy, as well as that of other run-off market participants, is expected to be different from the seller’s as generally sellers are not specialized in running off (re)insurance liabilities whereas we and other market participants do specialize in such run-offs.
The key assumptions used by us and, we believe, by other run-off market participants in the fair valuation of acquired companies are (i) the projected payout, timing and amounts of claims liabilities; (ii) the related projected timing and amount of reinsurance collections; (iii) an appropriate discount rate, which is applied to determine the present value of the future cash flows; (iv) the estimated ULAE to be incurred over the life of the run-off; (v) the impact that any accelerated run-off strategy may have on the adequacy of acquired bad debt provisions; and (vi) an appropriate risk margin.
The probability-weighted projected cash flows of the acquired company are based on projected claims payouts provided by the seller predominantly in the form of the seller’s most recent independent actuarial reserve report. In the absence of the seller’s actuarial reserve report, our actuaries will determine the estimated claims payout. In certain jurisdictions, the local legislation provides for the possibility of pursuing strategies to achieve complete finality and conclude the run-off of a company, such as solvent schemes of arrangement. If appropriate we
Table of Contents
90

may estimate the probability of being able to complete a solvent scheme of arrangement and factor that into the claims payout projections.
On acquisition, we make a provision for ULAE liabilities. This provision considers the adequacy of the provision maintained and recorded by the seller in light of our run-off strategy and estimated ULAE to be incurred over the life of the acquired run-off as projected by the seller’s actuaries or, in their absence, our actuaries. To the extent that our estimate of the total ULAE provision is different from the seller’s, an adjustment will be made. While our objective is to accelerate the run-off by completing commutations of assumed and ceded business (which would have the effect of shortening the life, and therefore the cost, of the run-off), the success of this strategy is far from certain. Therefore, the estimates of ULAE are based on running off the liabilities and assets over the actuarially projected life of the run-off.
We believe that providing for ULAE based on our run-off strategy is appropriate in determining the fair value of the assets and liabilities acquired in an acquisition of a run-off company. We believe that other participants in the run-off acquisition marketplace factor the estimated cost of running off the acquired company based on how that participant expects to manage the assets and liabilities into the price to pay for an acquisition.
The difference between the carrying value of reserves acquired at the date of acquisition and the fair value is the Fair Value Adjustment, ("FVA"). The FVA is amortized over the estimated payout period and adjusted for accelerations on commutation settlements or any other new information or subsequent change in circumstances after the date of acquisition. To the extent the actual payout experience after the acquisition is materially faster or slower than anticipated at the time of the acquisition, there is an adjustment to the estimated ultimate loss reserves, or there are changes in bad debt provisions or in estimates of future run-off costs following accelerated payouts, then the amortization of the FVA is accelerated or decelerated, as the case may be, to reflect such changes.
Fair Value Option - Insurance ContractsIn our Non-life Run-off segment we have elected to apply the fair value option for certain loss portfolio transfer
reinsurance transactions. This is an irrevocable election that applies to all balances under the insurance contract, including funds held assets, reinsurance recoverable, and the liability for losses and loss adjustment expenses.
The fair value of the liability for losses and LAE and reinsurance recoverable under these contracts is presented separately in our consolidated balance sheet as of December 31, 2020 and 2019. Changes in the fair value of the liability for losses and LAE and reinsurance balances recoverable on paid and unpaid losses are included in net incurred losses and LAE in our consolidated statement of operations.
We use an internal model to calculate the fair value of the liability for losses and loss adjustment expenses and reinsurance recoverable asset for certain retroactive reinsurance contracts where we have elected the fair value option in our Non-life Run-off segment.
The fair value is calculated as the aggregate of discounted cash flows plus a risk margin:
• The discounted cash flow approach uses (i) estimated nominal cash flows based upon an appropriate payment pattern developed in accordance with standard actuarial techniques and (ii) a discount rate based upon high quality rated corporate bond yields plus a credit spread for non-performance risk. The model uses corporate bond rates across the yield curve depending on the estimated timing of the future cash flows and specific to the currency of the risk.
• The risk margin was calculated using the present value of the cost of capital. The cost of capital approach uses (i) projected capital requirements, (ii) multiplied by the risk cost of capital representing the return required for non-hedgeable risk based upon the weighted average cost of capital less investment income, and (iii) discounted using the weighted average cost of capital.
The observable and unobservable inputs used in the model are described in Note 12 - "Fair Value Measurements" in the notes to our consolidated financial statements included within Item 8 of this Annual Report on Form 10-K.
Redeemable Noncontrolling InterestFor information on redeemable noncontrolling interest, refer to Note 2 - "Significant Accounting Policies" in the
notes to our consolidated financial statements included within Item 8 of this Annual Report on Form 10-K.
Table of Contents
91

ITEM 7A. QUANTITATIVE AND QUALITATIVE DISCLOSURES ABOUT MARKET RISKThe following risk management discussion and the estimated amounts generated from sensitivity analysis
presented are forward-looking statements of market risk assuming certain market conditions occur. Future results may differ materially from these estimated results due to, among other things, actual developments in the global financial markets, changes in the composition of our investment portfolio, or changes in our business strategies. The results of analysis we use to assess and mitigate risk are not projections of future events or losses. See "Cautionary Statement Regarding Forward-Looking Statements" for additional information regarding our forward-looking statements.
We are principally exposed to four types of market risk: interest rate risk; credit risk; equity price risk and foreign currency risk. Our policies to address these risks in 2020 are not materially different than those used in 2019, and, based on our current knowledge and expectations, we do not currently anticipate significant changes in our market risk exposures or in how we will manage those exposures in future reporting periods. However, due to the ongoing uncertainty and volatility in financial markets as a result of the economic conditions caused by the COVID-19 pandemic, we expect interest rates, credit spreads and global equity markets to remain volatile in the near-term. Furthermore, the pandemic has increased the risk of defaults across many industries. As a result, we continue to closely monitor market risk during this time.
Interest Rate and Credit Spread RiskInterest rate risk is the price sensitivity of a security to changes in interest rates. Credit spread risk is the price
sensitivity of a security to changes in credit spreads. Our investment portfolio and funds held - directly managed includes fixed maturity and short-term investments, whose fair values will fluctuate with changes in interest rates and credit spreads. We attempt to maintain adequate liquidity in our fixed maturity investments portfolio with a strategy designed to emphasize the preservation of our invested assets and provide sufficient liquidity for the prompt payment of claims and contract liabilities, as well as for settlement of commutation payments. We also monitor the duration and structure of our investment portfolio.
The following table summarizes the aggregate hypothetical change in fair value from an immediate parallel shift in the treasury yield curve, assuming credit spreads remain constant, in our fixed maturity and short-term investments portfolio classified as trading and AFS, our funds held directly managed portfolio, our fixed income funds and our fixed income exchange-traded funds, and excludes investments classified as held-for-sale:
Interest Rate Shift in Basis PointsAs of December 31, 2020 -100 -50 — +50 +100 (in millions of U.S. dollars)Total Market Value (1) $ 10,632 $ 10,324 $ 10,028 $ 9,756 $ 9,495 Market Value Change from Base 6.0 % 3.0 % — (2.7) % (5.3) %Change in Unrealized Value $ 604 $ 296 $ — $ (272) $ (533)
As of December 31, 2019 -100 -50 — +50 +100Total Market Value (1) $ 10,141 $ 9,893 $ 9,648 $ 9,415 $ 9,193 Market Value Change from Base 5.1 % 2.5 % — (2.4) % (4.7) %Change in Unrealized Value $ 493 $ 245 $ — $ (233) $ (455)
(1) Excludes equity exchange-traded funds of $154.9 million and $0 for the years ended December 31, 2020 and December 31, 2019, respectively, which are included in the Equity Price Risk section below.
Actual shifts in interest rates may not change by the same magnitude across the maturity spectrum or on an individual security and, as a result, the impact on the fair value of our fixed maturity securities, short-term investments, funds held - directly managed and fixed income exchange-traded fund may be materially different from the resulting change in value indicated in the tables above.
Table of Contents
92

The following table summarizes the aggregate hypothetical change in fair value from an immediate parallel shift in credit spreads assuming interest rates remain fixed, in our fixed maturity and short-term investments portfolio classified as trading and AFS, our funds held directly managed portfolio, our fixed income funds and our fixed income exchange-traded funds, and excludes investments classified as held-for-sale:
Credit Spread Shift in Basis PointsAs of December 31, 2020 -100 -50 — +50 +100 (in millions of U.S. dollars)Total Market Value (1) $ 10,608 $ 10,308 $ 10,028 $ 9,765 $ 9,516 Market Value Change from Base 5.8 % 2.8 % (2.6) % (5.1) %Change in Unrealized Value $ 580 $ 280 $ (263) $ (512)
As of December 31, 2019 -100 -50 — +50 +100Total Market Value (1) $ 10,078 $ 9,867 $ 9,648 $ 9,429 $ 9,218 Market Value Change from Base 4.5 % 2.3 % (2.3) % (4.5) %Change in Unrealized Value $ 430 $ 219 $ (219) $ (430)
(1) Excludes equity exchange-traded funds of $154.9 million and $0 for the years ended December 31, 2020 and December 31, 2019, respectively, which are included in the Equity Price Risk section below.
Credit RiskCredit risk relates to the uncertainty of a counterparty’s ability to make timely payments in accordance with
contractual terms of the instrument or contract. We are exposed to direct credit risk primarily within our portfolios of fixed maturity and short-term investments, and through customers, brokers and reinsurers in the form of premiums receivable and reinsurance balances recoverable on paid and unpaid losses, respectively, as discussed below.
Fixed Maturity and Short-Term InvestmentsAs a holder of $9.3 billion of fixed maturity and short-term investments, we also have exposure to credit risk
as a result of investment ratings downgrades or issuer defaults. In an effort to mitigate this risk, our investment portfolio consists primarily of investment grade-rated, liquid, fixed maturity investments of short-to-medium duration and mutual funds. A table of credit ratings for our fixed maturity and short-term investments is in Note 6 - "Investments" in the notes to our consolidated financial statements included within Item 8 of this Annual Report on Form 10-K. At December 31, 2020, 41.2% of our fixed maturity and short-term investment portfolio was rated AA or higher by a major rating agency (December 31, 2019: 39.1%) with 3.5% rated lower than BBB- (December 31, 2019: 4.3%). The portfolio as a whole, including cash, restricted cash, fixed maturity and short term investments and funds held - directly managed, had an average credit quality rating of A+ as of December 31, 2020 (December 31, 2019: A+). In addition, we manage our portfolio pursuant to guidelines that follow what we believe are prudent standards of diversification. The guidelines limit the allowable holdings of a single issue and issuers and, as a result, we believe we do not have significant concentrations of credit risk.
A summary of our fixed maturity and short-term investments by credit rating as of December 31, 2020 and 2019 is as follows:
Credit rating 2020 2019 ChangeAAA 29.5 % 26.0 % 3.5 %AA 11.7 % 13.1 % (1.4) %A 31.6 % 34.5 % (2.9) %BBB 23.5 % 21.9 % 1.6 %Non-investment grade 3.5 % 4.3 % (0.8) %Not rated 0.2 % 0.2 % — %Total 100.0 % 100.0 %
Average credit rating A+ A+Reinsurance Balances Recoverable on Paid and Unpaid Losses
We have exposure to credit risk as it relates to our reinsurance balances recoverable on paid and unpaid losses. Our insurance subsidiaries remain liable to the extent that retrocessionaires do not meet their contractual obligations and, therefore, we evaluate and monitor concentration of credit risk among our reinsurers. A discussion
Table of Contents
93

of our reinsurance balances recoverable on paid and unpaid losses is in Note 8 - "Reinsurance Balances Recoverable on Paid and Unpaid Losses" in the notes to our consolidated financial statements included within Item 8 of this Annual Report on Form 10-K.
Funds Held Under funds held arrangements, the reinsured company has retained funds that would otherwise have been
remitted to our reinsurance subsidiaries. The funds balance is credited with investment income and losses payable are deducted. We are subject to credit risk if the reinsured company is unable to honor the value of the funds held balances, such as in the event of insolvency. However, we generally have the contractual ability to offset any shortfall in the payment of the funds held balances with amounts owed by us to the reinsured for losses payable and other amounts contractually due. Our funds held are shown under two categories on the consolidated balance sheets, where funds held upon which we receive the underlying portfolio economics are shown as "Funds held - directly managed", and funds held where we receive a fixed crediting rate are shown as "Funds held by reinsured companies". Both types of funds held are subject to credit risk. We routinely monitor the creditworthiness of reinsured companies with whom we have funds held arrangements. As of December 31, 2020 we had a significant concentration of $1.0 billion with one reinsured company, which has financial strength credit ratings of A+ from A.M. Best and AA from Standard & Poor's.
Equity Price RiskOur portfolio of equity investments, excluding our fixed income exchange-traded funds but including the equity
funds and call options on equities included in other investments (collectively, "equities at risk"), has exposure to equity price risk, which is the risk of potential loss in fair value resulting from adverse changes in stock prices. Our fixed income exchange-traded funds are excluded from the below analysis and have been included within the interest rate and credit spread risk analysis, as these exchange-traded funds are part of our fixed income investment strategy and are backed by fixed income instruments. Our global equity portfolio is correlated with a blend of the S&P 500 and MSCI World indices, and changes in this blend of indices would approximate the impact on our portfolio. The following table summarizes the aggregate hypothetical change in fair value from a 10% decline in the overall market prices of our equities at risk:
2020 2019 Change(in millions of U.S. dollars)
Publicly traded equity investments in common and preferred stocks $ 260.8 $ 327.9 $ (67.1) Privately held equity investments in common and preferred stocks 274.7 265.8 8.9 Private equity funds 363.1 323.5 39.6 Equity funds 190.8 410.1 (219.3) Equity exchange traded funds 155.0 — 155.0 Call options on equity — 0.1 (0.1) Fair value of equities at risk $ 1,244.4 $ 1,327.4 $ (83)
Impact of 10% decline in fair value $ 124.4 $ 132.7 $ (8.3) In addition to the above, as of December 31, 2020, we had investments of $2.6 billion (December 31, 2019:
$1.1 billion) in hedge funds, included within our other investments, at fair value, that have exposure to equity price risk given the underlying assets in those funds. As of December 31, 2020 and 2019, the impact of a 10% decline in the fair value of these investments would have been $263.8 million and $112.2 million, respectively.
Table of Contents
94

Foreign Currency RiskThe table below summarizes our net exposures as of December 31, 2020 and 2019 to foreign currencies:
AUD CAD EUR GBP Other Total(in millions of U.S. dollars)
As of December 31, 2020Total net foreign currency exposure $ 7.0 $ (1.9) $ 24.4 $ 38.9 $ 1.5 $ 69.9 Pre-tax impact of a 10% movement in USD(1) $ 0.7 $ (0.2) $ 2.4 $ 3.9 $ 0.2 $ 7.0
As of December 31, 2019Total net foreign currency exposure $ 20.2 $ (10.6) $ 12.9 $ (11.9) $ 0.6 $ 11.2 Pre-tax impact of a 10% movement in USD(1) $ 2.0 $ (1.1) $ 1.3 $ (1.2) $ 0.1 $ 1.1 (1) Assumes 10% change in U.S. dollar relative to other currencies.
Through our subsidiaries located in various jurisdictions, we conduct our (re)insurance operations in a variety of non-U.S. currencies. We have the following exposures to foreign currency risk:
• Transaction Risk: The functional currency for the majority of our subsidiaries is the U.S. dollar. Within these entities, any fluctuations in foreign currency exchange rates relative to the U.S. dollar has a direct impact on the valuation of our assets and liabilities denominated in other currencies. All changes in foreign exchange rates, with the exception of non-U.S. dollar AFS investments, are recognized in our consolidated statements of earnings. Changes in foreign exchange rates relating to non-U.S. dollar AFS investments are recorded accumulated other comprehensive income (loss) in shareholders’ equity. Our subsidiaries with non-U.S. dollar functional currencies are also exposed to fluctuations in foreign currency exchange rates relative to their own functional currency.
• Translation Risk: We have net investments in certain European, British, and Australian subsidiaries whose functional currencies are the Euro, British pound and Australian dollar, respectively. The foreign exchange gain or loss resulting from the translation of their financial statements from their respective functional currency into U.S. dollars is recorded in the cumulative translation adjustment account, which is a component of accumulated other comprehensive income (loss) in shareholders’ equity.
Our foreign currency policy is to broadly manage, where possible, our foreign currency risk by:
• Seeking to match our liabilities under (re)insurance policies that are payable in foreign currencies with assets that are denominated in such currencies, subject to regulatory constraints.
• Selectively utilizing foreign currency forward contracts to mitigate foreign currency risk.
The instruments we use to manage foreign currency risk are discussed in Note 7 - "Derivatives and Hedging Instruments" in the notes to our consolidated financial statements included within Item 8 of this Annual Report on Form 10-K. To the extent our foreign currency exposure is not matched or hedged, we may experience foreign exchange losses or gains, which would be reflected in our consolidated results of operations and financial condition.
Effects of InflationInflation may have a material effect on our consolidated results of operations by its effect on our assets and
our liabilities. Inflation could lead to higher interest rates, resulting in a decrease in the market value of our fixed maturity portfolio. We may choose to hold our fixed maturity investments to maturity, which would result in the unrealized gains or losses accreting back over time. Inflation may also affect the value of certain of our liabilities, primarily our estimate for losses and LAE, such as our cost of claims which includes medical treatments, litigation costs and judicial awards. Although our estimate for losses and LAE is established to reflect the likely payments in the future, we would be subject to the risk that inflation could cause these amounts to be greater than the current estimate for losses and LAE. We seek to take this into account when setting reserves and pricing new business. However, the actual effects of inflation on our consolidated results of operations cannot be accurately known until claims are ultimately settled.
Table of Contents
95
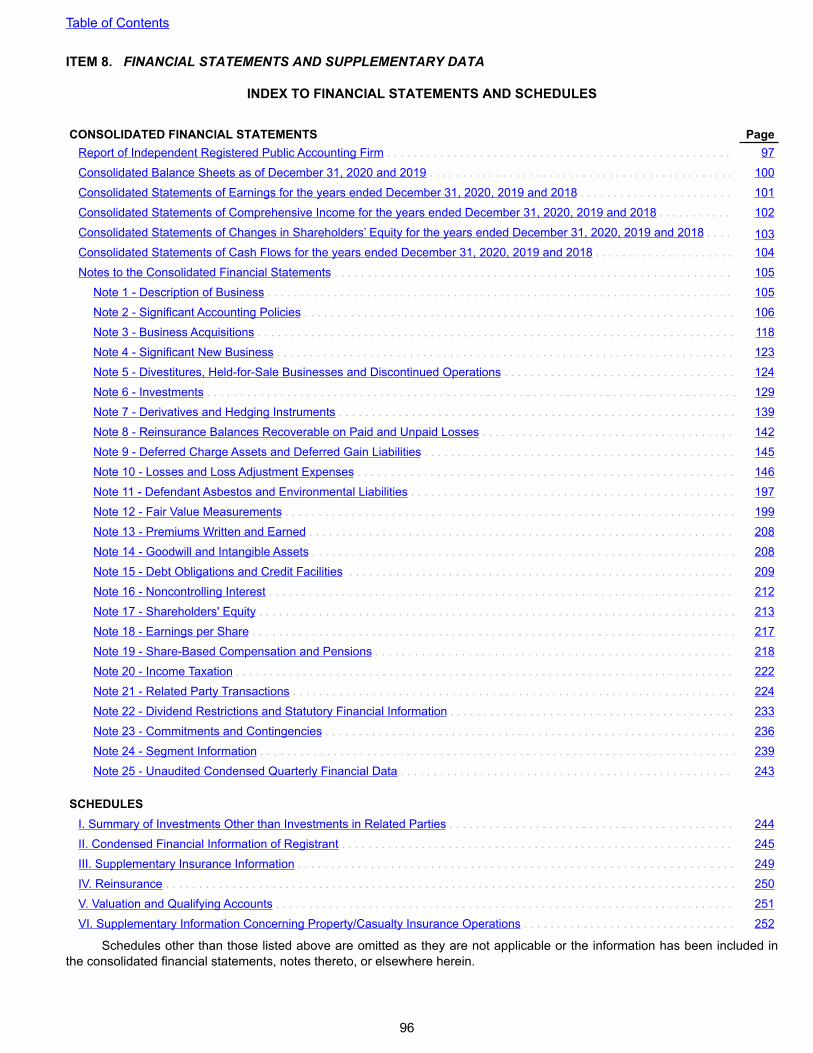
ITEM 8. FINANCIAL STATEMENTS AND SUPPLEMENTARY DATA
INDEX TO FINANCIAL STATEMENTS AND SCHEDULES
CONSOLIDATED FINANCIAL STATEMENTS PageReport of Independent Registered Public Accounting Firm . . . . . . . . . . . . . . . . . . . . . . . . . . . . . . . . . . . . . . . . . . . . . . . . . . . . 97
Consolidated Balance Sheets as of December 31, 2020 and 2019 . . . . . . . . . . . . . . . . . . . . . . . . . . . . . . . . . . . . . . . . . . . . . . 100
Consolidated Statements of Earnings for the years ended December 31, 2020, 2019 and 2018 . . . . . . . . . . . . . . . . . . . . . . . 101
Consolidated Statements of Comprehensive Income for the years ended December 31, 2020, 2019 and 2018 . . . . . . . . . . . 102
Consolidated Statements of Changes in Shareholders’ Equity for the years ended December 31, 2020, 2019 and 2018 . . . . 103Consolidated Statements of Cash Flows for the years ended December 31, 2020, 2019 and 2018 . . . . . . . . . . . . . . . . . . . . . 104
Notes to the Consolidated Financial Statements . . . . . . . . . . . . . . . . . . . . . . . . . . . . . . . . . . . . . . . . . . . . . . . . . . . . . . . . . . . . 105
Note 1 - Description of Business . . . . . . . . . . . . . . . . . . . . . . . . . . . . . . . . . . . . . . . . . . . . . . . . . . . . . . . . . . . . . . . . . . . . . . 105
Note 2 - Significant Accounting Policies . . . . . . . . . . . . . . . . . . . . . . . . . . . . . . . . . . . . . . . . . . . . . . . . . . . . . . . . . . . . . . . . . 106
Note 3 - Business Acquisitions . . . . . . . . . . . . . . . . . . . . . . . . . . . . . . . . . . . . . . . . . . . . . . . . . . . . . . . . . . . . . . . . . . . . . . . . 118
Note 4 - Significant New Business . . . . . . . . . . . . . . . . . . . . . . . . . . . . . . . . . . . . . . . . . . . . . . . . . . . . . . . . . . . . . . . . . . . . . 123
Note 5 - Divestitures, Held-for-Sale Businesses and Discontinued Operations . . . . . . . . . . . . . . . . . . . . . . . . . . . . . . . . . . . 124
Note 6 - Investments . . . . . . . . . . . . . . . . . . . . . . . . . . . . . . . . . . . . . . . . . . . . . . . . . . . . . . . . . . . . . . . . . . . . . . . . . . . . . . . . 129
Note 7 - Derivatives and Hedging Instruments . . . . . . . . . . . . . . . . . . . . . . . . . . . . . . . . . . . . . . . . . . . . . . . . . . . . . . . . . . . . 139
Note 8 - Reinsurance Balances Recoverable on Paid and Unpaid Losses . . . . . . . . . . . . . . . . . . . . . . . . . . . . . . . . . . . . . . 142
Note 9 - Deferred Charge Assets and Deferred Gain Liabilities . . . . . . . . . . . . . . . . . . . . . . . . . . . . . . . . . . . . . . . . . . . . . . . 145
Note 10 - Losses and Loss Adjustment Expenses . . . . . . . . . . . . . . . . . . . . . . . . . . . . . . . . . . . . . . . . . . . . . . . . . . . . . . . . . 146
Note 11 - Defendant Asbestos and Environmental Liabilities . . . . . . . . . . . . . . . . . . . . . . . . . . . . . . . . . . . . . . . . . . . . . . . . . 197
Note 12 - Fair Value Measurements . . . . . . . . . . . . . . . . . . . . . . . . . . . . . . . . . . . . . . . . . . . . . . . . . . . . . . . . . . . . . . . . . . . . 199
Note 13 - Premiums Written and Earned . . . . . . . . . . . . . . . . . . . . . . . . . . . . . . . . . . . . . . . . . . . . . . . . . . . . . . . . . . . . . . . . 208
Note 14 - Goodwill and Intangible Assets . . . . . . . . . . . . . . . . . . . . . . . . . . . . . . . . . . . . . . . . . . . . . . . . . . . . . . . . . . . . . . . . 208
Note 15 - Debt Obligations and Credit Facilities . . . . . . . . . . . . . . . . . . . . . . . . . . . . . . . . . . . . . . . . . . . . . . . . . . . . . . . . . . 209
Note 16 - Noncontrolling Interest . . . . . . . . . . . . . . . . . . . . . . . . . . . . . . . . . . . . . . . . . . . . . . . . . . . . . . . . . . . . . . . . . . . . . . 212
Note 17 - Shareholders' Equity . . . . . . . . . . . . . . . . . . . . . . . . . . . . . . . . . . . . . . . . . . . . . . . . . . . . . . . . . . . . . . . . . . . . . . . . 213
Note 18 - Earnings per Share . . . . . . . . . . . . . . . . . . . . . . . . . . . . . . . . . . . . . . . . . . . . . . . . . . . . . . . . . . . . . . . . . . . . . . . . . 217
Note 19 - Share-Based Compensation and Pensions . . . . . . . . . . . . . . . . . . . . . . . . . . . . . . . . . . . . . . . . . . . . . . . . . . . . . . 218
Note 20 - Income Taxation . . . . . . . . . . . . . . . . . . . . . . . . . . . . . . . . . . . . . . . . . . . . . . . . . . . . . . . . . . . . . . . . . . . . . . . . . . . 222
Note 21 - Related Party Transactions . . . . . . . . . . . . . . . . . . . . . . . . . . . . . . . . . . . . . . . . . . . . . . . . . . . . . . . . . . . . . . . . . . . 224
Note 22 - Dividend Restrictions and Statutory Financial Information . . . . . . . . . . . . . . . . . . . . . . . . . . . . . . . . . . . . . . . . . . . 233
Note 23 - Commitments and Contingencies . . . . . . . . . . . . . . . . . . . . . . . . . . . . . . . . . . . . . . . . . . . . . . . . . . . . . . . . . . . . . . 236
Note 24 - Segment Information . . . . . . . . . . . . . . . . . . . . . . . . . . . . . . . . . . . . . . . . . . . . . . . . . . . . . . . . . . . . . . . . . . . . . . . . 239
Note 25 - Unaudited Condensed Quarterly Financial Data . . . . . . . . . . . . . . . . . . . . . . . . . . . . . . . . . . . . . . . . . . . . . . . . . . 243
SCHEDULESI. Summary of Investments Other than Investments in Related Parties . . . . . . . . . . . . . . . . . . . . . . . . . . . . . . . . . . . . . . . . . . . 244
II. Condensed Financial Information of Registrant . . . . . . . . . . . . . . . . . . . . . . . . . . . . . . . . . . . . . . . . . . . . . . . . . . . . . . . . . . . 245
III. Supplementary Insurance Information . . . . . . . . . . . . . . . . . . . . . . . . . . . . . . . . . . . . . . . . . . . . . . . . . . . . . . . . . . . . . . . . . . 249
IV. Reinsurance . . . . . . . . . . . . . . . . . . . . . . . . . . . . . . . . . . . . . . . . . . . . . . . . . . . . . . . . . . . . . . . . . . . . . . . . . . . . . . . . . . . . . . 250
V. Valuation and Qualifying Accounts . . . . . . . . . . . . . . . . . . . . . . . . . . . . . . . . . . . . . . . . . . . . . . . . . . . . . . . . . . . . . . . . . . . . . 251
VI. Supplementary Information Concerning Property/Casualty Insurance Operations . . . . . . . . . . . . . . . . . . . . . . . . . . . . . . . . 252
Schedules other than those listed above are omitted as they are not applicable or the information has been included in the consolidated financial statements, notes thereto, or elsewhere herein.
Table of Contents
96

REPORT OF INDEPENDENT REGISTERED PUBLIC ACCOUNTING FIRMTo the Shareholders and Board of Directors
Enstar Group Limited:
Opinion on the Consolidated Financial StatementsWe have audited the accompanying consolidated balance sheets of Enstar Group Limited and subsidiaries (the Company) as of December 31, 2020 and 2019, the related consolidated statements of earnings, comprehensive income, changes in shareholders’ equity, and cash flows for each of the years in the three‑year period ended December 31, 2020, and the related notes and financial statement schedules I to VI (collectively, the consolidated financial statements). In our opinion, the consolidated financial statements present fairly, in all material respects, the financial position of the Company as of December 31, 2020 and 2019, and the results of its operations and its cash flows for each of the years in the three‑year period ended December 31, 2020, in conformity with U.S. generally accepted accounting principles.
We also have audited, in accordance with the standards of the Public Company Accounting Oversight Board (United States) (PCAOB), the Company’s internal control over financial reporting as of December 31, 2020, based on criteria established in Internal Control – Integrated Framework (2013) issued by the Committee of Sponsoring Organizations of the Treadway Commission, and our report dated March 1, 2021 expressed an unqualified opinion on the effectiveness of the Company’s internal control over financial reporting.
Basis for OpinionThese consolidated financial statements are the responsibility of the Company’s management. Our responsibility is to express an opinion on these consolidated financial statements based on our audits. We are a public accounting firm registered with the PCAOB and are required to be independent with respect to the Company in accordance with the U.S. federal securities laws and the applicable rules and regulations of the Securities and Exchange Commission and the PCAOB.
We conducted our audits in accordance with the standards of the PCAOB. Those standards require that we plan and perform the audit to obtain reasonable assurance about whether the consolidated financial statements are free of material misstatement, whether due to error or fraud. Our audits included performing procedures to assess the risks of material misstatement of the consolidated financial statements, whether due to error or fraud, and performing procedures that respond to those risks. Such procedures included examining, on a test basis, evidence regarding the amounts and disclosures in the consolidated financial statements. Our audits also included evaluating the accounting principles used and significant estimates made by management, as well as evaluating the overall presentation of the consolidated financial statements. We believe that our audits provide a reasonable basis for our opinion.
Critical Audit MattersThe critical audit matters communicated below are matters arising from the current period audit of the consolidated financial statements that were communicated or required to be communicated to the audit committee and that: (1) relate to accounts or disclosures that are material to the consolidated financial statements and (2) involved our especially challenging, subjective, or complex judgments. The communication of critical audit matters does not alter in any way our opinion on the consolidated financial statements, taken as a whole, and we are not, by communicating the critical audit matters below, providing separate opinions on the critical audit matters or on the accounts or disclosures to which they relate.
Loss reserves and asbestos and environmental liabilities
As discussed in Notes 2 (c), 2 (d), 10 and 11 to the consolidated financial statements, the Company has recorded a liability for loss and loss adjustment expenses (loss reserves) and defendant asbestos and environmental liabilities (asbestos and environmental liabilities) of $ 8,140 million and $ 706 million, respectively, as of December 31, 2020. Loss reserves include an amount determined from reported claims and an amount, based on historical loss experience and industry statistics, for losses incurred but not reported. Asbestos and environmental liabilities include amounts for indemnity and defense costs for pending and future claims, as well as estimated clean-up costs based on engineering reports. The Company establishes loss reserves and asbestos and environmental liabilities based on actuarially determined estimates of ultimate claims payments, with the assistance of actuarial specialists.
We identified the assessment of the estimate of loss reserves and asbestos and environmental liabilities as a critical audit matter. The evaluation of the estimate of loss reserves involved a high degree of auditor judgment due to the inherent uncertainty that exists in the losses incurred but not yet reported amounts, the outcome of
Table of Contents
97

coverage litigation on certain lines of business, and the significant amount of time that can lapse between the assumption of risk and ultimate payment of the claim. The evaluation of the estimate of asbestos and environmental liabilities involved a high degree of auditor judgment due to the inherent uncertainty that exists in estimating the number and potential value of claims asserted, but unpaid and claims not yet asserted. The key assumptions used in the estimation process for loss reserves included loss development factors, expected loss ratios, and expected trends in claim frequency and severity. The key assumptions used in the estimation process for asbestos and environmental liabilities included expected trends in claim frequency and severity. Specialized skills and knowledge were required to evaluate the actuarial methodologies and the key assumptions used to estimate loss reserves and asbestos and environmental liabilities.
The following are the primary procedures we performed to address this critical audit matter. We evaluated the design and tested the operating effectiveness of certain internal controls over the Company’s process to estimate the loss reserves and asbestos and environmental liabilities. This included controls over the assumptions listed above and actuarial methodologies used in the estimation of loss reserves and asbestos and environmental liabilities. We involved actuarial professionals with specialized skills and knowledge, who assisted in:
• comparing the methodologies and assumptions used by the Company in estimating loss reserves and asbestos and environmental liabilities with generally accepted actuarial methodologies
• evaluating assumptions for loss development factors, expected loss ratios, and expected trends in claim frequency and severity used in the estimation process of loss reserves by comparing them to historical results and industry trends
• evaluating assumptions for expected trends in claim frequency and severity used in the estimation process of asbestos and environmental liabilities by comparing them to historical results and industry trends
• developing an independent actuarial estimate of loss reserves and asbestos and environmental liabilities for selected lines of business
• examining the Company’s internal or independent external actuarial analyses for the remaining lines of business by 1) analyzing claims development in the current year; and 2) evaluating changes in methodologies and assumptions from the prior year
• assessing the movement of the recorded loss reserves within the Company’s range of actuarially determined reserves
• assessing the movement of the recorded asbestos and environmental liabilities within the Company’s range of actuarially determined reserves.
Liability for loss and loss adjustment expenses, fair value
As discussed in Notes 2 (c), 2 (q), 10 and 12 to the consolidated financial statements, the Company used a discounted cash flow approach to estimate the liability for loss and loss adjustment expenses, fair value. The discounted cash flow approach uses estimated nominal cash flows based on a payment pattern developed in accordance with standard actuarial techniques. Nominal loss reserves include an amount determined from reported claims and an amount, based on historical loss experience and industry statistics, for losses incurred but not reported. The Company establishes nominal loss reserves based on actuarially determined estimates of ultimate loss and loss adjustment expenses, with the assistance of actuarial specialists. The Company has recorded a liability for loss and loss adjustment expenses, fair value (loss reserves at fair value) of $ 2,453 million as of December 31, 2020.
We identified the assessment of loss reserves at fair value as a critical audit matter. The evaluation of the estimate of nominal loss reserves involved a high degree of auditor judgment due to the inherent uncertainty that exists in the losses incurred but not yet reported amounts, the outcome of coverage litigation on certain lines of business, and the significant amount of time that can lapse between the assumption of risk and ultimate payment of the claim. The key assumptions used in the estimation process included loss development factors and expected trends in claim frequency and severity. Specialized skills and knowledge were required to 1) evaluate the actuarial methodologies and certain assumptions used to estimate nominal loss reserves; and 2) evaluate the projected payout, including timing, and amount of the nominal cash flows used in the fair value estimate.
The following are the primary procedures we performed to address this critical audit matter. We evaluated the design and tested the operating effectiveness of certain internal controls over the Company’s process to estimate nominal loss reserves. This included controls over the assumptions and actuarial methodologies used in the 1) estimation of nominal loss reserves; and 2) the estimation of the projected payout, including timing and
Table of Contents
98
amount of the nominal cash flows used to develop the fair value. We involved actuarial professionals with specialized skills and knowledge, who assisted in:
• comparing the methodologies and assumptions used by the Company in estimating nominal loss reserves with generally accepted actuarial methodologies
• comparing assumptions for loss development factors and expected trends in claim frequency and severity to historical results and industry trends
• developing an independent actuarial estimate of nominal loss reserves for selected lines of business
• examining the Company’s internal and independent external actuarial analyses for the remaining lines of business by 1) analyzing claims development in the current year; and 2) evaluating changes in methodologies and assumptions from the prior year
• evaluating the Company’s overall nominal loss reserves and assessing the movement of the nominal loss reserves within the Company’s range of actuarially determined reserves
• evaluating the projected payout, including timing, and amount of the nominal cash flows used to develop the fair value, by developing an independent projected payout for selected lines of business
• examining the Company’s projected payout for the remaining lines of business by evaluating changes in the timing of the nominal cash flows from the prior year and evaluating changes in methodologies and assumptions from the prior year.
/s/ KPMG Audit LimitedKPMG Audit LimitedWe have served as the Company’s auditor since 2012.Hamilton, BermudaMarch 1, 2021
Table of Contents
99

ENSTAR GROUP LIMITED
CONSOLIDATED BALANCE SHEETS
As of December 31, 2020 and 2019
2020 2019(expressed in thousands of U.S.
dollars, except share data)ASSETSShort-term investments, trading, at fair value $ 5,129 $ 51,490
Short-term investments, available-for-sale, at fair value (amortized cost: 2020 — $263,750; 2019 — $128,311; net of allowance: 2020 — $0) 263,795 128,335
Fixed maturities, trading, at fair value 4,594,892 6,143,335
Fixed maturities, available-for-sale, at fair value (amortized cost: 2020 — $3,312,891; 2019 — $1,537,815; net of allowance: 2020 — $322) 3,395,100 1,538,052
Funds held - directly managed 1,074,890 1,187,552
Equities, at fair value 846,795 726,721
Other investments, at fair value 4,244,034 2,518,031
Equity method investments 832,295 326,277
Total investments (Note 6 and Note 12) 15,256,930 12,619,793
Cash and cash equivalents 901,152 624,472
Restricted cash and cash equivalents 471,964 346,877
Premiums receivable 405,793 491,511
Reinsurance balances recoverable on paid and unpaid losses (net of allowance: 2020 — $137,122) (Note 8) 1,568,333 1,485,616
Reinsurance balances recoverable on paid and unpaid losses, at fair value (Note 8 and Note 12) 520,830 695,518
Insurance balances recoverable (net of allowance: 2020 — $4,824) (Note 11) 249,652 448,855
Funds held by reinsured companies 635,819 475,732
Other assets 925,533 1,162,955
Assets held-for-sale (Note 5) 711,278 1,474,770
TOTAL ASSETS $ 21,647,284 $ 19,826,099
LIABILITIESLosses and loss adjustment expenses (Note 10) $ 8,140,362 $ 7,247,282
Losses and loss adjustment expenses, fair value (Note 10 and Note 12) 2,452,920 2,621,122
Defendant asbestos and environmental liabilities (Note 11) 706,329 847,685
Insurance and reinsurance balances payable 494,412 420,546
Debt obligations (Note 15) 1,373,259 1,191,207
Other liabilities 942,905 994,584
Liabilities held-for-sale (Note 5) 483,657 1,208,531
TOTAL LIABILITIES 14,593,844 14,530,957
COMMITMENTS AND CONTINGENCIES (Note 23)
REDEEMABLE NONCONTROLLING INTEREST (Note 16) 365,436 438,791
SHAREHOLDERS’ EQUITY (Note 17)Ordinary shares (par value $1 each, issued and outstanding 2020: 22,085,232; 2019: 21,511,505):
Voting Ordinary Shares (issued and outstanding 2020: 18,575,550; 2019: 18,001,823) 18,576 18,002 Non-voting convertible ordinary Series C Shares (issued and outstanding 2020 and 2019: 2,599,672) 2,600 2,600 Non-voting convertible ordinary Series E Shares (issued and outstanding 2020 and 2019: 910,010) 910 910
Preferred Shares:Series C Preferred Shares (issued and held in treasury 2020 and 2019: 388,571) 389 389
Series D Preferred Shares (issued and outstanding 2020 and 2019: 16,000) 400,000 400,000
Series E Preferred Shares (issued and outstanding 2020 and 2019: 4,400) 110,000 110,000
Treasury shares, at cost (Series C Preferred Shares 2020 and 2019: 388,571) (421,559) (421,559)
Joint Share Ownership Plan (voting ordinary shares, held in trust 2020: 565,630; 2019: 0) (566) —
Additional paid-in capital 1,836,074 1,836,778
Accumulated other comprehensive income 80,659 7,171
Retained earnings 4,647,312 2,887,892
Total Enstar Shareholders’ Equity 6,674,395 4,842,183
Noncontrolling interest 13,609 14,168
TOTAL SHAREHOLDERS’ EQUITY 6,688,004 4,856,351
TOTAL LIABILITIES, REDEEMABLE NONCONTROLLING INTEREST AND SHAREHOLDERS’ EQUITY $ 21,647,284 $ 19,826,099
See accompanying notes to the consolidated financial statements
Table of Contents
100

ENSTAR GROUP LIMITEDCONSOLIDATED STATEMENTS OF EARNINGS
For the Years Ended December 31, 2020, 2019 and 2018
2020 2019 2018(expressed in thousands of U.S.
dollars, except share and per share data)INCOME
Net premiums earned $ 572,092 $ 804,047 $ 695,779 Fees and commission income 42,446 28,453 35,088 Net investment income 302,817 308,271 261,698 Net realized and unrealized gains (losses) 1,642,019 1,011,966 (407,532) Other income 101,132 37,070 34,073
2,660,506 2,189,807 619,106 EXPENSES
Net incurred losses and loss adjustment expenses 415,926 614,179 323,722 Acquisition costs 171,020 240,609 177,855 General and administrative expenses 501,479 413,084 348,786 Interest expense 59,308 52,541 25,696 Net foreign exchange (gains) losses 16,393 (7,912) 2,644
1,164,126 1,312,501 878,703 EARNINGS (LOSS) BEFORE INCOME TAXES 1,496,380 877,306 (259,597) Income tax benefit (expense) (23,827) (12,372) 3,689 Earnings from equity method investments 238,569 55,910 42,147 NET EARNINGS (LOSS) FROM CONTINUING OPERATIONS 1,711,122 920,844 (213,761) Net earnings from discontinued operations, net of income taxes 16,251 7,375 1,489 NET EARNINGS (LOSS) 1,727,373 928,219 (212,272) Net loss attributable to noncontrolling interest 27,671 9,870 62,051 NET EARNINGS (LOSS) ATTRIBUTABLE TO ENSTAR 1,755,044 938,089 (150,221) Dividends on preferred shares (35,700) (35,914) (12,133) NET EARNINGS (LOSS) ATTRIBUTABLE TO ENSTAR ORDINARY SHAREHOLDERS $ 1,719,344 $ 902,175 $ (162,354)
Earnings per ordinary share attributable to Enstar Group Limited: Basic:Net earnings (loss) from continuing operations $ 79.43 $ 41.80 $ (7.89) Net earnings from discontinued operations 0.35 0.20 0.05 Net earnings (loss) per ordinary share $ 79.78 $ 42.00 $ (7.84)
Diluted:Net earnings (loss) from continuing operations $ 78.45 $ 41.23 $ (7.89) Net earnings from discontinued operations 0.35 0.20 0.05 Net earnings (loss) per ordinary share $ 78.80 $ 41.43 $ (7.84)
Weighted average ordinary shares outstanding:Basic 21,551,408 21,482,617 20,698,310 Diluted 21,818,294 21,775,066 20,904,176
See accompanying notes to the consolidated financial statements
Table of Contents
101

ENSTAR GROUP LIMITEDCONSOLIDATED STATEMENTS OF COMPREHENSIVE INCOME
For the Years Ended December 31, 2020, 2019 and 2018
2020 2019 2018 (expressed in thousands of U.S. dollars)NET EARNINGS (LOSS) $ 1,727,373 $ 928,219 $ (212,272)
Other comprehensive income (loss), net of income taxes:Unrealized gains (losses) on fixed income available-for-sale investments arising during the year 104,924 2,896 (2,284) Reclassification adjustment for change in allowance for credit losses recognized in net earnings (509) — — Reclassification adjustment for net realized (gains) losses included in net earnings (18,033) (3,894) 63 Reclassification to earnings on disposal of subsidiary (11,856) — — Unrealized gains (losses) arising during the year, net of reclassification adjustments 74,526 (998) (2,221) Change in currency translation adjustment (2,103) (2,428) (202) Reclassification to earnings on disposal of subsidiary 34 — — Cumulative currency translation adjustment, net of reclassification adjustments (2,069) (2,428) (202) Decrease in defined benefit pension liability 1,152 42 2,156 Total other comprehensive income (loss) 73,609 (3,384) (267)
Comprehensive income (loss) 1,800,982 924,835 (212,539) Comprehensive loss attributable to noncontrolling interest 27,550 9,985 62,291 COMPREHENSIVE INCOME (LOSS) ATTRIBUTABLE TO ENSTAR $ 1,828,532 $ 934,820 $ (150,248)
See accompanying notes to the consolidated financial statements
Table of Contents
102

ENSTAR GROUP LIMITEDCONSOLIDATED STATEMENTS OF CHANGES IN SHAREHOLDERS’ EQUITY
For the Years Ended December 31, 2020, 2019 and 2018
2020 2019 2018(expressed in thousands of U.S. dollars)
Share Capital — Voting Ordinary SharesBalance, beginning of year $ 18,002 $ 17,950 $ 16,402
Issue of shares 752 52 1,548 Shares repurchased (178) — —
Balance, end of year $ 18,576 $ 18,002 $ 17,950 Share Capital — Non-Voting Convertible Ordinary Series C Shares
Balance, beginning and end of year $ 2,600 $ 2,600 $ 2,600 Share Capital — Non-Voting Convertible Ordinary Series E Shares
Balance, beginning of year $ 910 $ 910 $ 405 Issue of shares — — 505
Balance, end of year $ 910 $ 910 $ 910 Share Capital - Series C Convertible Participating Non-Voting Preferred Shares
Balance, beginning and end of year $ 389 $ 389 $ 389 Share Capital - Series D Preferred Shares
Balance, beginning of year $ 400,000 $ 400,000 $ — Issue of shares — — 400,000
Balance, end of year $ 400,000 $ 400,000 $ 400,000 Share Capital - Series E Preferred Shares
Balance, beginning of year $ 110,000 $ 110,000 $ — Issue of shares — — 110,000
Balance, end of year $ 110,000 $ 110,000 $ 110,000 Treasury Shares (Series C Preferred Shares)
Balance, beginning and end of year $ (421,559) $ (421,559) $ (421,559) Joint Share Ownership Plan — Voting Ordinary Shares, Held in Trust
Balance, beginning of year $ — $ — $ — Issue of shares (566) — —
Balance, end of year $ (566) $ — $ — Additional Paid-in Capital
Balance, beginning of year $ 1,836,778 $ 1,804,664 $ 1,395,067 Issue (repurchase) of voting ordinary shares (815) 583 413,141 Shares repurchased (25,828) — — Issuance costs of preferred shares — — (14,643) Amortization of share-based compensation 25,939 31,531 11,099
Balance, end of year $ 1,836,074 $ 1,836,778 $ 1,804,664 Accumulated Other Comprehensive Income
Balance, beginning of year $ 7,171 $ 10,440 $ 10,468 Cumulative currency translation adjustment
Balance, beginning of year 8,548 10,986 11,171 Change in currency translation adjustment (672) (2,438) (185)
Balance, end of year 7,876 8,548 10,986 Defined benefit pension liability
Balance, beginning of year (945) (987) (3,143) Change in defined benefit pension liability 1,152 42 2,156
Balance, end of year 207 (945) (987) Unrealized gains (losses) on available-for-sale investments
Balance, beginning of year (432) 441 2,440 Change in unrealized gains (losses) on available-for-sale investments 73,008 (873) (1,999)
Balance, end of year 72,576 (432) 441 Balance, end of year $ 80,659 $ 7,171 $ 10,440
Retained EarningsBalance, beginning of year $ 2,887,892 $ 1,976,539 $ 2,132,912
Net earnings (loss) 1,727,373 928,219 (212,272) Net loss attributable to noncontrolling interest 27,671 9,870 62,051 Dividends on preferred shares (35,700) (35,914) (12,133) Change in redemption value of redeemable noncontrolling interests 46,224 9,178 7,554 Cumulative effect of change in accounting principle (6,148) — (1,573)
Balance, end of year $ 4,647,312 $ 2,887,892 $ 1,976,539 Noncontrolling Interest (excludes redeemable noncontrolling interests)
Balance, beginning of year $ 14,168 $ 12,056 $ 9,264 Contribution (distribution) of noncontrolling interest (400) (47) 49 Net earnings (loss) attributable to noncontrolling interest (159) 2,159 2,743
Balance, end of year $ 13,609 $ 14,168 $ 12,056
See accompanying notes to the consolidated financial statements
Table of Contents
103

ENSTAR GROUP LIMITEDCONSOLIDATED STATEMENTS OF CASH FLOWS
For the Years Ended December 31, 2020, 2019 and 2018
2020 2019 2018 (expressed in thousands of U.S. dollars)
OPERATING ACTIVITIES:Net earnings (loss) $ 1,727,373 $ 928,219 $ (212,272)
Net earnings from discontinued operations, net of income taxes (16,251) (7,375) (1,489)
Adjustments to reconcile net earnings to cash flows provided by (used in) operating activities:Realized losses (gains) on sale of investments (178,851) (86,071) 27,395
Unrealized losses (gains) on investments (1,463,168) (925,895) 380,137
Depreciation and other amortization 59,570 34,695 32,242
Earnings from equity method investments (238,569) (55,910) (42,147)
Sales and maturities of trading securities 3,792,083 5,361,936 4,706,318
Purchases of trading securities (2,139,399) (4,405,433) (5,343,965)
Other non-cash items 23,242 33,857 11,857
Changes in:Reinsurance balances recoverable on paid and unpaid losses 52,027 (316,440) (289,295)
Funds held by reinsured companies (192,313) (67,636) (215,041)
Losses and loss adjustment expenses 1,002,520 821,049 897,091
Defendant asbestos and environmental liabilities (141,356) (18,142) (15,844)
Insurance and reinsurance balances payable 86,645 50,859 133,676
Premiums receivable 23,326 204,358 (165,357)
Other operating assets and liabilities 389,487 (127,622) (44,915)
Net cash flows provided by (used in) operating activities 2,786,366 1,424,449 (141,609)
INVESTING ACTIVITIES:Acquisitions, net of cash acquired $ — $ 172,482 $ (245,151)
Sales of subsidiaries, net of cash sold (13,847) — —
Sales and maturities of available-for-sale securities 2,259,546 335,670 58,219
Purchase of available-for-sale securities (4,180,893) (1,826,724) (10,385)
Purchase of other investments (975,024) (794,613) (900,262)
Proceeds from other investments 594,676 581,639 434,255
Purchase of equity method investments (33,000) (69,213) (155,440)
Sale of equity method investment 12,200 — —
Other investing activities 906 (2,551) (8,321)
Net cash flows used in investing activities (2,335,436) (1,603,310) (827,085)
FINANCING ACTIVITIES:Net proceeds from the issuance of preferred shares $ — $ — $ 495,357
Dividends on preferred shares (35,700) (35,914) (12,133)
(Purchase) contribution by noncontrolling interest — (47) 49
Contribution by redeemable noncontrolling interest — 13,127 55,377
Contribution of capital to discontinued operations — (45,000) (51,000)
Dividends paid to noncontrolling interest (400) (11,556) (3,852)
Repurchase of shares (26,006) — —
Receipt of loans 858,512 1,070,502 1,132,507
Repayment of loans (679,000) (742,574) (914,319)
Net cash flows provided by financing activities 117,406 248,538 701,986 DISCONTINUED OPERATIONS CASH FLOWS:
Net cash flows provided by (used in) operating activities 107,644 339,067 (18,463) Net cash flows (used in) provided by investing activities (129,640) (380,227) 1,331 Net cash flows provided by financing activities — 45,000 51,000
Net cash flows from discontinued operations (21,996) 3,840 33,868
EFFECT OF EXCHANGE RATE CHANGES ON FOREIGN CURRENCY CASH, CASH EQUIVALENTS AND RESTRICTED CASH (5,800) (324) 2,588
NET INCREASE (DECREASE) IN CASH, CASH EQUIVALENTS AND RESTRICTED CASH 540,540 73,193 (230,252)
CASH, CASH EQUIVALENTS AND RESTRICTED CASH, BEGINNING OF YEAR 971,349 901,996 1,166,116
NET CHANGE IN CASH OF BUSINESSES HELD-FOR-SALE (138,773) (3,840) (33,868)
CASH, CASH EQUIVALENTS AND RESTRICTED CASH, END OF YEAR $ 1,373,116 $ 971,349 $ 901,996
Supplemental Cash Flow Information:Income taxes paid, net of refunds $ 25,029 $ 4,941 $ 12,355
Interest paid $ 50,775 $ 49,457 $ 25,240
Reconciliation to Consolidated Balance Sheets: Cash and cash equivalents $ 901,152 $ 624,472 $ 535,809
Restricted cash and cash equivalents 471,964 346,877 366,187
Cash, cash equivalents and restricted cash $ 1,373,116 $ 971,349 $ 901,996
In addition to the cash flows presented above, our noncash investing activities for the year ended December 31, 2020 included $235 million relating to the purchase of equity method investments which was satisfied through the sale of a subsidiary. Refer to Note 5 - "Divestitures, Held-for-Sale Businesses and Discontinued Operations."
See accompanying notes to the consolidated financial statements
Table of Contents
104

ENSTAR GROUP LIMITEDNOTES TO THE CONSOLIDATED FINANCIAL STATEMENTS
December 31, 2020, 2019 and 2018 (Tabular information expressed in thousands of U.S. dollars except share and per share data)
1. DESCRIPTION OF BUSINESS Enstar Group Limited ("Enstar") is a Bermuda-based holding company, formed in 2001. Enstar is a leading
global insurance group that offers innovative capital release solutions through its network of group companies in Bermuda, the United States, the United Kingdom, Continental Europe, Australia, and other international locations. Our ordinary shares are listed on the NASDAQ Global Select Market under the ticker symbol "ESGR". Unless the context indicates otherwise, the terms "Enstar," "we," "us" or "our" mean Enstar Group Limited and its consolidated subsidiaries and the term "Parent Company" means Enstar Group Limited and not any of its consolidated subsidiaries.
Our business is organized into three segments:
(i) Non-life Run-off: This segment comprises the operations of our subsidiaries that are in the business of running off property and casualty and other non-life (re)insurance business. It also includes our management business, which manages the run-off portfolios of third parties through our service companies;
(ii) Atrium: Atrium Underwriters Ltd. is a managing general agent at Lloyd’s of London ("Lloyd's"), which manages Syndicate 609. Through our Lloyd’s corporate member, SGL No.1 Limited ("SGL No.1"), we provide 25% of the underwriting capacity for Atrium's Syndicate 609 (with the balance provided by traditional Lloyd’s Names). Atrium specializes in a wide range of industry classes, including marine, aviation and transit, property and casualty binding authorities, reinsurance, accident and health and non-marine direct and facultative. As of December 31, 2020, we have classified the Atrium segment as held-for-sale in view of the Exchange Transaction as discussed in Note 5 - "Divestitures, Held-for-Sale Businesses and Discontinued Operations."; and
(iii) StarStone: StarStone was a global specialty insurer that offered a diverse range of property, casualty and specialty insurance through its operations in Bermuda, the United States, the United Kingdom, and Continental Europe. However, during 2020, StarStone's U.S. operations, including StarStone U.S. Holdings, Inc. and its subsidiaries ("StarStone U.S.") were sold and StarStone's remaining non-U.S. operations ("StarStone International") were placed into an orderly run-off. For further information, refer to Note 5 - "Divestitures, Held-for-Sale Businesses and Discontinued Operations."
Atrium and StarStone are reported as separate segments as of December 31, 2020 because they were managed and operated in separate and distinct manners. Atrium employees were not involved in the management or strategy of StarStone, nor were StarStone employees involved in the management or strategy of Atrium. Atrium and StarStone were monitored and reported upon separately and distinctly and the strategies and business plans were determined independently of each other.
In addition, our other activities, which do not qualify as a reportable segment, include our corporate expenses, debt servicing costs, preferred share dividends, holding company income and expenses, foreign exchange and other miscellaneous items.
Table of Contents
105
2. SIGNIFICANT ACCOUNTING POLICIES Basis of Preparation
The consolidated financial statements have been prepared in conformity with accounting principles generally accepted in the United States of America ("U.S. GAAP"). The consolidated financial statements include our assets, liabilities and results of operations as of December 31, 2020 and 2019 and for the years ended December 31, 2020, 2019 and 2018. Results of operations for acquired subsidiaries are included from the date of acquisition. All significant intercompany transactions and balances have been eliminated. Certain prior period amounts have been reclassified to conform to the current period presentation as described in further detail in Note 5 - "Divestitures, Held-for-Sale Businesses and Discontinued Operations." These reclassifications had no impact on net earnings.
Use of EstimatesThe preparation of financial statements in accordance with U.S. GAAP requires management to make
estimates and assumptions that affect the reported amount of assets and liabilities and disclosure of contingent assets and liabilities at the date of the financial statements and the reported amounts of revenues and expenses during the reporting period. Our actual results may differ materially from these estimates. The impact of changes in estimates are reflected in earnings in the period during which the estimate is changed. Accounting policies that we believe are most dependent on assumptions and estimates are considered to be our critical accounting estimates and are related to the determination of:
• liability for losses and loss adjustment expenses ("LAE");
• reinsurance balances recoverable on paid and unpaid losses;
• defendant asbestos and environmental liabilities and related insurance balances recoverable;
• valuation allowances on reinsurance balances recoverable and deferred tax assets;
• impairment charges, including credit allowances on investment securities classified as available-for-sale ("AFS"), and impairments on deferred charge assets;
• gross and net premiums written and net premiums earned;
• fair value measurements of investments;
• fair value estimates associated with accounting for acquisitions;
• fair value estimates associated with loss portfolio transfer reinsurance agreements for which we have elected the fair value option; and
• redeemable noncontrolling interests.
We expect that uncertainty and volatility in financial markets relating to the COVID-19 pandemic will continue to impact the value of our investments. The scope, duration and magnitude of the direct and indirect effects of the COVID-19 pandemic are changing rapidly and are difficult to anticipate. As with others in our industry, we are subject to economic factors such as interest rates, foreign exchange rates, underwriting events, regulation, tax policy changes, political risks and other market risks that can impact our strategy, operations, and results.
Significant Accounting Policies(a) Premiums Non-Life
Non-life premiums written are earned on a pro-rata basis over the period the coverage is provided. Reinsurance premiums are recorded at the inception of the policy, are based upon contractual terms and, for certain business, are estimated based on underlying contracts or from information provided by insureds and/or brokers. Changes in reinsurance premium estimates are expected and may result in adjustments in future periods. Any subsequent differences arising on such estimates are recorded as premiums written in the period in which they are determined.
Certain non-life contracts are retrospectively rated and provide for a final adjustment to the premium based on the final settlement of all losses. Premiums on such contracts are adjusted based upon contractual terms, and management judgment is involved with respect to the estimate of the amount of losses that we expect to incur. Additional premiums are recognized at the time loss thresholds specified in the contract are exceeded and are earned over the coverage period, or are earned immediately if the period of risk coverage has passed.
Table of Contents
ENSTAR GROUP LIMITEDNOTES TO THE CONSOLIDATED FINANCIAL STATEMENTS — (Continued)
106

Unearned Premium Reserves and Premiums Receivable
Unearned premium reserves represent the unexpired portion of policy premiums. For retrospectively rated contracts as well as those contracts whose written premium amounts are recorded based on premium estimates at inception, changes to accrued premiums arising from changes to these estimates are reflected as changes in premium balances receivable where appropriate.
Premium balances receivable are reported net of an allowance for expected credit losses as appropriate. The allowance is based upon our ongoing review of amounts outstanding, historical loss data, including delinquencies and write-offs, current and forecasted economic conditions and other relevant factors. However, the credit risk on our premiums receivable balances is substantially reduced where we have the ability to cancel the underlying policy if the policyholder does not pay the related premium.
(b) Acquisition Costs Acquisition costs, consisting principally of commissions and brokerage expenses and certain premium taxes
and fees incurred at the time a contract or policy is issued and that vary with and are directly related to the successful efforts of acquiring new insurance contracts or renewing existing insurance contracts, are deferred and amortized over the period in which the related premiums are earned. Deferred acquisition costs are limited to their estimated realizable value by line of business based on the related unearned premiums, anticipated claims and claim expenses and anticipated investment income.
A premium deficiency occurs if the sum of anticipated losses and loss adjustment expenses exceed unearned premiums, deferred acquisition costs and anticipated investment income. A premium deficiency is initially recognized by charging any deferred acquisition costs to expense to the extent required in order to eliminate the deficiency. If the premium deficiency exceeds the deferred acquisition costs then a liability is accrued for the excess deficiency.
(c) Losses and LAE Non-life Run-off
The liability for losses and LAE in the Non-life Run-off segment includes an amount determined from reported claims and an amount, based on historical loss experience and industry statistics, for losses incurred but not reported ("IBNR") determined using a variety of actuarial methods. These estimates are continually reviewed and are necessarily subject to the impact of future changes in factors such as claim severity and frequency, changes in economic conditions including the impact of inflation, legal and judicial developments, and medical cost trends. Our estimates, at inception and on an ongoing basis, do not include an estimate for potential future commutations and policy buybacks. Commutations and policy buybacks are often unique and circumstance-based, and each commutation or policy buyback is separately negotiated. Therefore, the successful execution of one commutation or policy buyback does not necessarily impact the likelihood of other commutations or policy buybacks occurring in the future. While we believe that our liability for losses and LAE is adequate, the ultimate amount may be in excess of, or less than, the amounts recorded on our financial statements. Adjustments will be reflected as part of the net increase or reduction in losses and LAE liabilities in the periods in which they become known. Premium and commission adjustments may be triggered by changes in incurred losses, and any changes in such amounts are recorded in the same period that the related change in incurred loss is recognized.
Commutations of acquired companies’ exposures have the effect of accelerating the payout of claims compared to the probability-weighted ranges of actuarially projected cash flows that we applied when estimating the fair values of assets and liabilities at the time of acquisition. Commutations and policy buybacks provide an opportunity for us to exit exposures to certain policies and insureds generally at a discount to our estimate of the ultimate liability and provide us with the ability to eliminate exposure to further losses. Commutations and policy buybacks can be beneficial to us as they legally extinguish liabilities in full, reduce the potential for future adverse loss development, and reduce future claims handling costs. Any material acceleration of payout together with the impact of any material loss reserve savings in any period will also accelerate the amortization of fair value adjustments and deferred charge assets and gain liabilities in that period. Commutations are only executed directly with insureds or reinsureds and any gains realized or losses incurred on the settlement of losses and LAE liabilities through commutations or policy buybacks are recognized upon the execution of a commutation or policy buyback with the insured or reinsured.
Our (re)insurance subsidiaries also establish provisions for LAE relating to run-off costs for the estimated duration of the run-off, which are included in the liability for losses and LAE. These provisions are assessed at each reporting date, and provisions relating to future periods are adjusted to reflect any changes in estimates of the
Table of Contents
ENSTAR GROUP LIMITEDNOTES TO THE CONSOLIDATED FINANCIAL STATEMENTS — (Continued)
107

periodic run-off costs or the duration of the run-off, including the impact of any acceleration of the run-off period that may be caused by commutations. Provisions relating to the current period together with any adjustment to future run-off provisions are included in net incurred losses and LAE in the consolidated statements of earnings.
Atrium and StarStone
The reserves for losses and LAE in the Atrium and StarStone segments include reserves for unpaid reported losses and for IBNR loss reserves. The reserves for unpaid reported losses and loss expenses are established by management based on reports from brokers, ceding companies and insureds and represent the estimated ultimate cost of events or conditions that have been reported to or specifically identified by us. The reserve for IBNR losses is established by us based on actuarially determined estimates of ultimate losses and loss expenses. Inherent in the estimate of ultimate losses and loss expenses are expected trends in claim severity and frequency and other factors which may vary significantly as claims are settled. Accordingly, ultimate losses and loss expenses may differ from the amounts recorded in the consolidated financial statements. These estimates are reviewed regularly and, as experience develops and new information becomes known, the reserves are adjusted as necessary. Such adjustments, if any, will be recorded in earnings in the period in which they become known. Prior period development arises from changes to loss estimates recognized in the current year that relate to loss reserves established in previous calendar years.
Components of Net Incurred Losses and LAE
Included within the total net incurred losses and LAE on our consolidated statement of earnings are the following items:
• Net losses paid: paid losses and LAE, net of related reinsurance recoveries.
• Net change in case and LAE reserves: the change in case reserves and associated LAE, net of related reinsurance recoveries.
• Net change in IBNR reserves: the change in IBNR reserves, net of related reinsurance recoveries.
• Increase (reduction) in estimates of net ultimate losses: the total of net losses paid, net change in case and LAE reserves and the net change in IBNR. This includes the net impact of commutations and policy buybacks on the liability for losses and LAE reserves and reinsurance recoveries.
• Increase (reduction) in provisions for unallocated LAE: the net change in our provision for unallocated LAE.
• Amortization of deferred charge assets and deferred gain liabilities: relates to retroactive reinsurance contracts where, if at the inception of the contract, the estimated undiscounted ultimate losses payable are in excess of the premiums received, a deferred charge asset is recorded for the excess; whereas, if the premiums received are in excess of the estimated undiscounted ultimate losses payable, a deferred gain liability is recorded for the excess, such that we don't record any gain or loss at the inception of these retroactive reinsurance contracts. In addition, for retrocessions of losses and LAE reserves that we have assumed through retroactive reinsurance contracts where the retroceded liabilities exceed the retrocession premiums paid, we record the excess as a deferred gain liability which is amortized to earnings over the estimated period during which the losses paid on the assumed retroceded liabilities are recovered from the retrocessionaire.
• Amortization of fair value adjustments: the amortization of the fair value adjustments associated with acquired companies, where the assumed losses and LAE reserves and the acquired reinsurance recoveries are fair valued on acquisition.
• Changes in fair value - fair value option: the changes in the fair value for reinsurance agreements where we have elected the fair value option. The change in fair value component includes the changes in the discounted cash flows and risk margin. The underlying ("nominal") net losses paid, net change in case and LAE reserves and the net change in IBNR reserves relating to these reinsurance agreements for which we have elected the fair value option are included within the appropriate line items described above.
• Net incurred losses and LAE: the total of the increase (reduction) in estimates of net ultimate losses, increase (reduction) in provisions for unallocated LAE, amortization of deferred charge assets and deferred gain liabilities, amortization of fair value adjustments and changes in fair value - fair value option.
Table of Contents
ENSTAR GROUP LIMITEDNOTES TO THE CONSOLIDATED FINANCIAL STATEMENTS — (Continued)
108

(d) Defendant Asbestos and Environmental Liabilities We acquired DCo LLC ("DCo") on December 30, 2016, and Morse TEC LLC ("Morse TEC") on October 30,
2019, as described in Note 3 - "Business Acquisitions." DCo and Morse TEC hold liabilities associated with personal injury asbestos claims and environmental claims arising from their legacy manufacturing operations. DCo and Morse TEC continue to process asbestos personal injury claims.
Defendant asbestos and environmental liabilities on our consolidated balance sheets include amounts for indemnity and defense costs for pending and future claims, determined using standard actuarial techniques for asbestos-related exposures. Defendant asbestos and environmental liabilities also include amounts for environmental liabilities associated with DCo's and Morse TEC's properties.
(e) Reinsurance Balances Recoverable on Paid and Unpaid Losses Amounts recoverable from reinsurers are estimated in a manner consistent with the underlying liability for
losses and loss adjustment expenses. We report our reinsurance balances recoverable on paid and unpaid losses net of an allowance for estimated uncollectible amounts. The allowance is based upon our ongoing review of the outstanding balances and reflects factors such as the duration of the collection period, credit quality, changes in reinsurer credit standing, default rates specific to the individual reinsurer, the geographical location of the reinsurer, contractual disputes with reinsurers over individual contentious claims, contract language or coverage issues, industry analyst reports and consensus economic forecasts.
A probability-of-default methodology that reflects current and forecasted economic conditions is used to estimate the allowance for uncollectible reinsurance due to credit-related factors. See "New Accounting Standards Adopted in 2020" below for the discussion on our adoption of the credit losses standard.
The allowance also includes estimated uncollectible amounts related to dispute risk with reinsurers. Amounts deemed to be uncollectible, including amounts due from known insolvent reinsurers, are written off against the allowance.
Changes in the allowance, as well as any subsequent collections of amounts previously written off, are reported as part of the net incurred losses and loss adjustment expenses in our consolidated statements of earnings.
On an ongoing basis, we also evaluate and monitor the financial condition of our reinsurers under voluntary schemes of arrangement to minimize our exposure to significant losses from potential insolvencies.
(f) Insurance Balances Recoverable Amounts billed to and due from insurers providing coverage for our defendant asbestos liabilities are
calculated in accordance with the terms of the individual insurance contracts.
The insurance balances recoverable related to our defendant asbestos liabilities are presented net of a provision for uncollectible amounts, reflecting the amount deemed not collectible primarily due to credit quality and contractual disputes with insurers over coverage issues.
(g) Investments, Cash and Cash Equivalents Short-term investments and fixed maturity investments
Short-term investments comprise investments with a maturity greater than three months up to one year from the date of purchase. Fixed maturities comprise investments with a maturity of greater than one year from the date of purchase.
Short-term and fixed maturity investments classified as trading are carried at fair value, with realized and unrealized gains and losses included in net earnings and reported as net realized and unrealized gains and losses.
Short-term and fixed maturity investments classified as AFS are carried at fair value, with unrealized gains and losses excluded from net earnings and reported as a separate component of accumulated other comprehensive income (loss) ("AOCI"). Realized gains and losses on sales of investments classified as AFS are recognized in the consolidated statements of earnings.
The costs of short-term and fixed maturity investments are adjusted for amortization of premiums and accretion of discounts, recognized using the effective yield method and included in net investment income. For mortgage-backed and asset-backed investments, and any other holdings for which there is a prepayment risk, prepayment assumptions are evaluated and reviewed on a regular basis.
Table of Contents
ENSTAR GROUP LIMITEDNOTES TO THE CONSOLIDATED FINANCIAL STATEMENTS — (Continued)
109

Investment purchases and sales are recorded on a trade-date basis. Realized gains and losses on the sale of investments are based upon specific identification of the cost of investments.
Allowance for Credit Losses
We perform a detailed analysis every reporting period to identify any credit losses on our investment portfolios not measured at fair value through net earnings.
Some of the factors that we consider when assessing whether an allowance for credit losses is required on our debt securities include: (1) the extent to which the fair value has been less than the amortized cost; (2) the financial condition, near-term and long-term prospects of the issuer, including the relevant industry conditions and trends, and implications of rating agency actions and offering prices; (3) the likelihood of the recoverability of principal and interest; and (4) whether it is more likely than not that we will be required to sell the security prior to an anticipated recovery in value.
With effect from January 1, 2020, credit losses on our AFS debt securities are recognized through an allowance account which is deducted from the amortized cost basis of the security, with the net carrying value of the security presented on the consolidated balance sheet at the amount expected to be collected. To calculate the amount of the credit loss, we compare the present value of the expected future cash flows with the amortized cost basis of the AFS debt security, with the amount of the credit loss recognized being limited to the excess of the amortized cost basis over the fair value of the AFS debt security, effectively creating a “fair value floor”. See "New Accounting Standards Adopted in 2020" below for the discussion on our adoption of the credit losses standard.
For our AFS debt securities that we do not intend to sell or for which it is more likely than not that we will not be required to sell before an anticipated recovery in value, we separate the credit loss component of any unrealized losses from the amount related to all other factors and report the credit loss component in net realized investment gains (losses) in our consolidated statements of earnings. The unrealized losses related to non-credit factors is reported in other comprehensive income. The allowance for credit losses account is adjusted for any additional credit losses, write-offs and subsequent recoveries and is reflected in earnings.
For our AFS debt securities where we record a credit loss, a determination is made as to the cause of the credit loss and whether we expect a recovery in the fair value of the security. For our AFS debt securities where we expect a recovery in fair value, the constant effective yield method is utilized, and the investment is amortized to par.
For our AFS debt securities that we intend to sell or for which it is more likely than not that we will be required to sell before an anticipated recovery in fair value, the full amount of the unrealized loss is included in net realized investment gains (losses). The new cost basis of the investment is the previous amortized cost basis less the credit loss recognized in net realized investment gains (losses). The new cost basis is not adjusted for any subsequent recoveries in fair value.
We report the investment income accrued on our AFS debt securities within other assets and therefore separately from the underlying AFS debt securities. In addition, due to the short-term period during which accrued investment income remains unpaid, which is typically six months or less, since the coupon on our AFS debt securities is paid semi-annually or more frequently, we have elected not to establish an allowance for credit losses on our accrued investment income balances. Accrued investment income is written off through net realized investment gains (losses) at the time the issuer of the debt security defaults or is expected to default on payments.
Uncollectible debt securities are written off when we determine that no additional payments of principal or interest will be received.
Other-Than-Temporary Impairments ("OTTI")
As discussed above and below, with effect from January 1, 2020, we adopted the new credit losses standard which replaced the OTTI model that was previously applicable to our AFS debt securities. The new approach now requires the recognition of impairment charges relating to credit losses through an allowance account and limits the amount of credit loss to the difference between a security’s amortized cost basis and its fair value. A description of our historical OTTI process which was in place prior to our adoption of the new credit losses standard and which applied to our comparative financial statements is provided below.
Fixed maturity investments classified as AFS were reviewed quarterly to determine if they had sustained an impairment of value that was, based on our judgment, considered to be other than temporary. The process included reviewing each fixed maturity investment whose fair value was below amortized cost and: (1) determining if we had the intent to sell the fixed maturity investment; (2) determining if it was more likely than not that we would be
Table of Contents
ENSTAR GROUP LIMITEDNOTES TO THE CONSOLIDATED FINANCIAL STATEMENTS — (Continued)
110
required to sell the fixed maturity investment before its anticipated recovery; and (3) assessing whether a credit loss existed, that is, whether we anticipated if the present value of the cash flows expected to be collected from the fixed maturity investment would be less than the amortized cost basis of the investment.
In assessing whether it was more likely than not that we would be required to sell a fixed maturity investment before its anticipated recovery, we considered various factors including our future cash flow requirements, legal and regulatory requirements, the level of our cash, cash equivalents, short-term investments and fixed maturity investments available-for-sale in an unrealized gain position, and other relevant factors.
In evaluating credit losses, we considered a variety of factors in the assessment of a fixed maturity investment including: (1) the time period during which there had been a significant decline below cost; (2) the extent of the decline below cost and par; (3) the potential for the investment to recover in value; (4) an analysis of the financial condition of the issuer; (5) the rating of the issuer; and (6) failure of the issuer of the investment to make scheduled interest or principal payments.
If we concluded that an investment was other-than-temporarily impaired, then the difference between the fair value and the amortized cost of the investment was presented as an OTTI charge in the consolidated statements of earnings, with an offset for any non-credit related loss component of the OTTI charge recognized in other comprehensive income. Accordingly, only the credit loss component of the OTTI amount would have an impact on our earnings.
Equities
We hold investments in publicly traded equities and exchange-traded funds as well as in privately held equities. Our equity investments are carried at fair value with realized and unrealized gains and losses included in net earnings and reported as net realized and unrealized gains and losses.
Other investments, at fair value
Other investments include investments in limited partnerships and limited liability companies (collectively "private equities") and fixed income funds, hedge funds, equity funds, private credit funds and collateralized loan obligation ("CLO") equity funds that carry their investments at fair value, as well as direct investments in CLO equities. These other investments are stated at fair value, which ordinarily will be the most recently reported net asset value as advised by the fund manager or administrator. Many of our fund investments publish net asset values on a daily basis and provide daily liquidity while others report on a monthly or quarterly basis. The change in fair value is included in net realized and unrealized gains and losses on investments and recognized in net earnings.
Equity method investments
Investments in which the Company has significant influence over the operating and financial policies of the investee are classified as equity method investments and are accounted for using the equity method of accounting. In applying the equity method of accounting, investments are initially recorded at cost and are subsequently adjusted based on the Company's proportionate share of net income or loss of the investee, net of any distributions received from the investee. We typically record our proportionate share of an investee's net income or loss on a quarter lag in line with the timing of when they report their financial information to us. Any adjustments made to the carrying value of our equity method investees are based on the most recently available financial information from the investees. Changes in the carrying value of such investments are recorded in our consolidated statements of earnings as earnings (losses) from equity method investments. Any decline in the value of our equity method investments considered by management to be other-than-temporary is reflected in our consolidated statements of earnings in the period in which it is determined.
Cash and cash equivalents
Cash equivalents includes money market funds, fixed interest deposits and all highly liquid debt instruments purchased with an original maturity of three months or less.
(h) Variable interest entitiesWe have investments in certain limited partnership funds which are deemed to be variable interest entities
(“VIEs”) and which are included in other investments at the reported net asset value (“NAV”). Determining whether to consolidate a VIE may require judgment in assessing (i) whether an entity is a VIE, and (ii) if we are the entity’s primary beneficiary and thus required to consolidate the entity. To determine if we are the primary beneficiary of a VIE, we evaluate whether we have (i) the power to direct the activities that most significantly impact the VIE’s
Table of Contents
ENSTAR GROUP LIMITEDNOTES TO THE CONSOLIDATED FINANCIAL STATEMENTS — (Continued)
111

economic performance, and (ii) the obligation to absorb losses or the right to receive benefits of the VIE that could potentially be significant to the VIE. Our evaluation includes identification of the activities that most significantly impact the VIE’s economic performance and an assessment of our ability to direct those activities based on governance provisions, contractual arrangements to provide or receive certain services, funding commitments and other applicable agreements and circumstances. Our assessment of whether we are the primary beneficiary of our VIEs requires significant assumptions and judgment.
(i) Funds Held Under funds held arrangements, the reinsured company has retained funds that would otherwise have been
remitted to our reinsurance subsidiaries. The funds balance is credited with investment income and losses payable are deducted. Funds held are shown under two categories on the consolidated balance sheets, funds held where we receive the underlying portfolio economics are shown as "Funds held - directly managed", and funds held where we receive a fixed crediting rate are shown as "Funds held by reinsured companies". Funds held by reinsured companies are carried at cost. Funds held - directly managed, are carried at fair value and represents the aggregate of funds held at cost and the value of an embedded derivative. The embedded derivative relates to our contractual right to receive the return on the underlying investment portfolio economics. The investment returns on both categories of funds held are recognized in net investment income and net realized and unrealized gains (losses). The revaluation of the embedded derivative is included in net unrealized gains (losses).
(j) Fees and Commission Income Fees and commission income primarily includes profit commissions earned from managed Lloyd's syndicates
as well as fees earned under fronting and consulting arrangements with third-party clients, which are recorded on an accrual basis.
(k) Foreign Exchange Our reporting currency is the U.S. dollar. Assets and liabilities of certain of our subsidiaries and equity method
investees whose functional currency is not the U.S. dollar are translated at period end exchange rates. Revenues and expenses of such foreign entities are translated at average exchange rates during the year. The effect of the currency translation adjustments for these foreign entities is included in accumulated other comprehensive income (loss).
Other foreign currency assets and liabilities that are considered monetary items are translated at exchange rates in effect at the balance sheet date. Foreign currency revenues and expenses are translated either at transaction date exchange rates or using an appropriately weighted average exchange rate for the reporting period. These exchange gains and losses are recognized in net earnings.
(l) Share-based Compensation We primarily use four types of share-based compensation arrangements: (i) restricted shares, restricted share
units and performance share units ("PSUs"), (ii) joint share ownership program ("JSOP"), (iii) cash-settled stock appreciation rights ("SARs") and (iv) shares issued under our employee share purchase plans. With the exception of SARs and the incentive plan awards issued to certain employees of Atrium and StarStone, our share-based compensation awards qualify for equity classification. For equity-classified awards, the fair value of the compensation cost is measured at the grant date and is expensed over the service period of the award within general and administrative expenses in the consolidated statements of earnings except for PSUs where the expense also varies depending on the performance multiplier on the award. The SARs, the Atrium and StarStone incentive plan awards are classified as liability awards. Liability classified awards are recorded at fair value within other liabilities in the consolidated balance sheet with changes in fair value relating to the vested portion of the award recorded within general and administrative expenses in the consolidated statements of earnings.
(m) Derivative Instruments We utilize derivative instruments in our foreign currency, investments and interest rate risk management
strategies and recognize all derivatives as either assets or liabilities in the consolidated balance sheets and carry them at the fair value of the specific instrument utilized. Changes in the fair value as well as realized gains or losses on derivative instruments are recognized in net earnings if they are not designated as qualifying hedging instruments or if the criteria for establishing a perfectly effective designated hedging relationship for our net investment hedges has not been met. However, if a designated net investment hedge is deemed to be perfectly effective, then we recognize the changes in the fair value of the underlying hedging instrument in accumulated other comprehensive income (loss) until the application of hedge accounting is discontinued. Any cumulative gains or
Table of Contents
ENSTAR GROUP LIMITEDNOTES TO THE CONSOLIDATED FINANCIAL STATEMENTS — (Continued)
112

losses arising on designated net investment hedges are deferred in accumulated other comprehensive income (loss) until the cumulative translation adjustment ("CTA") from the underlying hedged net investment is recognized in net earnings due to a disposal, deconsolidation or substantial liquidation.
Certain of our funds held arrangements also contain embedded derivatives as described above, which are carried at fair value. In addition, we may also hold equity call options and other derivatives carried at fair value, as part of our investment strategy.
(n) Income Taxes Certain of our subsidiaries and branches operate in jurisdictions where they are subject to taxation. Current
and deferred tax expense or benefit is allocated to net earnings (loss), or, in certain cases, to discontinued operations or other comprehensive income (loss). Current tax is recognized and measured upon enacted tax laws and rates applicable in the relevant jurisdiction in the period in which the income tax becomes accruable or realizable. Deferred taxes are provided for temporary differences between the carrying amount of assets and liabilities used in the financial statements and the tax basis used in the various jurisdictional tax returns. When our assessment indicates that all or some portion of deferred tax assets will not be realized, a valuation allowance is recorded against the deferred tax assets to reduce the assets to an amount more likely than not to be realized.
We recognize the benefit relating to tax positions only where the position is more likely than not to be sustained assuming examination by tax authorities. A recognized tax benefit is measured as the largest amount that is greater than 50 percent likely of being realized upon settlement. A liability or other adjustment is recognized for any tax benefit (along with any interest and penalty, if applicable) claimed in a tax return in excess of the amount allowed to be recognized in the financial statements under U.S. GAAP. Any changes in amounts recognized are recorded in the period in which they are determined in our consolidated statements of earnings.
(o) Earnings Per Share Basic earnings per share is based on the weighted average number of ordinary shares outstanding and
excludes potentially dilutive securities such as restricted shares, restricted share units, warrants, options and convertible securities. Diluted earnings per share is based on the weighted average number of ordinary and ordinary share equivalents outstanding calculated using the treasury stock method for all potentially dilutive securities. When the effect of dilutive securities would be anti-dilutive, these securities are excluded from the calculation of diluted earnings per share.
(p) Acquisitions, Goodwill and Intangible Assets The acquisition method is used to account for all business acquisitions. This method requires that we record
the acquired assets and liabilities at their estimated fair value. The fair values of each of the acquired reinsurance assets and liabilities are derived from probability-weighted ranges of the associated projected cash flows, based on actuarially prepared information and management’s run-off strategy. Our run-off strategy, as well as that of other run-off market participants, is expected to be different from the seller's as generally sellers are not specialized in running off (re)insurance liabilities whereas we and other market participants do specialize in such run-offs.
The key assumptions used by us and, we believe, by other run-off market participants in the valuation of acquired companies are (i) the projected payout, timing and amount of claims liabilities; (ii) the related projected timing and amount of reinsurance collections; (iii) an appropriate discount rate, which is applied to determine the present value of the future cash flows; (iv) the estimated unallocated LAE to be incurred over the life of the run-off; (v) the impact of any accelerated run-off strategy; and (vi) an appropriate risk margin.
The difference between the nominal carrying values of the acquired reinsurance liabilities and assets as of the acquisition date and their fair value is recorded as a fair value adjustment ("FVA") on the consolidated balance sheet. The FVA is amortized over the estimated payout period of the acquired outstanding losses and LAE and reinsurance balances recoverable. To the extent the actual payout experience after the acquisition is materially faster or slower than anticipated at the time of the acquisition as a result of, (i) our active claims management strategies, which include commutations and policy buybacks, (ii) an adjustment to the estimated ultimate loss reserves, (iii) changes in bad debt provisions, or (iv) changes in estimates of future run-off costs following accelerated payouts, then the amortization of the FVA is adjusted to reflect such changes.
Intangible assets arising from our business acquisitions are classified as either definite-lived or indefinite-lived intangible assets. Definite-lived intangible assets are amortized over their useful lives with the amortization expense being recognized in the consolidated statements of earnings. Indefinite-lived intangible assets are however not subject to amortization. The carrying values of intangible assets are reviewed for indicators of impairment at least
Table of Contents
ENSTAR GROUP LIMITEDNOTES TO THE CONSOLIDATED FINANCIAL STATEMENTS — (Continued)
113
annually. Impairment is recognized if the carrying values of the definite-lived intangible assets are not recoverable from their undiscounted cash flows and is measured as the amount by which the carrying value exceeds the fair value. Similarly, for indefinite-lived intangible assets, if the carrying value of the asset exceeds its fair value, then an impairment loss is recognized in an amount equal to the excess.
The difference between the fair value of net assets acquired and the purchase price is recorded as goodwill and included as an asset on the consolidated balance sheet or as a gain from bargain purchase in the consolidated statements of earnings. Goodwill is established initially upon acquisition and assessed at least annually for impairment. If the goodwill asset is determined to be impaired it is written down in the period in which the determination is made.
(q) Retroactive Reinsurance Retroactive reinsurance policies provide indemnification for losses and LAE with respect to past loss events.
In our Non-life Run-off segment we generally use the balance sheet accounting approach for assumed loss portfolio transfers, whereby at the inception of the contract there are no premiums or losses recorded in earnings.
Deferred Charge Assets and Deferred Gain Liabilities
If, at the inception of a Non-life Run-off retroactive reinsurance contract, the estimated undiscounted ultimate losses payable are in excess of the premiums received, a deferred charge asset is recorded for the excess; whereas, if the premiums received are in excess of the estimated undiscounted ultimate losses payable, a deferred gain liability is recorded for the excess, such that we don't record any gain or loss at the inception of these retroactive reinsurance contracts. In addition, for retrocessions of losses and LAE reserves that we have assumed through retroactive reinsurance contracts where the retroceded liabilities exceed the retrocession premiums paid, we record the excess as a deferred gain liability which is amortized to earnings over the estimated period during which the losses paid on the assumed retroceded liabilities are recovered from the retrocessionaire.
The premium consideration that we charge the ceding companies under retroactive reinsurance contracts may be lower than the undiscounted estimated ultimate losses payable due to the time value of money. After receiving the premium consideration in full from our cedents at the inception of the contract, we invest the premium received over an extended period of time, thereby generating investment income. We expect to generate profits from these retroactive reinsurance contracts when taking into account the premium received and expected investment income, less contractual obligations and expenses.
Deferred charge assets, recorded in other assets, and deferred gain liabilities, recorded in other liabilities, are amortized over the estimated claim payment period of the related contract with the periodic amortization reflected in earnings as a component of losses and LAE. The amortization of deferred charge assets and deferred gain liabilities is adjusted at each reporting period to reflect new estimates of the amount and timing of remaining loss and LAE payments. Changes in the estimated amount and the timing of payments of unpaid losses may have an effect on the unamortized deferred charge assets and deferred gain liabilities and the amount of periodic amortization. When liabilities for losses and LAE are extinguished through commutations and policy buybacks, they are removed from our estimates for the remaining loss and LAE payments, and this will generally result in an acceleration of the amortization of the deferred charge assets and deferred gain liabilities. Deferred charge assets are assessed at each reporting period for impairment and if the asset is determined to be impaired, then it is written down in the period in which the determination is made with that write down reflected in earnings as a component of net incurred losses and LAE.
Fair Value Option
In our Non-life Run-off segment, we have elected to apply the fair value option for certain loss portfolio transfer reinsurance transactions. This is an irrevocable election that applies to all balances under the insurance contract, including funds held assets, reinsurance balances recoverable on paid and unpaid losses, and the liability for losses and loss adjustment expenses.
We use an internal model to calculate the fair value of the liability for losses and loss adjustment expenses and the reinsurance balances recoverable on paid and unpaid losses. The nominal amounts related to the funds held assets, reinsurance balances recoverable on paid and unpaid losses, and the liability for losses and loss adjustment expenses, are inputs in our internal model. Note 12 - "Fair Value Measurements" describes the internal model, including the observable and unobservable inputs used in the model.
Table of Contents
ENSTAR GROUP LIMITEDNOTES TO THE CONSOLIDATED FINANCIAL STATEMENTS — (Continued)
114

(r) Redeemable Noncontrolling Interest In connection with the acquisitions of Arden, Atrium and StarStone, certain subsidiaries issued shares to
noncontrolling interests. These shares provide certain redemption rights to the holders, which may be settled in our own shares or cash or a combination of cash and shares, at our option. Redeemable noncontrolling interests with redemption features that are not solely within our control are classified within temporary equity in the consolidated balance sheets and carried at their redemption value, which is fair value. Any change in the fair value is recognized through retained earnings as if the balance sheet date was also the redemption date.
(s) Held-for-sale Business and Discontinued Operations We report a business as held-for-sale when certain criteria are met, which include (1) management has either
approved the sale or is in the process of obtaining approval to sell the business and is committed to a formal plan to sell the business, (2) the business is available for immediate sale in its present condition, (3) the business is being actively marketed for sale at a price that is reasonable in relation to its current fair value, and (4) the sale is anticipated to occur within the next 12 months, among other specified criteria. A business classified as held-for-sale is recorded at the lower of its carrying amount or estimated fair value less costs to sell. If the carrying amount of the business exceeds its estimated fair value, a loss is recognized. Assets and liabilities related to the businesses classified as held-for-sale are separately reported in our Consolidated Balance Sheets beginning in the period in which the business is classified as held-for-sale. Refer to Note 5 - "Divestitures, Held-for-Sale Businesses and Discontinued Operations" for further information regarding our held-for-sale business.
Disposals that represent strategic shifts that have or will have a major effect on our operations and financial results are reported as discontinued operations which requires the restatement of the comparatives reflected on our consolidated financial statements. In addition, transactions with discontinued operations are not eliminated on consolidation and any transactions that were previously eliminated on consolidation but which will continue with the discontinued operations are restated for all periods presented and reflected within continuing operations in our consolidated financial statements.
New Accounting Standards Adopted in 2020 Accounting Standards Update ("ASU") 2020-10 – Codification Improvements
In October 2020, the Financial Accounting Standards Board ("FASB") issued ASU 2020-10, which (1) removes references to various FASB Concepts Statements, (2) situates all disclosure guidance in the appropriate disclosure section of the Codification, and (3) makes other improvements and technical corrections to the Codification, with these amendments being applied retrospectively. We early adopted this guidance and that adoption did not have a material impact on our consolidated financial statements and disclosures.
ASU 2020-09 – Amendments to SEC Paragraphs Pursuant to SEC Release No. 33-10762
In October 2020, the FASB issued ASU 2020-09, which amends and supersedes various SEC paragraphs included in a number of Codification Topics pursuant to the issuance of the SEC's Release No. 33-10762. Through Release No. 33-10762, which was issued in March 2020, the SEC made amendments to the financial disclosure requirements in Regulation S-X for guarantors and issuers of guaranteed securities registered or being registered, and issuers’ affiliates whose securities collateralize securities registered or being registered, to improve those requirements for both investors and registrants. The changes made by the SEC are intended to (1) provide investors with material information given the specific facts and circumstances, (2) make the disclosures easier to understand, and (3) reduce the costs and burdens to registrants.
The amended rules in Release No. 33-10762 became effective on January 4, 2021, although early compliance was permitted. We elected early compliance with the new rules subsequent to their issuance. Because the amendments made by the FASB in this ASU are designed to ensure alignment of the relevant SEC paragraphs in various Codification Topics with the amended rules in Release No. 33-10762, the amendments did not have a material impact on our disclosures, since we already elected early compliance with the amended rules in Release No. 33-10762.
ASU 2020-04 and ASU 2021-01– Reference Rate Reform
In March 2020, the FASB issued ASU 2020-04, which is codified in Accounting Standards Codification ("ASC") 848 and which provides entities with temporary optional expedients and exceptions to the existing US GAAP guidance on contract modifications and hedge accounting to ease the financial reporting burdens related to the expected market transition from the London Inter-bank Offered Rate ("LIBOR") and other inter-bank offered rates to alternative reference rates, such as the Secured Overnight Financing Rate ("SOFR").
Table of Contents
ENSTAR GROUP LIMITEDNOTES TO THE CONSOLIDATED FINANCIAL STATEMENTS — (Continued)
115

Under the provisions of ASU 2020-04, entities can elect not to apply certain modification accounting requirements to contracts affected by reference rate reform, if certain criteria are met. An entity that makes this election would not have to remeasure the contracts at the modification date or reassess a previous accounting determination. Entities can also elect various optional expedients for hedging relationships affected by reference rate reform, if certain criteria are met. Once elected, the amendments in this guidance must be applied prospectively for all eligible contract modifications.
Subsequently in January 2021, the FASB issued ASU 2021-01 to refine the scope of ASC 848 and clarify that certain optional expedients and exceptions in ASC 848 for contract modifications and hedge accounting apply to derivatives that are affected by the discounting transition. Specifically, the ASU clarified that certain provisions in ASC 848, if elected by an entity, apply to derivative instruments that use an interest rate for margining, discounting, or contract price alignment that is modified as a result of reference rate reform. The amendments in ASU 2021-01 are effective immediately for all entities and can be applied either on a full retrospective or prospective basis depending on the facts and circumstances.
ASU 2020-04 was effective upon issuance and can be applied through to December 31, 2022. We adopted the ASU upon its issuance and as we transition from LIBOR to alternative reference rates, we have elected the temporary optional expedients and exceptions to the existing US GAAP guidance on contract modifications and hedge accounting permitted by the ASU, as appropriate. The adoption of this standard did not have any impact on our consolidated financial statements and disclosures.
ASU 2020-03 – Codification Improvements to Financial Instruments
In March 2020, the FASB issued ASU 2020-03, which makes narrow-scope improvements to various topics within the codification relating to financial instruments, including the new credit losses standard. The amendments related to certain specific issues covered by the ASU were effective immediately upon the issuance of the ASU, while certain specific issues covered by the ASU and affecting the credit losses standard in ASU 2016-13 were effective in 2020 for those entities that have already adopted ASU 2016-13. We adopted the amendments in this ASU upon its issuance and that adoption did not have a material impact on our consolidated financial statements and the related disclosures.
ASUs 2016-13, 2018-19, 2019-04, 2019-05, 2019-10 and 2019-11, Financial Instruments – Credit Losses – Measurement of Credit Losses on Financial Instruments
In June 2016, the FASB issued ASU 2016-13, which is codified in ASC 326 - Financial Instruments - Credit Losses, amending the guidance on the impairment of financial instruments and significantly changing how entities measure credit losses for most financial assets and certain other financial instruments, including reinsurance balances recoverable on paid and unpaid losses that are not measured at fair value through net earnings. The ASU replaced the “incurred loss” approach that was previously applied to determine credit losses with an “expected loss” model for financial instruments measured at amortized cost. Under the "expected loss" model, the estimate of expected credit losses should consider historical information, current information, as well as reasonable and supportable forecasts, including estimates of prepayments. The expected credit losses and subsequent adjustments to such losses are recorded through an allowance account that is deducted from the amortized cost basis of the financial asset, with the net carrying value of the financial asset presented on the consolidated balance sheet at the amount expected to be collected.
ASU 2016-13 also amends the other-than-temporary impairment ("OTTI") model that was previously applicable to AFS debt securities, with the new approach now requiring the recognition of impairments relating to credit losses through an allowance account and limiting the amount of credit loss to the difference between a security’s amortized cost basis and its fair value. This revised approach records the full effect of reversals of any credit losses in current period earnings, compared to previous guidance where this reversal was amortized over the lifetime of the security. Under this revised approach, the length of time a security has been in an unrealized loss position will no longer be considered in determining whether to record a credit loss. In addition, the historical and implied volatility of the fair value of a security and recoveries or declines in fair value after the balance sheet date will no longer be considered when making a determination of whether a credit loss exists.
We adopted ASU 2016-13 and all the related amendments on January 1, 2020 using the modified retrospective approach for our financial instruments carried at amortized cost, and prospectively for our AFS debt securities as required by the standard, resulting in an overall reduction in retained earnings of $6.1 million as summarized below:
• A cumulative effect adjustment of $3.0 million relating to our financial instruments carried at amortized cost,
Table of Contents
ENSTAR GROUP LIMITEDNOTES TO THE CONSOLIDATED FINANCIAL STATEMENTS — (Continued)
116

which primarily relates to our insurance balances recoverable on paid and unpaid losses. We already carried significant specific allowances for credit losses of $147.6 million on our reinsurance balances recoverable on paid and unpaid losses, relating primarily to our Non-life Run-off segment and therefore the adoption of this standard did not have a material impact on our balance sheet; and
• $3.1 million related to our AFS debt securities whose fair values were less than their amortized cost basis.
Recently Issued Accounting Pronouncements Not Yet AdoptedASU 2020-08 – Codification Improvements to Subtopic 310-20 - Receivables - Nonrefundable Fees and Other Costs
In October 2020, the FASB issued ASU 2020-08 to clarify that an entity should re-evaluate whether a callable debt security is within the scope of ASC 310-20-35-33 during each reporting period. All entities are required to apply the amendments in this ASU on a prospective basis as of the beginning of the period of adoption for existing or newly purchased callable debt securities.
The amendments in this ASU are effective for interim and annual reporting periods beginning after December 15, 2020, and early adoption is not permitted. We do not expect the adoption of this guidance to have a material impact on our consolidated financial statements and the related disclosures.
ASU 2020-06 – Accounting for Convertible Instruments and Contracts in an Entity's Own Equity
In August 2020, the FASB issued ASU 2020-06, which simplifies the accounting for certain financial instruments with characteristics of liabilities and equity, including convertible instruments and contracts in an entity's own equity. For convertible instruments, the ASU eliminates two of the three accounting models in ASC 470-20 that require separate accounting for embedded conversion features. The ASU also simplifies an issuer's application of the derivatives scope exception in ASC 815-40 for contracts in its own equity and removes some of the conditions that preclude a freestanding contract from being classified in equity, thereby allowing more of such contracts to qualify for equity classification.
The amendments in this ASU are effective for interim and annual reporting periods beginning after December 15, 2021 and, although early adoption is permitted, the amendments may not be adopted earlier than during interim and annual reporting periods beginning after December 15, 2020. In addition, the FASB specified that an entity should adopt the guidance as of the beginning of its annual reporting period through either a modified retrospective method of transition or a fully retrospective method of transition. We do not expect the adoption of this guidance to have a material impact on our consolidated financial statements and the related disclosures.
ASU 2020-01 - Clarifying the Interactions between ASC 321, ASC 323 and ASC 815
In January 2020, the FASB issued ASU 2020-01 to clarify the interaction of the accounting for equity securities under ASC 321 and investments accounted for under the equity method of accounting in ASC 323 and the accounting for certain forward contracts and purchased options accounted for under ASC 815. With respect to the interactions between ASC 321 and ASC 323, the amendments clarify that an entity should consider observable transactions that require it to either apply or discontinue the equity method of accounting when applying the measurement alternative in ASC 321, immediately before applying or upon discontinuing the equity method of accounting. With respect to forward contracts or purchased options to purchase securities, the amendments clarify that when applying the guidance in ASC 815-10-15-141(a), an entity should not consider whether upon the settlement of the forward contract or exercise of the purchased option, individually or with existing investments, the underlying securities would be accounted for under the equity method in ASC 323 or the fair value option in accordance with ASC 825. The ASU is effective for interim and annual reporting periods beginning after December 15, 2020, although early adoption is permitted, including adoption in any interim period. We do not expect the adoption of this guidance to have a material impact on our consolidated financial statements and disclosures.
ASU 2019-12 - Simplifying the Accounting for Income Taxes
In December 2019, the FASB issued ASU 2019-12 which removes certain exceptions for (1) recognizing deferred taxes for investments, (2) performing intraperiod tax allocation, and (3) calculating income taxes in interim periods. The ASU also adds guidance to reduce complexity in certain areas, including recognizing deferred taxes for tax goodwill and allocating income taxes to a legal entity that is not subject to income taxes. The ASU is effective for interim and annual reporting periods beginning after December 15, 2020, although early adoption is permitted, including adoption in any interim period. We do not expect the adoption of this guidance to have a material impact on our consolidated financial statements and disclosures.
Table of Contents
ENSTAR GROUP LIMITEDNOTES TO THE CONSOLIDATED FINANCIAL STATEMENTS — (Continued)
117

3. BUSINESS ACQUISITIONS 2019
Morse TECOverview
On October 30, 2019, we completed the acquisition of Morse TEC LLC ("Morse TEC") through our subsidiary, Enstar Holdings (US) LLC for $0 purchase price. Morse TEC held $0.7 billion in liabilities associated with personal injury asbestos claims and environmental claims arising from BorgWarner's legacy manufacturing operations. We applied the acquisition method to account for the Morse TEC transaction as required by ASC 805 - Business Combinations, with no goodwill or gain from bargain purchase being recorded on the acquisition. In addition, no intangible assets were identified for recognition on the acquisition.
Fair Value of Net Assets Acquired and Liabilities Assumed
The following table summarizes the fair values of the assets acquired and liabilities assumed in the Morse TEC transaction at the acquisition date, which were allocated to the Non-life Run-off segment.
ASSETSCash and cash equivalents $ 171,412 Deferred tax assets 140,000 Other assets - insurance balances receivable 371,116 TOTAL ASSETS 682,528 LIABILITIESDefendant asbestos and environmental liabilities 662,507 Other liabilities 20,021 TOTAL LIABILITIES $ 682,528 NET ASSETS ACQUIRED AT FAIR VALUE —
Morse TEC's Results Included in the Consolidated Statement of Earnings
The table below summarizes the results of the Morse TEC operations, which were included in our consolidated statement of earnings from the acquisition date to December 31, 2019:
Net investment income $ 488 General and administrative expenses (1,459) Other expenses (1,512) Net loss $ (2,483) 2018
Maiden Re North AmericaOverview
On December 27, 2018, we completed the acquisition of Maiden Reinsurance North America, Inc. (“Maiden Re North America”) from a subsidiary of Maiden Holdings, Ltd. ("Maiden Holdings"). Maiden Re North America is an insurance company domiciled in Missouri that provides property and casualty treaty reinsurance, casualty facultative reinsurance and accident and health treaty reinsurance. As part of the transaction, we also novated and assumed certain reinsurance agreements from Maiden Holdings' Bermuda reinsurer, including certain reinsurance agreements with Maiden Re North America. Refer to Note 4 - "Significant New Business" for additional information relating to these reinsurance agreements. We have operated the business in run-off since we acquired it.
Table of Contents
ENSTAR GROUP LIMITEDNOTES TO THE CONSOLIDATED FINANCIAL STATEMENTS — (Continued)
118

Purchase Price
The total cash paid in the transaction was $286.4 million, subject to certain post-closing adjustments. The components of the consideration paid to acquire all of the outstanding shares of Maiden Re North America were as follows:
Cash paid $ 286,375 Adjustment for the fair value of preexisting relationships 10,273 Total purchase price $ 296,648 Net assets acquired at fair value (including preexisting relationships) $ 296,648 Excess of purchase price over fair value of net assets acquired $ —
The purchase price was allocated to the acquired assets and liabilities of Maiden Re North America based on their estimated fair values at the acquisition date.
Adjustment for the Fair Value of Preexisting Relationships
Enstar had contractual preexisting relationships with Maiden Re North America, which were deemed to be effectively settled at fair value on the acquisition date. The differences between the carrying value and the fair value of the preexisting relationships was included as part of the purchase price in accordance with ASC 805 - Business Combinations. The fair value of the balances relating to preexisting reinsurance relationships with Maiden Re North America were deemed to equal their carrying values given their short-term nature and the expectation that they would all be settled within twelve months following acquisition.
Fair Value of Net Assets Acquired and Liabilities Assumed
The following table summarizes the fair values of the assets acquired and liabilities assumed (excluding preexisting relationships and net of the intercompany cession assumed as part of the transaction) in the Maiden Re North America transaction at the acquisition date, which have all been allocated to the Non-life Run-off segment.
ASSETSFixed maturities, trading, at fair value $ 1,098,593 Short-term investments, trading, at fair value 3,508 Total investments 1,102,101 Cash and cash equivalents 12,035 Restricted cash and cash equivalents 26,871 Premiums receivable 138,378 Prepaid reinsurance premiums 3,257 Reinsurance balances recoverable 87,018 Other assets 96,669 TOTAL ASSETS $ 1,466,329 LIABILITIESLosses and LAE $ 1,027,367 Unearned premiums 85,696 Other liabilities 56,618 TOTAL LIABILITIES 1,169,681 NET ASSETS ACQUIRED AT FAIR VALUE $ 296,648
Table of Contents
ENSTAR GROUP LIMITEDNOTES TO THE CONSOLIDATED FINANCIAL STATEMENTS — (Continued)
119
Maiden Re North America's Results Included in the Consolidated Statement of Earnings
The table below summarizes the results of the Maiden Re North America operations, which were included in our consolidated statement of earnings from the acquisition date to December 31, 2018:
Net investment income $ 675 Net unrealized gains 3,749 General and administrative expenses (435) Net earnings $ 3,989
KaylaReOverview
On May 14, 2018, the Company acquired all of the outstanding shares and warrants of KaylaRe Holdings, Ltd. ("KaylaRe"). In consideration for the acquired shares and warrants of KaylaRe, the Company issued an aggregate of 2,007,017 ordinary shares to the shareholders of KaylaRe, comprising 1,501,778 voting ordinary shares and 505,239 Series E non-voting ordinary shares. Effective May 14, 2018, we consolidated KaylaRe into our consolidated financial statements, and any balances between KaylaRe and Enstar are now eliminated upon consolidation. Effective September 30, 2019, KaylaRe and KaylaRe Ltd. merged with Cavello Bay Reinsurance Limited, a wholly-owned subsidiary of the Company, with Cavello Bay Reinsurance Limited as the surviving company. Refer to Note 21 - "Related Party Transactions" for additional information relating to KaylaRe.
Purchase Price
The components of the consideration paid to acquire all of the outstanding shares and warrants of KaylaRe were as follows:
Fair value of Enstar ordinary shares issued $ 414,750 Fair value of previously held equity method investment 336,137 Adjustment for the fair value of preexisting relationships 37,169 Total purchase price $ 788,056 Net assets acquired at fair value (excluding preexisting relationships) $ 746,320 Excess of purchase price over fair value of net assets acquired $ 41,736
The purchase price was allocated to the acquired assets and liabilities of KaylaRe based on their estimated fair values at the acquisition date. We recognized goodwill of $41.7 million on the transaction, primarily attributable to (i) the capital synergies from integrating KaylaRe into our group capital structure, (ii) investment management capabilities on a total return basis, and (iii) the incremental acquired capital to be utilized for future Non-life Run-off transactions.
Fair Value of Enstar Ordinary Shares Issued
The fair value of the Enstar ordinary shares issued was based on the closing price of Enstar's voting ordinary shares of $206.65 as of May 14, 2018, the date the transaction closed. Enstar's non-voting ordinary shares are economically equivalent to Enstar's voting ordinary shares.
Number of Enstar ordinary shares issued 2,007,017Closing price of Enstar voting ordinary shares as of May 14, 2018 $ 206.65 Fair value of Enstar ordinary shares issued to shareholders of KaylaRe $ 414,750
Fair Value of Previously Held Equity Method Investment
Prior to the close of the transaction, Enstar held a 48.2% interest in KaylaRe, which was accounted for as an equity method investment in accordance with ASC 323 - Investments - Equity Method and Joint Ventures. The acquisition of the remaining 51.8% equity interest in KaylaRe was considered a step acquisition, whereby the Company remeasured the previously held equity method investment to fair value. The Company considered multiple factors in determining the fair value of the previously held equity method investment, including (i) the price negotiated with the selling shareholders for the 51.8% equity interest in KaylaRe, (ii) recent market transactions for similar companies, and (iii) current trading multiples for comparable companies. Based on this analysis, a valuation multiple of 1.05 to KaylaRe's carrying book value was determined to be appropriate to remeasure the previously held equity method investment at fair value. This resulted in the recognition of a gain of $16.0 million on completion
Table of Contents
ENSTAR GROUP LIMITEDNOTES TO THE CONSOLIDATED FINANCIAL STATEMENTS — (Continued)
120

of the step acquisition of KaylaRe, which was recorded in earnings (losses) from equity method investments for the three and six months ended June 30, 2018.
Carrying value of previously held equity method investment prior to the close of the transaction $ 320,130 Price-to-book multiple 1.05Fair value of previously held equity method investment prior to the close of the transaction $ 336,137
Gain recognized on remeasurement of previously held equity method investment to fair value $ 16,007 Adjustment for the Fair Value of Preexisting Relationships
Enstar had contractual preexisting relationships with KaylaRe, which were deemed to be effectively settled at fair value on the acquisition date. The differences between the carrying value and the fair value of the preexisting relationships was included as part of the purchase price in accordance with ASC 805 - Business Combinations. The fair value of the balances relating to preexisting reinsurance relationships with KaylaRe was determined using a discounted cash flow approach and, where applicable, consideration was given to stated contractual settlement provisions, when determining the loss to be recorded on the deemed settlement of these preexisting relationships. The fair values of the balances arising from the non-reinsurance preexisting relationships with KaylaRe were deemed to equal their carrying values given their short-term nature and the expectation that they would all be settled within the next twelve months.
As a result of effectively settling all the contractual preexisting relationships with KaylaRe, the Company recognized a loss of $15.6 million, which was recorded in other income (loss) in the three and six months ended June 30, 2018, as summarized below:
ASSETS Carrying value Fair value
Loss on deemed
settlementFunds held by reinsured companies $ 386,793 $ 386,793 $ — Deferred acquisition costs/Value of business acquired 33,549 40,268 6,719 TOTAL ASSETS 420,342 427,061 6,719 LIABILITIESLosses and LAE 339,747 333,205 (6,542) Unearned premiums 105,602 105,602 — Insurance and reinsurance balances payable 25,897 23,559 (2,338) Other liabilities 1,864 1,864 — TOTAL LIABILITIES 473,110 464,230 (8,880) NET ASSETS (LIABILITIES) $ (52,768) $ (37,169) $ 15,599
Table of Contents
ENSTAR GROUP LIMITEDNOTES TO THE CONSOLIDATED FINANCIAL STATEMENTS — (Continued)
121

Fair Value of Net Assets Acquired and Liabilities Assumed
The following table summarizes the fair values of the assets acquired and liabilities assumed (excluding preexisting relationships) in the KaylaRe transaction at the acquisition date, which have all been allocated to the Non-life Run-off segment.
ASSETSFixed maturities, trading, at fair value $ 126,393 Other investments, at fair value 626,476 Total investments 752,869 Cash and cash equivalents 5,657 Premiums receivable 10,965 Deferred acquisition costs 275 Other assets 614 TOTAL ASSETS $ 770,380 LIABILITIESLosses and LAE $ 4,059 Unearned premiums 10,984 Insurance and reinsurance balances payable 13 Other liabilities 9,004 TOTAL LIABILITIES 24,060 NET ASSETS ACQUIRED AT FAIR VALUE $ 746,320
KaylaRe's Results Included in the Consolidated Statement of Earnings
The table below summarizes the results of the KaylaRe operations, which are included in our consolidated statement of earnings from the acquisition date to December 31, 2018:
Premiums earned $ 13,627 Incurred losses and LAE (12,364) Acquisition costs (341) Underwriting income 922 Net investment income 3,096 Net unrealized gains (47,769) General and administrative expenses (2,164) Net loss $ (45,915)
Table of Contents
ENSTAR GROUP LIMITEDNOTES TO THE CONSOLIDATED FINANCIAL STATEMENTS — (Continued)
122

4. SIGNIFICANT NEW BUSINESS We define significant new business as material transactions other than business acquisitions which are
included in Note 3 - "Business Acquisitions." Generally, our significant new business takes the form of reinsurance or direct business transfers. The table below sets forth a summary of significant new business that we have completed between January 1, 2018 and December 31, 2020:
Transaction Date CompletedTotal Assets
Assumed
Deferred Charge Asset (1)
Total Liabilities Assumed
Net Fair Value Adjustment (2) Primary Nature of Business
Hannover Re August 6, 2020 $ 182,498 N/A $ 209,713 $ (27,215) U.S. asbestos, environmental and workers' compensation liabilities
Munich Re July 1, 2020 $ 100,956 N/A $ 100,956 N/A
Australian public liability, professional liability and builders' warranty
liabilities
AXA Group (3) June 1, 2020 $ 179,681 N/A $ 179,681 N/A U.S. construction general liability
Aspen June 1, 2020 $ 770,000 $ 11,746 $ 781,746 N/A
Diversified mix of property, liability and specialty lines of business across
the U.S., U.K. and Europe
Lyft March 31, 2020 $ 465,000 N/A $ 465,000 N/A U.S. motor
Zurich (3) October 1, 2019 $ 507,061 $ 115,815 $ 622,876 N/AU.S. asbestos and environmental
liabilityMaiden Re Bermuda August 5, 2019 $ 445,000 $ 85,183 $ 530,183 N/A
U.S. workers' compensation and General Casualty
Amerisure April 11, 2019 $ 45,463 $ 2,873 $ 48,336 N/A U.S. construction defect
AmTrustFebruary 14,
2019 $ 1,143,949 $ 20,633 $ 1,164,582 N/A
Lloyd's property, professional, marine, non-marine, affinity annual, extended
warranty and political
Allianz SEDecember 31,
2018 $ 70,000 N/A $ 70,000 N/A Asbestos and environmentalMaiden Re Bermuda
December 27, 2018 $ 70,425 $ 1,704 $ 72,129 N/A
U.S. workers' compensation and motor
Coca-Cola August 1, 2018 $ 103,617 $ 17,208 $ 120,825 N/AU.S. workers' compensation, auto
liability, general and product liability
Zurich AustraliaFebruary 23,
2018 $ 268,657 N/A $ 280,764 $ (12,107) Australian motor
NeonFebruary 16,
2018 $ 525,673 N/A $ 546,298 $ (20,625) Medical malpractice, general liability, professional indemnity and marine
Novae January 29, 2018 $ 1,095,730 N/A $ 1,163,198 $ (67,468)
Financial, casualty, marine and energy, professional indemnity,
aviation, motor and property
The table below sets forth a summary of significant new business that we have signed or completed between January 1, 2021 and March 1, 2021:
Transaction Date Completed
Initial Estimate of Liabilities Assumed Primary Nature of Business
AXA Group(4)N/A - Announced
February 25, 2021 $ 1,395,000 Diversified mix of global casualty and professional lines
ProSight (4)N/A - Announced January 15, 2021 $ 500,000
U.S. discontinued workers' compensation and excess workers' compensation lines of business and adverse development cover on a diversified mix of general liability
classes of business
CNA (4) February 5, 2021 $ 690,000 U.S. excess workers' compensation
Liberty Mutual (4) January 8, 2021 $ 420,000 U.S. energy liability, construction liability and homebuilders liability(1) Where the estimated ultimate losses payable exceed the premium consideration received at the inception of the agreement, a deferred charge
asset is recorded.(2) When the fair value option is elected for any retroactive reinsurance agreement, an initial net fair value adjustment is recorded at the inception
of the agreement.(3) Effective October 1, 2020 and 2019, we ceded 10% of the AXA Group and Zurich transactions, respectively, to Enhanzed Reinsurance Ltd.
("Enhanzed Re"), in which we have an investment, on the same terms and conditions as those received by us.(4) The retroactive reinsurance agreements with AXA Group, ProSight, CNA and Liberty Mutual either closed or are expected to close in 2021
and therefore the related balances are not included in our consolidated financial statements as of December 31, 2020.
Table of Contents
ENSTAR GROUP LIMITEDNOTES TO THE CONSOLIDATED FINANCIAL STATEMENTS — (Continued)
123

5. DIVESTITURES, HELD-FOR-SALE BUSINESSES AND DISCONTINUED OPERATIONS Atrium Exchange Transaction
On August 13, 2020, we announced an exchange transaction with Trident V, L.P., Trident V Parallel Fund, L.P. and Trident V Professionals Fund, L.P. (collectively, the "Trident V Funds") managed by Stone Point Capital LLC ("Stone Point"). As part of the exchange, we entered into a recapitalization agreement with the Trident V Funds, Dowling Capital Partners I, L.P. and Capital City Partners LLC (collectively, the "Dowling Funds"), North Bay Holdings Limited ("North Bay"), and StarStone Specialty Holdings Limited ("SSHL"). On January 1, 2021, this transaction was completed.
As of December 31, 2020, Enstar owned an indirect 59.0% interest in North Bay and the Trident V Funds and the Dowling Funds owned 39.3% and 1.7%, respectively. North Bay owns 100.0% of SSHL, the holding company for the StarStone group, which previously included StarStone U.S. and still includes StarStone International. North Bay also owned 92.1% of Northshore Holdings Limited ("Northshore"), the holding company that owns Atrium Underwriting Group Limited and its subsidiaries (collectively, "Atrium") and Arden Reinsurance Company Ltd. ("Arden"). The remaining share ownership of Northshore is held on behalf of certain Atrium employees.
Pursuant to the terms of the recapitalization agreement, we exchanged a portion of our indirect interest in Northshore for all of the Trident V Funds’ indirect interest in StarStone U.S., which was owned through an interest in Core Specialty (the “Exchange Transaction”). Effective January 1, 2021, we own 25.23% of Core Specialty on a fully diluted basis, which in turn owns StarStone U.S., and 13.8% of Northshore, which continues to own Atrium and Arden. Furthermore, the Trident V Funds no longer own any interest in Core Specialty but own 76.3% of Northshore, while the Dowling Funds own 0.4% of Core Specialty and 1.6% of Northshore. The Exchange Transaction had no impact on the ultimate ownership of SSHL, which continues to own StarStone International, with us, the Trident V Funds and the Dowling Funds retaining our and their current ownership interests in SSHL of 59.0%, 39.3% and 1.7%, respectively.
Effective January 1, 2021, Northshore was deconsolidated and our remaining investment will be accounted for as a privately held equity investment and carried at its fair value.
Through our wholly-owned subsidiary SGL No.1, a Lloyd’s corporate member included within our Non-life Run-off segment, we provided 25% of the underwriting capacity on the 2017 to 2020 underwriting years of Atrium's Syndicate 609 at Lloyd’s. Effective January 1, 2021, and in conjunction with the completion of the Atrium Exchange Transaction, SGL No.1 ceased its provision of underwriting capacity on Syndicate 609. Accordingly, the 2020 underwriting year was the last underwriting year that SGL No. 1 participated in with respect to the Atrium business. We will continue to report SGL No. 1's 25% gross-up share of the 2020 and prior underwriting years of Syndicate 609 until the 2020 underwriting year completes an RITC into a successor year, which will be no earlier than December 31, 2022. There is no net retention for Enstar on Atrium's 2020 and prior underwriting years as the business was contractually transferred to the Atrium entities that were divested in the Exchange Transaction. Effective January 1, 2021, certain balances that SGL No. 1 has with Atrium and Arden will no longer be eliminated on consolidation.
Table of Contents
ENSTAR GROUP LIMITEDNOTES TO THE CONSOLIDATED FINANCIAL STATEMENTS — (Continued)
124

As of December 31, 2020, we have classified the assets and liabilities of Northshore as held-for-sale but it did not qualify as a discontinued operation since the pending disposal did not represent a strategic shift that would have a major effect on our operations and financial results. The following table summarizes the components of Northshore's assets and liabilities held-for-sale on our consolidated balance sheet as of December 31, 2020:
December 31, 2020
ASSETS
Short-term investments, AFS, at fair value $ 1,720
Fixed maturities, trading, at fair value 154,026
Fixed maturities, AFS, at fair value 7,483
Other investments, at fair value 9,897
Total investments 173,126
Cash and cash equivalents 71,156
Restricted cash and cash equivalents 152,044
Premiums receivable 62,392
Reinsurance balances recoverable on paid and unpaid losses 37,341
Funds held by reinsured companies 32,226
Other assets 182,993
TOTAL ASSETS HELD-FOR-SALE $ 711,278
LIABILITIES
Losses and loss adjustment expenses $ 254,149
Insurance and reinsurance balances payable 12,393
Debt obligations 39,850
Other liabilities 177,265
TOTAL LIABILITIES HELD-FOR-SALE $ 483,657
NET ASSETS HELD-FOR-SALE $ 227,621
As of December 31, 2020, included in the table above were restricted investments of $94.4 million.
Recapitalization of StarStone U.S. and Discontinued OperationsOn November 30, 2020, we completed the sale and recapitalization of StarStone U.S. through the sale of
StarStone U.S. to Core Specialty, a newly formed entity with equity backing from funds managed by SkyKnight Capital, L.P., Dragoneer Investment Group and Aquiline Capital Partners LLC.
We received consideration of $282.0 million inclusive of $235.0 million of common shares of Core Specialty and cash of $47.0 million. The $235.0 million of common shares of Core Specialty represents a 25.23% interest in Core Specialty on a fully diluted basis. Our investment in Core Specialty is accounted for as an equity method investment and we record our proportionate share of the net earnings on a one quarter lag.
Table of Contents
ENSTAR GROUP LIMITEDNOTES TO THE CONSOLIDATED FINANCIAL STATEMENTS — (Continued)
125

StarStone U.S. comprised a substantial portion of the StarStone segment. We classified the assets and liabilities of StarStone U.S. as held-for-sale. The following table summarizes the components of StarStone U.S.'s assets and liabilities held-for-sale on our consolidated balance sheet as of December 31, 2019:
December 31, 2019 (1)
ASSETSFixed maturities, trading, at fair value $ 202,994 Fixed maturities, AFS, at fair value 375,337 Equities, at fair value 3,000 Other investments, at fair value 6,389 Total investments 587,720 Cash and cash equivalents 78,613 Restricted cash and cash equivalents 5,815 Premiums receivable 99,367 Deferred tax assets 15,191 Reinsurance balances recoverable on paid and unpaid losses 530,604 Funds held by reinsured companies 35,861 Deferred acquisition costs 36,992 Goodwill and intangible assets 24,900 Other assets 59,707 TOTAL ASSETS HELD-FOR-SALE $ 1,474,770
LIABILITIESLosses and loss adjustment expenses $ 836,761 Unearned premiums 218,166 Insurance and reinsurance balances payable 22,453 Other liabilities 131,151 TOTAL LIABILITIES HELD-FOR-SALE $ 1,208,531
NET ASSETS HELD-FOR-SALE $ 266,239 (1) Following our decision to sell StarStone U.S. to Core Specialty which was completed on November 30, 2020, the assets and liabilities of
StarStone U.S. as of December 31, 2019 were reclassified to held-for-sale on our consolidated balance sheets, in addition to the comparatives being restated since StarStone U.S. qualified as a discontinued operation.
As of December 31, 2019, included in the table above were restricted investments of $131.0 million.
Table of Contents
ENSTAR GROUP LIMITEDNOTES TO THE CONSOLIDATED FINANCIAL STATEMENTS — (Continued)
126

The StarStone U.S. business qualified as a discontinued operation. The following table summarizes the components of net earnings (loss) from discontinued operations, net of income taxes, related to StarStone U.S., on the consolidated statements of earnings for the years ended December 31, 2020, 2019 and 2018:
2020 2019 2018INCOMENet premiums earned $ 291,326 $ 350,814 $ 199,796 Net investment income 12,849 15,606 10,572 Net realized and unrealized gains 5,431 19,385 (5,352) Other income 49 9 10
309,655 385,814 205,026 EXPENSESNet incurred losses and loss adjustment expenses 191,844 258,396 130,303 Acquisition costs 57,640 65,342 14,935 General and administrative expenses 60,236 60,003 58,590 Interest expense 2,066 2,600 2,120 Net foreign exchange (gains) losses (13) 33 24
311,773 386,374 205,972 EARNINGS (LOSS) BEFORE INCOME TAXES (2,118) (560) (946) Income tax benefit 2,255 7,935 2,435 NET EARNINGS (LOSS) FROM DISCONTINUED OPERATIONS, NET OF INCOME TAXES, BEFORE GAIN ON SALE $ 137 $ 7,375 $ 1,489
DISPOSALConsideration received $ 281,989 $ — $ — Less: Carrying value of subsidiary (277,697) — — Add: Net realized gains on AFS securities and cumulative currency translation adjustments previously recognized in AOCI 11,822 — — Gain on sale of subsidiary $ 16,114 $ — $ —
NET EARNINGS (LOSS) FROM DISCONTINUED OPERATIONS, NET OF INCOME TAXES $ 16,251 $ 7,375 $ 1,489 Net loss (earnings) from discontinued operations attributable to noncontrolling interest (8,717) (3,025) (611) NET EARNINGS (LOSS) FROM DISCONTINUED OPERATIONS ATTRIBUTABLE TO ENSTAR ORDINARY SHAREHOLDERS $ 7,534 $ 4,350 $ 878
Continuing Involvement Disclosures
Following the completion of the sale of StarStone U.S. to Core Specialty on November 30, 2020, our continuing involvement with StarStone U.S comprised of the following transactions:
LPT and ADC reinsurance agreement
In connection with the sale of StarStone U.S. to Core Specialty, one of our Non-life Run-off subsidiaries entered into an LPT and ADC reinsurance agreement with StarStone U.S. pursuant to which we reinsured all of the net loss reserves of StarStone U.S. in respect of premium earned prior to October 31, 2020. Under the terms of the LPT and ADC reinsurance agreement, we assumed total net loss reserves of $462.4 million from StarStone U.S. in exchange for a total reinsurance premium consideration of $478.2 million, subject to an aggregate limit of $130.0 million above the assumed total net loss reserves. Our Non-life Run-off subsidiary's obligations to StarStone U.S. under the LPT and ADC reinsurance agreement are guaranteed by us. The LPT and ADC reinsurance agreement between us and StarStone U.S. shall continue in force until such time as our liability with respect to the assumed total net loss reserves terminates.
Concurrent with the closing of the LPT and ADC reinsurance agreement, one of our wholly-owned subsidiaries entered into an Administrative Services Agreement ("ASA") with StarStone U.S., through which it was
Table of Contents
ENSTAR GROUP LIMITEDNOTES TO THE CONSOLIDATED FINANCIAL STATEMENTS — (Continued)
127

appointed as an independent contractor to provide certain administrative services covering the business we assumed from StarStone U.S. through the LPT and ADC reinsurance agreement. This ASA became effective on November 30, 2020 and shall continue until its termination.
In addition, concurrent with the sale of StarStone U.S. to Core Specialty which was completed on November 30, 2020, one of our wholly-owned subsidiaries entered into a Transition Services Agreement ("TSA") with Core Specialty through which our subsidiary and Core Specialty agreed to provide certain transitional services to each other relating to the StarStone U.S. businesses, for a specified period of time. This TSA became effective on November 30, 2020 and unless otherwise agreed to in writing by both Core Specialty and us, shall terminate on the earliest to occur of (a) the 2-year anniversary of the agreement, (b) the date on which all the covered transitional services have been terminated, and (c) the termination of the agreement.
Reinsurance transactions previously eliminated on consolidation
The table below presents a summary of the total income and expenses which have been recognized within our continuing operations for the years ended December 31, 2020, 2019 and 2018, relating to intercompany transactions, primarily intra-group reinsurances, between StarStone U.S. and our subsidiaries:
2020 2019 2018Total Income $ 11,911 $ 10,672 $ 98,402 Total Expenses (1) (16,397) 62,515 113,952 Net Earnings (Loss) $ 28,308 $ (51,843) $ (15,550)
(1) For the year ended December 31, 2020, negative total expenses were driven by favorable loss development on the losses and LAE reserves ceded by StarStone U.S. to our subsidiaries.
Cash flows
The cash inflows (outflows) between our subsidiaries and StarStone U.S. for the years ended December 31, 2020, 2019 and 2018 were $99.2 million, $(53.9) million and $(64.6) million, respectively.
Equity method investment
We have applied the equity method of accounting to the common shares we acquired in Core Specialty as part-consideration for the sale of StarStone U.S. and which make up 25.23% of the total outstanding common shares in Core Specialty on a fully diluted basis. Since we account for our share of earnings attributable to our equity method investees on a quarter lag, the carrying value of our investment in the common shares of Core Specialty as at December 31, 2020 remained unchanged from our November 30, 2020 fair value of $235.0 million, when we completed the sale of StarStone U.S. to Core Specialty.
Run-off of StarStone International (non-U.S.)On June 10, 2020, we announced that we placed StarStone International into an orderly run-off (the
"StarStone International Run-Off"). The liabilities associated with the StarStone International Run-Off vary in duration, and the run-off is expected to occur over a number of years. Steps to reduce the size of StarStone International's operations have begun and will involve several phases that will occur over time. As a result, we cannot anticipate with certainty the expected completion date of the StarStone International Run-Off.
We continue to evaluate additional strategic options for StarStone International's operations and business. Consequently, such options could have the effect of mitigating costs associated with placing the business into run-off. The remaining StarStone International operations will continue to serve the needs of policyholders and ensure that the companies continue to meet all regulatory requirements. The results of StarStone International are included within continuing operations in the StarStone segment. Recent developments relating to StarStone International include:
• On October 2, 2020, StarStone International sold the renewal rights for its financial lines portfolio for consideration of $0.5 million.
• On October 14, 2020, we completed the sale of Vander Haeghen & Co. SA ("VdH"), a Belgium-based insurance agency majority owned by StarStone International entities, for consideration of €3.8 million ($4.5 million). We recognized a gain on the sale of $3.4 million in the fourth quarter of 2020.
• On November 17, 2020, we announced an agreement to sell StarStone Underwriting Limited ("SUL"), the Lloyd's managing agency, together with the right to operate Lloyd's Syndicate 1301, to Inigo Limited ("Inigo"). We currently have a 59.0% interest in SUL and the Trident V Funds and the Dowling Funds
Table of Contents
ENSTAR GROUP LIMITEDNOTES TO THE CONSOLIDATED FINANCIAL STATEMENTS — (Continued)
128

currently own 39.3% and 1.7%, respectively. Upon closing, Enstar, the Trident V Funds and the Dowling Funds will receive $30.0 million of consideration from the sale of SUL in the form of Inigo shares. In addition, Enstar and the Trident V Funds have committed to invest up to $27.0 million and $18.0 million, respectively, into Inigo. The sale is expected to close in the first half of 2021, subject to regulatory approvals and satisfaction of customary closing conditions. Upon closing, we expect to own 5.4% of Inigo. As of December 31, 2020, our investment in Inigo was $16.9 million and was accounted for as a privately held equity investment and carried at fair value. In conjunction with the transaction, Enstar, the Trident V Funds and the Dowling Funds will retain the economics of Syndicate 1301’s 2020 and prior years’ underwriting portfolios as this business runs off.
• On February 11, 2021, we entered into an agreement to sell Arena N.V., a Belgium-based specialist accident and health managing general agent.
6. INVESTMENTS We hold: (i) trading portfolios of short-term and fixed maturity investments and equities, carried at fair value;
(ii) AFS portfolios of short-term and fixed maturity investments, carried at fair value; (iii) other investments carried at fair value; (iv) equity method investments; and (v) funds held - directly managed.
Short-term and Fixed Maturity InvestmentsAsset Types
The fair values of the underlying asset categories comprising our short-term and fixed maturity investments classified as trading and AFS and the fixed maturity investments included within our funds held - directly managed balance were as follows as of December 31, 2020 and 2019:
2020
Short-term investments,
trading
Short-term investments,
AFS
Fixed maturities,
trading
Fixed maturities,
AFS
Fixed maturities,
funds held - directly
managed TotalU.S. government and agency $ — $ 243,556 $ 123,874 $ 474,442 $ 109,176 $ 951,048 U.K. government — — 37,508 13,574 — 51,082 Other government 3,424 3,213 327,437 146,914 21,165 502,153 Corporate 1,705 17,026 3,227,726 1,920,323 519,952 5,686,732 Municipal — — 79,959 30,032 52,678 162,669 Residential mortgage-backed — — 154,471 328,871 70,603 553,945 Commercial mortgage-backed — — 347,225 276,488 230,377 854,090 Asset-backed — — 296,692 204,456 56,312 557,460
Total fixed maturity and short-term investments $ 5,129 $ 263,795 $ 4,594,892 $ 3,395,100 $ 1,060,263 $ 9,319,179
Table of Contents
ENSTAR GROUP LIMITEDNOTES TO THE CONSOLIDATED FINANCIAL STATEMENTS — (Continued)
129

2019
Short-term investments,
trading
Short-term investments,
AFS
Fixed maturities,
trading
Fixed maturities,
AFS
Fixed maturities,
funds held - directly
managed TotalU.S. government and agency $ — $ 111,583 $ 208,296 $ 269,661 $ 106,537 $ 696,077 U.K. government 24,411 1,069 122,012 14,280 — 161,772 Other government 21,958 387 575,017 84,760 20,734 702,856 Corporate 5,121 13,915 3,959,288 866,557 603,389 5,448,270 Municipal — 1,381 87,451 2,399 49,456 140,687 Residential mortgage-backed — — 215,521 99,188 86,205 400,914 Commercial mortgage-backed — — 534,357 49,046 230,343 813,746 Asset-backed — — 441,393 152,161 76,681 670,235
Total fixed maturity and short-term investments $ 51,490 $ 128,335 $ 6,143,335 $ 1,538,052 $ 1,173,345 $ 9,034,557
Included within residential and commercial mortgage-backed securities as of December 31, 2020 were securities issued by U.S. governmental agencies with a fair value of $458.1 million (as of December 31, 2019: $333.3 million). There were no senior secured loans within corporate securities as of December 31, 2020, compared to $31.4 million as of December 31, 2019.
Contractual Maturities
The contractual maturities of our short-term and fixed maturity investments, classified as trading and AFS, and the fixed maturity investments included within our funds held - directly managed balance are shown below. Actual maturities may differ from contractual maturities because issuers may have the right to call or prepay obligations with or without call or prepayment penalties.
As of December 31, 2020Amortized
Cost Fair Value% of Total Fair
ValueOne year or less $ 489,559 $ 494,490 5.3 %More than one year through two years 710,621 726,331 7.8 %More than two years through five years 2,097,923 2,206,020 23.7 %More than five years through ten years 1,974,838 2,151,191 23.1 %More than ten years 1,544,533 1,775,652 19.0 %Residential mortgage-backed 545,628 553,945 5.9 %Commercial mortgage-backed 828,155 854,090 9.2 %Asset-backed 567,638 557,460 6.0 %
$ 8,758,895 $ 9,319,179 100.0 %
Table of Contents
ENSTAR GROUP LIMITEDNOTES TO THE CONSOLIDATED FINANCIAL STATEMENTS — (Continued)
130

Credit Ratings
The following table sets forth the credit ratings of our short-term and fixed maturity investments, classified as trading and AFS, and the fixed maturity investments included within our funds held - directly managed balance as of December 31, 2020:
AmortizedCost Fair Value
% of Total
AAARated AA Rated A Rated
BBBRated
Non-Investment
Grade Not Rated
U.S. government and agency
$ 935,014 $ 951,048 10.2 % $ 951,048 $ — $ — $ — $ — $ —
U.K. government 46,988 51,082 0.6 % — 43,199 7,883 — — —
Other government 463,765 502,153 5.4 % 244,041 159,095 42,337 51,413 5,267 —
Corporate 5,226,238 5,686,732 61.0 % 172,718 607,796 2,646,602 1,960,971 287,363 11,282
Municipal 145,469 162,669 1.7 % 8,270 78,585 55,631 20,183 — —
Residential mortgage-backed
545,628 553,945 5.9 % 544,545 — 2,195 2,615 2,472 2,118
Commercial mortgage-backed
828,155 854,090 9.2 % 591,396 115,114 74,615 61,730 3,961 7,274
Asset-backed 567,638 557,460 6.0 % 239,733 84,058 119,757 89,898 24,014 —
Total $ 8,758,895 $ 9,319,179 100.0 % $ 2,751,751 $ 1,087,847 $ 2,949,020 $ 2,186,810 $ 323,077 $ 20,674
% of total fair value 29.5 % 11.7 % 31.6 % 23.5 % 3.5 % 0.2 %
Unrealized Gains and Losses on AFS Short-Term and Fixed Maturity Investments
The amortized cost, unrealized gains and losses, allowance for credit losses and fair values of our short-term and fixed maturity investments classified as AFS as of December 31, 2020 were as follows:
Gross Unrealized Losses
2020 Amortized Cost
Gross Unrealized
GainsNon-Credit
Related LossesAllowance for
Credit Losses(1) Fair Value
U.S. government and agency $ 715,527 $ 3,305 $ (834) $ — $ 717,998 U.K. government 12,494 1,080 — — 13,574 Other government 142,459 7,721 (53) — 150,127 Corporate 1,873,184 65,913 (1,567) (181) 1,937,349 Municipal 28,881 1,155 (4) — 30,032 Residential mortgage-backed 326,268 3,292 (689) — 328,871 Commercial mortgage-backed 273,516 5,202 (2,097) (133) 276,488 Asset-backed 204,312 846 (694) (8) 204,456
$ 3,576,641 $ 88,514 $ (5,938) $ (322) $ 3,658,895 (1) The Company adopted ASU 2016-13 and the related amendments on January 1, 2020. Refer to Note 1 - "Significant Accounting Policies" for
further details.
Table of Contents
ENSTAR GROUP LIMITEDNOTES TO THE CONSOLIDATED FINANCIAL STATEMENTS — (Continued)
131

The amortized cost, unrealized gains and losses and fair values of our short-term and fixed maturity investments classified as AFS as of December 31, 2019 were as follows:
2019Amortized
Cost
GrossUnrealized
Gains
GrossUnrealized
LossesNon-OTTI
FairValue
U.S. government and agency $ 381,488 $ 78 $ (322) $ 381,244 U.K. government 15,067 282 — 15,349 Other government 84,116 1,119 (88) 85,147 Corporate 880,667 3,739 (3,934) 880,472 Municipal 3,770 12 (2) 3,780 Residential mortgage-backed 99,646 221 (679) 99,188 Commercial mortgage-backed 49,219 30 (203) 49,046 Asset-backed 152,153 127 (119) 152,161
$ 1,666,126 $ 5,608 $ (5,347) $ 1,666,387
Gross Unrealized Losses on AFS Short-term and Fixed Maturity Investments
The following table summarizes our short-term and fixed maturity investments classified as AFS that were in a gross unrealized loss position, for which an allowance for credit losses has not been recorded, as of December 31, 2020:
12 Months or Greater Less Than 12 Months Total
2020Fair
Value
Gross Unrealized
LossesFair
Value
Gross Unrealized
LossesFair
Value
Gross Unrealized
LossesU.S. government and agency $ — $ — $ 55,839 $ (834) $ 55,839 $ (834) UK government — — — — — — Other government — — 7,971 (53) 7,971 (53) Corporate — — 199,048 (1,224) 199,048 (1,224) Municipal — — 1,690 (4) 1,690 (4) Residential mortgage-backed 4,626 (125) 79,149 (564) 83,775 (689) Commercial mortgage-backed 38 (38) 67,094 (1,562) 67,132 (1,600) Asset-backed — — 116,827 (564) 116,827 (564)
Total short-term and fixed maturity investments $ 4,664 $ (163) $ 527,618 $ (4,805) $ 532,282 $ (4,968)
The following table summarizes our short-term and fixed maturity investments classified as AFS that were in a gross unrealized loss position as of December 31, 2019, aggregated by major security type and length of time in continuous unrealized loss position:
12 Months or Greater Less Than 12 Months Total
2019Fair
Value
Gross Unrealized
LossesFair
Value
Gross Unrealized
LossesFair
Value
Gross Unrealized
LossesU.S. government and agency $ — $ — $ 193,574 $ (322) $ 193,574 $ (322) Other government 1,080 (23) 37,796 (65) 38,876 (88) Corporate 2,754 (306) 338,965 (3,628) 341,719 (3,934) Municipal 128 — 761 (2) 889 (2) Residential mortgage-backed — — 52,005 (679) 52,005 (679) Commercial mortgage-backed — — 35,777 (203) 35,777 (203) Asset-backed — — 101,591 (119) 101,591 (119)
Total short-term and fixed maturity investments $ 3,962 $ (329) $ 760,469 $ (5,018) $ 764,431 $ (5,347)
Table of Contents
ENSTAR GROUP LIMITEDNOTES TO THE CONSOLIDATED FINANCIAL STATEMENTS — (Continued)
132

As of December 31, 2020 and 2019, the number of securities classified as AFS in an unrealized loss position for which an allowance for credit loss is not recorded was 407 and 479, respectively. Of these securities, the number of securities that had been in an unrealized loss position for twelve months or longer was 2 and 12, respectively.
The contractual terms of a majority of these investments do not permit the issuers to settle the securities at a price less than the amortized cost basis of the security. While credit spreads have increased, and in certain cases credit ratings were downgraded, we currently do not expect the issuers of these fixed income securities to settle them at a price less than their amortized cost basis and therefore it is expected that we will recover the entire amortized cost basis of each security. Furthermore, we do not intend to sell the securities that are currently in an unrealized loss position, and it is also not more likely than not that we will be required to sell the securities before the recovery of their amortized cost bases.
Allowance for Credit Losses on AFS Fixed Maturity Investments
We adopted ASU 2016-13 and the related amendments on January 1, 2020 prospectively, and recognized an allowance for credit losses of $3.1 million on initial adoption of the guidance. Our allowance for credit losses is derived based on various data sources, multiple key inputs and forecast scenarios. These include default rates specific to the individual security, vintage of the security, geography of the issuer of the security, industry analyst reports, credit ratings and consensus economic forecasts.
To determine the credit losses on our AFS securities, we use the probability of default ("PD") and loss given default ("LGD") methodology through a third-party proprietary tool which calculates the expected credit losses based on a discounted cash flow method. The tool uses effective interest rates to discount the expected cash flows associated with each AFS security to determine its fair value, which is then compared with its amortized cost basis to derive the credit loss on the security.
The methodology and inputs used to determine the credit loss by security type are as follows:
• Corporate and Government: Expected cashflows are derived that are specific to each security. The PD is based on a quantitative model that converts agency ratings to term structures that vary by country, industry and the state of the credit cycle. This is used along with macroeconomic forecasts to produce scenario conditioned PDs. The LGD is based on default studies provided by a third party which we use along with macroeconomic forecasts to produce scenario conditioned LGDs.
• Municipals: Expected cash flows are derived that are specific to each security. The PD model produces scenario conditioned PD output over the lifetime of the municipal security. These PDs are based on key macroeconomic and instrument specific risk factors. The LGD is derived based on a model which uses assumptions specific to the municipal securities.
For corporate, government and municipal securities, we use an explicit reversion and a three year forecast period, which we consider to be a reasonable duration during which an economic forecast could continue to be reliable.
• Asset backed, Commercial and Residential mortgaged-backed: Expected cash flows are derived that are specific to each security. The PD and LGD for each security is based on a quantitative model that generates scenario conditioned PD and LGD term structures based on the underlying collateral type, waterfall and other trustee information. This model also considers prepayments. For these security types, there is no explicit reversion and the forecasts are deemed reasonable and supportable over the life of the portfolio.
Due to the short-term period during which accrued investment income remains unpaid, which is typically six months or less since the coupon on our debt securities is paid semi-annually or more frequently, we elected not to establish an allowance for credit losses on our accrued investment income balances. Accrued investment income is written off through net realized investment gains (losses) at the time the issuer of the debt security defaults or is expected to default on payments.
Table of Contents
ENSTAR GROUP LIMITEDNOTES TO THE CONSOLIDATED FINANCIAL STATEMENTS — (Continued)
133

The following table provides a reconciliation of the beginning and ending allowance for credit losses on our AFS debt securities:
December 31, 2020
Other government Corporate
Residential mortgage-
backed
Commercialmortgagebacked
Asset-backed Total
Allowance for credit losses, beginning of year $ — $ — $ — $ — $ — $ —
Cumulative effect of change in accounting principle (22) (2,987) — (50) — (3,059) Allowances for credit losses on securities for which credit losses were not previously recorded — (10,748) (2) (675) (142) (11,567) Additions to the allowance for credit losses arising from purchases of securities accounted for as PCD assets — — — — — —
Reductions for securities sold during the year 22 2,545 — — — 2,567
Reductions in the allowance for credit losses on securities we either intend to sell or more likely than not, we will be required to sell before the recovery of their amortized cost basis — — — — — — (Increase) decrease to the allowance for credit losses on securities that had an allowance recorded in the previous period — 11,009 2 592 134 11,737
Allowance for credit losses, end of year $ — $ (181) $ — $ (133) $ (8) $ (322)
During the year ended December 31, 2020, we did not have any write-offs charged against the allowance for credit losses or any recoveries of amounts previously written-off.
Other-Than-Temporary Impairment on AFS Short-term and Fixed Maturity Investments
For the years ended December 31, 2019 and 2018, we did not recognize any OTTI losses on our AFS securities. We determined that no other-than-temporary credit losses existed as of December 31, 2019. A description of our OTTI process is included in Note 2 - "Significant Accounting Policies".
As discussed in detail in Note 2 - "Significant Accounting Policies", we adopted ASU 2016-13 and the related amendments on January 1, 2020 with this new guidance replacing the OTTI model that was previously applicable to our AFS debt securities. The new approach now requires the recognition of impairments relating to credit losses through an allowance account and limits the amount of credit loss to the difference between a security’s amortized cost basis and its fair value.
Equity InvestmentsThe following table summarizes our equity investments classified as trading as of December 31, 2020 and
2019:
2020 2019Publicly traded equity investments in common and preferred stocks $ 260,767 $ 327,875 Exchange-traded funds 311,287 133,047 Privately held equity investments in common and preferred stocks 274,741 265,799
$ 846,795 $ 726,721 Equity investments include publicly traded common and preferred stocks, exchange-traded funds and
privately held common and preferred stocks. Our publicly traded equity investments in common and preferred stocks predominantly trade on major exchanges and are managed by our external advisors. Our investments in exchange-traded funds also trade on major exchanges.
Our privately held equity investments in common and preferred stocks are direct investments in companies that we believe offer attractive risk adjusted returns and/or offer other strategic advantages. Each investment may have its own unique terms and conditions and there may be restrictions on disposals. There is no active market for these investments. Included within the above balance as of December 31, 2020 and 2019 is an investment in the parent company of AmTrust Financial Services, Inc. ("AmTrust"), with a fair value of $230.3 million and $240.1 million, respectively. Refer to Note 21 - "Related Party Transactions" for further information.
Table of Contents
ENSTAR GROUP LIMITEDNOTES TO THE CONSOLIDATED FINANCIAL STATEMENTS — (Continued)
134

Other Investments, at fair valueThe following table summarizes our other investments carried at fair value as of December 31, 2020 and
2019:
2020 2019Hedge funds $ 2,638,339 $ 1,121,904 Fixed income funds 552,541 481,039 Private equity funds 363,103 323,496 Private credit funds 192,319 — Equity funds 190,767 410,149 CLO equity funds 166,523 87,509 CLO equities 128,083 87,555 Others 12,359 6,379
$ 4,244,034 $ 2,518,031
The valuation of our other investments is described in Note 12 - "Fair Value Measurements". Due to a lag in the valuations of certain funds reported by the managers, we may record changes in valuation with up to a three-month lag. We regularly review and discuss fund performance with the fund managers to corroborate the reasonableness of the reported net asset values and to assess whether any events have occurred within the lag period that would affect the valuation of the investments. The following is a description of the nature of each of these investment categories:
• Hedge funds may invest in a wide range of instruments, including debt and equity securities, and utilize various sophisticated strategies, including derivatives, to achieve their objectives. We invest in fixed income, equity and multi-strategy hedge funds.
• Fixed income funds comprise a number of positions in diversified fixed income funds that are managed by third-party managers. Underlying investments vary from high-grade corporate bonds to non-investment grade senior secured loans and bonds, in both liquid and illiquid markets. The liquid fixed income funds have regularly published prices.
• Private equity funds invest primarily in the financial services industry.
• Private credit funds invest in direct senior or collateralized loans.
• Equity funds invest in a diversified portfolio of U.S. and international publicly-traded equity securities.
• CLO equity funds invest primarily in the equity tranches of term-financed securitizations of diversified pools of corporate bank loans.
• CLO equities comprise investments in the equity tranches of term-financed securitizations of diversified pools of corporate bank loans.
• Others primarily comprise of a real estate debt fund that invests primarily in European commercial real estate equity.
The increase in our other investments carried at fair value between December 31, 2020 and December 31, 2019 was primarily attributable to unrealized gains of $1.3 billion and net additional subscriptions of $380.3 million to hedge funds, fixed income funds, private credit funds, CLO equities and CLO equity funds.
As of December 31, 2020, we had unfunded commitments of $975.5 million to other investments.
Certain of our other investments are subject to restrictions on redemptions and sales that are determined by the governing documents, which limits our ability to liquidate those investments. These restrictions may include lock-ups, redemption gates, restricted share classes or side pockets, restrictions on the frequency of redemption and notice periods. A gate is the ability to deny or delay a redemption request, whereas a side-pocket is a designated account for which the investor loses its redemption rights. Certain other investments may not have any restrictions governing their sale, but there is no active market and no guarantee that we will be able to execute a sale in a timely manner. In addition, even if certain other investments are not eligible for redemption or sales are restricted, we may still receive income distributions from those other investments. The table below details the estimated date by which proceeds would be received if we had provided notice of our intent to redeem or initiated a
Table of Contents
ENSTAR GROUP LIMITEDNOTES TO THE CONSOLIDATED FINANCIAL STATEMENTS — (Continued)
135

sales process as of December 31, 2020:
Less than 1 Year 1-2 years 2-3 years
More than 3 years
Not Eligible/
Restricted TotalRedemption Frequency
Hedge funds $ 2,590,164 $ — $ — $ — $ 48,175 $ 2,638,339 Monthly to Bi-
annually
Fixed income funds 537,055 — — — 15,486 552,541 Daily to
Quarterly
Equity funds 190,767 — — — — 190,767 Daily to
QuarterlyPrivate equity funds — — — — 363,103 363,103 N/A
CLO equity funds 94,313 61,741 10,469 — — 166,523 Quarterly to Bi-
annually
CLO equities 128,083 — — — — 128,083 Daily to
QuarterlyPrivate credit funds — 9,250 — 183,069 192,319 N/AOther 12,359 12,359 N/A
$ 3,540,382 $ 70,991 $ 10,469 $ — $ 622,192 $ 4,244,034
As of December 31, 2020 and 2019, we had $48.2 million and $51.8 million, respectively, of hedge funds subject to gates or side-pockets.
Equity Method InvestmentsThe table below shows our equity method investments as of December 31, 2020 and 2019:
2020 2019Ownership % Carrying Value Ownership % Carrying Value
Enhanzed Re 47.4 % $ 330,289 47.4 % $ 182,856 Citco (1) 31.9 % 53,022 31.9 % 51,742 Monument Re (2) 20.0 % 193,716 20.0 % 60,598 Clear Spring — % — 20.0 % 10,645 Core Specialty 25.2 % 235,000 — % — Other 27% 20,268 30% 20,436
$ 832,295 $ 326,277 (1) We own 31.9% of the common shares in HH CTCO Holdings Limited which in turn owns 15.4% of the convertible preferred shares, amounting
to a 6.2% interest in the total equity of Citco III Limited ("Citco").(2) We own 20.0% of the common shares in Monument Re as well as different classes of preferred shares which have fixed dividend yields and
whose balances are included in the Investment amount.
Refer to Note 21 - "Related Party Transactions" for further information regarding the investments above. As of December 31, 2020, we had unfunded commitments of $68.7 million related to equity method investments.
Funds HeldUnder funds held arrangements, the reinsured company has retained funds that would otherwise have been
remitted to our reinsurance subsidiaries. We either have (i) funds held by reinsured companies, which are carried at amortized cost and on which we receive a fixed crediting rate, or (ii) funds held - directly managed, which are carried at fair value and on which we receive the underlying return on the portfolio. The investment returns on funds held by reinsured companies are recognized in net investment income and the investment returns on funds held - directly managed are recognized in net investment income and net realized and unrealized gains (losses). The funds held balance is credited with investment income and losses payable are deducted.
Funds Held - Directly Managed
Funds held - directly managed, where we receive the underlying return on the investment portfolio, are carried at fair value, either because we elected the fair value option at the inception of the reinsurance contract, or because it represents the aggregate of funds held at amortized cost and the fair value of an embedded derivative. The embedded derivative relates to our contractual right to receive the return on the underlying investment portfolio
Table of Contents
ENSTAR GROUP LIMITEDNOTES TO THE CONSOLIDATED FINANCIAL STATEMENTS — (Continued)
136

supporting the reinsurance contract. We include the estimated fair value of these embedded derivatives in the consolidated balance sheets with the host contract in order to reflect the expected settlement of these features with the host contract. The change in the fair value of the embedded derivative is included in net unrealized gains (losses). The following table summarizes the components of the funds held - directly managed as of December 31, 2020 and 2019:
2020 2019Fixed maturity investments, trading $ 1,060,263 $ 1,173,345 Cash and cash equivalents 9,067 10,296 Other assets 5,560 3,911
$ 1,074,890 $ 1,187,552 The following table summarizes the short-term and fixed maturity investment components of funds held -
directly managed as of December 31, 2020 and 2019:
2020 2019Funds held - Directly
Managed - Fair Value
Option
Funds held - Directly
Managed - Variable Return Total
Funds held - Directly
Managed - Fair Value
Option
Funds held - Directly
Managed - Variable Return Total
Short-term and fixed maturity investments, at amortized cost $ 106,938 $ 859,403 $ 966,341 $ 185,859 $ 940,194 $ 1,126,053 Net unrealized gains (losses):
Change in fair value - fair value option accounting 9,693 — 9,693 5,438 — 5,438 Change in fair value - embedded derivative accounting — 84,229 84,229 — 41,854 41,854
Short-term and fixed maturity investments within funds held - directly managed, at fair value $ 116,631 $ 943,632 $ 1,060,263 $ 191,297 $ 982,048 $ 1,173,345
Refer to the sections above for details of the short-term and fixed maturity investments within our funds held - directly managed portfolios.
Funds Held by Reinsured Companies
Funds held by reinsured companies, where we received a fixed crediting rate, are carried at cost on our consolidated balance sheets. As of December 31, 2020 and 2019, we had funds held by reinsured companies of $635.8 million and $475.7 million, respectively. The increase related to $204.2 million of additional funds held balances related to the AXA Group transaction.
Table of Contents
ENSTAR GROUP LIMITEDNOTES TO THE CONSOLIDATED FINANCIAL STATEMENTS — (Continued)
137

Net Investment IncomeMajor categories of net investment income for the years ended December 31, 2020, 2019 and 2018 are
summarized as follows:
2020 2019 2018Fixed maturity investments $ 198,988 $ 217,886 $ 178,213 Short-term investments and cash and cash equivalents 4,843 15,609 11,692 Funds held 33,920 22,580 11,640 Funds held – directly managed 34,563 38,173 37,623
Investment income from fixed maturities and cash and cash equivalents 272,314 294,248 239,168
Equity investments 19,240 16,671 5,397 Other investments 27,153 11,792 26,214
Investment income from equities and other investments 46,393 28,463 31,611 Gross investment income 318,707 322,711 270,779
Investment expenses (15,890) (14,440) (9,081) Net investment income $ 302,817 $ 308,271 $ 261,698
Net Realized and Unrealized Gains (Losses)Components of net realized and unrealized gains (losses) for the years ended December 31, 2020, 2019 and
2018 were as follows:
2020 2019 2018Net realized gains (losses) on sale:
Gross realized gains on fixed maturity securities, AFS $ 26,313 $ 4,844 $ 27 Gross realized losses on fixed maturity securities, AFS (7,801) (905) (90) Decrease in allowance for expected credit losses on fixed maturity securities, AFS 170 — — Net realized gains (losses) on fixed maturity securities, trading 126,945 81,011 (27,408) Net realized gains (losses) on fixed maturity securities in funds held - directly managed 8,798 1,495 (3,940) Net realized gains (losses) on equity investments 24,282 (374) 4,016 Net realized investment gains on investment derivatives 144 — —
Total net realized gains (losses) on sale 178,851 86,071 (27,395) Net unrealized gains (losses):
Fixed maturity securities, trading 101,022 341,130 (159,594) Fixed maturity securities in funds held - directly managed 50,837 88,053 (46,257) Equity investments (25,752) 55,359 (9,831) Other investments 1,336,343 441,702 (164,455) Investment derivatives 718 (349) —
Total net unrealized gains (losses) 1,463,168 925,895 (380,137) Net realized and unrealized gains (losses) $ 1,642,019 $ 1,011,966 $ (407,532)
The gross realized gains and losses on AFS investments included in the table above resulted from sales of $2.0 billion, $302.9 million and $11.4 million for the years ended December 31, 2020, 2019 and 2018, respectively.
The unrealized gains for 2020 primarily comprised unrealized gains of $1.2 billion in the hedge fund managed by AnglePoint. These unrealized gains were driven by strong performance in equity markets across multiple sectors, including consumer discretionary, communication services, information technology and consumer staples.
Table of Contents
ENSTAR GROUP LIMITEDNOTES TO THE CONSOLIDATED FINANCIAL STATEMENTS — (Continued)
138
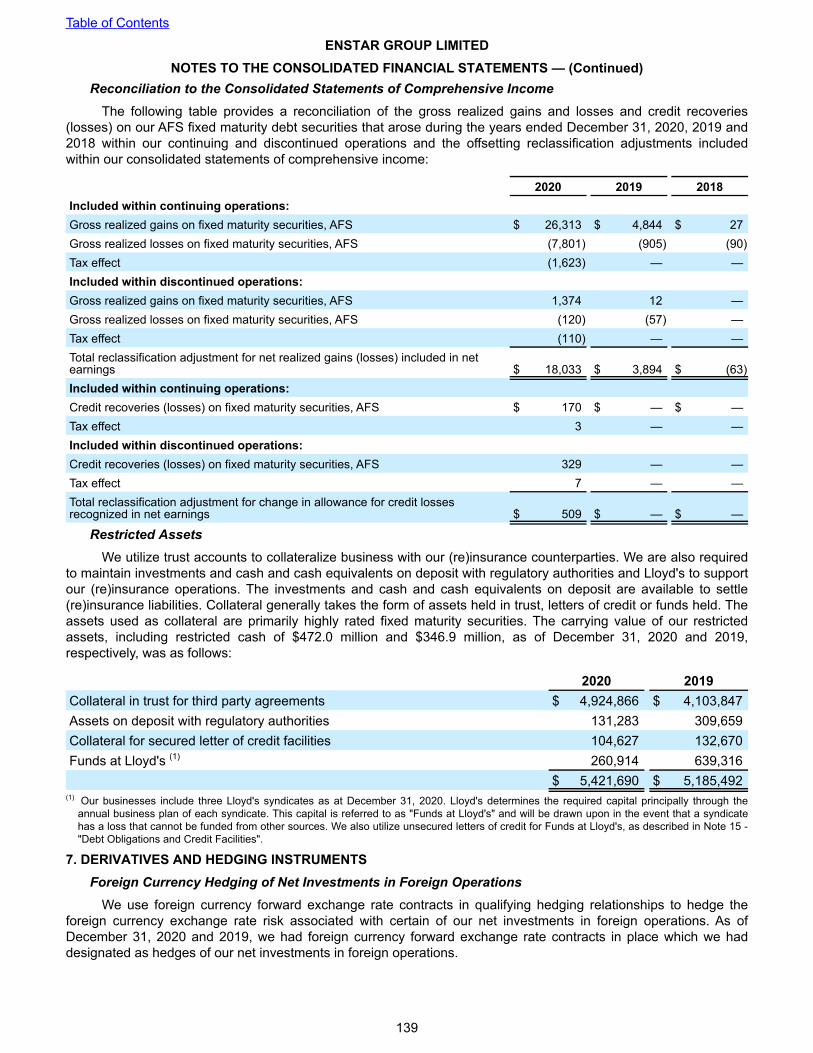
Reconciliation to the Consolidated Statements of Comprehensive IncomeThe following table provides a reconciliation of the gross realized gains and losses and credit recoveries
(losses) on our AFS fixed maturity debt securities that arose during the years ended December 31, 2020, 2019 and 2018 within our continuing and discontinued operations and the offsetting reclassification adjustments included within our consolidated statements of comprehensive income:
2020 2019 2018Included within continuing operations:Gross realized gains on fixed maturity securities, AFS $ 26,313 $ 4,844 $ 27 Gross realized losses on fixed maturity securities, AFS (7,801) (905) (90) Tax effect (1,623) — — Included within discontinued operations:Gross realized gains on fixed maturity securities, AFS 1,374 12 — Gross realized losses on fixed maturity securities, AFS (120) (57) — Tax effect (110) — — Total reclassification adjustment for net realized gains (losses) included in net earnings $ 18,033 $ 3,894 $ (63) Included within continuing operations:Credit recoveries (losses) on fixed maturity securities, AFS $ 170 $ — $ — Tax effect 3 — — Included within discontinued operations:Credit recoveries (losses) on fixed maturity securities, AFS 329 — — Tax effect 7 — — Total reclassification adjustment for change in allowance for credit losses recognized in net earnings $ 509 $ — $ —
Restricted Assets We utilize trust accounts to collateralize business with our (re)insurance counterparties. We are also required
to maintain investments and cash and cash equivalents on deposit with regulatory authorities and Lloyd's to support our (re)insurance operations. The investments and cash and cash equivalents on deposit are available to settle (re)insurance liabilities. Collateral generally takes the form of assets held in trust, letters of credit or funds held. The assets used as collateral are primarily highly rated fixed maturity securities. The carrying value of our restricted assets, including restricted cash of $472.0 million and $346.9 million, as of December 31, 2020 and 2019, respectively, was as follows:
2020 2019Collateral in trust for third party agreements $ 4,924,866 $ 4,103,847 Assets on deposit with regulatory authorities 131,283 309,659 Collateral for secured letter of credit facilities 104,627 132,670 Funds at Lloyd's (1) 260,914 639,316
$ 5,421,690 $ 5,185,492 (1) Our businesses include three Lloyd's syndicates as at December 31, 2020. Lloyd's determines the required capital principally through the
annual business plan of each syndicate. This capital is referred to as "Funds at Lloyd's" and will be drawn upon in the event that a syndicate has a loss that cannot be funded from other sources. We also utilize unsecured letters of credit for Funds at Lloyd's, as described in Note 15 - "Debt Obligations and Credit Facilities".
7. DERIVATIVES AND HEDGING INSTRUMENTS Foreign Currency Hedging of Net Investments in Foreign Operations
We use foreign currency forward exchange rate contracts in qualifying hedging relationships to hedge the foreign currency exchange rate risk associated with certain of our net investments in foreign operations. As of December 31, 2020 and 2019, we had foreign currency forward exchange rate contracts in place which we had designated as hedges of our net investments in foreign operations.
Table of Contents
ENSTAR GROUP LIMITEDNOTES TO THE CONSOLIDATED FINANCIAL STATEMENTS — (Continued)
139

The following table presents the gross notional amounts and estimated fair values recorded within other assets and liabilities related to our qualifying foreign currency forward exchange rate contracts as of December 31, 2020 and 2019:
2020 2019Fair Value Fair Value
Gross Notional Amount Assets Liabilities
Gross Notional Amount Assets Liabilities
Foreign currency forward - AUD $ 73,852 $ 13 $ 5,060 $ 64,620 $ 52 $ 2,033
Foreign currency forward - EUR 217,168 205 8,889 112,284 246 1,635
Foreign currency forward - GBP 312,671 951 14,998 318,387 344 7,784
Total qualifying hedges $ 603,691 $ 1,169 $ 28,947 $ 495,291 $ 642 $ 11,452
The following table presents the net gains and losses deferred in the cumulative translation adjustment ("CTA") account, which is a component of AOCI, in shareholders' equity, relating to our foreign currency forward exchange rate contracts for the years ended December 31, 2020, 2019 and 2018:
Amount of Gains (Losses) Deferred in AOCI2020 2019 2018
Foreign currency forward - AUD $ (6,792) $ (722) $ 3,438 Foreign currency forward - EUR (15,026) 1,817 1,000 Foreign currency forward - GBP (8,457) (16,423) — Total qualifying hedges $ (30,275) $ (15,328) $ 4,438
Non-derivative Hedging Instruments of Net Investments in Foreign Operations From time to time, we may also use non-derivative instruments such as foreign currency denominated
borrowings under our credit facilities to hedge certain of our net investments in foreign operations in designated qualifying non-derivative hedging arrangements. While there were no outstanding foreign currency denominated borrowings under our credit facilities as of December 31, 2020 and 2019, there was a net gain of $3.1 million deferred in the CTA account in AOCI relating to qualifying non-derivative hedging instruments for the year ended December 31, 2018.
Derivatives Not Designated or Not Qualifying as Net Investments in Hedging InstrumentsFrom time to time, we may also utilize foreign currency forward contracts as part of our overall foreign
currency risk management strategy or to obtain exposure to a particular financial market, as well as for yield enhancement in non-qualifying hedging relationships. We may also utilize equity call option instruments or other derivatives either to obtain exposure to a particular equity instrument or for yield enhancement in non-qualifying hedging relationships.
Foreign Currency Forward Contracts
The following tables present the gross notional amounts and estimated fair values recorded within other assets and other liabilities related to our non-qualifying foreign currency forward exchange rate hedging relationships as of December 31, 2020 and 2019:
December 31, 2020 December 31, 2019
Fair Value Fair ValueGross
Notional Amount Assets Liabilities
Gross Notional Amount Assets Liabilities
Foreign currency forward - AUD $ 28,848 $ 882 $ 2,847 $ 913 $ 839 $ 892
Foreign currency forward - CAD 64,224 10 1,764 66,266 10 1,482
Foreign currency forward - EUR 43,531 1,782 41 74,444 507 1,440
Foreign currency forward - GBP 2,731 161 404 11,940 13 292
Total non-qualifying hedges $ 139,334 $ 2,835 $ 5,056 $ 153,563 $ 1,369 $ 4,106
Table of Contents
ENSTAR GROUP LIMITEDNOTES TO THE CONSOLIDATED FINANCIAL STATEMENTS — (Continued)
140

The following table presents the amounts of the net gains and losses included in earnings related to our non-qualifying foreign currency forward exchange rate contracts during the years ended December 31, 2020, 2019, and 2018:
Gains (losses) on non-qualifying hedges charged to earnings2020 2019 2018
Foreign currency forward - AUD $ (2,388) $ 1,523 $ 4,958 Foreign currency forward - CAD (879) (2,079) 9,311 Foreign currency forward - EUR 1,871 1,759 2,296 Foreign currency forward - GBP (1,558) 12,004 15,078 Net gains (losses) on non-qualifying hedges $ (2,954) $ 13,207 $ 31,643
Investments in Call Options on Equities
During the years ended December 31, 2020, 2019, and 2018, we recorded unrealized gains (losses) of less than $(0.1) million, $0.5 million and $(9.4) million, respectively, in net earnings on the call options on equities that we had purchased in 2018 at a cost of $10.0 million. These call options on equities had a fair value of less than $0.1 million as of December 31, 2019 and expired without being exercised during the year ended December 31, 2020.
Forward Interest Rate Swaps
In 2019, we entered into a forward interest rate swap, with a notional amount of AUD$120.0 million, to partially mitigate the risk associated with declining interest rates until the completion of the Munich Re transaction which closed on July 1, 2020, as described in Note 4 - "Significant New Business".
During the year ended December 31, 2020, we recorded unrealized gains included within net earnings of $0.8 million on the forward interest rate swap. This forward interest rate swap was terminated on April 7, 2020, for an inception-to-date net realized gain of $0.5 million. The carrying value of the forward interest rate swap, recorded in other liabilities as of December 31, 2019, was $0.3 million.
Credit Default Swaps, Futures and Currency Forward Contracts
From time to time we may also utilize (i) credit default swaps to both hedge and replicate credit exposure, (ii) government bond futures contracts for interest rate management, and (iii) foreign currency forward contracts for currency hedging, to collectively manage credit and duration risk, as well as for yield enhancement on some of our fixed income portfolios.
The following table presents the gross notional amounts and estimated fair values recorded within other assets and other liabilities related to our credit default swaps, government bond futures contracts and currency forward contracts:
December 31, 2020Fair Value
Gross Notional Amount Assets LiabilitiesFutures contracts - long positions $ 34,502 $ 32 $ 5 Futures contracts - short positions (32,316) 6 121 Currency forward contracts - long positions - USD 1,428 — 13 Currency forward contracts - short positions - USD (3,233) 60 — Currency forward contracts - long positions - GBP 1,278 19 — Currency forward contracts - short positions - GBP (4,418) 12 — Total $ (2,759) $ 129 $ 139
The following table presents the amounts of the net gains included in earnings related to our credit default swaps, government bond futures contracts and currency forward contracts:
2020Credit default swaps $ 181 Futures contracts (127) Currency forward contracts 572 Total net gains $ 626
Table of Contents
ENSTAR GROUP LIMITEDNOTES TO THE CONSOLIDATED FINANCIAL STATEMENTS — (Continued)
141

We did not utilize any credit default swaps, government bond futures contracts and currency forward contracts during the years ended December 31, 2019 and 2018.
8. REINSURANCE BALANCES RECOVERABLE ON PAID AND UNPAID LOSSES The following tables provide the total reinsurance balances recoverable on paid and unpaid losses.
December 31, 2020
Non-lifeRun-off StarStone Total
Recoverable from reinsurers on unpaid:Outstanding losses $ 938,231 $ 263,638 $ 1,201,869 IBNR 508,082 139,761 647,843 ULAE 16,688 — 16,688
Fair value adjustments - acquired companies (14,014) (1,339) (15,353) Fair value adjustments - fair value option (21,427) — (21,427)
Total reinsurance reserves recoverable 1,427,560 402,060 1,829,620 Paid losses recoverable 172,309 87,234 259,543 Total $ 1,599,869 $ 489,294 $ 2,089,163
Reconciliation to Consolidated Balance Sheet:Reinsurance balances recoverable on paid and unpaid losses $ 1,079,039 $ 489,294 $ 1,568,333 Reinsurance balances recoverable on paid and unpaid losses - fair value option 520,830 — 520,830 Total $ 1,599,869 $ 489,294 $ 2,089,163
December 31, 2019
Non-lifeRun-off Atrium StarStone Total
Recoverable from reinsurers on unpaid:Outstanding losses $ 972,293 $ 9,011 $ 264,131 $ 1,245,435 IBNR 673,059 19,286 93,185 785,530
Fair value adjustments - acquired companies (13,652) 519 (2,122) (15,255) Fair value adjustments - fair value option (88,086) — — (88,086)
Total reinsurance reserves recoverable 1,543,614 28,816 355,194 1,927,624 Paid losses recoverable 181,375 1,541 70,594 253,510 Total $ 1,724,989 $ 30,357 $ 425,788 $ 2,181,134
Reconciliation to Consolidated Balance Sheet:Reinsurance balances recoverable on paid and unpaid losses $ 1,029,471 $ 30,357 $ 425,788 $ 1,485,616 Reinsurance balances recoverable on paid and unpaid losses - fair value option 695,518 — — 695,518 Total $ 1,724,989 $ 30,357 $ 425,788 $ 2,181,134
Our (re)insurance run-off subsidiaries and assumed portfolios, prior to acquisition, used retrocessional agreements to reduce their exposure to the risk of (re)insurance assumed. On an annual basis, both Atrium (classified as held-for-sale as of December 31, 2020) and StarStone purchased a tailored outwards reinsurance program designed to manage their risk profiles. The majority of Atrium’s and StarStone's third-party reinsurance is with highly rated reinsurers or is collateralized by pledged assets or letters of credit.
The fair value adjustments, determined on acquisition of (re)insurance subsidiaries, are based on the estimated timing of loss and LAE recoveries and an assumed interest rate equivalent to a risk free rate for securities with similar duration to the acquired reinsurance balances recoverable on paid and unpaid losses plus a spread for credit risk, and are amortized over the estimated recovery period, as adjusted for accelerations in timing of payments as a result of commutation settlements. The determination of the fair value adjustments on the retroactive
Table of Contents
ENSTAR GROUP LIMITEDNOTES TO THE CONSOLIDATED FINANCIAL STATEMENTS — (Continued)
142

reinsurance contracts for which we have elected the fair value option is described in Note 12 - "Fair Value Measurements".
As of December 31, 2020 and 2019, we had reinsurance balances recoverable on paid and unpaid losses of $2.1 billion and $2.2 billion, respectively. The decrease of $92.0 million was primarily due to the Hannover Re transaction, cash collections and the classification of Atrium as held-for-sale at December 31, 2020, partially offset by increases due to the retrocession to Enhanzed Re as discussed in Note 21 - "Related Party Transactions"
Top Ten Reinsurers
December 31, 2020
Non-lifeRun-off StarStone Total
% ofTotal
Top 10 reinsurers $ 1,036,676 $ 327,917 $ 1,364,593 65.3 %Other reinsurers > $1 million 539,428 158,174 697,602 33.4 %Other reinsurers < $1 million 23,765 3,203 26,968 1.3 %Total $ 1,599,869 $ 489,294 $ 2,089,163 100.0 %
December 31, 2019Non-lifeRun-off Atrium StarStone Total
% ofTotal
Top 10 reinsurers $ 1,154,110 $ 22,051 $ 295,443 $ 1,471,604 67.4 %Other reinsurers > $1 million 551,636 7,761 129,335 688,732 31.6 %Other reinsurers < $1 million 19,243 545 1,010 20,798 1.0 %Total $ 1,724,989 $ 30,357 $ 425,788 $ 2,181,134 100.0 %
December 31, 2020 December 31, 2019Information regarding top ten reinsurers:
Number of top 10 reinsurers rated A- or better 7 8 Number of top 10 non-rated reinsurers (1) 3 2
Reinsurers rated A- or better in top 10 $ 863,819 $ 1,199,479 Non-rated reinsurers in top 10 (1) 500,774 272,125 Total top 10 reinsurance recoverables $ 1,364,593 $ 1,471,604
Single reinsurers that represent 10% or more of total reinsurance balance recoverables as of December 31, 2020 and 2019:
Hannover Ruck SE (2) $ — $ 259,077 Lloyd's Syndicates (3) $ 331,118 $ 396,246 Michigan Catastrophic Claims Association(4) $ 229,374 $ —
(1) The reinsurance balances recoverable from the three and two non-rated top 10 reinsurers as of December 31, 2020 and 2019, respectively, was comprised of:
• $229.4 million and $190.8 million as of December 31, 2020 and December 31, 2019 respectively, due from a U.S. state backed reinsurer that is supported by assessments on active auto writers operating within the state;
• $73.8 million and $81.4 million as of December 31, 2020 and December 31, 2019 respectively, due from a reinsurer who has provided us with security in the form of pledged assets in trust for the full amount of the recoverable balance; and
• $208.4 million as of December 31, 2020 due from Enhanzed Re, an equity method investee to whom some of our subsidiaries have retroceded their exposures through quota share reinsurance agreements as discussed in Note 21 - "Related Party Transactions". These quota share reinsurance agreements are written on a funds withheld basis with our subsidiaries retaining the retrocession premium consideration, to secure the full amount of the recoverable balances due from Enhanzed Re.
(2) Hannover Ruck SE is rated AA- by Standard & Poor’s and A+ by A.M. Best. The transaction described in Note 4 - "Significant New Business" had the effect of reducing the balances due from this reinsurer to below 10% of the total reinsurance balances recoverable as of December 31, 2020.
(3) Lloyd's Syndicates are rated A+ by Standard & Poor's and A by A.M. Best.(4) U.S. state backed reinsurer that is supported by assessments on active auto writers operating within the state.
Table of Contents
ENSTAR GROUP LIMITEDNOTES TO THE CONSOLIDATED FINANCIAL STATEMENTS — (Continued)
143

Allowance for Estimated Uncollectible Reinsurance Balances Recoverable on Paid and Unpaid LossesWe evaluate and monitor the credit risk related to our reinsurers, and an allowance for estimated uncollectible
reinsurance balances recoverable on paid and unpaid losses ("allowance for estimated uncollectible reinsurance") is established for amounts considered potentially uncollectible.
With respect to our process for determining the allowances for estimated uncollectible reinsurance, we adopted ASU 2016-13 and the related amendments on January 1, 2020 and recorded a cumulative effect adjustment of $0.2 million to increase the opening retained earnings on the initial adoption of the guidance. Our allowance for estimated uncollectible reinsurance is derived based on various data sources, multiple key inputs and forecast scenarios. These include the duration of the collection period, credit quality, changes in reinsurer credit standing, default rates specific to the individual reinsurer, the geographical location of the reinsurer, contractual disputes with reinsurers over individual contentious claims, contract language or coverage issues, industry analyst reports and consensus economic forecasts.
To determine the allowance for estimated uncollectible reinsurance, we use the PD and LGD methodology whereby each reinsurer is allocated an appropriate PD percentage based on the expected payout duration by portfolio. This PD percentage is then multiplied by an appropriate LGD percentage to arrive at an overall credit allowance percentage which is then applied to the reinsurance balance recoverable for each reinsurer, net of any specific bad debt provisions, collateral or other contract related offsets, to arrive at the overall allowance for estimated uncollectible reinsurance by reinsurer.
The following tables show our gross and net balances recoverable from our reinsurers as well as the related allowance for estimated uncollectible reinsurance broken down by the credit ratings of our reinsurers. The majority of the allowance for estimated uncollectible reinsurance relates to the Non-life Run-off segment.
December 31, 2020
Gross
Allowance for estimated
uncollectible reinsurance Net
Provisions as a % of Gross
Reinsurers rated A- or above $ 1,464,529 $ 60,801 $ 1,403,728 4.2 %Reinsurers rated below A-, secured 608,999 — 608,999 — %Reinsurers rated below A-, unsecured 152,757 76,321 76,436 50.0 %Total $ 2,226,285 $ 137,122 $ 2,089,163 6.2 %
December 31, 2019
Gross
Allowance for estimated
uncollectible reinsurance Net
Provisions as a % of Gross
Reinsurers rated A- or above $ 1,731,270 $ 43,427 $ 1,687,843 2.5 %Reinsurers rated below A-, secured 463,840 — 463,840 — %Reinsurers rated below A-, unsecured 133,663 104,212 29,451 78.0 %Total $ 2,328,773 $ 147,639 $ 2,181,134 6.3 %
Table of Contents
ENSTAR GROUP LIMITEDNOTES TO THE CONSOLIDATED FINANCIAL STATEMENTS — (Continued)
144

The table below provides a reconciliation of the beginning and ending allowance for estimated uncollectible reinsurance balances for the years ended December 31, 2020 and 2019:
2020 2019Allowance for estimated uncollectible reinsurance, beginning of year $ 147,639 $ 156,732 Cumulative effect of change in accounting principle (195) — Effect of exchange rate movement 700 (887) Current period change in the allowance (381) 2,077 Write-offs charged against the allowance (9,625) (9,871) Recoveries collected (1,016) (412) Allowance for estimated uncollectible reinsurance, end of year $ 137,122 $ 147,639
We consider a reinsurance recoverable asset to be past due when it is 90 days past due and record a credit allowance when there is reasonable uncertainty about the collectability of a disputed amount during the reporting period. We did not have significant past due balances older than one year for any of the periods presented.
9. DEFERRED CHARGE ASSETS AND DEFERRED GAIN LIABILITIESDeferred charge assets and deferred gain liabilities relate to retroactive reinsurance policies providing
indemnification of losses and LAE with respect to past loss events in the Non-life Run-off segment. For (re)insurance contracts for which we do not elect the fair value option, a deferred charge asset is recorded for the excess, if any, of the estimated ultimate losses payable over the premiums received at the initial measurement; whereas, a deferred gain liability is recorded for the excess, if any, of the premiums received over the estimated ultimate losses payable at the initial measurement. In addition, for retrocessions of losses and LAE reserves that we have assumed through retroactive reinsurance contracts where the retroceded liabilities exceed the retrocession premiums paid, we record the excess as a deferred gain liability which is amortized to earnings over the estimated period during which the losses paid on the assumed retroceded liabilities are recovered from the retrocessionaire. For further information on our deferred charge assets and deferred gain liabilities, refer to Note 2 - "Significant Accounting Policies."
Deferred Charge AssetsDeferred charge assets are included in other assets on our consolidated balance sheets. The following table
presents a reconciliation of the deferred charge assets for the years ended December 31, 2020, 2019 and 2018:
2020 2019 2018Beginning carrying value $ 272,462 $ 86,585 $ 80,192 Recorded during the year 11,746 224,504 20,174 Amortization (45,606) (38,627) (13,781) Ending carrying value $ 238,602 $ 272,462 $ 86,585
Deferred charge assets are assessed at each reporting period for impairment. If the asset is determined to be impaired, it is written down in the period in which the determination is made. For the year ended December 31, 2020, we completed our assessment for impairment of deferred charge assets and concluded that there had been no impairment of our carried deferred charge asset balances.
Further information on deferred charges recorded during the years ended December 31, 2020, 2019 and 2018 is included in Note 4 - "Significant New Business."
Table of Contents
ENSTAR GROUP LIMITEDNOTES TO THE CONSOLIDATED FINANCIAL STATEMENTS — (Continued)
145

Deferred Gain LiabilitiesDeferred gain liabilities are included in other liabilities on our consolidated balance sheets. The following table
presents a reconciliation of the deferred gain liabilities for the years ended December 31, 2020 and 2019:
2020 2019Beginning carrying value $ 12,875 $ — Recorded during the year 9,365 13,758 Amortization (2,360) (883) Ending carrying value $ 19,880 $ 12,875
10. LOSSES AND LOSS ADJUSTMENT EXPENSES The liability for losses and loss adjustment expenses ("LAE"), also referred to as loss reserves, represents our
gross estimates before reinsurance for unpaid reported losses and includes losses that have been incurred but not reported ("IBNR") for our Non-life Run-off, Atrium (classified as held-for-sale as of December 31, 2020) and StarStone segments using a variety of actuarial methods. We recognize an asset for the portion of the liability that we expect to recover from reinsurers. LAE reserves include allocated loss adjustment expenses ("ALAE"), and unallocated loss adjustment expenses ("ULAE"). ALAE are linked to the settlement of an individual claim or loss, whereas ULAE are based on our estimates of future costs to administer the claims. IBNR represents reserves for loss and LAE that have been incurred but not yet reported to us. This includes amounts for unreported claims, development on known claims and reopened claims.
Our loss reserves cover multiple lines of business, including asbestos, environmental, general casualty, workers' compensation/personal accident, marine, aviation and transit, construction defect, professional indemnity/directors and officers, motor, property and other non-life lines of business.
The following tables summarize the liability for losses and LAE by segment and for our other activities.
2020
Non-lifeRun-off StarStone Other Total
Outstanding losses $ 4,440,425 $ 677,220 $ 10,204 $ 5,127,849 IBNR 4,641,500 615,963 20,040 5,277,503 Fair value adjustments - acquired companies (142,854) (329) — (143,183) Fair value adjustments - fair value option (54,589) — — (54,589) ULAE 350,600 35,102 — 385,702 Total $ 9,235,082 $ 1,327,956 $ 30,244 $ 10,593,282
Reconciliation to Consolidated Balance Sheet:Loss and loss adjustment expenses $ 6,782,162 $ 1,327,956 $ 30,244 $ 8,140,362 Loss and loss adjustment expenses, at fair value 2,452,920 — — 2,452,920 Total $ 9,235,082 $ 1,327,956 $ 30,244 $ 10,593,282
Table of Contents
ENSTAR GROUP LIMITEDNOTES TO THE CONSOLIDATED FINANCIAL STATEMENTS — (Continued)
146

2019Non-lifeRun-off Atrium StarStone Other Total
Outstanding losses $ 4,407,082 $ 89,141 $ 743,830 $ 9,512 $ 5,249,565 IBNR 3,945,407 136,543 556,134 13,565 4,651,649 Fair value adjustments- acquired companies (170,689) 3,700 (522) — (167,511) Fair value adjustments - fair value option (217,933) — — — (217,933) ULAE 331,494 2,288 18,852 — 352,634 Total $ 8,295,361 $ 231,672 $ 1,318,294 $ 23,077 $ 9,868,404
Reconciliation to Consolidated Balance Sheet:Loss and loss adjustment expenses $ 5,674,239 $ 231,672 $ 1,318,294 $ 23,077 $ 7,247,282 Loss and loss adjustment expenses, at fair value 2,621,122 — — — 2,621,122 Total $ 8,295,361 $ 231,672 $ 1,318,294 $ 23,077 $ 9,868,404
The overall increase in the liability for losses and LAE between December 31, 2019 and December 31, 2020 was primarily attributable to the reinsurance transactions completed in 2020, as described in Note 4 - "Significant New Business," net incurred losses and LAE and foreign exchange losses in the year, partially offset by losses paid in the year.
The table below provides a consolidated reconciliation of the beginning and ending liability for losses and LAE.
2020 2019 2018Balance as of January 1 $ 9,868,404 $ 9,048,796 $ 7,100,488 Less: reinsurance reserves recoverable 1,927,624 1,708,272 1,693,028 Less: net deferred charge assets and gain liabilities on retroactive reinsurance 259,587 86,585 80,192 Less: cumulative effect of change in accounting principle on the determination of the allowance for estimated uncollectible reinsurance balances (1) 643 — — Net balance as of January 1 7,680,550 7,253,939 5,327,268 Net incurred losses and LAE: Current period 405,178 580,074 533,081 Prior periods 10,748 34,105 (209,359) Total net incurred losses and LAE 415,926 614,179 323,722 Net paid losses: Current period (71,989) (179,461) (176,172) Prior periods (1,413,500) (1,609,009) (1,158,614) Total net paid losses (1,485,489) (1,788,470) (1,334,786) Effect of exchange rate movement 119,663 47,812 (145,243) Acquired on purchase of subsidiaries — 686 1,310,874 Assumed business 2,186,024 1,586,307 1,772,104 Ceded business (154,926) (33,260) — Reclassification to assets and liabilities held-for-sale (216,808) — — Net balance as of December 31 8,544,940 7,681,193 7,253,939 Plus: reinsurance reserves recoverable (2) 1,829,620 1,927,624 1,708,272 Plus: net deferred charge assets and gain liabilities on retroactive reinsurance 218,722 259,587 86,585 Balance as of December 31 $ 10,593,282 $ 9,868,404 $ 9,048,796
(1) The Company adopted ASU 2016-13 and the related amendments on January 1, 2020. Refer to Note 2 - "Significant Accounting Policies" for further details. This amount excludes $0.4 million related to the adoption impact of ASU 2016-13 on StarStone U.S., which has been classified as a discontinued operation with the related assets and liabilities disclosed as held-for-sale on our consolidated balance sheets.
Table of Contents
ENSTAR GROUP LIMITEDNOTES TO THE CONSOLIDATED FINANCIAL STATEMENTS — (Continued)
147

(2) Net of allowance for estimated uncollectible reinsurance.
The tables below provide the components of net incurred losses and LAE by segment and for our other activities.
2020
Non-lifeRun-off Atrium StarStone Other Total
Net losses paid $ 1,074,901 $ 73,920 $ 326,868 $ 9,800 $ 1,485,489 Net change in case and LAE reserves (1) (453,080) 7,245 (95,044) 692 (540,187) Net change in IBNR reserves (2) (718,414) 6,661 17,654 6,475 (687,624) Increase (reduction) in estimates of net ultimate losses (96,593) 87,826 249,478 16,967 257,678 Increase (reduction) in provisions for unallocated LAE (3) (48,765) (29) 17,244 — (31,550) Amortization of deferred charge assets and deferred gain liabilities (4) 42,640 — 606 — 43,246 Amortization of fair value adjustments (5) 28,667 (571) (590) — 27,506 Changes in fair value - fair value option (6) 119,046 — — — 119,046 Net incurred losses and LAE $ 44,995 $ 87,226 $ 266,738 $ 16,967 $ 415,926
2019
Non-lifeRun-off Atrium StarStone Other Total
Net losses paid $ 1,247,624 $ 78,189 $ 450,835 $ 11,822 $ 1,788,470 Net change in case and LAE reserves (1) (530,891) 3,534 (4,686) 3,460 (528,583) Net change in IBNR reserves (2) (812,699) (4,782) 22,021 756 (794,704) Increase (reduction) in estimates of net ultimate losses (95,966) 76,941 468,170 16,038 465,183 Increase (reduction) in provisions for unallocated LAE (3) (57,404) — 902 — (56,502) Amortization of deferred charge assets and deferred gain liabilities (4) 37,744 — — — 37,744 Amortization of fair value adjustments (5) 50,070 335 168 — 50,573 Changes in fair value - fair value option (6) 117,181 — — — 117,181 Net incurred losses and LAE $ 51,625 $ 77,276 $ 469,240 $ 16,038 $ 614,179
2018
Non-lifeRun-off Atrium StarStone Other Total
Net losses paid $ 838,817 $ 64,506 $ 427,371 $ 4,092 $ 1,334,786 Net change in case and LAE reserves (1) (547,420) 6,331 63,861 4,808 (472,420) Net change in IBNR reserves (2) (565,385) 4,091 46,501 7,999 (506,794) Increase (reduction) in estimates of net ultimate losses (273,988) 74,928 537,733 16,899 355,572 Increase (reduction) in provisions for unallocated LAE (3) (65,401) — 5,613 — (59,788) Amortization of deferred charge assets and deferred gain liabilities (4) 13,781 — — — 13,781 Amortization of fair value adjustments (5) 12,877 (5,118) (266) — 7,493 Changes in fair value - fair value option (6) 6,664 — — — 6,664 Net incurred losses and LAE $ (306,067) $ 69,810 $ 543,080 $ 16,899 $ 323,722
(1) Comprises the movement during the year in specific case reserve liabilities as a result of claims settlements or changes advised to us by our policyholders and attorneys, less changes in case reserves recoverable advised by us to our reinsurers as a result of the settlement or movement of assumed claims.
(2) Represents the gross change in our actuarial estimates of IBNR, less amounts recoverable. (3) Represents the change in the estimate of the total future costs to administer the claims.
Table of Contents
ENSTAR GROUP LIMITEDNOTES TO THE CONSOLIDATED FINANCIAL STATEMENTS — (Continued)
148

(4) Relates to the amortization of deferred charge assets and deferred gain liabilities on retroactive reinsurance contracts.(5) Relates to the amortization of fair value adjustments associated with the acquisition of companies. .(6) Represents the changes in the fair value of liabilities related to our assumed retroactive reinsurance agreements for which we have elected the
fair value option.
Loss Development InformationMethodology for Establishing Reserves
The liability for losses and LAE includes an amount determined from reported claims and an amount based on historical loss experience and industry statistics for IBNR using a variety of actuarial methods. Our loss reserves cover multiple lines of business, including workers' compensation, general casualty, asbestos and environmental, marine, aviation and transit, construction defects and other non-life lines of business. Our management, through our loss reserving committees, considers the reasonableness of loss reserves recommended by our actuaries, including actual loss development during the year.
Case reserves are recognized for known claims (including the cost of related litigation) when sufficient information has been reported to us to indicate the involvement of a specific insurance policy. We use considerable judgment in estimating losses for reported claims on an individual claim basis based upon our knowledge of the circumstances surrounding the claim, the severity of the injury or damage, the jurisdiction of the occurrence, the potential for ultimate exposure, the type of loss, and our experience with the line of business and policy provisions relating to the particular type of claim. The reserves for unpaid reported losses and LAE are established by management based on reports from brokers, ceding companies and insureds and represent the estimated ultimate cost of events or conditions that have been reported to, or specifically identified, by us. We also consider facts currently known and the current state of the law and coverage litigation.
IBNR reserves are established by management based on actuarially determined estimates of ultimate losses and loss expenses. We use generally accepted actuarial methodologies to estimate ultimate losses and LAE and those estimates are reviewed by management. In addition, the routine settlement of claims, at either below or above the carried advised loss reserve, updates historical loss development information to which actuarial methodologies are applied, often resulting in revised estimates of ultimate liabilities. On an annual basis, independent actuarial firms are retained by management to provide their estimates of ultimate losses and to review the estimates developed by our actuaries.
Within the annual loss reserve studies produced by either our actuaries or independent actuaries, exposures for each subsidiary are separated into homogeneous reserving categories for the purpose of estimating IBNR. Each reserving category contains either direct insurance or assumed reinsurance reserves and groups relatively similar types of risks and exposures (for example, asbestos, environmental, casualty, property) and lines of business written (for example, marine, aviation, non-marine). Based on the exposure characteristics and the nature of available data for each individual reserving category, a number of methodologies are applied. Recorded reserves for each category are selected from the actuarial indications produced by the various methodologies after consideration of exposure characteristics, data limitations and strengths and weaknesses of each method applied. This approach to estimating IBNR has been consistently adopted in the annual loss reserve studies for each period presented.
The estimation of unpaid claim liabilities at any given point in time is subject to a high degree of uncertainty for a number of reasons. A significant amount of time can lapse between the assumption of risk, the occurrence of a loss event, the reporting of the event to an insurance or reinsurance company and the ultimate payment of the claim on the loss event. Our actuarial methodologies include amongst other methodologies industry benchmarking which, under certain actuarial methods, compares the trend of our loss development to that of the industry. To the extent that the trend of our loss development compared to the industry changes in any period, it is likely to have an impact on our estimate of ultimate liabilities. Unpaid claim liabilities for property and casualty exposures in general are impacted by changes in the legal environment, jury awards, medical cost trends and general inflation. Certain estimates for unpaid claim liabilities involve considerable uncertainty due to significant coverage litigation, and it can be unclear whether past claim experience will be representative of future claim experience. Ultimate values for such claims cannot be estimated using reserving techniques that extrapolate losses to an ultimate basis using loss development factors, and the uncertainties surrounding the estimation of unpaid claim liabilities are not likely to be resolved in the near future. In addition, reserves are established to cover loss development related to both known and unasserted claims. Consequently, our subsequent estimates of ultimate losses and LAE, and our liability for losses and LAE, may differ materially from the amounts recorded in our consolidated financial statements.
Table of Contents
ENSTAR GROUP LIMITEDNOTES TO THE CONSOLIDATED FINANCIAL STATEMENTS — (Continued)
149

These estimates are reviewed regularly and, as experience develops and new information becomes known, the reserves are adjusted as necessary. Such adjustments (i.e. change in ultimate losses), if any, will be recorded in earnings in the period in which they become known. Prior period development arises from changes to loss estimates recognized in the current year that relate to loss reserves established in previous calendar years.
Asbestos and Environmental
In establishing the reserves for losses and LAE related to asbestos and environmental claims, management considers facts currently known and the current state of the law and coverage litigation environment. Liabilities are recognized for known claims (including the cost of related litigation) when sufficient information has been developed to indicate the involvement of a specific insurance policy, and management can reasonably estimate its liability. In addition, reserves have been established to cover additional exposures on both known and unreported claims. Estimates of the reserves are reviewed and updated continually. Developed case law and claim histories are still evolving for such claims, especially because significant uncertainty exists about the outcome of coverage litigation and whether past claim experience will be representative of future claim experience. In view of the changes in the legal and tort environment that affect the development of such claims, the uncertainties inherent in valuing asbestos and environmental claims are not likely to be resolved in the near future. Ultimate values for such claims cannot be estimated using traditional reserving techniques and there are significant uncertainties in estimating the amount of our potential losses for these claims. There can be no assurance that the reserves established by us will be adequate or will not be adversely affected by the development of other latent exposures.
The net liability for unpaid losses and LAE as of December 31, 2020 and 2019 included $1.9 billion and $2.1 billion, respectively, which represented an estimate of the net ultimate liability for asbestos and environmental claims. The gross liability for such claims as of December 31, 2020 and 2019 was $2.1 billion and $2.3 billion, respectively. For the years ended December 31, 2020 and 2019, our reserves for asbestos and environmental liabilities decreased by $178.2 million and increased by $419.9 million on a gross basis, respectively, and decreased by $227.2 million and increased by $374.7 million on a net basis, respectively. The decrease in 2020 was primarily due to net paid losses while the increase in 2019 was primarily due to acquisition activity, partially offset by net paid losses.
Disclosures of Incurred and Paid Loss Development, IBNR, Claims Counts and Payout Percentages
The loss development tables disclosed below, sets forth our historic incurred and paid loss development by accident year through December 31, 2020, net of reinsurance, as well as the cumulative number of reported claims, IBNR balances, and other supplementary information.
The loss development tables disclosed below are presented as follows:
• Non-Life Run-off - Loss development disclosures have been provided for the 10 latest acquisition years, in addition to disclosures for lines of business with material net losses and LAE reserve balances as of December 31, 2020, within those 10 latest acquisition years, also being provided. The disaggregated lines of business include general casualty, workers’ compensation, motor and professional indemnity and directors and officers.
• StarStone - All the lines of business related to the StarStone segment have been included within the loss development disclosures below, namely, casualty, marine, property, aerospace and workers’ compensation. Following our sale of StarStone U.S. to Core Specialty which was completed on November 30, 2020, the loss development disclosures presented for all the individual lines of business within the StarStone segment have been restated to exclude the historical incurred and paid loss development related to StarStone U.S.
Incurred and Paid Loss Development and IBNR Disclosures
For each acquisition year and/or line of business for which incurred losses and allocated loss adjustment expenses, net of reinsurance tables have been provided below, the disclosure approach and format adopted reflects the following:
• The incurred loss development tables include both reported case reserves and IBNR liabilities, as well as cumulative paid losses;
• Both the incurred and cumulative paid loss development tables include allocated LAE (i.e. claims handling costs allocated to specific individual claims) but exclude unallocated LAE (i.e. the costs associated with internal claims staff and third party administrators as well as consultants that cannot be allocated to specific individual claims);
Table of Contents
ENSTAR GROUP LIMITEDNOTES TO THE CONSOLIDATED FINANCIAL STATEMENTS — (Continued)
150

• The fair value adjustments related to business acquisitions are excluded from the loss development tables, however the undiscounted incurred losses, cumulative paid losses and allocated LAE related to business acquisitions are included in the loss development tables;
• The fair value adjustments related to retroactive reinsurance agreements for which we have elected the fair value option are excluded from the loss development tables, however the undiscounted incurred losses, cumulative paid losses and allocated LAE related to retroactive reinsurance agreements for which we have elected the fair value option are included in the loss development tables;
• The amounts relating to the amortization of deferred charge assets and deferred gain liabilities are excluded from the loss development tables;
• In the incurred loss development tables, the incurred effect of agreeing a commutation or policy buyback is included in the period in which the commutation or policy buyback is contractually agreed. We reflect the net incurred loss development arising from a commutation or policy buyback in the fiscal year in which a commutation or policy buyback is contractually agreed, and the net incurred loss development is allocated to the appropriate accident year. The claim will generally have been adjusted throughout its lifetime and the amounts recorded in prior years (which is considered supplementary information) remain unchanged in our loss development tables, such that the incurred amount that we recognize in the year in which a commutation or policy buyback is contractually agreed represents the effect of the commutation or policy buyback settlement compared to the carried net loss and LAE reserve balance in the prior year. We do not recast prior years to remove commuted or bought back claims, since this practice would eliminate any historical favorable or adverse development we may have experienced on the commuted loss and LAE reserves. Reserves that have been commuted or bought back are not adjusted in future years but the commuted or bought back value remains in our total incurred losses;
• In the cumulative paid losses tables, we reflect the amount of the commutation or policy buyback settlements in the year in which they are actually paid or received, and the net payment is allocated to the appropriate accident year. The claim or recoverable may have recorded payments or receipts throughout its lifetime and amounts recorded in prior years (which is considered supplementary information) remain unchanged in our loss development tables, such that the amounts paid or received that we recognize in the year in which a commutation or policy buyback is paid or received represents the amount actually paid or received. We do not recast prior years to remove payments or receipts related to commutations or policy buybacks, since we consider commutations and policy buybacks a key component of our business and are reflective of our ability to effectively manage acquired losses and LAE liabilities. Payments relating to commutations and policy buybacks are not adjusted in future years but the payments remain in our total cumulative paid losses;
• The amounts included within the loss development tables for the years ended December 31, 2011 through to December 31, 2019 (and in the case of StarStone, from April 1, 2014 its acquisition date through to December 31, 2019), as well as the historical average annual percentage payout ratios as of December 31, 2020, are presented as supplementary information and are therefore unaudited;
• All data presented within the loss development tables is net of reinsurance recoveries, excluding provisions for uncollectible reinsurance recoverables;
• All the incurred and paid loss activity presented within the loss development tables provided below, exclude intercompany cessions. Upon the sale of StarStone U.S. to Core Specialty on November 30, 2020, the incurred and paid loss development activity related to the cessions from StarStone U.S. to our other subsidiaries were no longer eliminated on consolidation and have been included within the loss development tables presented below;
• The IBNR reserves included within each incurred loss development table by accident year, reflect the net IBNR recorded as of December 31, 2020, including expected development on reported losses;
Table of Contents
ENSTAR GROUP LIMITEDNOTES TO THE CONSOLIDATED FINANCIAL STATEMENTS — (Continued)
151

• For the Non-life Run-off segment loss development tables, all information for both acquisitions and retroactive reinsurance agreements is presented prospectively. As the loss reserves are effectively re-underwritten at the date that they are acquired or assumed, we believe that the historical loss development prior to their acquisition is not relevant with respect to our own experience managing these acquired loss reserves. In addition, the information required to prepare the loss development disclosures on a retrospective basis is not always available to us and a mixed presentation approach would result in loss development tables that are not entirely reflective of the actual loss development of the acquired loss reserves;
• For the Non-life Run-off segment we have also presented the net incurred and paid losses and ALAE information by calendar year as well as IBNR and claim counts for accident years older than 10 years on a single row within the loss development tables. This presentation differs from the typical approach where only the net outstanding losses and LAE reserves are presented as a reconciling item at the bottom of the loss development tables. The additional detailed disclosures are provided on a voluntary basis and the inclusion of the disclosures is to provide additional information to the users of our financial statements and to also enable the reconciliation of our total loss reserves by acquisition year and by significant line of business;
• For the StarStone segment loss development tables, all information has been presented on a prospective basis from the date of our acquisition of StarStone, which was effective on April 1, 2014. Providing pre-acquisition incurred and paid losses by accident year for years prior to 2014 was determined to be impracticable due to significant data limitations; and
• Following our sale of StarStone U.S. to Core Specialty which was completed on November 30, 2020, the loss development disclosures presented below for all the individual lines of business within the StarStone segment have been restated to exclude the historical incurred and paid loss development related to StarStone U.S.
The historical amounts disclosed within the loss development tables for all the acquisition years and lines of business presented below are on a constant-currency basis, which is achieved by using constant foreign exchange rates between periods in the loss development tables, and translating prior period amounts denominated in currencies other than the U.S. dollar, which is our reporting currency, using the closing exchange rates as of December 31, 2020.
The impact of this exchange rate conversion is to show the change between periods exclusive of the effect of exchange rate fluctuations, which would otherwise distort the change in incurred losses and the cash flow patterns associated with those incurred losses shown within the loss development tables. The change in net incurred losses shown within the loss development tables will, however, differ from other U.S. GAAP disclosures of incurred current and prior period reserve development amounts, which include the effect of exchange rate fluctuations.
Establishing an estimate for loss reserves involves various assumptions and judgments, therefore, the information contained within the loss development disclosures only allows readers or users of our consolidated financial statements to understand, at the summary level presented in the development tables, the change over time in our reported incurred loss estimates as well as the nature and patterns of the cash flows associated with those estimates. We, therefore, believe that the information provided within the loss development tables disclosed below is of limited use for independent analysis or application of standard actuarial estimations, and any results obtained from doing so should be interpreted with caution.
Cumulative Number of Reported Claims
Reported claim counts, on a cumulative basis, are provided as supplemental information to each incurred loss development table by accident year. We measure claim frequency information on an individual claim count basis within each of our segments as follows:
• Non-Life Run-off - The claim frequency information for the exposures included within our Non-life Run-off lines of business includes direct and assumed open and closed claims by accident year at the claimant level. Reported claims that are closed without a payment are included within our cumulative number of reported claims because we typically incur claim adjustment expenses on them prior to their closure. The claim count numbers exclude counts related to claims within policy deductibles where the insured is responsible for the payment of losses within the deductible layer. Individual claim counts related to certain assumed reinsurance contracts such as excess-of-loss and quota share treaties are not available to us, and the losses arising from these treaties have been treated as single claims for the purposes of determining
Table of Contents
ENSTAR GROUP LIMITEDNOTES TO THE CONSOLIDATED FINANCIAL STATEMENTS — (Continued)
152

claim counts. Therefore, each treaty year within the reinsurance contract is deemed a single claim because the detailed underlying individual claim information is generally not reported to us by our cedants; and
• StarStone - The claim frequency information is determined at the claimant level for the exposures within the lines of business related to these segments. Our claims system assigns a unique claim identifier to each reported claim we receive. Each unique claim identifier is deemed to be a single claim, irrespective of whether the claim remains open or has been closed with or without payment. For certain insurance facilities and business produced or managed by managing general agents, coverholders and third party administrators where the underlying claims data is reported to us in an aggregated format, the information necessary to provide cumulative claims frequency is not available. In such cases, we typically record a “block” claim in our system. This also applies to a small amount of assumed reinsurance business that we write where, similarly, the underlying claims data is reported to us in an aggregated format. In such instances, each assumed reinsurance contract is deemed a single claim.
Our reported claim frequency information is subject to the following inherent limitations when analyzing our loss experience and severity:
• Claim counts are presented only on a reported and not on an ultimate basis. Therefore, reported claim counts include open claims which have outstanding reserves but exclude IBNR claims. As such the reported claims are consistent with reported losses, which can be calculated by subtracting IBNR losses from incurred losses. However, the reported claim counts are inconsistent with the losses in the incurred loss development tables, which include IBNR losses, and to losses in the paid loss development tables, which exclude outstanding reserves;
• Reported claim counts have not been adjusted for ceded reinsurance, which may distort any measures of frequency or severity;
• For lines of business that have a mix of primary and excess layer exposures, such as our general casualty and workers’ compensation lines of business, the reported claim counts may fluctuate from period to period between exposure layers, thereby distorting any measure of frequency and severity; and
• The use of our reported claim frequency information to project ultimate loss payouts by disaggregated disclosure category or line of business may not be as meaningful as claim count information related to individual contracts at a more granular level.
Table of Contents
ENSTAR GROUP LIMITEDNOTES TO THE CONSOLIDATED FINANCIAL STATEMENTS — (Continued)
153

Payout Percentages
• Non-life Run-off - The annual percentage payout disclosures for our Non-life Run-off segment are based on the payout of incurred claims by age, net of reinsurance. For our Non-life Run-off segment, claims aging reflects the number of years that have lapsed since the original acquisition of the related net liability for losses and LAE reserves to the date the claim is paid. There may be occasions where, due to our claims management strategies (including commutations and policy buy-backs) or due to the timing of claims payments relative to the associated recovery, the cash received from reinsurance recoveries is greater than the cash paid out to our claimants, (i.e. a net recovery rather than a net payout for a particular calendar year), thereby resulting in a negative annual percentage payout for that calendar year.
• StarStone - The average annual percentage payout disclosures for our StarStone segment are based on the payout of incurred claims by age, net of reinsurance.
Non-Life Run-off Segment The table below provides a reconciliation of the beginning and ending reserves for losses and LAE for the
Non-life Run-off segment.
2020 2019 2018Balance as of January 1 $ 8,295,361 $ 7,540,662 $ 5,949,472 Less: reinsurance reserves recoverable 1,543,614 1,366,123 1,377,485 Less: net deferred charge assets and gain liabilities on retroactive reinsurance 259,587 86,585 80,192 Plus: cumulative effect of change in accounting principal on allowance for estimated uncollectible reinsurance (1) 703 — — Net balance as of January 1 6,492,863 6,087,954 4,491,795 Net incurred losses and LAE: Current period 30,165 123,559 12,451 Prior periods 14,830 (71,934) (318,518) Total net incurred losses and LAE 44,995 51,625 (306,067) Net paid losses: Current period (9,990) (64,820) (5) Prior periods (1,064,911) (1,182,804) (838,812) Total net paid losses (1,074,901) (1,247,624) (838,817) Effect of exchange rate movement 94,745 46,472 (132,632) Acquired on purchase of subsidiaries — 686 1,111,839 Assumed business 2,186,024 1,586,307 1,761,836 Ceded business (154,926) (33,260) — Net balance as of December 31 7,588,800 6,492,160 6,087,954 Plus: reinsurance reserves recoverable(2) 1,427,560 1,543,614 1,366,123 Plus: net deferred charge assets and gain liabilities on retroactive reinsurance 218,722 259,587 86,585 Balance as of December 31 $ 9,235,082 $ 8,295,361 $ 7,540,662
(1) The Company adopted ASU 2016-13 and the related amendments on January 1, 2020. Refer to Note 2 - "Significant Accounting Policies" for further details.
(2) Net of allowance for estimated uncollectible reinsurance.
Table of Contents
ENSTAR GROUP LIMITEDNOTES TO THE CONSOLIDATED FINANCIAL STATEMENTS — (Continued)
154

Net incurred losses and LAE in the Non-life Run-off segment were as follows:
2020 2019 2018
Prior
PeriodCurrentPeriod Total
PriorPeriod
CurrentPeriod Total
PriorPeriod
CurrentPeriod Total
Net losses paid $ 1,064,911 $ 9,990 $ 1,074,901 $ 1,182,804 $ 64,820 $ 1,247,624 $ 838,812 $ 5 $ 838,817
Net change in case and LAE reserves (1)
(449,610) (3,470) (453,080) (553,996) 23,105 (530,891) (552,124) 4,704 (547,420)
Net change in IBNR reserves (2) (742,417) 24,003 (718,414) (847,893) 35,194 (812,699) (573,127) 7,742 (565,385)
Increase (reduction) in estimates of net ultimate losses
(127,116) 30,523 (96,593) (219,085) 123,119 (95,966) (286,439) 12,451 (273,988)
Increase (reduction) in provisions for unallocated LAE (3)
(48,407) (358) (48,765) (57,844) 440 (57,404) (65,401) — (65,401)
Amortization of deferred charge assets and deferred gain liabilities (4)
42,640 — 42,640 37,744 — 37,744 13,781 — 13,781
Amortization of fair value adjustments (5)
28,667 — 28,667 50,070 — 50,070 12,877 — 12,877
Changes in fair value - fair value option (6)
119,046 — 119,046 117,181 — 117,181 6,664 — 6,664
Net incurred losses and LAE $ 14,830 $ 30,165 $ 44,995 $ (71,934) $ 123,559 $ 51,625 $ (318,518) $ 12,451 $ (306,067) (1) Comprises the movement during the year in specific case reserve liabilities as a result of claims settlements or changes advised to us by our
policyholders and attorneys, less changes in case reserves recoverable advised by us to our reinsurers as a result of the settlement or movement of assumed claims.
(2) Represents the gross change in our actuarial estimates of IBNR, less amounts recoverable. (3) Represents the change in the estimate of the total future costs to administer the claims.(4) Relates to the amortization of deferred charge assets and deferred gain liabilities on retroactive reinsurance contracts.(5) Relates to the amortization of fair value adjustments associated with the acquisition of companies.(6) Represents the changes in the fair value of liabilities related to our assumed retroactive reinsurance agreements for which we have elected the
fair value option.
Year Ended December 31, 2020
The following table shows the components of the 2020 reduction in estimates of net ultimate losses related to prior periods by line of business for the Non-life Run-off segment.
2020
Net losses paidNet change in case and LAE reserves
Net change in IBNR reserves
Increase (reduction) in estimates of net ultimate losses
Asbestos $ 132,853 $ (1,300) $ (150,054) $ (18,501) Environmental 23,866 (266) (36,362) (12,762) General Casualty 170,502 (68,744) (127,421) (25,663) Workers' Compensation 142,790 (176,927) (149,198) (183,335) Marine, aviation and transit 33,927 (14,458) (50,558) (31,089) Construction defect 27,476 (6,092) (13,382) 8,002 Professional indemnity/ Directors & Officers 63,878 3,698 (79,181) (11,605) Motor 349,366 (106,561) (95,040) 147,765 Property 71,422 (24,356) (64,331) (17,265) All Other 48,831 (54,604) 23,110 17,337 Total $ 1,064,911 $ (449,610) $ (742,417) $ (127,116)
The significant drivers of the 2020 reduction in estimates of net ultimate losses are explained below.
Workers' Compensation - The workers’ compensation line of business experienced a $183.3 million reduction in estimates of net ultimate losses as a result of favorable actual development versus expected development across
Table of Contents
ENSTAR GROUP LIMITEDNOTES TO THE CONSOLIDATED FINANCIAL STATEMENTS — (Continued)
155

nearly all our acquired companies and assumed portfolios. We continue to drive favorable loss experience by proactively settling claims for less than the current case reserves. During 2020, we paid net losses of $142.8 million and released case and LAE reserves of $176.9 million. This represents a decline in reported losses of $34.1 million for the year. As a result of the favorable development in our data, our actuarial analyses indicated and resulted in a release of $149.2 million of IBNR reserves, primarily attributed to a settlement of an outwards reinsurance agreement resulting in the reduction in gross ultimate losses inuring to our benefit.
We also continue to actively seek to commute policies in our workers' compensation line of business when possible, and where the commutation of the policy is settled at a level below the carried value of the loss reserves, we record a reduction in our estimates of net ultimate losses. Included in the net paid losses and released case and LAE reserves were 10 commutations that resulted in a net reduction of ultimate losses of $10.8 million.
Marine, aviation and transit - We experienced $31.1 million of favorable development in our marine, aviation and transit line of business. The reduction in net ultimate loss reserves was driven by a number of favorable outcomes on certain large claims from our London based portfolios and better actual than expected experience of reported losses across most reserve segments which led to releases of IBNR reserves as a result of our annual actuarial analyses.
General casualty - Our general casualty line of business experienced $25.7 million in favorable loss development which was the result of better actual than expected claim emergence across several portfolios including a new portfolio acquired in 2020 that underwent its first actuarial analysis by our outside actuarial consultant. To date, we have not experienced adverse social inflation in our general casualty line of business since we are generally proactive in settling claims early for fair value which reduces legal costs for both the defendant and plaintiff.
Motor - The experience in the motor line was adverse by $147.8 million due to higher than expected severity related to a recent assumed loss portfolio transfer transaction. The case reserves were significantly strengthened when we transferred the claim handling to a new third-party administrator with specialist experience in commercial automobile exposures. Along with the new third-party administrator, we have implemented several claim initiatives aimed at reducing defense costs, settling claims earlier, lowering claims severity and increased governance and technical oversight.
Other significant components of the 2020 net incurred losses and LAE include losses related to 2020 net earned premium of $30.2 million, an increase in the fair value of liabilities of $119.0 million related to our assumed retroactive reinsurance agreements for which we have elected the fair value option, primarily due to narrowing credit spreads on corporate bond yields in 2020 and 15 commutations in lines other than workers’ compensation resulting in a decrease of $12.3 million.
Table of Contents
ENSTAR GROUP LIMITEDNOTES TO THE CONSOLIDATED FINANCIAL STATEMENTS — (Continued)
156

Year Ended December 31, 2019
The following table shows the components of the 2019 reduction in estimates of net ultimate losses related to prior periods by line of business for the Non-life Run-off segment.
2019
Net losses paidNet change in case and LAE reserves
Net change in IBNR reserves
Increase (reduction) in estimates of net ultimate losses
Asbestos $ 118,557 $ 35,003 $ (146,749) $ 6,811 Environmental 16,899 13,796 (15,707) 14,988 General Casualty 175,044 (89,968) (91,818) (6,742) Workers' Compensation 208,961 (156,435) (188,944) (136,418) Marine, aviation and transit 82,058 (77,958) (24,508) (20,408) Construction defect 32,078 (8,313) (25,025) (1,260) Professional indemnity/ Directors & Officers 103,413 (36,986) (104,984) (38,557) Motor 276,563 (134,127) (179,887) (37,451) Property 94,093 (73,259) (7,358) 13,476 All Other 75,138 (25,749) (62,913) (13,524) Total $ 1,182,804 $ (553,996) $ (847,893) $ (219,085)
The significant drivers of the 2019 reduction in estimates of net ultimate losses are explained below.
Workers' Compensation - A $136.4 million reduction in estimates of net ultimate losses in our workers' compensation line of business arose across multiple portfolios, where reported loss development was generally significantly less than expected development. The lower than expected actual development was driven by significant proactive settlement activity on individual claimants where we were able to settle claims lower than the case reserve estimates. For example, in two of our portfolios we observed favorable reported loss development, where we paid $39.3 million in loss payments to release a corresponding $53.6 million of associated case reserves for $14.3 million in favorable reported loss development. These settlement activities and the favorable actual loss development versus expected loss development, led to a change in the actuarial assumptions in the annual reserve study that reflect this favorable loss development.
We also continue to actively seek to commute policies in our workers' compensation line of business when possible, and where the commutation of the policy is settled at a level below the carried value of the loss reserves, we record a reduction in our estimates of net ultimate losses. During 2019, we completed 6 commutations across several workers' compensation portfolios that contributed to a $6.1 million reduction in estimates of net ultimate losses.
Professional Indemnity/Directors & Officers - A $38.6 million reduction in estimates of net ultimate losses in our professional indemnity/directors’ & officers’ line of business arose based on the annual actuarial analysis which reflected the better than expected loss development during 2019. As part of the reserve analysis, an in-depth review of recently acquired portfolios’ ceded reinsurance programs led to an increase in the ceded reinsurance asset of $13.5 million, which is a reduction in net ultimate losses.
Asbestos - A $6.8 million increase in estimates of net ultimate losses in our asbestos line of business arose primarily due to changes in our actuarial assumptions related to dismissal rates. During 2019, the number of new defendants and filed claims was less than expected, but this was offset by a lowering of the dismissal rate. In asbestos, the dismissal rates are extremely high as many of the claims do not have merit against the insured. However, we have seen a trend in both US and UK exposure of the dismissal rate decreasing in the range of 2 to 3 percentage points.
Similar to workers’ compensation business, during 2019, we completed 6 commutations across several portfolios that contributed to a $9.8 million reduction in estimates of net ultimate losses.
Table of Contents
ENSTAR GROUP LIMITEDNOTES TO THE CONSOLIDATED FINANCIAL STATEMENTS — (Continued)
157

Other - All other line of business changes in estimates of net ultimate losses were primarily due to the application of our reserving methodologies, favorable actual versus expected loss development and proactive claim management.
Other significant components of the 2019 net incurred losses and LAE include losses related to 2019 net earned premium of $123.6 million and an increase in the fair value of liabilities of $117.2 million related to our assumed retroactive reinsurance agreements for which we have elected the fair value option, primarily due to narrowing credit spreads on corporate bond yields in 2019.
Year Ended December 31, 2018
The following table shows the components of the 2018 reduction in estimates of net ultimate losses related to prior periods by line of business for the Non-life Run-off segment.
2018
Net losses paidNet change in case and LAE reserves
Net change in IBNR reserves
Increase (reduction) in estimates of net ultimate losses
Asbestos $ 108,248 $ (21,535) $ (151,662) $ (64,949) Environmental 21,273 479 (7,599) 14,153 General Casualty 141,624 (115,240) (60,828) (34,444) Workers' Compensation 139,226 (178,138) (115,648) (154,560) Marine, aviation and transit 67,831 (44,200) (21,188) 2,443 Construction defect 22,182 (7,257) (33,146) (18,221) Professional indemnity/ Directors & Officers 161,797 (11,159) (130,957) 19,681 Motor 104,182 (109,962) (34,215) (39,995) Property 22,178 (24,271) (11,497) (13,590) All Other 50,271 (40,841) (6,387) 3,043 Total $ 838,812 $ (552,124) $ (573,127) $ (286,439)
The significant drivers of the 2018 reduction in estimates of net ultimate losses are explained below.
Workers' Compensation - The $154.6 million reduction in estimates of net ultimate losses in our workers' compensation line of business arose across multiple portfolios, where reported incurred loss development was generally significantly less than expected. When actual development is less than expected for a sustained period of time across a significant volume of exposures, an updated actuarial analysis tends to indicate reductions in IBNR reserves. Updates to actuarial analysis, factoring in the less-than-expected reported incurred loss development for the year, is the primary driver of the reduction to our Workers' Compensation net ultimate loss estimates.
For certain of our portfolios, the lower than expected actual development was driven by significant proactive settlement activity on individual claimants where we were able to close open claims earlier than was indicated by our original payout patterns, and in other portfolios, based on the review of recent loss development activity we revised our actuarial development "tail factor" assumption, which led to a reduction in net ultimate losses. For example, in one portfolio we observed favorable incurred loss development, primarily relating to accident years 1995 through 2005 where we paid $22.7 million in loss payments to release a corresponding $37.0 million of associated case reserves for $14.3 million in favorable incurred loss development.
For recently acquired portfolios of workers' compensation business, we have utilized our subsidiary, Paladin Managed Care Services ("Paladin"), to assist us in reviewing claims. Paladin generally produces savings related to medical expense liabilities over and above savings achieved by prior vendors of such services, and the savings lead to actual development that is less than expected, thereby driving reductions to the estimates of net ultimate losses. In one particular program, our claims personnel pursued a proactive strategy of settling with numerous workers' compensation claimants whose injuries arose in recent accident years. For this portfolio, the claims team reduced the open inventory of claims by 78% during 2018. This reduction in exposure, when incorporated into an updated
Table of Contents
ENSTAR GROUP LIMITEDNOTES TO THE CONSOLIDATED FINANCIAL STATEMENTS — (Continued)
158

actuarial analysis, led to a reduction in our estimate of ultimate net losses of $30.2 million, primarily relating to accident years 2010 through 2014.
We also continue to actively seek commutations on policies when possible, and where the commutation of the policy is settled at a level below the carried value of the loss reserves, we record a reduction in our estimates of net ultimate losses. During 2018, we completed 7 commutations across several portfolios that contributed to an $11.2 million the reduction in estimates of net ultimate losses.
Asbestos - The $64.9 million reduction in estimates of net ultimate losses in our asbestos line of business arose primarily due to one asbestos portfolio where lower than expected volume of claims reported and a lower than expected severity on claims settled in the period, when projected to net ultimate losses through actuarial methodologies, resulted in a significant reduction in estimates of net ultimate losses. The volume of claims reported was 3% less than expected and the average cost per claim was 5% less than expected. Across our other asbestos portfolios, we completed 8 commutations and 2 policy buy-backs contributing to a $9.5 million reduction in estimates of net ultimate losses.
Other - All other line of business changes in estimates of net ultimate losses were primarily due to the application of our reserving methodologies, favorable actual versus expected loss development, claim management and commutations.
Disclosures of Incurred and Paid Loss Development, IBNR, Claims Counts and Payout Percentages
The following tables provide a breakdown of gross and net losses and LAE reserves, consisting of Outstanding Loss Reserve ("OLR") and IBNR by line of business and adjustments for fair value resulting from business combinations, adjustments for where we elected the fair value option, deferred charge assets and ULAE, as of December 31, 2020 and 2019:
2020Gross Net
OLR IBNR Total OLR IBNR Total (in thousands of U.S. dollars)Asbestos $ 544,438 $ 1,234,101 $ 1,778,539 $ 464,102 $ 1,122,021 $ 1,586,123 Environmental 184,783 118,111 302,894 164,709 100,339 265,048 General casualty 610,437 1,279,991 1,890,428 492,039 1,247,662 1,739,701 Workers' compensation/personal accident 1,087,324 918,238 2,005,562 912,068 776,941 1,689,009 Marine, aviation and transit 271,469 73,081 344,550 229,464 56,414 285,878 Construction defect 23,380 85,578 108,958 23,109 83,039 106,148 Professional indemnity/Directors & Officers 764,768 336,705 1,101,473 526,333 307,349 833,682 Motor 619,682 355,044 974,726 451,097 283,576 734,673 Property 116,398 35,832 152,230 97,826 34,182 132,008 Other 217,746 204,819 422,565 141,448 121,895 263,343
$ 4,440,425 $ 4,641,500 $ 9,081,925 $ 3,502,195 $ 4,133,418 $ 7,635,613 Fair value adjustments (142,854) (128,841) Fair value adjustments - fair value option (54,589) (33,163) Net deferred charge assets and gains on retroactive reinsurance — (218,722) ULAE 350,600 333,913 Total $ 9,235,082 $ 7,588,800
Table of Contents
ENSTAR GROUP LIMITEDNOTES TO THE CONSOLIDATED FINANCIAL STATEMENTS — (Continued)
159

2019Gross Net
OLR IBNR Total OLR IBNR Total (in thousands of U.S. dollars)Asbestos $ 542,681 $ 1,373,678 $ 1,916,359 $ 490,117 $ 1,271,982 $ 1,762,099 Environmental 187,165 156,121 343,286 173,878 142,351 316,229 General casualty 501,863 489,129 990,992 399,396 421,426 820,822 Workers' compensation/personal accident 1,270,530 977,808 2,248,338 963,578 751,074 1,714,652 Marine, aviation and transit 290,067 121,577 411,644 244,611 100,135 344,746 Construction defect 29,772 98,312 128,084 29,245 94,888 124,133 Professional indemnity/Directors & Officers 693,760 265,490 959,250 485,478 170,926 656,404 Motor 480,668 233,806 714,474 317,829 165,543 483,372 Property 140,620 63,604 204,224 122,010 56,450 178,460 Other 269,956 165,882 435,838 208,647 97,573 306,220
$ 4,407,082 $ 3,945,407 $ 8,352,489 $ 3,434,789 $ 3,272,348 $ 6,707,137 Fair value adjustments (170,689) (157,036) Fair value adjustments - fair value option (217,933) (129,848) Net deferred charge assets and gain liabilities on retroactive reinsurance — (259,587) ULAE 331,494 331,494 Total $ 8,295,361 $ 6,492,160
In addition to the breakdown of our Non-life Run-off reserves by line of business we also monitor our reserves by acquisition year. The acquisition year is the year in which the net reserves were acquired via a business acquisition or assumed via a retroactive reinsurance agreement. By analyzing the loss development tables by acquisition year on a prospective basis, the impact of the take-on positions from year to year does not distort the loss development tables.
The following table provides a summary of our net loss reserves, prior to provisions for bad debt, fair value adjustments, deferred charge assets and deferred gain liabilities and ULAE as of December 31, 2020, by year of acquisition and by significant line of business:
Acquisition Year2010 and Prior 2011 2012 2013 2014 2015 2016 2017 2018 2019 2020 Total
Asbestos $ 142,028 $ — $ — $ 7,767 $ — $ — $ 407,958 $ 726,901 $ 1,105 $ 277,947 $ — $ 1,563,706
Environmental 42,356 — — — — — 89,865 22,891 11,203 95,072 — 261,387
General casualty 52,582 13,270 9,983 16,696 31,610 34,704 3,727 44,551 228,419 218,995 1,077,908 1,732,445
Workers' compensation/personal accident 42,908 125,649 — 48,207 — 287,653 219,157 53,659 322,737 387,438 199,864 1,687,272
Marine, aviation and transit 8,760 2,747 — (188) 10,592 1,616 32 77,321 106,431 56,709 19,848 283,868
Construction defect 43 — — — — 36,258 14,289 18,836 — 36,709 — 106,135
Professional indemnity/Directors & Officers 7,539 9,564 23,210 — 20,942 — 76,314 — 331,676 130,906 232,934 833,085
Motor 12,452 201 276 — 1,465 13,147 — 3,710 260,797 17,899 422,321 732,268
Property 3,301 161 7,008 — 18,165 3,880 465 (114) 47,270 39,286 10,887 130,309
All Other 17,473 854 2,696 4,260 9,676 6,959 23,582 94,499 18,222 78,474 — 256,695
Total $ 329,442 $ 152,446 $ 43,173 $ 76,742 $ 92,450 $ 384,217 $ 835,389 $ 1,042,254 $ 1,327,860 $ 1,339,435 $ 1,963,762 $ 7,587,170
Table of Contents
ENSTAR GROUP LIMITEDNOTES TO THE CONSOLIDATED FINANCIAL STATEMENTS — (Continued)
160

The table below reconciles the net loss reserves, prior to provisions for bad debt, fair value adjustments, deferred charge assets and deferred gain liabilities and ULAE as of December 31, 2020, by significant line of business to the line of business table presented above:
2020Total Net
Reserves per all Acquisition
YearsProvision for
Bad DebtTotal Net Reserves
Asbestos $ 1,563,706 $ 22,417 $ 1,586,123
Environmental 261,387 3,661 265,048
General casualty 1,732,445 7,256 1,739,701
Workers' compensation/personal accident 1,687,272 1,737 1,689,009
Marine, aviation and transit 283,868 2,010 285,878
Construction defect 106,135 13 106,148
Professional indemnity/Directors & Officers 833,085 597 833,682
Motor 732,268 2,405 734,673
Property 130,309 1,699 132,008
All Other 256,695 6,648 263,343
Total $ 7,587,170 $ 48,443 $ 7,635,613
Loss development tables have been provided for acquisition years 2011 through 2020. In addition, for the acquisition years presented, we have also provided additional loss development tables for lines of business within those acquisition years which had net loss reserve balances that were deemed to be significant as of December 31, 2020 as follows:
• General casualty - 2018, 2019 and 2020 acquisition years;
• Workers' compensation - 2015, 2016, 2018 and 2019 acquisition years;
• Motor - 2018 and 2020 acquisition years; and
• Professional indemnity and directors and officers - 2018 and 2020 acquisition years.
Our Non-life Run-off segment is unique within the insurance industry in that legacy reserves are continuously being acquired and added to this segment through business acquisitions or through retroactive reinsurance agreements. Accordingly, it would not be appropriate to extrapolate redundancies or deficiencies into the future from the loss development tables provided below. Acquired and assumed reserves arising from business acquisitions and retroactive reinsurance agreements are presented on a full prospective basis.
The following tables set forth information about incurred and paid loss development, total IBNR reserves and cumulative loss frequency related to our 2011 through 2020 acquisition years within the Non-Life Run-off segment as of December 31, 2020. In addition, we have also presented loss development tables for the significant lines of business within certain acquisition years. The information related to incurred and paid loss development for the years ended December 31, 2011 through 2019 is presented as supplementary information and is therefore unaudited.
Table of Contents
ENSTAR GROUP LIMITEDNOTES TO THE CONSOLIDATED FINANCIAL STATEMENTS — (Continued)
161

Business Acquired and Contracts Incepting in the Year Ended December 31, 2011
Incurred Losses and Allocated Loss Adjustment Expenses, Net of Reinsurance As of December 31, 2020For the Years Ended December 31,
Accident Year
Total Net Reserves Acquired
2011 (unaudited)
2012 (unaudited)
2013 (unaudited)
2014 (unaudited)
2015 (unaudited)
2016 (unaudited)
2017 (unaudited)
2018 (unaudited)
2019 (unaudited) 2020 IBNR
Cumulative Number of
Claims
2010 and Prior $ 597,263 $ 621,819 $ 589,004 $ 489,877 $ 426,777 $ 375,227 $ 319,423 $ 274,136 $ 261,234 $ 240,808 $ 229,458 $ 17,493 112,837
2011 — 102 36 45 54 61 71 79 86 93 100 — 19
2012 — 122 11 10 10 10 17 18 17 17 — 7
2013 — 23 43 15 15 15 15 15 15 — 16
2014 — 1 3 3 3 18 15 14 2 14
2015 — — (2) (2) 32 24 19 — 1
2016 — 2 (139) (111) (99) (88) 7 2
2017 — — 21 15 17 1 2
2018 — 7 8 8 1 1
2019 — — 2 1 1
2020 — 2 1 1
$ 597,263 $ 229,564 $ 17,506 112,901
Cumulative Paid Losses and Allocated Loss Adjustment Expenses, Net of ReinsuranceFor The Years Ended December 31,
Accident Year
2011 (unaudited)
2012 (unaudited)
2013 (unaudited)
2014 (unaudited)
2015 (unaudited)
2016 (unaudited)
2017 (unaudited)
2018 (unaudited)
2019 (unaudited) 2020
2010 and Prior $ 58,934 $ 98,969 $ 90,711 $ 24,238 $ 19,370 $ 27,563 $ 19,697 $ 31,108 $ 56,741 $ 77,051
2011 27 36 46 54 61 71 79 86 93 100
2012 6 10 10 10 10 17 17 17 17
2013 6 11 15 15 15 15 15 15
2014 1 3 3 3 4 7 7
2015 (1) (2) (2) 2 11 18
2016 2 (153) (125) (114) (105)
2017 — 3 6 10
2018 1 4 5
2019 — —
2020 —
$ 77,118 Total outstanding liabilities for unpaid losses and LAE, net of reinsurance $ 152,446
Table of Contents
ENSTAR GROUP LIMITEDNOTES TO THE CONSOLIDATED FINANCIAL STATEMENTS — (Continued)
162

Business Acquired and Contracts Incepting in the Year Ended December 31, 2012
Incurred Losses and Allocated Loss Adjustment Expenses, Net of Reinsurance As of December 31, 2020For the Years Ended December 31,
Accident Year
Total Net Reserves Acquired
2012 (unaudited)
2013 (unaudited)
2014 (unaudited)
2015 (unaudited)
2016 (unaudited)
2017 (unaudited)
2018 (unaudited)
2019 (unaudited) 2020 IBNR
Cumulative Number of
Claims
2010 and Prior $ 326,229 $ 328,419 $ 321,295 $ 312,510 $ 297,081 $ 286,660 $ 277,778 $ 269,004 $ 263,472 $ 252,318 $ 10,889 47,773
2011 1,487 1,466 1,336 1,182 1,095 1,072 1,049 1,032 1,032 1,032 — 5
2012 55 81 49 363 344 406 397 167 167 167 — 6
2013 — 946 119 427 433 421 136 136 136 — 5
2014 (60) 2,991 3,108 1,552 1,300 1,195 1,146 1,068 1 7
2015 — 729 1,517 739 739 739 739 — 5
2016 (485) 67 1,266 1,113 1,059 445 37 2
2017 — 75 167 100 100 — 4
2018 (59) — 154 74 4 1
2019 (123) 274 145 11 4
2020 — 164 — 3
$ 327,044 $ 256,388 $ 10,942 47,815
Cumulative Paid Losses and Allocated Loss Adjustment Expenses, Net of ReinsuranceFor The Years Ended December 31,
Accident Year
2012 (unaudited)
2013 (unaudited)
2014 (unaudited)
2015 (unaudited)
2016 (unaudited)
2017 (unaudited)
2018 (unaudited)
2019 (unaudited) 2020
2010 and Prior $ 3,194 $ 70,440 $ 112,966 $ 144,553 $ 169,781 $ 180,270 $ 194,011 $ 204,482 $ 209,656
2011 120 496 742 866 928 990 1,032 1,032 1,032
2012 31 49 49 52 167 167 167 167 167
2013 109 119 136 136 136 136 136 136
2014 67 224 459 675 864 989 1,053
2015 112 117 739 739 739 739
2016 3 56 98 98 98
2017 13 43 100 100
2018 — 30 34
2019 18 36
2020 164
$ 213,215 Total outstanding liabilities for unpaid losses and LAE, net of reinsurance $ 43,173
Table of Contents
ENSTAR GROUP LIMITEDNOTES TO THE CONSOLIDATED FINANCIAL STATEMENTS — (Continued)
163

Business Acquired and Contracts Incepting in the Year Ended December 31, 2013
Incurred Losses and Allocated Loss Adjustment Expenses, Net of Reinsurance As of December 31, 2020For the Years Ended December 31,
Accident Year
Total Net Reserves Acquired
2013 (unaudited)
2014 (unaudited)
2015 (unaudited)
2016 (unaudited)
2017 (unaudited)
2018 (unaudited)
2019 (unaudited) 2020 IBNR
Cumulative Number of
Claims
2010 and Prior $ 320,974 $ 349,297 $ 354,585 $ 361,812 $ 356,522 $ 340,248 $ 326,851 $ 313,347 $ 314,497 $ 16,353 56,441 2011 96,929 102,288 100,482 100,243 95,848 87,913 86,403 85,919 81,616 2,700 11,185 2012 131,119 127,323 121,364 118,085 114,772 110,045 107,853 108,025 105,564 1,831 10,423 2013 13,062 90,739 91,634 88,920 85,791 81,732 80,036 80,091 79,174 1,073 5,656 2014 — 4,514 3,714 3,425 16,800 16,225 16,304 16,269 55 174 2015 — 265 280 982 329 250 237 42 2 2016 — 103 71 70 69 69 1 1 2017 — 30 13 13 13 — 1 2018 — 22 17 18 — 1 2019 — 13 15 — 1 2020 — 61 4 1
$ 562,084 $ 597,533 $ 22,059 83,886
Cumulative Paid Losses and Allocated Loss Adjustment Expenses, Net of ReinsuranceFor The Years Ended December 31,
Accident Year
2013 (unaudited)
2014 (unaudited)
2015 (unaudited)
2016 (unaudited)
2017 (unaudited)
2018 (unaudited)
2019 (unaudited) 2020
2010 and Prior $ 74,418 $ 134,409 $ 186,762 $ 222,891 $ 229,942 $ 243,755 $ 249,023 $ 258,436 2011 30,323 52,455 63,952 70,498 75,055 77,290 79,112 73,282 2012 33,361 59,095 74,663 86,916 92,445 96,780 99,781 98,096 2013 17,022 37,653 52,638 62,876 68,866 71,487 74,556 74,472 2014 993 1,747 2,256 15,804 15,959 16,123 16,164 2015 43 102 112 165 190 191 2016 34 64 65 66 67 2017 9 13 13 13 2018 13 17 18 2019 8 15 2020 37
$ 520,791 Total outstanding liabilities for unpaid losses and LAE, net of reinsurance $ 76,742
Table of Contents
ENSTAR GROUP LIMITEDNOTES TO THE CONSOLIDATED FINANCIAL STATEMENTS — (Continued)
164

Business Acquired and Contracts Incepting in the Year Ended December 31, 2014
Incurred Losses and Allocated Loss Adjustment Expenses, Net of Reinsurance As of December 31, 2020For the Years Ended December 31,
Accident Year
Total Net Reserves Acquired
2014 (unaudited)
2015 (unaudited)
2016 (unaudited)
2017 (unaudited)
2018 (unaudited)
2019 (unaudited) 2020 IBNR
Cumulative Number of Claims
2010 and Prior $ 142,341 $ 133,678 $ 123,973 $ 155,274 $ 142,256 $ 141,058 $ 145,889 $ 144,874 $ 6,454 12,014 2011 74,248 129,149 154,394 134,137 136,257 137,806 139,997 135,181 10,057 6,228 2012 141,597 147,347 178,577 187,062 179,745 165,821 162,740 160,769 10,449 6,393 2013 86,920 76,313 95,125 83,564 88,189 90,387 88,391 90,951 8,947 3,173 2014 — 13,802 9,554 14,506 7,438 6,590 6,954 7,098 1,708 1,112 2015 — 33,549 15,553 20,741 18,929 17,206 17,090 72 183 2016 — 330 1,108 4,594 771 724 89 45 2017 — 5,078 3,893 8,200 8,463 24 37 2018 — 6 5 82 — 19 2019 — — — — 10 2020 — — — 6
$ 445,106 $ 565,232 $ 37,800 29,220
Cumulative Paid Losses and Allocated Loss Adjustment Expenses, Net of ReinsuranceFor The Years Ended December 31,
Accident Year
2014 (unaudited)
2015 (unaudited)
2016 (unaudited)
2017 (unaudited)
2018 (unaudited)
2019 (unaudited) 2020
2010 and Prior $ 36,509 $ 82,699 $ 103,197 $ 118,857 $ 120,309 $ 121,847 $ 127,622 2011 84,031 109,675 110,575 113,701 120,155 123,335 123,364 2012 47,495 90,307 120,910 130,001 130,105 133,900 133,026 2013 21,752 40,817 48,223 56,941 65,073 65,625 66,225 2014 1,462 2,504 3,293 3,989 6,147 6,660 6,654 2015 1,741 4,308 11,566 13,371 13,417 13,473 2016 20 556 558 561 559 2017 537 1,541 1,238 1,778 2018 5 5 81 2019 — — 2020 —
$ 472,782 Total outstanding liabilities for unpaid losses and LAE, net of reinsurance $ 92,450
Table of Contents
ENSTAR GROUP LIMITEDNOTES TO THE CONSOLIDATED FINANCIAL STATEMENTS — (Continued)
165

Business Acquired and Contracts Incepting in the Year Ended December 31, 2015
Incurred Losses and Allocated Loss Adjustment Expenses, Net of ReinsuranceAs of December 31, 2020For the Years Ended December 31,
Accident Year
Total Net Reserves Acquired
2015 (unaudited)
2016 (unaudited)
2017 (unaudited)
2018 (unaudited)
2019 (unaudited) 2020 IBNR
Cumulative Number of Claims
2010 and Prior $ 1,003,949 $ 933,328 $ 640,324 $ 594,466 $ 564,502 $ 521,598 $ 505,379 $ 49,461 13,557 2011 124,727 137,429 131,303 129,657 128,155 128,672 126,764 14,306 5,587 2012 179,136 187,488 197,895 201,017 194,277 193,553 192,426 18,110 4,885 2013 229,590 189,838 196,582 199,983 189,737 185,101 184,590 13,855 4,699 2014 144,392 143,193 137,668 142,937 137,541 152,478 147,567 7,413 7,783 2015 23,750 70,276 69,322 66,152 64,974 69,465 73,256 6,959 10,997 2016 — 14,872 13,141 13,440 14,576 12,868 2,178 14,283 2017 — 4,095 4,527 5,277 6,860 345 3,534 2018 — 3,055 1,889 1,805 985 400 2019 — 1,838 1,873 1,831 51 2020 — 1,951 1,962 3
$ 1,705,544 $ 1,255,339 $ 117,405 65,779
Cumulative Paid Losses and Allocated Loss Adjustment Expenses, Net of ReinsuranceFor The Years Ended December 31,
Accident Year
2015 (unaudited)
2016 (unaudited)
2017 (unaudited)
2018 (unaudited)
2019 (unaudited) 2020
2010 and Prior $ 32,819 $ 83,350 $ 134,737 $ 166,983 $ 195,205 $ 220,984 2011 33,827 55,115 71,023 86,397 98,000 105,178 2012 52,728 94,831 119,520 142,358 158,620 168,213 2013 46,761 89,930 120,509 145,788 159,767 164,215 2014 30,747 64,475 91,016 109,451 125,619 133,094 2015 20,653 38,709 46,668 51,994 59,963 63,181 2016 5,603 7,371 8,687 9,861 10,321 2017 2,321 3,925 4,767 5,047 2018 567 862 820 2019 45 65 2020 4
$ 871,122 Total outstanding liabilities for unpaid losses and LAE, net of reinsurance $ 384,217
Table of Contents
ENSTAR GROUP LIMITEDNOTES TO THE CONSOLIDATED FINANCIAL STATEMENTS — (Continued)
166

Business Acquired and Contracts Incepting in the Year Ended December 31, 2015 - Workers' Compensation
Incurred Losses and Allocated Loss Adjustment Expenses, Net of ReinsuranceAs of December 31, 2020For the Years Ended December 31,
Accident Year
Total Net Reserves Acquired
2015 (unaudited)
2016 (unaudited)
2017 (unaudited)
2018 (unaudited)
2019 (unaudited) 2020 IBNR
Cumulative Number of Claims
2010 and Prior $ 953,178 $ 868,509 $ 569,692 $ 518,764 $ 490,534 $ 449,380 $ 434,422 $ 40,504 8,605
2011 76,789 73,723 69,009 68,013 66,781 67,741 65,825 3,685 1,241
2012 120,298 110,007 108,251 106,625 100,187 99,212 98,733 4,613 1,809
2013 146,237 124,726 122,238 121,010 113,056 112,677 113,414 5,595 2,386
2014 82,141 86,852 82,038 83,095 78,389 78,948 80,307 1,513 3,686
2015 4,089 18,647 12,623 13,488 12,295 11,309 11,337 557 2,900
2016 — 873 955 583 536 514 52 38
2017 — 358 61 41 33 13 10
2018 — — 5 3 — 1
2019 — 1 3 1 1
2020 — — — —
$ 1,382,732 $ 804,591 $ 56,533 20,677
Cumulative Paid Losses and Allocated Loss Adjustment Expenses, Net of Reinsurance
For The Years Ended December 31,Accident
Year2015
(unaudited)2016
(unaudited)2017
(unaudited)2018
(unaudited)2019
(unaudited) 20202010 and
Prior $ 20,630 $ 65,008 $ 107,906 $ 132,025 $ 155,329 $ 177,205
2011 16,032 30,462 39,635 50,470 55,595 58,420
2012 25,103 52,851 66,092 79,367 88,369 91,332
2013 27,737 55,675 75,065 91,559 100,890 104,265
2014 17,824 38,051 53,308 65,561 72,696 75,781
2015 3,034 5,672 7,917 9,169 9,248 9,461
2016 134 363 417 447 452
2017 2 10 18 19
2018 — 1 2
2019 — 1
2020 —
$ 516,938 Total outstanding liabilities for unpaid losses and LAE, net of reinsurance $ 287,653
Table of Contents
ENSTAR GROUP LIMITEDNOTES TO THE CONSOLIDATED FINANCIAL STATEMENTS — (Continued)
167

Business Acquired and Contracts Incepting in the Year Ended December 31, 2016
Incurred Losses and Allocated Loss Adjustment Expenses, Net of ReinsuranceAs of December 31, 2020For the Years Ended December 31,
Accident Year
Total Net Reserves Acquired
2016 (unaudited)
2017 (unaudited)
2018 (unaudited)
2019 (unaudited) 2020 IBNR
Cumulative Number of Claims
2010 and Prior $ 1,304,938 $ 1,316,544 $ 1,346,575 $ 1,321,289 $ 1,322,161 $ 1,361,353 $ 305,042 24,449 2011 17,291 17,291 19,920 19,754 18,829 18,609 2,266 861 2012 13,717 13,717 17,020 14,765 12,717 13,037 1,829 809 2013 373 373 1,312 1,237 1,120 914 603 127 2014 391 391 1,380 1,056 869 817 310 57 2015 — — — — — — — — 2016 — — — — — — — — 2017 — — — — — — — 2018 — — — — — — 2019 — — — — — 2020 — — — —
$ 1,336,710 $ 1,394,730 $ 310,050 26,303
Cumulative Paid Losses and Allocated Loss Adjustment Expenses, Net of Reinsurance
For the Years Ended December 31,Accident
Year2016
(unaudited)2017
(unaudited)2018
(unaudited)2019
(unaudited) 20202010 and
Prior $ 101,098 $ 222,703 $ 331,218 $ 445,770 $ 536,987 2011 2,758 6,647 8,218 9,691 13,098 2012 2,734 5,206 6,461 7,587 8,492 2013 145 191 278 285 301 2014 178 207 284 366 463 2015 — — — — — 2016 — — — — — 2017 — — — — 2018 — — — 2019 — — 2020 —
$ 559,341 Total outstanding liabilities for unpaid losses and LAE, net of reinsurance $ 835,389
Table of Contents
ENSTAR GROUP LIMITEDNOTES TO THE CONSOLIDATED FINANCIAL STATEMENTS — (Continued)
168
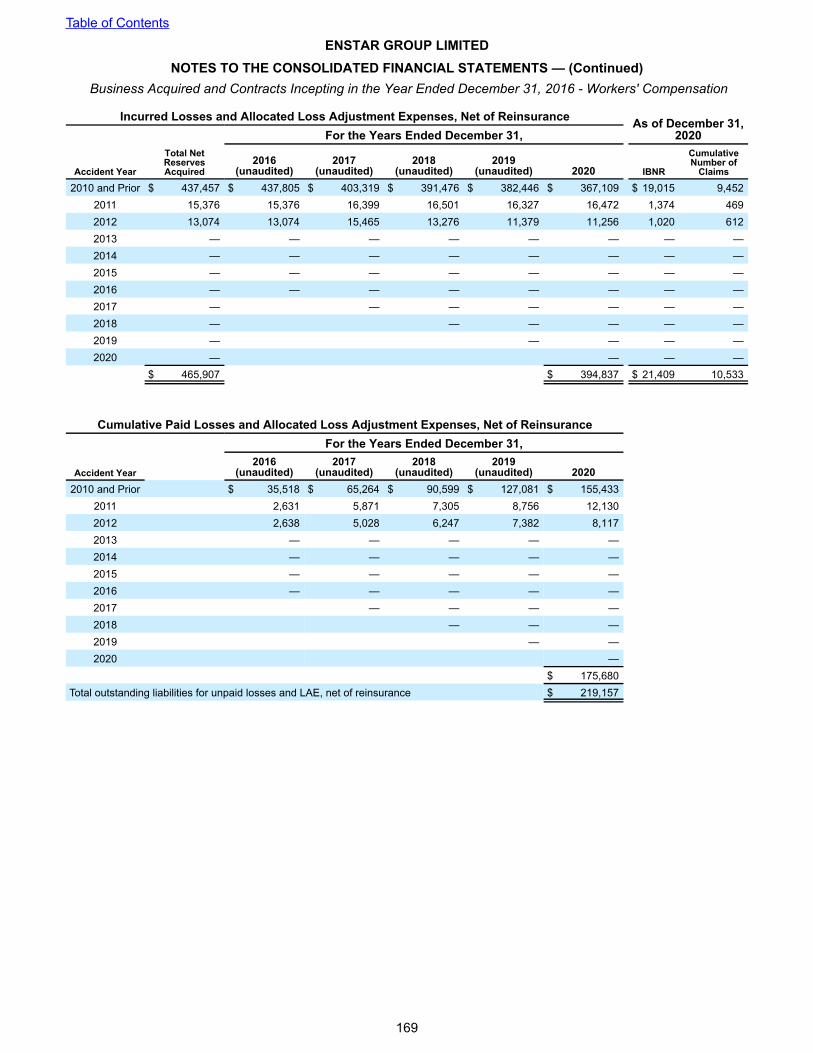
Business Acquired and Contracts Incepting in the Year Ended December 31, 2016 - Workers' Compensation
Incurred Losses and Allocated Loss Adjustment Expenses, Net of Reinsurance As of December 31, 2020For the Years Ended December 31,
Accident Year
Total Net Reserves Acquired
2016 (unaudited)
2017 (unaudited)
2018 (unaudited)
2019 (unaudited) 2020 IBNR
Cumulative Number of
Claims
2010 and Prior $ 437,457 $ 437,805 $ 403,319 $ 391,476 $ 382,446 $ 367,109 $ 19,015 9,452 2011 15,376 15,376 16,399 16,501 16,327 16,472 1,374 469 2012 13,074 13,074 15,465 13,276 11,379 11,256 1,020 612 2013 — — — — — — — — 2014 — — — — — — — — 2015 — — — — — — — — 2016 — — — — — — — — 2017 — — — — — — — 2018 — — — — — — 2019 — — — — — 2020 — — — —
$ 465,907 $ 394,837 $ 21,409 10,533
Cumulative Paid Losses and Allocated Loss Adjustment Expenses, Net of ReinsuranceFor the Years Ended December 31,
Accident Year2016
(unaudited)2017
(unaudited)2018
(unaudited)2019
(unaudited) 20202010 and Prior $ 35,518 $ 65,264 $ 90,599 $ 127,081 $ 155,433
2011 2,631 5,871 7,305 8,756 12,130 2012 2,638 5,028 6,247 7,382 8,117 2013 — — — — — 2014 — — — — — 2015 — — — — — 2016 — — — — — 2017 — — — — 2018 — — — 2019 — — 2020 —
$ 175,680 Total outstanding liabilities for unpaid losses and LAE, net of reinsurance $ 219,157
Table of Contents
ENSTAR GROUP LIMITEDNOTES TO THE CONSOLIDATED FINANCIAL STATEMENTS — (Continued)
169

Business Acquired and Contracts Incepting in the Year Ended December 31, 2017
Incurred Losses and Allocated Loss Adjustment Expenses, Net of ReinsuranceAs of December 31, 2020For the Years Ended December 31,
Accident YearTotal Net Reserves
Acquired2017
(unaudited)2018
(unaudited)2019
(unaudited) 2020 IBNRCumulative
Number of Claims
2010 and Prior $ 1,507,609 $ 1,433,301 $ 1,351,451 $ 1,364,113 $ 1,349,226 $ 749,197 31,566 2011 40,743 29,274 25,389 27,316 26,942 5,834 8 2012 43,653 35,470 31,238 29,456 28,485 3,744 10 2013 35,671 30,338 28,139 24,707 29,829 1,860 11 2014 32,858 20,315 16,984 15,996 16,342 2,287 20 2015 8,808 6,494 7,002 6,295 6,043 234 8 2016 362 (4) 126 919 1,074 394 3 2017 — 174 — — — — 1 2018 — — — — — — 2019 — — — — — 2020 — — — —
$ 1,669,704 $ 1,457,941 $ 763,550 31,627
Cumulative Paid Losses and Allocated Loss Adjustment Expenses, Net of Reinsurance
For the Years Ended December 31,
Accident Year2017
(unaudited)2018
(unaudited)2019
(unaudited) 20202010 and Prior $ 85,514 $ 175,630 $ 257,071 $ 334,586
2011 4,125 9,257 12,971 15,407 2012 10,348 15,372 18,605 21,076 2013 9,509 15,714 21,280 25,832 2014 6,482 8,986 11,559 12,668 2015 1,361 3,720 4,687 5,582 2016 (56) 66 434 536 2017 4 — — — 2018 — — — 2019 — — 2020 —
$ 415,687 Total outstanding liabilities for unpaid losses and LAE, net of reinsurance
$ 1,042,254
Table of Contents
ENSTAR GROUP LIMITEDNOTES TO THE CONSOLIDATED FINANCIAL STATEMENTS — (Continued)
170
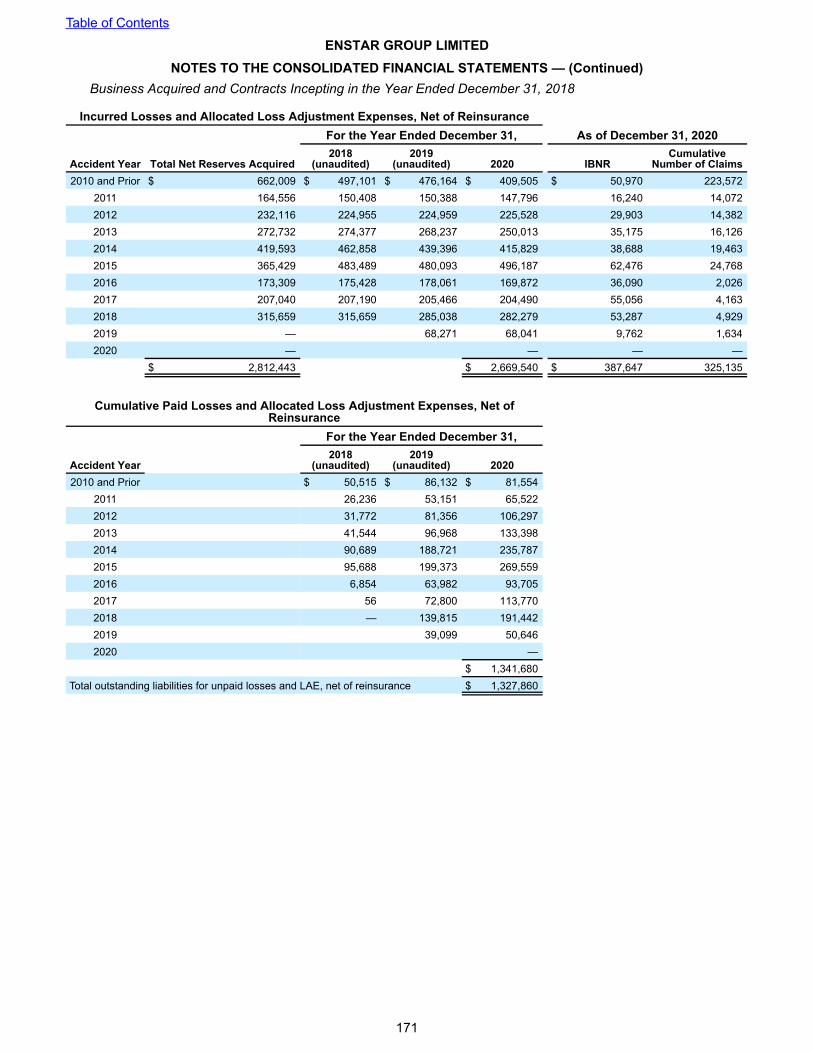
Business Acquired and Contracts Incepting in the Year Ended December 31, 2018
Incurred Losses and Allocated Loss Adjustment Expenses, Net of ReinsuranceAs of December 31, 2020For the Year Ended December 31,
Accident Year Total Net Reserves Acquired2018
(unaudited)2019
(unaudited) 2020 IBNRCumulative
Number of Claims2010 and Prior $ 662,009 $ 497,101 $ 476,164 $ 409,505 $ 50,970 223,572
2011 164,556 150,408 150,388 147,796 16,240 14,072 2012 232,116 224,955 224,959 225,528 29,903 14,382 2013 272,732 274,377 268,237 250,013 35,175 16,126 2014 419,593 462,858 439,396 415,829 38,688 19,463 2015 365,429 483,489 480,093 496,187 62,476 24,768 2016 173,309 175,428 178,061 169,872 36,090 2,026 2017 207,040 207,190 205,466 204,490 55,056 4,163 2018 315,659 315,659 285,038 282,279 53,287 4,929 2019 — 68,271 68,041 9,762 1,634 2020 — — — —
$ 2,812,443 $ 2,669,540 $ 387,647 325,135
Cumulative Paid Losses and Allocated Loss Adjustment Expenses, Net of Reinsurance
For the Year Ended December 31,
Accident Year2018
(unaudited)2019
(unaudited) 20202010 and Prior $ 50,515 $ 86,132 $ 81,554
2011 26,236 53,151 65,522 2012 31,772 81,356 106,297 2013 41,544 96,968 133,398 2014 90,689 188,721 235,787 2015 95,688 199,373 269,559 2016 6,854 63,982 93,705 2017 56 72,800 113,770 2018 — 139,815 191,442 2019 39,099 50,646 2020 —
$ 1,341,680 Total outstanding liabilities for unpaid losses and LAE, net of reinsurance $ 1,327,860
Table of Contents
ENSTAR GROUP LIMITEDNOTES TO THE CONSOLIDATED FINANCIAL STATEMENTS — (Continued)
171

Business Acquired and Contracts Incepting in the Year Ended December 31, 2018 - General Casualty
Incurred Losses and Allocated Loss Adjustment Expenses, Net of ReinsuranceAs of December 31, 2020For the Year Ended December 31,
Accident Year Total Net Reserves Acquired2018
(unaudited)2019
(unaudited) 2020 IBNRCumulative
Number of Claims2010 and Prior $ 130,049 $ 74,102 $ 70,937 $ 67,933 $ 4,827 47,893
2011 18,044 16,554 16,650 15,855 151 1,421 2012 37,454 33,433 29,123 29,760 3,270 1,593 2013 43,301 56,092 46,596 46,999 4,352 1,596 2014 66,562 80,896 74,947 68,535 5,802 2,291 2015 79,191 94,124 104,790 109,694 14,188 3,594 2016 28,825 28,825 36,585 36,684 10,075 253 2017 37,209 37,209 41,664 43,174 14,554 230 2018 39,888 39,888 40,753 39,157 11,605 182 2019 — 6,767 6,187 394 34 2020 — — — —
$ 480,523 $ 463,978 $ 69,218 59,087
Cumulative Paid Losses and Allocated Loss Adjustment Expenses, Net of Reinsurance
For the Year Ended December 31,
Accident Year2018
(unaudited)2019
(unaudited) 20202010 and Prior $ 9,164 $ 18,817 $ 29,840
2011 2,349 7,115 11,018 2012 1,281 11,453 14,383 2013 10,404 19,938 27,717 2014 13,766 27,833 41,899 2015 15,494 31,535 49,860 2016 — 14,109 18,916 2017 — 11,048 21,130 2018 — 8,879 17,455 2019 2,373 3,341 2020 —
$ 235,559 Total outstanding liabilities for unpaid losses and LAE, net of reinsurance $ 228,419
Table of Contents
ENSTAR GROUP LIMITEDNOTES TO THE CONSOLIDATED FINANCIAL STATEMENTS — (Continued)
172

Business Acquired and Contracts Incepting in the Year Ended December 31, 2018 - Workers' Compensation
Incurred Losses and Allocated Loss Adjustment Expenses, Net of ReinsuranceAs of December 31, 2020For the Year Ended December 31,
Accident YearTotal Net Reserves
Acquired2018
(unaudited)2019
(unaudited) 2020 IBNRCumulative
Number of Claims2010 and Prior $ 131,873 $ 122,831 $ 129,280 $ 131,775 $ 39,843 2,098
2011 29,897 28,685 29,981 27,203 9,067 401 2012 28,749 29,181 27,676 26,833 10,597 468 2013 38,029 38,554 38,093 35,212 13,243 869 2014 65,049 66,346 57,163 52,797 17,605 1,345 2015 38,851 39,379 35,235 33,253 13,026 1,464 2016 44,686 44,686 38,945 37,714 15,857 892 2017 52,360 52,360 49,156 45,529 23,004 998 2018 65,075 65,075 60,923 59,768 19,310 886 2019 — 20,889 21,417 4,445 383 2020 — — — —
$ 494,569 $ 471,501 $ 165,997 9,804
Cumulative Paid Losses and Allocated Loss Adjustment Expenses, Net of Reinsurance
For the Year Ended December 31,
Accident Year2018
(unaudited)2019
(unaudited) 20202010 and Prior $ 604 $ 11,788 $ 21,726
2011 2,281 5,592 9,418 2012 516 5,508 7,941 2013 1,525 7,773 12,280 2014 3,260 14,687 21,380 2015 1,403 4,355 9,844 2016 — 3,666 7,176 2017 — 5,900 9,088 2018 — 28,725 34,317 2019 13,483 15,594 2020 —
$ 148,764 Total outstanding liabilities for unpaid losses and LAE, net of reinsurance $ 322,737
Table of Contents
ENSTAR GROUP LIMITEDNOTES TO THE CONSOLIDATED FINANCIAL STATEMENTS — (Continued)
173

Business Acquired and Contracts Incepting in the Year Ended December 31, 2018 - Motor
Incurred Losses and Allocated Loss Adjustment Expenses, Net of ReinsuranceAs of December 31, 2020For the Year Ended December 31,
Accident Year Total Net Reserves Acquired2018
(unaudited)2019
(unaudited) 2020 IBNRCumulative
Number of Claims2010 and Prior $ 43,818 $ 31,489 $ 30,036 $ 33,230 $ 2,599 1,323
2011 48,231 38,092 37,707 36,301 2,031 1,239 2012 65,427 58,006 63,786 59,276 5,862 1,641 2013 78,456 71,276 65,012 55,345 5,744 683 2014 116,677 103,761 90,902 84,459 5,243 1,260 2015 135,855 133,493 132,167 132,165 15,246 1,510 2016 93,164 95,283 97,040 91,600 9,824 732 2017 100,321 100,471 99,135 102,038 16,628 2,797 2018 180,471 180,471 157,556 160,143 21,609 3,731 2019 — 39,757 39,647 4,955 1,200 2020 — — — —
$ 862,420 $ 794,204 $ 89,741 16,116
Cumulative Paid Losses and Allocated Loss Adjustment Expenses, Net of Reinsurance
For the Year Ended December 31,
Accident Year2018
(unaudited)2019
(unaudited) 20202010 and Prior $ 7,460 $ 13,722 $ 16,655
2011 6,060 12,980 15,464 2012 12,380 24,433 31,136 2013 11,114 29,311 35,186 2014 22,393 49,089 60,254 2015 21,712 61,928 84,976 2016 6,854 43,851 65,287 2017 56 48,661 73,440 2018 — 86,861 120,041 2019 22,687 30,968 2020 —
$ 533,407 Total outstanding liabilities for unpaid losses and LAE, net of reinsurance $ 260,797
Table of Contents
ENSTAR GROUP LIMITEDNOTES TO THE CONSOLIDATED FINANCIAL STATEMENTS — (Continued)
174

Business Acquired and Contracts Incepting in the Year Ended December 31, 2018 - Professional Indemnity/Directors & Officers
Incurred Losses and Allocated Loss Adjustment Expenses, Net of ReinsuranceAs of December 31, 2020For the Year Ended December 31,
Accident Year Total Net Reserves Acquired2018
(unaudited)2019
(unaudited) 2020 IBNRCumulative
Number of Claims2010 and Prior $ 236,568 $ 137,394 $ 147,383 $ 143,585 $ (3,639) 56,674
2011 46,512 52,553 48,884 51,600 3,185 3,762 2012 57,937 70,636 69,641 74,884 4,399 3,285 2013 59,457 63,284 78,933 76,291 10,543 3,257 2014 88,173 111,193 107,411 114,621 11,523 3,619 2015 47,337 100,975 81,272 85,394 15,074 3,990 2016 — — — — — — 2017 — — — — — — 2018 — — — — — — 2019 — — — — — 2020 — — — —
$ 535,984 $ 546,375 $ 41,085 74,587
Cumulative Paid Losses and Allocated Loss Adjustment Expenses, Net of Reinsurance
For the Year Ended December 31,
Accident Year2018
(unaudited)2019
(unaudited) 20202010 and Prior $ 29,359 $ 54,157 $ 28,528
2011 13,123 20,017 22,250 2012 16,382 23,237 33,794 2013 10,987 21,919 34,269 2014 22,734 39,601 61,024 2015 14,245 26,595 34,834 2016 — — — 2017 — — — 2018 — — — 2019 — — 2020 —
$ 214,699 Total outstanding liabilities for unpaid losses and LAE, net of reinsurance $ 331,676
Table of Contents
ENSTAR GROUP LIMITEDNOTES TO THE CONSOLIDATED FINANCIAL STATEMENTS — (Continued)
175

Business Acquired and Contracts Incepting in the Year Ended December 31, 2019
Incurred Losses and Allocated Loss Adjustment Expenses, Net of ReinsuranceAs of December 31, 2020For the Year Ended December 31,
Accident Year Total Net Reserves Acquired2019
(unaudited) 2020 IBNRCumulative Number
of Claims
2010 and Prior $ 652,608 $ 630,171 $ 628,495 $ 272,910 74,742
2011 49,873 40,554 35,876 8,773 15,218
2012 73,098 54,301 49,349 12,905 12,329
2013 112,031 93,213 88,066 29,931 14,952
2014 137,324 137,478 127,704 53,814 17,624
2015 179,651 188,833 196,007 80,816 25,081
2016 253,099 295,011 260,473 118,653 32,057
2017 116,386 116,386 116,386 116,386 2
2018 162,744 162,744 162,744 162,744 2
2019 — 54,571 64,595 6,155 1,679
2020 — 27,975 5,483 1,020
$ 1,736,814 $ 1,757,670 $ 868,570 194,706
Cumulative Paid Losses and Allocated Loss Adjustment Expenses, Net of Reinsurance
For the Year Ended December 31,
Accident Year2019
(unaudited) 2020
2010 and Prior $ 26,817 $ 106,195
2011 4,786 8,100
2012 6,886 9,565
2013 13,540 20,906
2014 28,188 47,310
2015 33,417 63,994
2016 56,125 84,592
2017 — —
2018 — —
2019 25,595 55,912
2020 21,661
$ 418,235 Total outstanding liabilities for unpaid losses and LAE, net of reinsurance $ 1,339,435
Table of Contents
ENSTAR GROUP LIMITEDNOTES TO THE CONSOLIDATED FINANCIAL STATEMENTS — (Continued)
176
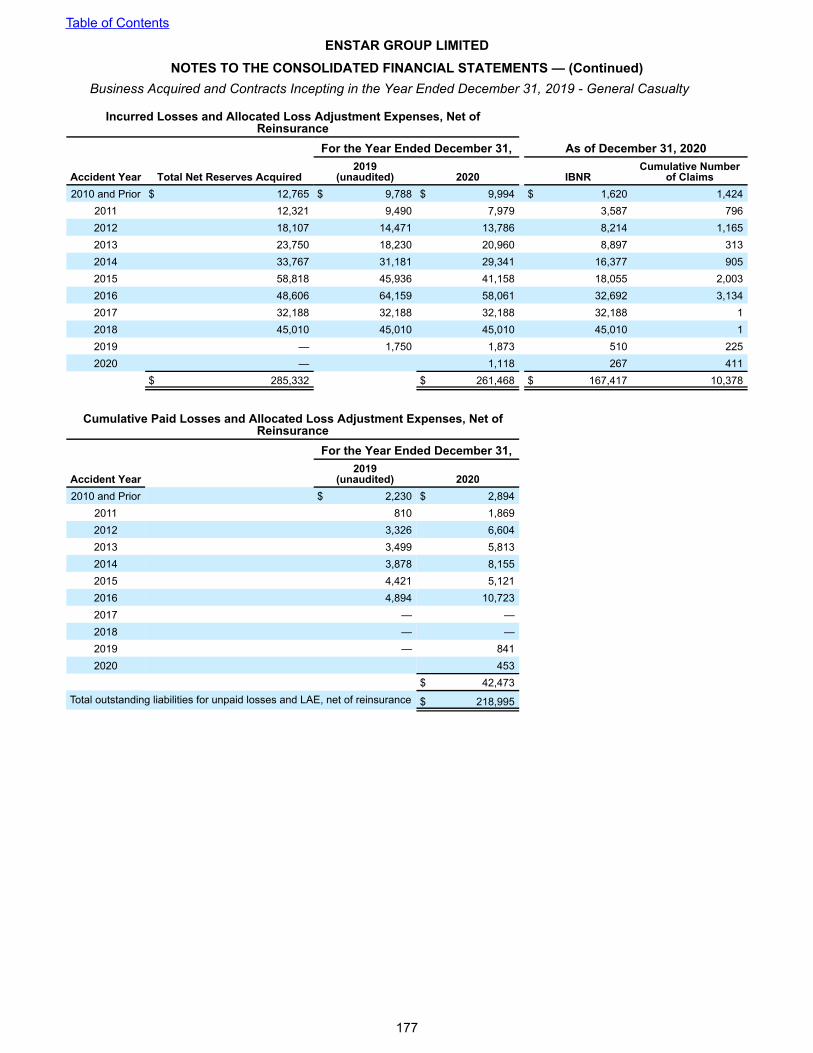
Business Acquired and Contracts Incepting in the Year Ended December 31, 2019 - General Casualty
Incurred Losses and Allocated Loss Adjustment Expenses, Net of Reinsurance
As of December 31, 2020For the Year Ended December 31,
Accident Year Total Net Reserves Acquired2019
(unaudited) 2020 IBNRCumulative Number
of Claims2010 and Prior $ 12,765 $ 9,788 $ 9,994 $ 1,620 1,424
2011 12,321 9,490 7,979 3,587 796 2012 18,107 14,471 13,786 8,214 1,165 2013 23,750 18,230 20,960 8,897 313 2014 33,767 31,181 29,341 16,377 905 2015 58,818 45,936 41,158 18,055 2,003 2016 48,606 64,159 58,061 32,692 3,134 2017 32,188 32,188 32,188 32,188 1 2018 45,010 45,010 45,010 45,010 1 2019 — 1,750 1,873 510 225 2020 — 1,118 267 411
$ 285,332 $ 261,468 $ 167,417 10,378
Cumulative Paid Losses and Allocated Loss Adjustment Expenses, Net of Reinsurance
For the Year Ended December 31,
Accident Year2019
(unaudited) 20202010 and Prior $ 2,230 $ 2,894
2011 810 1,869 2012 3,326 6,604 2013 3,499 5,813 2014 3,878 8,155 2015 4,421 5,121 2016 4,894 10,723 2017 — — 2018 — — 2019 — 841 2020 453
$ 42,473 Total outstanding liabilities for unpaid losses and LAE, net of reinsurance $ 218,995
Table of Contents
ENSTAR GROUP LIMITEDNOTES TO THE CONSOLIDATED FINANCIAL STATEMENTS — (Continued)
177

Business Acquired and Contracts Incepting in the Year Ended December 31, 2019 - Workers' Compensation
Incurred Losses and Allocated Loss Adjustment Expenses, Net of ReinsuranceAs of December 31, 2020For the Year Ended December 31,
Accident Year Total Net Reserves Acquired2019
(unaudited) 2020 IBNRCumulative Number
of Claims
2010 and Prior $ 5,860 $ 4,420 $ 4,551 $ 1,938 9,869
2011 2,474 2,410 2,409 2,342 1,082
2012 6,280 6,176 6,176 6,991 1,640
2013 16,738 18,339 15,980 14,415 2,897
2014 35,023 35,426 35,556 31,501 3,410
2015 57,194 56,171 57,314 48,840 4,802
2016 87,702 85,530 84,862 70,769 4,829
2017 84,197 84,197 84,197 84,197 1
2018 117,734 117,734 117,734 117,734 1
2019 — — — — —
2020 — 2,045 — 189
$ 413,202 $ 410,824 $ 378,727 28,720
Cumulative Paid Losses and Allocated Loss Adjustment Expenses, Net of Reinsurance
For the Year Ended December 31,
Accident Year2019
(unaudited) 2020
2010 and Prior $ 607 $ 696
2011 22 23
2012 22 63
2013 458 572
2014 3,080 3,443
2015 3,549 6,325
2016 7,337 12,137
2017 — —
2018 — —
2019 — —
2020 127
$ 23,386 Total outstanding liabilities for unpaid losses and LAE, net of reinsurance $ 387,438
Table of Contents
ENSTAR GROUP LIMITEDNOTES TO THE CONSOLIDATED FINANCIAL STATEMENTS — (Continued)
178

Business Acquired and Contracts Incepting in the Year Ended December 31, 2020
Incurred Losses and Allocated Loss Adjustment Expenses, Net of Reinsurance
As of December 31, 2020For the Years Ended
December 31,
Accident Year Total Net Reserves Acquired 2020 IBNR
Cumulative Number of
Claims
2010 and Prior $ 256,228 $ 169,601 $ 91,688 47
2011 26,488 26,983 25,162 36
2012 58,128 58,241 53,749 74
2013 68,683 63,922 47,944 140
2014 100,054 102,600 83,249 201
2015 161,383 161,352 113,476 384
2016 210,661 205,305 120,481 816
2017 316,751 342,330 168,832 1,770
2018 432,590 575,706 305,471 3,108
2019 344,495 343,168 301,463 1,351
2020 166,946 168,091 144,090 1,481
$ 2,142,407 $ 2,217,299 $ 1,455,605 9,408
Cumulative Paid Losses and Allocated Loss Adjustment Expenses, Net of ReinsuranceFor the Years Ended
December 31,
Accident Year 2020
2010 and Prior $ 2,310
2011 54
2012 601
2013 4,283
2014 5,975
2015 12,253
2016 33,985
2017 73,001
2018 111,871
2019 1,509
2020 7,695
253,537 Total outstanding liabilities for unpaid losses and LAE, net of reinsurance $ 1,963,762
Table of Contents
ENSTAR GROUP LIMITEDNOTES TO THE CONSOLIDATED FINANCIAL STATEMENTS — (Continued)
179

Business Acquired and Contracts Incepting in the Year Ended December 31, 2020 - General Casualty
Incurred Losses and Allocated Loss Adjustment Expenses, Net of Reinsurance
As of December 31, 2020For the Years Ended
December 31,
Accident Year Total Net Reserves Acquired 2020 IBNR
Cumulative Number of
Claims
2010 and Prior $ 43,511 $ 43,849 $ 36,455 36
2011 26,434 26,928 25,133 29
2012 55,478 55,591 51,130 60
2013 60,872 56,111 41,186 122
2014 87,620 90,182 71,022 185
2015 140,583 139,947 96,032 280
2016 142,395 143,156 100,293 394
2017 142,862 137,097 112,135 439
2018 141,803 138,267 133,942 316
2019 202,521 201,174 179,284 388
2020 83,021 82,598 77,737 338
$ 1,127,100 $ 1,114,900 $ 924,349 2,587
Cumulative Paid Losses and Allocated Loss Adjustment Expenses, Net of ReinsuranceFor the Years Ended
December 31,
Accident Year 2020
2010 and Prior $ 522
2011 54
2012 601
2013 3,258
2014 5,983
2015 10,230
2016 9,125
2017 4,149
2018 400
2019 203
2020 2,467
36,992 Total outstanding liabilities for unpaid losses and LAE, net of reinsurance $ 1,077,908
Table of Contents
ENSTAR GROUP LIMITEDNOTES TO THE CONSOLIDATED FINANCIAL STATEMENTS — (Continued)
180

Business Acquired and Contracts Incepting in the Year Ended December 31, 2020 - Motor
Incurred Losses and Allocated Loss Adjustment Expenses, Net of Reinsurance
As of December 31, 2020For the Years Ended December 31,
Accident Year Total Net Reserves Acquired 2020 IBNRCumulative
Number of Claims
2010 and Prior $ — $ — $ — —
2011 — — — —
2012 — — — —
2013 — — — —
2014 — — — —
2015 2,397 3,018 603 19
2016 48,505 42,420 2,779 221
2017 154,070 185,445 38,279 1,099
2018 250,028 397,413 145,623 2,204
2019 — — — —
2020 — — — —
$ 455,000 $ 628,296 $ 187,284 3,543
Cumulative Paid Losses and Allocated Loss Adjustment Expenses, Net of Reinsurance
For the Years Ended December 31,
Accident Year 2020
2010 and Prior $ —
2011 —
2012 —
2013 —
2014 —
2015 2,012
2016 24,804
2017 68,712
2018 110,447
2019 —
2020 —
205,975 Total outstanding liabilities for unpaid losses and LAE, net of reinsurance $ 422,321
Table of Contents
ENSTAR GROUP LIMITEDNOTES TO THE CONSOLIDATED FINANCIAL STATEMENTS — (Continued)
181

Business Acquired and Contracts Incepting in the Year Ended December 31, 2020 - Professional Indemnity/Directors & Officers
Incurred Losses and Allocated Loss Adjustment Expenses, Net of Reinsurance
As of December 31, 2020For the Years Ended December 31,
Accident Year Total Net Reserves Acquired 2020 IBNRCumulative
Number of Claims
2010 and Prior $ 4,680 $ 4,678 $ 4,679 1
2011 44 44 44 3
2012 2,593 2,593 2,584 4
2013 7,791 7,791 6,745 6
2014 11,949 11,949 11,947 4
2015 16,120 16,120 15,769 4
2016 16,259 16,216 16,053 9
2017 17,212 17,206 16,906 41
2018 25,323 25,290 19,209 115
2019 99,460 99,350 92,944 135
2020 34,548 34,757 30,144 79
$ 235,979 $ 235,994 $ 217,024 401
Cumulative Paid Losses and Allocated Loss Adjustment Expenses, Net of Reinsurance
For the Years Ended December 31,
Accident Year 2020
2010 and Prior $ —
2011 —
2012 —
2013 1,025
2014 —
2015 6
2016 1
2017 5
2018 475
2019 410
2020 1,138
3,060 Total outstanding liabilities for unpaid losses and LAE, net of reinsurance $ 232,934
Table of Contents
ENSTAR GROUP LIMITEDNOTES TO THE CONSOLIDATED FINANCIAL STATEMENTS — (Continued)
182

Annual Historical Duration of Claims
The following is unaudited supplementary information, which presents the annual percentage payout since the year of acquisition, by year of acquisition and significant line of business within each acquisition year:
Annual Percentage Payout of Incurred Losses since Year of Acquisition, Net of ReinsuranceYear of Acquisition Year 1 Year 2 Year 3 Year 4 Year 5 Year 6 Year 7 Year 8 Year 9 Year 102011 - All lines of business 25.68 % 17.45 % (3.59) % (28.95) % (2.12) % 3.57 % (3.49) % 4.99 % 11.18 % 8.86 %2012 - All lines of business 1.30 % 26.42 % 16.71 % 12.48 % 10.00 % 4.47 % 5.48 % 4.17 % 2.12 %2013 - All lines of business 25.96 % 21.67 % 15.93 % 11.01 % 6.15 % 3.89 % 2.24 % 0.32 %2014 - All lines of business 33.84 % 24.15 % 11.11 % 8.07 % 3.74 % 1.65 % 1.10 %2015 - All lines of business 17.33 % 17.09 % 12.84 % 9.80 % 7.69 % 4.65 %
2015 - Workers' compensation 13.72 % 17.09 % 12.73 % 9.73 % 6.71 % 4.27 %2016 - All lines of business 7.67 % 9.18 % 7.99 % 8.41 % 6.86 %
2016 - Workers' Compensation 10.33 % 8.96 % 7.09 % 9.89 % 8.22 %2017 - All lines of business 8.04 % 7.64 % 6.71 % 6.11 %2018 - All lines of business 12.86 % 25.40 % 12.00 %
2018 - General Casualty 11.31 % 21.69 % 17.77 %2018 - Workers' Compensation 2.03 % 19.49 % 10.03 %2018 - Professional Indemnity/Directors & Officers 19.55 % 14.40 % 5.34 %2018 - Motor 11.08 % 38.47 % 17.61 %
2019 - All lines of business 11.11 % 12.68 %2019 - General Casualty 8.82 % 7.43 %2019 - Workers' Compensation 3.67 % 2.02 %
2020 - All lines of business 11.43 %
2020 - General Casualty 3.32 %
2020 - Motor 32.78 %2020 - Professional Indemnity/Directors & Officers 1.30 %
The negative payout percentages in the table above for years 3, 4, 5, and 7 within the 2011 year of acquisition were primarily due to ceded paid losses exceeding the assumed paid losses as a result of commutations completed with several reinsurers covering the exposures assumed by one of our reinsurance subsidiaries that we acquired in 2011. For the specific years referenced above, we collected more paid recoveries from our reinsurers than the losses we paid on the assumed exposures, and as such, the calculated annual payout percentages were negative.
Table of Contents
ENSTAR GROUP LIMITEDNOTES TO THE CONSOLIDATED FINANCIAL STATEMENTS — (Continued)
183

Atrium (Classified as held-for-sale as of December 31, 2020)The table below provides a reconciliation of the beginning and ending liability for losses and LAE for the years
ended December 31, 2020, 2019 and 2018:
2020 2019 2018Balance as of January 1 $ 231,672 $ 241,284 $ 240,873 Less: reinsurance reserves recoverable 28,816 38,768 40,531 Less: cumulative effect of change in accounting principal on allowance for estimated uncollectible reinsurance (1) 851 — — Net balance as of January 1 202,005 202,516 200,342 Net incurred losses and LAE: Current period 93,471 85,027 83,627 Prior periods (6,245) (7,751) (13,817) Total net incurred losses and LAE 87,226 77,276 69,810 Net paid losses: Current period (33,724) (34,617) (35,537) Prior periods (40,196) (43,572) (28,969) Total net paid losses (73,920) (78,189) (64,506) Effect of exchange rate movement 1,497 1,253 (3,130) Reclassification to assets and liabilities held-for-sale (216,808) — — Net balance as of December 31 — 202,856 202,516 Plus: reinsurance reserves recoverable (2) — 28,816 38,768 Balance as of December 31 $ — $ 231,672 $ 241,284
(1) The Company adopted ASU 2016-13 and the related amendments on January 1, 2020. Refer to Note 2 - "Significant Accounting Policies" for further details.
(2) Net of allowance for estimated uncollectible reinsurance.Net incurred losses and LAE in the Atrium segment for the years ended December 31, 2020, December 31,
2019 and 2018 were as follows:
2020 2019 2018
Prior
PeriodCurrentPeriod Total
PriorPeriod
CurrentPeriod Total
PriorPeriod
CurrentPeriod Total
Net losses paid $ 40,196 $ 33,724 $ 73,920 $ 43,572 $ 34,617 $ 78,189 $ 28,969 $ 35,537 $ 64,506 Net change in case and LAE reserves(1) (14,145) 21,390 7,245 (13,278) 16,812 3,534 (10,161) 16,492 6,331 Net change in IBNR reserves(2) (31,773) 38,434 6,661 (38,380) 33,598 (4,782) (27,507) 31,598 4,091 Increase (reduction) in estimates of net ultimate losses (5,722) 93,548 87,826 (8,086) 85,027 76,941 (8,699) 83,627 74,928 Increase (reduction) in provisions for unallocated LAE (3) 48 (77) (29) — — — — — — Amortization of fair value adjustments (4) (571) — (571) 335 — 335 (5,118) — (5,118) Net incurred losses and LAE $ (6,245) $ 93,471 $ 87,226 $ (7,751) $ 85,027 $ 77,276 $ (13,817) $ 83,627 $ 69,810
(1) Comprises the movement during the year in specific case reserve liabilities as a result of claims settlements or changes advised to us by our policyholders and attorneys, less changes in case reserves recoverable advised by us to our reinsurers as a result of the settlement or movement of assumed claims.
(2) Represents the gross change in our actuarial estimates of IBNR, less amounts recoverable. (3) Represents the change in the estimate of the total future costs to administer the claims.(4) Relates to the amortization of fair value adjustments associated with the acquisition of companies.
The increase in net incurred losses and LAE of $10.0 million in 2020 was primarily driven by $18.4 million of losses related to the COVID-19 pandemic, primarily from accident and health business, partially offset by overall improved loss experience, within other lines of business and lower catastrophe activity on the business we write.
Table of Contents
ENSTAR GROUP LIMITEDNOTES TO THE CONSOLIDATED FINANCIAL STATEMENTS — (Continued)
184

The following table provides a breakdown of the gross and net losses and LAE reserves by line of business and the fair value adjustments recorded on the acquired gross and net losses and LAE reserves and ULAE as of December 31, 2019 for the Atrium segment. The breakdown as of December 31, 2020 has not been disclosed below since we have classified the Atrium segment as held-for-sale as discussed in Note 5 - "Divestitures, Held-for-Sale Businesses and Discontinued Operations."
2019Gross Net
OLR IBNR Total OLR IBNR Total(in thousands of U.S. dollars)
Marine, Aviation and Transit $ 24,668 $ 34,156 $ 58,824 $ 21,012 $ 24,829 $ 45,841 Binding Authorities 31,507 54,039 85,546 29,590 51,984 81,574 Reinsurance 18,385 29,533 47,918 16,209 23,338 39,547 Accident and Health 5,460 7,880 13,340 4,735 7,469 12,204 Non-Marine Direct and Facultative 9,121 10,935 20,056 8,584 9,637 18,221 Total $ 89,141 $ 136,543 $ 225,684 $ 80,130 $ 117,257 $ 197,387 Fair value adjustments 3,700 3,181 ULAE 2,288 2,288 Total $ 231,672 $ 202,856
StarStone The table below provides a reconciliation of the beginning and ending liability for losses and LAE for the years
ended December 31, 2020, 2019 and 2018:
2020 2019 2018Balance as of January 1 $ 1,318,294 $ 1,247,989 $ 910,143 Less: reinsurance reserves recoverable 355,194 303,381 275,012 Less: cumulative effect of change in accounting principal on allowance for estimated uncollectible reinsurance (1) 495 — — Net balance as of January 1 962,605 944,608 635,131 Net incurred losses and LAE: Current period 263,562 354,884 422,191 Prior periods 3,176 114,356 120,889 Total net incurred losses and LAE 266,738 469,240 543,080 Net paid losses: Current period (26,831) (75,458) (137,390) Prior periods (300,037) (375,377) (289,981) Total net paid losses (326,868) (450,835) (427,371) Effect of exchange rate movement 23,421 87 (9,481) Acquired on purchase of subsidiaries — — 192,981 Assumed business — — 10,268 Ceded business — — — Net balance as of December 31 925,896 963,100 944,608 Plus: reinsurance reserves recoverable (2) 402,060 355,194 303,381 Balance as of December 31 $ 1,327,956 $ 1,318,294 $ 1,247,989
(1) The Company adopted ASU 2016-13 and the related amendments on January 1, 2020. Refer to Note 2 - "Significant Accounting Policies" for further details.
(2) Net of allowance for estimated uncollectible reinsurance.
Table of Contents
ENSTAR GROUP LIMITEDNOTES TO THE CONSOLIDATED FINANCIAL STATEMENTS — (Continued)
185
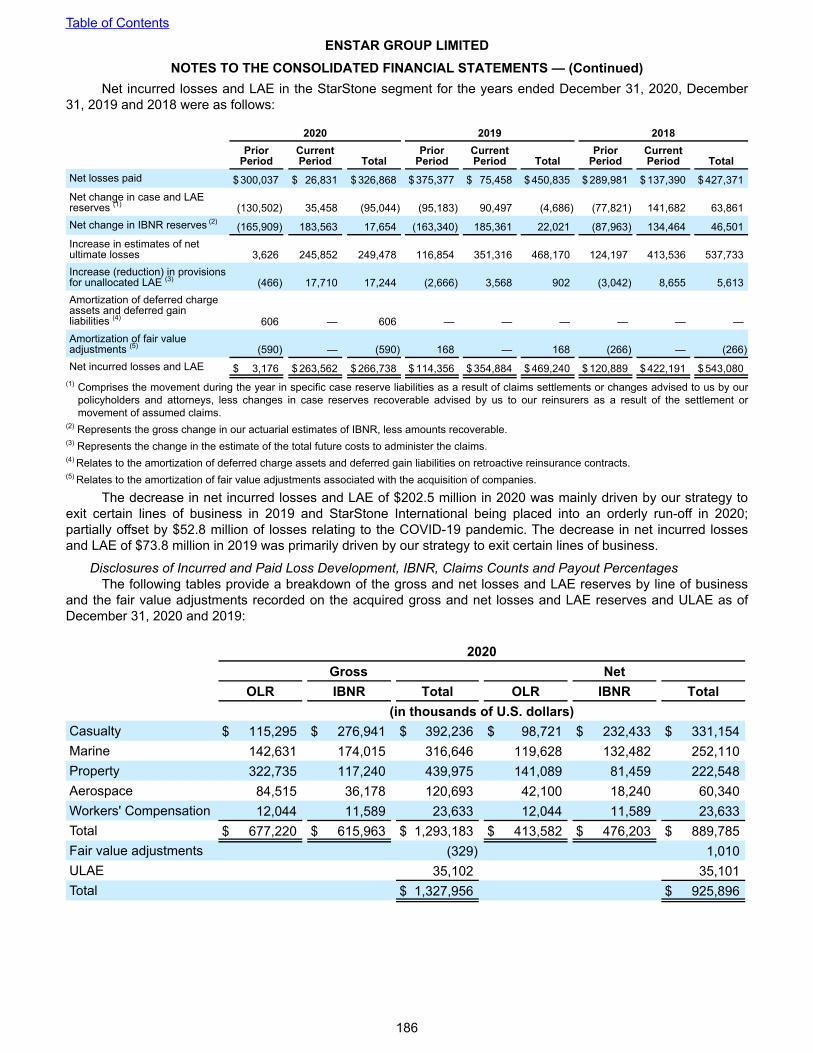
Net incurred losses and LAE in the StarStone segment for the years ended December 31, 2020, December 31, 2019 and 2018 were as follows:
2020 2019 2018
Prior
PeriodCurrentPeriod Total
PriorPeriod
CurrentPeriod Total
PriorPeriod
CurrentPeriod Total
Net losses paid $ 300,037 $ 26,831 $ 326,868 $ 375,377 $ 75,458 $ 450,835 $ 289,981 $ 137,390 $ 427,371 Net change in case and LAE reserves (1) (130,502) 35,458 (95,044) (95,183) 90,497 (4,686) (77,821) 141,682 63,861 Net change in IBNR reserves (2) (165,909) 183,563 17,654 (163,340) 185,361 22,021 (87,963) 134,464 46,501 Increase in estimates of net ultimate losses 3,626 245,852 249,478 116,854 351,316 468,170 124,197 413,536 537,733 Increase (reduction) in provisions for unallocated LAE (3) (466) 17,710 17,244 (2,666) 3,568 902 (3,042) 8,655 5,613 Amortization of deferred charge assets and deferred gain liabilities (4) 606 — 606 — — — — — — Amortization of fair value adjustments (5) (590) — (590) 168 — 168 (266) — (266) Net incurred losses and LAE $ 3,176 $ 263,562 $ 266,738 $ 114,356 $ 354,884 $ 469,240 $ 120,889 $ 422,191 $ 543,080
(1) Comprises the movement during the year in specific case reserve liabilities as a result of claims settlements or changes advised to us by our policyholders and attorneys, less changes in case reserves recoverable advised by us to our reinsurers as a result of the settlement or movement of assumed claims.
(2) Represents the gross change in our actuarial estimates of IBNR, less amounts recoverable.(3) Represents the change in the estimate of the total future costs to administer the claims.(4) Relates to the amortization of deferred charge assets and deferred gain liabilities on retroactive reinsurance contracts. (5) Relates to the amortization of fair value adjustments associated with the acquisition of companies.
The decrease in net incurred losses and LAE of $202.5 million in 2020 was mainly driven by our strategy to exit certain lines of business in 2019 and StarStone International being placed into an orderly run-off in 2020; partially offset by $52.8 million of losses relating to the COVID-19 pandemic. The decrease in net incurred losses and LAE of $73.8 million in 2019 was primarily driven by our strategy to exit certain lines of business.
Disclosures of Incurred and Paid Loss Development, IBNR, Claims Counts and Payout Percentages The following tables provide a breakdown of the gross and net losses and LAE reserves by line of business
and the fair value adjustments recorded on the acquired gross and net losses and LAE reserves and ULAE as of December 31, 2020 and 2019:
2020Gross Net
OLR IBNR Total OLR IBNR Total (in thousands of U.S. dollars)Casualty $ 115,295 $ 276,941 $ 392,236 $ 98,721 $ 232,433 $ 331,154 Marine 142,631 174,015 316,646 119,628 132,482 252,110 Property 322,735 117,240 439,975 141,089 81,459 222,548 Aerospace 84,515 36,178 120,693 42,100 18,240 60,340 Workers' Compensation 12,044 11,589 23,633 12,044 11,589 23,633 Total $ 677,220 $ 615,963 $ 1,293,183 $ 413,582 $ 476,203 $ 889,785 Fair value adjustments (329) 1,010 ULAE 35,102 35,101 Total $ 1,327,956 $ 925,896
Table of Contents
ENSTAR GROUP LIMITEDNOTES TO THE CONSOLIDATED FINANCIAL STATEMENTS — (Continued)
186

2019Gross Net
OLR IBNR Total OLR IBNR Total(in thousands of U.S. dollars)
Casualty $ 121,945 $ 210,969 $ 332,914 $ 108,543 $ 204,800 $ 313,343 Marine 189,355 161,379 350,734 158,252 128,242 286,494 Property 341,677 131,596 473,273 150,559 87,653 238,212 Aerospace 75,764 32,325 108,089 47,256 22,389 69,645 Workers' Compensation 15,089 19,865 34,954 15,089 19,865 34,954 Total $ 743,830 $ 556,134 $ 1,299,964 $ 479,699 $ 462,949 $ 942,648 Fair value adjustments (522) 1,600 ULAE 18,852 18,852 Total $ 1,318,294 $ 963,100
The following tables set forth information about incurred and paid loss development, total IBNR reserves and cumulative loss frequency related to all the individual lines of business within the StarStone segment as of December 31, 2020. The information related to incurred and paid loss development for the years ended December 31, 2014 through 2019 is presented as supplementary information and is therefore unaudited. The information within the tables below is presented on a prospective basis from the date of our acquisition of StarStone on April 1, 2014 since providing pre-acquisition incurred and paid losses by accident year for years prior to 2014 was determined to be impracticable due to significant data limitations. Following our sale of StarStone U.S. to Core Specialty, which was completed on November 30, 2020, the incurred and paid loss development tables presented below for all of the individual lines of business within the StarStone segment have been restated to exclude the historical incurred and paid loss development related to StarStone U.S.
Table of Contents
ENSTAR GROUP LIMITEDNOTES TO THE CONSOLIDATED FINANCIAL STATEMENTS — (Continued)
187

Casualty
Incurred Losses and Allocated Loss Adjustment Expenses, Net of Reinsurance As of December 31, 2020For The Years Ended December 31,
Accident Year
2014 (unaudited)
2015 (unaudited)
2016 (unaudited)
2017 (unaudited)
2018 (unaudited)
2019 (unaudited) 2020 IBNR(1)
Cumulative Number of
Claims2010 and
Prior $ 100,449 $ 101,217 $ 101,444 $ 101,801 $ 102,539 $ 102,317 $ 102,661 $ 19 4,3222011 16,244 18,740 19,681 19,103 27,703 27,859 28,027 429 2,9622012 39,797 33,853 30,788 28,482 33,511 36,159 37,072 3,418 3,5212013 51,458 47,304 54,282 53,493 56,145 63,323 67,638 9,044 4,8212014 66,094 67,141 67,461 66,559 66,585 75,513 72,097 10,495 4,8632015 76,470 82,050 81,685 92,904 99,425 101,191 13,037 4,3232016 92,406 95,726 111,020 135,670 128,139 25,293 3,8252017 100,585 135,743 161,288 166,472 34,822 3,8992018 87,781 101,381 106,014 39,329 2,9292019 42,595 59,902 23,758 2,5812020 98,738 72,789 1,582
Total $ 967,951 $ 232,433 39,628 (1) Total of IBNR plus expected development on reported losses.
Cumulative Paid Losses and Allocated Loss Adjustment Expenses, Net of ReinsuranceFor The Years Ended December 31,
Accident Year
2014 (unaudited)
2015 (unaudited)
2016 (unaudited)
2017 (unaudited)
2018 (unaudited)
2019 (unaudited) 2020
2010 and Prior $ 99,643 $ 101,181 $ 101,326 $ 101,712 $ 101,783 $ 101,813 $ 101,886 2011 12,394 15,941 18,354 18,760 27,385 27,401 27,426 2012 13,336 20,634 22,746 23,711 32,644 32,666 32,706 2013 16,373 22,131 35,799 38,866 42,123 48,898 52,333 2014 4,318 16,141 27,043 36,802 46,654 49,571 51,949 2015 6,439 21,503 36,971 50,598 69,948 75,875 2016 4,206 32,864 59,074 76,175 92,223 2017 7,712 41,896 87,902 114,062 2018 18,747 34,762 54,000 2019 4,721 26,235 2020 8,102
Total $ 636,797 Total outstanding liabilities for unpaid losses and LAE, net of reinsurance $ 331,154
Table of Contents
ENSTAR GROUP LIMITEDNOTES TO THE CONSOLIDATED FINANCIAL STATEMENTS — (Continued)
188

The reconciliation of incurred and paid loss development to the liability for unpaid losses and LAE as presented in the tables above for the year ended December 31, 2020 is set forth below:
2020Liabilities for unpaid losses and allocated LAE, net of reinsurance $ 331,154 Reinsurance recoverable on unpaid losses 61,082 Gross liability for unpaid losses and LAE before unallocated loss adjustment expenses and fair value adjustments $ 392,236
The following is unaudited supplementary information for average annual historical duration of claims:
Average Annual Percentage Payout of Incurred Losses by Age, Net of ReinsuranceYear 1 Year 2 Year 3 Year 4 Year 5 Year 6 Year 7 Year 8 Year 9 Year 10
Casualty 7.72 % 20.87 % 17.53 % 15.99 % 9.96 % 4.35 % 7.85 % 9.00 % 0.06 % 0.08 %
Table of Contents
ENSTAR GROUP LIMITEDNOTES TO THE CONSOLIDATED FINANCIAL STATEMENTS — (Continued)
189

Marine
Incurred Losses and Allocated Loss Adjustment Expenses, Net of Reinsurance As of December 31, 2020For The Years Ended December 31,
Accident Year
2014 (unaudited)
2015 (unaudited)
2016 (unaudited)
2017 (unaudited)
2018 (unaudited)
2019 (unaudited) 2020 IBNR(1)
Cumulative Number of
Claims
2010 and Prior $ 50,395 $ 47,336 $ 47,194 $ 47,287 $ 47,175 $ 47,213 $ 46,828 $ 62 3,037
2011 29,890 28,190 27,767 27,824 28,162 27,956 28,075 229 1,966
2012 48,204 52,010 51,710 50,435 51,231 49,176 48,706 307 2,431
2013 63,442 55,981 53,783 54,790 58,209 64,399 63,323 926 2,202
2014 50,959 54,370 49,449 56,049 51,642 51,062 49,676 1,003 3,944
2015 70,492 70,160 80,196 81,864 83,646 80,438 1,612 5,606
2016 80,830 83,187 88,459 88,023 89,309 4,150 6,658
2017 125,976 158,450 166,304 162,629 7,959 8,352
2018 164,461 164,042 161,831 16,444 10,123
2019 152,423 158,919 39,463 7,015
2020 84,427 60,327 2,703
Total $ 974,161 $ 132,482 54,037(1) Total of IBNR plus expected development on reported losses.
Cumulative Paid Losses and Allocated Loss Adjustment Expenses, Net of ReinsuranceFor The Years Ended December 31,
Accident Year
2014 (unaudited)
2015 (unaudited)
2016 (unaudited)
2017 (unaudited)
2018 (unaudited)
2019 (unaudited) 2020
2010 and Prior $ 44,212 $ 46,360 $ 46,464 $ 46,470 $ 46,563 $ 46,682 $ 46,709
2011 24,599 25,686 26,688 26,942 27,057 27,082 27,285
2012 38,570 42,787 44,681 45,498 45,951 46,178 47,452
2013 29,436 38,880 43,027 45,575 47,698 57,539 62,037
2014 11,037 25,306 33,076 37,594 43,323 44,727 44,740
2015 10,234 30,143 50,376 56,557 59,918 62,401
2016 11,669 41,875 58,438 73,778 76,534
2017 23,986 68,233 107,787 125,335
2018 40,698 103,930 129,632
2019 33,196 84,414
2020 15,512
Total $ 722,051
Total outstanding liabilities for unpaid losses and LAE, net of reinsurance $ 252,110
Table of Contents
ENSTAR GROUP LIMITEDNOTES TO THE CONSOLIDATED FINANCIAL STATEMENTS — (Continued)
190

The reconciliation of incurred and paid loss development to the liability for unpaid losses and LAE as presented in the tables above for the year ended December 31, 2020 is set forth below:
2020Liabilities for unpaid losses and allocated LAE, net of reinsurance $ 252,110 Reinsurance recoverable on unpaid losses 64,536 Gross liability for unpaid losses and LAE before unallocated loss adjustment expenses and fair value adjustments $ 316,646
The following is unaudited supplementary information for average annual historical duration of claims:
Average Annual Percentage Payout of Incurred Losses by Age, Net of ReinsuranceYear 1 Year 2 Year 3 Year 4 Year 5 Year 6 Year 7 Year 8 Year 9 Year 10
Marine 18.17 % 30.97 % 19.08 % 9.99 % 5.02 % 2.46 % 3.48 % 2.04 % 0.99 % 0.39 %
Table of Contents
ENSTAR GROUP LIMITEDNOTES TO THE CONSOLIDATED FINANCIAL STATEMENTS — (Continued)
191

Property
Incurred Losses and Allocated Loss Adjustment Expenses, Net of Reinsurance As of December 31, 2020For The Years Ended December 31,
Accident Year
2014 (unaudited)
2015 (unaudited)
2016 (unaudited)
2017 (unaudited)
2018 (unaudited)
2019 (unaudited) 2020 IBNR(1)
Cumulative Number of
Claims
2010 and Prior $ 190,649 $ 188,537 $ 187,286 $ 187,846 $ 188,778 $ 189,079 $ 190,667 $ 13 4,485
2011 91,712 90,272 90,328 90,018 89,918 90,259 90,406 88 1,635
2012 66,137 62,119 61,243 62,177 59,201 59,463 58,247 133 1,516
2013 78,501 65,608 65,394 64,521 62,711 61,114 61,383 152 1,955
2014 59,390 44,130 43,631 44,081 41,968 41,226 40,612 794 2,125
2015 75,514 73,946 67,944 67,733 68,678 69,314 1,377 11,435
2016 83,622 91,680 92,038 91,956 94,450 1,361 14,167
2017 152,172 169,673 181,855 171,673 4,429 14,553
2018 161,507 172,640 174,137 11,123 11,891
2019 116,634 117,009 22,609 6,166
2020 71,147 39,380 1,338
Total $ 1,139,045 $ 81,459 71,266(1) Total of IBNR plus expected development on reported losses.
Cumulative Paid Losses and Allocated Loss Adjustment Expenses, Net of ReinsuranceFor The Years Ended December 31,
Accident Year
2014 (unaudited)
2015 (unaudited)
2016 (unaudited)
2017 (unaudited)
2018 (unaudited)
2019 (unaudited) 2020
2010 and Prior $ 183,649 $ 186,876 $ 187,040 $ 187,264 $ 187,285 $ 187,300 $ 188,080
2011 87,937 89,149 89,662 89,894 89,894 89,940 90,110
2012 48,322 52,442 54,681 55,672 55,895 58,099 58,100
2013 31,000 46,556 51,431 53,548 59,756 60,916 61,060
2014 5,517 18,945 31,854 34,869 36,461 37,609 39,681
2015 8,756 25,890 52,799 61,347 62,237 62,826
2016 23,803 54,188 72,244 81,904 83,577
2017 34,961 96,151 137,569 146,340
2018 60,944 93,275 126,763
2019 19,461 52,637
2020 7,323
Total $ 916,497
Total outstanding liabilities for unpaid losses and LAE, net of reinsurance $ 222,548
Table of Contents
ENSTAR GROUP LIMITEDNOTES TO THE CONSOLIDATED FINANCIAL STATEMENTS — (Continued)
192

The reconciliation of incurred and paid loss development to the liability for unpaid losses and LAE as presented in the tables above for the year ended December 31, 2020 is set forth below:
2020Liabilities for unpaid losses and allocated LAE, net of reinsurance $ 222,548 Reinsurance recoverable on unpaid losses 217,427 Gross liability for unpaid losses and LAE before unallocated loss adjustment expenses and fair value adjustments $ 439,975 The following is unaudited supplementary information for average annual historical duration of claims:
Average Annual Percentage Payout of Incurred Losses by Age, Net of ReinsuranceYear 1 Year 2 Year 3 Year 4 Year 5 Year 6 Year 7 Year 8 Year 9 Year 10
Property 19.10 % 28.75 % 26.40 % 8.35 % 2.47 % 2.69 % 1.55 % 1.01 % 0.02 % 0.30 %
Table of Contents
ENSTAR GROUP LIMITEDNOTES TO THE CONSOLIDATED FINANCIAL STATEMENTS — (Continued)
193

Aerospace
Incurred Losses and Allocated Loss Adjustment Expenses, Net of Reinsurance As of December 31, 2020For The Years Ended December 31,
Accident Year
2014 (unaudited)
2015 (unaudited)
2016 (unaudited)
2017 (unaudited)
2018 (unaudited)
2019 (unaudited) 2020 IBNR(1)
Cumulative Number of
Claims
2010 and Prior $ 18,439 $ 18,083 $ 18,393 $ 18,906 $ 18,962 $ 18,759 $ 18,693 $ 36 622
2011 58,748 57,226 57,653 58,084 59,578 58,677 58,299 96 2,179
2012 55,293 55,087 55,870 55,823 57,044 56,771 56,907 186 2,375
2013 71,930 69,976 70,255 74,733 77,222 76,774 78,673 297 2,538
2014 65,227 53,457 53,533 52,471 54,534 48,757 45,978 485 2,867
2015 64,550 67,846 70,903 71,624 69,612 69,879 1,070 2,962
2016 35,923 43,371 46,832 43,991 42,954 1,463 2,925
2017 28,816 33,623 54,980 52,590 2,193 3,381
2018 58,573 54,969 54,831 3,491 3,390
2019 45,401 45,784 5,148 2,028
2020 8,732 3,775 357
Total $ 533,320 $ 18,240 25,624 (1) Total of IBNR plus expected development on reported losses
Cumulative Paid Losses and Allocated Loss Adjustment Expenses, Net of ReinsuranceFor The Years Ended December 31,
Accident Year
2014(unaudited)
2015 (unaudited)
2016 (unaudited)
2017 (unaudited)
2018 (unaudited)
2019 (unaudited) 2020
2010 and Prior $ 15,391 $ 16,530 $ 17,141 $ 18,209 $ 18,480 $ 18,535 $ 18,538
2011 53,785 55,133 55,817 56,394 56,954 57,482 57,483
2012 45,618 49,009 51,787 53,271 54,415 55,160 55,290
2013 50,725 59,639 63,226 68,574 72,573 73,309 73,923
2014 17,297 31,192 38,494 40,749 43,857 43,858 43,868
2015 31,417 50,844 59,342 62,522 64,811 65,630
2016 11,001 30,516 35,884 37,909 37,933
2017 9,000 26,857 44,582 46,134
2018 24,979 39,531 43,284
2019 23,294 30,210
2020 687
Total $ 472,980
Total outstanding liabilities for unpaid losses and LAE, net of reinsurance $ 60,340
Table of Contents
ENSTAR GROUP LIMITEDNOTES TO THE CONSOLIDATED FINANCIAL STATEMENTS — (Continued)
194

The reconciliation of incurred and paid loss development to the liability for unpaid losses and LAE as presented in the tables above for the year ended December 31, 2020 is set forth below:
2020Liabilities for unpaid losses and allocated LAE, net of reinsurance $ 60,340 Reinsurance recoverable on unpaid losses 60,353 Gross liability for unpaid losses and LAE before unallocated loss adjustment expenses and fair value adjustments $ 120,693
The following is unaudited supplementary information for average annual historical duration of claims:
Average Annual Percentage Payout of Incurred Losses by Age, Net of ReinsuranceYear 1 Year 2 Year 3 Year 4 Year 5 Year 6 Year 7 Year 8 Year 9 Year 10
Aerospace 32.80 % 29.84 % 15.40 % 4.61 % 4.31 % 2.22 % 1.93 % 1.12 % 0.48 % 0.01 %
Table of Contents
ENSTAR GROUP LIMITEDNOTES TO THE CONSOLIDATED FINANCIAL STATEMENTS — (Continued)
195

Workers' Compensation
Incurred Losses and Allocated Loss Adjustment Expenses, Net of Reinsurance As of December 31, 2020For The Years Ended December 31,
Accident Year
2014 (unaudited)
2015 (unaudited)
2016 (unaudited)
2017 (unaudited)
2018 (unaudited)
2019 (unaudited) 2020 IBNR(1)
Cumulative Number of
Claims2010 and
Prior $ — $ — $ — $ — $ — $ — $ — $ — — 2011 — — — — — — — — — 2012 — — — — — — — — — 2013 — — — — 1 1 1 — — 2014 10,145 11,179 11,889 10,180 9,867 9,666 9,372 500 137 2015 35,735 36,078 32,567 30,742 29,757 28,768 1,870 259 2016 40,912 35,179 37,703 38,739 36,293 2,847 277 2017 28,188 29,931 22,900 23,320 3,888 295 2018 15,100 14,814 14,490 2,484 161 2019 — — — — 2020 — — —
Total $ 112,244 $ 11,589 1,129 (1) Total of IBNR plus expected development on reported losses.
Cumulative Paid Losses and Allocated Loss Adjustment Expenses, Net of ReinsuranceFor The Years Ended December 31,
Accident Year
2014(unaudited)
2015 (unaudited)
2016 (unaudited)
2017 (unaudited)
2018 (unaudited)
2019 (unaudited) 2020
2010 and Prior $ — $ — $ — $ — $ — $ — $ — 2011 — — — — — — — 2012 — — — — — — — 2013 — — — — 1 1 1 2014 969,000 3,951 6,031 7,430 7,957 8,201 8,503 2015 4,135 13,126 19,785 22,952 24,301 25,032 2016 5,170 15,229 22,940 27,632 29,539 2017 3,560 10,436 14,600 16,520 2018 2,574 6,431 9,016 2019 — — 2020 —
Total $ 88,611 Total outstanding liabilities for unpaid losses and LAE, net of reinsurance $ 23,633
The reconciliation of incurred and paid loss development to the liability for unpaid losses and LAE as presented in the tables above for the year ended December 31, 2020 is set forth below:
2020Liabilities for unpaid losses and allocated LAE, net of reinsurance $ 23,633 Reinsurance recoverable on unpaid losses — Gross liability for unpaid losses and LAE before unallocated loss adjustment expenses and fair value adjustments $ 23,633
Table of Contents
ENSTAR GROUP LIMITEDNOTES TO THE CONSOLIDATED FINANCIAL STATEMENTS — (Continued)
196

The following is unaudited supplementary information for average annual historical duration of claims:
Average Annual Percentage Payout of Incurred Losses by Age, Net of ReinsuranceYear 1 Year 2 Year 3 Year 4 Year 5 Year 6 Year 7 Year 8 Year 9 Year 10
Workers' compensation 14.40 % 29.38 % 20.46 % 11.77 % 5.19 % 2.57 % 1.61 % — % — % — %
11. DEFENDANT ASBESTOS AND ENVIRONMENTAL LIABILITIES We acquired DCo LLC ("DCo") on December 30, 2016, and Morse TEC on October 30, 2019. These
companies hold liabilities associated with personal injury asbestos claims and environmental claims arising from their legacy manufacturing operations. Defendant asbestos liabilities on our consolidated balance sheets include amounts for loss payments and defense costs for pending and future asbestos-related claims, determined using standard actuarial techniques for asbestos exposures. Defendant environmental liabilities include estimated clean-up costs associated with the acquired companies' former operations based on engineering reports.
Insurance balances recoverable on our consolidated balance sheets include estimated insurance recoveries relating to these liabilities. The recorded asset represents our assessment of the capacity of the insurance agreements to indemnify our subsidiaries for the anticipated defense and loss payments for pending claims and projected future claims. The recognition of these recoveries is based on an assessment of the right to recover under the respective contracts and on the financial strength of the insurers. The recorded asset does not represent the limits of our insurance coverage, but rather the amount we would expect to recover if the accrued and projected loss and defense costs were paid in full.
Included within insurance balances recoverable and defendant asbestos and environmental liabilities are the fair value adjustments that were initially recognized upon acquisition. These fair value adjustments are amortized in proportion to the actual payout of claims and recoveries. The carrying value of the asbestos and environmental liabilities, insurance recoveries, future estimated expenses and the fair value adjustments related to DCo and Morse TEC as of December 31, 2020 and 2019 was as follows:
2020 2019Defendant asbestos and environmental liabilities:
Defendant asbestos liabilities $ 913,276 $ 1,100,593 Defendant environmental liabilities 12,572 10,279 Estimated future expenses 42,510 51,637 Fair value adjustments (262,029) (314,824) Defendant asbestos and environmental liabilities 706,329 847,685
Insurance balances recoverable:Insurance recoveries related to defendant asbestos liabilities (net of allowance: 2020 - $4,824) 310,602 549,593 Fair value adjustments (60,950) (100,738) Insurance balances recoverable 249,652 448,855
Net liabilities relating to defendant asbestos and environmental exposures $ 456,677 $ 398,830
Table of Contents
ENSTAR GROUP LIMITEDNOTES TO THE CONSOLIDATED FINANCIAL STATEMENTS — (Continued)
197

The table below provides a consolidated reconciliation of the beginning and ending liability for defendant asbestos and environmental exposures for the years ended December 31, 2020, 2019 and 2018:
2020 2019 2018Balance as of January 1 847,685 203,320 219,164 Less: Insurance balances recoverable 448,855 135,808 122,326 Plus: Cumulative effect of change in accounting principle on the determination of the allowance for estimated uncollectible insurance balances (1) 3,167 — — Net balance as of January 1 401,997 67,512 96,838 Total net recoveries (paid claims) 153,964 (10,434) (6,351) Amounts recorded in other income (expense):
Change in estimate of net ultimate liabilities (103,166) (4,263) (23,221) Reduction in estimated future expenses (9,126) (3,274) — Amortization of fair value adjustments 13,008 13,500 246 Total other expense (income) (99,284) 5,963 (22,975)
Acquired on purchase of subsidiaries — 335,789 — Net balance as of December 31 456,677 398,830 67,512 Plus: Insurance balances recoverable (2) 249,652 448,855 135,808 Balance as of December 31 706,329 847,685 203,320
(1) The Company adopted ASU 2016-13 and the related amendments on January 1, 2020. Refer to Note 1 - "Significant Accounting Policies" for further details.
(2) Net of allowance for estimated uncollectible insurance balances.
Total other income from our defendant asbestos and environmental liabilities companies was $99.3 million for the year ended December 31, 2020 and was driven by a reduction in the actuarially estimated ultimate net liabilities as a result of a lower than expected number of asbestos claims filed against us; lower than expected paid indemnity and defense costs; the collection of disputed insurance recoveries that were carried on our balance sheet at $166.7 million, net of fair value adjustments, for consideration of $179.6 million; and recovery of $19.3 million on insurance payments previously written-off prior to our acquisition of the companies.
Methodologies for determining liabilitiesDefendant Asbestos Liabilities
We review, on an ongoing basis, our own experience in handling asbestos-related claims and trends affecting asbestos-related claims in the U.S. tort system generally, for the purposes of assessing the value of pending asbestos-related claims and the number and value of those that may be asserted in the future, as well as potential recoveries from our insurance carriers with respect to such claims and defense costs. The actuarial analysis for these asbestos-related exposures utilizes data resulting from the claim review process, including input from national coordinating counsel and local counsel, and includes the development of an estimate of the potential value of asbestos-related claims asserted but not yet resolved as well as the number and potential value of asbestos-related claims not yet asserted. In developing the estimate of liability for potential future claims, the actuarial analysis projects the potential number of future claims based on our historical claim filings and epidemiological studies. The actuarial analysis also utilizes assumptions based on our historical proportion of claims resolved without payment, historical claim resolution costs for those claims that result in a payment, and historical defense costs. The liabilities are then estimated by multiplying the pending and projected future claim filings by projected payments rates and average claim resolution amounts and then adding an estimate for defense costs.
We determine, based on the factors described above, including the actuarial analysis, that their best estimate of the aggregate liability both for asbestos-related claims asserted but not yet resolved and potential asbestos-related claims not yet asserted, including estimated defense costs, was $913.3 million and $1.1 billion as of December 31, 2020 and 2019, respectively.
Defendant Environmental Liabilities
As a result of our acquisition of DCo and Morse TEC, we have been identified by the United States Environmental Protection Agency and certain U.S. state environmental agencies and private parties as potentially responsible parties ("PRP") at various hazardous waste disposal sites under the Comprehensive Environmental
Table of Contents
ENSTAR GROUP LIMITEDNOTES TO THE CONSOLIDATED FINANCIAL STATEMENTS — (Continued)
198

Response, Compensation and Liability Act ("Superfund") and equivalent U.S. state laws. The PRPs may currently be liable for the cost of clean-up and other remedial activities at 22 such sites. Responsibility for clean-up and other remedial activities at a Superfund site is typically shared among PRPs based on an allocation formula.
We have a liability for defendant environmental liabilities of $12.6 million and $10.3 million as of December 31, 2020 and 2019, respectively. The estimate for defendant environmental liabilities is based on information available to us, including an estimate of the allocation of liability among PRPs, the probability that other PRPs will pay the cost apportioned to them, currently available information from PRPs and/or federal or state environmental agencies concerning the scope of contamination and estimated remediation and consulting costs, and remediation alternatives.
Allowance for Estimated Uncollectible Insurance Balances Recoverable on Defendant Asbestos Liabilities
We evaluate and monitor the credit risk related to our insurers and an allowance for estimated uncollectible insurance balances recoverable on our defendant asbestos liabilities ("allowance for estimated uncollectible insurance") is established for amounts considered potentially uncollectible. To determine the allowance for estimated uncollectible insurance, we use the inputs and methodologies as described in Note 8 - "Reinsurance Balances Recoverable on Paid and Unpaid Losses" above.
The table below provides a reconciliation of the beginning and ending allowance for estimated uncollectible insurance balances related to our defendant asbestos liabilities, for the years ended December 31, 2020 and 2019:
2020 2019Allowance for estimated uncollectible insurance balances, beginning of year $ 3,818 $ — Cumulative effect of change in accounting principle 3,167 — Current period change in the allowance (2,161) 3,818 Allowance for estimated uncollectible insurance balances, end of year $ 4,824 $ 3,818
During the year ended December 31, 2020, we did not have any write-offs charged against the allowance for estimated uncollectible insurance or any recoveries of amounts previously written off.
We did not have significant non-disputed past due balances receivable from our insurers related to our defendant asbestos liabilities, that were older than one year for any of the periods presented. Any balances that are part of ongoing legal activity are estimated to be recovered at the level of our recorded asset which is consistent with our legal advice and past collection experience.
12. FAIR VALUE MEASUREMENTS
Fair Value HierarchyFair value is defined as the price at which to sell an asset or transfer a liability (i.e. the "exit price") in an
orderly transaction between market participants. We use a fair value hierarchy that gives the highest priority to quoted prices in active markets and the lowest priority to unobservable data. The hierarchy is broken down into three levels as follows:
• Level 1 - Valuations based on unadjusted quoted prices in active markets for identical assets or liabilities that we have the ability to access. Valuation adjustments and block discounts are not applied to Level 1 instruments.
• Level 2 - Valuations based on quoted prices in active markets for similar assets or liabilities, quoted prices for identical assets or liabilities in inactive markets, or for which significant inputs are observable (e.g. interest rates, yield curves, prepayment speeds, default rates, loss severities, etc.) or can be corroborated by observable market data.
• Level 3 - Valuations based on unobservable inputs where there is little or no market activity. Unadjusted third party pricing sources or management's assumptions and internal valuation models may be used to determine the fair values.
Table of Contents
ENSTAR GROUP LIMITEDNOTES TO THE CONSOLIDATED FINANCIAL STATEMENTS — (Continued)
199

In addition, certain of our other investments are measured at fair value using net asset value ("NAV") per share (or its equivalent) as a practical expedient and have not been classified within the fair value hierarchy above. We have categorized our assets and liabilities that are recorded at fair value on a recurring basis among levels based on the observability of inputs, or at fair value using NAV per share (or its equivalent) as follows:
December 31, 2020Quoted Prices in
Active Markets forIdentical Assets
(Level 1)
SignificantOther Observable
Inputs(Level 2)
SignificantUnobservable
Inputs(Level 3)
Fair Value Based on NAV
as Practical Expedient
Total FairValue
Investments:Short-term and Fixed maturity investments:
U.S. government and agency $ — $ 951,048 $ — $ — $ 951,048 U.K. government — 51,082 — — 51,082 Other government — 502,153 — — 502,153 Corporate — 5,686,732 — — 5,686,732 Municipal — 162,669 — — 162,669 Residential mortgage-backed — 553,945 — — 553,945 Commercial mortgage-backed — 854,090 — — 854,090 Asset-backed — 557,460 — — 557,460
$ — $ 9,319,179 $ — $ — $ 9,319,179
Other assets included within funds held - directly managed — 14,627 — — 14,627
Equities:Publicly traded equity investments $ 229,167 $ 31,600 $ — $ — $ 260,767 Exchange-traded funds 311,287 — — — 311,287 Privately held equity investments — — 274,741 — 274,741
$ 540,454 $ 31,600 $ 274,741 $ — $ 846,795
Other investments:Hedge funds $ — $ — $ — $ 2,638,339 $ 2,638,339 Fixed income funds — 285,837 — 266,704 552,541 Equity funds — 5,073 — 185,694 190,767 Private equity funds — — — 363,103 363,103 CLO equities — 128,083 — — 128,083 CLO equity funds — — — 166,523 166,523 Private credit funds — — 9,250 183,069 192,319 Other — — 314 12,045 12,359
$ — $ 418,993 $ 9,564 $ 3,815,477 $ 4,244,034 Total Investments $ 540,454 $ 9,784,399 $ 284,305 $ 3,815,477 $ 14,424,635
Cash and cash equivalents $ 385,790 $ 208,272 $ — $ — $ 594,062
Reinsurance balances recoverable on paid and unpaid losses: $ — $ — $ 520,830 $ — $ 520,830
Other Assets:Derivatives qualifying as hedging $ — $ 1,169 $ — $ — $ 1,169 Derivatives not qualifying as hedges — 2,964 — — 2,964 Derivative instruments $ — $ 4,133 $ — $ — $ 4,133
Losses and LAE: $ — $ — $ 2,452,920 $ — $ 2,452,920
Other Liabilities:Derivatives qualifying as hedging $ — $ 28,947 $ — $ — $ 28,947 Derivatives not qualifying as hedges — 5,195 — — 5,195 Derivative instruments $ — $ 34,142 $ — $ — $ 34,142
Table of Contents
ENSTAR GROUP LIMITEDNOTES TO THE CONSOLIDATED FINANCIAL STATEMENTS — (Continued)
200

December 31, 2019
Quoted Prices inActive Markets forIdentical Assets
(Level 1)
SignificantOther Observable
Inputs(Level 2)
SignificantUnobservable
Inputs(Level 3)
Fair Value Based on NAV
as Practical Expedient
Total FairValue
Investments:
Short-term and Fixed maturity investments:
U.S. government and agency $ — $ 696,077 $ — $ — $ 696,077 U.K government — 161,772 — — 161,772 Other government — 702,856 — — 702,856 Corporate — 5,448,270 — — 5,448,270 Municipal — 140,687 — — 140,687 Residential mortgage-backed — 400,914 — — 400,914 Commercial mortgage-backed — 813,746 — — 813,746 Asset-backed — 670,235 — — 670,235
$ — $ 9,034,557 $ — $ — $ 9,034,557
Other assets included within funds held - directly managed $ — $ 14,207 $ — $ — $ 14,207
Equities:
Publicly traded equity investments $ 297,310 $ 30,565 $ — $ — $ 327,875 Exchange-traded funds 133,047 — — — 133,047 Privately held equity investments — — 265,799 — 265,799
$ 430,357 $ 30,565 $ 265,799 $ — $ 726,721
Other investments:
Hedge funds $ — $ — $ — $ 1,121,904 $ 1,121,904 Fixed income funds — 398,143 — 82,896 481,039 Equity funds — 111,040 — 299,109 410,149 Private equity funds — — — 323,496 323,496 CLO equities — — 87,555 — 87,555 CLO equity funds — — — 87,509 87,509 Other — 34 314 6,031 6,379
$ — $ 509,217 $ 87,869 $ 1,920,945 $ 2,518,031 Total Investments $ 430,357 $ 9,588,546 $ 353,668 $ 1,920,945 $ 12,293,516
Cash and cash equivalents $ 144,984 $ 222,191 $ — $ — $ 367,175
Reinsurance balances recoverable on paid and unpaid losses: $ — $ — $ 695,518 $ — $ 695,518
Other Assets:
Derivatives qualifying as hedging $ — $ 642 $ — $ — $ 642 Derivatives not qualifying as hedges — 1,369 — — 1,369 Derivative instruments $ — $ 2,011 $ — $ — $ 2,011
Losses and LAE: $ — $ — $ 2,621,122 $ — $ 2,621,122
Other Liabilities:
Derivatives qualifying as hedging $ — $ 11,452 $ — $ — $ 11,452 Derivatives not qualifying as hedges — 4,106 — — 4,106 Derivative instruments $ — $ 15,558 $ — $ — $ 15,558
Table of Contents
ENSTAR GROUP LIMITEDNOTES TO THE CONSOLIDATED FINANCIAL STATEMENTS — (Continued)
201

Valuation Methodologies of Financial Instruments Measured at Fair ValueShort-term and Fixed Maturity Investments
The fair values for all securities in the short-term and fixed maturity investments and funds held - directly managed portfolios are independently provided by the investment accounting service providers, investment managers and investment custodians, each of which utilize internationally recognized independent pricing services. We record the unadjusted price provided by the investment accounting service providers, investment managers or investment custodians and validate this price through a process that includes, but is not limited to: (i) comparison of prices against alternative pricing sources; (ii) quantitative analysis (e.g. comparing the quarterly return for each managed portfolio to its target benchmark); (iii) evaluation of methodologies used by external parties to estimate fair value, including a review of the inputs used for pricing; and (iv) comparing the price to our knowledge of the current investment market. Our internal price validation procedures and review of fair value methodology documentation provided by independent pricing services have not historically resulted in adjustment in the prices obtained from the pricing service.
The independent pricing services used by the investment accounting service providers, investment managers and investment custodians obtain actual transaction prices for securities that have quoted prices in active markets. Where we utilize single unadjusted broker-dealer quotes, they are generally provided by market makers or broker-dealers who are recognized as market participants in the markets for which they are providing the quotes. For determining the fair value of securities that are not actively traded, in general, pricing services use "matrix pricing" in which the independent pricing service uses observable market inputs including, but not limited to, reported trades, benchmark yields, broker-dealer quotes, interest rates, prepayment speeds, default rates and other such inputs as are available from market sources to determine a reasonable fair value.
The following describes the techniques generally used to determine the fair value of our short-term and fixed maturity investments by asset class, including the investments underlying the funds held - directly managed.
• U.S. government and agency securities consist of securities issued by the U.S. Treasury and mortgage pass-through agencies such as the Federal National Mortgage Association, the Federal Home Loan Mortgage Corporation and other agencies. Non-U.S. government securities consist of bonds issued by non-U.S. governments and agencies along with supranational organizations. The significant inputs used to determine the fair value of these securities include the spread above the risk-free yield curve, reported trades and broker-dealer quotes. These are considered to be observable market inputs and, therefore, the fair values of these securities are classified as Level 2.
• Corporate securities consist primarily of investment-grade debt of a wide variety of corporate issuers and industries. The fair values of these securities are determined using the spread above the risk-free yield curve, reported trades, broker-dealer quotes, benchmark yields, and industry and market indicators. These are considered observable market inputs and, therefore, the fair values of these securities are classified as Level 2. Where pricing is unavailable from pricing services, such as in periods of low trading activity or when transactions are not orderly, we obtain non-binding quotes from broker-dealers. Where significant inputs are unable to be corroborated with market observable information, we classify the securities as Level 3.
• Municipal securities consist primarily of bonds issued by U.S.-domiciled state and municipal entities. The fair values of these securities are determined using the spread above the risk-free yield curve, reported trades, broker-dealer quotes and benchmark yields. These are considered observable market inputs and, therefore, the fair values of these securities are classified as Level 2.
• Asset-backed securities consist primarily of investment-grade bonds backed by pools of loans with a variety of underlying collateral. Residential and commercial mortgage-backed securities include both agency and non-agency originated securities. Where pricing is unavailable from pricing services, we obtain non-binding quotes from broker-dealers. This is generally the case when there is a low volume of trading activity and current transactions are not orderly. The significant inputs used to determine the fair value of these securities include the spread above the risk-free yield curve, reported trades, benchmark yields, prepayment speeds and default rates. The fair values of these securities are classified as Level 2 if the significant inputs are market observable. Where significant inputs are unable to be corroborated with market observable information, we classify the securities as Level 3.
Table of Contents
ENSTAR GROUP LIMITEDNOTES TO THE CONSOLIDATED FINANCIAL STATEMENTS — (Continued)
202

Equities
Our investments in equities consist of a combination of publicly and privately traded investments. Our publicly traded equity investments in common and preferred stocks predominantly trade on major exchanges and are managed by our external advisors. Our exchange-traded funds also trade on major exchanges. Our publicly traded equities are widely diversified and there is no significant concentration in any specific industry. We use an internationally recognized pricing service to estimate the fair value of our publicly traded equities and exchange-traded funds. We have categorized the majority of our publicly traded equity investments, other than preferred stock, and our exchange-traded funds as Level 1 investments because the fair values of these investments are based on unadjusted quoted prices in active markets for identical assets. One equity security is trading in an inactive market and, as a result has been classified as Level 2. The fair value estimates of our investments in publicly traded preferred stock are based on observable market data and, as a result, have been categorized as Level 2.
Our privately held equity investments in common and preferred stocks are direct investments in companies that we believe offer attractive risk adjusted returns and/or offer other strategic advantages. Each investment may have its own unique terms and conditions and there may be restrictions on disposals. The market for these investments is illiquid and there is no active market. We use a combination of cost, internal models, reported values from co-investors/managers and observable inputs, such as capital raises and capital transactions between new and existing shareholders to calculate the fair value of the privately held equity investments. The fair value estimates of our investments in privately held equities are based on unobservable market data and, as a result, have been categorized as Level 3.
Other investments, at fair value
We have ongoing due diligence processes with respect to the other investments carried at fair value in which we invest, including active discussions with managers of the investments. These processes are designed to assist us in assessing the quality of information provided by, or on behalf of, each fund and in determining whether such information continues to be reliable or whether further review is warranted. Certain funds do not provide full transparency of their underlying holdings; however, we obtain the audited financial statements for funds annually and review the audited results relative to the net asset values provided by the managers, and regularly review and discuss the fund performance with the fund managers to corroborate the reasonableness of the reported net asset values ("NAV").
The use of NAV as an estimate of the fair value for investments in certain entities that calculate NAV is a permitted practical expedient. Due to the time lag in the NAV reported by certain fund managers we adjust the valuation for capital calls and distributions. Other investments measured at fair value using NAV as a practical expedient have not been classified in the fair value hierarchy. Other investments for which we do not use NAV as a practical expedient have been valued using prices from independent pricing services, investment managers and broker-dealers.
The following describes the techniques generally used to determine the fair value of our other investments.
• For our investments in hedge funds, we measure fair value by obtaining the most recently available NAV as advised by the external fund manager or third-party administrator. The fair values of these investments are measured using the NAV as a practical expedient and therefore have not been categorized within the fair value hierarchy.
• Our investments in fixed income funds and equity funds are valued based on a combination of prices from independent pricing services, external fund managers or third-party administrators. For the publicly available prices we have classified the investments as Level 2. For the non-publicly available prices we are using NAV as a practical expedient and therefore these have not been categorized within the fair value hierarchy.
• For our investments in private equity funds, we measure fair value by obtaining the most recently available NAV from the external fund manager or third-party administrator. The fair values of these investments are measured using the NAV as a practical expedient and therefore have not been categorized within the fair value hierarchy.
• We measure the fair value of our direct investment in CLO equities based on valuations provided by independent pricing services, our external CLO equity manager, and valuations provided by the broker or lead underwriter of the investment (the "broker"). The fair values measured using prices provided by independent pricing services have been classified as Level 2 and fair values using prices from brokers have
Table of Contents
ENSTAR GROUP LIMITEDNOTES TO THE CONSOLIDATED FINANCIAL STATEMENTS — (Continued)
203

been classified as Level 3 due to the use of unobservable inputs in the valuation and the limited number of relevant trades in secondary markets.
• For our investments in the CLO equity funds, we measure fair value by obtaining the most recently available NAV as advised by the external fund manager or third party administrator. The fair value of these investments is measured using the NAV as a practical expedient and therefore have not been categorized within the fair value hierarchy.
• Our investments in private credit funds are primarily valued by obtaining the most recently available NAV from the external fund manager or third-party administrator. The fair values of these investments are measured using the NAV as a practical expedient and therefore have not been categorized within the fair value hierarchy. Included within private credit funds is a loan which is valued at cost less distributions received to date.
• Included within other is an investment in a real estate debt fund, for which we measure fair value by obtaining the most recently available NAV from the external fund manager or third-party administrator. The fair value of this investment is measured using the NAV as a practical expedient and therefore has not been categorized within the fair value hierarchy.
Cash and Cash Equivalents
Cash equivalents are short-term, highly liquid investments that are readily convertible to known amounts of cash and are very close to maturity that they present insignificant risk of changes in value due to changes in interest rates. Included within cash and cash equivalents are money market funds, fixed interest deposits and highly liquid fixed maturity investments purchased with an original maturity of three months or less.
The majority of our cash and cash equivalents included within the fair value hierarchy are comprised of money market and liquid reserve funds which have been categorized as Level 1. Fixed interest deposits and highly liquid fixed maturity investments with an original maturity of three months or less have been categorized as Level 2. Operating cash balances are not subject to the recurring fair value measurement guidance and are therefore excluded from the fair value hierarchy.
Insurance Contracts - Fair Value Option
The Company uses an internal model to calculate the fair value of the liability for losses and loss adjustment expenses and reinsurance balances recoverable on paid and unpaid losses for certain retroactive reinsurance contracts where we have elected the fair value option in our Non-life Run-off segment. The fair value was calculated as the aggregate of discounted cash flows plus a risk margin. The discounted cash flow approach uses (i) estimated nominal cash flows based upon an appropriate payment pattern developed in accordance with standard actuarial techniques and (ii) a discount rate based upon a high quality rated corporate bond yield plus a credit spread for non-performance risk. The model uses corporate bond rates across the yield curve depending on the estimated timing of the future cash flows and specific to the currency of the risk. The risk margin was calculated using the present value of the cost of capital. The cost of capital approach uses (i) projected capital requirements, (ii) multiplied by the risk cost of capital representing the return required for non-hedgeable risk based upon the weighted average cost of capital less investment income and (iii) discounted using the weighted average cost of capital.
Derivative Instruments
The fair values of our derivative instruments, as described in Note 7 - "Derivatives and Hedging Instruments," are classified as Level 2. The fair values are based upon prices in active markets for identical contracts.
Level 3 Measurements and Changes in LevelingTransfers into or out of levels are recorded at their fair values as of the end of the reporting period, consistent
with the date of determination of fair value.
Table of Contents
ENSTAR GROUP LIMITEDNOTES TO THE CONSOLIDATED FINANCIAL STATEMENTS — (Continued)
204

Investments
The following tables present a reconciliation of the beginning and ending balances for all investments measured at fair value on a recurring basis using Level 3 inputs during the years ended December 31, 2020 and 2019:
2020
Privately-held Equities Other Investments TotalBeginning fair value $ 265,799 $ 87,869 $ 353,668 Purchases 20,125 47,092 67,217 Sales — (1,289) (1,289) Total realized and unrealized losses (11,183) (40,368) (51,551)
Transfer out of Level 3 into Level 2 — (83,740) (83,740) Ending fair value $ 274,741 $ 9,564 $ 284,305
2019Fixed maturity investments
Privately-held
EquitiesOther
Investments TotalCorporate
Residential mortgage-
backed
Commercial mortgage-
backedAsset-backed
Beginning fair value $ 37,386 $ — $ 7,389 $ 9,121 $ 228,710 $ 39,367 $ 321,973 Purchases 184 — — — 30,713 56,908 87,805 Sales (3,520) — (784) (3,605) (2,016) (590) (10,515) Total realized and unrealized gains (losses)
90 (1) 64 255 8,392 (7,816) 984
Transfer into Level 3 from Level 2 3,535 102 1,515 21,024 — — 26,176 Transfer out of Level 3 into Level 2 (37,675) (101) (8,184) (26,795) — — (72,755) Ending fair value $ — $ — $ — $ — $ 265,799 $ 87,869 $ 353,668
Net realized and unrealized gains related to Level 3 assets in the table above are included in net realized and unrealized gains (losses) in our consolidated statements of earnings.
The securities transferred from Level 2 to Level 3 were transferred due to insufficient market observable inputs for the valuation of the specific assets. The transfers from Level 3 to Level 2 were based upon obtaining market observable information regarding the valuations of the specific assets.
Valuations Techniques and Inputs
The table below presents the quantitative information related to the fair value measurements for our privately held equity investments measured at fair value on a recurring basis using Level 3 inputs:
Quantitative Information about Level 3 Fair Value MeasurementsFair Value as of December 31,
2020 Valuation Techniques Unobservable Input Average (1)
(in millions of U.S. dollars)
$ 230.3 Guideline company methodology Distribution waterfall 12.98$ 54.0 Cost as approximation of fair value Cost as approximation of fair value$ 284.3
(1) The average represents the arithmetic average of the inputs and is not weighted by the relative fair value.
Table of Contents
ENSTAR GROUP LIMITEDNOTES TO THE CONSOLIDATED FINANCIAL STATEMENTS — (Continued)
205

Insurance Contracts - Fair Value Option
The following table presents a reconciliation of the beginning and ending balances for all insurance contracts measured at fair value on a recurring basis using Level 3 inputs during the years ended December 31, 2020 and 2019:
2020 2019
Liability for losses and
LAE
Reinsurance balances
recoverable on paid and
unpaid losses Net
Liability for losses and
LAE
Reinsurance balances
recoverable on paid and
unpaid losses NetBeginning fair value $ 2,621,122 $ 695,518 $ 1,925,604 $ 2,874,055 $ 739,591 $ 2,134,464 Assumed business 1,526 (180,972) 182,498 9,218 — 9,218 Incurred losses and LAE:
Reduction in estimates of ultimate losses (73,596) 59,478 (133,074) (32,690) (2,958) (29,732) Reduction in unallocated LAE (17,484) — (17,484) (19,915) — (19,915) Change in fair value 157,965 38,919 119,046 160,630 43,449 117,181 Total incurred losses and LAE 66,885 98,397 (31,512) 108,025 40,491 67,534
Paid losses (300,234) (101,326) (198,908) (416,770) (92,145) (324,625) Effect of exchange rate movements 63,621 9,213 54,408 46,594 7,581 39,013 Ending fair value $ 2,452,920 $ 520,830 $ 1,932,090 $ 2,621,122 $ 695,518 $ 1,925,604
The net assumed business of $182.5 million in the current period relates to the Hannover Re novation transaction disclosed in Note 4 - "Significant New Business." Changes in fair value in the table above are included in net incurred losses and LAE in our consolidated statements of earnings.
The following table presents the components of the net change in fair value for the years ended December 31, 2020, 2019 and 2018:
2020 2019 2018Changes in fair value due to changes in:
Duration $ 20,861 $ 22,719 $ 74,011 Corporate bond yield 96,478 94,462 (71,031) Weighted cost of capital (5,048) — Risk cost of capital 6,755 — 3,684
Change in fair value $ 119,046 $ 117,181 $ 6,664
Below is a summary of the quantitative information regarding the significant observable and unobservable inputs used in the internal model to determine fair value on a recurring basis as of December 31, 2020 and 2019:
2020 2019Valuation Technique
Unobservable (U) and Observable (O) Inputs Weighted Average
Weighted Average
Internal model Corporate bond yield (O) A rated A ratedInternal model Credit spread for non-performance risk (U) 0.2% 0.2%Internal model Risk cost of capital (U) 5.1% 5.1%Internal model Weighted average cost of capital (U) 8.25% 8.5%Internal model Duration - liability (U) 8.17 years 7.82 yearsInternal model Duration - reinsurance balances recoverable on paid and
unpaid losses (U)8.23 years 8.68 years
The fair value of the liability for losses and LAE and reinsurance balances recoverable on paid and unpaid losses may increase or decrease due to changes in the corporate bond rate, the credit spread for non-performance risk, the risk cost of capital, the weighted average cost of capital and the estimated payment pattern as described
Table of Contents
ENSTAR GROUP LIMITEDNOTES TO THE CONSOLIDATED FINANCIAL STATEMENTS — (Continued)
206

below:
• An increase in the corporate bond rate or credit spread for non-performance risk would result in a decrease in the fair value of the liability for losses and LAE and reinsurance balances recoverable on paid and unpaid losses. Conversely, a decrease in the corporate bond rate or credit spread for non-performance risk would result in an increase in the fair value of the liability for losses and LAE and reinsurance balances recoverable on paid and unpaid losses.
• An increase in the weighted average cost of capital would result in an increase in the fair value of the liability for losses and LAE and reinsurance balances recoverable on paid and unpaid losses. Conversely, a decrease in the weighted average cost of capital would result in a decrease in the fair value of the liability for losses and LAE and reinsurance balances recoverable on paid and unpaid losses.
• An increase in the risk cost of capital would result in an increase in the fair value of the liability for losses and LAE and reinsurance balances recoverable on paid and unpaid losses. Conversely, a decrease in the risk cost of capital would result in a decrease in the fair value of the liability for losses and LAE and reinsurance balances recoverable on paid and unpaid losses.
• The duration of the liability and recoverable is adjusted every period to reflect actual net payments during the period and expected future payments. An acceleration of the estimated payment pattern, a decrease in duration, would result in an increase in the fair value of the liability for losses and LAE and reinsurance balances recoverable on paid and unpaid losses. Conversely, a deceleration of the estimated payment pattern, an increase in duration, would result in a decrease in the fair value of the liability for losses and LAE and reinsurance balances recoverable on paid and unpaid losses.
In addition, the estimate of the capital required to support the liabilities is based upon current industry standards for capital adequacy. If the required capital per unit of risk increases, then the fair value of the liability for losses and LAE and reinsurance balances recoverable on paid and unpaid losses would increase. Conversely, a decrease in required capital would result in a decrease in the fair value of the liability for losses and LAE and reinsurance balances recoverable on paid and unpaid losses.
Disclosure of Fair Values for Financial Instruments Carried at CostSenior Notes
As of December 31, 2020, our 4.50% Senior Notes due 2022 (the "2022 Senior Notes") and our 4.95% Senior Notes due 2029 (the "2029 Senior Notes" and, together with the 2022 Senior Notes, the "Senior Notes") were carried at amortized cost of $349.3 million and $494.2 million, respectively, while the fair value based on observable market pricing from a third party pricing service was $362.4 million and $573.3 million, respectively. The Senior Notes are classified as Level 2.
Junior Subordinated Notes
As of December 31, 2020, our 5.75% Fixed-Rate Reset Junior Subordinated Notes due 2040 (the “Junior Subordinated Notes”) were carried at amortized cost of $344.8 million, while the fair value based on observable market pricing from a third party pricing service was $365.7 million. The Junior Subordinated Notes are classified as Level 2.
Insurance Contracts
Disclosure of fair value of amounts relating to insurance contracts is not required, except those for which we elected the fair value option, as described above.
Remaining Assets and Liabilities
Our remaining assets and liabilities were generally carried at cost or amortized cost, which due to their short-term nature approximates fair value as of December 31, 2020 and 2019.
Table of Contents
ENSTAR GROUP LIMITEDNOTES TO THE CONSOLIDATED FINANCIAL STATEMENTS — (Continued)
207
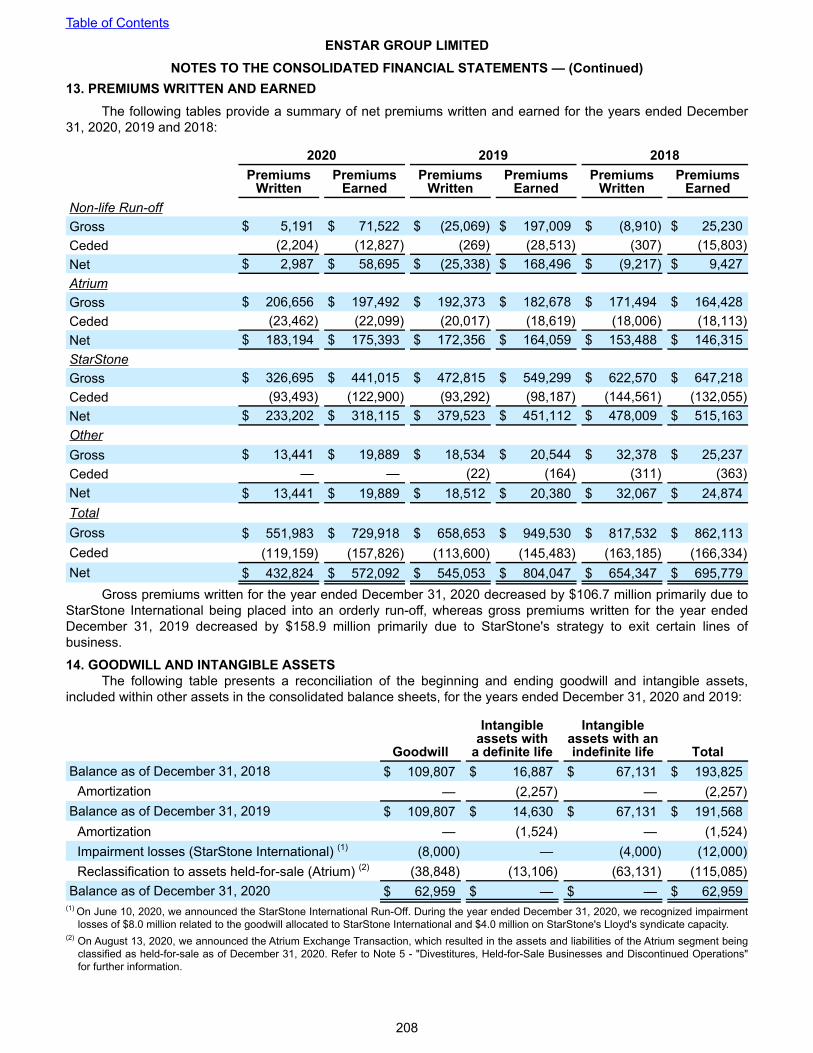
13. PREMIUMS WRITTEN AND EARNED The following tables provide a summary of net premiums written and earned for the years ended December
31, 2020, 2019 and 2018:
2020 2019 2018
Premiums
WrittenPremiums
EarnedPremiums
WrittenPremiums
EarnedPremiums
WrittenPremiums
EarnedNon-life Run-offGross $ 5,191 $ 71,522 $ (25,069) $ 197,009 $ (8,910) $ 25,230 Ceded (2,204) (12,827) (269) (28,513) (307) (15,803) Net $ 2,987 $ 58,695 $ (25,338) $ 168,496 $ (9,217) $ 9,427 AtriumGross $ 206,656 $ 197,492 $ 192,373 $ 182,678 $ 171,494 $ 164,428 Ceded (23,462) (22,099) (20,017) (18,619) (18,006) (18,113) Net $ 183,194 $ 175,393 $ 172,356 $ 164,059 $ 153,488 $ 146,315 StarStoneGross $ 326,695 $ 441,015 $ 472,815 $ 549,299 $ 622,570 $ 647,218 Ceded (93,493) (122,900) (93,292) (98,187) (144,561) (132,055) Net $ 233,202 $ 318,115 $ 379,523 $ 451,112 $ 478,009 $ 515,163 OtherGross $ 13,441 $ 19,889 $ 18,534 $ 20,544 $ 32,378 $ 25,237 Ceded — — (22) (164) (311) (363) Net $ 13,441 $ 19,889 $ 18,512 $ 20,380 $ 32,067 $ 24,874 TotalGross $ 551,983 $ 729,918 $ 658,653 $ 949,530 $ 817,532 $ 862,113 Ceded (119,159) (157,826) (113,600) (145,483) (163,185) (166,334) Net $ 432,824 $ 572,092 $ 545,053 $ 804,047 $ 654,347 $ 695,779
Gross premiums written for the year ended December 31, 2020 decreased by $106.7 million primarily due to StarStone International being placed into an orderly run-off, whereas gross premiums written for the year ended December 31, 2019 decreased by $158.9 million primarily due to StarStone's strategy to exit certain lines of business.
14. GOODWILL AND INTANGIBLE ASSETS The following table presents a reconciliation of the beginning and ending goodwill and intangible assets,
included within other assets in the consolidated balance sheets, for the years ended December 31, 2020 and 2019:
Goodwill
Intangibleassets with
a definite life
Intangible assets with an indefinite life Total
Balance as of December 31, 2018 $ 109,807 $ 16,887 $ 67,131 $ 193,825 Amortization — (2,257) — (2,257)
Balance as of December 31, 2019 $ 109,807 $ 14,630 $ 67,131 $ 191,568 Amortization — (1,524) — (1,524) Impairment losses (StarStone International) (1) (8,000) — (4,000) (12,000) Reclassification to assets held-for-sale (Atrium) (2) (38,848) (13,106) (63,131) (115,085)
Balance as of December 31, 2020 $ 62,959 $ — $ — $ 62,959 (1) On June 10, 2020, we announced the StarStone International Run-Off. During the year ended December 31, 2020, we recognized impairment
losses of $8.0 million related to the goodwill allocated to StarStone International and $4.0 million on StarStone's Lloyd's syndicate capacity.(2) On August 13, 2020, we announced the Atrium Exchange Transaction, which resulted in the assets and liabilities of the Atrium segment being
classified as held-for-sale as of December 31, 2020. Refer to Note 5 - "Divestitures, Held-for-Sale Businesses and Discontinued Operations" for further information.
Table of Contents
ENSTAR GROUP LIMITEDNOTES TO THE CONSOLIDATED FINANCIAL STATEMENTS — (Continued)
208

The gross carrying value, accumulated amortization and net carrying value of goodwill and intangible assets by segment and by type as of December 31, 2020 and 2019 was as follows:
December 31, 2020 December 31, 2019
Grosscarrying
valueAccumulated amortization
Netcarrying
value
Grosscarrying
valueAccumulated amortization
Netcarrying
valueNon-life Run-off segment:Goodwill $ 62,959 $ — $ 62,959 $ 62,959 $ — $ 62,959
Atrium segment:Goodwill — — — 38,848 — 38,848 Intangible assets with a definite life:
Distribution channel — — — 20,000 (8,111) 11,889 Brand — — — 7,000 (4,259) 2,741
Intangible assets with an indefinite life:Lloyd’s syndicate capacity — — — 33,031 — 33,031 Management contract — — — 30,100 — 30,100
Total Atrium segment goodwill and intangible assets — — — 128,979 (12,370) 116,609
StarStone segment:Goodwill — — — 8,000 — 8,000 Intangible assets with an indefinite life:
Lloyd’s syndicate capacity — — — 4,000 — 4,000 Total StarStone segment goodwill and intangible assets — — — 12,000 — 12,000 Total goodwill and intangible assets $ 62,959 $ — $ 62,959 $ 203,938 $ (12,370) $ 191,568
The amortization recorded on the intangible assets of the Atrium segment, prior to the reclassification to held-for-sale, for the years ended December 31, 2020, 2019 and 2018 was $1.5 million, $2.3 million and $3.6 million, respectively.
15. DEBT OBLIGATIONS AND CREDIT FACILITIES We utilize debt and credit facilities primarily for funding acquisitions and significant new business, investment
activities and, from time to time, for general corporate purposes. Our debt obligations were as follows:
Facility Origination Date TermDecember 31,
2020December 31,
20194.50% Senior Notes due 2022 March 10, 2017 5 years $ 349,253 $ 348,616 4.95% Senior Notes due 2029 May 28, 2019 10 years 494,194 493,600
Total Senior Notes 843,447 842,216 5.75% Junior Subordinated Notes due 2040 August 26, 2020 20 years 344,812 — EGL Revolving Credit Facility August 16, 2018 5 years 185,000 — 2018 EGL Term Loan Facility December 27, 2018 3 years — 348,991
Total debt obligations $ 1,373,259 $ 1,191,207
In 2020, we issued the Junior Subordinated Notes and fully repaid the 2018 EGL Term Loan Facility.
Table of Contents
ENSTAR GROUP LIMITEDNOTES TO THE CONSOLIDATED FINANCIAL STATEMENTS — (Continued)
209

The table below provides a summary of the total interest expense for the years ended December 31, 2020, 2019 and 2018:
2020 2019 2018Interest expense on debt obligations $ 57,974 $ 51,245 $ 25,205 Amortization of debt issuance costs 1,331 953 537 Funds withheld balances and other 3 343 (46) Total interest expense $ 59,308 $ 52,541 $ 25,696
Senior NotesWe have issued two series of Senior Notes as shown in the table above. The Senior Notes are effectively
subordinated to any of our secured indebtedness to the extent of the value of the assets securing such indebtedness, and structurally subordinated to all liabilities of our subsidiaries, including claims of policyholders. The 2022 Senior Notes and the 2029 Senior Notes bear interest at a fixed rate per annum, equal to 4.50% and 4.95%, respectively.
Both series of Senior Notes are rated BBB-. We may repurchase the 2029 Senior Notes at any time prior to three months prior to maturity of the 2029 Senior Notes, subject to the payment of a make-whole premium. After such date, we may repurchase the 2029 Senior Notes at a purchase price equal to 100% of the outstanding principal amount, plus accrued and unpaid interest. We do not have the right to repurchase the 2022 Senior Notes prior to their maturity.
We incurred costs of $2.9 million and $6.8 million in issuing the 2022 and 2029 Senior Notes, respectively. The unamortized costs as of December 31, 2020 were $0.7 million and $5.8 million, respectively.
Junior Subordinated Notes5.75% Junior Subordinated Notes due 2040
On August 26, 2020, our wholly-owned subsidiary, Enstar Finance LLC ("Enstar Finance") issued the Junior Subordinated Notes in an aggregate principal amount of $350.0 million. The Junior Subordinated Notes bear interest (i) during the initial five-year period ending August 30, 2025, at a fixed rate per annual of 5.75% and (ii) during each five-year reset period thereafter beginning September 1, 2025, at a fixed rate per annum equal to the five-year U.S. treasury rate calculated as of two business days prior to the beginning of such five-year period plus 5.468%.
The Junior Subordinated Notes are rated BB+ and are unsecured junior subordinated obligations of Enstar Finance. The Junior Subordinated Notes are fully and unconditionally guaranteed by us on an unsecured and junior subordinated basis. These debt securities of Enstar Finance are effectively subordinated to the obligations of our other subsidiaries.
Subject to certain requirements and during certain time periods, Enstar Finance may repurchase the Junior Subordinated Notes, in whole or in part, at any time, at a repurchase price equal to at least 100% of the principal amount, plus accrued and unpaid interest.
We incurred costs of $5.2 million in issuing the Junior Subordinated Notes. The unamortized costs as of December 31, 2020 were $5.2 million.
EGL Revolving Credit FacilityOn August 16, 2018, we entered into a five-year, unsecured $600.0 million revolving credit agreement. We
may request additional commitments under the facility up to an additional $400.0 million, which the existing lenders in their discretion or new lenders may provide, in each case subject to the terms of the agreement. To date, we have not requested any additional commitments under the facility.
As of December 31, 2020, we were permitted to borrow up to an aggregate of $600.0 million under the revolving credit facility. As of December 31, 2020, there was $415.0 million of available unutilized capacity under the facility. Subsequent to December 31, 2020, we borrowed an additional $20.0 million and repaid $30.0 million, increasing the unutilized capacity under the facility to $425.0 million.
We pay interest on loans borrowed under the facility at a per annum rate comprising a reference rate determined based on the type of loan we borrow plus a margin based on the Company's long term senior unsecured debt ratings. The applicable reference rate is adjusted base rate for base rate loans and adjusted LIBOR
Table of Contents
ENSTAR GROUP LIMITEDNOTES TO THE CONSOLIDATED FINANCIAL STATEMENTS — (Continued)
210

for LIBOR loans. The applicable margin varies based upon changes to our long term senior unsecured debt ratings assigned by S&P or Fitch. We pay interest quarterly for base rate loans and as frequently as monthly for LIBOR loans, depending on the applicable interest period. We also pay a commitment fee based on the average daily unutilized capacity under the facility. If an event of default occurs, the interest rate may increase and the agent may, and at the request of the required lenders shall, terminate lender commitments and demand early repayment of any outstanding loans borrowed under the facility.
We are subject to business and financial covenants under the revolving credit agreement. Business covenants include limitations on indebtedness and guarantees; liens; mergers, consolidations and other fundamental changes; dispositions; and investments and acquisitions, in each case subject to certain exceptions. Generally, the financial covenants require us to maintain a gearing ratio of consolidated indebtedness to total capitalization of not greater than 0.35 to 1.0 and to maintain a consolidated net worth of not less than the aggregate of (i) $2.3 billion, (ii) 50% of net income available for distribution to our ordinary shareholders at any time after August 16, 2018, and (iii) 50% of the proceeds of any common stock issuance made after August 16, 2018. In addition, we must maintain eligible capital in excess of the enhanced capital requirement imposed on us by the Bermuda Monetary Authority pursuant to the Insurance (Group Supervision) Rules 2011 of Bermuda. We are in compliance with the covenants of the revolving credit facility.
2018 EGL Term Loan FacilityOn December 27, 2018, we entered into and fully utilized a three-year, unsecured $500.0 million term loan.
During 2019, we repaid $150.0 million, and during 2020, we repaid the remaining $350.0 million and terminated the facility.
MaturitiesAs of December 31, 2020, the amount of outstanding debt obligations that will become due in each of the next
five years and thereafter was as follows: 2021, $0; 2022, $350.0 million; 2023, $185.0 million; 2024, $0; and thereafter, $850.0 million.
Letters of CreditWe utilize unsecured and secured letters of credit to support certain of our (re)insurance performance
obligations.
$275.0 million Funds at Lloyd's Letter of Credit Facility
On November 5, 2020, we amended and restated our Fund's at Lloyd's letter of credit facility to reduce its capacity to $275.0 million (with the right to request additional commitments under the facility in an aggregate amount not to exceed $75.0 million) and extended its term by two years. We use letters of credit under this facility to satisfy a portion of our Funds at Lloyd's requirements, and letters of credit issued under the facility will expire at the end of 2025. As of December 31, 2020 and December 31, 2019, our combined Funds at Lloyd's comprised cash and investments of $260.9 million and $639.3 million, respectively, and unsecured letters of credit of $210.0 million and $252.0 million, respectively.
$120.0 million Letter of Credit Facility
We use this facility to provide collateral support for certain reinsurance obligations of our subsidiaries. We may request additional commitments under the facility in an aggregate amount not to exceed $60.0 million, which the existing lender in its discretion or new lenders may provide, in each case subject to the terms of the agreement. As of December 31, 2020 and December 31, 2019, The aggregate amount of letters of credit issued under the facility was $115.7 million and $115.3 million, respectively.
$800.0 million Syndicated Letter of Credit Facility
On August 4, 2020, we increased the total commitments available under this facility by an aggregate amount of $40.0 million, bringing the total size of the facility to $800.0 million. We use this facility to collateralize certain reinsurance obligations. As of December 31, 2020 and December 31, 2019, the aggregate amount of letters of credit issued under the facility was $424.1 million and $608.0 million, respectively.
$65.0 million Letter of Credit Facility
On August 4, 2020, we entered into a $65.0 million letter of credit facility agreement pursuant to which we issued a letter of credit to collateralize a portion of our reinsurance obligations relating to our novation transaction
Table of Contents
ENSTAR GROUP LIMITEDNOTES TO THE CONSOLIDATED FINANCIAL STATEMENTS — (Continued)
211

with Hannover Re, which we completed on August 6, 2020, as discussed in Note 4 - "Significant New Business". As of December 31, 2020, the aggregate amount of letters of credit issued under the facility was $61.0 million.
Subsidiary Capital Letters of CreditWe also utilize unsecured and secured letters of credit to support the regulatory capital requirements of
certain of our subsidiaries.
$100.0 million Bermuda Letter of Credit Facility
On December 22, 2017, we entered into a $100.0 million subsidiary capital letter of credit facility agreement. The letter of credit issued under the agreement qualifies as eligible capital for one of our Bermuda regulated subsidiaries. As of December 31, 2020, the aggregate face amount of letters of credit under the facility was $100.0 million.
GBP £32.0 million United Kingdom Letter of Credit Facility
On December 8, 2020, we entered into a £32.0 million ($43.7 million) subsidiary capital letter of credit facility agreement. The letter of credit issued under the agreement qualifies as Ancillary Own Funds capital for one of our U.K. regulated subsidiaries. As of December 31, 2020, the aggregate face amount of letters of credit under the facility was $43.7 million.
16. NONCONTROLLING INTEREST We have both redeemable noncontrolling interest ("RNCI") and noncontrolling interest ("NCI") on our
consolidated balance sheets. RNCI with redemption features that are not solely within our control are classified within temporary equity in the consolidated balance sheets and carried at redemption value, which is fair value. The change in fair value is recognized through retained earnings as if the balance sheet date were also the redemption date. In addition, we also have NCI, which does not have redemption features and is classified within equity in the consolidated balance sheets.
Redeemable Noncontrolling InterestRNCI as of December 31, 2020 and 2019 comprised the ownership interests held by the Trident V Funds
(39.3%) and the Dowling Funds (1.7%) in our subsidiary North Bay. As discussed in Note 5 - "Divestitures, Held-for-Sale Businesses and Discontinued Operations," North Bay owned our investments in Northshore, the holding company that owns Atrium and Arden, and SSHL, the holding company for the StarStone group.
The following is a reconciliation of the beginning and ending carrying amount of the equity attributable to the RNCI for the years ended December 31, 2020 and 2019:
2020 2019Balance at beginning of year $ 438,791 $ 458,543 Capital contributions — 13,127 Dividends paid — (11,556) Net losses attributable to RNCI (27,512) (12,029) Change in unrealized gains (losses) on AFS investments attributable to RNCI 1,517 (126) Change in currency translation adjustments attributable to RNCI (1,397) 10 Change in redemption value of RNCI (46,224) (9,178) Cumulative effect of change in accounting principle attributable to RNCI (1) 261 — Balance at end of year $ 365,436 $ 438,791
(1) The Company adopted ASU 2016-13 and the related amendments on January 1, 2020. Refer to Note 2 - "Significant Accounting Policies" for further details.
We carried the RNCI at its estimated redemption value, which is fair value, as of December 31, 2020 and 2019. The decrease in the year ended December 31, 2020 included $27.5 million of net losses attributable to RNCI primarily arising on StarStone and which result from COVID-19 related net underwriting losses and exit costs associated with the decision to place StarStone International into run-off, partially offset by the gain on sale of StarStone U.S.; and $46.2 million due to change in redemption value. The redemption value decreased as a result of the StarStone International Run-Off decision and the agreement to sell both StarStone U.S and Northshore.
Table of Contents
ENSTAR GROUP LIMITEDNOTES TO THE CONSOLIDATED FINANCIAL STATEMENTS — (Continued)
212

Following the completion of the Atrium Exchange Transaction on January 1, 2021, as described in Note 5 - "Divestitures, Held-for-Sale Businesses and Discontinued Operations," we will deconsolidate the RNCI relating to Northshore in the first quarter of 2021, and thereafter the remaining RNCI will be for StarStone International.
Refer to Note 23 - "Commitments and Contingencies" for additional information regarding RNCI.
Noncontrolling InterestAs of December 31, 2020 and 2019, we had $13.6 million and $14.2 million, respectively, of NCI primarily
related to external interests in three of our subsidiaries. A reconciliation of the beginning and ending carrying amount of the equity attributable to NCI is included in the consolidated statement of changes in shareholders equity.
17. SHAREHOLDERS' EQUITY As of December 31, 2020 and 2019, the authorized share capital was 111,000,000 ordinary shares ("Voting
Ordinary Shares") and non-voting convertible ordinary shares ("Non-Voting Ordinary Shares"), each of par value $1.00 per share, and 45,000,000 preferred shares of par value $1.00 per share.
Voting Ordinary SharesOur Voting Ordinary Shares are listed and trade under the "ESGR" ticker symbol on the NASDAQ Global
Select Market. Each Voting Ordinary Share entitles the holder thereof to one vote.
Share Repurchases
On March 9, 2020, our Board of Directors adopted a stock trading plan for the purpose of repurchasing a limited number of our Company’s ordinary shares, not to exceed $150.0 million in aggregate (the "Repurchase Program"). On March 23, 2020, we suspended our Repurchase Program due to uncertainty from the COVID-19 pandemic. The Repurchase Program resumed on September 21, 2020 and expires on March 1, 2021.
From inception to December 31, 2020, we repurchased 178,280 ordinary shares at an average price of 145.87, for an aggregate price of $26.0 million under the Repurchase Program. As of December 31, 2020, the remaining capacity under the Repurchase Program was $124.0 million. We did not repurchase any shares subsequent to December 31, 2020.
Joint Share Ownership Plan
On January 21, 2020, 565,630 Voting Ordinary Shares were issued to the trustee of the Enstar Group Limited Employee Benefit Trust (the "EB Trust"). Voting rights in respect of shares held in the EB Trust have been contractually waived. We have consolidated the EB Trust, and shares held in the EB Trust are classified like treasury shares as contra-equity in our consolidated balance sheet. The EB Trust supports awards made under our Joint Share Ownership Plan, as described in Note 19 - "Share-Based Compensation and Pensions."
Shares issued in acquisition of KaylaRe
On May 14, 2018, 1,501,778 Voting Ordinary Shares were issued as consideration for the acquisition of KaylaRe Holdings Ltd, as described in Note 3 - "Business Acquisitions".
Non-Voting Ordinary SharesThe Non-Voting Ordinary Shares are comprised of several different series as of December 31, 2020:
• the Series C shares were originally issued in connection with investment transactions in April and December of 2011 and on exercise of warrants in March 2017. The Series C shares: (i) have all of the economic rights (including dividend rights) attaching to Voting Ordinary Shares but are non-voting except in certain limited circumstances; (ii) will automatically convert at a one-for-one exchange ratio (subject to adjustment for share splits, dividends, recapitalizations, consolidations or similar transactions) into Voting Ordinary Shares if the registered holder transfers them in a widely dispersed offering; (iii) may only vote on certain limited matters that would constitute a variation of class rights and as required under Bermuda law, provided that the aggregate voting power of the Series C shares with respect to any merger, consolidation or amalgamation will not exceed 0.01% of the aggregate voting power of our issued share capital; and (iv) require the registered holders’ written consent in order to vary the rights of the shares in a significant and adverse manner.
• the Series B and Series D shares were created in connection with the 2011 investment transactions, but no shares in these series are issued and outstanding. Holders of the Series C shares have the right to
Table of Contents
ENSTAR GROUP LIMITEDNOTES TO THE CONSOLIDATED FINANCIAL STATEMENTS — (Continued)
213

convert such shares, on a share-for-share basis, subject to certain adjustments, into Series D shares at their option. There is no economic difference in Series B, C or D shares, but there are slight differences in the conversion rights and the limited voting rights of each series.
• there were 910,010 Series E shares issued and outstanding as of December 31, 2020. On May 14, 2018, 505,239 Series E non-voting shares were issued as consideration for the acquisition of KaylaRe Holdings Ltd, as described in Note 3 - "Business Acquisitions". The Series E shares have substantially the same rights as the Series C shares, except that (i) they are convertible only into Voting Ordinary Shares and (ii) they may only vote as required under Bermuda law. The Series E shares include all other Non-Voting Ordinary Shares authorized under our bye-laws but not classified as Series A, B, C or D Non-Voting Ordinary Shares.
WarrantsAs of December 31, 2020, there were warrants outstanding to acquire 175,901 Series C Non-Voting Ordinary
Shares for an exercise price of $115.00 per share, subject to certain adjustments (the "Warrants"). The Warrants were issued in April 2011 and expire in April 2021.
Series C Preferred SharesAs of December 31, 2020, there were 388,571 Series C Participating Non-Voting Perpetual Preferred Shares
("Series C Preferred Shares") issued and held by one of our wholly-owned subsidiaries. The Series C Preferred Shares (i) upon liquidation, dissolution or winding up of the Company, entitle their holders to a preference over holders of our ordinary voting and non-voting shares of an amount equal to $0.001 per share with respect to surplus assets and (ii) are non-voting except in certain limited circumstances. The Series C Preferred shares have dividend rights equal to those of the ordinary voting shares, subject to certain limitations and in an amount determined by a "participation rate" that is generally reflective of the reduction in the number of Series C Preferred Shares issued in exchange for the previously outstanding Series A Shares. The Series C Preferred Shares otherwise rank on parity with the ordinary voting and non-voting shares, and they rank senior to each other class or series of share capital, unless the terms of any such class or series shall expressly provide otherwise.
Series D Preferred SharesOn June 28, 2018, the Company raised $400.0 million of gross proceeds through the public offering of 16,000
shares of its 7.00% non-cumulative fixed-to-floating rate Series D perpetual preferred shares ("Series D Preferred Shares") (equivalent to 16,000,000 depositary shares, each of which represents a 1/1,000th interest in a Series D Preferred Share), $1.00 par value and $25,000 liquidation preference (the "Liquidation Preference") per share (equivalent to $25.00 per depositary share). The depositary shares are listed and trade under the "ESGRP" ticker symbol on the NASDAQ Global Select Market. The Series D Preferred Shares are not redeemable prior to September 1, 2028, except in specified circumstances as described in the prospectus supplement relating to the offering. On and after September 1, 2028, the Series D Preferred Shares, represented by the depositary shares, will be redeemable at the Company’s option, in whole or from time to time in part, at a redemption price equal to $25,000 per Series D Preferred Share (equivalent to $25.00 per depositary share), plus any declared and unpaid dividends.
Series E Preferred SharesOn November 21, 2018, the Company raised $110.0 million of gross proceeds through the public offering of
4,400 shares of its 7.00% fixed rate non-cumulative Series E perpetual preferred shares ("Series E Preferred Shares") (equivalent to 4,400,000 depositary shares, each of which represents a 1/1,000th interest in a Series E Preferred Share), $1.00 par value and $25,000 liquidation preference (the "Series E Liquidation Preference") per share (equivalent to $25.00 per depositary share). The depositary shares are listed and trade under the "ESGRO" ticker symbol on the NASDAQ Global Select Market. The Series E Preferred Shares are not redeemable prior to March 1, 2024, except in specified circumstances as described in the prospectus supplement relating to the offering. On and after March 1, 2024, the Series E Preferred Shares, represented by the depositary shares, will be redeemable at the Company’s option, in whole or from time to time in part, at a redemption price equal to $25,000 per Series E Preferred Share (equivalent to $25.00 per depositary share), plus any declared and unpaid dividends.
Dividends on Preferred SharesHolders of Series D and Series E Preferred Shares are entitled to receive, only when, as and if declared, non-
cumulative cash dividends, paid quarterly in arrears on the 1st day of March, June, September and December of each year, commencing on September 1, 2018 for the Series D Preferred Shares and March 1, 2019 for the Series
Table of Contents
ENSTAR GROUP LIMITEDNOTES TO THE CONSOLIDATED FINANCIAL STATEMENTS — (Continued)
214
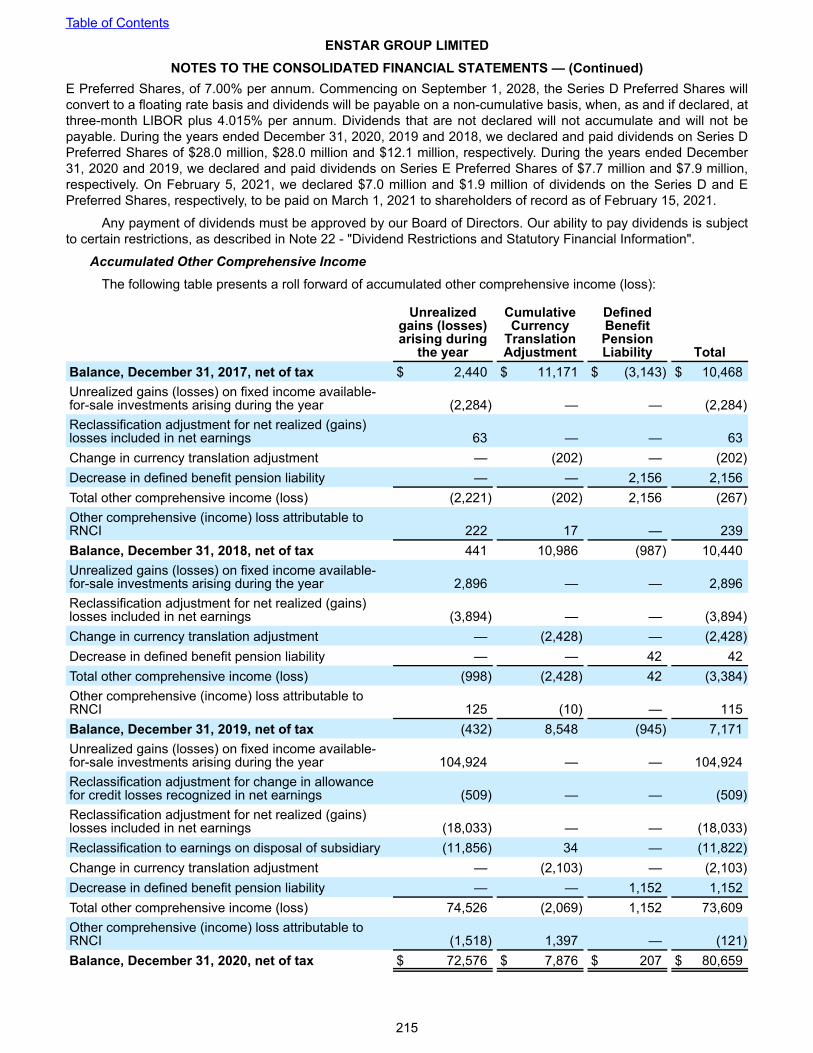
E Preferred Shares, of 7.00% per annum. Commencing on September 1, 2028, the Series D Preferred Shares will convert to a floating rate basis and dividends will be payable on a non-cumulative basis, when, as and if declared, at three-month LIBOR plus 4.015% per annum. Dividends that are not declared will not accumulate and will not be payable. During the years ended December 31, 2020, 2019 and 2018, we declared and paid dividends on Series D Preferred Shares of $28.0 million, $28.0 million and $12.1 million, respectively. During the years ended December 31, 2020 and 2019, we declared and paid dividends on Series E Preferred Shares of $7.7 million and $7.9 million, respectively. On February 5, 2021, we declared $7.0 million and $1.9 million of dividends on the Series D and E Preferred Shares, respectively, to be paid on March 1, 2021 to shareholders of record as of February 15, 2021.
Any payment of dividends must be approved by our Board of Directors. Our ability to pay dividends is subject to certain restrictions, as described in Note 22 - "Dividend Restrictions and Statutory Financial Information".
Accumulated Other Comprehensive IncomeThe following table presents a roll forward of accumulated other comprehensive income (loss):
Unrealized gains (losses) arising during
the year
Cumulative Currency
Translation Adjustment
Defined Benefit Pension Liability Total
Balance, December 31, 2017, net of tax $ 2,440 $ 11,171 $ (3,143) $ 10,468 Unrealized gains (losses) on fixed income available-for-sale investments arising during the year (2,284) — — (2,284) Reclassification adjustment for net realized (gains) losses included in net earnings 63 — — 63 Change in currency translation adjustment — (202) — (202) Decrease in defined benefit pension liability — — 2,156 2,156 Total other comprehensive income (loss) (2,221) (202) 2,156 (267) Other comprehensive (income) loss attributable to RNCI 222 17 — 239 Balance, December 31, 2018, net of tax 441 10,986 (987) 10,440 Unrealized gains (losses) on fixed income available-for-sale investments arising during the year 2,896 — — 2,896 Reclassification adjustment for net realized (gains) losses included in net earnings (3,894) — — (3,894) Change in currency translation adjustment — (2,428) — (2,428) Decrease in defined benefit pension liability — — 42 42 Total other comprehensive income (loss) (998) (2,428) 42 (3,384) Other comprehensive (income) loss attributable to RNCI 125 (10) — 115 Balance, December 31, 2019, net of tax (432) 8,548 (945) 7,171 Unrealized gains (losses) on fixed income available-for-sale investments arising during the year 104,924 — — 104,924 Reclassification adjustment for change in allowance for credit losses recognized in net earnings (509) — — (509) Reclassification adjustment for net realized (gains) losses included in net earnings (18,033) — — (18,033) Reclassification to earnings on disposal of subsidiary (11,856) 34 — (11,822) Change in currency translation adjustment — (2,103) — (2,103) Decrease in defined benefit pension liability — — 1,152 1,152 Total other comprehensive income (loss) 74,526 (2,069) 1,152 73,609 Other comprehensive (income) loss attributable to RNCI (1,518) 1,397 — (121) Balance, December 31, 2020, net of tax $ 72,576 $ 7,876 $ 207 $ 80,659
Table of Contents
ENSTAR GROUP LIMITEDNOTES TO THE CONSOLIDATED FINANCIAL STATEMENTS — (Continued)
215

The following table presents details about the tax effects allocated to each component of other comprehensive income (loss):
Before Tax Amount
Tax (Expense) Benefit
Net of Tax Amount
Twelve months ended December 31, 2020 Unrealized gains (losses) on fixed income available-for-sale investments arising during the year $ 115,610 $ (10,686) $ 104,924 Reclassification adjustment for change in allowance for credit losses recognized in net earnings (499) (10) (509) Reclassification adjustment for net realized (gains) losses included in net earnings (19,766) 1,733 (18,033) Reclassification to earnings on disposal of subsidiary (15,008) 3,152 (11,856) Change in currency translation adjustment (2,294) 191 (2,103) Reclassification to earnings on disposal of subsidiary 34 — 34 Decrease in defined benefit pension liability 1,097 55 1,152 Other comprehensive income (loss) $ 79,174 $ (5,565) $ 73,609
In the year ended December 31, 2019 and 2018, the deferred tax (expense) benefit associated with items reported in other comprehensive income (loss) was subject to a full valuation allowance. For information on valuation allowances on deferred tax assets, refer to “Assessment of Valuation Allowance on Deferred Tax Assets” within Note 20 - "Income Taxation."
The following table presents details amounts reclassified from accumulated other comprehensive income:
Details about AOCI components 2020 2019 2018
Affected Line Item in Statement where Net Earnings are presented
Unrealized gains (losses) on fixed income available-for-sale investments 18,682 3,894 (63)
Net realized and unrealized gains (losses)
16,591 — — Net earnings from discontinued operations
35,273 3,894 (63) Total before tax (4,875) — — Income tax (expense) 30,398 3,894 (63) Net of tax
Currency translation adjustment on disposal of subsidiary (34) — —
Net earnings from discontinued operations
Total reclassifications for the period, net of tax 30,364 3,894 (63)
Table of Contents
ENSTAR GROUP LIMITEDNOTES TO THE CONSOLIDATED FINANCIAL STATEMENTS — (Continued)
216

18. EARNINGS PER SHARE The following table sets forth the computation of basic and diluted net earnings per ordinary share for the
years ended December 31, 2020, 2019 and 2018:
2020 2019 2018Numerator:Earnings (loss) per share attributable to Enstar ordinary shareholders:
Net earnings (loss) from continuing operations(1) $ 1,711,810 $ 897,825 $ (163,232) Net earnings from discontinued operations(2) 7,534 4,350 878 Net earnings (loss) attributable to Enstar ordinary shareholders $ 1,719,344 $ 902,175 $ (162,354)
Denominator:Weighted-average ordinary shares outstanding — basic(3) 21,551,408 21,482,617 20,698,310 Effect of dilutive securities:Share-based compensation plans(4) 208,293 227,878 129,746Warrants 58,593 64,571 76,120
Weighted-average ordinary shares outstanding — diluted 21,818,294 21,775,066 20,904,176 Earnings (loss) per share attributable to Enstar ordinary shareholders:Basic:
Net earnings (loss) from continuing operations $ 79.43 $ 41.80 $ (7.89) Net earnings from discontinued operations 0.35 0.20 0.05 Net earnings (loss) per ordinary share $ 79.78 $ 42.00 $ (7.84)
Diluted (5):Net earnings (loss) from continuing operations $ 78.45 $ 41.23 $ (7.89) Net earnings from discontinued operations 0.35 0.20 0.05 Net earnings (loss) per ordinary share $ 78.80 $ 41.43 $ (7.84)
(1) Net earnings (loss) from continuing operations attributable to Enstar ordinary shareholders equals net earnings (loss) from continuing operations, plus net loss (earnings) from continuing operations attributable to noncontrolling interest, less dividends on preferred shares.
(2) Net earnings (loss) from discontinued operations attributable to Enstar ordinary shareholders equals net earnings (loss) from discontinued operations, net of income taxes, plus net loss (earnings) from discontinued operations attributable to noncontrolling interest; refer to Note 5 - "Divestitures, Held-for-Sale Businesses and Discontinued Operations" for a breakdown by period.
(3) Weighted-average ordinary shares for basic earnings per share includes ordinary shares (voting and non-voting) but excludes ordinary shares held in the EB Trust in respect of JSOP awards.
(4) Share-based dilutive securities include restricted shares, restricted share units, and performance share units. Certain share-based compensation awards, including the ordinary shares held in the EB Trust in respect of JSOP awards, were excluded from the calculation for the year ended December 31, 2020 because they were anti-dilutive.
(5) During a period of loss, the basic weighted average ordinary shares outstanding is used in the denominator of the diluted loss per ordinary share computation as the effect of including potentially dilutive securities would be anti-dilutive.
Table of Contents
ENSTAR GROUP LIMITEDNOTES TO THE CONSOLIDATED FINANCIAL STATEMENTS — (Continued)
217

19. SHARE-BASED COMPENSATION AND PENSIONS Share-based compensation
The 2016 and 2006 Equity Incentive Plans are our primary share-based compensation plans. We also maintain other share-based compensation plans as discussed below. The table below provides a summary of the compensation costs for all of our share-based compensation plans for the years ended December 31, 2020, 2019 and 2018:
2020 2019 2018
Share-based compensation plans:
Restricted shares and restricted share units $ 8,286 $ 6,564 $ 7,641
Performance share units 12,678 23,582 1,968
Cash-settled stock appreciation rights 215 2,575 (3,316)
Joint share ownership plan expense 4,296 — —
Other share-based compensation plans:
Northshore/Atrium incentive plan 971 3,652 2,792
StarStone incentive plan (223) 223 —
Deferred compensation and ordinary share plan for non-employee directors 1,183 992 1,155
Employee share purchase plan 339 411 430
Total share-based compensation $ 27,745 $ 37,999 $ 10,670
The associated tax benefit recorded to income tax expense in the Consolidated statement of operations was $2.7 million, $2.9 million and $1.9 million for the years ended December 31, 2020, 2019 and 2018, respectively.
Restricted Shares and Restricted Share Units
Restricted shares and restricted share units are service awards that typically vest over three years. These awards are share-settled and are recorded in additional paid-in capital on the consolidated balance sheets. The fair value of these awards is measured at the grant date and expensed over the service period. The following table summarizes the activity related to restricted shares and restricted share awards during 2020:
Number of
SharesWeighted-Average
Share PriceNonvested — January 1 64,572 $180.49Granted 70,012 152.28Vested (38,961) 174.93Forfeited (373) 177.73Nonvested — December 31 95,250 161.60
The unrecognized compensation cost related to our unvested restricted share and restricted share unit awards as of December 31, 2020 was $7.9 million. This cost is recognizable over the next 2.07 years, which is the weighted average contractual life.
Performance Share Units ("PSUs")
PSUs are share-settled and vest following the end of the three-year performance period. The number of shares to vest will be determined by a performance adjustment based on either (i) the change in fully diluted book value per share ("FDBVPS") over three years, or (ii) average annual non-GAAP operating income return on equity, excluding StarStone.
Performance Share Units based on FDBVPS
The following table summarizes the awards granted, the vested and unvested PSU awards at December 31, 2020, and the performance criteria and associated performance multipliers at various levels of achievement.
Table of Contents
ENSTAR GROUP LIMITEDNOTES TO THE CONSOLIDATED FINANCIAL STATEMENTS — (Continued)
218

Grant Year
Inception-to-date Activity Roll-forwardPerformance Criteria:
Change in FDBVPS (3 year) Performance Multiplier
Levels Per Award Agreements
PSUs Granted at Target Forfeited
Estimated Change in Multiplier Vested
Unvested at
December 31, 2020 Threshold Target Target + Maximum Threshold Target Target + Maximum
2017 36,321 (12,267) 9,527 (33,581) — 20.00 % 30.00 % N/A 40.00 % 50.00 % 100.00 % N/A 150.00 %
2017 91,875 — 18,100 (109,975) — 30.30 % 35.65 % N/A 41.00 % 50.00 % 100.00 % N/A 150.00 %
2018 39,682 (12,545) 10,218 (6,700) 30,655 25.00 % 32.50 % N/A 40.00 % 50.00 % 100.00 % N/A 150.00 %
2019 18,308 (1,758) 7,835 (881) 23,504 20.00 % 30.00 % N/A 40.00 % 60.00 % 100.00 % N/A 150.00 %
2020 22,591 (2,151) — (701) 19,739 25.00 % 32.50 % N/A 40.00 % 60.00 % 100.00 % N/A 150.00 %
2020 52,948 — — — 52,948 33.10 % 36.80 % 44.30 % 52.10 % 50.00 % 100.00 % 150.00 % 200.00 %
261,725 (28,721) 45,680 (151,838) 126,846
For each type of PSU based on FDBVPS, a change in the FDBVPS Performance Criteria at each of Threshold, Target and Maximum will result in the application of the respective Threshold, Target and Maximum Performance Multiplier and a settlement of awards at that level. In addition, for the 2020 FDBVPS Type II award, a change in the FDBVPS Performance Criteria at "Target +" will result in the application of the "Target +" Performance Multiplier. Straight-line interpolation applies within these ranges, and no settlement occurs if the increase in FDBVPS is less than the Threshold.
Performance Share Units based on Average Annual Non-GAAP Operating Income Return on Equity ("Operating ROE")
The following table summarizes the awards granted, the vested and unvested units at December 31, 2020, and the performance criteria and associated performance multipliers at various levels of achievement.
Grant Year
Inception-to-date Activity Roll-forwardPerformance Criteria:
Average Annual Operating ROE Performance Multiplier
Levels Per Award Agreements
PSUs Granted at Target Forfeited
Estimated Change in Multiplier Vested
Unvested at December 31,
2020 Threshold Target Maximum Threshold Target Maximum2019 18,308 (1,756) 7,811 (930) 23,433 9.60 % 12.00 % 14.40 % 60.00 % 100.00 % 150.00 %
2020 22,560 (2,151) — (701) 19,708 9.60 % 12.00 % 14.40 % 60.00 % 100.00 % 150.00 %
40,868 (3,907) 7,811 (1,631) 43,141
Annual Operating ROE is calculated based upon the non-GAAP operating income return on opening shareholder's equity, excluding StarStone. Average Annual Operating ROE is the sum of the three individual year annual operating ROE %'s divided by three. An Average Annual Operating ROE of Target to Maximum or more results in a settlement of 100% to a maximum of 150% of the units granted, respectively. An Average Annual Operating ROE of Threshold to Target results in a settlement of 60% to 100%. Straight-line interpolation applies within these ranges and no settlement occurs if the Average Annual Operating ROE is less than the Threshold.
Performance Multipliers
For expense purposes we assume a Target vesting at the initial time of award. At the end of each reporting period, we estimate the expected performance multiplier, as shown in the table below:
Award Description 2020 2019 2018
2017 FDBVPS Type I (30.00% Target Change) 139% (1) 139% 50%
2017 FDBVPS Type II (35.65% Target Change) 120% (1) 120% 50%
2018 FDBVPS 150% (1) 100% 50%
2019 FDBVPS 150% 100% N/A
2019 Average Operating ROE 150% 100% N/A
2020 FDBVPS Type I (32.50% Target Change) 100% N/A N/A
2020 Average Operating ROE 100% N/A N/A
2020 FDBVPS Type II (36.80% Target Change) 100% N/A N/A(1) Multipliers for the 2017 and 2018 awards are the final achieved terms.
Table of Contents
ENSTAR GROUP LIMITEDNOTES TO THE CONSOLIDATED FINANCIAL STATEMENTS — (Continued)
219

The unrecognized compensation cost related to our unvested PSU share awards as of December 31, 2020 was $14.4 million. This cost is recognizable over the next 1.9 years, which is the weighted average contractual life.
Roll-forward of Performance Share Units
The following table summarizes the activity related to PSUs during 2020:
Number of
SharesWeighted-Average
Share Price
Nonvested — January 1 206,949 $185.61
Granted 98,099 167.94
Change in performance multiplier 25,850 179.71
Vested (153,469) 187.24
Forfeited (7,442) 146.76
Nonvested — December 31 169,987 174.10
Cash-Settled Stock Appreciation Rights
Cash-settled stock appreciation right awards ("SARs") give the holder the right, upon exercise, to receive in cash the difference between the market price per share of our ordinary shares at the time of exercise and the exercise price of the SARs. The exercise price of each SAR is equal to the market price of our ordinary shares on the date of the grant. Vested SARs are exercisable for periods not to exceed either 4 years or 10 years from the date of grant. We have not granted any new SARs since 2015.
The following table summarizes the activity related to SARs during 2020:
Number of
SARs
Weighted-Average Exercise
Price of SARs
Weighted-Average Expected Term
(in years)
Aggregate Intrinsic Value(1)
Balance, beginning of year 89,227 $ 143.33 Exercised (12,793) 136.94 Balance, end of year 76,434 144.40 1.90 $ 4,623 (1) The aggregate intrinsic value is calculated as the pre-tax difference between the exercise price of the underlying share awards and the
closing price per share of our ordinary shares of $204.89 on December 31, 2020.
Compensation expense for SARs is based on the estimated fair value on the date of grant using the Black-Scholes valuation model, which requires the use of subjective assumptions related to the expected stock price volatility, expected term, expected dividend yield and risk-free interest rate. SARs are liability-classified awards for which compensation expense and the liability are re-measured using the then-current Black Scholes assumptions at each interim reporting date based upon the portion of the requisite service period rendered. There was no unrecognized compensation cost related to our SARs as of December 31, 2020.
The following table sets forth the assumptions used to estimate the fair value of the SARs using the Black-Scholes option valuation model as of December 31, 2020, 2019 and 2018:
2020 2019 2018Weighted-average fair value per SAR $ 78.47 $ 76.03 $ 45.85 Weighted-average volatility 49.43 % 19.75 % 18.94 %Weighted-average risk-free interest rate 0.15 % 1.64 % 2.72 %Dividend yield 0.00 % 0.00 % 0.00 %
Joint Share Ownership Plan
Under the JSOP, we have the ability to make equity awards to our U.K.-based staff through which a recipient acquires jointly held interests in a set number of our Voting Ordinary Shares together with the independent trustee of the EB Trust at fair market value, pursuant to the terms of a joint ownership agreement. Voting rights in respect of shares held in the EB Trust are contractually waived. Shares held in the EB Trust are classified as treasury shares.
On January 21, 2020, a JSOP award comprising 565,630 underlying Voting Ordinary Shares was made to our Chief Executive Officer which cliff-vests after 3 years. The value of the award at vesting, if any, is determined based on the price of our Voting Ordinary Shares appreciating above a certain threshold between the date of grant and the vesting date. If the higher of the closing price per Share on January 20, 2023 and the 10-day volume weighted average price per Share for the ten consecutive trading days ending on January 20, 2023 (each, the "Market Price") is $266.00 or greater (the "Hurdle"), the award will have a value equal to the Market Price, less $205.89, multiplied
Table of Contents
ENSTAR GROUP LIMITEDNOTES TO THE CONSOLIDATED FINANCIAL STATEMENTS — (Continued)
220

by 565,630. If the Market Price is less than $266.00 on such date, the award will have no value. In addition, 20% of the award is subject to a performance condition based on growth in fully diluted book value per share between January 1, 2020 and December 31, 2022.
The accounting for stock-settled JSOP awards is similar to options, whereby the grant date fair value of $13.6 million is expensed over the life of the award. To determine the grant date fair value of $24.13 per share, we utilized a Monte-Carlo valuation model with the following assumptions:
2020Weighted-average volatility 18.66 %Weighted-average risk-free interest rate 1.55 %Dividend yield 0.00 %
The unrecognized compensation cost related to our unvested JSOP share awards as of December 31, 2020 was $9.4 million. This cost is recognizable over the next 2.1 years, which is the weighted average contractual life.
Other share-based compensation plansNorthshore and Atrium Incentive Plans
Our subsidiary, Northshore, had long-term incentive plans that award time-based restricted shares of Northshore to certain Atrium employees. Shares generally vested over two to three years. These share awards have been classified as liability awards. There is no unrecognized compensation as we de-consolidated Northshore on January 1, 2021 as discussed in Note 5 - "Divestitures, Held-for-Sale Businesses and Discontinued Operations."
StarStone Incentive Plan
Our subsidiary, StarStone, had long-term incentive plans that were cash-settled plans for StarStone employees. The awards were based on StarStone's performance over two to three years. These share awards were classified as liability awards. The plan was terminated and awards settled during 2020. There is no unrecognized compensation cost.
Deferred Compensation and Ordinary Share Plan for Non-Employee Directors
The number of units credited to the accounts of non-employee directors for the years ended December 31, 2020, 2019 and 2018 under the Enstar Group Limited Deferred Compensation and Ordinary Share Plan for Non-Employee Directors (the "Deferred Compensation Plan") were 7,204, 5,976 and 5,691, respectively.
Employee Share Purchase Plan
We provide an Employee Share Purchase Plan whereby eligible employees may purchase Enstar shares at a 15% discount to market price, in an amount of share value limited to the lower of $21,250 or 15% of the employee's base salary. The 15% discount is expensed as compensation cost. The number of shares issued to employees under the Employee Share Purchase Plan for the years ended December 31, 2020, 2019 and 2018 were 16,914, 15,269 and 14,183, respectively.
Pension PlansWe provide retirement benefits to eligible employees through various plans that we sponsor. Pension expense
can be affected by changes in our employee headcount. The table below summarizes the expense related to our Defined Contribution Plans and our Defined Benefit Plan for the years ended December 31, 2020, 2019 and 2018.
2020 2019 2018Defined contribution plans $ 11,791 $ 11,798 $ 11,434 Defined benefit plan 2,975 684 2,243 Total pension expense $ 14,766 $ 12,482 $ 13,677
The increase in the 2020 defined benefit plan pension expense was driven by annuity purchases for partial risk transfer of certain plan liabilities. During 2020, an actuarial review was performed on the defined benefit plan, which determined that the plan’s unfunded liability, as of December 31, 2020 and 2019 was $6.9 million and $8.9 million, respectively. As of December 31, 2020 and 2019, we had an accrued liability of $6.9 million and $8.9 million, respectively, for this plan.
Table of Contents
ENSTAR GROUP LIMITEDNOTES TO THE CONSOLIDATED FINANCIAL STATEMENTS — (Continued)
221

20. INCOME TAXATION Enstar Group Limited is incorporated under the laws of Bermuda and under Bermuda law is not required to
pay taxes in Bermuda based upon income or capital gains. The Company, under the Exempted Undertakings Tax Protection Act of 1966, is protected against any legislation that may be enacted in Bermuda which would impose any tax on profits, income, or gain until March 31, 2035.
We have foreign operating subsidiaries and branch operations principally located in the United States, United Kingdom, Continental Europe and Australia that are subject to federal, foreign, state and local taxes in those jurisdictions. The undistributed earnings from our foreign subsidiaries will be indefinitely reinvested in those jurisdictions where the undistributed earnings were earned.
Deferred tax liabilities have not been accrued with respect to the undistributed earnings of our foreign subsidiaries. Generally, when earnings are distributed as dividends, withholding taxes may be imposed by the jurisdiction of the paying subsidiary. For our U.S. subsidiaries, we have not currently accrued any withholding taxes with respect to unremitted earnings because, solely for U.S. Federal income tax purposes, there are no accumulated positive earnings and profits that could be subject to U.S. dividend withholding tax. For our United Kingdom subsidiaries, there are no withholding taxes imposed as a matter of UK domestic tax law. For our other foreign subsidiaries, an insignificant amount of earnings is indefinitely reinvested; however, it would not be practicable to compute the related amounts of withholding taxes due to a variety of factors, including the amount, timing and manner of any repatriation. Because we operate in many jurisdictions, our net earnings are subject to risk due to changing tax laws and tax rates around the world. The current, rapidly changing economic environment may increase the likelihood of substantial changes to tax laws in the jurisdictions in which we operate.
Income Tax ExpenseThe following table presents earnings (loss) before income taxes by jurisdiction attributable to continuing
operations, including earnings from equity method investments, for the years ended December 31, 2020, 2019 and 2018:
2020 2019 2018Domestic (Bermuda) $ 1,503,505 $ 576,338 $ (232,743) Foreign 231,444 356,878 15,293 Total earnings (loss) before income taxes attributable to continuing operations $ 1,734,949 $ 933,216 $ (217,450)
The following table presents our current and deferred income tax expense (benefit) attributable to continuing operations by jurisdiction for the years ended December 31, 2020, 2019 and 2018:
2020 2019 2018Current:
Domestic (Bermuda) $ — $ — $ — Foreign 15,232 16,330 (917)
15,232 16,330 (917) Deferred:
Domestic (Bermuda) — — — Foreign 8,595 (3,958) (2,772)
8,595 (3,958) (2,772) Total income tax expense (benefit) attributable to continuing operations $ 23,827 $ 12,372 $ (3,689)
Table of Contents
ENSTAR GROUP LIMITEDNOTES TO THE CONSOLIDATED FINANCIAL STATEMENTS — (Continued)
222

The actual effective income tax rate differs from the statutory rate of 0 percent under Bermuda law to earnings (loss) attributable to continuing operations before income taxes, including earnings (loss) from equity method investments for the years ended December 31, 2020, 2019 and 2018 as shown in the following reconciliation:
2020 2019 2018Earnings (loss) before income taxes $ 1,734,949 $ 933,216 $ (217,450) Bermuda income taxes at statutory rate 0.0 % 0.0 % 0.0 %Foreign income tax rate differential 1.2 % 8.6 % 0.6 %Change in valuation allowance 0.1 % (7.2) % (1.8) %U.S. base erosion and anti-abuse tax — % 0.3 % (0.3) %Other 0.1 % (0.4) % 3.2 %Effective tax rate 1.4 % 1.3 % 1.7 %
Our effective tax rate is generally driven by the geographical distribution of our pre-tax earnings between our taxable and non-taxable jurisdictions.
Deferred Tax Assets and LiabilitiesDeferred tax assets and liabilities (included in other assets and other liabilities, respectively, on the
consolidated balance sheet) reflect the tax effect of the differences between the financial statement carrying amount and the income tax bases of assets and liabilities. Significant components of the deferred tax assets and deferred tax liabilities as of December 31, 2020 and 2019 were as follows:
2020 2019Deferred tax assets:
Net operating loss carryforwards $ 141,459 $ 144,609 Insurance reserves 22,238 7,535 Unearned premiums 68 151 Provisions for bad debt 407 6,172 Defendant asbestos and environmental liabilities 121,006 140,000 Other deferred tax assets 16,696 3,230
Deferred tax assets 301,874 301,697 Valuation allowance (118,229) (117,390) Deferred tax assets, net of valuation allowance 183,645 184,307
Deferred tax liabilities:Unrealized gains on investments (20,185) (14,079) Lloyd's underwriting profit taxable in future periods (15,555) (8,852) Deferred policy acquisition cost — (8,267) Other deferred tax liabilities (9,242) (13,390)
Deferred tax liabilities (44,982) (44,588)
Net deferred tax asset $ 138,663 $ 139,719
Net Deferred Tax Asset (Liability) Balance by Major Jurisdiction:
December 31,2020 2019
Net Deferred Tax Asset
Net Deferred Tax Asset
United States $ 156,730 $ 154,700 United Kingdom (18,095) (16,074) Other 28 1,093 Total $ 138,663 $ 139,719
Table of Contents
ENSTAR GROUP LIMITEDNOTES TO THE CONSOLIDATED FINANCIAL STATEMENTS — (Continued)
223

Net Operating Loss Carryforwards:
As of December 31, 2020, we had net operating loss carryforwards that could be available to offset future taxable income, as follows:
Tax Jurisdiction Loss Carryforwards Tax effect ExpirationOperating and Capital Loss Carryforwards:United States - Net operating loss $ 428,732 $ 90,034 2024-2038United Kingdom 185,230 35,194 IndefinitelyLuxembourg 17,200 4,300 2035-2036Other 48,683 11,931 Indefinitely
The U.S. and UK net operating loss carryforwards are also subject to certain utilization limitations and have been considered in management's assessment of Valuation Allowance.
Assessment of Valuation Allowance on Deferred Tax Assets
As of December 31, 2020 and 2019, we had deferred tax asset valuation allowances of $118.2 million and $117.4 million, respectively, related to foreign subsidiaries. We recorded a net increase of $0.8 million in our deferred tax valuation allowance primarily due to a change in deferred tax assets which management does not believe meet the "more likely than not" realization standard.
The realization of deferred tax assets is dependent on generating sufficient taxable income in future periods in which the tax benefits are deductible or creditable. The amount of the deferred tax asset considered realizable, however, could be revised in the future if estimates of future taxable income change. Income taxes are determined and assessed jurisdictionally by legal entity or by filing group. Certain jurisdictions require or allow combined or consolidated tax filings. We have estimated future taxable income of our foreign subsidiaries and provided a valuation allowance in respect of those assets where we do not expect to realize a benefit. We have considered all available evidence using a “more likely than not” standard in determining the amount of the valuation allowance. We considered the following evidence: (i) net earnings or losses in recent years; (ii) the future sustainability and likelihood of positive net earnings of our subsidiaries; (iii) the carryforward periods of tax losses including the effect of reversing temporary differences; and (iv) tax planning strategies, in making our determination. The assumptions used in determining future taxable income require significant judgment and any changes in these assumptions could have an impact on earnings.
Unrecognized Tax BenefitsDuring the years ended December 31, 2020, 2019 and 2018, there were no unrecognized tax benefits. There
were no accruals for the payment of interest and penalties related to unrecognized tax benefits as of each of December 31, 2020, 2019 and 2018.
Open Tax YearsOur operating subsidiaries may be subject to audit by various tax authorities and may have different statutes
of limitations expiration dates. Tax authorities may propose adjustments to our income taxes. Listed below are the tax years that remain subject to examination by a major tax jurisdiction as of December 31, 2020:
Major Tax Jurisdiction Open Tax YearsUnited States 2017-2020United Kingdom 2019-2020Australia 2015-2020
21. RELATED PARTY TRANSACTIONS Stone Point Capital LLC
Through several private transactions occurring from May 2012 to July 2012 and an additional private transaction that closed in May 2018, investment funds managed by Stone Point Capital LLC ("Stone Point") have acquired an aggregate of 1,635,986 of our Voting Ordinary Shares (which constitutes 8.8% of our outstanding Voting Ordinary Shares). On November 6, 2013, we appointed James D. Carey to our Board of Directors. Mr. Carey is the sole member of an entity that is one of four general partners of the entities serving as general partners for Trident, is a member of the investment committees of such general partners, and is a member and senior principal
Table of Contents
ENSTAR GROUP LIMITEDNOTES TO THE CONSOLIDATED FINANCIAL STATEMENTS — (Continued)
224

of Stone Point, the manager of the Trident funds.
On November 30, 2020, we completed the sale and recapitalization of StarStone U.S. to Core Specialty in a transaction described in Note 5 - "Divestitures, Held-for-Sale Businesses and Discontinued Operations".
Pursuant to the terms of a Recapitalization Agreement entered into on August 13, 2020 among us, the Trident V Funds, which are advised by Stone Point, and the Dowling Funds (the "Recapitalization Agreement"), we agreed to exchange a portion of our indirect interest in Northshore, the holding company that owns Atrium and Arden, for all of the Trident V Funds’ indirect interest in StarStone U.S. (the “Exchange Transaction”), which is described in Note 5 - "Divestitures, Held-for-Sale Businesses and Discontinued Operations."
Our interests in StarStone and Atrium are held through North Bay, which is a joint venture between us, the Trident V Funds and the Dowling Funds. As of December 31, 2020, we had an indirect 59.0% interest in North Bay and the Trident V Funds and the Dowling Funds owned 39.3% and 1.7%, respectively. North Bay owned 100% of StarStone Specialty Holdings Limited ("SSHL"), the holding company for the StarStone group, which included StarStone U.S. and StarStone International. North Bay also owned 92% of Northshore. North Bay also owns the preferred equity of three segregated cells within our wholly-owned subsidiary Fitzwilliam Insurance Limited (the “Fitzwilliam Cells”) that have provided reinsurance to StarStone and are considered part of StarStone International. Following the completion of the sale and recapitalization of StarStone U.S. and the Exchange Transaction, we now own 25.23% of Core Specialty on a fully diluted basis, which owns StarStone U.S., and 13.8% of Northshore, which continues to own Atrium and Arden. The Trident V Funds own 76.3% of Northshore, and the Dowling Funds own 0.4% of Core Specialty and 1.6% of Northshore. The Exchange Transaction had no impact on the ultimate ownership of SSHL, which continues to own StarStone International, with us, the Trident V Funds and the Dowling Funds retaining our and their prior ownership interests in SSHL of 59.0%, 39.3% and 1.7%, respectively.
In connection with the closing of the Exchange Transaction, we entered into amended and restated shareholders’ agreements with the Trident V Funds and the Dowling Funds with respect to our investment in SSHL and Northshore. With respect to SSHL, we have the right to designate three of five members of the SSHL board of directors and the Trident V Funds have the right to designate the other two members. The Trident V Funds also have certain customary rights as a minority shareholder to approve certain material matters and transactions. Each shareholder of SSHL must provide us and the Trident V Funds with a right of first offer to acquire its shares in SSHL if such shareholder wishes to sell them. Each shareholder will also have certain rights to participate in sales of SSHL shares by the other shareholders, and we have certain rights to cause the Trident V Funds and the Dowling Funds to sell their SSHL shares if we wish to sell control of SSHL or the StarStone International business.
Also pursuant to the terms of the shareholders’ agreement for SSHL, at any time after December 31, 2022, the Trident V Funds have the right to cause us to purchase their shares in SSHL at their fair market value, and the Dowling Funds have the right to participate in any such sale transaction initiated by the Trident V Funds. We would be entitled to pay the purchase price for such SSHL shares in cash or in unrestricted ordinary shares of Enstar that are then listed or admitted to trading on a national securities exchange. At any time after March 31, 2023, we will have the right to cause the Trident V Funds and the Dowling Funds to sell their shares in SSHL to us at their fair market value. We would be obligated to pay the purchase price for such SSHL shares in cash.
Pursuant to the terms of the shareholders’ agreement for Northshore, for so long as we own 50% or more of the Northshore shares we held upon the closing of the Exchange Transaction, we have the right to designate one member to the board of directors of Northshore and each of its material subsidiaries. Our shares in Northshore are subject to an 18-month restriction on transfer following the closing of the Exchange Transaction, after which the Trident V Funds have a right of first offer to acquire our shares in Northshore if we wish to sell them. We have certain rights to participate in sales of Northshore shares by the Trident V Funds, and the Trident V Funds have certain rights to cause us to sell our Northshore shares if the Trident V Funds wish to sell control of Northshore or the Atrium business. We, in partnership with StarStone's other shareholders, have previously completed transactions to provide capital support to StarStone in the form of:
(i) a contribution to its contributed surplus account and a loss portfolio transfer, effective October 1, 2018. To fund the transaction, the North Bay shareholders contributed an aggregate amount of $135.0 million to North Bay in proportion to their ownership interests. Trident’s proportionate contribution of $53.1 million was temporarily funded by North Bay and was reimbursed in the first quarter of 2019; and
(ii) a loss portfolio transfer, effective April 1, 2019, for which shareholders agreed to contribute an aggregate amount of $48.0 million.
Table of Contents
ENSTAR GROUP LIMITEDNOTES TO THE CONSOLIDATED FINANCIAL STATEMENTS — (Continued)
225

In addition, Enstar has separately entered into a loss portfolio transfer and adverse development cover with StarStone effective October 1, 2019, whereby StarStone transferred $189.4 million in loss reserves and unearned premium to a wholly-owned Enstar subsidiary in exchange for premium of $189.4 million. Enstar also provided an additional $59.0 million adverse development cover in excess of the $189.4 million.
As of December 31, 2020 and December 31, 2019, the RNCI on our balance sheet relating to these Trident co-investment transactions was $350.2 million and $420.5 million, respectively.
As of December 31, 2020, we had the following additional relationships with Stone Point and its affiliates:
• Investments in funds (carried within other investments) managed by Stone Point, with respect to which we recognized net unrealized gains (losses);
• Investments in registered investment companies affiliated with entities owned by Trident or otherwise affiliated with Stone Point, with respect to which we recognized net unrealized gains (losses) and interest income;
• Separate accounts managed by Eagle Point Credit Management, PRIMA Capital Advisors and SKY Harbor Capital Management, which are affiliates of entities owned by Trident, with respect to which we incurred management fees;
• Investments in funds (carried within other investments) managed by Sound Point Capital, an entity in which Mr. Carey has an indirect minority ownership interest and serves as a director, with respect to which we recognized net unrealized gains (losses);
• Sound Point Capital has acted as collateral manager for certain of our direct investments in CLO debt and equity securities, with respect to which we recognized net unrealized gains (losses) and interest income;
• Marble Point Capital, which is an affiliate of an entity owned by Trident, has acted as collateral manager for certain of our direct investments in CLO debt and equity securities, with respect to which we recognized net unrealized gains (losses) and interest income;
• A separate account managed by Sound Point Capital, with respect to which we incurred management fees in prior periods;
• In the fourth quarter of 2018, we invested $25.0 million in Mitchell TopCo Holdings, the parent company of Mitchell International and Genex Services, as a co-investor alongside certain Trident funds; and
• In the second quarter of 2020, we invested $10.0 million in a 2 year senior secured unrated floating rate term loan facility with an extension option which was arranged and managed by Sound Point Capital. The facility's borrower, Amplify U.S. Inc., is a subsidiary of Evergreen (as defined below) and has used the proceeds to purchase AmTrust's preferred stock. The facility ranks senior to all other claims of the borrower, the purchased preferred stock and cash flows therefrom serve as collateral, and AmTrust has provided an unsecured guarantee for the facility. For further information on our relationships with Evergreen and AmTrust, refer to the AmTrust section below.
Table of Contents
ENSTAR GROUP LIMITEDNOTES TO THE CONSOLIDATED FINANCIAL STATEMENTS — (Continued)
226

The following table presents the amounts included in our consolidated balance sheet related to our related party transactions with Stone Point and its affiliated entities:
December 31, 2020 December 31, 2019Short-term investments, AFS, at fair value $ 878 $ 1,431 Fixed maturities, trading, at fair value 196,086 269,131 Fixed maturities, AFS, at fair value 227,397 160,303 Equities, at fair value 103,914 121,794 Other investments, at fair value:
Hedge funds 19,844 18,993 Fixed income funds 210,017 381,449 Private equity funds 37,262 34,858 CLO equities 38,658 32,560 CLO equity funds 166,523 87,509 Private Debt 27,016 16,312 Real estate fund 27,278 18,106
Total investments 1,054,873 1,142,446 Cash and cash equivalents 23,933 54,080 Other assets 403 10 Other liabilities 745 4,710 Net investment $ 1,078,464 $ 1,191,826
The following table presents the amounts included in net earnings related to our related party transactions with Stone Point and its affiliated entities:
2020 2019 2018Net investment income $ 16,325 $ 8,733 $ 7,424 Net realized and unrealized gains (losses) 23,750 26,631 207 Total net earnings $ 40,075 $ 35,364 $ 7,631
KaylaRe On December 15, 2016, KaylaRe completed an initial capital raise of $620.0 million. We originally owned
48.2% of KaylaRe's common shares and recorded our investment in KaylaRe using the equity method basis of accounting, pursuant to the conclusion that we were not required to consolidate following an analysis based on the guidance in ASC 810 - Consolidation.
On May 14, 2018, we completed a transaction to acquire all of the outstanding shares and warrants of KaylaRe, following the receipt of all required regulatory approvals. In consideration for the acquired shares and warrants of KaylaRe, we issued an aggregate of 2,007,017 ordinary shares, comprising 1,501,778 voting ordinary shares and 505,239 Series E non-voting ordinary shares to the shareholders of KaylaRe as follows: (i) 1,204,353 voting ordinary shares and 505,239 Series E Shares to a fund managed by Hillhouse Capital Management, Ltd.; (ii) 285,986 voting ordinary shares to Trident; and (iii) 11,439 voting ordinary shares to the minority shareholder. In addition, the Shareholders Agreement between Enstar and the other KaylaRe shareholders was effectively terminated. Effective May 14, 2018 we consolidated KaylaRe into our consolidated financial statements and any balances between KaylaRe and Enstar are now eliminated on consolidation. Refer to Note 3 - "Business Acquisitions" for additional information. Effective September 30, 2019, KaylaRe and KaylaRe Ltd. merged with Cavello Bay Reinsurance Limited, a wholly-owned subsidiary of the Company, with Cavello Bay Reinsurance Limited as the surviving company.
Table of Contents
ENSTAR GROUP LIMITEDNOTES TO THE CONSOLIDATED FINANCIAL STATEMENTS — (Continued)
227
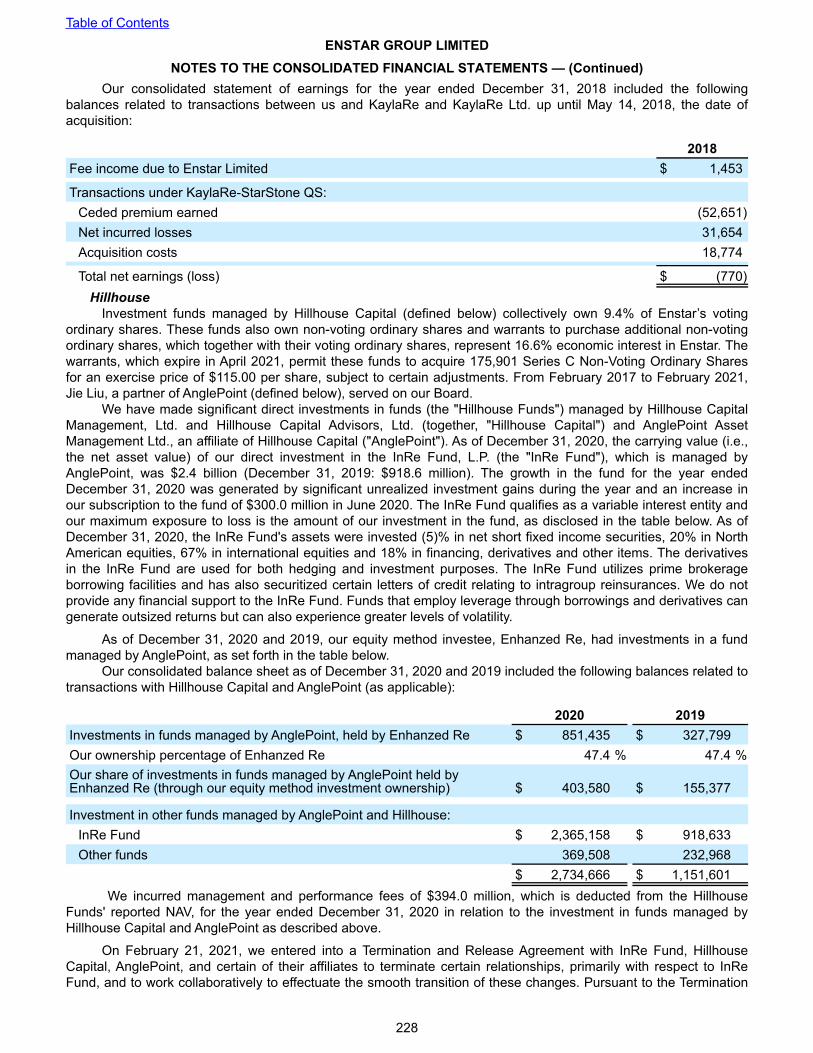
Our consolidated statement of earnings for the year ended December 31, 2018 included the following balances related to transactions between us and KaylaRe and KaylaRe Ltd. up until May 14, 2018, the date of acquisition:
2018Fee income due to Enstar Limited $ 1,453
Transactions under KaylaRe-StarStone QS:Ceded premium earned (52,651) Net incurred losses 31,654 Acquisition costs 18,774
Total net earnings (loss) $ (770) Hillhouse
Investment funds managed by Hillhouse Capital (defined below) collectively own 9.4% of Enstar’s voting ordinary shares. These funds also own non-voting ordinary shares and warrants to purchase additional non-voting ordinary shares, which together with their voting ordinary shares, represent 16.6% economic interest in Enstar. The warrants, which expire in April 2021, permit these funds to acquire 175,901 Series C Non-Voting Ordinary Shares for an exercise price of $115.00 per share, subject to certain adjustments. From February 2017 to February 2021, Jie Liu, a partner of AnglePoint (defined below), served on our Board.
We have made significant direct investments in funds (the "Hillhouse Funds") managed by Hillhouse Capital Management, Ltd. and Hillhouse Capital Advisors, Ltd. (together, "Hillhouse Capital") and AnglePoint Asset Management Ltd., an affiliate of Hillhouse Capital ("AnglePoint"). As of December 31, 2020, the carrying value (i.e., the net asset value) of our direct investment in the InRe Fund, L.P. (the "InRe Fund"), which is managed by AnglePoint, was $2.4 billion (December 31, 2019: $918.6 million). The growth in the fund for the year ended December 31, 2020 was generated by significant unrealized investment gains during the year and an increase in our subscription to the fund of $300.0 million in June 2020. The InRe Fund qualifies as a variable interest entity and our maximum exposure to loss is the amount of our investment in the fund, as disclosed in the table below. As of December 31, 2020, the InRe Fund's assets were invested (5)% in net short fixed income securities, 20% in North American equities, 67% in international equities and 18% in financing, derivatives and other items. The derivatives in the InRe Fund are used for both hedging and investment purposes. The InRe Fund utilizes prime brokerage borrowing facilities and has also securitized certain letters of credit relating to intragroup reinsurances. We do not provide any financial support to the InRe Fund. Funds that employ leverage through borrowings and derivatives can generate outsized returns but can also experience greater levels of volatility.
As of December 31, 2020 and 2019, our equity method investee, Enhanzed Re, had investments in a fund managed by AnglePoint, as set forth in the table below.
Our consolidated balance sheet as of December 31, 2020 and 2019 included the following balances related to transactions with Hillhouse Capital and AnglePoint (as applicable):
2020 2019Investments in funds managed by AnglePoint, held by Enhanzed Re $ 851,435 $ 327,799 Our ownership percentage of Enhanzed Re 47.4 % 47.4 %Our share of investments in funds managed by AnglePoint held by Enhanzed Re (through our equity method investment ownership) $ 403,580 $ 155,377
Investment in other funds managed by AnglePoint and Hillhouse:InRe Fund $ 2,365,158 $ 918,633 Other funds 369,508 232,968
$ 2,734,666 $ 1,151,601 We incurred management and performance fees of $394.0 million, which is deducted from the Hillhouse
Funds' reported NAV, for the year ended December 31, 2020 in relation to the investment in funds managed by Hillhouse Capital and AnglePoint as described above.
On February 21, 2021, we entered into a Termination and Release Agreement with InRe Fund, Hillhouse Capital, AnglePoint, and certain of their affiliates to terminate certain relationships, primarily with respect to InRe Fund, and to work collaboratively to effectuate the smooth transition of these changes. Pursuant to the Termination
Table of Contents
ENSTAR GROUP LIMITEDNOTES TO THE CONSOLIDATED FINANCIAL STATEMENTS — (Continued)
228

and Release Agreement, AnglePoint will cease to serve as the InRe Fund's investment manager on or prior to April 1, 2021 in connection with the intended purchase of AnglePoint’s Hong Kong affiliate (“AnglePoint HK”) by us or our designee from affiliates of Hillhouse Capital. As part of those transactions, AnglePoint will assign its investment management agreement with InRe Fund to AnglePoint HK. In connection with AnglePoint ceasing to serve as investment manager, affiliates of Hillhouse Capital agreed to a deduction of $100.0 million from amounts due to them from the InRe Fund and to waive their right to receive any performance fees that could have been earned for 2021. The Agreement also includes mutual releases of certain liabilities and obligations between Enstar and its affiliates on the one hand and Hillhouse and its affiliates on the other hand.
In the first quarter of 2021, as a result of the Termination and Release Agreement, we will re-evaluate our conclusions with regard to consolidation of the InRe Fund in accordance with the accounting for variable interest entities.
Monument ReMonument Insurance Group Limited ("Monument Re") was established in October 2016 and Enstar has
invested a total of $59.6 million in the common and preferred shares of Monument Re as of December 31, 2020 (December 31, 2019: $26.6 million). We own 20% of the common shares of Monument Re, as well as different classes of preferred shares which have fixed dividend yields, and which collectively represented a total economic interest of 23.0% as of December 31, 2020 (December 31, 2019: 23.5%). In connection with our investment in Monument Re, we entered into a Shareholders Agreement with the other shareholders and have accounted for our equity interest in Monument Re as an equity method investment since we have significant influence over its operating and financial policies.
On May 31, 2019, we completed the transfer of our remaining life assurance policies written by our wholly-owned subsidiary Alpha Insurance SA to a subsidiary of Monument Re. In this transaction, we transferred policy benefits for life and annuity contracts with a carrying value of €88.8 million (or $99.1 million) and total assets with a fair value of €91.1 million (or $101.6 million) to a subsidiary of Monument Re.
Our investment in the common and preferred shares of Monument Re, which is included in equity method investments on our consolidated balance sheet, as of December 31, 2020 and 2019 was $193.7 million and $60.6 million, respectively.
During the twelve months ended December 31, 2020 and 2019 our share of net earnings on our investment in Monument Re was $88.3 million and $19.8 million, respectively. In addition, we received director fees from Monument Re of less than $0.1 million in connection with one of our representatives serving on Monument Re's board of directors during the twelve months ended December 31, 2020.
Clear Spring (formerly SeaBright)Effective January 1, 2017, we sold SeaBright Insurance Company (“SeaBright Insurance”) to Clear Spring PC
Acquisition Corp., a subsidiary of Delaware Life Insurance Company ("Delaware Life"). Following the sale, SeaBright Insurance was capitalized with $56.0 million of equity, with Enstar retaining a 20% indirect equity interest in SeaBright Insurance. Subsequently, SeaBright Insurance was renamed Clear Spring Property and Casualty Company ("Clear Spring"). Effective December 30, 2020, we sold our remaining interest in Clear Spring to Delaware Life for $12.2 million and recorded a gain on sale of $0.6 million in the fourth quarter of 2020. As a result, Clear Spring was not a related party as of December 31, 2020.
Prior to the sale, we accounted for our equity interest in Clear Spring as an equity method investment as we had significant influence over its operating and financial policies. Our investment in the common shares of Clear Spring which is included in equity method investments on our consolidated balance sheet, as of December 31, 2020 and 2019 was $0 and $10.6 million, respectively.
During the twelve months ended December 31, 2020 and 2019 our share of net earnings on our investment in Clear Spring was $1.0 million and $0.6 million, respectively.
Effective January 1, 2017, StarStone National Insurance Company (“StarStone National”) entered into a ceding quota share treaty with Clear Spring pursuant to which Clear Spring reinsures 33.3% of core workers' compensation business written by StarStone National. This agreement was terminated as of December 31, 2018.
Effective January 1, 2017, we also entered into an assuming quota share treaty with Clear Spring pursuant to which an Enstar subsidiary reinsures 25% of all workers' compensation business written by Clear Spring. This is recorded as other activities.
Table of Contents
ENSTAR GROUP LIMITEDNOTES TO THE CONSOLIDATED FINANCIAL STATEMENTS — (Continued)
229

As noted above, Clear Spring was not a related party as of December 31, 2020. Our consolidated balance sheet as of December 31, 2019 included the following balances between us and Clear Spring:
2019Balances under StarStone ceding quota share included, in assets or liabilities held-for-sale:
Reinsurance balances recoverable on paid and unpaid losses $ 22,812 Prepaid insurance premiums 51 Ceded payable 3,616 Ceded acquisition costs 21
Balances under assuming quota share:Losses and LAE 6,135 Unearned reinsurance premiums 13 Funds held 8,611
Our consolidated statement of earnings for the years ended December 31, 2020, 2019 and 2018 included the following amounts between us and Clear Spring:
2020 2019 2018Transactions under StarStone ceding quota share, included in net earnings (loss) from discontinued operations:
Ceded premium earned $ 122 $ (14,994) (29,520) Net incurred losses and LAE 2,730 6,567 18,143 Acquisition costs 56 356 7,035
Transactions under assuming quota share:Premium earned (15) 3,749 7,380 Net incurred losses and LAE 1,014 (2,202) (4,536) Acquisition costs 11 (92) (1,836)
Total net earnings (loss) $ 3,918 $ (6,616) $ (3,334) AmTrust
In November 2018, pursuant to a Subscription Agreement with Evergreen Parent L.P. ("Evergreen"), K-Z Evergreen, LLC and Trident Pine Acquisition LP ("Trident Pine"), we purchased equity in Evergreen in the aggregate amount of $200.0 million. Evergreen is an entity formed by private equity funds managed by Stone Point and the Karfunkel-Zyskind family that acquired the 45% of the issued and outstanding shares of common stock of AmTrust that the Karfunkel-Zyskind Family and certain of its affiliates and related parties did not already own or control. The equity interest was in the form of equity securities issued at the same price and in the same proportion as the equity interest purchased by Trident Pine. In a second transaction in December 2019, Enstar acquired an additional $25.9 million of Evergreen securities from another investor.
Following the closing of the second transaction, Enstar owns 8.5% of the equity interest in Evergreen and Trident Pine owns 21.8%. Evergreen owns all of the equity interest in AmTrust. In addition, upon the successful closing of the transaction we received a fee of $3.3 million, half of which was received upon closing, and the other half was received on the first anniversary of the closing. The fee was recorded in full in other income within our consolidated statements of earnings for the year ended December 31, 2018.
Our indirect investment in the shares of AmTrust, carried in equities on our consolidated balance sheet, as of December 31, 2020 and 2019 was $230.3 million and $240.1 million, respectively.
Table of Contents
ENSTAR GROUP LIMITEDNOTES TO THE CONSOLIDATED FINANCIAL STATEMENTS — (Continued)
230

The following table presents the amounts included in net earnings related to our related party transactions with AmTrust:
2020 2019 2018Net investment income $ 7,365 $ 7,667 $ 299 Net realized and unrealized gains (11,183) 10,086 — Total net earnings $ (3,818) $ 17,753 $ 299
CitcoIn June 2018, we made a $50.0 million indirect investment in the shares of Citco III Limited ("Citco"), a fund
administrator with global operations. As of December 31, 2020, we owned 31.9% of the common shares in HH CTCO Holdings Limited, which in turn owns 15.4% of the convertible preferred shares, amounting to a 6.2% interest in the total equity of Citco. Pursuant to an investment agreement and in consideration for participation therein, a related party of Hillhouse Capital provided us with investment support. In a private transaction that preceded our co-investment opportunity, certain Citco shareholders, including Trident, agreed to sell all or a portion of their interests in Citco. As of December 31, 2020, Trident owned 3.4% interest in Citco. Mr. Carey currently serves as an observer to the board of directors of Citco in connection with Trident's investment therein.
Our indirect investment in the shares of Citco, which is included in equity method investments on our consolidated balance sheet, as of December 31, 2020 and 2019 was $53.0 million and $51.7 million, respectively.
During the twelve months ended December 31, 2020 and 2019 our share of net earnings on our indirect investment in Citco was $2.2 million and $2.7 million, respectively.
Enhanzed ReEnhanzed Re is a joint venture between Enstar, Allianz SE ("Allianz") and Hillhouse Capital that was
capitalized in December 2018. Enhanzed Re is a Bermuda-based Class 4 and Class E reinsurer and will reinsure life, Non-life Run-off, and property and casualty insurance business, initially sourced from Allianz and Enstar. Enstar, Allianz and Hillhouse Capital affiliates have made equity investment commitments in the aggregate of $470.0 million to Enhanzed Re. Enstar owns 47.4% of the entity, Allianz owns 24.9%, and an affiliate of Hillhouse Capital owns 27.7%. As of December 31, 2020, Enstar contributed $154.1 million of its total capital commitment to Enhanzed Re and had an uncalled amount of $68.7 million. We have accounted for our equity interest in Enhanzed Re as an equity method investment as we have significant influence over its operating and financial policies.
Enstar acts as the (re)insurance manager for Enhanzed Re, for which it receives fee income recorded within fees and commission income, AnglePoint acts as the primary investment manager, and an affiliate of Allianz provides investment management services. Enhanzed Re writes business from affiliates of its operating sponsors, Allianz SE and Enstar. It also underwrites other business to maximize diversification by risk and geography.
Our investment in the common shares of Enhanzed Re, which is included in equity method investments on our consolidated balance sheet, as of December 31, 2020 and 2019 was $330.3 million and $182.9 million, respectively.
During the twelve months ended December 31, 2020 and 2019 our share of net earnings on our investment in Enhanzed Re was $147.3 million and $28.9 million, respectively.
We have ceded 10% of the Zurich and AXA transactions, as discussed in Note 4 - "Significant New Business," to Enhanzed Re on the same terms and conditions as those received by Enstar.
During the year ended December 31, 2020, one of our UK-based Non-life Run-off subsidiaries ceded $137.0 million of net loss reserves to Enhanzed Re. The reinsurance is on a funds held basis with fixed crediting rates.
Our consolidated balance sheet as of December 31, 2020 and 2019 included the following balances between us and Enhanzed Re:
2020 2019Balances under ceding quota share:
Reinsurance balances recoverable $ 208,379 $ 59,601 Funds held 193,981 50,089 Insurance balances payables 1,276 1,443
Other assets 730 1,033
Table of Contents
ENSTAR GROUP LIMITEDNOTES TO THE CONSOLIDATED FINANCIAL STATEMENTS — (Continued)
231

Our consolidated statement of earnings for the years ended December 31, 2020 and 2019 included the following amounts between us and Enhanzed Re:
2020 2019Amounts under ceding quota share:
Ceded premium earned $ (391) $ — Net incurred losses and LAE (5,977) — Acquisition costs 169 73 Net investment income (4,272) — Net realized and unrealized gains (740) — Other income 2,617 — Fees and commission income 572 749 Total Net earnings $ (8,022) $ 822
Change in unrealized gains (losses) on AFS investments $ (2,729) $ — Core Specialty
Following the sale and recapitalization of StarStone U.S. as described in Note 5 - "Divestitures, Held-for-Sale Businesses and Discontinued Operations," our investment in the common shares of Core Specialty, which is included in equity method investments on our consolidated balance sheet was $235.0 million as of December 31, 2020.
In connection with the sale and recapitalization of StarStone U.S. we entered into an LPT and ADC reinsurance agreement with respect to StarStone U.S.’ legacy reserves. Concurrent with the closing of the LPT and ADC reinsurance agreement, we entered into an ASA with StarStone U.S., through which one of our wholly-owned subsidiaries was appointed as an independent contractor to provide certain administrative services covering the business we assumed from StarStone U.S. through the LPT and ADC reinsurance agreement.
In addition, concurrent with the sale of StarStone U.S. to Core Specialty, one of our wholly-owned subsidiaries entered into a TSA with Core Specialty through which our subsidiary and Core Specialty agreed to provide certain transitional services to each other relating to the StarStone U.S. businesses, for a specified period of time.
On completion of the sale and recapitalization of StarStone U.S. on November 30, 2020, we received $235.0 million of Core Specialty shares and $51.5 million of cash. Subsequently, the cash component of the consideration has been determined to be $47.0 million. The surplus of $4.5 million is repayable to Core Specialty and is recorded within other liabilities.
Furthermore, there are existing reinsurance agreements whereby (i) certain of our subsidiaries provide reinsurance protection to StarStone U.S. ("the assuming reinsurances") and (ii) StarStone U.S. provides reinsurance protection to certain of our subsidiaries ("the ceding reinsurances"). These arrangements remain in place.
Table of Contents
ENSTAR GROUP LIMITEDNOTES TO THE CONSOLIDATED FINANCIAL STATEMENTS — (Continued)
232

Our consolidated balance sheet as of December 31, 2020 included the following balances between us and Core Specialty:
2020Balances under assuming quota share, LPT and ADC reinsurances:
Funds held by reinsured companies $ 58,086 Other assets 38,846 Losses and loss adjustment expenses 682,637 Insurance and reinsurance balances payable 24,806 Other liabilities 5,003
Balances under ceding reinsurances:Reinsurance balances recoverable on paid and unpaid losses 1,736
Balances under service agreements:Other assets 6,727 Other liabilities 328
Balances under sale and recapitalization agreement:Other liabilities 4,512
Our consolidated statement of earnings for the year ended December 31, 2020 included the following amounts between us and Core Specialty:
2020Transactions under assuming quota share, LPT and ADC reinsurances:
Net premiums earned $ 76 Net incurred losses and loss adjustment expenses (1,223) Acquisition costs 458
Transactions under service agreements:Fees and commission income 4,004
Total net earnings $ 3,315
22. DIVIDEND RESTRICTIONS AND STATUTORY FINANCIAL INFORMATION Parent Company Dividend Restrictions
There were no significant restrictions on the Parent Company's ability to pay dividends from retained earnings as of December 31, 2020. Bermuda law permits the payment of dividends if (i) we are not, or would not be after payment, unable to pay our liabilities as they become due and (ii) the realizable value of our assets is in excess of our liabilities after taking such payment into account. We have not historically declared a dividend on our ordinary shares. The issuance of our Series D and E Preferred Shares have resulted in the declaration of dividends. Holders of Series D and Series E Preferred Shares are entitled to receive, only when, as and if declared, non-cumulative cash dividends, paid quarterly in arrears on the 1st day of March, June, September and December of each year of 7.0% per annum. Refer to Note 17 - "Shareholders' Equity" for details regarding dividends on preferred shares.
The Bermuda Monetary Authority ("BMA") acts as group supervisor to Enstar. On an annual basis, we are required to file group statutory financial statements, a group statutory financial return, a group capital and solvency return, audited group financial statements and a Group Solvency Self-Assessment ("GSSA") with the BMA. The
Table of Contents
ENSTAR GROUP LIMITEDNOTES TO THE CONSOLIDATED FINANCIAL STATEMENTS — (Continued)
233

GSSA is designed to document our perspective on the capital resources necessary to achieve our business strategies and remain solvent, and to provide the BMA with insights on our risk management, governance procedures and documentation related to this process. We are required to maintain available group statutory capital and surplus in an amount that is at least equal to the group enhanced capital requirement ("Group ECR"). The BMA has also established a group target capital level equal to 120% of the Group ECR. We are in compliance with these requirements.
Our ability to pay dividends to our shareholders is dependent upon the ability of our (re)insurance subsidiaries to distribute capital and pay dividends to us. Our (re)insurance subsidiaries are subject to certain regulatory restrictions on the distribution of capital and payment of dividends in the jurisdictions in which they operate, as described below. The restrictions are generally based on net income or levels of capital and surplus as determined in accordance with the relevant statutory accounting practices. Failure of these subsidiaries to meet their applicable regulatory requirements could result in restrictions on any distributions of capital or retained earnings or stricter regulatory oversight of the subsidiaries.
Our ability to pay dividends and make other forms of distributions may also be limited by repayment obligations and financial covenants in our outstanding loan facility agreements.
Subsidiary Statutory Financial Information and Dividend RestrictionsOur (re)insurance subsidiaries prepare their statutory financial statements in accordance with statutory
accounting practices prescribed or permitted by local regulators. Statutory and local accounting differs from U.S. GAAP, including in the treatment of investments, acquisition costs and deferred income taxes, amongst other items.
The statutory capital and surplus amounts for the years ended December 31, 2020 and 2019 and statutory net income amounts for the years ended December 31, 2020, 2019 and 2018 for our (re)insurance subsidiaries based in Bermuda, the United Kingdom, Australia, the United States and Continental Europe are summarized in the table below which includes information relating to acquisitions from the year of acquisition:
Statutory Capital and Surplus
Required Actual Statutory Income 2020 2019 2020 2019 2020 2019 2018Bermuda $ 2,711,687 $ 2,138,395 $ 5,565,429 $ 4,016,663 $ 1,850,913 $ 643,683 $ 29,486 U.K. 803,685 837,104 1,224,208 1,532,751 43,219 154,644 (52,936) U.S. 185,904 364,507 554,339 861,379 (67,477) 121,406 (75,005) Europe 95,746 94,334 214,115 229,344 (983) 11,816 (17,611) Australia 18,858 18,110 58,531 37,815 (1,722) 4,847 1,761
As of December 31, 2020, the total amount of net assets of our consolidated subsidiaries that were restricted was $3.8 billion.
Certain material aspects of these laws and regulations as they relate to solvency, dividends and capital and surplus are summarized below.
Bermuda
Our Bermuda-based (re)insurance subsidiaries are registered under the Insurance Act 1978 of Bermuda and related regulations, as amended (the "Insurance Act"). The Insurance Act imposes certain solvency and liquidity standards and auditing and reporting requirements and grants the BMA powers to supervise, investigate, require information and the production of documents and intervene in the affairs of insurance companies.
The Insurance Act requires that our Bermuda-based (re)insurance subsidiaries maintain certain solvency and liquidity standards. The minimum liquidity ratio requires that the value of relevant assets not be less than 75% of the amount of relevant liabilities. The minimum solvency margin, which varies depending on the class of the insurer, is determined as a percentage of either net reserves for losses and LAE or premiums. Our Bermuda subsidiaries with commercial insurance licenses are required to maintain a minimum statutory capital and surplus (Enhanced Capital Requirement or "ECR") at least equal to the greater of a minimum solvency margin or the Bermuda Solvency Capital Requirement ("BSCR"). The BSCR is calculated based on a standardized risk-based capital model as provided by the BMA.
Each of our regulated Bermuda subsidiaries would be prohibited from declaring or paying any dividends if it were in breach of its minimum solvency margin or liquidity ratio or if the declaration or payment of such dividends
Table of Contents
ENSTAR GROUP LIMITEDNOTES TO THE CONSOLIDATED FINANCIAL STATEMENTS — (Continued)
234

would cause it to fail to meet such margin or ratio. In addition, each of our regulated Bermuda subsidiaries is prohibited, without the prior approval of the BMA, from reducing by 15% or more its total statutory capital, or from reducing by 25% of more its total statutory capital and surplus, as set out in its previous year’s statutory financial statements. Our Bermuda insurance companies that are in run-off are required to seek BMA approval for any dividends or distributions.
As of December 31, 2020 and 2019, each of our Bermuda-based (re)insurance subsidiaries exceeded their respective minimum solvency and liquidity requirements. The Bermuda (re)insurance subsidiaries in aggregate exceeded minimum solvency requirements by $2.9 billion as of December 31, 2020 (2019: $1.9 billion) and were in compliance with their liquidity requirements.
United Kingdom
U.K. Insurance Companies (non-Lloyd's)
Our U.K. based insurance subsidiaries are regulated by the U.K. Prudential Regulatory Authority (the "PRA") and the Financial Conduct Authority (the "FCA", together with the PRA, the "U.K. Regulator").
Our U.K.-based insurance subsidiaries are required to maintain adequate financial resources in accordance with the requirements of the U.K. Regulator. Insurers must comply with a Solvency Capital Requirement ("SCR"), which is calculated using either the Solvency II standard formula or a bespoke internal model. Our non-Lloyd's U.K. companies use the standard formula for determining compliance with the SCR.
The calculation of the minimum capital resources requirements in any particular case depends on, among other things, the type and amount of insurance business written and claims paid by the insurance company. As of December 31, 2020 and 2019, all of our U.K. insurance subsidiaries maintained capital in excess of the minimum capital resources requirements and complied with the relevant U.K. Regulator requirements. Our U.K.-based insurance subsidiaries, including our Lloyd's Syndicates described below, in aggregate, maintained capital in excess of the minimum capital resources requirements by $420.5 million and $695.6 million as of December 31, 2020 and 2019, respectively.
The U.K. Regulator’s rules require our U.K. insurance subsidiaries to obtain regulatory approval for any proposed or actual payment of a dividend. The U.K. Regulator uses the SCR, among other tests, when assessing requests to make distributions.
Lloyd’s
As of December 31, 2020, we participated in the Lloyd’s market through our interests in: (i) Atrium’s Syndicate 609, which is managed by Atrium Underwriters Limited, a Lloyd's managing agent; (ii) StarStone’s Syndicate 1301, which is managed by StarStone Underwriting Limited ("SUL"), a Lloyd’s managing agent; and (iii) Syndicate 2008, a wholly aligned syndicate that has permission to underwrite RITC business and other run-off or discontinued business type transactions with other Lloyd’s syndicates. We participated on each of the three syndicates through a single, wholly owned Lloyd’s corporate member. SUL serves as managing agent for Syndicate 2008. On November 17, 2020, we announced an agreement to sell SUL, together with the right to operate StarStone's Syndicate 1301; and on January 1, 2021, we sold the Atrium business. These transactions are discussed further in Note 5 - "Divestitures, Held-for-Sale Businesses and Discontinued Operations."
The underwriting capacity of a member of Lloyd’s is supported by providing Funds at Lloyd’s, as described in Note 6 - "Investments". Business plans, including maximum underwriting capacity, for Lloyd’s syndicates requires annual approval by the Lloyd’s Franchise Board, which may require changes to any business plan or additional capital to support underwriting plans.
The Lloyd’s market has applied the Solvency II internal model under Lloyd’s supervision, and our Lloyd’s operations are required to meet Solvency II standards. Lloyd's has the approval of the PRA to use its internal model under the Solvency II regime.
United States
Our U.S. Non-life Run-off (re)insurance subsidiaries are subject to the insurance laws and regulations of the states in which they are domiciled, licensed and/or eligible to conduct business. These laws restrict the amount of dividends the subsidiaries can pay to us. The restrictions are generally based on statutory net income and/or certain levels of statutory surplus as determined in accordance with the relevant statutory accounting requirements of the individual domiciliary states or states in which any of the (re)insurance subsidiaries are commercially domiciled. Generally, prior regulatory approval must be obtained before an insurer may make a distribution above a specified
Table of Contents
ENSTAR GROUP LIMITEDNOTES TO THE CONSOLIDATED FINANCIAL STATEMENTS — (Continued)
235

level.
The U.S. (re)insurance subsidiaries are also required to maintain minimum levels of solvency and liquidity as determined by law, and to comply with Risk-Based Capital ("RBC") requirements and licensing rules as specified by the National Association of Insurance Commissioners ("NAIC"). RBC is used to evaluate the adequacy of capital and surplus maintained by our U.S. (re)insurance subsidiaries in relation to three major risk areas associated with: (i) asset risk; (ii) insurance risk and (iii) other risks. For all of our U.S. (re)insurance subsidiaries, with the exception of one subsidiary which has a permitted accounting practice to treat an adverse development cover reinsurance agreement as prospective reinsurance, there are no prescribed or permitted statutory accounting practices that differ significantly from the statutory accounting principles established by NAIC.
As of December 31, 2020, all of our U.S. non-life (re)insurance subsidiaries exceeded their required levels of risk-based capital. On an aggregate basis, our U.S. non-life (re)insurance subsidiaries exceeded their minimum levels of risk-based capital as of December 31, 2020 by $362.2 million (2019: $488.3 million).
Europe
Our Liechtenstein insurance subsidiary (StarStone Insurance SE) is regulated by the Liechtenstein Financial Market Authority ("FMA") pursuant to the Liechtenstein Insurance Supervisory Act. This subsidiary is obligated to maintain a minimum solvency margin based on the Solvency II regulations. As of December 31, 2020, this subsidiary exceeded the Solvency II requirements by $97.6 million (2019: $119.0 million). The amount of dividends that this subsidiary is permitted to distribute is restricted to freely distributable reserves, which consist of retained earnings, the current year profit and legal reserves. Any dividend exceeding the current year profit requires the FMA’s approval. Solvency and capital requirements for this subsidiary are based on the Solvency II framework and must continue to be met following any distribution.
Our Belgian insurance subsidiary files financial statements and returns with the National Bank of Belgium. This subsidiary was in compliance with its solvency and capital requirements under Solvency II.
Australia
The Company’s Australian insurance subsidiary is regulated and subject to prudential supervision by the Australian Prudential Regulation Authority (“APRA”). APRA is the primary regulatory body responsible for regulating compliance with the Insurance Act 1973. APRA’s prudential standards require that all insurers maintain and meet prescribed capital adequacy requirements designed to ensure that insurers to meet their insurance obligations under a wide range of scenarios.
A run-off insurer must obtain APRA’s written consent prior to making any capital releases, including any payment of dividends, not from current year profits. The Company’s insurance subsidiary must provide APRA a valuation prepared by its Appointed Actuary that demonstrates that the tangible assets of the insurer, after the proposed capital reduction, are sufficient to cover its insurance liabilities.
23. COMMITMENTS AND CONTINGENCIES Concentration of Credit Risk
We believe that there are no significant concentrations of credit risk associated with our cash and cash equivalents, fixed maturity investments, or other investments. Our cash and investments are managed pursuant to guidelines that follow prudent standards of diversification and liquidity, and limit the allowable holdings of a single issue and issuers. We are also subject to custodial credit risk on our investments, which we manage by diversifying our holdings amongst large financial institutions that are highly regulated.
We have exposure to credit risk on certain of our assets pledged to ceding companies under insurance contracts. In addition, we are potentially exposed should any insurance intermediaries be unable to fulfill their contractual obligations with respect to payments of balances owed to and by us.
Credit risk exists in relation to (re)insurance balances recoverable on paid and unpaid losses. We remain liable to the extent that counterparties do not meet their contractual obligations and, therefore, we evaluate and monitor concentration of credit risk among our (re)insurers.
We are also subject to credit risk in relation to funds held by reinsured companies. Under funds held arrangements, the reinsured company has retained funds that would otherwise have been remitted to our reinsurance subsidiaries. The funds may be placed into trust or subject to other security arrangements. However,
Table of Contents
ENSTAR GROUP LIMITEDNOTES TO THE CONSOLIDATED FINANCIAL STATEMENTS — (Continued)
236

we generally have the contractual ability to offset any shortfall in the payment of the funds held balances with amounts owed by us. As of December 31, 2020, we had a significant funds held concentration of $955.0 million to one reinsured company which has financial strength credit ratings of A+ from A.M. Best and AA from S&P.
We limit the amount of credit exposure to any one counterparty and none of our counterparty credit exposures, excluding U.S. government instruments and the counterparty noted above, exceeded 10% of shareholders’ equity as of December 31, 2020. Our credit exposure to the U.S. government was $1.4 billion as of December 31, 2020.
Legal ProceedingsWe are, from time to time, involved in various legal proceedings in the ordinary course of business, including
litigation and arbitration regarding claims. Estimated losses relating to claims arising in the ordinary course of business, including the anticipated outcome of any pending arbitration or litigation are included in the liability for losses and LAE in our consolidated balance sheets. In addition to claims litigation, we may be subject to other lawsuits and regulatory actions in the normal course of business, which may involve, among other things, allegations of underwriting errors or omissions, employment claims or regulatory activity. We do not believe that the resolution of any currently pending legal proceedings, either individually or taken as a whole, will have a material effect on our business, results of operations or financial condition. We anticipate that, similar to the rest of the (re)insurance industry, we will continue to be subject to litigation and arbitration proceedings in the ordinary course of business, including litigation generally related to the scope of coverage with respect to asbestos and environmental and other claims.
Unfunded Investment CommitmentsAs of December 31, 2020, we had unfunded commitments of $975.5 million to other investments, $68.7
million to equity method investments and $5.0 million to fixed maturity investments.
GuaranteesAs of December 31, 2020 and 2019, parental guarantees and capital instruments supporting subsidiaries'
insurance obligations were $1.5 billion and $1.0 billion, respectively. We also guarantee the Junior Subordinated Notes and the FAL facility, which are described in Note 15 - "Debt Obligations and Credit Facilities."
Redeemable Noncontrolling Interest We have the right to purchase the RNCI interests from the RNCI holders at certain times in the future (each
such right, a "call right") and the RNCI holders have the right to sell their RNCI interests to us at certain times in the future (each such right, a "put right"). Pursuant to the Exchange Transaction described in Note 21 - "Related Party Transactions" we exchanged a portion of our indirect interest in Northshore, the holding company that owns Atrium and Arden, for all of the Trident V Funds' indirect interest in StarStone U.S. on January 1, 2021. Following the closing of the Exchange Transaction, we have maintained a call right over the portion of SSHL owned by the Trident V Funds and the Dowling Funds, and they will maintain put rights to transfer those interests to us.
LeasesWe have recognized a right-of-use asset and an offsetting lease liability on our consolidated balance sheets,
relating primarily to office space and facilities that we have leased to conduct our business operations. On an ongoing basis we determine whether an arrangement is a lease or contains a lease at inception and also complete an assessment to determine the classification of each lease as either a finance lease or an operating lease. Our leases are all currently classified as operating leases.
Our leases have remaining lease terms of one year to 36 years, some of which include options to extend the lease term for up to five years and some of which include options to terminate the lease within one year. We consider these options in determining the lease term used to establish our right-of-use assets and lease liabilities. Renewal options that we believe we are likely to exercise are considered when determining lease terms. Our lease agreements do not contain any material residual value guarantees or material restrictive covenants.
Since a majority of our leases do not provide an implicit discount rate, we use our collateralized incremental borrowing rate in determining the present value of lease payments.
Table of Contents
ENSTAR GROUP LIMITEDNOTES TO THE CONSOLIDATED FINANCIAL STATEMENTS — (Continued)
237

The table below provides the lease cost and other information relating to our operating leases for the years ended December 31, 2020 and 2019:
2020 2019Lease cost:Operating lease cost $ 12,720 $ 13,627 Short-term lease cost(1) 246 — Total lease cost 12,966 13,627 Sub-lease income(2) (553) (542) Total net lease cost $ 12,413 $ 13,085
Other information:Operating cash paid for amounts included in the measurement of lease liabilities $ 13,421 $ 11,129 Non-cash activity: right-of-use assets relating to leases 295 57,536 Weighted-average remaining lease term 6.1 years 6.3 yearsWeighted-average discount rate 6.5 % 6.3 %
(1) Leases with an initial lease term of twelve months or less are not recognized within our consolidated balance sheets.(2) Sub-lease income consists of rental income received from third parties to whom we have sub-leased some of our leased office spaces and is
included within other income in our consolidated statements of earnings.
Lease expense for the year ended December 31, 2018 was $11.3 million, relating to office space and facilities that we leased to conduct our business operations.
The table below provides a summary of the operating leases recorded on our consolidated balance sheets for the years ended December 31, 2020 and 2019:
Balance sheet classification 2020 2019Right-of-use assets (1) (2) Other assets $ 32,297 $ 46,747 Current lease liabilities (2) Other liabilities 7,959 11,403 Non-current lease liabilities (2) Other liabilities 27,064 34,785
(1) Following our decision to put the StarStone International operations into orderly run-off effective June 10, 2020, we recorded total impairment charges of $3.5 million on the right-of-use assets relating to certain StarStone International operating leases as of December 31, 2020.
(2) The right-of-use assets and the total lease liability balances exclude balances of $1.0 million and $0.8 million respectively, related to Atrium which have been reclassified to held-for-sale balances on our consolidated balance sheet as of December 31, 2020.
The table below provides a summary of the contractual maturities of our operating lease liabilities:
2021 2022 2023 2024 20252026 and beyond
Total lease payments
Less: Imputed interest
Present value of lease liabilities
Contractual maturities $ 9,774 8,099 7,267 5,561 4,534 8,577 43,812 (8,789) $ 35,023
Table of Contents
ENSTAR GROUP LIMITEDNOTES TO THE CONSOLIDATED FINANCIAL STATEMENTS — (Continued)
238

24. SEGMENT INFORMATION We have three reportable segments of business that are each managed, operated and separately reported:
(i) Non-life Run-off; (ii) Atrium; and (iii) StarStone. Our other activities, which do not qualify as a reportable segment, include our corporate expenses, debt servicing costs, holding company income and expenses, foreign exchange and other miscellaneous items. These segments are described in Note 1 - "Description of Business."
As discussed in Note 5 - "Divestitures, Held-for-Sale Businesses and Discontinued Operations," the strategic transactions related to our Atrium and StarStone segments will enable us to focus on our core Non-life Run-off business. We will review and assess our segment structure in 2021 to reflect the changes to the StarStone and Atrium segments in the fourth quarter of 2020 and the first quarter of 2021, respectively.
The following tables set forth selected and consolidated statement of earnings results by segment for the years ended December 31, 2020, 2019, and 2018:
2020
Non-life Run-off Atrium StarStone Other Total
Gross premiums written $ 5,191 $ 206,656 $ 326,695 $ 13,441 $ 551,983
Net premiums written $ 2,987 $ 183,194 $ 233,202 $ 13,441 $ 432,824
Net premiums earned $ 58,695 $ 175,393 $ 318,115 $ 19,889 $ 572,092
Net incurred losses and LAE (44,995) (87,226) (266,738) (16,967) (415,926)
Acquisition costs (20,177) (59,611) (90,797) (435) (171,020)
Operating expenses (200,990) (13,078) (81,853) — (295,921)
Underwriting income (loss) (207,467) 15,478 (121,273) 2,487 (310,775)
Net investment income 282,048 5,542 27,443 (12,216) 302,817
Net realized and unrealized gains 1,627,526 4,165 10,328 — 1,642,019
Fees and commission income 19,462 22,984 — — 42,446
Other income (losses) 99,940 131 3,734 (2,673) 101,132
Corporate expenses (97,727) (21,522) (42,011) (44,298) (205,558)
Interest income (expense) (67,195) — (2,110) 9,997 (59,308)
Net foreign exchange gains (losses) (13,214) 4,327 (10,140) 2,634 (16,393)
EARNINGS (LOSS) BEFORE INCOME TAXES 1,643,373 31,105 (134,029) (44,069) 1,496,380
Income tax expense (17,412) (4,122) (902) (1,391) (23,827)
Earnings from equity method investments 238,569 — — — 238,569 NET EARNINGS (LOSS) FROM CONTINUING OPERATIONS 1,864,530 26,983 (134,931) (45,460) 1,711,122 Net earnings from discontinued operations, net of income taxes — — 16,251 — 16,251
NET EARNINGS (LOSS) 1,864,530 26,983 (118,680) (45,460) 1,727,373 Net (earnings) loss attributable to noncontrolling interest 1,597 (11,059) 37,133 — 27,671 NET EARNINGS (LOSS) ATTRIBUTABLE TO ENSTAR 1,866,127 15,924 (81,547) (45,460) 1,755,044
Dividends on preferred shares — — — (35,700) (35,700) NET EARNINGS (LOSS) ATTRIBUTABLE TO ENSTAR ORDINARY SHAREHOLDERS $ 1,866,127 $ 15,924 $ (81,547) $ (81,160) $ 1,719,344
Underwriting ratios:
Loss ratio 49.7 % 83.8 %
Acquisition expense ratio 34.0 % 28.5 %
Operating expense ratio 7.5 % 25.8 %
Combined ratio 91.2 % 138.1 %
Table of Contents
ENSTAR GROUP LIMITEDNOTES TO THE CONSOLIDATED FINANCIAL STATEMENTS — (Continued)
239

2019Non-life Run-off Atrium StarStone Other Total
Gross premiums written $ (25,069) $ 192,373 $ 472,815 $ 18,534 $ 658,653
Net premiums written $ (25,338) $ 172,356 $ 379,523 $ 18,512 $ 545,053
Net premiums earned $ 168,496 $ 164,059 $ 451,112 $ 20,380 $ 804,047 Net incurred losses and LAE (51,625) (77,276) (469,240) (16,038) (614,179) Acquisition costs (73,642) (56,956) (109,369) (642) (240,609) Operating expenses (199,756) (14,452) (60,627) — (274,835)
Underwriting income (loss) (156,527) 15,375 (188,124) 3,700 (325,576) Net investment income 275,236 7,049 34,396 (8,410) 308,271 Net realized and unrealized gains 968,350 6,195 31,572 5,849 1,011,966 Fees and commission income 18,293 10,160 — — 28,453 Other income 34,809 140 329 1,792 37,070 Corporate expenses (70,689) (13,825) (7,790) (45,945) (138,249) Interest income (expense) (62,055) — (475) 9,989 (52,541) Net foreign exchange gains (losses) 9,918 (504) (1,505) 3 7,912 EARNINGS (LOSS) BEFORE INCOME TAXES 1,017,335 24,590 (131,597) (33,022) 877,306 Income tax expense (7,250) (4,033) (1,004) (85) (12,372) Earnings (losses) from equity method investments 56,128 — (218) — 55,910 NET EARNINGS (LOSS) FROM CONTINUING OPERATIONS 1,066,213 20,557 (132,819) (33,107) 920,844 Net earnings from discontinued operations, net of income taxes — — 7,375 — 7,375 NET EARNINGS (LOSS) 1,066,213 20,557 (125,444) (33,107) 928,219 Net (earnings) loss attributable to noncontrolling interest (6,409) (8,432) 24,711 — 9,870 NET EARNINGS (LOSS) ATTRIBUTABLE TO ENSTAR 1,059,804 12,125 (100,733) (33,107) 938,089 Dividends on preferred shares — — — (35,914) (35,914) NET EARNINGS (LOSS) ATTRIBUTABLE TO ENSTAR ORDINARY SHAREHOLDERS $ 1,059,804 $ 12,125 $ (100,733) $ (69,021) $ 902,175
Underwriting ratios:Loss ratio 47.1 % 104.0 %Acquisition expense ratio 34.7 % 24.2 %Operating expense ratio 8.8 % 13.5 %Combined ratio 90.6 % 141.7 %
Table of Contents
ENSTAR GROUP LIMITEDNOTES TO THE CONSOLIDATED FINANCIAL STATEMENTS — (Continued)
240

2018Non-life Run-off Atrium StarStone Other Total
Gross premiums written $ (8,910) $ 171,494 $ 622,570 $ 32,378 $ 817,532
Net premiums written $ (9,217) $ 153,488 $ 478,009 $ 32,067 $ 654,347
Net premiums earned $ 9,427 $ 146,315 $ 515,163 $ 24,874 $ 695,779 Net incurred losses and LAE 306,067 (69,810) (543,080) (16,899) (323,722) Acquisition costs (4,006) (50,646) (120,517) (2,686) (177,855) Operating expenses (158,731) (17,777) (98,137) — (274,645)
Underwriting income (loss) 152,757 8,082 (246,571) 5,289 (80,443) Net investment income 226,287 5,686 27,000 2,725 261,698 Net realized and unrealized losses (381,712) (3,251) (12,320) (10,249) (407,532) Fees and commission income 16,466 18,622 — — 35,088 Other income (losses) 35,978 162 (550) (1,517) 34,073 Corporate expenses (39,093) (6,921) — (28,127) (74,141) Interest income (expense) (30,616) — (103) 5,023 (25,696) Net foreign exchange gains (losses) 2,534 (3,394) (2,832) 1,048 (2,644) EARNINGS (LOSS) BEFORE INCOME TAXES (17,399) 18,986 (235,376) (25,808) (259,597) Income tax benefit (expense) 3,581 (3,732) 3,892 (52) 3,689
Earnings from equity method investments 42,147 — — — 42,147 NET EARNINGS (LOSS) FROM CONTINUING OPERATIONS 28,329 15,254 (231,484) (25,860) (213,761) Net earnings from discontinued operations, net of income taxes — — 1,489 — 1,489 NET EARNINGS (LOSS) 28,329 15,254 (229,995) (25,860) (212,272) Net (earnings) loss attributable to noncontrolling interest (3,107) (6,257) 71,415 — 62,051 NET EARNINGS (LOSS) ATTRIBUTABLE TO ENSTAR 25,222 8,997 (158,580) (25,860) (150,221) Dividend on preferred shares — — — (12,133) (12,133) NET EARNINGS (LOSS) ATTRIBUTABLE TO ENSTAR ORDINARY SHAREHOLDERS $ 25,222 $ 8,997 $ (158,580) $ (37,993) $ (162,354)
Underwriting ratios:Loss ratio 47.7 % 105.4 %Acquisition expense ratio 34.6 % 23.4 %Operating expense ratio 12.2 % 19.1 %Combined ratio 94.5 % 147.9 %
Table of Contents
ENSTAR GROUP LIMITEDNOTES TO THE CONSOLIDATED FINANCIAL STATEMENTS — (Continued)
241

Gross Premiums Written by Geographical AreaThe following table summarizes our gross premiums written for the year ended December 31, 2020 by
geographic area. Geographic distribution in future years is subject to variation based upon market conditions and business strategies.
Non-life Run-off Atrium StarStone Other Total Total % Total % Total % Total % Total % (In thousands of U.S. dollars, except percentages)United States $ 4,969 95.7 $ 103,411 50.1 $ 61,104 18.7 $ 13,441 100.0 $ 182,925 33.2 United Kingdom (229) (4.4) 14,054 6.8 105,057 32.2 — — 118,882 21.5 Europe 1,615 31.1 19,705 9.5 62,181 19.0 — — 83,501 15.1 Asia — — 7,834 3.8 60,262 18.4 — — 68,096 12.3 Rest of World (1,164) (22.4) 61,652 29.8 38,091 11.7 — — 98,579 17.9 Total $ 5,191 100.0 $ 206,656 100.0 $ 326,695 100.0 $ 13,441 100.0 $ 551,983 100.0
Assets by SegmentInvested assets are managed on a subsidiary by subsidiary basis, and investment income and realized and
unrealized gains (losses) on investments are recognized in each segment as earned. Our total assets as of December 31, 2020 and 2019 by segment and for our other activities were as follows:
2020 2019Assets by Segment:
Non-life Run-off (1) $ 19,062,400 $ 15,775,409 Atrium (2) 615,778 580,405 StarStone 2,583,247 3,985,137
Other (614,141) (514,852) Total assets $ 21,647,284 $ 19,826,099
(1) The total assets within the Non-life Run-off segment include assets of $95.5 million related to Arden's operations that have been included within Northshore's held-for-sale assets in Note 5 - "Divestitures, Held-for-Sale Businesses and Discontinued Operations" and Discontinued Operations."
(2) The total assets within the Atrium segment are all included within Northshore's held-for-sale assets in Note 5 - "Divestitures, Held-for-Sale Businesses and Discontinued Operations".
Table of Contents
ENSTAR GROUP LIMITEDNOTES TO THE CONSOLIDATED FINANCIAL STATEMENTS — (Continued)
242
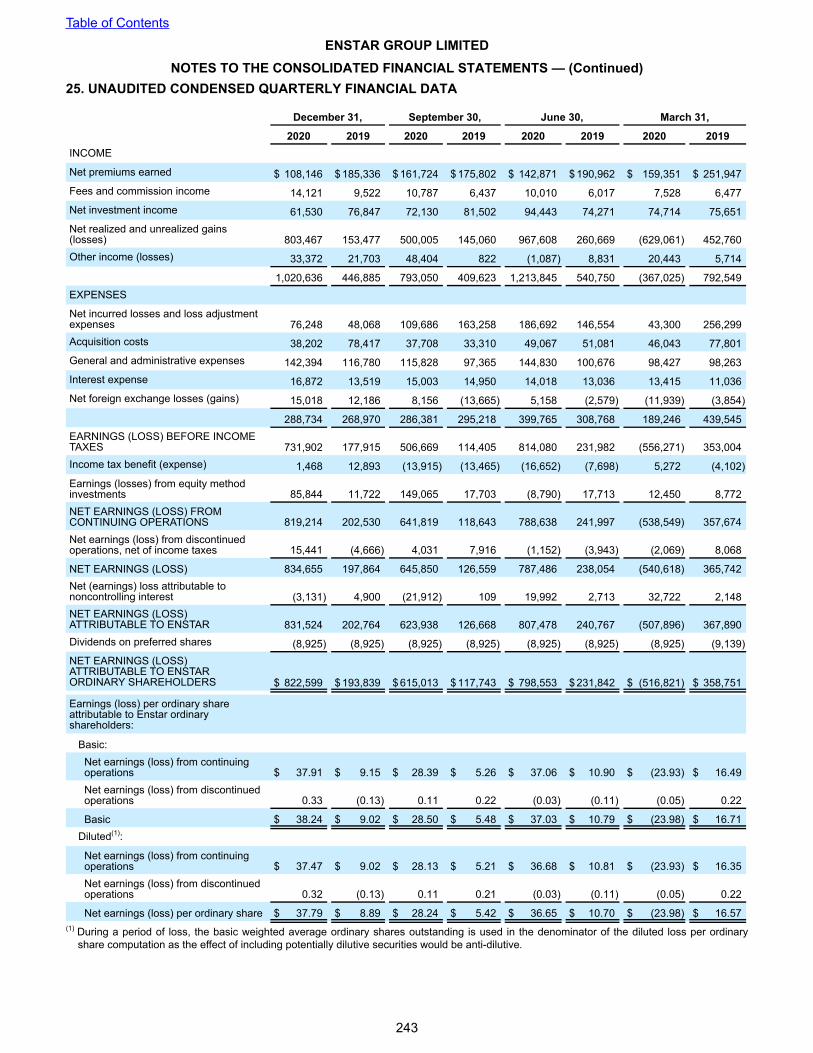
25. UNAUDITED CONDENSED QUARTERLY FINANCIAL DATA
December 31, September 30, June 30, March 31,
2020 2019 2020 2019 2020 2019 2020 2019INCOME
Net premiums earned $ 108,146 $ 185,336 $ 161,724 $ 175,802 $ 142,871 $ 190,962 $ 159,351 $ 251,947 Fees and commission income 14,121 9,522 10,787 6,437 10,010 6,017 7,528 6,477 Net investment income 61,530 76,847 72,130 81,502 94,443 74,271 74,714 75,651 Net realized and unrealized gains (losses) 803,467 153,477 500,005 145,060 967,608 260,669 (629,061) 452,760 Other income (losses) 33,372 21,703 48,404 822 (1,087) 8,831 20,443 5,714
1,020,636 446,885 793,050 409,623 1,213,845 540,750 (367,025) 792,549 EXPENSES
Net incurred losses and loss adjustment expenses 76,248 48,068 109,686 163,258 186,692 146,554 43,300 256,299 Acquisition costs 38,202 78,417 37,708 33,310 49,067 51,081 46,043 77,801 General and administrative expenses 142,394 116,780 115,828 97,365 144,830 100,676 98,427 98,263 Interest expense 16,872 13,519 15,003 14,950 14,018 13,036 13,415 11,036 Net foreign exchange losses (gains) 15,018 12,186 8,156 (13,665) 5,158 (2,579) (11,939) (3,854)
288,734 268,970 286,381 295,218 399,765 308,768 189,246 439,545 EARNINGS (LOSS) BEFORE INCOME TAXES 731,902 177,915 506,669 114,405 814,080 231,982 (556,271) 353,004 Income tax benefit (expense) 1,468 12,893 (13,915) (13,465) (16,652) (7,698) 5,272 (4,102) Earnings (losses) from equity method investments 85,844 11,722 149,065 17,703 (8,790) 17,713 12,450 8,772 NET EARNINGS (LOSS) FROM CONTINUING OPERATIONS 819,214 202,530 641,819 118,643 788,638 241,997 (538,549) 357,674 Net earnings (loss) from discontinued operations, net of income taxes 15,441 (4,666) 4,031 7,916 (1,152) (3,943) (2,069) 8,068
NET EARNINGS (LOSS) 834,655 197,864 645,850 126,559 787,486 238,054 (540,618) 365,742 Net (earnings) loss attributable to noncontrolling interest (3,131) 4,900 (21,912) 109 19,992 2,713 32,722 2,148 NET EARNINGS (LOSS) ATTRIBUTABLE TO ENSTAR 831,524 202,764 623,938 126,668 807,478 240,767 (507,896) 367,890 Dividends on preferred shares (8,925) (8,925) (8,925) (8,925) (8,925) (8,925) (8,925) (9,139) NET EARNINGS (LOSS) ATTRIBUTABLE TO ENSTAR ORDINARY SHAREHOLDERS $ 822,599 $ 193,839 $ 615,013 $ 117,743 $ 798,553 $ 231,842 $ (516,821) $ 358,751
Earnings (loss) per ordinary share attributable to Enstar ordinary shareholders:
Basic:Net earnings (loss) from continuing operations $ 37.91 $ 9.15 $ 28.39 $ 5.26 $ 37.06 $ 10.90 $ (23.93) $ 16.49 Net earnings (loss) from discontinued operations 0.33 (0.13) 0.11 0.22 (0.03) (0.11) (0.05) 0.22
Basic $ 38.24 $ 9.02 $ 28.50 $ 5.48 $ 37.03 $ 10.79 $ (23.98) $ 16.71 Diluted(1):
Net earnings (loss) from continuing operations $ 37.47 $ 9.02 $ 28.13 $ 5.21 $ 36.68 $ 10.81 $ (23.93) $ 16.35 Net earnings (loss) from discontinued operations 0.32 (0.13) 0.11 0.21 (0.03) (0.11) (0.05) 0.22
Net earnings (loss) per ordinary share $ 37.79 $ 8.89 $ 28.24 $ 5.42 $ 36.65 $ 10.70 $ (23.98) $ 16.57 (1) During a period of loss, the basic weighted average ordinary shares outstanding is used in the denominator of the diluted loss per ordinary
share computation as the effect of including potentially dilutive securities would be anti-dilutive.
Table of Contents
ENSTAR GROUP LIMITEDNOTES TO THE CONSOLIDATED FINANCIAL STATEMENTS — (Continued)
243

SCHEDULE IENSTAR GROUP LIMITED
SUMMARY OF INVESTMENTS OTHER THAN INVESTMENTS IN RELATED PARTIESAs of December 31, 2020
(Expressed in thousands of U.S. Dollars)
Type of investment Cost (1) Fair Value
Amount at which shown in the balance sheet
Short-term and fixed maturity investments — Trading and short-term and fixed maturity investments within funds held - directly managed:(2)
U.S. government and agency $ 219,487 $ 233,050 $ 233,050 U.K. government 34,494 37,508 37,508 Other government 321,306 352,026 352,026 Corporate 3,353,054 3,749,383 3,749,383 Municipal 116,588 132,637 132,637 Residential mortgage-backed 219,360 225,074 225,074 Commercial mortgage-backed 554,639 577,602 577,602 Asset-backed 349,941 339,675 339,675 Total 5,168,869 5,646,955 5,646,955
Short-term and fixed maturity investments — AFS:(2)
U.S. government and agency 715,527 717,998 717,998 U.K. government 12,494 13,574 13,574 Other government 142,459 150,127 150,127 Corporate 1,873,184 1,937,349 1,937,349 Municipal 28,881 30,032 30,032 Residential mortgage-backed 326,268 328,871 328,871 Commercial mortgage-backed 273,516 276,488 276,488 Asset-backed 199,467 199,610 199,610 Total 3,571,796 3,654,049 3,654,049
Equities(3) 444,570 512,557 512,557 Other investments, at fair value(4) 982,770 982,770 982,770 Total $ 10,168,005 $ 10,796,331 $ 10,796,331
(1) Original cost of fixed maturity securities is reduced by repayments and adjusted for amortization of premiums or accretion of discounts. (2) The difference in the amount of fixed maturities shown at fair value and the fixed maturities shown in our consolidated balance sheet relates to
the fair value of $18.2 million as of December 31, 2020 for our investment in fixed maturities issued by affiliates of Stone Point. Refer to Note 21 - "Related Party Transactions" of the notes to the consolidated financial statements.
(3) The difference in the amount of equities shown at fair value and the equities shown in our consolidated balance sheet relates to the fair value of $77.1 million as of December 31, 2020 for our investment in a registered investment company affiliated with entities owned by Trident, $26.9 million as a co-investor alongside Stone Point and a $230.3 million investment in AmTrust. Refer to Note 21 - "Related Party Transactions" of the notes to the consolidated financial statements.
(4) The difference in the amount of other investments shown at fair value and the other investments shown in our consolidated balance sheet relates to the fair value of $3.3 billion as of December 31, 2020 for our other investments in funds or companies owned by or affiliated with certain related parties. Refer to Note 21 - "Related Party Transactions" of the notes to the consolidated financial statements.
244

SCHEDULE IIENSTAR GROUP LIMITED
CONDENSED FINANCIAL INFORMATION OF REGISTRANT
Balance Sheets - Parent Company Only As of December 31, 2020 and 2019
2020 2019
(in thousands of U.S.
dollars, except share data)ASSETSCash and cash equivalents $ 7,872 $ 4,568 Balances due from subsidiaries 18,951 134,897 Investments in subsidiaries 7,887,255 6,050,197 Other assets 8,047 6,391 TOTAL ASSETS $ 7,922,125 $ 6,196,053 LIABILITIESDebt obligations $ 903,447 $ 1,191,207 Balances due to subsidiaries 300,987 135,532 Other liabilities 43,296 27,131 TOTAL LIABILITIES 1,247,730 1,353,870 COMMITMENTS AND CONTINGENCIESSHAREHOLDERS’ EQUITYOrdinary shares (par value $1 each, issued and outstanding 2020: 22,085,232; 2019: 21,511,505):
Voting Ordinary Shares (issued and outstanding 2020: 18,575,550; 2019: 18,001,823) 18,576 18,002 Non-voting convertible ordinary Series C Shares (issued and outstanding 2020 and 2019: 2,599,672) 2,600 2,600 Non-voting convertible ordinary Series E Shares (issued and outstanding 2020 and 2019: 910,010) 910 910
Preferred Shares:Series C Preferred Shares (issued and held in treasury 2020 and 2019: 388,571) 389 389 Series D Preferred Shares (issued and outstanding 2020 and 2019: 16,000) 400,000 400,000 Series E Preferred Shares (issued and outstanding 2020 and 2019: 4,400) 110,000 110,000
Treasury shares, at cost (Series C Preferred Shares 2020 and 2019: 388,571) (421,559) (421,559) Joint Share Ownership Plan (voting ordinary shares, held in trust 2020: 565,630; 2019: 0) (566) — Additional paid-in capital 1,836,074 1,836,778 Accumulated other comprehensive income 80,659 7,171 Retained earnings 4,647,312 2,887,892 Total Enstar Group Limited Shareholders’ Equity 6,674,395 4,842,183 TOTAL LIABILITIES AND SHAREHOLDERS’ EQUITY $ 7,922,125 $ 6,196,053
See accompanying notes to the Condensed Financial Information of Registrant
Table of Contents
245

SCHEDULE IIENSTAR GROUP LIMITED
CONDENSED FINANCIAL INFORMATION OF REGISTRANT - CONTINUED
Statements of Earnings - Parent Company OnlyFor the Years Ended December 31, 2020, 2019 and 2018
2020 2019 2018 (in thousands of U.S. dollars)INCOMENet investment income $ 1,680 $ 3,649 $ 142
1,680 3,649 142 EXPENSESGeneral and administrative expenses 45,689 44,964 68,977 Interest expense 51,739 51,508 27,353 Net foreign exchange losses (gains) (2,655) (21,516) 7,655
94,773 74,956 103,985 EARNINGS (LOSSES) BEFORE EQUITY IN UNDISTRIBUTED EARNINGS OF SUBSIDIARIES (93,093) (71,307) (103,843) Equity in undistributed earnings (losses) of subsidiaries - continuing operations 1,831,886 1,002,021 (47,867) Equity in undistributed earnings (losses) of subsidiaries - discontinued operations 16,251 7,375 1,489 NET EARNINGS 1,755,044 938,089 (150,221) Dividends on preferred shares (35,700) (35,914) (12,133) NET EARNINGS (LOSS) ATTRIBUTABLE TO ENSTAR GROUP LIMITED ORDINARY SHAREHOLDERS $ 1,719,344 $ 902,175 $ (162,354)
See accompanying notes to the Condensed Financial Information of Registrant
Statements of Comprehensive Income - Parent Company OnlyFor the Years Ended December 31, 2020, 2019 and 2018
2020 2019 2018 (in thousands of U.S. dollars)NET EARNINGS $ 1,755,044 $ 938,089 $ (150,221) OTHER COMPREHENSIVE INCOME (LOSS) RELATING TO SUBSIDIARIES, NET OF TAX 73,488 (3,269) (27) COMPREHENSIVE INCOME $ 1,828,532 $ 934,820 $ (150,248)
See accompanying notes to the Condensed Financial Information of Registrant
Table of Contents
246
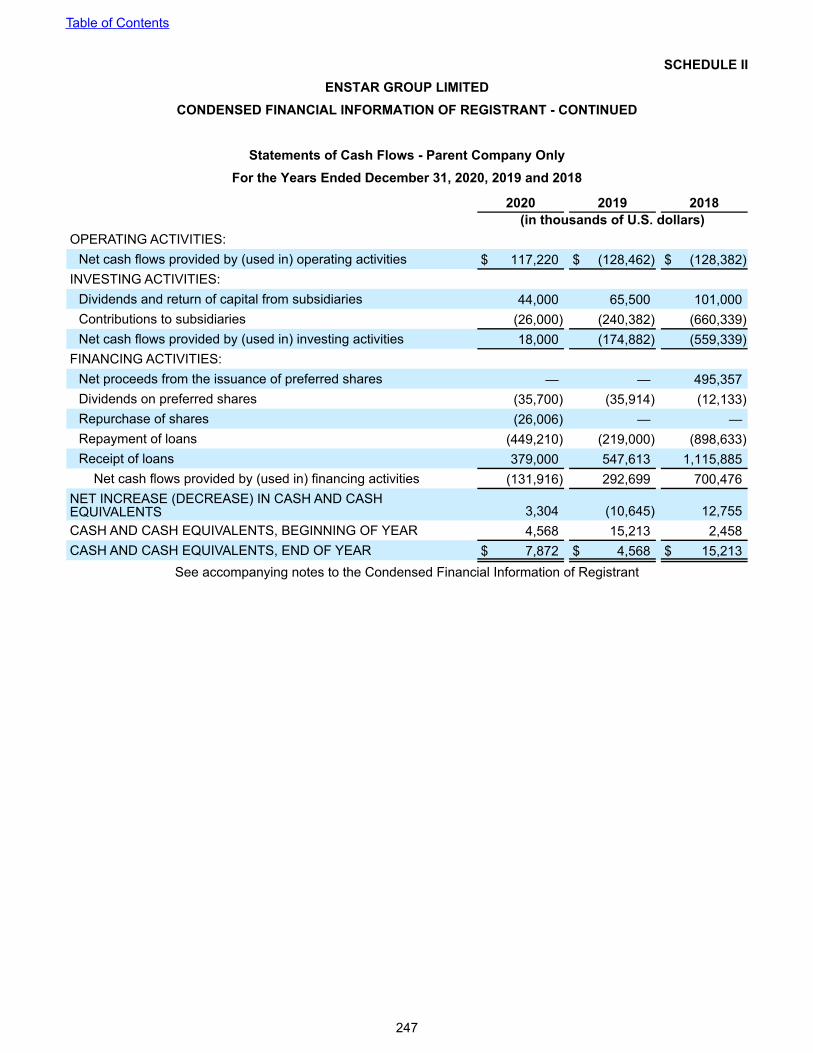
SCHEDULE IIENSTAR GROUP LIMITED
CONDENSED FINANCIAL INFORMATION OF REGISTRANT - CONTINUED
Statements of Cash Flows - Parent Company OnlyFor the Years Ended December 31, 2020, 2019 and 2018
2020 2019 2018 (in thousands of U.S. dollars)OPERATING ACTIVITIES:
Net cash flows provided by (used in) operating activities $ 117,220 $ (128,462) $ (128,382) INVESTING ACTIVITIES:
Dividends and return of capital from subsidiaries 44,000 65,500 101,000 Contributions to subsidiaries (26,000) (240,382) (660,339) Net cash flows provided by (used in) investing activities 18,000 (174,882) (559,339)
FINANCING ACTIVITIES:Net proceeds from the issuance of preferred shares — — 495,357 Dividends on preferred shares (35,700) (35,914) (12,133) Repurchase of shares (26,006) — — Repayment of loans (449,210) (219,000) (898,633) Receipt of loans 379,000 547,613 1,115,885
Net cash flows provided by (used in) financing activities (131,916) 292,699 700,476 NET INCREASE (DECREASE) IN CASH AND CASH EQUIVALENTS 3,304 (10,645) 12,755 CASH AND CASH EQUIVALENTS, BEGINNING OF YEAR 4,568 15,213 2,458 CASH AND CASH EQUIVALENTS, END OF YEAR $ 7,872 $ 4,568 $ 15,213
See accompanying notes to the Condensed Financial Information of Registrant
Table of Contents
247

Notes to the Condensed Financial Information of Registrant The Condensed Financial Information of Registrant should be read in conjunction with our consolidated
financial statements and the accompanying notes thereto included in Part II - Item 8 of this Annual Report on Form 10-K. Our wholly-owned and majority owned subsidiaries are recorded based upon our proportionate share of our subsidiaries' net assets (similar to presenting them on the equity method).
Net investment income relates to interest on loans to subsidiaries. For the years ended December 31, 2020, 2019, and 2018, interest paid was $46.5 million, $46.5 million, and $25.1 million, respectively.
Investing activities in the Condensed Statements of Cash Flows primarily represents the flow of funds to and from subsidiaries to provide cash on hand to fund business acquisitions and significant new business.
Non-Cash investing activities during the years ended December 31, 2020, 2019, and 2018, included:
i. $130.0 million, $0 and $0, respectively, for dividends and return of capital from subsidiaries. In 2020, these transactions were to settle intercompany balances, resulting in a net reduction in balances due to subsidiaries and a decrease in investments in subsidiaries.
ii. $0, $0 and $414.8 million, respectively, for contributions to subsidiaries. In 2018, these transactions represented the contribution of the acquired outstanding shares and warrants of KaylaRe Holdings, Ltd, to another subsidiary company.
As of December 31, 2020 and 2019, parental guarantees and capital support instruments supporting subsidiaries' insurance obligations were $1.5 billion and $1.0 billion, respectively. In addition, as of December 31, 2020 and 2019, there were $210.0 million and $252.0 million, respectively, of unsecured letters of credit for Funds at Lloyd's which have a parental guarantee. Furthermore, as of December 31, 2020, we also guarantee the Junior Subordinated Notes issued in 2020 for an aggregate principal amount of $350.0 million.
As of December 31, 2020 and 2019, retained earnings were $4,647.3 million and $2,887.9 million, respectively, an increase of $1,759.4 million. This increase was primarily attributable to the net earnings of $1,719.3 million.
Table of Contents
248
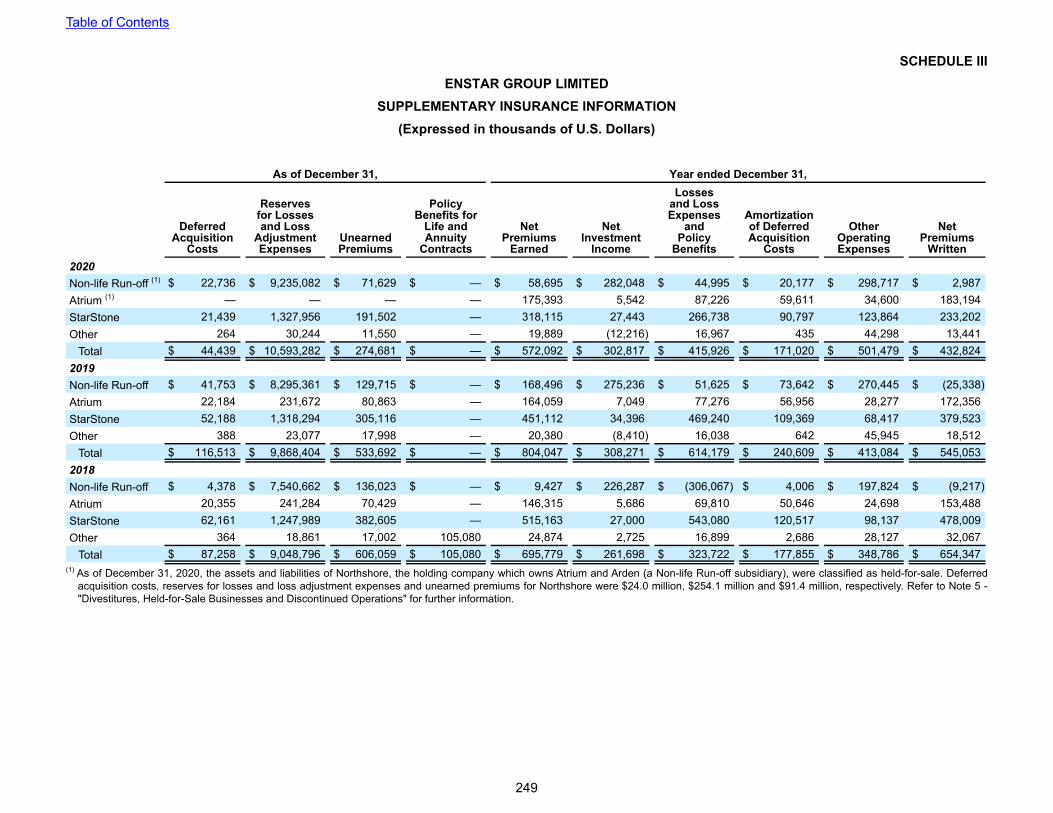
SCHEDULE IIIENSTAR GROUP LIMITED
SUPPLEMENTARY INSURANCE INFORMATION(Expressed in thousands of U.S. Dollars)
As of December 31, Year ended December 31,
DeferredAcquisition
Costs
Reservesfor Lossesand Loss
AdjustmentExpenses
UnearnedPremiums
Policy Benefits for
Life and Annuity
Contracts
NetPremiums
Earned
NetInvestment
Income
Lossesand LossExpenses
andPolicy
Benefits
Amortizationof DeferredAcquisition
Costs
Other Operating Expenses
NetPremiums
Written2020Non-life Run-off (1) $ 22,736 $ 9,235,082 $ 71,629 $ — $ 58,695 $ 282,048 $ 44,995 $ 20,177 $ 298,717 $ 2,987 Atrium (1) — — — — 175,393 5,542 87,226 59,611 34,600 183,194 StarStone 21,439 1,327,956 191,502 — 318,115 27,443 266,738 90,797 123,864 233,202 Other 264 30,244 11,550 — 19,889 (12,216) 16,967 435 44,298 13,441
Total $ 44,439 $ 10,593,282 $ 274,681 $ — $ 572,092 $ 302,817 $ 415,926 $ 171,020 $ 501,479 $ 432,824 2019Non-life Run-off $ 41,753 $ 8,295,361 $ 129,715 $ — $ 168,496 $ 275,236 $ 51,625 $ 73,642 $ 270,445 $ (25,338) Atrium 22,184 231,672 80,863 — 164,059 7,049 77,276 56,956 28,277 172,356 StarStone 52,188 1,318,294 305,116 — 451,112 34,396 469,240 109,369 68,417 379,523 Other 388 23,077 17,998 — 20,380 (8,410) 16,038 642 45,945 18,512
Total $ 116,513 $ 9,868,404 $ 533,692 $ — $ 804,047 $ 308,271 $ 614,179 $ 240,609 $ 413,084 $ 545,053 2018Non-life Run-off $ 4,378 $ 7,540,662 $ 136,023 $ — $ 9,427 $ 226,287 $ (306,067) $ 4,006 $ 197,824 $ (9,217) Atrium 20,355 241,284 70,429 — 146,315 5,686 69,810 50,646 24,698 153,488 StarStone 62,161 1,247,989 382,605 — 515,163 27,000 543,080 120,517 98,137 478,009 Other 364 18,861 17,002 105,080 24,874 2,725 16,899 2,686 28,127 32,067
Total $ 87,258 $ 9,048,796 $ 606,059 $ 105,080 $ 695,779 $ 261,698 $ 323,722 $ 177,855 $ 348,786 $ 654,347 (1) As of December 31, 2020, the assets and liabilities of Northshore, the holding company which owns Atrium and Arden (a Non-life Run-off subsidiary), were classified as held-for-sale. Deferred
acquisition costs, reserves for losses and loss adjustment expenses and unearned premiums for Northshore were $24.0 million, $254.1 million and $91.4 million, respectively. Refer to Note 5 - "Divestitures, Held-for-Sale Businesses and Discontinued Operations" for further information.
Table of Contents
249

SCHEDULE IV
ENSTAR GROUP LIMITEDREINSURANCE
For the Years Ended December 31, 2020, 2019 and 2018 (Expressed in thousands of U.S. Dollars)
Gross
Ceded toOther
Companies
AssumedfromOther
Companies Net Amount
Percentageof AmountAssumed
to Net
2020Premiums earned:
Property and casualty $ 542,119 $ (157,826) $ 187,799 $ 572,092 32.8 %Total premiums earned $ 542,119 $ (157,826) $ 187,799 $ 572,092
2019Life insurance in force $ 725,293 $ (65,795) $ — $ 659,498 — %Premiums earned:
Property and casualty 679,212 (145,460) 269,023 802,775 33.5 %Life and annuities 1,295 (23) — 1,272 — %
Total premiums earned $ 680,507 $ (145,483) $ 269,023 $ 804,047
2018Life insurance in force $ 855,366 $ (84,603) $ — $ 770,763 — %Premiums earned:
Property and casualty 539,169 (166,308) 319,052 691,913 46.1 %Life and annuities 3,892 (26) — 3,866 — %
Total premiums earned $ 543,061 $ (166,334) $ 319,052 $ 695,779
Table of Contents
250

SCHEDULE V
ENSTAR GROUP LIMITEDVALUATION AND QUALIFYING ACCOUNTS
For the Years Ended December 31, 2020, 2019 and 2018 (Expressed in thousands of U.S. Dollars)
Balance at Beginning of
Year
Charged to costs and expenses
Charged to other accounts
(1) Deductions (2)Balance at End
of Year December 31, 2020
Reinsurance balances recoverable on paid and unpaid losses:
Allowance for estimated uncollectible reinsurance $ 147,639 $ — $ 124 $ (10,641) $ 137,122
Insurance balances recoverable:
Allowance for estimated uncollectible insurance 3,818 — 1,006 — 4,824
Valuation allowance for deferred tax assets 117,390 3,854 — (3,015) 118,229
December 31, 2019
Reinsurance balances recoverable on paid and unpaid losses:
Allowance for estimated uncollectible reinsurance 156,732 — 111 (9,204) 147,639
Insurance balances recoverable:
Allowance for estimated uncollectible insurance — — 3,818 — 3,818
Valuation allowance for deferred tax assets 212,113 2,792 — (97,515) 117,390
December 31, 2018
Reinsurance balances recoverable on paid and unpaid losses:
Allowance for estimated uncollectible reinsurance 165,213 — (1,837) (6,644) 156,732
Valuation allowance for deferred tax assets 188,300 (2,492) 18,000 8,305 212,113 (1) The 2020 amount includes $3.0 million for the cumulative effect of change in accounting principle.(2) Credited to the related asset account.
Table of Contents
251
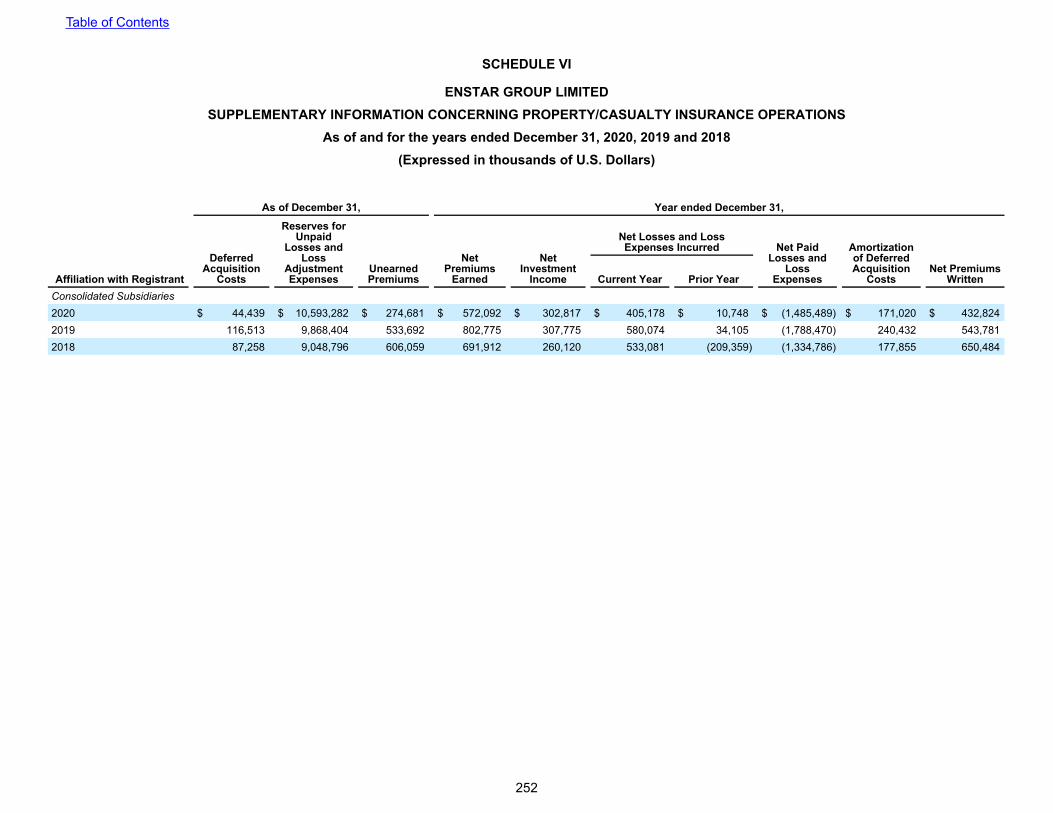
SCHEDULE VI
ENSTAR GROUP LIMITEDSUPPLEMENTARY INFORMATION CONCERNING PROPERTY/CASUALTY INSURANCE OPERATIONS
As of and for the years ended December 31, 2020, 2019 and 2018 (Expressed in thousands of U.S. Dollars)
As of December 31, Year ended December 31,
Affiliation with Registrant
Deferred Acquisition
Costs
Reserves for Unpaid
Losses and Loss
Adjustment Expenses
UnearnedPremiums
Net Premiums
Earned
Net Investment
Income
Net Losses and Loss Expenses Incurred Net Paid
Losses and Loss
Expenses
Amortization of Deferred Acquisition
CostsNet Premiums
WrittenCurrent Year Prior YearConsolidated Subsidiaries2020 $ 44,439 $ 10,593,282 $ 274,681 $ 572,092 $ 302,817 $ 405,178 $ 10,748 $ (1,485,489) $ 171,020 $ 432,824 2019 116,513 9,868,404 533,692 802,775 307,775 580,074 34,105 (1,788,470) 240,432 543,781 2018 87,258 9,048,796 606,059 691,912 260,120 533,081 (209,359) (1,334,786) 177,855 650,484
Table of Contents
252

ITEM 9. CHANGES IN AND DISAGREEMENTS WITH ACCOUNTANTS ON ACCOUNTING AND FINANCIAL DISCLOSURE
Not applicable.
ITEM 9A. CONTROLS AND PROCEDURESEvaluation of Disclosure Controls and Procedures
Under the supervision and with the participation of management, including our Chief Executive Officer and our Chief Financial Officer, we evaluated the effectiveness of our disclosure controls and procedures (as defined in Rules 13a-15(e) and 15d-15(e) of the Exchange Act) as of December 31, 2020. Based on that evaluation, our Chief Executive Officer and our Chief Financial Officer have concluded that we maintained effective disclosure controls and procedures to provide reasonable assurance that information required to be disclosed by us in reports that we file or submit under the Exchange Act is recorded, processed, summarized and timely reported as specified in the SEC's rules and forms, and is accumulated and communicated to our management, including the Chief Executive Officer and Chief Financial Officer, as appropriate, to allow timely decisions regarding required disclosure.
Management’s Annual Report on Internal Control Over Financial ReportingManagement is responsible for establishing and maintaining adequate internal control over financial reporting
(as defined in Rules 13a-15(f) and 15d-15(f) of the Exchange Act). Our internal control over financial reporting is a process designed to provide reasonable assurance regarding the reliability of financial reporting and the preparation of financial statements for external purposes in accordance with U.S. GAAP.
Management does not expect that its internal control over financial reporting will prevent all error and fraud. A control system, no matter how well conceived and operated, has inherent limitations, and accordingly no evaluation of controls can provide absolute assurance that all control issues and instances of fraud, if any, have been detected. As a result, even those internal control systems determined to be effective can provide only reasonable assurance with respect to financial reporting and the preparation of financial statements.
Under the supervision and with the participation of management, including our Chief Executive Officer and our Chief Financial Officer, we evaluated the effectiveness of our internal control over financial reporting as of December 31, 2020, based on the criteria set forth by the Committee of Sponsoring Organizations of the Treadway Commission in Internal Control - Integrated Framework (2013). Based on that evaluation, we have concluded that we maintained effective internal control over financial reporting as of December 31, 2020.
KPMG Audit Limited, the independent registered public accounting firm who audited our consolidated financial statements included in this Form 10-K, audited our internal control over financial reporting as of December 31, 2020 and their attestation report on our internal control over financial reporting appears below.
Changes in Internal Control Over Financial ReportingThere were no changes in our internal control over financial reporting that occurred during the three months
ended December 31, 2020 that have materially affected, or are reasonably likely to materially affect, our internal control over financial reporting.
Table of Contents
253

Report of Independent Registered Public Accounting FirmTo the Shareholders and Board of Directors
Enstar Group Limited:
Opinion on Internal Control Over Financial Reporting
We have audited Enstar Group Limited’s and subsidiaries’ (the Company) internal control over financial reporting as of December 31, 2020, based on criteria established by the Committee of Sponsoring Organizations of the Treadway Commission in Internal Control – Integrated Framework (2013). In our opinion, the Company maintained, in all material respects, effective internal control over financial reporting as of December 31, 2020, based on criteria established by the Committee of Sponsoring Organizations of the Treadway Commission in Internal Control – Integrated Framework (2013).
We also have audited, in accordance with the standards of the Public Company Accounting Oversight Board (United States) (PCAOB), the consolidated balance sheets of the Company as of December 31, 2020 and 2019, the related consolidated statements of earnings, comprehensive income, changes in shareholders’ equity, and cash flows for each of the years in the three-year period ended December 31, 2020, and the related notes and financial statement schedules I to VI (collectively, the consolidated financial statements), and our report dated March 1, 2021 expressed an unqualified opinion on those consolidated financial statements.Basis for Opinion
The Company’s management is responsible for maintaining effective internal control over financial reporting and for its assessment of the effectiveness of internal control over financial reporting, included in the accompanying Management’s Annual Report on Internal Control Over Financial Reporting. Our responsibility is to express an opinion on the Company’s internal control over financial reporting based on our audit. We are a public accounting firm registered with the PCAOB and are required to be independent with respect to the Company in accordance with the U.S. federal securities laws and the applicable rules and regulations of the Securities and Exchange Commission and the PCAOB.
We conducted our audit in accordance with the standards of the PCAOB. Those standards require that we plan and perform the audit to obtain reasonable assurance about whether effective internal control over financial reporting was maintained in all material respects. Our audit of internal control over financial reporting included obtaining an understanding of internal control over financial reporting, assessing the risk that a material weakness exists, and testing and evaluating the design and operating effectiveness of internal control based on the assessed risk. Our audit also included performing such other procedures as we considered necessary in the circumstances. We believe that our audit provides a reasonable basis for our opinion.Definition and Limitations of Internal Control Over Financial Reporting
A company’s internal control over financial reporting is a process designed to provide reasonable assurance regarding the reliability of financial reporting and the preparation of financial statements for external purposes in accordance with generally accepted accounting principles. A company’s internal control over financial reporting includes those policies and procedures that (1) pertain to the maintenance of records that, in reasonable detail, accurately and fairly reflect the transactions and dispositions of the assets of the company; (2) provide reasonable assurance that transactions are recorded as necessary to permit preparation of financial statements in accordance with generally accepted accounting principles, and that receipts and expenditures of the company are being made only in accordance with authorizations of management and directors of the company; and (3) provide reasonable assurance regarding prevention or timely detection of unauthorized acquisition, use, or disposition of the company’s assets that could have a material effect on the financial statements.
Because of its inherent limitations, internal control over financial reporting may not prevent or detect misstatements. Also, projections of any evaluation of effectiveness to future periods are subject to the risk that controls may become inadequate because of changes in conditions, or that the degree of compliance with the policies or procedures may deteriorate.
/s/ KPMG Audit LimitedKPMG Audit LimitedHamilton, Bermuda
March 1, 2021
Table of Contents
254

PART II (CONTINUED)ITEM 9B. OTHER INFORMATION
Not applicable.
PART III
ITEM 10. DIRECTORS, EXECUTIVE OFFICERS AND CORPORATE GOVERNANCEAll information required by Items 10, 11, 12, 13 and 14 of this Annual Report on Form 10-K is incorporated by
reference from the definitive proxy statement for our 2021 Annual General Meeting of Shareholders that will be filed with the SEC not later than 120 days after the close of the fiscal year ended December 31, 2020 pursuant to Regulation 14A.
ITEM 11. EXECUTIVE COMPENSATIONSee Item 10 herein.
ITEM 12. SECURITY OWNERSHIP OF CERTAIN BENEFICIAL OWNERS AND MANAGEMENT AND RELATED STOCKHOLDER MATTERS
See Item 10 herein.
ITEM 13. CERTAIN RELATIONSHIPS AND RELATED TRANSACTIONS, AND DIRECTOR INDEPENDENCESee Item 10 herein.
ITEM 14. PRINCIPAL ACCOUNTING FEES AND SERVICESSee Item 10 herein.
PART IV
ITEM 15. EXHIBITS, FINANCIAL STATEMENT SCHEDULES(a) Financial Statements and Financial Statement Schedules: see Item 8 in Part II of this report.
(b) Exhibits: see accompanying exhibit index that precedes the signature page of this report.
ITEM 16. FORM 10-K SUMMARYOmitted at Company's option.
Table of Contents
255

Exhibit Index
Exhibit
No. Description
2.1s Master Transaction Agreement, dated as of August 31, 2018, by and among Enstar Group Limited, Enstar Holdings (US) LLC and Maiden Holdings North America, Ltd. (incorporated by reference to Exhibit 2.1 to the Company’s Form 8-K filed on September 4, 2018).
3.1 Memorandum of Association of Enstar Group Limited (incorporated by reference to Exhibit 3.1 to the Company’s Form 10-K/A filed on May 2, 2011).
3.2 Fifth Amended and Restated Bye-Laws of Enstar Group Limited (incorporated by reference to Exhibit 3.1 of the Company’s Form 8-K filed on June 13, 2019).
3.3 Certificate of Designations for the Series B Convertible Participating Non-Voting Perpetual Preferred Stock (incorporated by reference to Exhibit 3.1 to the Company’s Form 8-K filed on July 9, 2013).
3.4 Certificate of Designations of Series C Participating Non-Voting Perpetual Preferred Stock of Enstar Group Limited, dated as of June 13, 2016 (incorporated by reference to Exhibit 3.1 to the Company's Form 8-K filed on June 17, 2016).
3.5 Certificate of Designations of Series D Perpetual Non-Cumulative Preferred Shares of Enstar Group Limited, dated as of June 27, 2018 (incorporated by reference to Exhibit 4.1 to the Company’s Form 8-K filed on June 27, 2018).
3.6 Certificate of Designations of Series E Perpetual Non-Cumulative Preferred Shares of Enstar Group Limited, dated as of November 21, 2018 (incorporated by reference to Exhibit 4.1 to the Company’s Form 8-K filed on November 21, 2018).
4.1 Senior Indenture, dated as of March 10, 2017, between Enstar Group Limited and The Bank of New York Mellon, as trustee (incorporated by reference to Exhibit 4.1 to the Company's Form 8-K filed on March 10, 2017).
4.2 First Supplemental Indenture, dated as of March 10, 2017, between Enstar Group Limited and The Bank of New York Mellon, as trustee (incorporated by reference to Exhibit 4.2 to the Company's Form 8-K filed on March 10, 2017).
4.3 Second Supplemental Indenture, dated as of March 26, 2019, between Enstar Group Limited and The Bank of New York Mellon, as trustee (incorporated by reference to Exhibit 4.1 to the Company’s Form 8-K filed on March 26, 2019).
4.4 Third Supplemental Indenture, dated as of May 28, 2019, between Enstar Group Limited and The Bank of New York Mellon, as trustee (incorporated by reference to Exhibit 4.2 to the Company’s Form 8-K filed on May 28, 2019).
4.5 Junior Subordinated Indenture, dated as of August 26, 2020, among Enstar Finance LLC, Enstar Group Limited and The Bank of New York Mellon, as trustee (incorporated by reference to exhibit 4.1 to the Company's Form 8-K filed on August 26, 2020).
4.6 First Supplemental Indenture, dated as of August 26, 2020, among Enstar Finance LLC, Enstar Group Limited and The Bank of New York Mellon, as trustee (incorporated by reference to Exhibit 4.2 to the Company's Form 8-K filed on August 26, 2020).
4.7 Deposit Agreement, dated as of June 27, 2018, between Enstar Group Limited and American Stock Transfer (incorporated by reference to Exhibit 4.3 to the Company’s Form 8-K filed on June 27, 2018).
4.8 Deposit Agreement, dated as of November 21, 2018, between Enstar Group Limited and American Stock Transfer (incorporated by reference to Exhibit 4.3 to the Company’s Form 8-K filed on November 21, 2018).
4.9 Description of Securities (incorporated by reference to Exhibit 4.7 to the Company's Form 10-K filed on February 27, 2020).
10.1 Form of Warrant (incorporated by reference to Exhibit 99.2 to the Company’s Form 8-K filed on April 21, 2011).
10.2 Registration Rights Agreement, dated as of January 31, 2007, by and among Castlewood Holdings Limited, Trident II, L.P., Marsh & McLennan Capital Professionals Fund, L.P., Marsh & McLennan Employees’ Securities Company, L.P., Dominic F. Silvester, J. Christopher Flowers, and other parties thereto set forth on the Schedule of Shareholders attached thereto (incorporated by reference to Exhibit 10.1 of the Company’s Form 8-K12B filed on January 31, 2007).
Table of Contents
256

10.3 Registration Rights Agreement, dated as of April 20, 2011, by and among Enstar Group Limited, GSCP VI AIV Navi, Ltd., GSCP VI Offshore Navi, Ltd., GSCP VI Parallel AIV Navi, Ltd., GSCP VI Employee Navi, Ltd., and GSCP VI GmbH Navi, L.P. (incorporated by reference to Exhibit 99.3 to the Company’s Form 8-K filed on April 21, 2011).
10.4 Registration Rights Agreement, dated April 1, 2014, among Enstar Group Limited, FR XI Offshore AIV, L.P., First Reserve Fund XII, L.P., FR XII A Parallel Vehicle L.P., FR Torus Co-Investment, L.P. and Corsair Specialty Investors, L.P. (incorporated by reference to Exhibit 10.1 to the Company’s Form 8-K filed on April 4, 2014).
10.5 Form of Waiver Agreement (incorporated herein by reference to Exhibit 4.7 to the Company's Form S-3 filed on October 10, 2017).
10.6 Shareholder Rights Agreement, dated June 3, 2015, between Enstar Group Limited and Canada Pension Plan Investment Board (incorporated by reference to Exhibit 10.1 to the Company’s Form 8-K filed on June 3, 2015.
10.7+ Form of Director Indemnification Agreement (incorporated by reference to Exhibit 10.1 to the Company’s Form S-3 (No. 333-151461) initially filed on June 5, 2008).
10.8+ Amended and Restated Employment Agreement, dated as of January 21, 2020, by and between Enstar Group Limited and Dominic F. Silvester (incorporated by reference to Exhibit 10.2 to the Company’s Form 8-K filed on January 27, 2020).
10.9+ Amended and Restated Employment Agreement, dated as of January 21, 2020, by and between Enstar Group Limited and Paul J. O’Shea (incorporated by reference to Exhibit 10.3 to the Company’s Form 8-K filed on January 27, 2020).
10.10+ Amended and Restated Employment Agreement, dated January 21, 2020, by and between Enstar Group Limited and Orla M. Gregory (incorporated by reference to Exhibit 10.4 to the Company’s Form 8-K filed on January 27, 2020).
10.11+ Employment Agreement, dated December 28, 2017, by and between Enstar Group Limited and Guy Bowker (incorporated by reference to Exhibit 10.1 to the Company’s Form 8-K filed on January 4, 2018).
10.12*+ Employment Agreement, dated August 21, 2020, by and between Enstar Group Limited and Zachary Wolf.
10.13+ Employment Agreement, dated January 8, 2018, by and between Enstar Group Limited and Paul M.J. Brockman (incorporated by reference to Exhibit 10.1 to the Company’s Form 10-Q filed on May 8, 2019).
10.14+ Employment Agreement, dated September 9, 2016, by and between Enstar Group Limited and Nazar Alobaidat (incorporated by reference to Exhibit 10.13 to the Company's Form 10-K filed on February 27, 2020).
10.15+ Enstar Group Limited Deferred Compensation and Ordinary Share Plan for Non-Employee Directors, effective as of June 5, 2007 (incorporated by reference to Exhibit 10.1 to the Company’s Form 8-K filed on June 11, 2007).
10.16+ Amended and Restated Enstar Group Limited Deferred Compensation and Ordinary Share Plan for Non-Employee Directors, effective as of January 1, 2015 (incorporated by reference to Exhibit 10.13 to the Company’s Form 10-K filed on March 2, 2015).
10.17+ Form of Non-Employee Director Restricted Stock Award Agreement (incorporated by reference to Exhibit 10.32 to the Company’s Form 10-K filed on March 2, 2015).
10.18+ Castlewood Holdings Limited 2006 Equity Incentive Plan (incorporated by reference to Exhibit 10.11 to the proxy statement/prospectus that forms a part of the Company’s Form S-4 declared effective December 15, 2006).
10.19+ First Amendment to Castlewood Holdings Limited 2006 Equity Incentive Plan (incorporated by reference to Exhibit 10.2 to the Company’s Form 8-K filed on April 6, 2007).
10.20+ Form of Award Agreement under the Castlewood Holdings Limited 2006 Equity Incentive Plan (incorporated by reference to Exhibit 10.1 to the Company’s Form 8-K filed on April 6, 2007).
10.21+ Form of Stock Appreciation Right Award Agreement pursuant to the 2006 Equity Incentive Plan (incorporated by reference to Exhibit 10.5 to the Company’s Form 10-Q filed on August 11, 2014).
10.22+ Form of Restricted Stock Award Agreement pursuant to the 2006 Equity Incentive Plan (incorporated by reference to Exhibit 10.6 to the Company’s Form 10-Q filed on August 11, 2014).
Table of Contents
257

10.23+ Enstar Group Limited Amended and Restated 2016 Equity Incentive Plan (incorporated by reference to Exhibit 10.1 to the Company’s Form 8-K filed on December 2, 2019).
10.24+ Form of Restricted Stock Award Agreement under the Enstar Group Limited 2016 Equity Incentive Plan (incorporated by reference to Exhibit 10.1 to the Company's Form 10-Q filed on August 5, 2016).
10.25+ Form of Stock Appreciation Right Award Agreement under the Enstar Group Limited 2016 Equity Incentive Plan (incorporated by reference to Exhibit 10.2 to the Company's Form 10-Q filed on August 5, 2016).
10.26+ Form of Restricted Stock Unit Award Agreement under the Enstar Group Limited 2016 Equity Incentive Plan (incorporated by reference to Exhibit 10.2 to the Company's Form 10-Q filed on November 8, 2016).
10.27+ Form of Performance Stock Unit Award Agreement under the Enstar Group Limited 2016 Equity Incentive Plan (incorporated by reference to Exhibit 10.3 to the Company's Form 10-Q filed on November 8, 2016).
10.28+ Form of Performance Stock Unit Award Agreement (2018) under the Enstar Group Limited 2016 Equity Incentive Plan (incorporated by reference to Exhibit 10.1 to the Company's Form 10-Q filed on November 8, 2017).
10.29+ Form of Performance Stock Unit Award Agreement (3-Year Cycle) (2020) under the Enstar Group Limited 2016 Equity Incentive Plan (incorporated by reference to Exhibit 10.5 to the Company’s Form 8-K filed on January 27, 2020).
10.30+ Form of Performance Stock Unit Award Agreement (Annual Cycle) (2020) under the Enstar Group Limited 2016 Equity Incentive Plan (incorporated by reference to Exhibit 10.29 to the Company's Form 10-K filed on February 27, 2020).
10.31+ Form of Restricted Stock Unit Award Agreement (2020) under the Enstar Group Limited 2016 Equity Incentive Plan (incorporated by reference to Exhibit 10.30 to the Company's Form 10-K filed on February 27, 2020).
10.32+ Joint Share Ownership Agreement, dated January 21, 2020, by and among Enstar Group Limited, Dominic F. Silvester and Zedra Trust Company, as trustee (incorporated by reference to Exhibit 10.1 to the Company’s Form 8-K filed on January 27, 2020).
10.33+ Enstar Group Limited Amended and Restated Employee Share Purchase Plan (incorporated by reference to Exhibit 10.4 to the Company’s Form 10-Q filed on November 8, 2016).
10.34+ Amended and Restated Enstar Group Limited 2019-2021 Annual Incentive Program (incorporated by reference to Exhibit 10.30 to the Company’s Form 10-K filed on March 1, 2019).
10.35s Recapitalization Agreement, dated as of August 13, 2020, by and among North Bay Holdings Limited, Enstar Group Limited, Kenmare Holdings Ltd., Trident V, L.P., Trident V Parallel Fund, L.P., Trident V Professionals Fund, L.P., Dowling Capital Partners I, L.P., Capital City Partners LLC, and StarStone Specialty Holdings Limited (incorporated by reference to Exhibit 10.1 of the Company's Form 8-K filed on August 17, 2020).
10.36 Voting and Shareholders' Agreement, dated as of January 1, 2021, among StarStone Specialty Holdings Limited, Kenmare Holdings Ltd., Trident V, L.P., Trident V Parallel Fund, L.P., Trident V Professionals Fund, L.P., Dowling Capital Partners I, L.P., and Capital City Partners LLC (incorporated by reference to Exhibit 10.1 of the Company's Form 8-K filed on January 4, 2021).
10.37 Third Amended and Restated Shareholders' Agreement, dated as of January 1, 2021, among Northshore Holdings Limited, Trident V, L.P., Trident V Parallel Fund, L.P., Trident V Professionals Fund, L.P., Kenmare Holdings Ltd., Dowling Capital Partners I, L.P., Capital City Partners LLC, Atrium Nominees Limited, and the other Persons who from time to time become a party thereto (incorporated by reference to Exhibit 10.2 of the Company's Form 8-K filed on January 1, 2021).
10.38 Exchange Agreement, dated as of February 2, 2018, by and among Enstar Group Limited, KaylaRe Holdings, Ltd., HH KaylaRe Holdings, Ltd., Hillhouse Fund III, L.P., Trident V, L.P., Trident V Parallel Fund, L.P, Trident V Professionals Fund, L.P., Souris Partners and Cavello Bay Reinsurance Limited (incorporated by reference to Exhibit 10.1 of the Company’s Form 8-K filed on February 8, 2018).
10.39 Master Agreement, dated March 1, 2019, by and among Enstar Group Limited, Maiden Holdings, Ltd. and Maiden Reinsurance Ltd. (incorporated by reference to Exhibit 10.2 to the Company’s Form 10-Q filed on May 8, 2019).
10.40 Amendment to Master Agreement, dated June 28, 2019, by and among Enstar Group Limited, Maiden Holdings, Ltd. and Maiden Reinsurance Ltd. (incorporated by reference to Exhibit 10.1 to the Company’s Form 10-Q filed on August 6, 2019).
Table of Contents
258

10.41 Subscription Agreement, dated as of December 11, 2018, by and between Cavello Bay Reinsurance Limited and Enhanzed Reinsurance Limited (incorporated by reference to Exhibit 10.36 to the Company’s Form 10-K filed on March 1, 2019).
10.42s Stock Purchase Agreement, dated as of June 10, 2020, by and among StarStone Finance Limited, Core Specialty Insurance Holdings, Inc., and North Bay Holdings Limited (incorporated by reference to Exhibit 10.1 to the Company's Form 8-K filed on June 11, 2020).
10.43 Revolving Credit Agreement, dated as of August 16, 2018, by and among Enstar Group Limited and certain of its subsidiaries, National Australia Bank Limited, Barclays Bank PLC, Wells Fargo Bank, National Association and each of the lenders party thereto (incorporated by reference to Exhibit 10.1 of the Company’s Form 8-K filed on August 21, 2018).
10.44 First Amendment to Revolving Credit Agreement, dated as of December 19, 2018, by and among Enstar Group Limited and certain of its subsidiaries, National Australia Bank Limited, Barclays Bank PLC, Wells Fargo Bank, National Association and each of the lenders party thereto (incorporated by reference to Exhibit 10.38 to the Company’s Form 10-K filed on March 1, 2019).
10.45* Second Amendment to Revolving Credit Agreement, dated as of November 25, 2020, by and among Enstar Group Limited and certain of its subsidiaries, National Australia Bank Limited, Barclays Bank PLC, Wells Fargo Bank, National Association, and each of the lenders party thereto.
10.46 Letter of Credit Facility Agreement, dated as of August 5, 2019, by and among Enstar Group Limited and certain of its subsidiaries, National Australia Bank Limited, London Branch, The Bank of Nova Scotia and each of the lenders party thereto (incorporated by reference to Exhibit 10.1 to the Company’s Form 8-K filed on August 7, 2019).
10.47 First Amendment to Letter of Credit Facility Agreement, dated as of December 9, 2019, by and among Enstar Group Limited and certain of its subsidiaries, National Australia Bank Limited, London Branch, The Bank of Nova Scotia and each of the lenders party thereto (incorporated by reference to Exhibit 10.1 to the Company’s Form 8-K filed on December 11, 2019).
10.48 Second Amendment to Letter of Credit Facility Agreement, dated as of June 3, 2020, by and among Enstar Group Limited and certain of its subsidiaries, National Australia Bank Limited, London Branch, The Bank of Nova Scotia and each of the lenders party thereto (incorporated by reference to Exhibit 10.1 to the Company's Form 8-K filed on June 9, 2020).
10.49* Third Amendment to Letter of Credit Facility Agreement, dated as of November 25, 2020, by and among Enstar Group Limited and certain of its subsidiaries, National Australia Bank Limited, London Branch, The Bank of Nova Scotia and each of the lenders party thereto.
10.50*s Termination and Release Agreement, dated as of February 21, 2021, by and among Enstar Group Limited and certain of its subsidiaries and Hillhouse Capital Management, Ltd. and certain of its affiliates.
21.1* List of Subsidiaries.
23.1* Consent of KPMG Audit Limited.
31.1* Certification of Chief Executive Officer pursuant to Rule 13a-14(a) or Rule 15d-14(a) of the Securities Exchange Act of 1934 as adopted under Section 302 of the Sarbanes-Oxley Act of 2002.
31.2* Certification of Chief Financial Officer pursuant to Rule 13a-14(a) or Rule 15d-14(a) of the Securities Exchange Act of 1934 as adopted under Section 302 of the Sarbanes-Oxley Act of 2002.
32.1** Certification of Chief Executive Officer pursuant to 18 U.S.C. Section 1350, as adopted pursuant to Section 906 of the Sarbanes-Oxley Act of 2002.
32.2** Certification of Chief Financial Officer pursuant to 18 U.S.C. Section 1350, as adopted pursuant to Section 906 of the Sarbanes-Oxley Act of 2002.
101* Inline XBRL Document Set for the consolidated financial statements and accompanying notes in Part II, Item 8 of this Annual Report on Form 10-K.
104* The cover page from the Company’s Annual Report on Form 10-K for the year ended December 31, 2020, formatted as Inline XBRL (included in Exhibit 101).
_______________________________* filed herewith** furnished herewith+ denotes management contract or compensatory arrangementscertain of the schedules and similar attachments are not filed but Enstar Group Limited undertakes to furnish a copy of the schedules
or similar attachments to the SEC upon request
Table of Contents
259

SIGNATURESPursuant to the requirements of Section 13 or 15(d) of the Securities Exchange Act of 1934, the registrant has
duly caused this report to be signed on its behalf by the undersigned, thereunto duly authorized on March 1, 2021.
ENSTAR GROUP LIMITED
By: /S/ DOMINIC F. SILVESTER
Dominic F. SilvesterChief Executive Officer
Pursuant to the requirements of the Securities Exchange Act of 1934, this report has been signed below by the following persons on behalf of the registrant and in the capacities indicated on March 1, 2021.
Signature Title
/s/ ROBERT J. CAMPBELLRobert J. Campbell
Chairman and Director
/s/ DOMINIC F. SILVESTERDominic F. Silvester
Chief Executive Officer and Director
/s/ GUY BOWKERGuy Bowker
Chief Financial Officer (signing in his capacity as principal financial officer and principal accounting officer)
/s/ PAUL J. O’SHEAPaul J. O’Shea
President and Director
/s/ B. FREDERICK BECKERB. Frederick Becker
Director
/s/ JAMES D. CAREYJames D. Carey
Director
/s/ SUSAN L. CROSSSusan L. Cross
Director
/s/ HANS-PETER GERHARDTHans-Peter Gerhardt
Director
/s/ MYRON HENDRYMyron Hendry
Director
/s/ HITESH PATELHitesh Patel
Director
/s/ POUL A. WINSLOWPoul A. Winslow
Director
Table of Contents
260

Robert Campbell Chairman of the Board Enstar Group Limited
Partner Beck Mack & Oliver, LLC
Dominic SilvesterChief Executive OfficerEnstar Group Limited
B. Frederick (Rick) BeckerNon-Executive Director
James CareyManaging DirectorStone Point Capital LLC
Hans-Peter GerhardtChief Executive Officer (former)AXA Re, PARIS Re and Asia Capital Reinsurance
W. Myron HendryExecutive VP, Chief Platform Officer (former)XL Catlin
Paul O’SheaPresidentEnstar Group Limited
Hitesh PatelNon-Executive Director
Poul WinslowSenior Managing Director & Global Head of Capital Markets and Factor Investing Canada Pension Plan Investment Board
Susan L. CrossEVP, Global Chief Actuary (former)XL Group Ltd.
Dominic Silvester Chief Executive Officer
Paul O’Shea President
Orla Gregory Chief Operating Officer
Zachary Wolf Chief Financial Officer Paul BrockmanChief Claims Officer
Nazar AlobaidatChief Investment Officer
Audrey B. TarantoGeneral Counsel
DIRECTORS EXECUTIVE OFFICERS
ENSTAR GROUP LIMITED
Head OfficeP.O. Box HM 2267, Windsor Place, 3rd Floor , 22 Queen Street, Hamilton HM JX, Bermuda
TRANSFER AGENT
American Stock Transfer & Trust Company 6201, 15th Avenue, Brooklyn, NY 11219 (800) 937-5449
