eni: fourth quarter and full year 2015 results · eni: fourth quarter and full year 2015 results...
TRANSCRIPT

- 1 -
Registered Head Office Piazzale Enrico Mattei, 1
00144 Rome Tel.: +39 06598.21
www.eni.com San Donato Milanese (Milan) February 26, 2016
Eni: fourth quarter and full year 2015 results
Yesterday, Eni’s Board of Directors approved group results for the fourth quarter and the full year 2015 (unaudited).
Robust cash generation: operating cash flow1-2 of €4.01 billion in Q4 2015 (€12.19 billion in FY2015) in spite of sharply lower oil prices (Brent down 43% to $44 per barrel in the Q4, down 47% to $53 per barrel in FY2015) down by 12% y-o-y (down by 15% in FY2015)
Reduced the target oil price under which full-year capex are funded by operating cash flow: down to $50 per barrel in 2015 vs. our previous guidance of $63 per barrel for the period 2015-2016
Finalized Saipem transaction by divesting a 12.5% stake to FSI, the pro-quota subscription of the investee’s capital increase and the reimbursement of intercompany financing receivables
Efficiency gains and cost rephasing exceeded our expectations: capex reduced by 17% (vs. an initial guidance of 14%); Opex per boe reduced by 13% (vs. an initial guidance of 7%); G&A down €0.6 billion (vs. an initial guidance of €0.5 billion)
Hydrocarbon production growth: up 14% to 1.88 million boe/d in Q4 2015, the highest level in 5 years; up 10% (vs. an initial guidance of +5%) to 1.76 million boe/d for the FY2015
Exploration activities in the year added 1.4 bboe of fresh resources (vs. an initial guidance of 0.5 bboe), at an average cost of 0.7 $/barrel, also boosted by the supergiant Zohr discovery off Egypt
Organic reserve replacement ratio: 148% (135% on average since 2010)
R&M: positive adjusted EBIT3 and FCF4 in 2015 achieved earlier than forecast of our strategic plan
G&P: 2015 adjusted EBIT almost at break-even in line with our guidance
Confirmed a dividend of €0.85 per share for FY2015
Results Continuing operations:
- standalone adjusted EBIT: down 64% in Q4 2015 to €0.86 billion; down 64% in the FY2015 to €4.1 billion;
- standalone adjusted earnings: a loss of €0.20 billion in Q4 2015; a profit of €0.34 billion in the FY2015 (down 91%);
- reported earnings: a loss of €6.89 billion in Q4 2015; a loss of €7.79 billion in FY2015 due to asset impairments driven by the oil scenario adopted by Eni
Group net earnings: a loss of €8.46 billion in Q4 2015; a loss of €8.82 billion in FY2015 Net borrowings: €16.86 billion at year-end; leverage at 0.31. Pro-forma effects of Saipem
transaction at December 31, 2015: net debt down by €4.8 billion, leverage at 0.22. 1 In this press release adjusted results from continuing operations exclude as usual the items “profit/loss on stock” and extraordinary gains and losses (special items), while they reinstate the effects relating to the elimination of gains and losses on intercompany transactions with sectors which are in the disposal phase, E&C and Chemical, represented as discontinued operations under the IFRS5. A corresponding alternative performance measure has been presented for the cash flow from operating activities. For further information, see “Disclaimer” on page 7. 2 Net cash provided by operating activities of continuing operations on a standalone basis 3 Operating profit. 4 Free cash flow: net cash provided by operating activities plus proceeds from disposals less capex. 5 An interim dividend of €0.4 per share was paid in September 2015
- 2 -
“In 2015, Eni achieved remarkable results in its transformation process, which will see the group become even more focused on its core oil&gas business, and even better organized to compete in a low energy price environment as reflected in the Eni scenario which is aligned with a conservative market consensus. The complex deconsolidation of Saipem has been completed in four months providing Eni with net proceeds of €4.8 billion. Our efforts to rationalize costs have achieved better than expected results, and enabled us to self-finance capex in 2015 at 50$/bbl, $13/bbl less than expected a year ago. These actions of efficiency, however, have not affected Eni’s impressive level of growth in the market, in the short or the medium term. In E&P, production grew by 10%. Both our exploration resources and our proven reserves, recorded high growth, demonstrating the quality of our portfolio of assets. In the G&P and R&M businesses, consolidation has continued, with the G&P’s results in line with expectations and R&M’s results beating expectations. In 2016, similar to the previous year, we are continuing Eni’s transformation process with the goal of making the group even stronger and better able to operate in difficult external conditions, enabling us to maintain solid growth expectations. Based on these results, I will propose to the Board of Directors on 17 March the distribution of a final dividend of € 0.4 per share” commented Claudio Descalzi, Eni’s Chief Executive Officer.
Fourth Quarter
Third Quarter
Fourth Quarter SUMMARY GROUP RESULTS (a) (€ million)
2014 2015 2015 2014 2015 % Ch.
Continuing operations:
2,304 215 979 (57.5) Adjusted operating profit (loss) (b) 10,447 3,794 (63.7)
250 (748) (379) .. Adjusted net profit (loss) (b) 2,200 (696) ..
(2,294) (1,425) (6,891) .. Net profit (loss) 101 (7,793) ..
(0.64) (0.40) (1.91) .. - per share (€) (c) 0.03 (2.16) ..
(1.60) (0.89) (4.18) - per ADR ($) (c) (d) 0.08 (4.80) ..
(2,384) (952) (8,460) .. Net profit (loss) 1,291 (8,821) ..
(0.66) (0.26) (2.35) .. - per share (€) (c) 0.36 (2.45) ..
(1.65) (0.58) (5.15) .. - per ADR ($) (c) (d) 0.96 (5.44) ..
Results of continuing operations on standalone basis (b)
2,358 432 857 (63.7) Adjusted operating profit (loss) 11,442 4,103 (64.1)
525 (429) (200) .. Adjusted net profit (loss) 3,854 336 (91.3)
73.0 .. .. Tax rate (%) 65.3 93.0
4,548 1,698 4,007 (11.9) Net cash provided by operating activities 14,387 12,189 (15.3)
% Ch.IV Q. 15vs. IV Q.
14
Full year
(a) Attributable to Eni's shareholders.(b)Non-GAAP measures. For a detailed explanation and reconciliation of standalone adjusted results and cash flow which exclude as usual the items “profit/loss on stock”andextraordinary gains and losses (special items), while they reinstate the effects relating the elimination of gains and losses on intercompany transactions with discontinued (c) Fully diluted. Dollar amounts are converted on the basis of the average EUR/USD exchange rate quoted by the ECB for the periods presented.(d) One ADR (American Depositary Receipt) is equal to two Eni ordinary shares.
Continuing and Discontinued operations Eni’s preliminary results for the Q4 and FY2015 have been prepared in addition to the consolidated basis, stating separately continuing operations from discontinued operations, the latter accounted for in accordance to IFRS 5. Discontinued operations comprise: The E&C operating segment which is managed by Eni’s subsidiary Saipem SpA. On January 22,
2016, there was the closing of the preliminary agreements signed on October 27, 2015 with the Fondo Strategico Italiano (FSI). Those include the sale of a 12.5% stake plus one share of the share capital of Saipem to FSI and the concurrent enter into force of the shareholder agreement with Eni, which was intended to establish joint control over the former Eni subsidiary. Therefore effective for the full year, Saipem assets and liabilities, revenues and expenses and cash flow have been classified as discontinued operations. In addition as provided by IFRS5, Eni’s net assets in Saipem have been aligned to the lower of their carrying amount and fair value given by the share price at the reporting date.
The chemical segment managed by Eni’s wholly-owned subsidiary Versalis SpA. As of the reporting date, negotiations were underway to define an agreement with an industrial partner who, by acquiring a controlling stake of Versalis, would support Eni in implementing the industrial plan designed to upgrade this business. Therefore, effective for the full year, likewise Saipem, Versalis assets and liabilities, revenues and expenses and cash flow have been classified as discontinued operations. In addition, Eni’s net assets in Versalis have been aligned to the lower of their carrying amount and their fair value based on the transaction that is underway.
Consequently, in this press release the review of the financial performance of the Q4 and FY 2015 mainly focuses on the results of the continuing operations. In this regard, taking into consideration that gains and losses pertaining to the discontinued operations include according to the accounting provided by IFRS 5 only those resulting from transactions with third parties, the results of the continuing operations do not fully illustrate the underlying performance given the elimination of gains and losses
- 3 -
on intercompany transactions with the discontinued operations. The same is true for the performance of the discontinued operations. The bigger the intercompany transactions, the larger that sort of misrepresentation. In particular, the accounting of the E&C segment as discontinued operations according to IFRS 5 criteria yields a benefit to the continuing operations due to the elimination of the costs incurred towards Saipem for the execution of contract works commissioned by Eni’s Group companies for maintenance and construction of assets (plants and other infrastructures). On the contrary, the accounting of the chemical segment as discontinued operations affects the results of the continuing operations due to the elimination of revenues relating to the supply of oil-based petrochemical feedstock and other plant utilities to Versalis, mainly from the Group’s R&M segment. Because of this, throughout this press release management has presented measures of the underlying performance of the continuing operations on a standalone basis by reinstating the effects of the elimination of intercompany transactions. These performance measures by excluding gains and losses of the discontinued operations earned from both third parties and the Group’s continuing operations, actually determine the derecognition of the two disposal group. These measures are: standalone adjusted operating profit, standalone adjusted net profit and standalone cash flow from operations. Standalone adjusted results In the Q4 2015, standalone adjusted operating profit from continuing operations was €0.86 billion, down by 64% from Q4 2014. This reflected a lower contribution from the E&P segment (down by €1.17 billion, or 58%) driven by the impact of sharply lower oil prices (down by approximately 43%), partly offset by production growth, cost efficiencies and the depreciation of the euro against the dollar (down 12.3%). The G&P and R&M segments reported positive adjusted operating profit, albeit lower than in Q4 2014 (down by an overall amount of €0.2 billion) due to the negative oil price environment and, in the case of G&P, the unfavourable outcome of commercial arbitration. Overall, despite production growth and efficiency gains of €0.7 billion, the low oil price environment had a fundamentally negative effect on the operating performance in Q4 down by €1.9 billion net of currency differences, while lower onetime effects associated with gas contract renegotiations negatively affected operating profit by €0.3 billion. For the FY 2015, standalone adjusted operating profit from continuing operations was €4.1 billion and it was down by €7.34 billion or 64% y-o-y. The decrease was driven mainly by the upstream segment which reported sharply lower results (down €7.44 billion, or 64%) due to falling commodity prices, with an impact of €8.8 billion net of currency differences, partially offset by production growth and efficiency and optimization gains of €2.2 billion, while lower onetime effects associated with gas contract renegotiations negatively affected operating profit by €0.7 billion. In Q4 2015, standalone adjusted net loss from continuing operations was €0.20 billion, down by €0.73 billion from the adjusted net profit of €0.53 billion reported in Q4 2014. The drivers were a decline in operating profit and a higher tax rate. This latter was due to the E&P tax rate, which was negatively affected by: i) the recognition of a major part of the positive pre-tax results in PSA contracts, which, although more resilient in a low-price environment, nonetheless bear higher-than-average rates of tax; ii) a higher incidence of non-deductible expenses on the pre-tax profit that has been lowered by the scenario. Standalone adjusted net profit from continuing operations in the FY 2015 amounted to €0.34 billion, down by €3.52 billion y-o-y, or 91%, due to the same factors mentioned above. The consolidated tax rate increased by 28 percentage points y-o-y to 93%. Excluding the impact of the higher incidence on pre-tax profit of certain non-deductible expenses in E&P, where this incidence is expected to prospectively come down due to the effect of lower amortization charges going forward as a result of the impairment losses recorded in 2015 driven by the price outlook, and also restating the Group operating profit in accordance with the successful-effort-method accounting of exploration expenses, net of impaired exploration projects, the Group tax rate has been re-determined in 79% and 63% for the FY2015 and FY2014, respectively.
- 4 -
Standalone cash flow The standalone cash flow from operating activities from continuing operations came in at €12.19 billion in the FY2015 benefiting from the positive effect of working capital. Non-recurring effects of the working capital positively influenced cash flow by approximately €2.2 billion. Proceeds from disposals were €2.26 billion and comprised the almost entirety available-for-sale shareholding in Snam due to the exercise of the conversion right from bondholders (€0.91 billion), the disposal of an available-for-sale interest in Galp (€0.66 billion), as well as non-strategic assets mainly in the Exploration & Production segment. These inflows funded a fair amount of the financial requirements for the dividend payments to Eni shareholders (€3.46 billion, of which €1.44 billion related to the interim dividend 2015), capital expenditure for the year (€10.78 billion) and other changes related to capital expenditure (€1.35 billion). As of December 31, 2015, net borrowings6 increased by €3.18 billion to €16.86 billion compared to December 31 2014, driven by the dividend payments, cash absorbed by the discontinued operations and currency translation effects as well as by the reclassification of Saipem net cash in the discontinued operations. Compared to September 30, 2015, net borrowings decreased by €1.55 billion due to cash flow from operating activities pertaining to continuing operations (€4.01 billion), cash from discontinued operations (€0.50 billion) and cash proceeds from the disposal of Eni’s interests in Snam and Galp, which were partly offset by capital expenditure for the period and currency translation effects as well as by the reclassification of Saipem net cash in the discontinued operations. As of December 31, 2015, the ratio of net borrowings to shareholders’ equity including non-controlling interest – leverage7 – increased to 0.31, compared to 0.22 as of December 31, 2014. This increase was due to greater net borrowings and a reduction in total equity, which was impacted by the result of the year and dividend payments, partly offset by a sizable appreciation of the US dollar against the euro in the translation of the financial statements of Eni’s subsidiaries that use the US dollar as functional currency, ultimately resulting in an equity gain. The US dollar was up by 10.3% compared to the closing of the previous reporting period at December 31, 2014 and December 31, 2015. The effects of the Saipem transaction yielded a 9-points reduction in leverage to 0.22, calculated on a pro-forma basis on the financial position as of December 31, 2015. Dividend 2015 The Board of Directors intends to submit a proposal for distributing a dividend of €0.80 per share8 (€1.12 in 2014) at the Annual Shareholders’ Meeting. Included in this annual payment is €0.40 per share which was paid as interim dividend in September 2015. The balance of €0.40 per share is payable to shareholders on May 25, 2016, the ex-dividend date being May 23, 2016. Business developments Eni has finalized a strategic oil agreement in Egypt, which provides investment of up to $5 billion (at 100%) to develop the Country’s oil and gas reserves in future years. Eni has also agreed on new terms for ongoing oil contracts, with the economic effects retroactive to January 1, 2015. Set new measures to reduce overdue amounts of trade receivables relating to hydrocarbon supplies to Egyptian state-owned companies. In February 2016, Egyptian authorities sanctioned the development plan of the Zohr discovery, where production start-up is expected by end of 2017. In February 2016, Mozambique authorities sanctioned the development of the first development phase of Coral, targeting to put into production 140 bcm of gas.
6 Information on net borrowings composition is furnished on page 32. 7 Non-GAAP financial measures disclosed throughout this press release are accompanied by explanatory notes and tables to help investors gain a full understanding of said measures in line with guidance provided for by CESR Recommendation No. 2005-178b. See page 32 for leverage. 8 Dividends are not entitled to tax credit and, depending on the receiver, are subject to a withholding tax on distribution or are partially cumulated to the receiver’s taxable income.
- 5 -
Eni signed a preliminary agreement with KazMunayGas to acquire 50% of the mineral rights in the Isatay block in the Caspian Sea. Eni signed an agreement to supply 1.4 mmtonnes/y of LNG from the Eni-operated Jangkrik field (Eni’s interest 55%) to the Indonesian state-run company PT Pertamina, effective in 2017. The agreement will support the development of the Jangkrik field. In Ghana, Eni sanctioned the final investment decision for the integrated Offshore Cape Three Points (OCTP) oil and gas project (Eni 47.22%, operator). The first oil is expected in 2017. In Angola, Eni signed a three-year extension of the exploration period of the Block 15/06, where the first oil from the West Hub development operated project was achieved at the end of 2014.
Eni entered Mexico’s upstream sector by signing the Production Sharing Contract as operator (Eni’s interest 100%) of Block 1 to develop the oilfields of Amoca, Miztón e Tecoalli. These fields, located in the Gulf of Mexico shallow waters, are estimated to hold 800 million barrels of oil and 14 billion cubic meters of gas in place. The delineation campaign of the fields will be submitted to the Mexican authorities in the first quarter of 2016. This campaign foresees the drilling of four wells in order to define a combined and fast track development plan. In Mozambique, following the signing of the Unitization and Unit Operating Agreement (UUOA) and in full agreement with all the concessionaries of the projects, a unitization was set out for the development of the natural gas reservoirs straddling Areas 4 (operated by Eni East Africa) and 1 (operated by Anadarko) in the Rovuma Basin, offshore Mozambique. In accordance with the UUOA, the development of the straddling reservoirs will be carried out at an early stage in a separated but coordinated way by the two operators, until 24 Tcf of natural gas reserves are developed (12 Tcf of natural gas from each Area). Future developments will be jointly pursued by Area 4 and Area 1 concessionaires. The Final Investment Decision relating the Mamba field in Eni’s operating Area is expected in 2017. Eni renewed the exploration rights portfolio with the acquisition of approximately 20,000 square kilometers net of new acreage mainly in Egypt (Southwest Melehia in the Western Desert, Karawan and North Leil), Myanmar (two offshore blocks), Norway (three licences), the United Kingdom (7 offshore licences) and Mexico (Area 1). In 2015 exploration activities added 1.4 bboe to the Company’s reserve backlog at a cost of $0.7 per barrel (compared to a target of 500 million boe). In addition to the supergiant Zohr success, the main discoveries were made: i) in the prospect Nkala Marine in the Marine XII block in Congo; ii) in Egypt, with a gas and condensates discovery in the Noroos prospect in the West Abu Madi licence, which has entered production in just two months and the Melehia West Deep discovery in the Western Egyptian Desert; iii) in Libya, in the contractual area D with a gas and condensates discovery; iv) in Indonesia, in the Merakes field. As planned, Eni achieved the start-up of 10 major new fields, of which the most significant were: The giant Perla gas field offshore Venezuela, retaining a potential of up to 17 Tcf of gas in place (or
3.1 billion boe). A production plateau of approximately 1,200 mmcf/d is expected by 2020. Gas is sold to the national oil and gas company PDVSA under a Gas Sales Agreement running until 2036;
The Cinguvu field, part of the West Hub Development project in Block 15/06 offshore Angola. In addition, early in 2016 the third Mpungi satellite field came on stream achieving an overall plateau of 100 kboe/d;
Nené Marine in Congo in early production, just 8 months after obtaining authorization and sixteen months following the discovery;
The Kizomba project off Angola, Lucius and Hadrian off the United States in the Gulf of Mexico, Nooros in Egypt and West Franklin phase 2 in the United Kingdom.
- 6 -
Other developments Eni completed the sale of a residual 4% interest in Galp with proceeds of €325 million at a price of €9.81 per share. The transaction was carried out through an accelerated book-building procedure aimed at institutional investors. Eni received reimbursement of the bonds exchangeable into ordinary shares of Snam, through the receipt of approximately 288 million shares equal to approximately 8.22% of the share capital of the company. Eni holds a residual interest of the 0.03% of Snam share capital. Eni’s place on the Dow Jones Sustainability World Index was confirmed for the ninth consecutive year. The index features companies that are characterized by their excellent performance in all the fields of sustainability. Eni’s inclusion was also confirmed for the ninth consecutive year on the FTSE4Good, one of the world’s most prestigious corporate social responsibility stock-market indexes. This reflects Eni’s excellent performance in environmental sustainability, respect for human rights, corporate governance, transparency and relationship with stakeholders. Outlook The global macroeconomic outlook for 2016 is characterized by a number of risks and uncertainties, mainly due to the continued slowdown in China’s industrial activity, the Eurozone and other commodity-exporting countries. After hitting multi-year lows of below $30 per barrel, the price of crude oil is expected to continue to be weak due to structural imbalances in the marketplace driven by oversupply and renewed uncertainties surrounding the pace of future energy demand in the medium and long term. Based on this macroeconomic outlook, Eni’s management has revised downwards its pricing assumptions of the Brent crude oil marker utilized in each of the periods of the Company’s strategic plan 2016-2019: particularly the long-term reference price has been reduced to 65 dollar-a-barrel, down from the 90-dollar case utilized in the previous planning assumptions. In order to cope with the anticipated negative impact of the scenario on the E&P results from operations and cash flow, management is planning to increase efforts to optimize capex and reduce operating costs by exploiting the deflationary pressure induced by the fall in crude oil prices. In the G&P sector, management anticipates a challenging environment pressured by weak demand growth and oversupplies. The Company confirms its strategy to renegotiate long-term supply contracts in order to align the supply terms with market conditions, as well as boost profitability in its high-value businesses (LNG, gas retail and trading). In the R&M sector management expects still profitable refining margin, although lower than in 2015. In this context, business strategies will be focused on the optimization of refinery processes and costs as well as on the enhancement of results in marketing. Management’s forecasts for the Group’s production and sale metrics are explained below: - Hydrocarbons production: management expects production to be flat y-o-y due to the expected start-up of new fields, particularly in Norway, Egypt, Angola, Kazakhstan and the United States, and the ramp-up of fields started in 2015 to offset decline at mature fields; - Natural gas sales: against the backdrop of weak demand and strong competition, management expects gas sales to be slightly down y-o-y in line with an expected reduction of the contractual minimum take of long-term supply contracts. Management plans to retain its market share in the large customers and retail segments also increasing the value of the existing customer base by developing innovative commercial propositions, by integrating services to the supply of the commodity and by optimizing operations and commercial activities; - Refinery intake on own account; refinery intake are expected flat y-o-y excluding the effect of the disposal of Eni’s refining capacity in CRC refinery in Czech Republic finalized on April 30, 2015; - Refined products sales in Italy and in the rest of Europe: against the backdrop of weak demand growth and strong competition, management expects to consolidate volume and market share in the Italian retail market also increasing the value of the existing customer base by leveraging our offer
- 7 -
differentiation, innovation in products and services as well as efficiency in logistic and commercial activities. In 2016 management expects to carry out a number of initiatives intended to reduce capital spending by 20% y-o-y on a constant exchange rate basis by re-phasing and rescheduling capital projects, being increasingly selective with exploration plays and renegotiating contracts for the supply of capital goods in order to cope with the slump in crude oil prices. Those initiatives are expected to have a limited impact on our plans to grow production in the short and medium term. Management forecasts that capex will be 100%-funded by cash flow from operations under a 50 dollar-a-barrel scenario. Operating costs per boe is expected to be reduced by 11% y-o-y. The Group’s leverage is projected to be below the 0.30 threshold thanks to the closing of the Saipem transaction, optimization of the underlying performance and portfolio management, which are expected to reduce the impact of the oil and gas prices. On March 18, 2016, Eni is hosting a strategy presentation to outline the Company’s strategy and targets for the 2016-2019 plan, as well as the current economic and financial outlook. In this press release on the Group consolidated accounts for the fourth quarter and the full year 2015, results and cash flow are presented for the fourth and third quarter of 2015, for the fourth quarter of 2015 and for the full year 2015 and 2014. Information on liquidity and capital resources relates to the period ending as of December 31, September 30, 2015, and December 31, 2014. Except for the adjusted results on a standalone basis, statements presented in this press release are comparable with those presented in the management’s disclosure section of the Company’s annual report and interim report. Accounts set forth herein have been prepared in accordance with the evaluation and recognition criteria set by the International Financial Reporting Standards (IFRS) issued by the International Accounting Standards Board (IASB) and adopted by the European Commission according to the procedure set forth in Article 6 of the European Regulation (CE) No. 1606/2002 of the European Parliament and European Council of July 19, 2002. These criteria are unchanged from the 2014 annual report on form 20-F filed with the US SEC on April 2, 2015, and the Interim Consolidated Financial Statements as of June 30, 2015, which investors are urged to read. In this press release illustrating Eni’s preliminary results for Q4 and FY2015, the two operating segments E&C and Chemical have been classified as discontinued operations based on the guidelines of IFRS 5, because at the reporting date there was the firm commitment of the management to recover their carrying amounts through a sale transaction and it was highly probable that a sale transaction would be consummated in a short-time frame. The comparative reporting periods of this press release have been restated consistently. The Saipem transaction was finalized on January 22, 2016, with the closing of the sale of a 12.5% stake in the entity to the Fondo Strategico Italiano (FSI) and the concurrent enter into force of the shareholder agreement between the parties intended to establish joint control over the former subsidiary. Saipem is due to be derecognized from Eni’s consolidated accounts effective January 1, 2016. Negotiations are underway with an industrial partner who has showed interest in acquiring a controlling stake of Versalis, the 100%-owned Eni subsidiary, which manages the Group chemical business, thus supporting Eni in implementing the industrial plan designed to upgrade the business. Because Eni is exiting two major lines of business, the mentioned disposal groups have been represented and accounted for as discontinued operations. Based on this accounting, gains and losses pertaining to the discontinued operations include only those earned form transactions with third parties, while gains and losses on intercompany transactions have continued being eliminated because both Saipem and Versalis were fully consolidated subsidiaries at the 2015 reporting date. The accounting of the discontinued operations entails that in presence of large intercompany transactions, the results of the continuing operations do not fully illustrate the underlying performance given the elimination of gains and losses on intercompany transactions with the discontinued operations. Regarding Saipem, the cost incurred by the entity for the supply of capital goods and maintenance services to Eni’s group companies are eliminated upon consolidation. Regarding Versalis, the revenues earned by the Group operating companies, mainly in the R&M segment, for the supply of oil-based chemical feedstock are eliminated upon consolidation. Furthermore, Saipem ceased recognizing depreciation charges form the classification date (November 1, 2015; Versalis was classified as discontinued operations at the reporting date). The carrying amounts of goodwill and other non-current assets at both disposal groups were adjusted to take into account the alignment of the two disposal groups net assets to their fair values at the reporting date, given by the market price for Saipem and the fair value based on the transaction that is underway for Versalis.
New segmental reporting of Eni Effective January 1, 2015, Eni’s segment information was modified to align Eni’s reportable segments to certain changes in the organization and in profit accountability defined by Eni’s top management. The main changes adopted compared to the previous setup of the segment information related to:
Results of the oil and products trading activities and related risk management activities were transferred to the Gas & Power segment, consistently with the new organizational setup. In previous reporting periods, results of those activities were reported within the Refining & Marketing segment as part of a reporting structure which highlighted results for each stream of commodities;
R&M and Chemicals operating segments are now combined into a single reportable segment because a single manager is accountable for both the two segments and they show similar long-term economic performance;
The previous reporting segments “Corporate and financial companies” and “Other activities” have been combined being residual components of the Group.
The comparative reporting periods have been restated consequently (see tables below) and to reflect the representation of discontinued operations. In particular, Versalis’ results have been reclassified from the “R&M and Chemical” reporting segment and accounted as discontinued operations together with the E&C business.
- 8 -
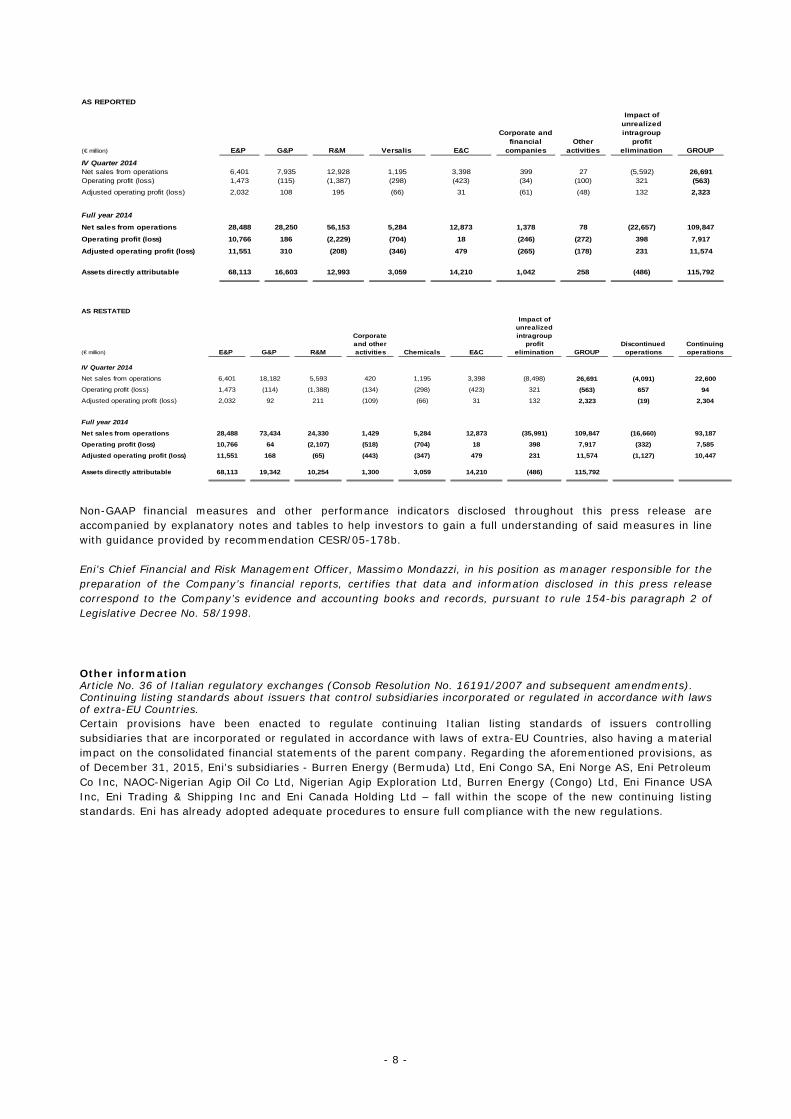
AS REPORTED
(€ million) E&P G&P R&M Versalis E&C
Corporate and financial
companiesOther
activities
Impact of unrealized intragroup
profit elimination GROUP
IV Quarter 2014Net sales from operations 6,401 7,935 12,928 1,195 3,398 399 27 (5,592) 26,691Operating profit (loss) 1,473 (115) (1,387) (298) (423) (34) (100) 321 (563)
Adjusted operating profit (loss) 2,032 108 195 (66) 31 (61) (48) 132 2,323
Full year 2014
Net sales from operations 28,488 28,250 56,153 5,284 12,873 1,378 78 (22,657) 109,847
Operating profit (loss) 10,766 186 (2,229) (704) 18 (246) (272) 398 7,917
Adjusted operating profit (loss) 11,551 310 (208) (346) 479 (265) (178) 231 11,574
Assets directly attributable 68,113 16,603 12,993 3,059 14,210 1,042 258 (486) 115,792
AS RESTATED
(€ million) E&P G&P R&M
Corporate and other activities Chemicals E&C
Impact of unrealized intragroup
profit elimination GROUP
Discontinued operations
Continuing operations
IV Quarter 2014
Net sales from operations 6,401 18,182 5,593 420 1,195 3,398 (8,498) 26,691 (4,091) 22,600
Operating profit (loss) 1,473 (114) (1,388) (134) (298) (423) 321 (563) 657 94
Adjusted operating profit (loss) 2,032 92 211 (109) (66) 31 132 2,323 (19) 2,304
Full year 2014
Net sales from operations 28,488 73,434 24,330 1,429 5,284 12,873 (35,991) 109,847 (16,660) 93,187
Operating profit (loss) 10,766 64 (2,107) (518) (704) 18 398 7,917 (332) 7,585
Adjusted operating profit (loss) 11,551 168 (65) (443) (347) 479 231 11,574 (1,127) 10,447
Assets directly attributable 68,113 19,342 10,254 1,300 3,059 14,210 (486) 115,792
Non-GAAP financial measures and other performance indicators disclosed throughout this press release are accompanied by explanatory notes and tables to help investors to gain a full understanding of said measures in line with guidance provided by recommendation CESR/05-178b. Eni’s Chief Financial and Risk Management Officer, Massimo Mondazzi, in his position as manager responsible for the preparation of the Company’s financial reports, certifies that data and information disclosed in this press release correspond to the Company’s evidence and accounting books and records, pursuant to rule 154-bis paragraph 2 of Legislative Decree No. 58/1998. Other information Article No. 36 of Italian regulatory exchanges (Consob Resolution No. 16191/2007 and subsequent amendments). Continuing listing standards about issuers that control subsidiaries incorporated or regulated in accordance with laws of extra-EU Countries. Certain provisions have been enacted to regulate continuing Italian listing standards of issuers controlling subsidiaries that are incorporated or regulated in accordance with laws of extra-EU Countries, also having a material impact on the consolidated financial statements of the parent company. Regarding the aforementioned provisions, as of December 31, 2015, Eni’s subsidiaries - Burren Energy (Bermuda) Ltd, Eni Congo SA, Eni Norge AS, Eni Petroleum Co Inc, NAOC-Nigerian Agip Oil Co Ltd, Nigerian Agip Exploration Ltd, Burren Energy (Congo) Ltd, Eni Finance USA Inc, Eni Trading & Shipping Inc and Eni Canada Holding Ltd – fall within the scope of the new continuing listing standards. Eni has already adopted adequate procedures to ensure full compliance with the new regulations.
- 9 -
Disclaimer This press release, in particular the statements under the section “Outlook”, contains certain forward-looking statements particularly those regarding capital expenditure, development and management of oil and gas resources, dividends, allocation of future cash flow from operations, future operating performance, gearing, targets of production and sales growth, new markets and the progress and timing of projects. By their nature, forward-looking statements involve risks and uncertainties because they relate to events and depend on circumstances that will or may occur in the future. Actual results may differ from those expressed in such statements, depending on a variety of factors, including the timing of bringing new fields on stream; management’s ability in carrying out industrial plans and in succeeding in commercial transactions; future levels of industry product supply; demand and pricing; operational issues; general economic conditions; political stability and economic growth in relevant areas of the world; changes in laws and governmental regulations; development and use of new technology; changes in public expectations and other changes in business conditions; the actions of competitors and other factors discussed elsewhere in this document. Due to the seasonality in demand for natural gas and certain refined products and the changes in a number of external factors affecting Eni’s operations, such as prices and margins of hydrocarbons and refined products, Eni’s results from operations and changes in net borrowings for the fourth quarter of the year cannot be extrapolated on an annual basis. The all sources reserve replacement ratio disclosed elsewhere in this press release is calculated as ratio of changes in proved reserves for the year resulting from revisions of previously reported reserves, improved recovery, extensions, discoveries and sales or purchases of minerals in place, to production for the year. A ratio higher than 100% indicates that more proved reserves were added than produced in a year. The Reserve Replacement Ratio is a measure used by management to indicate the extent to which production is replaced by proved oil and gas reserves. The Reserve Replacement Ratio is not an indicator of future production because the ultimate development and production of reserves is subject to a number of risks and uncertainties. These include the risks associated with the successful completion of large-scale projects, including addressing ongoing regulatory issues and completion of infrastructure, as well as changes in oil and gas prices, political risks and geological and other environmental risks.
* * *
Company Contacts
Press Office: +39.0252031875 - +39.0659822030
Freephone for shareholders (from Italy): 800940924
Freephone for shareholders (from abroad): +80011223456
Switchboard: +39-0659821
Website: www.eni.com
* * *
Eni
Società per Azioni Rome, Piazzale Enrico Mattei, 1
Share capital: €4,005,358,876 fully paid
Tax identification number 00484960588
Tel.: +39 0659821 - Fax: +39 0659822141
This press release for the fourth quarter and the full year 2015 (unaudited) is also available on Eni’s website eni.com.
- 10 -
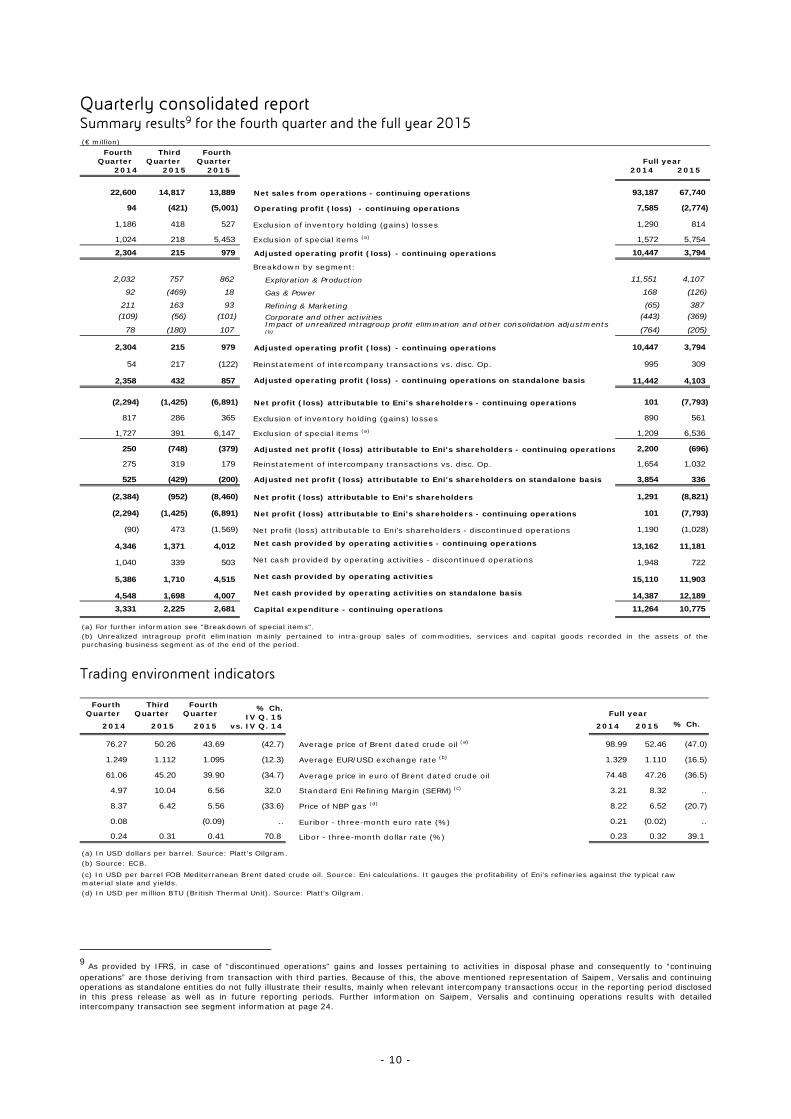
Quarterly consolidated report Summary results9 for the fourth quarter and the full year 2015 (€ million)
Fourth Quarter
Third Quarter
Fourth Quarter
2014 2015 2015 2014 2015
22,600 14,817 13,889 Net sales from operations - continuing operations 93,187 67,740
94 (421) (5,001) Operating profit (loss) - continuing operations 7,585 (2,774)
1,186 418 527 Exclusion of inventory holding (gains) losses 1,290 814
1,024 218 5,453 Exclusion of special items (a) 1,572 5,754
2,304 215 979 Adjusted operating profit (loss) - continuing operations 10,447 3,794
Breakdown by segment:
2,032 757 862 Exploration & Production 11,551 4,107
92 (469) 18 Gas & Power 168 (126)
211 163 93 Refining & Marketing (65) 387
(109) (56) (101) Corporate and other activities (443) (369)
78 (180) 107Impact of unrealized intragroup profit elimination and other consolidation adjustments (b) (764) (205)
2,304 215 979 Adjusted operating profit (loss) - continuing operations 10,447 3,794
54 217 (122) Reinstatement of intercompany transactions vs. disc. Op. 995 309
2,358 432 857 Adjusted operating profit (loss) - continuing operations on standalone basis 11,442 4,103
(2,294) (1,425) (6,891) Net profit (loss) attributable to Eni's shareholders - continuing operations 101 (7,793)
817 286 365 Exclusion of inventory holding (gains) losses 890 561
1,727 391 6,147 Exclusion of special items (a) 1,209 6,536
250 (748) (379) Adjusted net profit (loss) attributable to Eni's shareholders - continuing operations 2,200 (696)
275 319 179 Reinstatement of intercompany transactions vs. disc. Op. 1,654 1,032
525 (429) (200) Adjusted net profit (loss) attributable to Eni's shareholders on standalone basis 3,854 336
(2,384) (952) (8,460) Net profit (loss) attributable to Eni's shareholders 1,291 (8,821)
(2,294) (1,425) (6,891) Net profit (loss) attributable to Eni's shareholders - continuing operations 101 (7,793)
(90) 473 (1,569) Net profit (loss) attributable to Eni's shareholders - discontinued operations 1,190 (1,028)
4,346 1,371 4,012 Net cash provided by operating activities - continuing operations 13,162 11,181
1,040 339 503 Net cash provided by operating activities - discontinued operations 1,948 722
5,386 1,710 4,515 Net cash provided by operating activities 15,110 11,903
4,548 1,698 4,007 Net cash provided by operating activities on standalone basis 14,387 12,189
3,331 2,225 2,681 Capital expenditure - continuing operations 11,264 10,775
Full year
(b) Unrealized intragroup profit elimination mainly pertained to intra-group sales of commodities, services and capital goods recorded in the assets of thepurchasing business segment as of the end of the period.
(a) For further information see "Breakdown of special items".
Trading environment indicators
Fourth Quarter
Third Quarter
Fourth Quarter
2014 2015 2015 2014 2015 % Ch.
76.27 50.26 43.69 (42.7) Average price of Brent dated crude oil (a) 98.99 52.46 (47.0)
1.249 1.112 1.095 (12.3) Average EUR/USD exchange rate (b) 1.329 1.110 (16.5)
61.06 45.20 39.90 (34.7) Average price in euro of Brent dated crude oil 74.48 47.26 (36.5)
4.97 10.04 6.56 32.0 Standard Eni Refining Margin (SERM) (c) 3.21 8.32 ..
8.37 6.42 5.56 (33.6) Price of NBP gas (d) 8.22 6.52 (20.7)
0.08 (0.09) .. Euribor - three-month euro rate (%) 0.21 (0.02) ..
0.24 0.31 0.41 70.8 Libor - three-month dollar rate (%) 0.23 0.32 39.1
(d) In USD per million BTU (British Thermal Unit). Source: Platt’s Oilgram.
% Ch.IV Q. 15
vs. IV Q. 14
Full year
(a) In USD dollars per barrel. Source: Platt’s Oilgram.(b) Source: ECB.
(c) In USD per barrel FOB Mediterranean Brent dated crude oil. Source: Eni calculations. It gauges the profitability of Eni’s refineries against the typical raw material slate and yields.
9 As provided by IFRS, in case of “discontinued operations” gains and losses pertaining to activities in disposal phase and consequently to “continuing operations” are those deriving from transaction with third parties. Because of this, the above mentioned representation of Saipem, Versalis and continuing operations as standalone entities do not fully illustrate their results, mainly when relevant intercompany transactions occur in the reporting period disclosed in this press release as well as in future reporting periods. Further information on Saipem, Versalis and continuing operations results with detailed intercompany transaction see segment information at page 24.
- 11 -
Group financial review Reported results In Q4 2015 Eni reported a net loss pertaining to continuing operations of €6,891 million (€7,793 million in the FY2015), which was sharply lower y-o-y when Eni reported a net loss of €2,294 million in Q4 2014 and break-even in the FY2014. A prolonged slide in crude oil prices has negatively affected the Group’s performance, eroding results from operations and the value of assets. Operating earnings were a loss of €5,001 million in Q4 2015 and a loss of €2,774 million in the FY2015. These negatives were driven by lower E&P revenues reflecting reduced oil and gas realizations negatively impacted by sharply lower Brent prices (down by 43%), the alignment of the carrying amounts of oil and product inventories to current market prices and the recognition of material impairment losses mainly taken at the Group oil&gas CGUs (€4,453 million). In performing the impairment review, Eni’s management assumed a reduced long-term price outlook for the Brent crude oil price down to $65 per barrel compared to the previous $90-a-barrel case adopted for valuating asset recoverability in the 2014 annual report. Furthermore, the Q4 operating loss was impacted by an estimate revision of €346 million taken at revenues accrued on the sale of natural gas and electricity to retail customers in Italy dating back to past reporting periods and the establishment of a provision of €130 million (€484 million and €226 million, respectively in the FY2015). Eni’s management has implemented a number of initiatives to mitigate the negative effect of low oil prices on profitability and cash flow. These initiatives include the reduction of E&P operating expenses and the curtailment of capital expenditure by carefully selecting exploration plays, rescheduling and re-phasing large development activities and renegotiating contracts for the supply of plants and other E&P infrastructures, as well as leveraging oilfield services rates on the deflationary pressure induced by the decline in crude oil prices. This reduction in capital expenditure only had a modest impact on hydrocarbon production, which grew by 14% to 1,884 kboe/d in Q4 2015 (up to 1,760 kboe/d for the FY2015, or 10% from 2014). The production plateau was the highest in the last 20 quarters (since 2010, on yearly basis). The Refining & Marketing segment returned to underlying profitability supported by plant optimizations and an ongoing margin recovery. The G&P segment almost achieved EBIT break-even, net of extraordinary charges related to the unfavorable outcome of commercial arbitration, despite the postponement of the recognition of gains on the renegotiations of certain long-term supply contracts. Finally, G&A expenses were reduced by €0.6 billion. Net loss for Q4 2015 and the FY2015 was significantly affected by an increased tax rate driven by a deteriorating price scenario in the upstream segment, which resulted in the segment’s taxable profit earned in PSA contracts, which, although more resilient in a low-price environment, nonetheless bear higher-than-average rates of tax and a higher incidence of non-deductible expenses on the pre-tax profit that has been lowered by the scenario. In addition, the tax rate was impacted by lower recognition of deferred tax assets relating operating losses due to a reduced profitability outlook (€860 million). The Group tax rate was also impacted by the write-off of Italian deferred tax assets of €870 million in the full year due to projections of lower future taxable profit at Italian subsidiaries and the reduction of the statutory tax rate from 27.5% to 24%, which was considered as substantially enacted at the reporting date. Net loss attributable to Eni’s shareholders including both continuing operations and discontinued operations amounted to €8,460 million in Q4 and to €8,821 million for the FY2015. The loss of the discontinued operations pertaining to Eni’s shareholders was affected by the recognition of impairment losses on the disposal groups Saipem and Versalis, which net assets were aligned to the lower of their carrying amounts and fair value. Eni’s net assets in Saipem and Versalis were aligned respectively to the share price at the reporting date and the likely outcome of the industrial agreement, which is being evaluated in the negotiations currently underway, resulting in an overall impairment charge of €1,969 million. Partly offsetting, a fair-valued derivative gain of €49 million was recorded for Saipem due to the

- 12 -
difference between the transaction price (€8.39 per share) and the market price at the reporting date (€7.49 per share) for the stake disposed of to FSI. On January 22, 2016, following the closing of the Saipem transaction, the residual interest in the former subsidiary was initially recognized as investment in a joint venture and was aligned at the market price at closing of €4.2 per share with a charge through profit and loss of €441 million. Subsequently, in February 2016 Saipem’s market capitalization has fallen sharply. Under the provisions of IAS 10 these negative developments do not constitute adjusting events of the Saipem valuation made in the 2015 accounts which aligned the Saipem carrying amount to the market price at December 31, 2015. Adjusted results on a standalone basis In Q4 2015, adjusted operating profit of continuing operations was €857 million, down by 63.7% y-o-y (€4,103 million, down by 64.1% in the full year). Adjusted net loss pertaining to continuing operations attributable to Eni’s shareholders amounted to €200 million in Q4 2015, down by €725 million y-o-y. The adjusted net loss comprises positive adjustments of €6,691 million related to: (i) an inventory post-tax loss of €365 million, (ii) post-tax special charges of €6,147 million; (iii) an adjustment amounting to €179 million was made to reinstate the elimination of gains and losses on intercompany transactions with the discontinued operations in order to obtain a Non-GAAP measure which is indicative of the underlying performance of the continuing operations. In the FY2015, adjusted operating profit of continuing operations was €4,103 million, down by 64.1%; adjusted net profit of €336 million was down by €3,518 million. Net result excluded a post-tax inventory loss (€561 million), post-tax special charges (€6,536 million) and an adjustment amounting to €1,032 million, which was made to reinstate the elimination of gains and losses on intercompany transactions with the discontinued operations in order to obtain a Non-GAAP measure, which is indicative of the underlying performance of the continuing operations. These adjustments resulted in an overall positive adjustment of €8,129 million. Special items of the operating profit of continuing operations (net charges of €5,453 million and €5,754 million, in the fourth quarter and the full year 2015, respectively) comprised: (i) impairment losses (€4,659 million and €4,824 million in the two reporting periods, respectively) mainly relating to oil&gas properties driven by the impact of a lower price environment on the expected future cash flows in the medium and long-term. The most notable impairments refer to certain assets, which were acquired by the Group following business combinations in previous reporting periods (Algeria, Congo and Turkmenistan) and to CGUs which are currently operating in high-cost areas (USA, UK, Norway and Angola). Furthermore, investments made for compliance and stay-in-business purposes were written off at cash generating units previously devaluated in the Refining & Marketing business. Finally, impairment losses were recorded at the Group power plants in the G&P segment due to a weak margins scenario; (ii) net charges in the Gas & Power segment due to an estimate revision of revenues accrued on the sale of natural gas (€346 million) and electricity (€138 million) to retail customers in Italy and the establishment of a provision for these revenues (€130 million for gas sale and €96 million for electricity); (iii) the effects of the fair-value evaluation of certain commodity derivatives lacking the formal criteria to be accounted as hedges under IFRS (charge of €141 million and of €164 million in the fourth quarter and the full year 2015, respectively); (iv) environmental provisions (€60 million and €204 million in the two reporting periods, respectively) and provisions for redundancy incentives (€4 million and €27 million, respectively). Non-operating special items related to income taxes related to the tax effects of special gains/charges in operating profit, the write-off of certain deferred tax assets (€870 million in FY2015) due to projections of lower future taxable profit at Italian subsidiaries and the reduction of the statutory tax rate. In addition, similar adjustments to deferred tax assets were recognized outside Italy at E&P subsidiaries (€860 million). These charges were partly offset by the reversal of deferred taxation due to changes in the United Kingdom tax law.
- 13 -
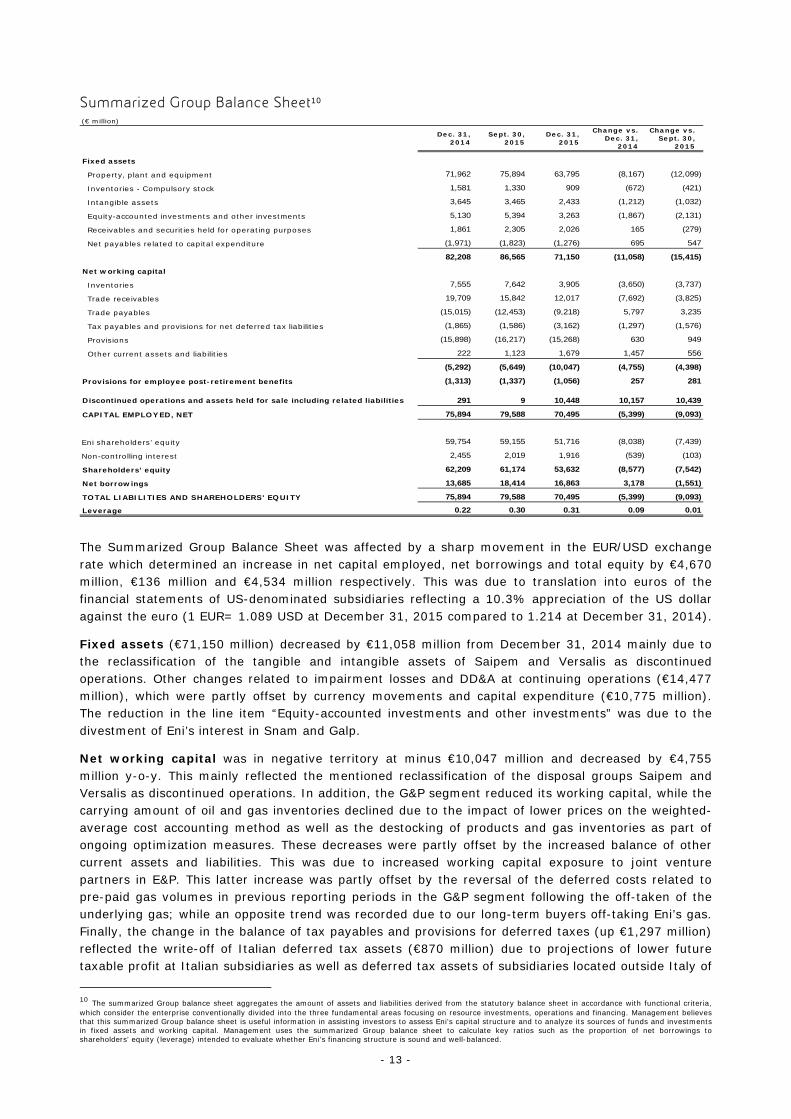
Summarized Group Balance Sheet10 (€ million)
Dec. 31, 2014
Sept. 30, 2015
Dec. 31, 2015
Change vs. Dec. 31,
2014
Change vs. Sept. 30,
2015
Fixed assets
Property, plant and equipment 71,962 75,894 63,795 (8,167) (12,099)
Inventories - Compulsory stock 1,581 1,330 909 (672) (421)
Intangible assets 3,645 3,465 2,433 (1,212) (1,032)
Equity-accounted investments and other investments 5,130 5,394 3,263 (1,867) (2,131)
Receivables and securities held for operating purposes 1,861 2,305 2,026 165 (279)
Net payables related to capital expenditure (1,971) (1,823) (1,276) 695 547
82,208 86,565 71,150 (11,058) (15,415)
Net working capital
Inventories 7,555 7,642 3,905 (3,650) (3,737)
Trade receivables 19,709 15,842 12,017 (7,692) (3,825)
Trade payables (15,015) (12,453) (9,218) 5,797 3,235
Tax payables and provisions for net deferred tax liabilities (1,865) (1,586) (3,162) (1,297) (1,576)
Provisions (15,898) (16,217) (15,268) 630 949
Other current assets and liabilities 222 1,123 1,679 1,457 556
(5,292) (5,649) (10,047) (4,755) (4,398)
Provisions for employee post-retirement benefits (1,313) (1,337) (1,056) 257 281
Discontinued operations and assets held for sale including related liabilities 291 9 10,448 10,157 10,439
CAPITAL EMPLOYED, NET 75,894 79,588 70,495 (5,399) (9,093)
Eni shareholders’ equity 59,754 59,155 51,716 (8,038) (7,439)
Non-controlling interest 2,455 2,019 1,916 (539) (103)
Shareholders’ equity 62,209 61,174 53,632 (8,577) (7,542)
Net borrowings 13,685 18,414 16,863 3,178 (1,551)
TOTAL LIABILITIES AND SHAREHOLDERS' EQUITY 75,894 79,588 70,495 (5,399) (9,093)
Leverage 0.22 0.30 0.31 0.09 0.01 The Summarized Group Balance Sheet was affected by a sharp movement in the EUR/USD exchange rate which determined an increase in net capital employed, net borrowings and total equity by €4,670 million, €136 million and €4,534 million respectively. This was due to translation into euros of the financial statements of US-denominated subsidiaries reflecting a 10.3% appreciation of the US dollar against the euro (1 EUR= 1.089 USD at December 31, 2015 compared to 1.214 at December 31, 2014).
Fixed assets (€71,150 million) decreased by €11,058 million from December 31, 2014 mainly due to the reclassification of the tangible and intangible assets of Saipem and Versalis as discontinued operations. Other changes related to impairment losses and DD&A at continuing operations (€14,477 million), which were partly offset by currency movements and capital expenditure (€10,775 million). The reduction in the line item “Equity-accounted investments and other investments” was due to the divestment of Eni’s interest in Snam and Galp.
Net working capital was in negative territory at minus €10,047 million and decreased by €4,755 million y-o-y. This mainly reflected the mentioned reclassification of the disposal groups Saipem and Versalis as discontinued operations. In addition, the G&P segment reduced its working capital, while the carrying amount of oil and gas inventories declined due to the impact of lower prices on the weighted-average cost accounting method as well as the destocking of products and gas inventories as part of ongoing optimization measures. These decreases were partly offset by the increased balance of other current assets and liabilities. This was due to increased working capital exposure to joint venture partners in E&P. This latter increase was partly offset by the reversal of the deferred costs related to pre-paid gas volumes in previous reporting periods in the G&P segment following the off-taken of the underlying gas; while an opposite trend was recorded due to our long-term buyers off-taking Eni’s gas. Finally, the change in the balance of tax payables and provisions for deferred taxes (up €1,297 million) reflected the write-off of Italian deferred tax assets (€870 million) due to projections of lower future taxable profit at Italian subsidiaries as well as deferred tax assets of subsidiaries located outside Italy of
10 The summarized Group balance sheet aggregates the amount of assets and liabilities derived from the statutory balance sheet in accordance with functional criteria, which consider the enterprise conventionally divided into the three fundamental areas focusing on resource investments, operations and financing. Management believes that this summarized Group balance sheet is useful information in assisting investors to assess Eni’s capital structure and to analyze its sources of funds and investments in fixed assets and working capital. Management uses the summarized Group balance sheet to calculate key ratios such as the proportion of net borrowings to shareholders’ equity (leverage) intended to evaluate whether Eni’s financing structure is sound and well-balanced.
- 14 -
the upstream segment (€860 million) and the reimbursement/transferring to financing institutions of taxes receivables in Italy (approximately €900 million).
Discontinued operations, asset held for sale including related liabilities (€10,448 million) comprised: i) Saipem and its subsidiaries considering the arrangements signed on October 2015 with the Fondo Strategico Italiano (FSI). These include the sale of a 12.5% stake of the share capital of Saipem to FSI and a concurrent shareholder agreement with Eni intended to establish joint control over the target entity; ii) the chemical operating segment. As of the reporting date, negotiations were underway to define an agreement with an industrial partner who, by acquiring a controlling stake of Versalis, would support Eni in implementing the industrial plan designed to upgrade this segment. In addition, the book value of goodwill and of the non-current assets of the two disposal groups have been aligned to the fair value of the underlying net assets. This item also includes non-strategic assets in the Refining & Marketing and Gas & Power businesses.
Shareholders’ equity including non-controlling interest was €53,632 million, representing a decrease of €8,577 million from December 31, 2014. This was due to net loss in comprehensive income for the year (€5,070 million) given by net loss of €9,416 million partly offset by positive foreign currency translation differences (€4,534 million). Also affecting the total equity was dividend distribution and other changes of €3,478 million (€3,457 million being the 2014 final dividend and the interim dividend for 2015 paid to Eni’s shareholders and dividends to other non-controlling interests).
- 15 -
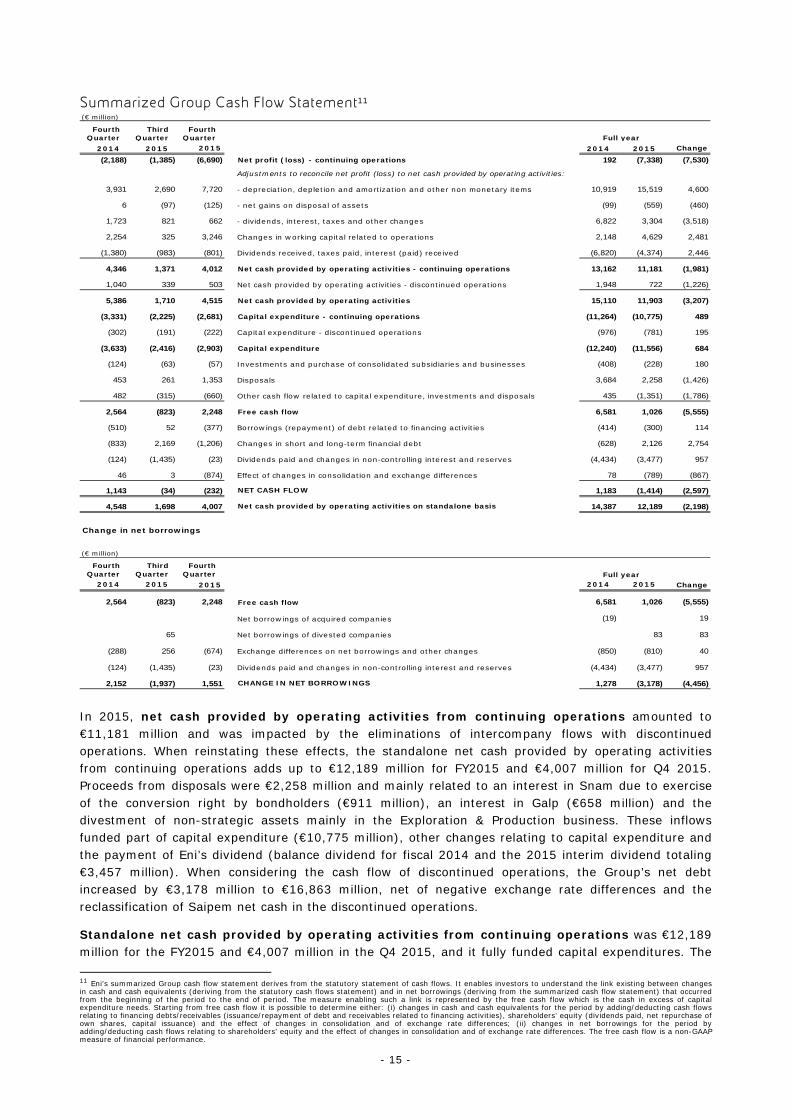
Summarized Group Cash Flow Statement11 (€ million)
Fourth Quarter
Third Quarter
Fourth Quarter
2014 2015 2015 2014 2015 Change
(2,188) (1,385) (6,690) Net profit (loss) - continuing operations 192 (7,338) (7,530)
Adjustments to reconcile net profit (loss) to net cash provided by operating activities:
3,931 2,690 7,720 - depreciation, depletion and amortization and other non monetary items 10,919 15,519 4,600
6 (97) (125) - net gains on disposal of assets (99) (559) (460)
1,723 821 662 - dividends, interest, taxes and other changes 6,822 3,304 (3,518)
2,254 325 3,246 Changes in working capital related to operations 2,148 4,629 2,481
(1,380) (983) (801) Dividends received, taxes paid, interest (paid) received (6,820) (4,374) 2,446
4,346 1,371 4,012 Net cash provided by operating activities - continuing operations 13,162 11,181 (1,981)
1,040 339 503 Net cash provided by operating activities - discontinued operations 1,948 722 (1,226)
5,386 1,710 4,515 Net cash provided by operating activities 15,110 11,903 (3,207)
(3,331) (2,225) (2,681) Capital expenditure - continuing operations (11,264) (10,775) 489
(302) (191) (222) Capital expenditure - discontinued operations (976) (781) 195
(3,633) (2,416) (2,903) Capital expenditure (12,240) (11,556) 684
(124) (63) (57) Investments and purchase of consolidated subsidiaries and businesses (408) (228) 180
453 261 1,353 Disposals 3,684 2,258 (1,426)
482 (315) (660) Other cash flow related to capital expenditure, investments and disposals 435 (1,351) (1,786)
2,564 (823) 2,248 Free cash flow 6,581 1,026 (5,555)
(510) 52 (377) Borrowings (repayment) of debt related to financing activities (414) (300) 114
(833) 2,169 (1,206) Changes in short and long-term financial debt (628) 2,126 2,754
(124) (1,435) (23) Dividends paid and changes in non-controlling interest and reserves (4,434) (3,477) 957
46 3 (874) Effect of changes in consolidation and exchange differences 78 (789) (867)
1,143 (34) (232) NET CASH FLOW 1,183 (1,414) (2,597)
4,548 1,698 4,007 Net cash provided by operating activities on standalone basis 14,387 12,189 (2,198)
Change in net borrowings
(€ million)
Fourth Quarter
Third Quarter
Fourth Quarter
2014 2015 2015 2014 2015 Change
2,564 (823) 2,248 Free cash flow 6,581 1,026 (5,555)
Net borrowings of acquired companies (19) 19
65 Net borrowings of divested companies 83 83
(288) 256 (674) Exchange differences on net borrowings and other changes (850) (810) 40
(124) (1,435) (23) Dividends paid and changes in non-controlling interest and reserves (4,434) (3,477) 957
2,152 (1,937) 1,551 CHANGE IN NET BORROWINGS 1,278 (3,178) (4,456)
Full year
Full year
In 2015, net cash provided by operating activities from continuing operations amounted to €11,181 million and was impacted by the eliminations of intercompany flows with discontinued operations. When reinstating these effects, the standalone net cash provided by operating activities from continuing operations adds up to €12,189 million for FY2015 and €4,007 million for Q4 2015. Proceeds from disposals were €2,258 million and mainly related to an interest in Snam due to exercise of the conversion right by bondholders (€911 million), an interest in Galp (€658 million) and the divestment of non-strategic assets mainly in the Exploration & Production business. These inflows funded part of capital expenditure (€10,775 million), other changes relating to capital expenditure and the payment of Eni’s dividend (balance dividend for fiscal 2014 and the 2015 interim dividend totaling €3,457 million). When considering the cash flow of discontinued operations, the Group’s net debt increased by €3,178 million to €16,863 million, net of negative exchange rate differences and the reclassification of Saipem net cash in the discontinued operations.
Standalone net cash provided by operating activities from continuing operations was €12,189 million for the FY2015 and €4,007 million in the Q4 2015, and it fully funded capital expenditures. The 11 Eni’s summarized Group cash flow statement derives from the statutory statement of cash flows. It enables investors to understand the link existing between changes in cash and cash equivalents (deriving from the statutory cash flows statement) and in net borrowings (deriving from the summarized cash flow statement) that occurred from the beginning of the period to the end of period. The measure enabling such a link is represented by the free cash flow which is the cash in excess of capital expenditure needs. Starting from free cash flow it is possible to determine either: (i) changes in cash and cash equivalents for the period by adding/deducting cash flows relating to financing debts/receivables (issuance/repayment of debt and receivables related to financing activities), shareholders’ equity (dividends paid, net repurchase of own shares, capital issuance) and the effect of changes in consolidation and of exchange rate differences; (ii) changes in net borrowings for the period by adding/deducting cash flows relating to shareholders’ equity and the effect of changes in consolidation and of exchange rate differences. The free cash flow is a non-GAAP measure of financial performance.
- 16 -
Group cash flow performance was excellent (down 15% and down 12%, respectively, from the corresponding periods of 2014) in spite of sharply lower oil prices. This result was driven by optimization initiatives in working capital performed mainly in the G&P, with the substantial recovery of prepaid gas volumes and other renegotiation benefits, and in the R&M segment as well as in corporate activities. Non-recurring effects of the working capital positively influenced cash flow by approximately €2.2 billion.
Financial and operating information by segment for the fourth quarter and full year 2015 is provided in the following pages.
- 17 -
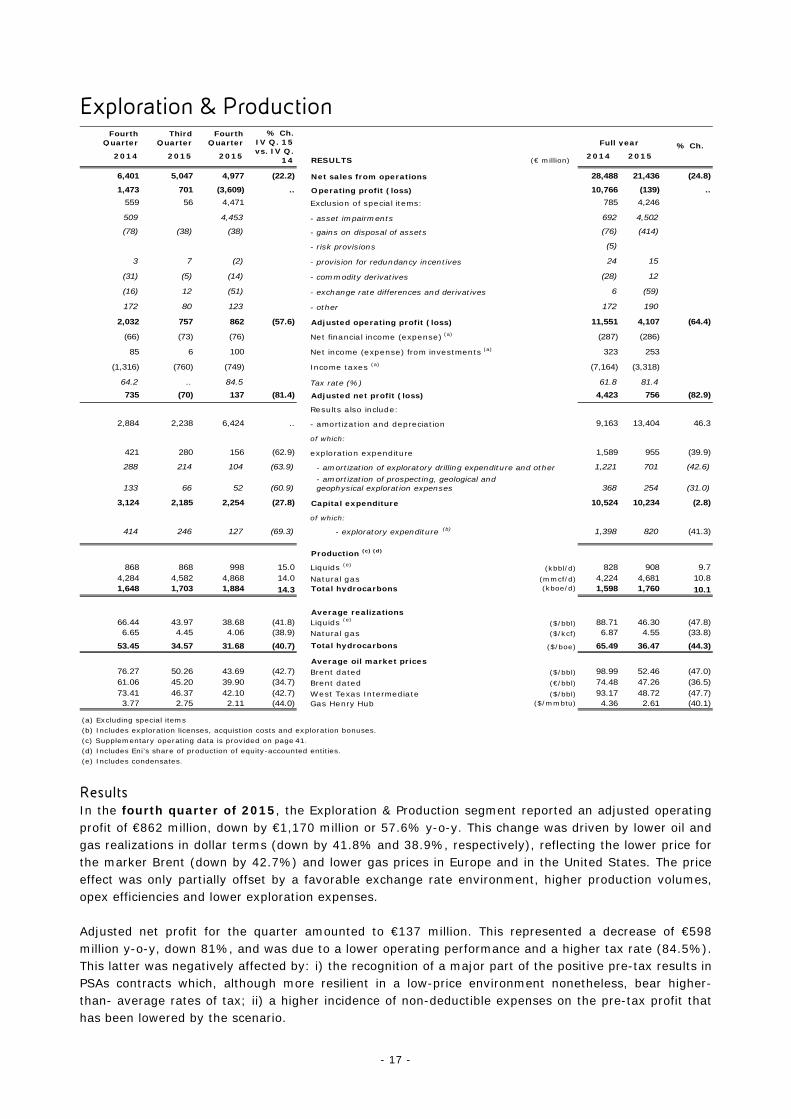
Exploration & Production Fourth
Quarter Third
Quarter Fourth
Quarter
2014 2015 2015 RESULTS (€ million) 2014 2015
6,401 5,047 4,977 (22.2) Net sales from operations 28,488 21,436 (24.8)
1,473 701 (3,609) .. Operating profit (loss) 10,766 (139) ..
559 56 4,471 Exclusion of special items: 785 4,246
509 4,453 - asset impairments 692 4,502
(78) (38) (38) - gains on disposal of assets (76) (414)
- risk provisions (5)
3 7 (2) - provision for redundancy incentives 24 15
(31) (5) (14) - commodity derivatives (28) 12
(16) 12 (51) - exchange rate differences and derivatives 6 (59)
172 80 123 - other 172 190
2,032 757 862 (57.6) Adjusted operating profit (loss) 11,551 4,107 (64.4)
(66) (73) (76) Net financial income (expense) (a) (287) (286)
85 6 100 Net income (expense) from investments (a) 323 253
(1,316) (760) (749) Income taxes (a) (7,164) (3,318)
64.2 .. 84.5 Tax rate (%) 61.8 81.4
735 (70) 137 (81.4) Adjusted net profit (loss) 4,423 756 (82.9)
Results also include:
2,884 2,238 6,424 .. - amortization and depreciation 9,163 13,404 46.3
of which:
421 280 156 (62.9) exploration expenditure 1,589 955 (39.9)
288 214 104 (63.9) - amortization of exploratory drilling expenditure and other 1,221 701 (42.6)
133 66 52 (60.9)- amortization of prospecting, geological and geophysical exploration expenses 368 254 (31.0)
3,124 2,185 2,254 (27.8) Capital expenditure 10,524 10,234 (2.8)
of which:
414 246 127 (69.3) - exploratory expenditure (b) 1,398 820 (41.3)
Production (c) (d)
868 868 998 15.0 Liquids (e) (kbbl/d) 828 908 9.74,284 4,582 4,868 14.0 Natural gas (mmcf/d) 4,224 4,681 10.81,648 1,703 1,884 14.3 Total hydrocarbons (kboe/d) 1,598 1,760 10.1
Average realizations66.44 43.97 38.68 (41.8) Liquids (e) ($/bbl) 88.71 46.30 (47.8)6.65 4.45 4.06 (38.9) Natural gas ($/kcf) 6.87 4.55 (33.8)
53.45 34.57 31.68 (40.7) Total hydrocarbons ($/boe) 65.49 36.47 (44.3)
Average oil market prices76.27 50.26 43.69 (42.7) Brent dated ($/bbl) 98.99 52.46 (47.0)61.06 45.20 39.90 (34.7) Brent dated (€/bbl) 74.48 47.26 (36.5)73.41 46.37 42.10 (42.7) West Texas Intermediate ($/bbl) 93.17 48.72 (47.7)3.77 2.75 2.11 (44.0) Gas Henry Hub ($/mmbtu) 4.36 2.61 (40.1)
(e) Includes condensates.
% Ch.IV Q. 15vs. IV Q.
14
(b) Includes exploration licenses, acquistion costs and exploration bonuses.(c) Supplementary operating data is provided on page 41.
(d) Includes Eni’s share of production of equity-accounted entities.
Full year % Ch.
(a) Excluding special items
Results In the fourth quarter of 2015, the Exploration & Production segment reported an adjusted operating profit of €862 million, down by €1,170 million or 57.6% y-o-y. This change was driven by lower oil and gas realizations in dollar terms (down by 41.8% and 38.9%, respectively), reflecting the lower price for the marker Brent (down by 42.7%) and lower gas prices in Europe and in the United States. The price effect was only partially offset by a favorable exchange rate environment, higher production volumes, opex efficiencies and lower exploration expenses. Adjusted net profit for the quarter amounted to €137 million. This represented a decrease of €598 million y-o-y, down 81%, and was due to a lower operating performance and a higher tax rate (84.5%). This latter was negatively affected by: i) the recognition of a major part of the positive pre-tax results in PSAs contracts which, although more resilient in a low-price environment nonetheless, bear higher-than- average rates of tax; ii) a higher incidence of non-deductible expenses on the pre-tax profit that has been lowered by the scenario.
- 18 -
In the FY2015, the Exploration & Production segment reported an adjusted operating profit of €4,107 million, down by €7,444 million or 64.4% y-o-y, due to the same drivers experienced in the quarter. Adjusted net profit amounted to €756 million, decreasing by €3,667 million or 82.9% from 2014, due to lower operating performance and an increased adjusted tax rate (81.4%) due to the same drivers disclosed in the quarterly results. Excluding the impact of the higher incidence on pre-tax profit of certain non-deductible expenses, because this incidence is expected to prospectively come down due to the effect of lower amortization charges going forward as a result of the impairment losses recorded in 2015 driven by the price outlook, and also restating the Group operating profit in accordance with the successful-effort-method accounting of exploration expenses, net of impaired exploration projects, the E&P tax rate has been re-determined in 70% and 60% for the FY2015 and FY2014, respectively. In the FY2015, taxes paid represent approximately the 34% of the cash flow from operating activities of the E&P segment before changes in working capital and income taxes paid, slightly lower than in 2014. For the FY2015, special charges determined a positive adjustment of €4,246 million (€4,471 million in Q4) mainly relating to: (i) impairments of oil&gas properties (€4,453 million) driven by the projections of lower hydrocarbon prices in the medium to long term which affected their recoverable amounts. The most notable impairments refer to certain assets, which were acquired by the Group following business combinations in previous reporting periods (Algeria, Congo and Turkmenistan) and to CGUs which are currently operating in high-cost areas (USA, UK, Norway and Angola); (ii) fair value of certain derivatives of financial instruments embedded in the pricing formula of long-term gas supply agreements (a charge of €12 million); and (iii) gains on disposals of non-strategic assets (€414 million), particularly in Nigeria. Operating review In Q4 2015, Eni’s hydrocarbon production was 1.884 million boe/d, 14.3% higher than in the fourth quarter of 2014 (1.760 million boe/d in FY2015; up by 10.1% from 2014). Excluding the price effects reported in Production Sharing Agreements, production increased by 11.6% (up 6.3% y-o-y). The increase was driven by new field start-ups and the continuing ramp-up of production at fields started in 2014, mainly in Angola, Venezuela, the United States and the United Kingdom, higher production in Libya and Iraq as well as the recovery of trade receivables for past investments in Iran. These positive effects were partly offset by the decline of mature fields. New field start-ups and ramp-ups of production added an estimated 198 kboe/d of new production (139 kboe/d y-o-y). The share of oil and natural gas produced outside Italy was 91% in the quarter and 90% in the full year (compared to 89% in the corresponding periods a year ago). Liquids production (998 kbbl/d) increased by 130 kbbl/d or 15% from the fourth quarter of 2014. Natural gas production for the fourth quarter of 2015 was 4,868 mmcf/d, increasing by 584 mmcf/d (up 14%) from the corresponding period a year ago. In 2015 liquids production (908 kbbl/d) increased by 80 kbbl/d or 9.7%, due to new fields start-ups and ramp-ups and higher production in Libya, Iran and Iraq. Natural gas production (4,681 mmcf/d) increased by 457 mmcf/d or 10.8% from 2014. The following start-ups were achieved over the course of the year: (i) the giant Perla gas field in the Cardon IV block (Eni’s interest 50%), located in the Gulf of Venezuela, with more than 490 mmcf/d at 100% of production at the end of the year; (ii) the Kizomba satellites Phase 2 project in the block 15 (Eni’s interest 20%), in the Angolan offshore, with recoverable reserves of 190 million barrels and a production plateau of 70 kbbl/d; (iii) the Cinguvu fields, following the first oil of Sangos started-up in 2014, within the West Hub Development project in the block 15/06 (Eni operator with a 35% interest) in Angola and a production of approximately 50 kbbl/d (18 kbbl/d net to Eni). Since January 2016, the start-up of Mpungi fields will support production ramp-up of 100 kbbl/d expected during the year; (iv) the Hadrian South field (Eni’s interest 30%), in the Gulf of Mexico flowing at approximately 16 kboe/d
- 19 -
net to Eni and the Lucius field (Eni’s interest 8.5%) with approximately 7 kboe/d net to Eni; (v) Nené and Litchendjili fields in the block Marine XII (Eni operator with a 65% interest) in Congo, West Franklin phase 2 (Eni’s interest 21.87%) in the United Kingdom and Eldfisk 2 phase 1 (Eni’s interest 12.39%) in Norway.
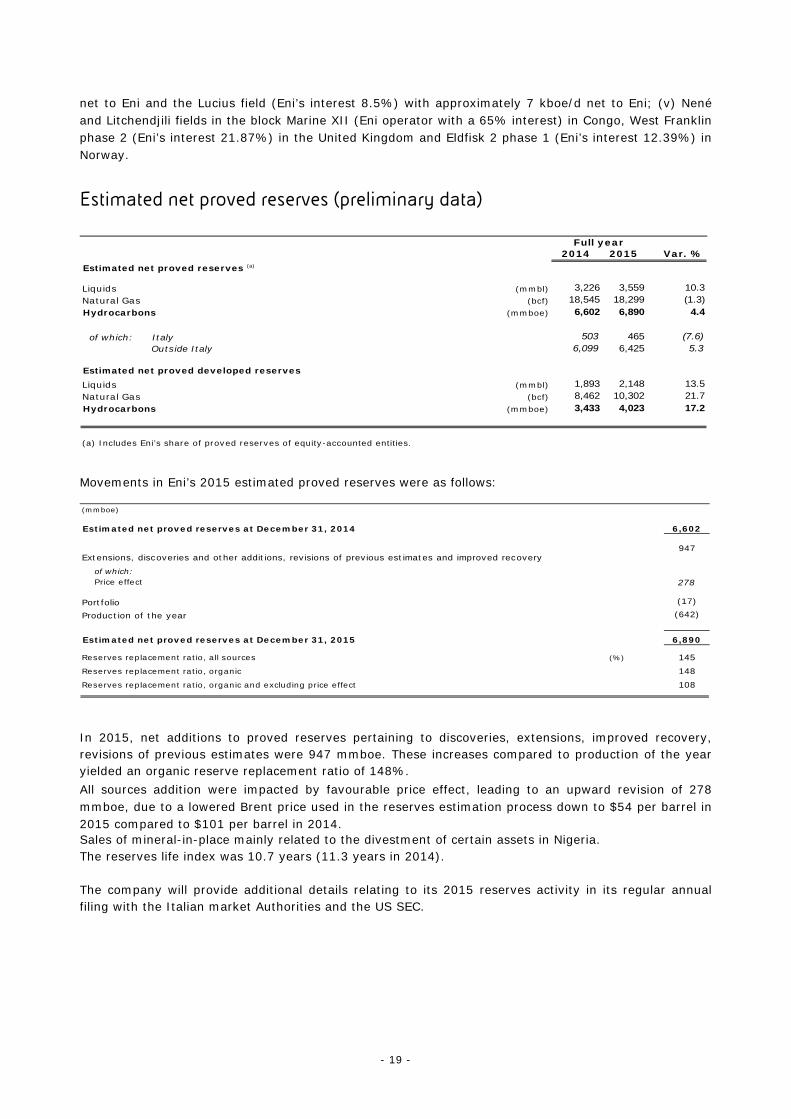
Estimated net proved reserves (preliminary data)
2014 2015 Var. %Estimated net proved reserves (a)
Liquids (mmbl) 3,226 3,559 10.3
Natural Gas (bcf) 18,545 18,299 (1.3)
Hydrocarbons (mmboe) 6,602 6,890 4.4
of which: Italy 503 465 (7.6) Outside Italy 6,099 6,425 5.3
Estimated net proved developed reservesLiquids (mmbl) 1,893 2,148 13.5
Natural Gas (bcf) 8,462 10,302 21.7
Hydrocarbons (mmboe) 3,433 4,023 17.2
Full year
(a) Includes Eni’s share of proved reserves of equity-accounted entities. Movements in Eni’s 2015 estimated proved reserves were as follows: (mmboe)
Estimated net proved reserves at December 31, 2014 6,602
947
of which:Price effect 278
Portfolio (17)
Production of the year (642)
Estimated net proved reserves at December 31, 2015 6,890
(%) 145148108
Extensions, discoveries and other additions, revisions of previous estimates and improved recovery
Reserves replacement ratio, all sources
Reserves replacement ratio, organic
Reserves replacement ratio, organic and excluding price effect
In 2015, net additions to proved reserves pertaining to discoveries, extensions, improved recovery, revisions of previous estimates were 947 mmboe. These increases compared to production of the year yielded an organic reserve replacement ratio of 148%. All sources addition were impacted by favourable price effect, leading to an upward revision of 278 mmboe, due to a lowered Brent price used in the reserves estimation process down to $54 per barrel in 2015 compared to $101 per barrel in 2014. Sales of mineral-in-place mainly related to the divestment of certain assets in Nigeria. The reserves life index was 10.7 years (11.3 years in 2014). The company will provide additional details relating to its 2015 reserves activity in its regular annual filing with the Italian market Authorities and the US SEC.
- 20 -
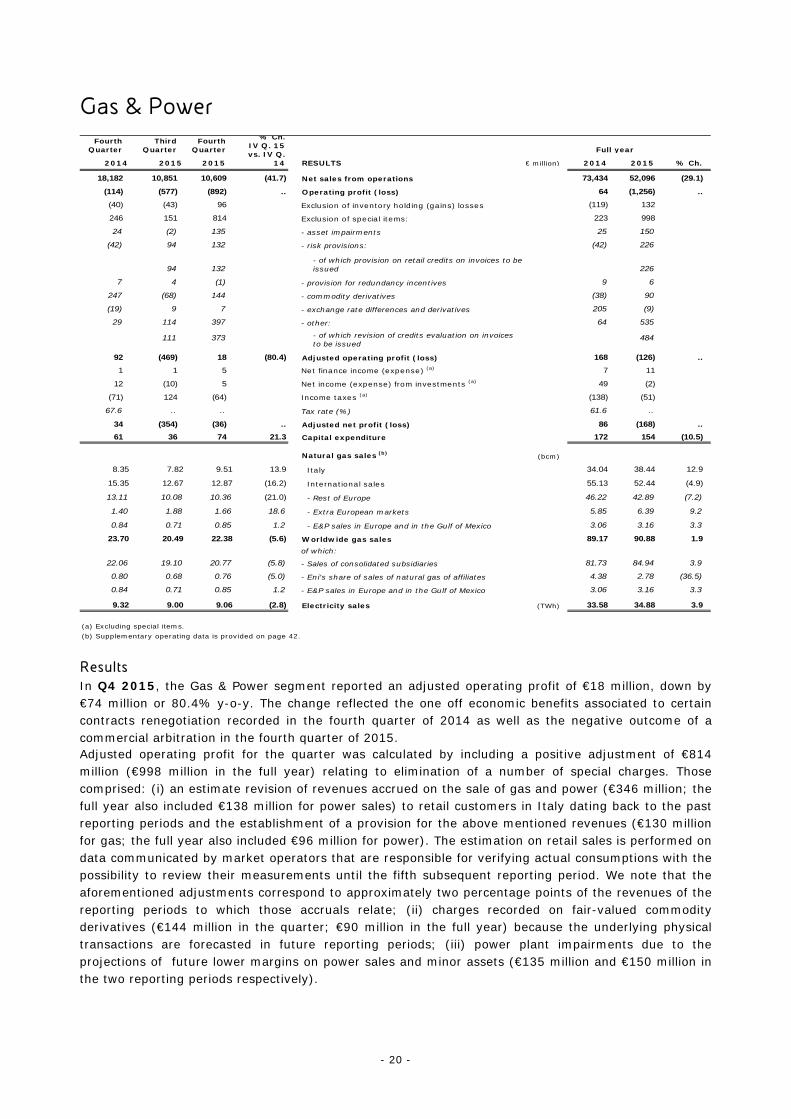
Gas & Power
Fourth Quarter
Third Quarter
Fourth Quarter
2014 2015 2015 RESULTS € million) 2014 2015 % Ch.
18,182 10,851 10,609 (41.7) Net sales from operations 73,434 52,096 (29.1)
(114) (577) (892) .. Operating profit (loss) 64 (1,256) ..
(40) (43) 96 Exclusion of inventory holding (gains) losses (119) 132
246 151 814 Exclusion of special items: 223 998
24 (2) 135 - asset impairments 25 150
(42) 94 132 - risk provisions: (42) 226
94 132- of which provision on retail credits on invoices to be issued 226
7 4 (1) - provision for redundancy incentives 9 6
247 (68) 144 - commodity derivatives (38) 90
(19) 9 7 - exchange rate differences and derivatives 205 (9)
29 114 397 - other: 64 535
111 373 - of which revision of credits evaluation on invoices to be issued
484
92 (469) 18 (80.4) Adjusted operating profit (loss) 168 (126) ..
1 1 5 Net finance income (expense) (a) 7 11
12 (10) 5 Net income (expense) from investments (a) 49 (2)
(71) 124 (64) Income taxes (a) (138) (51)
67.6 .. .. Tax rate (%) 61.6 ..
34 (354) (36) .. Adjusted net profit (loss) 86 (168) ..
61 36 74 21.3 Capital expenditure 172 154 (10.5)
Natural gas sales (b) (bcm)
8.35 7.82 9.51 13.9 Italy 34.04 38.44 12.9
15.35 12.67 12.87 (16.2) International sales 55.13 52.44 (4.9)
13.11 10.08 10.36 (21.0) - Rest of Europe 46.22 42.89 (7.2)
1.40 1.88 1.66 18.6 - Extra European markets 5.85 6.39 9.2
0.84 0.71 0.85 1.2 - E&P sales in Europe and in the Gulf of Mexico 3.06 3.16 3.3
23.70 20.49 22.38 (5.6) Worldwide gas sales 89.17 90.88 1.9
of which:
22.06 19.10 20.77 (5.8) - Sales of consolidated subsidiaries 81.73 84.94 3.9
0.80 0.68 0.76 (5.0) - Eni's share of sales of natural gas of affiliates 4.38 2.78 (36.5)
0.84 0.71 0.85 1.2 - E&P sales in Europe and in the Gulf of Mexico 3.06 3.16 3.3
9.32 9.00 9.06 (2.8) Electricity sales (TWh) 33.58 34.88 3.9
(a) Excluding special items.(b) Supplementary operating data is provided on page 42.
Full year
% Ch.IV Q. 15vs. IV Q.
14
Results In Q4 2015, the Gas & Power segment reported an adjusted operating profit of €18 million, down by €74 million or 80.4% y-o-y. The change reflected the one off economic benefits associated to certain contracts renegotiation recorded in the fourth quarter of 2014 as well as the negative outcome of a commercial arbitration in the fourth quarter of 2015. Adjusted operating profit for the quarter was calculated by including a positive adjustment of €814 million (€998 million in the full year) relating to elimination of a number of special charges. Those comprised: (i) an estimate revision of revenues accrued on the sale of gas and power (€346 million; the full year also included €138 million for power sales) to retail customers in Italy dating back to the past reporting periods and the establishment of a provision for the above mentioned revenues (€130 million for gas; the full year also included €96 million for power). The estimation on retail sales is performed on data communicated by market operators that are responsible for verifying actual consumptions with the possibility to review their measurements until the fifth subsequent reporting period. We note that the aforementioned adjustments correspond to approximately two percentage points of the revenues of the reporting periods to which those accruals relate; (ii) charges recorded on fair-valued commodity derivatives (€144 million in the quarter; €90 million in the full year) because the underlying physical transactions are forecasted in future reporting periods; (iii) power plant impairments due to the projections of future lower margins on power sales and minor assets (€135 million and €150 million in the two reporting periods respectively).
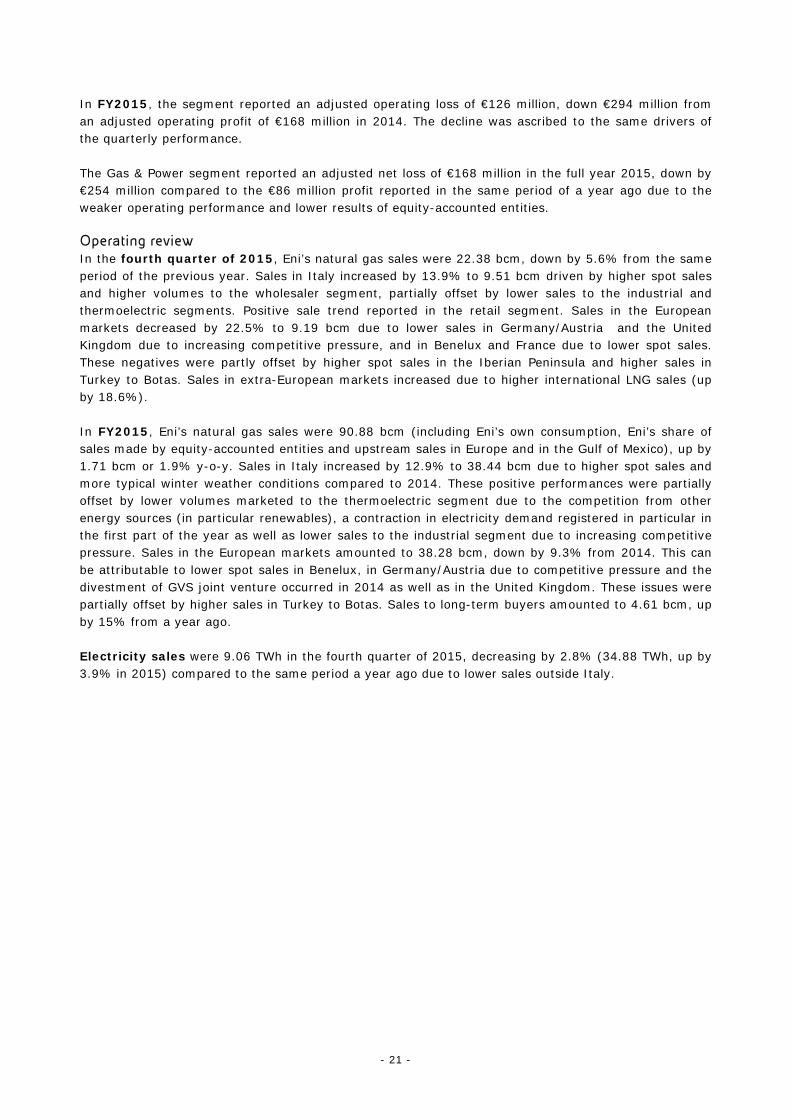
- 21 -
In FY2015, the segment reported an adjusted operating loss of €126 million, down €294 million from an adjusted operating profit of €168 million in 2014. The decline was ascribed to the same drivers of the quarterly performance. The Gas & Power segment reported an adjusted net loss of €168 million in the full year 2015, down by €254 million compared to the €86 million profit reported in the same period of a year ago due to the weaker operating performance and lower results of equity-accounted entities. Operating review In the fourth quarter of 2015, Eni’s natural gas sales were 22.38 bcm, down by 5.6% from the same period of the previous year. Sales in Italy increased by 13.9% to 9.51 bcm driven by higher spot sales and higher volumes to the wholesaler segment, partially offset by lower sales to the industrial and thermoelectric segments. Positive sale trend reported in the retail segment. Sales in the European markets decreased by 22.5% to 9.19 bcm due to lower sales in Germany/Austria and the United Kingdom due to increasing competitive pressure, and in Benelux and France due to lower spot sales. These negatives were partly offset by higher spot sales in the Iberian Peninsula and higher sales in Turkey to Botas. Sales in extra-European markets increased due to higher international LNG sales (up by 18.6%). In FY2015, Eni’s natural gas sales were 90.88 bcm (including Eni’s own consumption, Eni’s share of sales made by equity-accounted entities and upstream sales in Europe and in the Gulf of Mexico), up by 1.71 bcm or 1.9% y-o-y. Sales in Italy increased by 12.9% to 38.44 bcm due to higher spot sales and more typical winter weather conditions compared to 2014. These positive performances were partially offset by lower volumes marketed to the thermoelectric segment due to the competition from other energy sources (in particular renewables), a contraction in electricity demand registered in particular in the first part of the year as well as lower sales to the industrial segment due to increasing competitive pressure. Sales in the European markets amounted to 38.28 bcm, down by 9.3% from 2014. This can be attributable to lower spot sales in Benelux, in Germany/Austria due to competitive pressure and the divestment of GVS joint venture occurred in 2014 as well as in the United Kingdom. These issues were partially offset by higher sales in Turkey to Botas. Sales to long-term buyers amounted to 4.61 bcm, up by 15% from a year ago. Electricity sales were 9.06 TWh in the fourth quarter of 2015, decreasing by 2.8% (34.88 TWh, up by 3.9% in 2015) compared to the same period a year ago due to lower sales outside Italy.
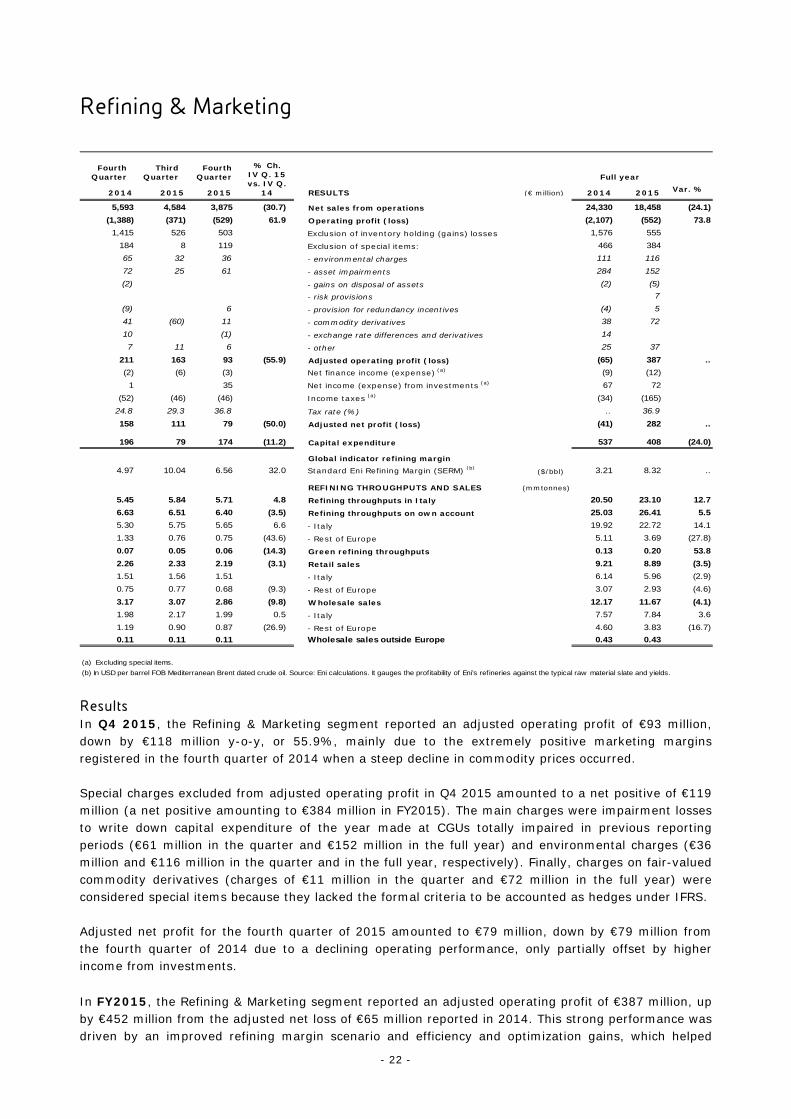
- 22 -
Refining & Marketing
Fourth Quarter
Third Quarter
Fourth Quarter
2014 2015 2015 RESULTS (€ million) 2014 2015 Var. %
5,593 4,584 3,875 (30.7) Net sales from operations 24,330 18,458 (24.1)
(1,388) (371) (529) 61.9 Operating profit (loss) (2,107) (552) 73.8
1,415 526 503 Exclusion of inventory holding (gains) losses 1,576 555
184 8 119 Exclusion of special items: 466 384
65 32 36 - environmental charges 111 116
72 25 61 - asset impairments 284 152
(2) - gains on disposal of assets (2) (5)
- risk provisions 7
(9) 6 - provision for redundancy incentives (4) 5
41 (60) 11 - commodity derivatives 38 72
10 (1) - exchange rate differences and derivatives 14
7 11 6 - other 25 37
211 163 93 (55.9) Adjusted operating profit (loss) (65) 387 ..
(2) (6) (3) Net finance income (expense) (a) (9) (12)
1 35 Net income (expense) from investments (a) 67 72
(52) (46) (46) Income taxes (a) (34) (165)
24.8 29.3 36.8 Tax rate (%) .. 36.9
158 111 79 (50.0) Adjusted net profit (loss) (41) 282 ..
196 79 174 (11.2) Capital expenditure 537 408 (24.0)
Global indicator refining margin4.97 10.04 6.56 32.0 Standard Eni Refining Margin (SERM) (b) ($/bbl) 3.21 8.32 ..
REFINING THROUGHPUTS AND SALES (mmtonnes)
5.45 5.84 5.71 4.8 Refining throughputs in Italy 20.50 23.10 12.7
6.63 6.51 6.40 (3.5) Refining throughputs on own account 25.03 26.41 5.5
5.30 5.75 5.65 6.6 - Italy 19.92 22.72 14.1
1.33 0.76 0.75 (43.6) - Rest of Europe 5.11 3.69 (27.8)
0.07 0.05 0.06 (14.3) Green refining throughputs 0.13 0.20 53.8
2.26 2.33 2.19 (3.1) Retail sales 9.21 8.89 (3.5)
1.51 1.56 1.51 - Italy 6.14 5.96 (2.9)
0.75 0.77 0.68 (9.3) - Rest of Europe 3.07 2.93 (4.6)
3.17 3.07 2.86 (9.8) Wholesale sales 12.17 11.67 (4.1)
1.98 2.17 1.99 0.5 - Italy 7.57 7.84 3.6
1.19 0.90 0.87 (26.9) - Rest of Europe 4.60 3.83 (16.7)
0.11 0.11 0.11 Wholesale sales outside Europe 0.43 0.43
(a) Excluding special items.
(b) In USD per barrel FOB Mediterranean Brent dated crude oil. Source: Eni calculations. It gauges the profitability of Eni’s refineries against the typical raw material slate and yields.
Full year% Ch.
IV Q. 15vs. IV Q.
14
Results In Q4 2015, the Refining & Marketing segment reported an adjusted operating profit of €93 million, down by €118 million y-o-y, or 55.9%, mainly due to the extremely positive marketing margins registered in the fourth quarter of 2014 when a steep decline in commodity prices occurred. Special charges excluded from adjusted operating profit in Q4 2015 amounted to a net positive of €119 million (a net positive amounting to €384 million in FY2015). The main charges were impairment losses to write down capital expenditure of the year made at CGUs totally impaired in previous reporting periods (€61 million in the quarter and €152 million in the full year) and environmental charges (€36 million and €116 million in the quarter and in the full year, respectively). Finally, charges on fair-valued commodity derivatives (charges of €11 million in the quarter and €72 million in the full year) were considered special items because they lacked the formal criteria to be accounted as hedges under IFRS. Adjusted net profit for the fourth quarter of 2015 amounted to €79 million, down by €79 million from the fourth quarter of 2014 due to a declining operating performance, only partially offset by higher income from investments. In FY2015, the Refining & Marketing segment reported an adjusted operating profit of €387 million, up by €452 million from the adjusted net loss of €65 million reported in 2014. This strong performance was driven by an improved refining margin scenario and efficiency and optimization gains, which helped
- 23 -
lower margin to around $5 per barrel, anticipating the EBIT break-even of the refining business to 2015 versus an original guidance for the year 2017 indicated in the 2015-2018 strategic plan. Operating review In the fourth quarter of 2015, the Standard Eni Refining Margin (SERM) increased its value by 32% to 6.6 $/bl y-o-y (the margin more than doubled on yearly basis). This trend reflected lower marker Brent prices and the relative strength in gasoline prices compared to the feedstock cost. In this context, Eni’s refining throughputs for the fourth quarter of 2015 were 6.40 mmtonnes (26.41 mmtonnes in 2015). On a homogeneous basis when excluding the impact of the disposal of the refining capacity in Czech Republic and the reconversion shutdown at Gela refinery, Eni’s refining throughputs increased by 5.7% (up by 15%, in 2015). Volumes processed in Italy increased by 6.4% and 16.4% in both the reporting periods reflecting a favorable trading environment. The volumes of vegetable oil for the production of biofuels at Venice green refinery reported an increase from 2014 (year of the operations start-up). Retail sales in Italy were 1.51 mmtonnes in the fourth quarter of 2015 (5.96 mmtonnes in 2015) were barely unchanged from the corresponding period of 2014. In 2015, retail sales in Italy decreased 2.9%, mainly in the motorway network and in lease concessions. In the fourth quarter of 2015, Eni’s market share amounted to 24.5%. On a yearly basis, the market share of 24.5% decreased by 1 percentage point. Wholesale sales in Italy (1.99 mmtonnes and 7.84 mmtonnes in the fourth quarter and the full year 2015, respectively) were nearly unchanged in the quarter (up by 3.5% in the full year 2015), mainly due to higher sales of gasoil and almost completely offset by lower volumes of bunkering and fuel oil. Market share in the fourth quarter of 2015 was 26.8%. On a yearly basis, market share was 27.5%. Retail sales in the rest of Europe were 0.68 mmtonnes in the fourth quarter of 2015 (2.93 mmtonnes in the full year 2015), decreasing by 9.3% y-o-y (down by 4.6% on a yearly basis) due to the assets disposal in Czech Republic, Slovakia and Romania, only partly offset by higher sales in Switzerland, Austria and Germany.
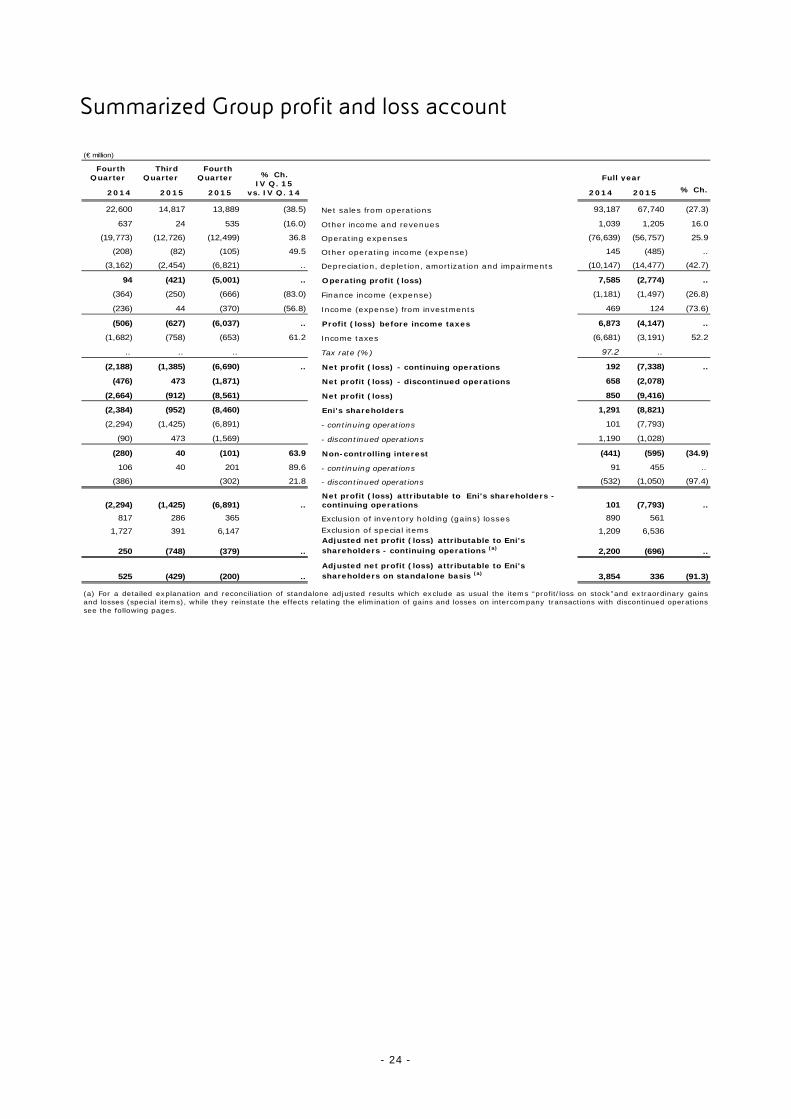
- 24 -
Summarized Group profit and loss account
(€ million)
Fourth Quarter
Third Quarter
Fourth Quarter
2014 2015 2015 2014 2015 % Ch.
22,600 14,817 13,889 (38.5) Net sales from operations 93,187 67,740 (27.3)
637 24 535 (16.0) Other income and revenues 1,039 1,205 16.0
(19,773) (12,726) (12,499) 36.8 Operating expenses (76,639) (56,757) 25.9
(208) (82) (105) 49.5 Other operating income (expense) 145 (485) ..
(3,162) (2,454) (6,821) .. Depreciation, depletion, amortization and impairments (10,147) (14,477) (42.7)
94 (421) (5,001) .. Operating profit (loss) 7,585 (2,774) ..
(364) (250) (666) (83.0) Finance income (expense) (1,181) (1,497) (26.8)
(236) 44 (370) (56.8) Income (expense) from investments 469 124 (73.6)
(506) (627) (6,037) .. Profit (loss) before income taxes 6,873 (4,147) ..
(1,682) (758) (653) 61.2 Income taxes (6,681) (3,191) 52.2
.. .. .. Tax rate (%) 97.2 ..
(2,188) (1,385) (6,690) .. Net profit (loss) - continuing operations 192 (7,338) ..
(476) 473 (1,871) Net profit (loss) - discontinued operations 658 (2,078)
(2,664) (912) (8,561) Net profit (loss) 850 (9,416)
(2,384) (952) (8,460) Eni's shareholders 1,291 (8,821)
(2,294) (1,425) (6,891) - continuing operations 101 (7,793)
(90) 473 (1,569) - discontinued operations 1,190 (1,028)
(280) 40 (101) 63.9 Non-controlling interest (441) (595) (34.9)
106 40 201 89.6 - continuing operations 91 455 ..
(386) (302) 21.8 - discontinued operations (532) (1,050) (97.4)
(2,294) (1,425) (6,891) ..Net profit (loss) attributable to Eni's shareholders - continuing operations 101 (7,793) ..
817 286 365 Exclusion of inventory holding (gains) losses 890 561
1,727 391 6,147 Exclusion of special items 1,209 6,536
250 (748) (379) ..
Adjusted net profit (loss) attributable to Eni's shareholders - continuing operations (a) 2,200 (696) ..
525 (429) (200) ..Adjusted net profit (loss) attributable to Eni's shareholders on standalone basis (a) 3,854 336 (91.3)
Full year% Ch.IV Q. 15
vs. IV Q. 14
(a) For a detailed explanation and reconciliation of standalone adjusted results which exclude as usual the items “profit/loss on stock”and extraordinary gainsand losses (special items), while they reinstate the effects relating the elimination of gains and losses on intercompany transactions with discontinued operationssee the following pages.
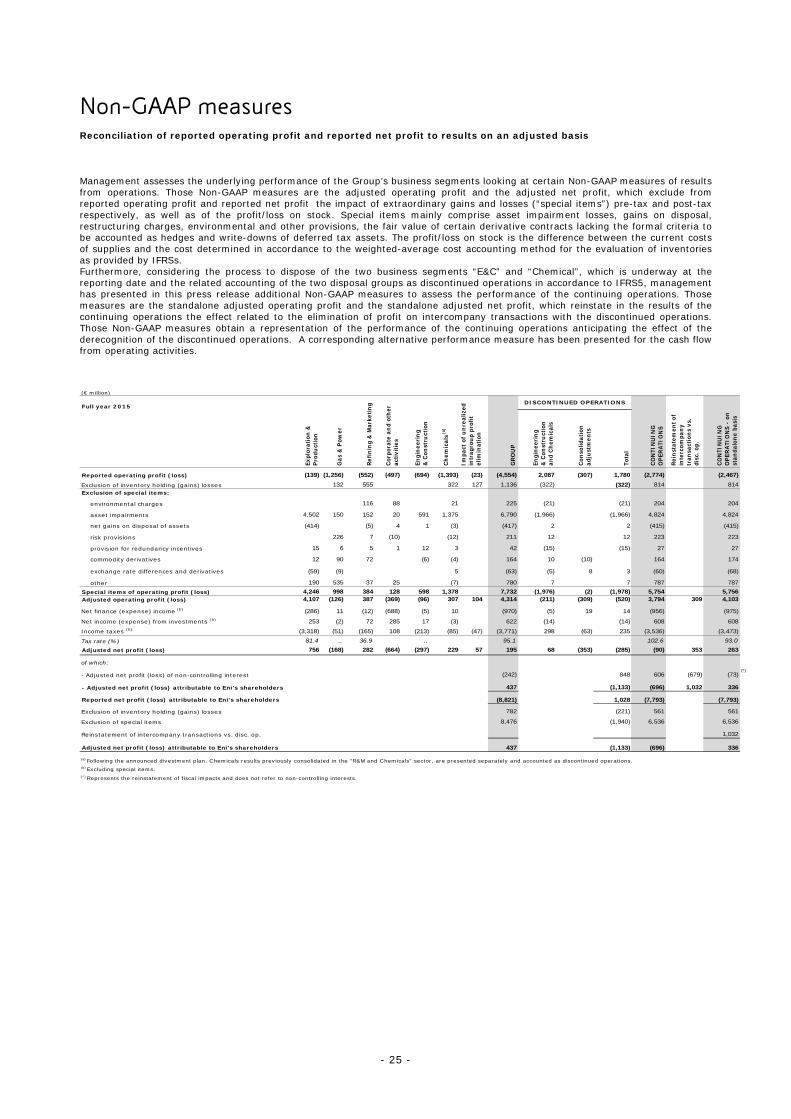
- 25 -
Non-GAAP measures Reconciliation of reported operating profit and reported net profit to results on an adjusted basis Management assesses the underlying performance of the Group’s business segments looking at certain Non-GAAP measures of results from operations. Those Non-GAAP measures are the adjusted operating profit and the adjusted net profit, which exclude from reported operating profit and reported net profit the impact of extraordinary gains and losses (“special items”) pre-tax and post-tax respectively, as well as of the profit/loss on stock. Special items mainly comprise asset impairment losses, gains on disposal, restructuring charges, environmental and other provisions, the fair value of certain derivative contracts lacking the formal criteria to be accounted as hedges and write-downs of deferred tax assets. The profit/loss on stock is the difference between the current costs of supplies and the cost determined in accordance to the weighted-average cost accounting method for the evaluation of inventories as provided by IFRSs. Furthermore, considering the process to dispose of the two business segments “E&C” and “Chemical”, which is underway at the reporting date and the related accounting of the two disposal groups as discontinued operations in accordance to IFRS5, management has presented in this press release additional Non-GAAP measures to assess the performance of the continuing operations. Those measures are the standalone adjusted operating profit and the standalone adjusted net profit, which reinstate in the results of the continuing operations the effect related to the elimination of profit on intercompany transactions with the discontinued operations. Those Non-GAAP measures obtain a representation of the performance of the continuing operations anticipating the effect of the derecognition of the discontinued operations. A corresponding alternative performance measure has been presented for the cash flow from operating activities. (€ million)
Full year 2015
Reported operating profit (loss) (139) (1,256) (552) (497) (694) (1,393) (23) (4,554) 2,087 (307) 1,780 (2,774) (2,467)
Exclusion of inventory holding (gains) losses 132 555 322 127 1,136 (322) (322) 814 814
Exclusion of special items:
environmental charges 116 88 21 225 (21) (21) 204 204
asset impairments 4,502 150 152 20 591 1,375 6,790 (1,966) (1,966) 4,824 4,824
net gains on disposal of assets (414) (5) 4 1 (3) (417) 2 2 (415) (415)
risk provisions 226 7 (10) (12) 211 12 12 223 223
provision for redundancy incentives 15 6 5 1 12 3 42 (15) (15) 27 27
commodity derivatives 12 90 72 (6) (4) 164 10 (10) 164 174
exchange rate differences and derivatives (59) (9) 5 (63) (5) 8 3 (60) (68)
other 190 535 37 25 (7) 780 7 7 787 787
Special items of operating profit (loss) 4,246 998 384 128 598 1,378 7,732 (1,976) (2) (1,978) 5,754 5,756Adjusted operating profit (loss) 4,107 (126) 387 (369) (96) 307 104 4,314 (211) (309) (520) 3,794 309 4,103
Net finance (expense) income (b) (286) 11 (12) (688) (5) 10 (970) (5) 19 14 (956) (19) (975)
Net income (expense) from investments (b) 253 (2) 72 285 17 (3) 622 (14) (14) 608 608
Income taxes (b) (3,318) (51) (165) 108 (213) (85) (47) (3,771) 298 (63) 235 (3,536) 63 (3,473)
Tax rate (%) 81.4 .. 36.9 .. 95.1 102.6 93.0
Adjusted net profit (loss) 756 (168) 282 (664) (297) 229 57 195 68 (353) (285) (90) 353 263
of which:
- Adjusted net profit (loss) of non-controlling interest (242) 848 606 (679) (73)(*)
- Adjusted net profit (loss) attributable to Eni's shareholders 437 (1,133) (696) 1,032 336
Reported net profit (loss) attributable to Eni's shareholders (8,821) 1,028 (7,793) (7,793)
Exclusion of inventory holding (gains) losses 782 (221) 561 561
Exclusion of special items 8,476 (1,940) 6,536 6,536
Reinstatement of intercompany transactions vs. disc. op. 1,032
Adjusted net profit (loss) attributable to Eni's shareholders 437 (1,133) (696) 336
(a) Following the announced divestment plan, Chemicals results previously consolidated in the "R&M and Chemicals" sector, are presented separately and accounted as discontinued operations.(b) Excluding special items.(*) Represents the reinstatement of fiscal impacts and does not refer to non-controlling interests.
GRO
UP
Corp
orat
e an
d ot
her
activ
ities
Impa
ct o
f unr
ealiz
edin
trag
roup
pro
fitel
imin
atio
n
Expl
orat
ion
&
Prod
uctio
n
Gas
& P
ower
Refin
ing
& M
arke
ting
Engi
neer
ing
& C
onst
ruct
ion
Chem
ical
s (a)
CON
TIN
UIN
G
OPE
RATI
ON
S -
on
stan
dalo
ne b
asis
Rein
stat
emen
t of
inte
rcom
pany
tr
ansa
ctio
ns v
s.
disc
. op.
DISCONTINUED OPERATIONS
CON
TIN
UIN
G
OPE
RATI
ON
S
Engi
neer
ing
& C
onst
ruct
ion
and
Chem
ical
s
Cons
olid
atio
n ad
just
men
ts
Tota
l
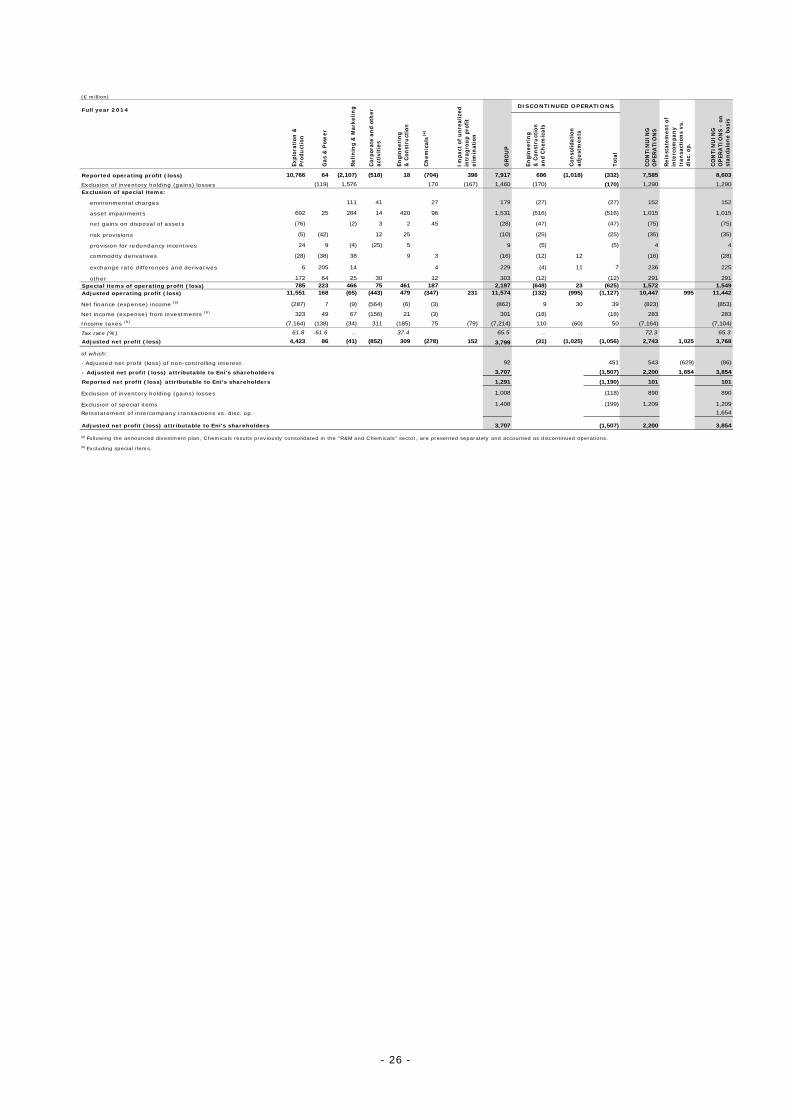
- 26 -
(€ million)
Full year 2014
Reported operating profit (loss) 10,766 64 (2,107) (518) 18 (704) 398 7,917 686 (1,018) (332) 7,585 8,603
Exclusion of inventory holding (gains) losses (119) 1,576 170 (167) 1,460 (170) (170) 1,290 1,290
Exclusion of special items:
environmental charges 111 41 27 179 (27) (27) 152 152
asset impairments 692 25 284 14 420 96 1,531 (516) (516) 1,015 1,015
net gains on disposal of assets (76) (2) 3 2 45 (28) (47) (47) (75) (75)
risk provisions (5) (42) 12 25 (10) (25) (25) (35) (35)
provision for redundancy incentives 24 9 (4) (25) 5 9 (5) (5) 4 4
commodity derivatives (28) (38) 38 9 3 (16) (12) 12 (16) (28)
exchange rate differences and derivatives 6 205 14 4 229 (4) 11 7 236 225
other 172 64 25 30 12 303 (12) (12) 291 291
Special items of operating profit (loss) 785 223 466 75 461 187 2,197 (648) 23 (625) 1,572 1,549Adjusted operating profit (loss) 11,551 168 (65) (443) 479 (347) 231 11,574 (132) (995) (1,127) 10,447 995 11,442
Net finance (expense) income (b) (287) 7 (9) (564) (6) (3) (862) 9 30 39 (823) (30) (853)
Net income (expense) from investments (b) 323 49 67 (156) 21 (3) 301 (18) (18) 283 283
Income taxes (b) (7,164) (138) (34) 311 (185) 75 (79) (7,214) 110 (60) 50 (7,164) 60 (7,104)
Tax rate (%) 61.8 61.6 .. 37.4 65.5 .. .. 72.3 65.3
Adjusted net profit (loss) 4,423 86 (41) (852) 309 (278) 152 3,799 (31) (1,025) (1,056) 2,743 1,025 3,768
of which:
- Adjusted net profit (loss) of non-controlling interest 92 451 543 (629) (86)
- Adjusted net profit (loss) attributable to Eni's shareholders 3,707 (1,507) 2,200 1,654 3,854
Reported net profit (loss) attributable to Eni's shareholders 1,291 (1,190) 101 101
Exclusion of inventory holding (gains) losses 1,008 (118) 890 890
Exclusion of special items 1,408 (199) 1,209 1,209
Reinstatement of intercompany transactions vs. disc. op. 1,654
Adjusted net profit (loss) attributable to Eni's shareholders 3,707 (1,507) 2,200 3,854
(a) Following the announced divestment plan, Chemicals results previously consolidated in the "R&M and Chemicals" sector, are presented separately and accounted as discontinued operations.
(b) Excluding special items.
GRO
UP
Expl
orat
ion
&
Prod
uctio
n
Gas
& P
ower
Refin
ing
& M
arke
ting
Engi
neer
ing
& C
onst
ruct
ion
Impa
ct o
f unr
ealiz
edin
trag
roup
pro
fitel
imin
atio
n
Corp
orat
e an
d ot
her
activ
ities
Chem
ical
s (a)
CON
TIN
UIN
G
OPE
RATI
ON
S -
on
stan
dalo
ne b
asis
Rein
stat
emen
t of
inte
rcom
pany
tr
ansa
ctio
ns v
s.
disc
. op.
DISCONTINUED OPERATIONS
CON
TIN
UIN
G
OPE
RATI
ON
S
Engi
neer
ing
& C
onst
ruct
ion
and
Chem
ical
s
Cons
olid
atio
n ad
just
men
ts
Tota
l

- 27 -
(€ million)
Fourth Quarter 2015
Reported operating profit (loss) (3,609) (892) (529) (149) (59) (1,379) 57 (6,560) 1,438 121 1,559 (5,001) (5,122)
Exclusion of inventory holding (gains) losses 96 503 64 (72) 591 (64) (64) 527 527
Exclusion of special items:
environmental charges 36 24 (11) 49 11 11 60 60
asset impairments 4,453 135 61 10 380 1,371 6,410 (1,751) (1,751) 4,659 4,659
net gains on disposal of assets (38) 6 (32) (32) (32)
risk provisions 132 (1) 2 133 (2) (2) 131 131
provision for redundancy incentives (2) (1) 6 1 8 1 13 (9) (9) 4 4
commodity derivatives (14) 144 11 141 141 141
exchange rate differences and derivatives (51) 7 (1) (5) (50) 5 1 6 (44) (45)
other 123 397 6 8 7 (3) 538 (4) (4) 534 534
Special items of operating profit (loss) 4,471 814 119 48 395 1,355 7,202 (1,750) 1 (1,749) 5,453 5,452
Adjusted operating profit (loss) 862 18 93 (101) 336 40 (15) 1,233 (376) 122 (254) 979 (122) 857
Net finance (expense) income (b) (76) 5 (3) (242) (1) 2 (315) (1) 1 (315) (1) (316)
Net income (expense) from investments (b) 100 5 35 (6) 37 (4) 167 (33) (33) 134 134
Income taxes (b) (749) (64) (46) (11) (137) (32) (15) (1,054) 169 (16) 153 (901) 16 (885)
Tax rate (%) 84.5 .. 36.8 36.8 97.1 .. ..
Adjusted net profit (loss) 137 (36) 79 (360) 235 6 (30) 31 (241) 107 (134) (103) (107) (210)
of which:
- Adjusted net profit (loss) of non-controlling interest 124 152 276 (286) (10)
- Adjusted net profit (loss) attributable to Eni's shareholders (93) (286) (379) 179 (200)
Reported net profit (loss) attributable to Eni's shareholders (8,460) 1,569 (6,891) (6,891)
Exclusion of inventory holding (gains) losses 409 (44) 365 365
Exclusion of special items 7,958 (1,811) 6,147 6,147
Reinstatement of intercompany transactions vs. disc. op. 179
Adjusted net profit (loss) attributable to Eni's shareholders (93) (286) (379) (200)
(a) Following the announced divestment plan, Chemicals results previously consolidated in the "R&M and Chemicals" sector, are presented separately and accounted as discontinued operations.
(b) Excluding special items.
Corp
orat
e an
d ot
her
activ
ities
Engi
neer
ing
& C
onst
ruct
ion
Expl
orat
ion
&
Prod
uctio
n
Gas
& P
ower
Refin
ing
& M
arke
ting
Impa
ct o
f unr
ealiz
edin
trag
roup
pro
fitel
imin
atio
n
Chem
ical
s (a)
CON
TIN
UIN
G
OPE
RATI
ON
S -
on
stan
dalo
ne b
asis
Rein
stat
emen
t of
inte
rcom
pany
tr
ansa
ctio
ns v
s.
disc
. op.
GRO
UP
DISCONTINUED OPERATIONS
CON
TIN
UIN
G
OPE
RATI
ON
S
Engi
neer
ing
& C
onst
ruct
ion
and
Chem
ical
s
Cons
olid
atio
n ad
just
men
ts
Tota
l
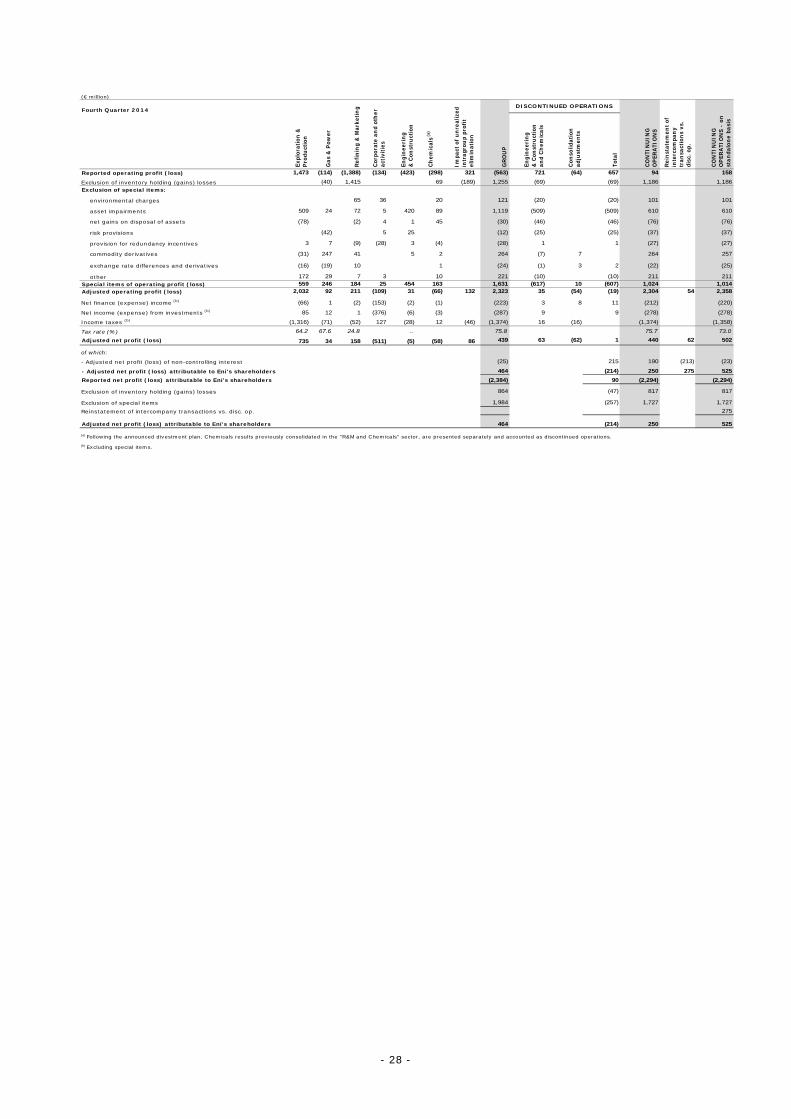
- 28 -
(€ million)
Fourth Quarter 2014
Reported operating profit (loss) 1,473 (114) (1,388) (134) (423) (298) 321 (563) 721 (64) 657 94 158
Exclusion of inventory holding (gains) losses (40) 1,415 69 (189) 1,255 (69) (69) 1,186 1,186
Exclusion of special items:
environmental charges 65 36 20 121 (20) (20) 101 101
asset impairments 509 24 72 5 420 89 1,119 (509) (509) 610 610
net gains on disposal of assets (78) (2) 4 1 45 (30) (46) (46) (76) (76)
risk provisions (42) 5 25 (12) (25) (25) (37) (37)
provision for redundancy incentives 3 7 (9) (28) 3 (4) (28) 1 1 (27) (27)
commodity derivatives (31) 247 41 5 2 264 (7) 7 264 257
exchange rate differences and derivatives (16) (19) 10 1 (24) (1) 3 2 (22) (25)
other 172 29 7 3 10 221 (10) (10) 211 211
Special items of operating profit (loss) 559 246 184 25 454 163 1,631 (617) 10 (607) 1,024 1,014Adjusted operating profit (loss) 2,032 92 211 (109) 31 (66) 132 2,323 35 (54) (19) 2,304 54 2,358
Net finance (expense) income (b) (66) 1 (2) (153) (2) (1) (223) 3 8 11 (212) (8) (220)
Net income (expense) from investments (b) 85 12 1 (376) (6) (3) (287) 9 9 (278) (278)
Income taxes (b) (1,316) (71) (52) 127 (28) 12 (46) (1,374) 16 (16) (1,374) 16 (1,358)
Tax rate (%) 64.2 67.6 24.8 .. 75.8 75.7 73.0
Adjusted net profit (loss) 735 34 158 (511) (5) (58) 86 439 63 (62) 1 440 62 502
of which:
- Adjusted net profit (loss) of non-controlling interest (25) 215 190 (213) (23)
- Adjusted net profit (loss) attributable to Eni's shareholders 464 (214) 250 275 525
Reported net profit (loss) attributable to Eni's shareholders (2,384) 90 (2,294) (2,294)
Exclusion of inventory holding (gains) losses 864 (47) 817 817
Exclusion of special items 1,984 (257) 1,727 1,727
Reinstatement of intercompany transactions vs. disc. op. 275
Adjusted net profit (loss) attributable to Eni's shareholders 464 (214) 250 525
(a) Following the announced divestment plan, Chemicals results previously consolidated in the "R&M and Chemicals" sector, are presented separately and accounted as discontinued operations.
(b) Excluding special items.
GRO
UP
Expl
orat
ion
&
Prod
uctio
n
Gas
& P
ower
Refin
ing
& M
arke
ting
Corp
orat
e an
d ot
her
activ
ities
Engi
neer
ing
& C
onst
ruct
ion
Impa
ct o
f unr
ealiz
edin
trag
roup
pro
fitel
imin
atio
n
Chem
ical
s (a)
CON
TIN
UIN
G
OPE
RATI
ON
S -
on
stan
dalo
ne b
asis
Rein
stat
emen
t of
inte
rcom
pany
tr
ansa
ctio
ns v
s.
disc
. op.
DISCONTINUED OPERATIONS
CON
TIN
UIN
G
OPE
RATI
ON
S
Engi
neer
ing
& C
onst
ruct
ion
and
Chem
ical
s
Cons
olid
atio
n ad
just
men
ts
Tota
l
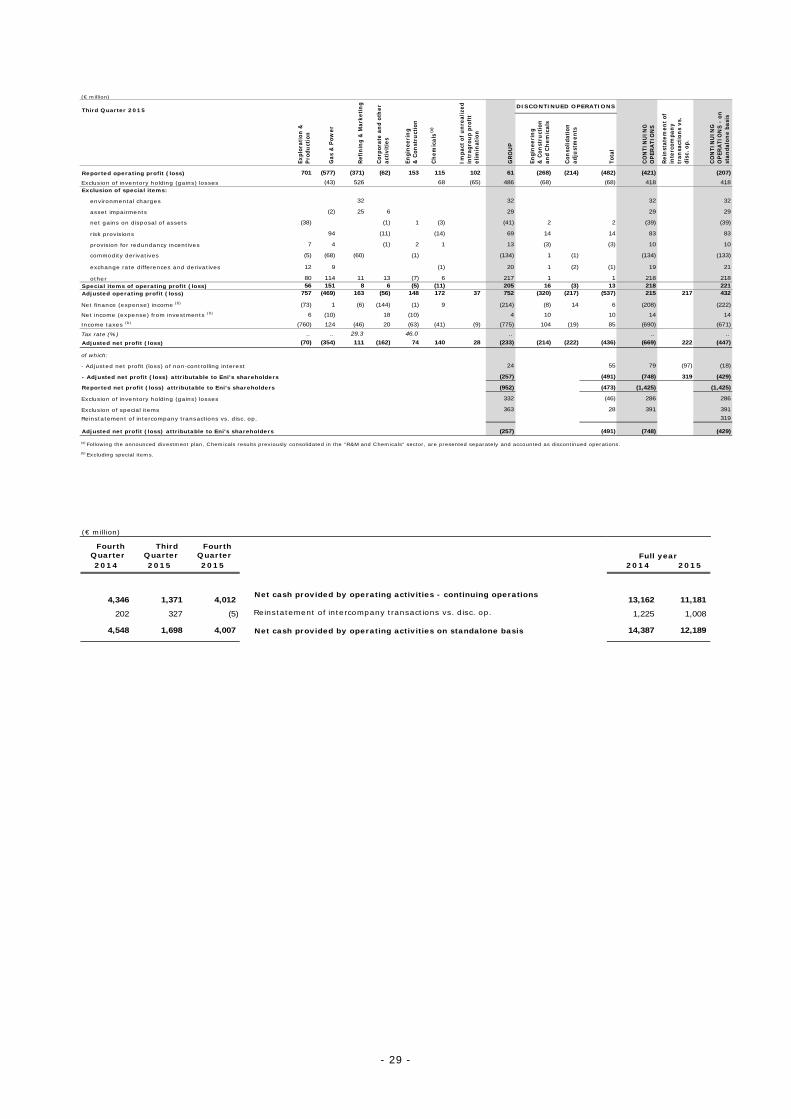
- 29 -
(€ million)
Third Quarter 2015
Reported operating profit (loss) 701 (577) (371) (62) 153 115 102 61 (268) (214) (482) (421) (207)
Exclusion of inventory holding (gains) losses (43) 526 68 (65) 486 (68) (68) 418 418
Exclusion of special items:
environmental charges 32 32 32 32
asset impairments (2) 25 6 29 29 29
net gains on disposal of assets (38) (1) 1 (3) (41) 2 2 (39) (39)
risk provisions 94 (11) (14) 69 14 14 83 83
provision for redundancy incentives 7 4 (1) 2 1 13 (3) (3) 10 10
commodity derivatives (5) (68) (60) (1) (134) 1 (1) (134) (133)
exchange rate differences and derivatives 12 9 (1) 20 1 (2) (1) 19 21
other 80 114 11 13 (7) 6 217 1 1 218 218
Special items of operating profit (loss) 56 151 8 6 (5) (11) 205 16 (3) 13 218 221Adjusted operating profit (loss) 757 (469) 163 (56) 148 172 37 752 (320) (217) (537) 215 217 432
Net finance (expense) income (b) (73) 1 (6) (144) (1) 9 (214) (8) 14 6 (208) (14) (222)
Net income (expense) from investments (b) 6 (10) 18 (10) 4 10 10 14 14
Income taxes (b) (760) 124 (46) 20 (63) (41) (9) (775) 104 (19) 85 (690) 19 (671)
Tax rate (%) .. .. 29.3 46.0 .. .. ..
Adjusted net profit (loss) (70) (354) 111 (162) 74 140 28 (233) (214) (222) (436) (669) 222 (447)
of which:
- Adjusted net profit (loss) of non-controlling interest 24 55 79 (97) (18)
- Adjusted net profit (loss) attributable to Eni's shareholders (257) (491) (748) 319 (429)
Reported net profit (loss) attributable to Eni's shareholders (952) (473) (1,425) (1,425)
Exclusion of inventory holding (gains) losses 332 (46) 286 286
Exclusion of special items 363 28 391 391
Reinstatement of intercompany transactions vs. disc. op. 319
Adjusted net profit (loss) attributable to Eni's shareholders (257) (491) (748) (429)
(a) Following the announced divestment plan, Chemicals results previously consolidated in the "R&M and Chemicals" sector, are presented separately and accounted as discontinued operations.
(b) Excluding special items.
Expl
orat
ion
&
Prod
uctio
n
Gas
& P
ower
Refin
ing
& M
arke
ting
Corp
orat
e an
d ot
her
activ
ities
Engi
neer
ing
& C
onst
ruct
ion
Impa
ct o
f unr
ealiz
edin
trag
roup
pro
fitel
imin
atio
n
Chem
ical
s (a)
CON
TIN
UIN
G
OPE
RATI
ON
S -
on
stan
dalo
ne b
asis
Rein
stat
emen
t of
inte
rcom
pany
tr
ansa
ctio
ns v
s.
disc
. op.
GRO
UP
DISCONTINUED OPERATIONS
CON
TIN
UIN
G
OPE
RATI
ON
S
Engi
neer
ing
& C
onst
ruct
ion
and
Chem
ical
s
Cons
olid
atio
n ad
just
men
ts
Tota
l
(€ million)
Fourth Quarter
Third Quarter
Fourth Quarter
2014 2015 2015 2014 2015
4,346 1,371 4,012Net cash provided by operating activities - continuing operations
13,162 11,181
202 327 (5) Reinstatement of intercompany transactions vs. disc. op. 1,225 1,008
4,548 1,698 4,007 Net cash provided by operating activities on standalone basis 14,387 12,189
Full year
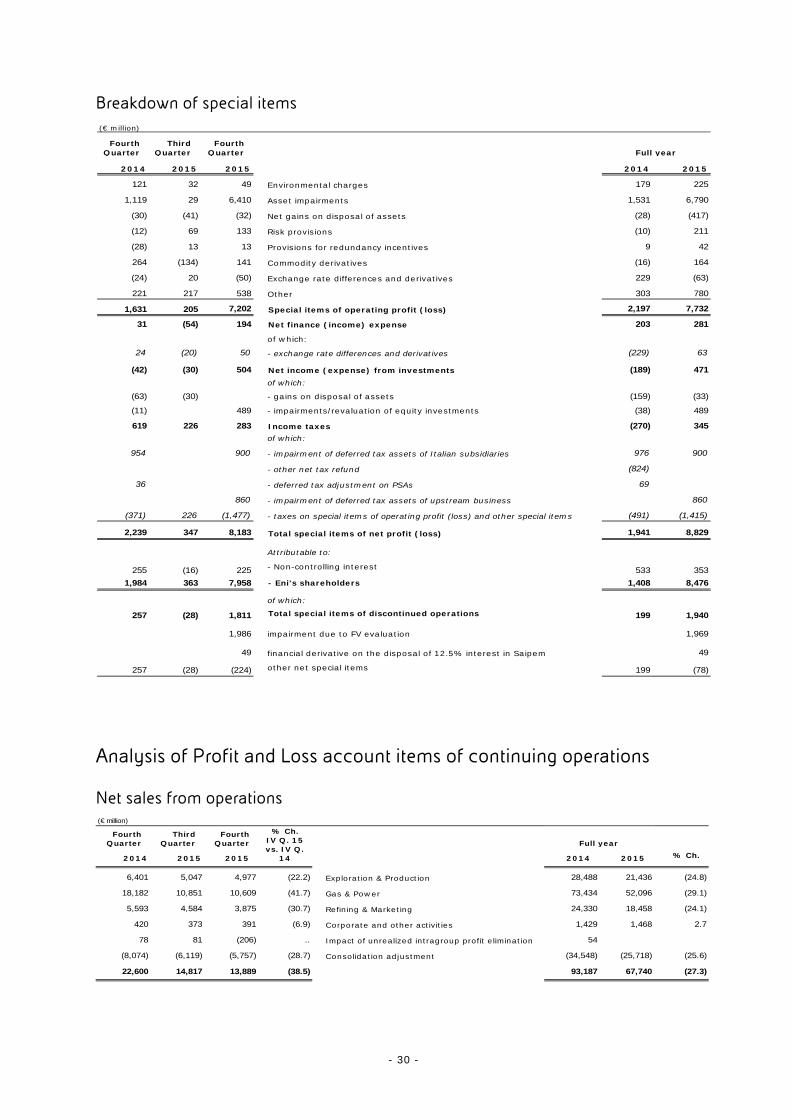
- 30 -
Breakdown of special items (€ million)
Fourth Quarter
Third Quarter
Fourth Quarter
2014 2015 2015 2014 2015
121 32 49 Environmental charges 179 225
1,119 29 6,410 Asset impairments 1,531 6,790
(30) (41) (32) Net gains on disposal of assets (28) (417)
(12) 69 133 Risk provisions (10) 211
(28) 13 13 Provisions for redundancy incentives 9 42
264 (134) 141 Commodity derivatives (16) 164
(24) 20 (50) Exchange rate differences and derivatives 229 (63)
221 217 538 Other 303 780
1,631 205 7,202 Special items of operating profit (loss) 2,197 7,732
31 (54) 194 Net finance (income) expense 203 281
of which:
24 (20) 50 - exchange rate differences and derivatives (229) 63
(42) (30) 504 Net income (expense) from investments (189) 471
of which:
(63) (30) - gains on disposal of assets (159) (33)
(11) 489 - impairments/revaluation of equity investments (38) 489
619 226 283 Income taxes (270) 345
of which:
954 900 - impairment of deferred tax assets of Italian subsidiaries 976 900
- other net tax refund (824)
36 - deferred tax adjustment on PSAs 69
860 - impairment of deferred tax assets of upstream business 860
(371) 226 (1,477) - taxes on special items of operating profit (loss) and other special items (491) (1,415)
2,239 347 8,183 Total special items of net profit (loss) 1,941 8,829
Attributable to:
255 (16) 225 - Non-controlling interest 533 353
1,984 363 7,958 - Eni's shareholders 1,408 8,476
of which:
257 (28) 1,811 Total special items of discontinued operations 199 1,940
1,986 impairment due to FV evaluation 1,969
49 financial derivative on the disposal of 12.5% interest in Saipem 49
257 (28) (224) other net special items 199 (78)
Full year
Analysis of Profit and Loss account items of continuing operations
Net sales from operations (€ million)
Fourth Quarter
Third Quarter
Fourth Quarter
2014 2015 2015 2014 2015 % Ch.
6,401 5,047 4,977 (22.2) Exploration & Production 28,488 21,436 (24.8)
18,182 10,851 10,609 (41.7) Gas & Power 73,434 52,096 (29.1)
5,593 4,584 3,875 (30.7) Refining & Marketing 24,330 18,458 (24.1)
420 373 391 (6.9) Corporate and other activities 1,429 1,468 2.7
78 81 (206) .. Impact of unrealized intragroup profit elimination 54
(8,074) (6,119) (5,757) (28.7) Consolidation adjustment (34,548) (25,718) (25.6)
22,600 14,817 13,889 (38.5) 93,187 67,740 (27.3)
Full year% Ch.
IV Q. 15vs. IV Q.
14
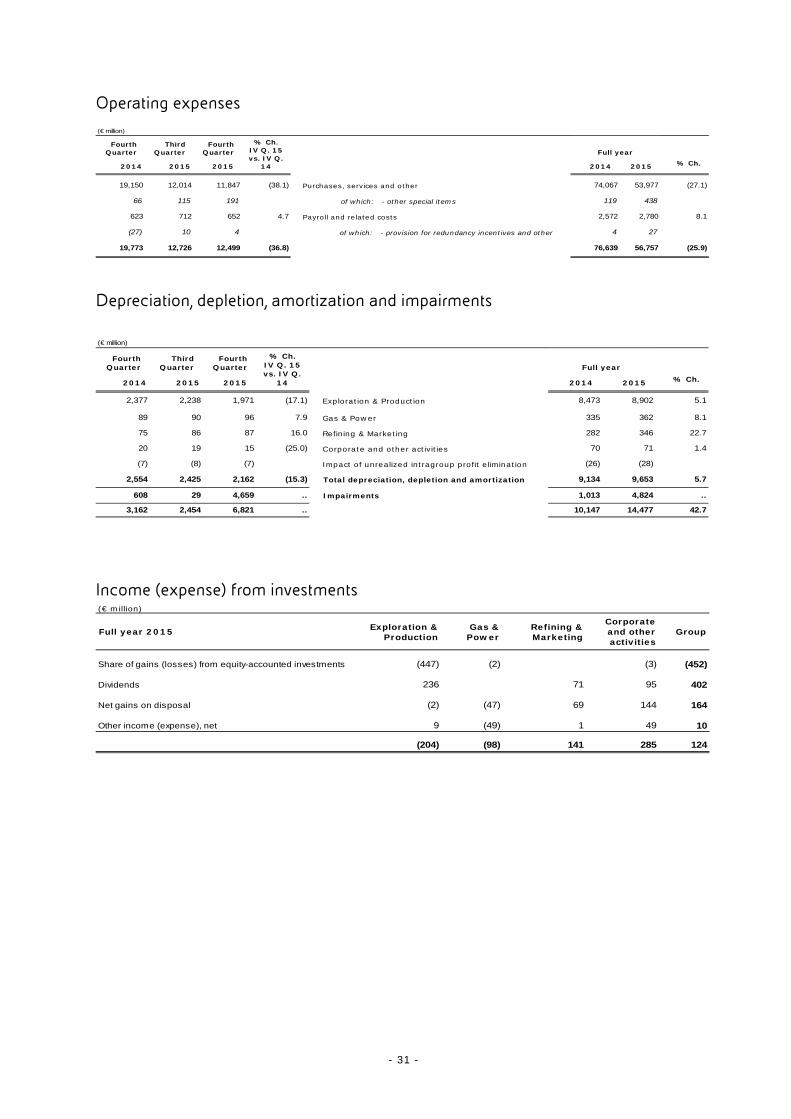
- 31 -
Operating expenses
(€ million)
Fourth Quarter
Third Quarter
Fourth Quarter
2014 2015 2015 2014 2015 % Ch.
19,150 12,014 11,847 (38.1) Purchases, services and other 74,067 53,977 (27.1)
66 115 191 of which: - other special items 119 438
623 712 652 4.7 Payroll and related costs 2,572 2,780 8.1
(27) 10 4 of which: - provision for redundancy incentives and other 4 27
19,773 12,726 12,499 (36.8) 76,639 56,757 (25.9)
Full year% Ch.
IV Q. 15vs. IV Q.
14
Depreciation, depletion, amortization and impairments (€ million)
Fourth Quarter
Third Quarter
Fourth Quarter
2014 2015 2015 2014 2015 % Ch.
2,377 2,238 1,971 (17.1) Exploration & Production 8,473 8,902 5.1
89 90 96 7.9 Gas & Power 335 362 8.1
75 86 87 16.0 Refining & Marketing 282 346 22.7
20 19 15 (25.0) Corporate and other activities 70 71 1.4
(7) (8) (7) Impact of unrealized intragroup profit elimination (26) (28)
2,554 2,425 2,162 (15.3) Total depreciation, depletion and amortization 9,134 9,653 5.7
608 29 4,659 .. Impairments 1,013 4,824 ..
3,162 2,454 6,821 .. 10,147 14,477 42.7
Full year% Ch.
IV Q. 15vs. IV Q.
14
Income (expense) from investments (€ million)
Full year 2015 Exploration &Production
Gas & Power
Refining & Marketing
Corporate and other activities
Group
Share of gains (losses) from equity-accounted investments (447) (2) (3) (452)
Dividends 236 71 95 402
Net gains on disposal (2) (47) 69 144 164
Other income (expense), net 9 (49) 1 49 10
(204) (98) 141 285 124
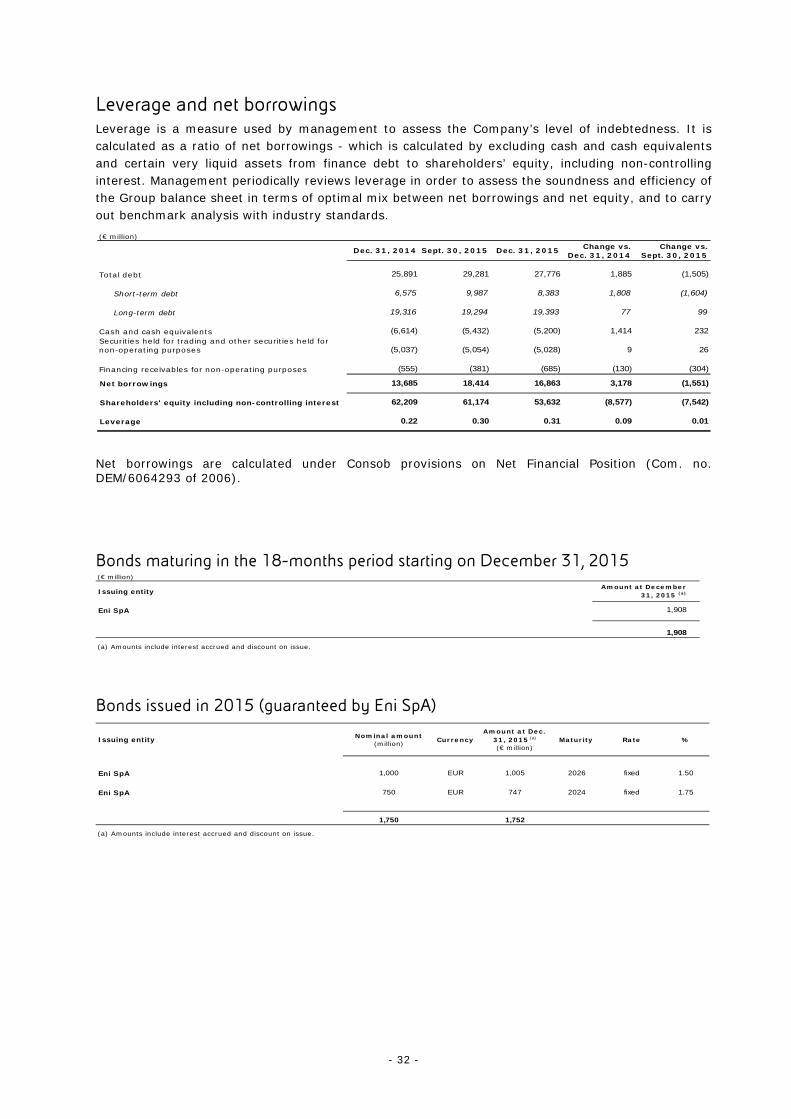
- 32 -
Leverage and net borrowings Leverage is a measure used by management to assess the Company’s level of indebtedness. It is calculated as a ratio of net borrowings - which is calculated by excluding cash and cash equivalents and certain very liquid assets from finance debt to shareholders’ equity, including non-controlling interest. Management periodically reviews leverage in order to assess the soundness and efficiency of the Group balance sheet in terms of optimal mix between net borrowings and net equity, and to carry out benchmark analysis with industry standards. (€ million)
Dec. 31, 2014 Sept. 30, 2015 Dec. 31, 2015 Change vs.Dec. 31, 2014
Change vs.Sept. 30, 2015
Total debt 25,891 29,281 27,776 1,885 (1,505)
Short-term debt 6,575 9,987 8,383 1,808 (1,604)
Long-term debt 19,316 19,294 19,393 77 99
Cash and cash equivalents (6,614) (5,432) (5,200) 1,414 232Securities held for trading and other securities held for non-operating purposes (5,037) (5,054) (5,028) 9 26
Financing receivables for non-operating purposes (555) (381) (685) (130) (304)
Net borrowings 13,685 18,414 16,863 3,178 (1,551)
Shareholders' equity including non-controlling interest 62,209 61,174 53,632 (8,577) (7,542)
Leverage 0.22 0.30 0.31 0.09 0.01
Net borrowings are calculated under Consob provisions on Net Financial Position (Com. no. DEM/6064293 of 2006). Bonds maturing in the 18-months period starting on December 31, 2015 (€ million)
Issuing entity
Eni SpA
(a) Amounts include interest accrued and discount on issue.
Amount at December 31, 2015 (a)
1,908
1,908
Bonds issued in 2015 (guaranteed by Eni SpA)
Issuing entity Nominal amount(million) Currency
Amount at Dec. 31, 2015 (a)
(€ million)Maturity Rate %
Eni SpA 1,000 EUR 1,005 2026 fixed 1.50
Eni SpA 750 EUR 747 2024 fixed 1.75
1,750 1,752
(a) Amounts include interest accrued and discount on issue.
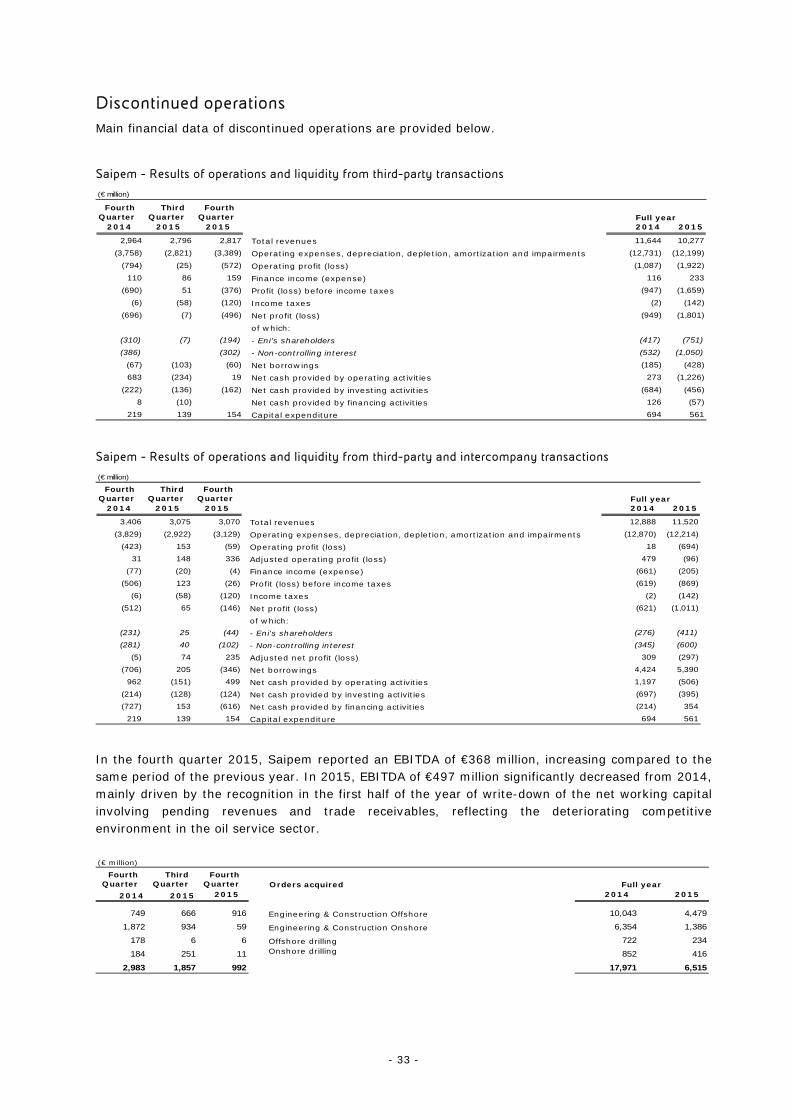
- 33 -
Discontinued operations
Main financial data of discontinued operations are provided below.
Saipem - Results of operations and liquidity from third-party transactions
(€ million)
Fourth Quarter
Third Quarter
Fourth Quarter
2014 2015 2015 2014 2015
2,964 2,796 2,817 Total revenues 11,644 10,277
(3,758) (2,821) (3,389) Operating expenses, depreciation, depletion, amortization and impairments (12,731) (12,199)
(794) (25) (572) Operating profit (loss) (1,087) (1,922)
110 86 159 Finance income (expense) 116 233
(690) 51 (376) Profit (loss) before income taxes (947) (1,659)
(6) (58) (120) Income taxes (2) (142)
(696) (7) (496) Net profit (loss) (949) (1,801)
of which:(310) (7) (194) - Eni's shareholders (417) (751)
(386) (302) - Non-controlling interest (532) (1,050)
(67) (103) (60) Net borrowings (185) (428)
683 (234) 19 Net cash provided by operating activities 273 (1,226)
(222) (136) (162) Net cash provided by investing activities (684) (456)
8 (10) Net cash provided by financing activities 126 (57)
219 139 154 Capital expenditure 694 561
Full year
Saipem - Results of operations and liquidity from third-party and intercompany transactions
(€ million)
Fourth Quarter
Third Quarter
Fourth Quarter
2014 2015 2015 2014 2015
3,406 3,075 3,070 Total revenues 12,888 11,520
(3,829) (2,922) (3,129) Operating expenses, depreciation, depletion, amortization and impairments (12,870) (12,214)
(423) 153 (59) Operating profit (loss) 18 (694)
31 148 336 Adjusted operating profit (loss) 479 (96)
(77) (20) (4) Finance income (expense) (661) (205)
(506) 123 (26) Profit (loss) before income taxes (619) (869)
(6) (58) (120) Income taxes (2) (142)
(512) 65 (146) Net profit (loss) (621) (1,011)
of which:(231) 25 (44) - Eni's shareholders (276) (411)
(281) 40 (102) - Non-controlling interest (345) (600)
(5) 74 235 Adjusted net profit (loss) 309 (297)
(706) 205 (346) Net borrowings 4,424 5,390
962 (151) 499 Net cash provided by operating activities 1,197 (506)
(214) (128) (124) Net cash provided by investing activities (697) (395)
(727) 153 (616) Net cash provided by financing activities (214) 354
219 139 154 Capital expenditure 694 561
Full year
In the fourth quarter 2015, Saipem reported an EBITDA of €368 million, increasing compared to the same period of the previous year. In 2015, EBITDA of €497 million significantly decreased from 2014, mainly driven by the recognition in the first half of the year of write-down of the net working capital involving pending revenues and trade receivables, reflecting the deteriorating competitive environment in the oil service sector.
(€ million)
Fourth Quarter
Third Quarter
Fourth Quarter Orders acquired
2014 2015 2015 2014 2015
749 666 916 Engineering & Construction Offshore 10,043 4,479
1,872 934 59 Engineering & Construction Onshore 6,354 1,386
178 6 6 Offshore drilling 722 234
184 251 11 Onshore drilling 852 416
2,983 1,857 992 17,971 6,515
Full year

- 34 -
Chemical - Results of operations and liquidity from third-party transactions
(€ million)
Fourth Quarter
Third Quarter
Fourth Quarter
2014 2015 2015 2014 2015
1,152 1,204 1,083 Total revenues 5,078 4,603
(1,015) (697) (2,070) Operating expenses, depreciation, depletion, amortization and impairments (3,659) (4,461)
137 507 (987) Operating profit (loss) 1,419 142
4 (2) Finance income (expense) 13
134 511 (993) Profit (loss) before income taxes 1,416 152
86 (31) (382) Income taxes 191 (429)
220 480 (1,375) Net profit (loss) 1,607 (277)
37 2 1 Net borrowings 8
357 573 484 Net cash provided by operating activities 1,675 1,948
(83) (89) (67) Net cash provided by investing activities (391) (291)
4 1 3 Net cash provided by financing activities 6 7
83 52 68 Capital expenditure 282 220
Full year
Chemical - Results of operations and liquidity from third-party and intercompany transactions
(€ million)
Fourth Quarter
Third Quarter
Fourth Quarter
2014 2015 2015 2014 2015
1,243 1,259 1,140 Total revenues 5,413 4,834
(1,541) (1,144) (2,519) Operating expenses, depreciation, depletion, amortization and impairments (6,117) (6,227)
(298) 115 (1,379) Operating profit (loss) (704) (1,393)
(66) 172 40 Adjusted operating profit (loss) (347) 307
(7) (6) (11) Finance income (expense) (30) (16)
(308) 109 (1,394) Profit (loss) before income taxes (737) (1,412)
86 (31) (382) Income taxes 191 (429)
(222) 78 (1,776) Net profit (loss) (546) (1,841)
(58) 140 6 Adjusted net profit (loss) (278) 229
202 (76) 39 Net borrowings 2,535 1,452
(124) 163 9 Net cash provided by operating activities (474) 220
(79) (89) (48) Net cash provided by investing activities (387) (277)
180 (46) 69 Net cash provided by financing activities 865 127
83 52 68 Capital expenditure 282 220
Full year
On a standalone basis, Eni’s Chemical segment reported an adjusted operating profit of €40 million (€307 million in the full year) increasing by €106 million from the operating loss of €66 million of the fourth quarter 2014 (a recovery of €654 million from the operating loss of €347 million in 2014). This result was driven by efficiency initiatives and plants optimization in terms of shutdowns or reconversion of unprofitable sites and the shutdowns of certain production lines. These turnaround initiatives helped to better leverage on the trading environment recovery, mainly in ethylene, polyethylene and styrene. These segments benefitted from the temporary shortage of products, unscheduled facility shutdowns and lower competitiveness of imported products reflecting the euro devaluation.
Fourth Quarter
Third Quarter
Fourth Quarter
2014 2015 2015 2014 2015
Production (ktonnes) 726 907 842 Intermediates 2,972 3,334
571 614 580 Polymers 2,311 2,366
1,297 1,521 1,422 5,283 5,700
Full year
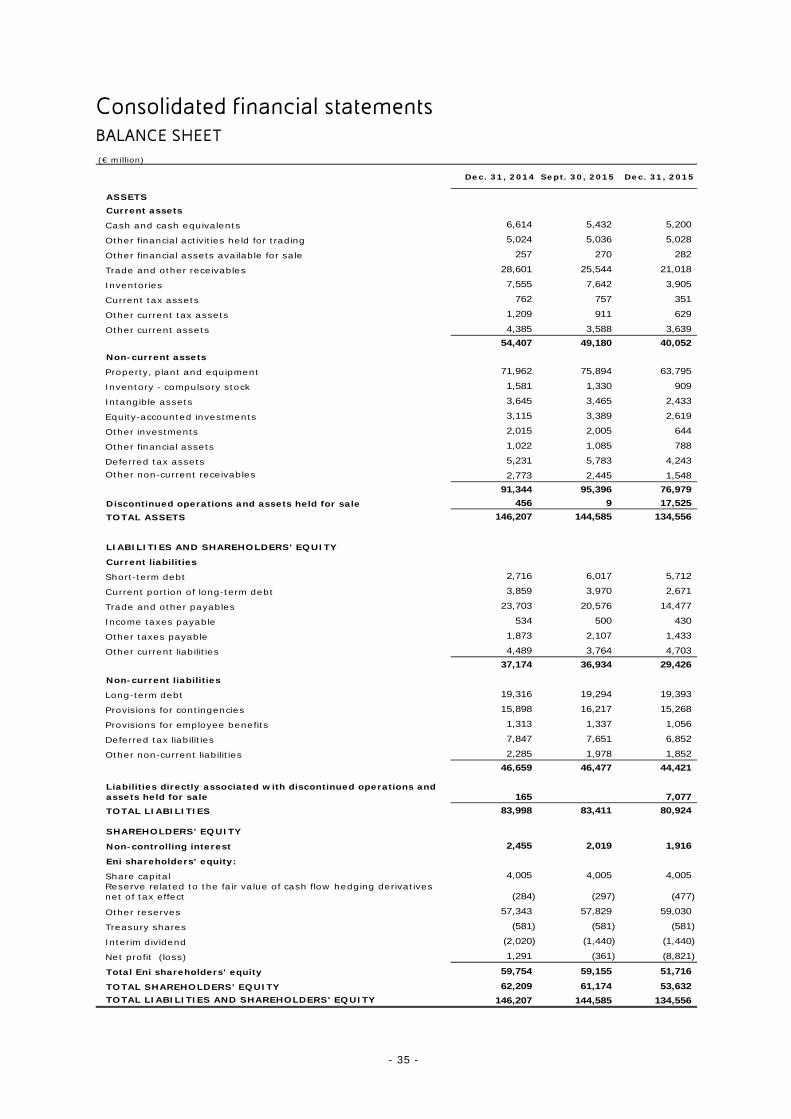
- 35 -
Consolidated financial statements BALANCE SHEET (€ million)
Dec. 31, 2014 Sept. 30, 2015 Dec. 31, 2015
ASSETSCurrent assets
Cash and cash equivalents 6,614 5,432 5,200
Other financial activities held for trading 5,024 5,036 5,028
Other financial assets available for sale 257 270 282
Trade and other receivables 28,601 25,544 21,018
Inventories 7,555 7,642 3,905
Current tax assets 762 757 351
Other current tax assets 1,209 911 629
Other current assets 4,385 3,588 3,639
54,407 49,180 40,052
Non-current assets
Property, plant and equipment 71,962 75,894 63,795
Inventory - compulsory stock 1,581 1,330 909
Intangible assets 3,645 3,465 2,433
Equity-accounted investments 3,115 3,389 2,619
Other investments 2,015 2,005 644
Other financial assets 1,022 1,085 788
Deferred tax assets 5,231 5,783 4,243
Other non-current receivables 2,773 2,445 1,548
91,344 95,396 76,979
Discontinued operations and assets held for sale 456 9 17,525
TOTAL ASSETS 146,207 144,585 134,556
LIABILITIES AND SHAREHOLDERS' EQUITY
Current liabilities
Short-term debt 2,716 6,017 5,712
Current portion of long-term debt 3,859 3,970 2,671
Trade and other payables 23,703 20,576 14,477
Income taxes payable 534 500 430
Other taxes payable 1,873 2,107 1,433
Other current liabilities 4,489 3,764 4,703
37,174 36,934 29,426
Non-current liabilities
Long-term debt 19,316 19,294 19,393
Provisions for contingencies 15,898 16,217 15,268
Provisions for employee benefits 1,313 1,337 1,056
Deferred tax liabilities 7,847 7,651 6,852
Other non-current liabilities 2,285 1,978 1,852
46,659 46,477 44,421
Liabilities directly associated with discontinued operations and assets held for sale 165 7,077
TOTAL LIABILITIES 83,998 83,411 80,924
SHAREHOLDERS' EQUITY
Non-controlling interest 2,455 2,019 1,916
Eni shareholders' equity:
Share capital 4,005 4,005 4,005 Reserve related to the fair value of cash flow hedging derivatives net of tax effect (284) (297) (477)
Other reserves 57,343 57,829 59,030
Treasury shares (581) (581) (581)
Interim dividend (2,020) (1,440) (1,440)
Net profit (loss) 1,291 (361) (8,821)
Total Eni shareholders' equity 59,754 59,155 51,716
TOTAL SHAREHOLDERS' EQUITY 62,209 61,174 53,632
TOTAL LIABILITIES AND SHAREHOLDERS' EQUITY 146,207 144,585 134,556
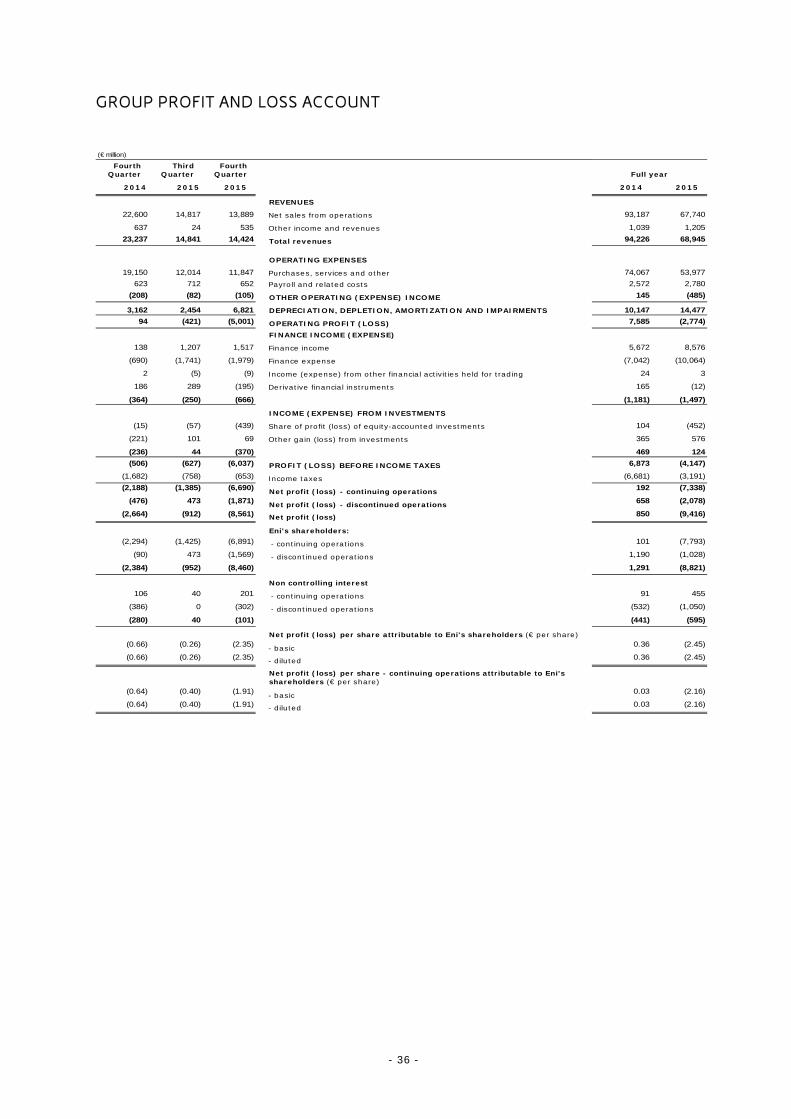
- 36 -
GROUP PROFIT AND LOSS ACCOUNT
(€ million)
Fourth Quarter
Third Quarter
Fourth Quarter
2014 2015 2015 2014 2015
REVENUES
22,600 14,817 13,889 Net sales from operations 93,187 67,740
637 24 535 Other income and revenues 1,039 1,205
23,237 14,841 14,424 Total revenues 94,226 68,945
OPERATING EXPENSES
19,150 12,014 11,847 Purchases, services and other 74,067 53,977
623 712 652 Payroll and related costs 2,572 2,780
(208) (82) (105) OTHER OPERATING (EXPENSE) INCOME 145 (485)
3,162 2,454 6,821 DEPRECIATION, DEPLETION, AMORTIZATION AND IMPAIRMENTS 10,147 14,477
94 (421) (5,001) OPERATING PROFIT (LOSS) 7,585 (2,774)
FINANCE INCOME (EXPENSE)
138 1,207 1,517 Finance income 5,672 8,576
(690) (1,741) (1,979) Finance expense (7,042) (10,064)
2 (5) (9) Income (expense) from other financial activities held for trading 24 3
186 289 (195) Derivative financial instruments 165 (12)
(364) (250) (666) (1,181) (1,497)
INCOME (EXPENSE) FROM INVESTMENTS
(15) (57) (439) Share of profit (loss) of equity-accounted investments 104 (452)
(221) 101 69 Other gain (loss) from investments 365 576
(236) 44 (370) 469 124
(506) (627) (6,037) PROFIT (LOSS) BEFORE INCOME TAXES 6,873 (4,147)
(1,682) (758) (653) Income taxes (6,681) (3,191)
(2,188) (1,385) (6,690) Net profit (loss) - continuing operations 192 (7,338)
(476) 473 (1,871) Net profit (loss) - discontinued operations 658 (2,078)
(2,664) (912) (8,561) Net profit (loss) 850 (9,416)
Eni's shareholders:(2,294) (1,425) (6,891) - continuing operations 101 (7,793)
(90) 473 (1,569) - discontinued operations 1,190 (1,028)
(2,384) (952) (8,460) 1,291 (8,821)
Non controlling interest106 40 201 - continuing operations 91 455
(386) 0 (302) - discontinued operations (532) (1,050)
(280) 40 (101) (441) (595)
Net profit (loss) per share attributable to Eni's shareholders (€ per share)(0.66) (0.26) (2.35) - basic 0.36 (2.45)
(0.66) (0.26) (2.35) - diluted 0.36 (2.45)
Net profit (loss) per share - continuing operations attributable to Eni's shareholders (€ per share)
(0.64) (0.40) (1.91) - basic 0.03 (2.16)
(0.64) (0.40) (1.91) - diluted 0.03 (2.16)
Full year
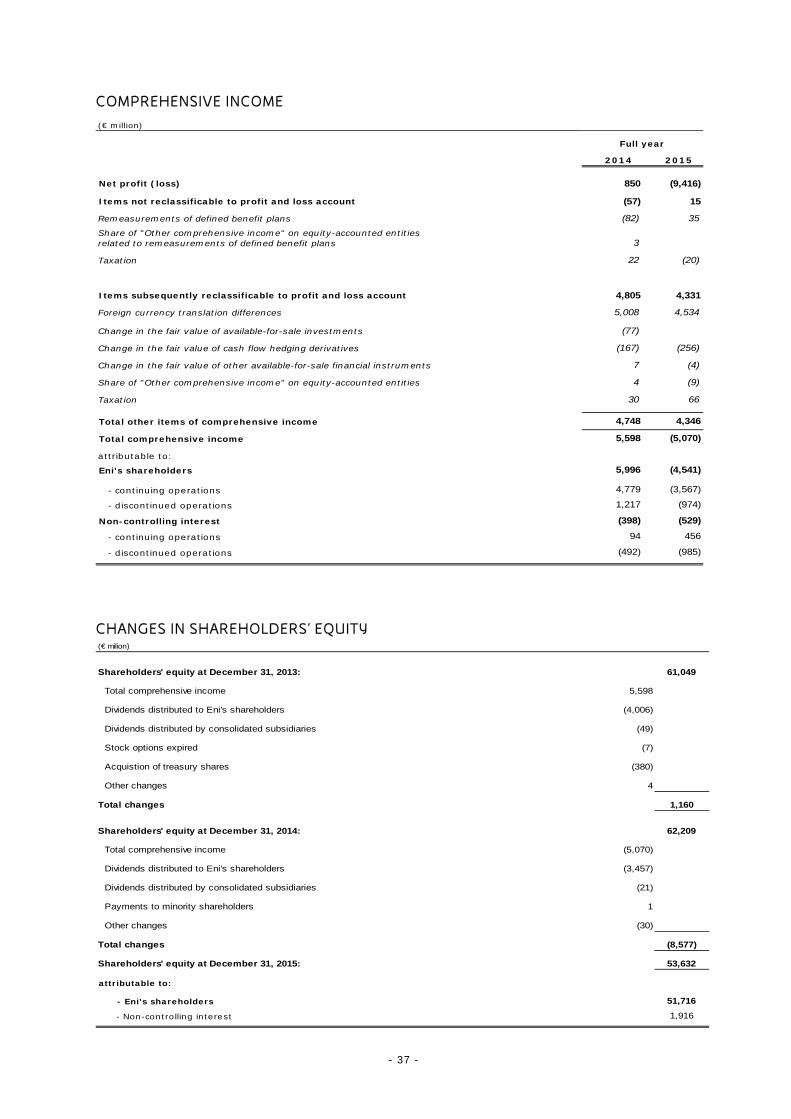
- 37 -
COMPREHENSIVE INCOME
(€ million)
2014 2015
Net profit (loss) 850 (9,416)
Items not reclassificable to profit and loss account (57) 15
Remeasurements of defined benefit plans (82) 35
Share of "Other comprehensive income" on equity-accounted entities related to remeasurements of defined benefit plans 3
Taxation 22 (20)
Items subsequently reclassificable to profit and loss account 4,805 4,331
Foreign currency translation differences 5,008 4,534
Change in the fair value of available-for-sale investments (77)
Change in the fair value of cash flow hedging derivatives (167) (256)
Change in the fair value of other available-for-sale financial instruments 7 (4)
Share of "Other comprehensive income" on equity-accounted entities 4 (9)
Taxation 30 66
Total other items of comprehensive income 4,748 4,346
Total comprehensive income 5,598 (5,070)
attributable to:
Eni's shareholders 5,996 (4,541)
- continuing operations 4,779 (3,567)
- discontinued operations 1,217 (974)
Non-controlling interest (398) (529)
- continuing operations 94 456
- discontinued operations (492) (985)
Full year
CHANGES IN SHAREHOLDERS’ EQUITY (€ milion)
Shareholders' equity at December 31, 2013: 61,049
Total comprehensive income 5,598
Dividends distributed to Eni's shareholders (4,006)
Dividends distributed by consolidated subsidiaries (49)
Stock options expired (7)
Acquistion of treasury shares (380)
Other changes 4
Total changes 1,160
Shareholders' equity at December 31, 2014: 62,209
Total comprehensive income (5,070)
Dividends distributed to Eni's shareholders (3,457)
Dividends distributed by consolidated subsidiaries (21)
Payments to minority shareholders 1
Other changes (30)
Total changes (8,577)
Shareholders' equity at December 31, 2015: 53,632
attributable to:
- Eni's shareholders 51,716
- Non-controlling interest 1,916
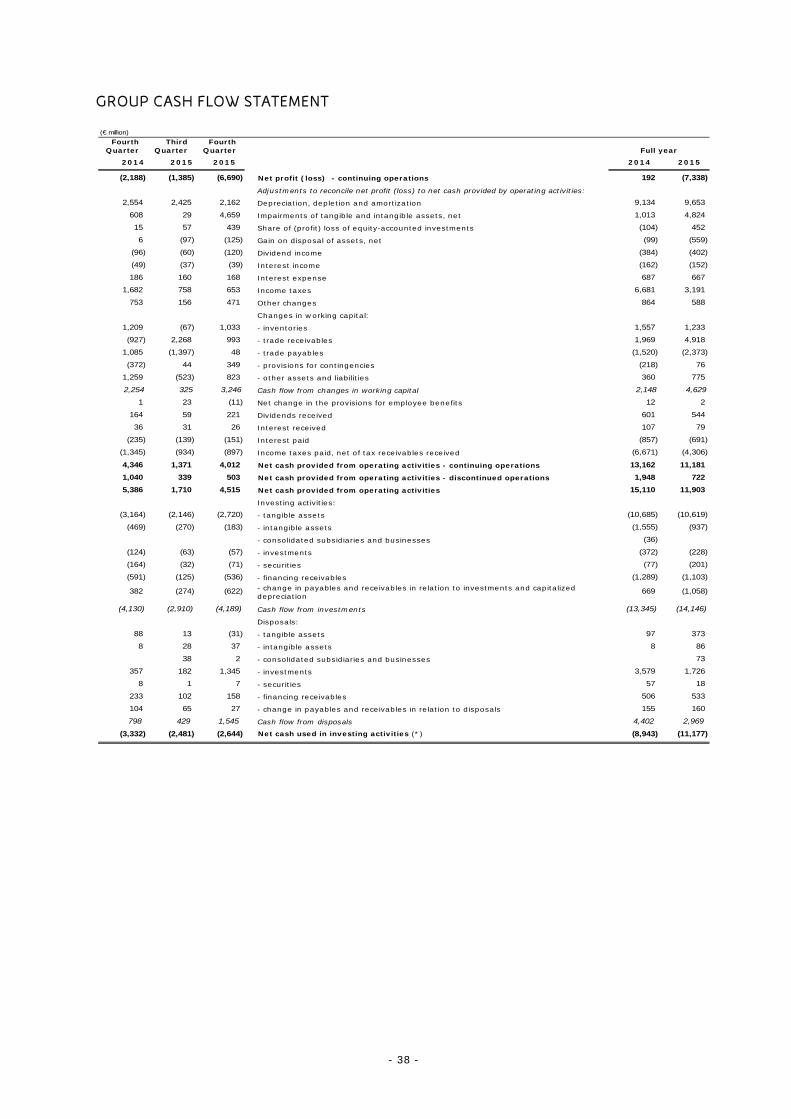
- 38 -
GROUP CASH FLOW STATEMENT
(€ million)
Fourth Quarter
Third Quarter
Fourth Quarter
2014 2015 2015 2014 2015
(2,188) (1,385) (6,690) Net profit (loss) - continuing operations 192 (7,338)
Adjustments to reconcile net profit (loss) to net cash provided by operating activities:
2,554 2,425 2,162 Depreciation, depletion and amortization 9,134 9,653
608 29 4,659 Impairments of tangible and intangible assets, net 1,013 4,824
15 57 439 Share of (profit) loss of equity-accounted investments (104) 452
6 (97) (125) Gain on disposal of assets, net (99) (559)
(96) (60) (120) Dividend income (384) (402)
(49) (37) (39) Interest income (162) (152)
186 160 168 Interest expense 687 667
1,682 758 653 Income taxes 6,681 3,191
753 156 471 Other changes 864 588
Changes in working capital:
1,209 (67) 1,033 - inventories 1,557 1,233
(927) 2,268 993 - trade receivables 1,969 4,918
1,085 (1,397) 48 - trade payables (1,520) (2,373)
(372) 44 349 - provisions for contingencies (218) 76
1,259 (523) 823 - other assets and liabilities 360 775
2,254 325 3,246 Cash flow from changes in working capital 2,148 4,629
1 23 (11) Net change in the provisions for employee benefits 12 2
164 59 221 Dividends received 601 544
36 31 26 Interest received 107 79
(235) (139) (151) Interest paid (857) (691)
(1,345) (934) (897) Income taxes paid, net of tax receivables received (6,671) (4,306)
4,346 1,371 4,012 Net cash provided from operating activities - continuing operations 13,162 11,181
1,040 339 503 Net cash provided from operating activities - discontinued operations 1,948 722
5,386 1,710 4,515 Net cash provided from operating activities 15,110 11,903
Investing activities:
(3,164) (2,146) (2,720) - tangible assets (10,685) (10,619)
(469) (270) (183) - intangible assets (1,555) (937)
- consolidated subsidiaries and businesses (36)
(124) (63) (57) - investments (372) (228)
(164) (32) (71) - securities (77) (201)
(591) (125) (536) - financing receivables (1,289) (1,103)
382 (274) (622) - change in payables and receivables in relation to investments and capitalized depreciation
669 (1,058)
(4,130) (2,910) (4,189) Cash flow from investments (13,345) (14,146)
Disposals:
88 13 (31) - tangible assets 97 373
8 28 37 - intangible assets 8 86
38 2 - consolidated subsidiaries and businesses 73
357 182 1,345 - investments 3,579 1,726
8 1 7 - securities 57 18
233 102 158 - financing receivables 506 533
104 65 27 - change in payables and receivables in relation to disposals 155 160
798 429 1,545 Cash flow from disposals 4,402 2,969
(3,332) (2,481) (2,644) Net cash used in investing activities (*) (8,943) (11,177)
Full year
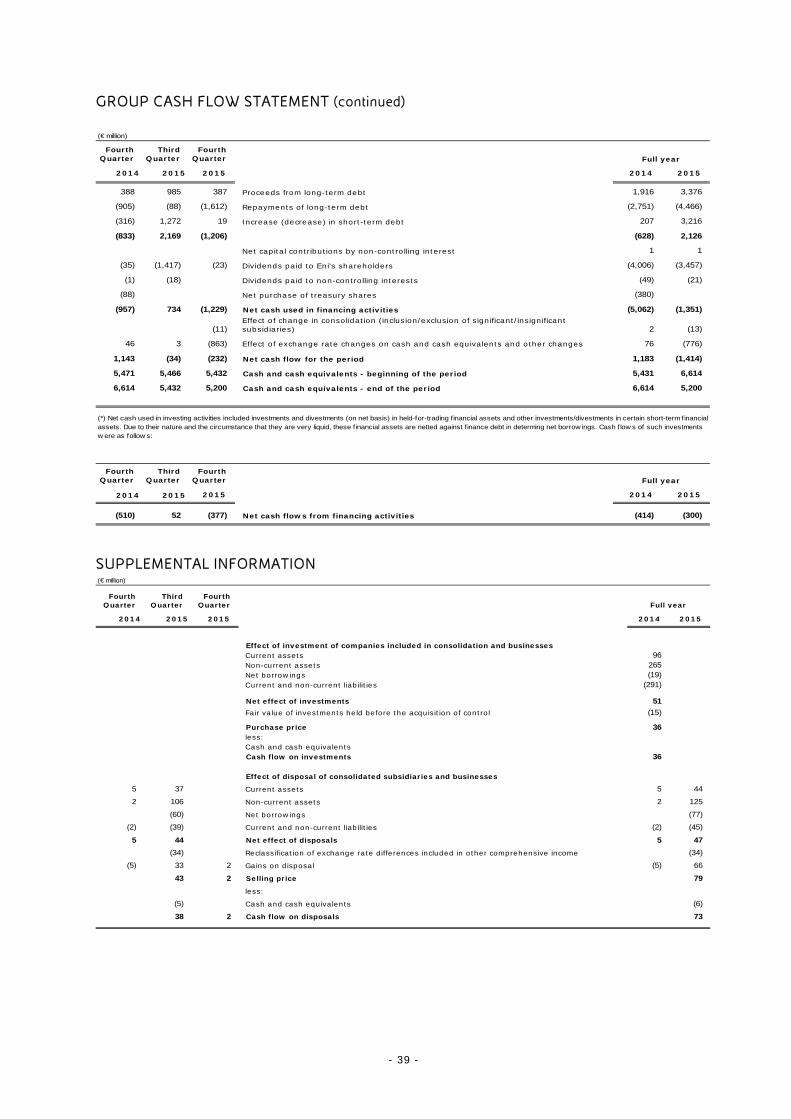
- 39 -
GROUP CASH FLOW STATEMENT (continued) (€ million)
Fourth Quarter
Third Quarter
Fourth Quarter
2014 2015 2015 2014 2015
388 985 387 Proceeds from long-term debt 1,916 3,376
(905) (88) (1,612) Repayments of long-term debt (2,751) (4,466)
(316) 1,272 19 Increase (decrease) in short-term debt 207 3,216
(833) 2,169 (1,206) (628) 2,126
Net capital contributions by non-controlling interest 1 1
(35) (1,417) (23) Dividends paid to Eni's shareholders (4,006) (3,457)
(1) (18) Dividends paid to non-controlling interests (49) (21)
(88) Net purchase of treasury shares (380)
(957) 734 (1,229) Net cash used in financing activities (5,062) (1,351)
(11)Effect of change in consolidation (inclusion/exclusion of significant/insignificant subsidiaries) 2 (13)
46 3 (863) Effect of exchange rate changes on cash and cash equivalents and other changes 76 (776)
1,143 (34) (232) Net cash flow for the period 1,183 (1,414)
5,471 5,466 5,432 Cash and cash equivalents - beginning of the period 5,431 6,614
6,614 5,432 5,200 Cash and cash equivalents - end of the period 6,614 5,200
Fourth Quarter
Third Quarter
Fourth Quarter
2014 2015 2015 2014 2015
(510) 52 (377) Net cash flows from financing activities (414) (300)
Full year
(*) Net cash used in investing activities included investments and divestments (on net basis) in held-for-trading f inancial assets and other investments/divestments in certain short-term financial assets. Due to their nature and the circumstance that they are very liquid, these f inancial assets are netted against f inance debt in determing net borrow ings. Cash f low s of such investments w ere as follow s:
Full year
SUPPLEMENTAL INFORMATION (€ million)
Fourth Quarter
Third Quarter
Fourth Quarter
2014 2015 2015 2014 2015
Effect of investment of companies included in consolidation and businessesCurrent assets 96Non-current assets 265Net borrowings (19)Current and non-current liabilities (291)
Net effect of investments 51
Fair value of investments held before the acquisition of control (15)
Purchase price 36less:Cash and cash equivalents Cash flow on investments 36
Effect of disposal of consolidated subsidiaries and businesses
5 37 Current assets 5 44
2 106 Non-current assets 2 125
(60) Net borrowings (77)
(2) (39) Current and non-current liabilities (2) (45)
5 44 Net effect of disposals 5 47
(34) Reclassification of exchange rate differences included in other comprehensive income (34)
(5) 33 2 Gains on disposal (5) 66
43 2 Selling price 79
less:
(5) Cash and cash equivalents (6)
38 2 Cash flow on disposals 73
Full year

- 40 -
Capital expenditure (€ million)
Fourth Quarter
Third Quarter
Fourth Quarter
2014 2015 2015 2014 2015 % Ch.
3,124 2,185 2,254 (27.8) Exploration & Production 10,524 10,234 (2.8)
414 246 127 (69.3) - exploration 1,398 820 (41.3)
2,672 1,923 2,097 (21.5) - development 9,021 9,341 3.5
38 16 30 (21.1) - other expenditure 105 73 (30.5)
61 36 74 21.3 Gas & Power 172 154 (10.5)
196 79 174 (11.2) Refining & Marketing 537 408 (24.0)
39 17 32 (17.9) Corporate and other activities 113 64 (43.4)
(89) (92) 147 Impact of unrealized intragroup profit elimination (82) (85)
3,331 2,225 2,681 (19.5) Capital expenditure - continuing operations 11,264 10,775 (4.3)
Full year% Ch.
IV Q. 15vs. IV Q. 14
In the full year 2015, capital expenditure amounted to €10,775 million (€11,264 million in full year 2014) and mainly related to: - development activities deployed mainly in Angola, Norway, Egypt, Kazakhstan, Congo, Indonesia, Italy and the United States and exploratory activities of which 97% was spent outside Italy, primarily in Egypt, Libya, Cyprus, Gabon, Congo, the United States, the United Kingdom and Indonesia; - refining activity (€282 million) with projects designed to improve the conversion rate and flexibility of refineries, as well as the upgrade of the refined product retail network (€126 million); - initiatives to improve flexibility of the combined cycle power plants (€69 million). Exploration & Production capital expenditure by geographic area (€ million)
Fourth Quarter
Third Quarter
Fourth Quarter
2014 2015 2015 2014 2015 % Ch.
242 154 160 (33.9) Italy 923 727 (21.2)
559 293 322 (42.4) Rest of Europe 1,783 1,447 (18.8)
364 377 363 (0.3) North Africa 1,071 1,867 74.3
1,195 718 694 (41.9) Sub-Saharan Africa 3,754 3,219 (14.3)
169 217 225 33.1 Kazakhstan 527 842 59.8
310 257 387 24.8 Rest of Asia 1,277 1,407 10.2
226 162 103 (54.4) America 1,064 694 (34.8)
59 7 (100.0) Australia and Oceania 125 31 (75.2)
3,124 2,185 2,254 (27.8) 10,524 10,234 (2.8)
Full year% Ch.IV Q. 15
vs. IV Q. 14
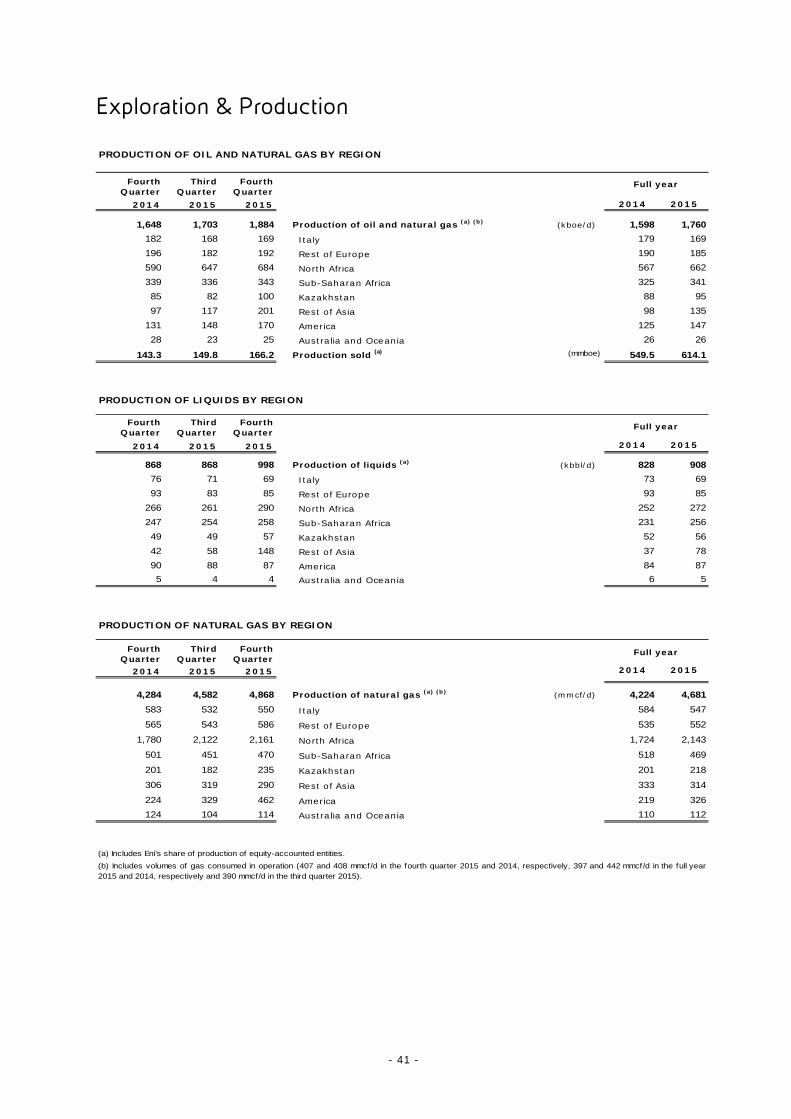
- 41 -
Exploration & Production
PRODUCTION OF OIL AND NATURAL GAS BY REGION
Fourth Quarter
Third Quarter
Fourth Quarter
2014 2015 2015 2014 2015
1,648 1,703 1,884 Production of oil and natural gas (a) (b) (kboe/d) 1,598 1,760
182 168 169 Italy 179 169
196 182 192 Rest of Europe 190 185
590 647 684 North Africa 567 662
339 336 343 Sub-Saharan Africa 325 341
85 82 100 Kazakhstan 88 95
97 117 201 Rest of Asia 98 135
131 148 170 America 125 147
28 23 25 Australia and Oceania 26 26
143.3 149.8 166.2 Production sold (a) (mmboe) 549.5 614.1
PRODUCTION OF LIQUIDS BY REGION
Fourth Quarter
Third Quarter
Fourth Quarter
2014 2015 2015 2014 2015
868 868 998 Production of liquids (a) (kbbl/d) 828 908
76 71 69 Italy 73 69
93 83 85 Rest of Europe 93 85
266 261 290 North Africa 252 272
247 254 258 Sub-Saharan Africa 231 256
49 49 57 Kazakhstan 52 56
42 58 148 Rest of Asia 37 78
90 88 87 America 84 87
5 4 4 Australia and Oceania 6 5
PRODUCTION OF NATURAL GAS BY REGION
Fourth Quarter
Third Quarter
Fourth Quarter
2014 2015 2015 2014 2015
4,284 4,582 4,868 Production of natural gas (a) (b) (mmcf/d) 4,224 4,681
583 532 550 Italy 584 547
565 543 586 Rest of Europe 535 552
1,780 2,122 2,161 North Africa 1,724 2,143
501 451 470 Sub-Saharan Africa 518 469
201 182 235 Kazakhstan 201 218
306 319 290 Rest of Asia 333 314
224 329 462 America 219 326
124 104 114 Australia and Oceania 110 112
Full year
Full year
Full year
(a) Includes Eni’s share of production of equity-accounted entities.
(b) Includes volumes of gas consumed in operation (407 and 408 mmcf/d in the fourth quarter 2015 and 2014, respectively, 397 and 442 mmcf/d in the full year2015 and 2014, respectively and 390 mmcf/d in the third quarter 2015).
- 42 -
Gas & Power Natural gas sales by market (bcm)
Fourth Quarter
Third Quarter
Fourth Quarter
2014 2015 2015 2014 2015 % Ch.
8.35 7.82 9.51 13.9 ITALY 34.04 38.44 12.9
1.14 0.50 1.36 19.3 - Wholesalers 4.05 4.19 3.5
2.33 3.89 3.45 48.1 - Italian exchange for gas and spot markets 11.96 16.35 36.7
1.36 1.11 1.04 (23.5) - Industries 4.93 4.66 (5.5)
0.40 0.23 0.43 7.5 - Medium-sized enterprises and services 1.60 1.58 (1.3)
0.30 0.28 0.16 (46.7) - Power generation 1.42 0.88 (38.0)
1.39 0.30 1.52 9.4 - Residential 4.46 4.90 9.9
1.43 1.51 1.55 8.4 - Own consumption 5.62 5.88 4.6
15.35 12.67 12.87 (16.2) INTERNATIONAL SALES 55.13 52.44 (4.9)
13.11 10.08 10.36 (21.0) Rest of Europe 46.22 42.89 (7.2)
1.25 1.20 1.17 (6.4) - Importers in Italy 4.01 4.61 15.0
11.86 8.88 9.19 (22.5) - European markets 42.21 38.28 (9.3)
1.32 1.26 1.55 17.4 Iberian Peninsula 5.31 5.40 1.7
1.95 2.29 0.96 (50.8) Germany/Austria 7.44 5.82 (21.8)
3.03 1.68 1.74 (42.6) Benelux 10.36 7.94 (23.4)
0.54 0.10 0.57 5.6 Hungary 1.55 1.58 1.9
0.65 0.38 0.43 (33.8) UK 2.94 1.96 (33.3)
1.94 1.83 2.06 6.2 Turkey 7.12 7.76 9.0
2.27 1.04 1.73 (23.8) France 7.05 7.11 0.9
0.16 0.30 0.15 (6.3) Other 0.44 0.71 61.4
1.40 1.88 1.66 18.6 Extra European markets 5.85 6.39 9.2
0.84 0.71 0.85 1.2 E&P sales in Europe and in the Gulf of Mexico 3.06 3.16 3.3
23.70 20.49 22.38 (5.6) WORLDWIDE GAS SALES 89.17 90.88 1.9
% Ch.IV Q. 15
vs. IV Q. 14
Full year
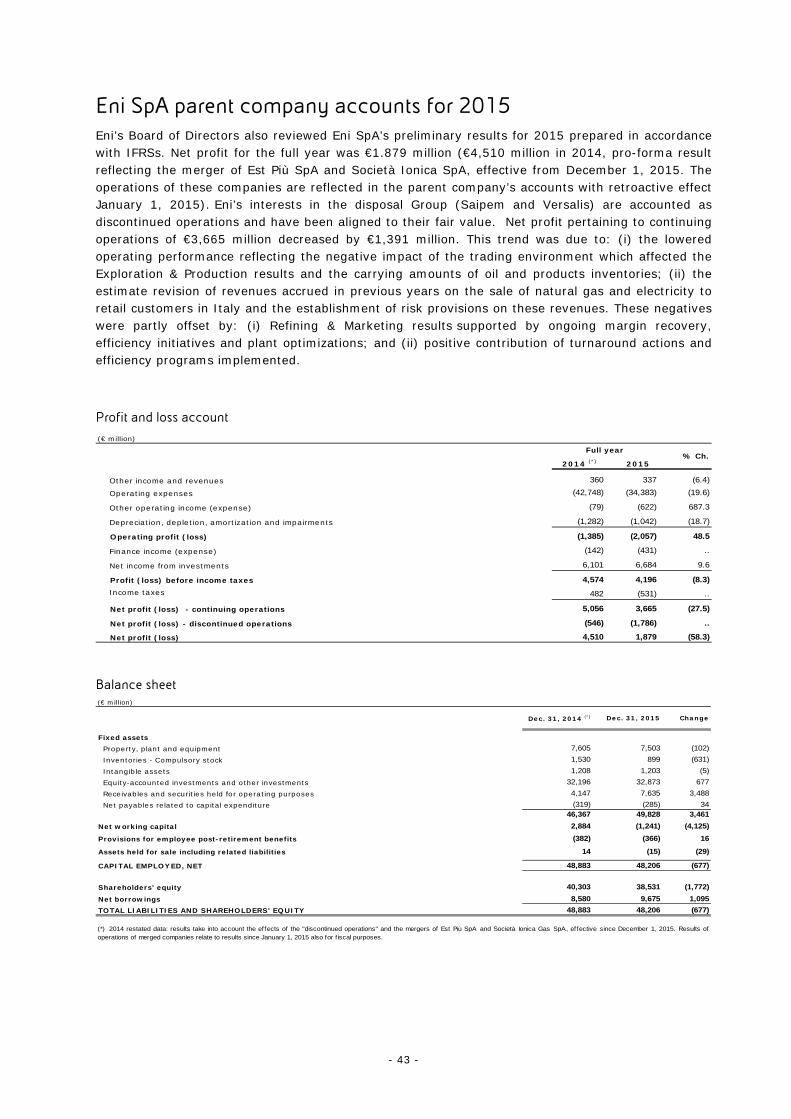
- 43 -
Eni SpA parent company accounts for 2015 Eni’s Board of Directors also reviewed Eni SpA’s preliminary results for 2015 prepared in accordance with IFRSs. Net profit for the full year was €1.879 million (€4,510 million in 2014, pro-forma result reflecting the merger of Est Più SpA and Società Ionica SpA, effective from December 1, 2015. The operations of these companies are reflected in the parent company’s accounts with retroactive effect January 1, 2015). Eni’s interests in the disposal Group (Saipem and Versalis) are accounted as discontinued operations and have been aligned to their fair value. Net profit pertaining to continuing operations of €3,665 million decreased by €1,391 million. This trend was due to: (i) the lowered operating performance reflecting the negative impact of the trading environment which affected the Exploration & Production results and the carrying amounts of oil and products inventories; (ii) the estimate revision of revenues accrued in previous years on the sale of natural gas and electricity to retail customers in Italy and the establishment of risk provisions on these revenues. These negatives were partly offset by: (i) Refining & Marketing results supported by ongoing margin recovery, efficiency initiatives and plant optimizations; and (ii) positive contribution of turnaround actions and efficiency programs implemented. Profit and loss account
(€ million)
2014 (*) 2015
Other income and revenues 360 337 (6.4)
Operating expenses (42,748) (34,383) (19.6)
Other operating income (expense) (79) (622) 687.3
Depreciation, depletion, amortization and impairments (1,282) (1,042) (18.7)
Operating profit (loss) (1,385) (2,057) 48.5
Finance income (expense) (142) (431) ..
Net income from investments 6,101 6,684 9.6
Profit (loss) before income taxes 4,574 4,196 (8.3)
Income taxes 482 (531) ..
Net profit (loss) - continuing operations 5,056 3,665 (27.5)
Net profit (loss) - discontinued operations (546) (1,786) ..
Net profit (loss) 4,510 1,879 (58.3)
Full year% Ch.
Balance sheet (€ million)
Dec. 31, 2014 (*) Dec. 31, 2015 Change
Fixed assetsProperty, plant and equipment 7,605 7,503 (102)
Inventories - Compulsory stock 1,530 899 (631)
Intangible assets 1,208 1,203 (5)
Equity-accounted investments and other investments 32,196 32,873 677
Receivables and securities held for operating purposes 4,147 7,635 3,488
Net payables related to capital expenditure (319) (285) 3446,367 49,828 3,461
Net working capital 2,884 (1,241) (4,125)
Provisions for employee post-retirement benefits (382) (366) 16
Assets held for sale including related liabilities 14 (15) (29)
CAPITAL EMPLOYED, NET 48,883 48,206 (677)
Shareholders’ equity 40,303 38,531 (1,772)
Net borrowings 8,580 9,675 1,095
TOTAL LIABILITIES AND SHAREHOLDERS' EQUITY 48,883 48,206 (677)
(*) 2014 restated data: results take into account the effects of the "discontinued operations" and the mergers of Est Più SpA and Società Ionica Gas SpA, effective since December 1, 2015. Results ofoperations of merged companies relate to results since January 1, 2015 also for f iscal purposes.