enhancing south africa’s export - department of trade ... · enhancing south africa’s export...
TRANSCRIPT

Enhancing South Africa’s export
competitiveness: Reform of the port and rail network*
* Duncan Pieterse, Andre Steenkamp, Martin Odendaal and Tom Farole
National Treasury | March 2016
Export performance is lagging behind peers
2
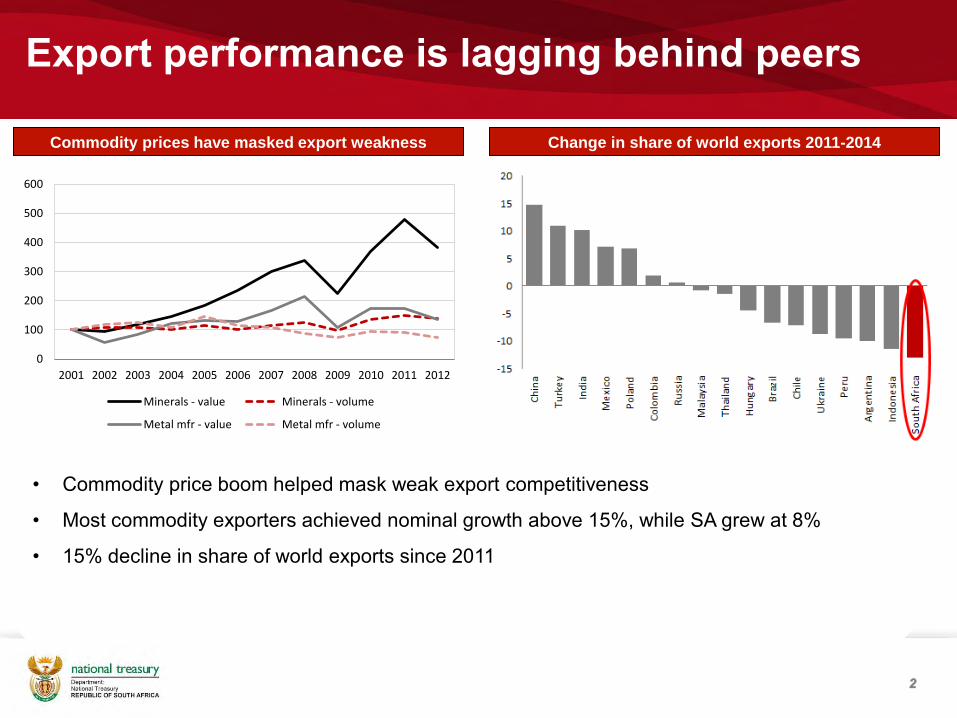
Commodity prices have masked export weakness Change in share of world exports 2011-2014
• Commodity price boom helped mask weak export competitiveness
• Most commodity exporters achieved nominal growth above 15%, while SA grew at 8%
• 15% decline in share of world exports since 2011
0
100
200
300
400
500
600
2001 2002 2003 2004 2005 2006 2007 2008 2009 2010 2011 2012
Minerals - value Minerals - volume
Metal mfr - value Metal mfr - volume
Export sector highly concentrated in nature
3
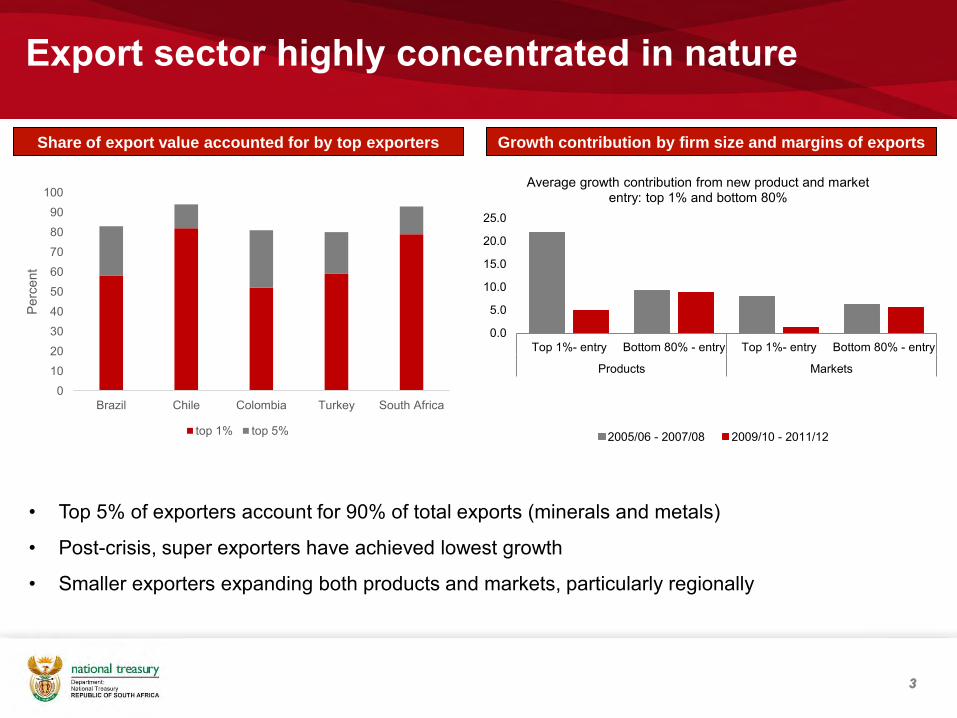
Share of export value accounted for by top exporters Growth contribution by firm size and margins of exports
0.0
5.0
10.0
15.0
20.0
25.0
Top 1%- entry Bottom 80% - entry Top 1%- entry Bottom 80% - entry
Products Markets
Average growth contribution from new product and market entry: top 1% and bottom 80%
2005/06 - 2007/08 2009/10 - 2011/12
0102030405060708090
100
Brazil Chile Colombia Turkey South Africa
Perc
ent
top 1% top 5%
• Top 5% of exporters account for 90% of total exports (minerals and metals)
• Post-crisis, super exporters have achieved lowest growth
• Smaller exporters expanding both products and markets, particularly regionally

Addressing transport is critical to South Africa’s
export success
4
Cost to export a 20ft container (US$), 2015
Most problematic factors for exporting
• Global geography and inland concentration
• Reducing export costs / inland travel times
can dramatically boost exports
• Transnet (TNPA, TPT, TFR) and road
freight are crucial determinants
Cost breakdown for orange exporter in Western Cape

Transport intensity: Citrus exporter
5
R 7,840
R -1 507
R -1 455
R -4 217
R 661R 330
R 2 935
R 952
R 0
R 1,000
R 2,000
R 3,000
R 4,000
R 5,000
R 6,000
R 7,000
R 8,000
Export value (non-USA market)
Production cost Packaging cost Logistics Profit
Packhouse to port (SA)
Distribution costs (shipping + insurance)
Port costs

Access Constraints
6
Capacity mismatch for heavy haul exports
• Mismatch between rail and port capacity for coal (coalex and RBCT), iron ore (orex and
Port of Saldanha Bay) and manganese
• Directly constrains the bulk mining sector and commodity exporters
Access constraints for smaller, traditional exporters
• Capacity constraints has forced smaller coal exporters to use smaller ports (Maputo) at
higher cost
Economics of rail and market failures restrict access to most non-commodity exporters
• Fragmented volume base of non-traditional exporters at odds with economics of rail
• Lack of information and coordination challenges of freight volumes across many firms and
sectors prevents the freight market working efficiently
How does one benefit opportunistically from the commodity price upswings or exchange rate
depreciation in an access constrained environment? (flat cost curve or excess capacity)
Pricing Constraints – rail
7
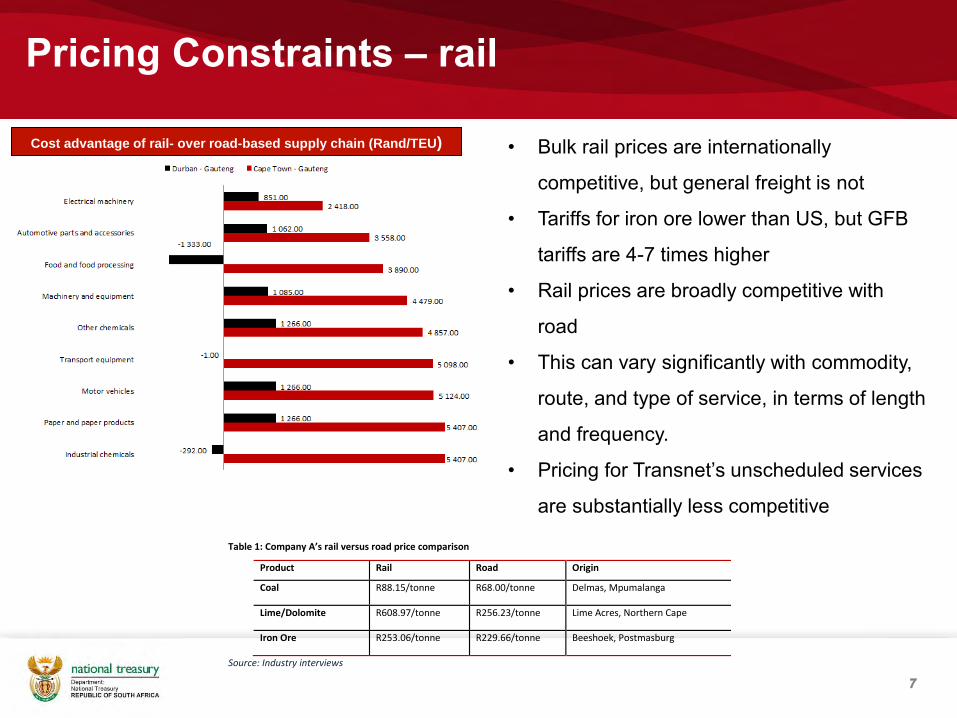
• Bulk rail prices are internationally
competitive, but general freight is not
• Tariffs for iron ore lower than US, but GFB
tariffs are 4-7 times higher
• Rail prices are broadly competitive with
road
• This can vary significantly with commodity,
route, and type of service, in terms of length
and frequency.
• Pricing for Transnet’s unscheduled services
are substantially less competitive
Cost advantage of rail- over road-based supply chain (Rand/TEU)
Table 1: Company A’s rail versus road price comparison
Product Rail Road Origin
Coal R88.15/tonne R68.00/tonne Delmas, Mpumalanga
Lime/Dolomite R608.97/tonne R256.23/tonne Lime Acres, Northern Cape
Iron Ore R253.06/tonne R229.66/tonne Beeshoek, Postmasburg
Source: Industry interviews

Pricing Constraints - ports
8
• Port costs are extremely high by international
standards (despite significant reductions)
• Cargo owners are subsidizing vessel owners
and tenants (60% to 35% over ten years)
• Import vs export cargo dues
• Container and automotive port charges much
higher than bulk commodities
• Required revenue remains the same (role of
revisiting regulatory asset base)
Total port costs including terminal handling charges for containers

Reliability constraints
9
Reliability concerns can trump price advantages of rail
• Competence and quality of rail services are poorer than Australia, Canada, India, China,
Germany, the United States and Russia
• Operation of the (unregulated) intermodal terminals, port and inland, is the main problem
Congestion at the major ports
• Durban: average turnaround time is 3x higher that other large ports, crane performance is
well below international standards and truck turnaround is above the target of 35 minutes
Locomotive type
Corridor / Flow Key commodities Efficiency improvements
19E Export coal heavy haul line Coal Locomotive cycle time reduced from 58 to 48 hours
15E Export iron ore heavy haul line Iron ore Improved number of locomotives per 342 wagon train from 9 to 6 locomotives per train with better energy usage
43D Phalaborwa – Richards bay Magnetite, rock and phosphate
Wagon cycle time reduced from 84 to 56 hours
20E Hotazel – Port Elizabeth Manganese Wagon cycle time reduced from 90 to 65 hours
Efficiencies introduced since the start of the locomotive modernisation programme

Interface constraints
10
Lack of effective intermodal operations
• South Africa’s dense corridors are ideal for intermodal transport – depends on rail service,
equipment (e.g. ship to shore cranes), terminals, last kilometre
• The capacity and operational constraint on the general freight rail corridors is not the
mainline track infrastructure but at the end terminals – port and inland container depots and
last kilometre
Barriers to regional rail
• Lack of capital investment and coordination issues leads to poor rail reliability
• Significant improvements have taken place over the past 2 to 3 years, with transit times
becoming more predictable and costs declining (JOC in Bulawayo)

Chronic underinvestment in the ports and rail network
11
Recent history of underinvestment
• Deferred spending on maintenance and replacement of the rolling stock and signaling
equipment – decline in reliability and rapid loss of market share
Emphasis on maintenance versus expansion
• Assets are being refurbished and not replaced with higher performing ones – contributes to
the long-term decline in competitiveness of the rail system
• “Underinvestment” in rail and underinvestment in ports
Ambitious strategy to address underinvestment
• Market demand strategy (MDS) introduced in 2012
• Around R200 billion earmarked for rail infrastructure over 7-year period

Inadequate regulation for rail and ports
12
Inadequate regulatory framework
• Fragmented approach to economic regulation of the transport sector
• Freight rail regulatory regime lacks most of the features of economies that achieve strong
rail performance
• The DoT aims to improve the regulation by establishing the STER
Failure to force transparency in cross-subsidisation
• Transnet’s centralised structure allows it to move funds between operating divisions
• Two types of cross subsidisation that takes place within Transnet
1. cross-subsidy within a vertically integrated entity – TFR heavy haul business and
general freight business (costs common to both?)
2. within a horizontally integrated entity – profitable TNPA and Pipelines divisions
and the rest of Transnet
• Regulatory weaknesses contribute to the persistence of opaque cross-subsidisation
Competitive road freight, but privileged regulatory
environment
13
Road currently dominates the movement of domestic dry bulk freight
High levels of competition and a privileged regulatory environment
• Increased supply from new trucking companies caused road freight tariffs to fall
• Concern that the level of competition in the trucking industry is excessive and destructive
• High gross-vehicle-mass (GVM) limits (56 vs 40-44 in EU and 36 in US); overloading and
lack of enforcement; internalization of externality effects; and inadequate road infrastructure
charging erodes rails ability to compete with road
• Costs of overreliance on road freight borne by fiscus

Limited private sector participation
14
Transnet’s approach to private sector participation
• There is currently very little private sector involvement in the port and rail network.
• Takes place mostly in areas where specialist private sector expertise is necessary or when
an investment cannot be funded by Transnet’s balance sheet (e.g. Operation Phakisa
investments at selected ports)
• RBCT is a good example of private sector involvement in port infrastructure and operation
Failure to secure private sector participation to maintain the branch line network
• Rail branch lines have been increasingly abandoned to improve the overall density of the
rail system.
• All previous attempts to interest the private sector to operate selected branch lines have
been unsuccessful.

Weak and patchy regional integration
15
Trade policy barriers remain significant in regional trade
• Lack of harmonisation of standards and pricing across SADC - main constraint to regional
road freight transportation
• Illegal impounding and harassment by traffic officials
Table 1: Cross-border fees in SADC
Charges / Fees South Africa
Zimbabwe Zambia Malawi Mozambique Comments
CBP - Cross Border Permit $525 $150 $86.50 $27.00 $105.00 Annual Fee
TIP (Temporary Import Permit)
N/C N/C N/C $12.50 N/C On Entry
Customs Processing Fee N/C N/C $7.50 $12.50 $20.00 On Entry
Carbon Emission Tax N/C $90 $27.00 N/C N/C For 90 days
Transit Bond (RIT) $90 $75 $250.00 $150.00 $170.00 On Entry
Customs Weekend O/T Fee N/C N/C N/C $1.25 N/C Weekends and Public Holidays
Carrier License N/C N/C $80.00 N/C N/C Annual Fee per Company
Municipality Fee N/C N/C $50.00 N/C N/C On Entry
Insurance N/C $50 $50.00 $50.00 $75.00 per 30 days
NLB (New Limpopo Bridge) - Beitbridge only
N/A $54 N/A N/A N/A On Entry and Exit
Road Tolls - COMESA Vehicles
Toll Plaza Fees
$200 $10/100km
$15/100 km
$400.00 Mozambique / Zimbabwe is per return trip
Road Tolls - Mozambique Vehicles
N/A N/A $300.00 $28/100 km
N/A Zambia is per return trip
Source: FESARTA.
Border inspections contribute to
unnecessary delays
• The use of one-stop border posts
(OSBPs) remains in its infancy.
• Lack of coordination among
national (monopolistic) rail
systems in the region - lack of
reciprocal access rights and
failure to coordinate operational
planning.

Policy options based on international experience
16
Institutional and regulatory reforms to promote competition and get the prices right
• Introduction of Single Transport Economic Regulator
• Pricing, access (branchlines), cross subsidies, service standards (port operations)
• Third party access and consolidation of volumes
• Vertical separation of freight rail (economics of density?) – concession?
• Corporitisation of TNPA and Pipelines?
Private sector participation to increase investment and improve service delivery
• Concessioning some branchlines to the private sector
• Opportunities in cross-border and multi-modal transport and consolidation and volumes
• Competition between terminal operators on cargo handling, towage, warehousing
• Concessioning selected ports very successful internationally (but access rules?)
Joint development of infrastructure projects of strategic importance

Policy options based on international experience
17
Level the playing field between road and rail
Information and coordination to address market failures and improve access
• Facilitating information on freight flows and supporting operational solutions for freight
consolidation
Cooperation to improve intermodal, interregional and institutional interfaces
• Efficient intermodal terminals, with private sector participation
• Operational solutions (e.g. customs clearance at inland terminals)
• Improve institutional coordination (e.g. declaration of key nodes and classification of roads)
Thank you
18