enhancing productivity - spectris/media/files/s/spectris/annual-interm-reports/... · enhancing...
TRANSCRIPT

21119.04 06/03/12 Proof 7
Spectris plcAnnual Report and Accounts for the
year ended 31 December 2011
ImPRovINg PERFoRmANcE
ENhANcINgPRoDucTIvITy
Spectris plc Annual Report and Accounts 2011

21119.04 06/03/12 Proof 7
The purpose of the annual report is to provide information to the shareholders of Spectris plc. The company, its directors, employees, agents and advisers do not accept or assume responsibility to any other person to whom this document is shown or into whose hands it may come and any such responsibility or liability is expressly disclaimed. The annual report contains certain forward-looking statements with respect to the operations, performance and financial condition of the company. By their nature, these statements involve uncertainties since future events and circumstances can cause actual results to differ materially from those anticipated and no reliance should be placed on them. The forward-looking statements reflect knowledge and information available at the date of preparation of this annual report and the company undertakes no obligation to update these forward-looking statements. Nothing in this annual report should be construed as a profit forecast.
Spectris is a leading supplier of productivity-enhancing instrumentation and controls. our products, applications and services help customers to improve product quality and performance, improve core manufacturing processes, reduce downtime and wastage and reduce time to market. our businesses are leaders in the markets they serve, providing solutions for customers across a wide range of industries.
Investment Proposition
Spectris comprises four strategic segments which reflect the end user industries and applications we serve.
our businesses are strong players in niche markets where there are significant barriers to entry.
our products typically involve low capital expenditure but provide significant and rapid payback for customers.
our businesses serve all the major global manufacturing industries and we derive significant revenues in the high growth economies.
our product pipeline is underpinned by research and development, which accounts for around 7% of sales each year.
year-on-year sales growth, on a like-for-like basis, has averaged mid-single digits since 2003. This has been supplemented by growth from acquisitions averaging around 4% per annum.
our businesses have low capital requirements and are highly cash generative.
our dividend policy is to make progressive payments based on affordability and sustainability.
We have an experienced Board and Executive management team, a clear strategic direction and a proven business model.
www.spectris.comRead more online at
6Read more about our business model
2Read more about our worldwide operations here

Spectris plc Annual Report and Accounts 2011 01
21119.04 07/03/12 Proof 8
Highlights Contents
Business Review01 Highlights02 Group Overview06 Business Model08 Marketplace10 Acquisition Strategy12 Strategy and Objectives13 Key Performance Indicators14 Principal Risks and Uncertainties16 Chairman’s Statement18 Chief Executive’s Review20 Operating Review28 Financial Review32 Corporate Responsibility
Governance38 Board of Directors40 Directors’ Report46 Directors’ Remuneration Report
Financial Statements55 Auditor’s Report 56 Consolidated Statement of Income57 Consolidated Statement of Comprehensive
Income58 Consolidated Statement of Changes
in Equity60 Consolidated Statement of Financial
Position61 Consolidated Statement of Cash Flows62 Notes to the Accounts109 Company Balance Sheet110 Notes to the Company’s Accounts117 Shareholder Information
> Record sales and operating profit in all segments
> Operating margins grew by 2.4pp to 18.2%
> Strong growth in all key regions
> Healthy cash conversion of 89%
> Important acquisitions closed during the year provide additional growth and resilience
> Dividend up by 20%
Sales (£m)
up 23%
2011
1,106.2
2010
901.9
2009
787.3
2008
787.1
2007
659.8
Adjusted earnings per share* (pence)
up 43%
2011
124.1
2010
86.6
2009
45.4
2008
72.8
2007
58.1
Adjusted operating profit* (£m)
up 42%
2011
201.5
2010
142.1
2009
79.2
2008
118.3
2007
104.3
Dividend (pence)
up 20%
2011
33.6
2010
28.0
2009
24.25
2008
23.4
2007
21.0
“We are very pleased with our performance in 2011. The progress we made on all aspects of our strategy was fundamental to delivering these results.
Whilst the current macro-economic outlook remains uncertain, the Board is confident that, as a result of continued investment in new products and applications, together with the growth opportunities and resilience which our recent acquisitions provide, Spectris is strategically well positioned for the year ahead.”
John O’Higgins Chief Executive
* Adjusted figures exclude certain non-operational items, as defined in Note 3

Spectris plc Annual Report and Accounts 201102
21119.04 07/03/12 Proof 8
Group Overview
Our customers are typically multinational, blue chip companies across a diverse range of end user markets.
We have sales and service offices located around the world, providing local delivery and service for our customers.
Key strategic events in 2011
North America
1 Acquisition of Omega Engineering (Stamford, CT) provides new strategic growth platform for Industrial Controls segment.
2 Acquisition of Sixnet brings additional networking capability to Industrial Controls segment (Albany, NY).
Europe
3 Acquisition of IRM Group (Liège, Belgium) extends capabilities in metals processing market for In-line Instrumentation segment.
4 State-of-the-art manufacturing facility opened for X-ray tube production (Eindhoven, The Netherlands).
12
7
North America
26% Group sales
2,321Employees
Regional revenue up 27%*

Spectris plc Annual Report and Accounts 2011 03
Busin
ess
Revi
ewG
over
nanc
eFi
nanc
ial S
tate
men
ts
21119.04 07/03/12 Proof 8
www.spectris.comRead more online at
Europe
34% Group sales
3,534Employees
Regional revenue up 17%*
Asia
5 Additional regional sales office opened for Malvern (Zibo, central Shandong province, China).
6 New systems engineering centre opened for Servomex (Mumbai, India).
Rest of the world
7 Relocation of Spectris Brazil office to a new facility (São Paulo, Brazil).
4
6
5
3
Rest of the world
7% Group sales
81 Employees
Regional revenue up 21%*
Asia
33% Group sales
1,540 Employees
Regional revenue up 26%*
* % increase in reported sales compared with prior year

Spectris plc Annual Report and Accounts 201104
21119.04 07/03/12 Proof 8
Group Overview continued
MAtERiAlS ANAlySiS
lABoRAtoRy/oFF-liNE
Provides a range of analytical instrumentation and systems for particle and material characterisation.
Applications> Material characterisation> Contamination detection> Quality control
Industries> Pharma/fine chemicals> Metals/mining> Semiconductor/electronics> Research institutes
Operating companies> Malvern Instruments> PANalytical> Particle Measuring Systems
Supplies test, measurement and analysis equipment and software for product design optimisation, manufacturing control and environmental monitoring.
Applications> Measurement> Data acquisition and processing> Simulation
Industries> Automotive> Aerospace> Consumer electronics> Environmental
Operating companies> Brüel & Kjær Sound & Vibration> HBM
Malvern’s new Mastersizer 3000 is a much more compact benchtop instrument than its predecessor yet delivers greater sizing capability. Designed following extensive customer consultation, routine particle sizing has been made simpler and more automated so that all users, whether experienced or not, can quickly and easily make reliable measurements. Accessories include the novel Aero dry powder dispersion unit, which enables measurement of materials from cement to fragile pharmaceuticals.
HBM’s new espressoDAQ series of compact, USB-based data acquisition modules are designed to reliably measure parameters such as force, pressure, temperature or voltage. Designed for “plug and measure“ operation, the modules are powered via the USB interface of a laptop and deliver instant measurement results. The espressoDAQ family is ideally suited for mobile use, for example by test engineers in the service sector.
The group comprises four business segments which reflect the applications and end user industries we serve.
Our products help customers to improve accuracy and speed of materials analysis in the laboratory and in process manufacturing applications. We also provide test and measuring equipment for research and development applications.
tESt AND MEASuREMENt
Group contribution
31% Sales*
30% Profit*
Group contribution
31% Sales*
27%Profit*
* Figures shown are % of reported sales and adjusted operating profit

Spectris plc Annual Report and Accounts 2011 05
Busin
ess
Revi
ewG
over
nanc
eFi
nanc
ial S
tate
men
ts
21119.04 07/03/12 Proof 8
PRocESS/MANuFActuRiNG
iN-liNE iNStRuMENtAtioN iNDuStRiAl coNtRolS
Provides process analytical measurement, asset monitoring and on-line controls for both primary processing and the converting industries.
Applications> Quality control> Process technology> Safety
Industries> Process industries> Pulp and paper> Energy> Converting
Operating companies> Beta LaserMike> Brüel & Kjær Vibro> BTG Group> Fusion UV Systems> NDC Infrared Engineering> Servomex
Industrial Controls supplies process measurement, monitoring and control instrumentation and networking products for manufacturing industries.
Applications> Product tracking> Machine interface> Process control> Industrial networking
Industries> Manufacturing controls/networking > Machine building> Distributors
Operating companies> Microscan> Omega Engineering> Red Lion Controls
The new SERVOTOUGH FluegasExact 2700 from Servomex is the world’s first combustion gas analyser with an integrated in-line flow sensor and features the company’s advanced zirconia technology to provide accurate combustion gas measurements. Designed for operation in extreme environments, the FluegasExact measures oxygen and combustibles in flue gases to improve combustion efficiency and reduce emissions. It is ideal for controlling a range of combustion processes used in the hydrocarbon processing and power generation industries, including use in process heaters, utility boilers, incinerators and furnaces.
Our products and applications provide precision measurement and control in challenging operating environments, ensuring process quality, asset uptime, safety and improved yield. We also provide automation and control products for the discrete manufacturing industries.
The Omega business, acquired at the end of September, provides a broad range of process measurement and control instrumentation. During 2011, the company introduced a new wireless sensor system, the wSeries transmitters. Designed for demanding industrial applications and harsh outdoor environments, these small devices communicate via a standard Wi-Fi network, measuring voltage and current, temperature, humidity, and barometric pressure. Charts and graphs can be viewed over an ethernet network or via the internet from any computer, tablet, or smart phone with a web browser. Using Omega’s own server software, the wireless sensor system can be easily integrated with Omega’s data acquisition and automation systems, as well as with third-party systems, creating a complete measurement solution.
Group contribution
28%Sales*
32% Profit*
Group contribution
10% Sales*
11% Profit*

Spectris plc Annual Report and Accounts 201106
21119.04 07/03/12 Proof 8
Business Model
Culture and Values
Driv
ing
Grow
thNurturing Innovation
Systems and Controls
Spectris is a leading supplier of productivity-enhancing instrumentation and controls. Our products, applications and services help customers across a wide range of industries to improve their products and processes.
We aim to achieve superior value for shareholders sustainably over the long term through delivering against our strategic objectives: strengthening our market positions through innovation, expanding our regional operations, building our presence in key strategic growth areas, growing our businesses (both organically and through acquisition), and focusing on operational excellence.
Our group philosophy is one of autonomy, with our operating companies entrusted and empowered to run and manage their businesses. We believe that establishing and maintaining an ethical culture is critical to supporting our business model and ensuring our continued business success and growth.
Central to our culture are our core values of Honesty, Empowerment, Ownership, Delivery and Speed, which underpin the way we work. These are part of our Code of Business Ethics, which provides a framework for how we do business and includes a clear policy on anti-bribery and corruption as well as dealings with customers, suppliers, colleagues, conflicts of interest and human rights.
cultuRE AND VAluES
Read more about our values in the
Spectris Code of Business Ethics at
www.spectris.com/corporate%20
responsibility.aspx
Find out more
Use your phone’s bar code app and go directly to the strategy page on our website.
Did you know?
Our barcode readers are used to decode and check the print quality and integrity of QR codes in industrial applications.

Spectris plc Annual Report and Accounts 2011 07
Busin
ess
Revi
ewG
over
nanc
eFi
nanc
ial S
tate
men
ts
21119.04 07/03/12 Proof 8
Powerful revenue growth driversOur products typically involve relatively low capital expenditure for customers, but provide a significant and rapid payback. Customer benefits include improving production efficiency, reducing downtime, eliminating wastage, reducing time to market, and ensuring compliance with safety, environmental and quality regulations. In addition, after-sales service and support is an important part of our business and over 25% of our revenue is derived from consumables and services.
Broad portfolio of customers and marketsWe have a broad spread of markets, products and customers, as shown on the following pages. This balance of geographical spread
and end user industries helps to limit the risks from any adverse changes in the political or economic environment and also enables us to manage foreign exchange rate fluctuations and purchasing trends better. We seek to grow our businesses around the world, with particular emphasis on industrialising markets such as China, India and Latin America.
Strong financial positionWe maintain a strong balance sheet, which gives us the flexibility to pursue our strategic objectives. We focus on cash generation and our target is to deliver high cash conversion of operating profit in each financial year.
AcquisitionsWe seek to enhance our growth potential by pursuing an active but disciplined approach
to acquisitions, both through the purchase of complementary companies (bolt-on acquisitions), and by building our presence in new growth areas via the acquisition of substantial new businesses which are compatible with our strategic profile (platform acquisitions).
Leading industry positionsAll of our businesses are leading players in niche markets, with strong brands and long-term customer relationships. Our experienced engineers work with customers to understand the business and productivity challenges they face. Much of our technology and applications know-how is proprietary and patent-protected, providing significant barriers to entry.
DRiViNG GRowth
Strong customer focusWe work closely with our customers to understand the challenges they face and develop solutions which are tailored to their specific requirements. We involve professional users in the design of new products, ensuring that we understand their needs and convert this knowledge into innovation in products and processes. We offer a full range of services for our products, including installation, training, technical support, calibration and maintenance.
Research and developmentResearch and development underpins our business strategy and we invest around 7% of sales each year in research and development in order to maintain our market-leading positions. Our commitment to constant innovation means that our products
incorporate the very latest in technology and, as a consequence, we own patents, trademarks and intellectual property licenses. As part of the process of bringing new products to market, we involve our customers extensively during the development phase and, through beta evaluations, prior to product launch.
EmployeesWe employ a highly skilled technical workforce in our offices around the world. Our entrepreneurial culture offers a creative working environment with scope for individual responsibility and achievement and we are committed to providing equal employment opportunities, competitive remuneration, and training and development programmes.
Product manufacturingWe focus on our core competencies of research and development, product design, and assembly and test, whilst outsourcing the majority of component and sub-assembly production to qualified suppliers. As a result, our businesses are capital efficient. Low cost sourcing initiatives by the group’s strategic purchasing teams help to drive down the costs of procurement whilst optimising quality and supply chain performance.
Best practice transferDespite the specific industry and technology focus of each of the businesses, considerable emphasis is placed on knowledge sharing across the group and the transfer of best practice. This can be especially valuable when entering new end user markets or geographical regions.
NuRtuRiNG iNNoVAtioN
Operating structureWe are organised in a way that combines the benefits of a multinational group whilst maintaining the entrepreneurial culture of our operating companies. Our decentralised operating structure is a key differentiator and the focus on accountability and ownership at local level ensures that management teams can focus on their priorities and react quickly to changing customer and market needs. Each business unit has responsibility for all aspects of its business and for developing, and meeting, its business growth plans. Within each business segment, each operating company has developed its own brands and sales and service channels, tailored to its target industrial markets.
Central to our approach is a lean group structure which, together with the Board, sets the strategy and drives and monitors its implementation. In addition, the centre provides knowledge, advice and selective support services such as legal, tax and treasury, mergers and acquisitions, emerging market infrastructure and best practice sharing among businesses.
Control frameworkThe group has developed a robust internal control framework in keeping with our operating model, values and culture. This comprises common policies, procedures, principles and processes and provides the minimum requirement for the controls the businesses should have in place. The Code of
Business Ethics provides additional guidance to employees on how we conduct business and is designed to ensure that all employees make decisions that are consistent with our values and that help us meet our many commitments.
Each operating company implements internal controls built off this central framework and consistent with the size and complexity of its business. The effectiveness of the internal control framework is routinely monitored through a combination of certification, self-assessment and a rolling programme of reviews by internal and external audit functions, complemented by a sound risk management process, as outlined on page 44.
SyStEMS AND coNtRolS

Spectris plc Annual Report and Accounts 201108
21119.04 07/03/12 Proof 8
Marketplace
We operate in niche markets across a diverse range of industries. Our products typically involve relatively low expenditure for customers but provide a significant and rapid payback.
We aim to build long-term relationships with our customers and work with them to understand their business and the productivity challenges they face.
6See Business Model
Examples of customer benefits achieved:
> Automotive manufacturer reduced noise testing times by 75% with sound analysis equipment
> Mineral processing company increased throughput by 60% with in-line particle size analyser
> Tissue manufacturer increased profitability by around £4 million and improved product quality by changing from steel blades to high-performance creping blades
> Product assembly process cut from overnight to just one minute using UV curing system
> Coin producer increased output by 20% using force measurement technology
> Animal feed producer generated additional production worth around €600,000 per year by continuous oil and moisture measurement
> Liquefied natural gas plant avoided catastrophic turbine failure using remote vibration monitoring to diagnose machine fault
> Research institute used X-ray analysis to develop new lithium ion rechargeable batteries with longer lifetimes and faster recharging capability
Customer benefits:
iMPRoViNG PRoDuctiVity AND EFFiciENcy
REDuciNG tiME to MARkEt
iMPRoViNG PRoDuct quAlity AND PERFoRMANcE
REDuciNG DowNtiME AND wAStAGE
ENSuRiNG coMPliANcE with SAFEty, quAlity AND ENViRoNMENtAl lEGiSlAtioN
hElPiNG to BRiNG NEw PRoDuctS to MARkEt
www.spectris.comRead more online at

Spectris plc Annual Report and Accounts 2011 09
Busin
ess
Revi
ewG
over
nanc
eFi
nanc
ial S
tate
men
ts
21119.04 07/03/12 Proof 8
2011 Sales by end user market% total group reported sales
1. Automotive and aerospace 12% 2. Metals, minerals and mining 11% 3. Pharmaceuticals, fine chemicals 10% 4. Academic research 9% 5. Machine building 9% 6. Pulp and paper 9% 7. Semicon, telecoms, electronics 9% 8. Energy and utilities 8% 9. Web, print and packaging 5%10. Environment 4%11. Other, incl. distribution 14%
1
2
3
4
56
7
8
9
1011
Spectris operates in a wide range of end user markets around the world. This balanced
portfolio of industries and geographies, where no end user market accounts for more
than 12% of sales, and no single customer accounts for more than 2% of sales,
provides a degree of resilience against material adverse economic trading conditions
in the countries in which we operate.
The majority of our sales come from upgrades to customers’ existing production
facilities, rather than the addition of new capacity. In addition to participating in the
growing markets of many of our customers, we also seek to identify opportunities in
new markets, for example nanotechnology and life sciences.
We aim to grow our businesses around the world, with particular emphasis on
industrialising markets, and establish sales and support facilities in these regions
so that we are able to support our global customers wherever they are based.
Under pressure to reduce costs yet develop ever more sophisticated vehicles, reducing development times, and thus time to market, is a key challenge for the automotive industry. The Renault Group in France are using Brüel & Kjær’s data acquisition system to analyse powertrain noise (from the engine, transmission, drive shaft, suspension and wheels) in order to meet vehicle regulations and legislation and also customer expectations. Brüel & Kjær’s solution has provided greater test efficiency and reduced the time spent on characterising a complete powertrain from five days to just one to two days.
Case study
Brüel & Kjær helps Renault to reduce testing times

Spectris plc Annual Report and Accounts 201110
21119.04 07/03/12 Proof 8
Acquisition Strategy
Acquisitions are a central part of Spectris’ strategy, with all but one of the companies currently owned by Spectris having been acquired since the company was first floated on the London Stock Exchange in 1988.
Over this period, our portfolio has undergone a significant evolution into today’s group of 14 specialised, market-leading instrumentation, controls and process technology companies operating globally in diverse industrial markets.
ImplementatIon IntegratIon
rese
archCultural Fit
Due Diligen
ceStriking Deals
Objective
The objective of our acquisition strategy is to
create shareholder value by growing and
enhancing existing businesses through the
purchase of complementary companies,
referred to as bolt-on acquisitions, and by
building our presence in new growth areas via
the acquisition of substantial new businesses
which are compatible with our strategic profile.
The latter category are referred to as platform
acquisitions. Whether we are looking at a
bolt-on or a platform opportunity, an
acquisition candidate must exhibit the same
characteristics and fundamental business
strengths that exist in our current businesses
and which underpin our group:
> Productivity-enhancing instrumentation
and controls for industrial and academic
customers based on specialised technology
and superior application knowledge.
> Focus on critical applications with direct
impact on the customer’s process
performance, energy consumption, asset
utilisation, quality, product performance or
other value-enhancing parameters.
> High margins reflecting significant value
added for the customer.
> Emphasis on products and services whose
cost is small within the overall cost of the
customer’s application.
> Proven ability to grow the market and
capitalise on growth markets.
> Substantial aftermarket revenues and/or
service component.
> Strong, entrepreneurial management able
to capitalise on Spectris’ operating culture
which stresses empowerment, responsibility
and autonomy for our businesses.
In recent years, bolt-on acquisitions have been
the most frequent type of acquisition, with four
to five such deals typically completed each year,
and we expect this pattern to continue. By their
nature, platform acquisition opportunities
which have the necessary business
characteristics and are substantial enough to be
a worthwhile new growth platform for Spectris
arise infrequently, although we completed one
such acquisition, of Omega Engineering, during
the year. Spectris identifies potential acquisition
opportunities from many sources and we
regularly acquire businesses from private
owners, other corporations and financial
owners such as private equity and venture
capital institutions.
Bolt-on acquisitions
Bolt-on acquisitions typically provide growth
opportunities, bring additional technology,
applications, routes to market or geographic
presence to one of our companies and can take
the form of an acquisition of an entire business,
the purchase of a product line, the purchase of
intellectual property, or anything in between. As
a result, our bolt-on acquisitions vary greatly in
size from the very small up to the purchase of
substantial businesses valued up to £50 million
or more. Whatever the size of the acquisition,
Spectris’ approach is always to build upon a
proven, successful business or a technology
with demonstrated potential.
Our approach to creating value from bolt-on
acquisitions is similarly focused on recognising
and creating opportunities arising from the
acquired business having a complementary
or adjacent nature to one of our existing
businesses. Manufacturing consolidation and
cost-cutting initiatives, while not overlooked,
are generally of secondary importance to the
growth aspects in any bolt-on acquisition.
Instead, we look to integrate the acquired
business with an existing company whilst
retaining the strengths of both.
As an illustration of how we add value, it is
quite common for innovative, technology-led
Stage 2 proCeSSIng
Stage 3 ImplementatIon anD IntegratIon
Stage 1 reSearChIng opportunItIeS

Spectris plc Annual Report and Accounts 2011 11
Busin
ess
Revi
ewG
over
nanc
eFi
nanc
ial S
tate
men
ts
21119.04 07/03/12 Proof 8
LDS Test and Measurement was acquired from SPX Corporation in December 2008 for a consideration of $86 million (on a debt and cash-free basis). The company is a leading provider of electro-dynamic vibration test systems for the automotive, aerospace, defence, and electronics markets, and of data acquisition products.
The data acquisition and instrumentation products became part of HBM, extending their range of testing applications and generating new sales opportunities for HBM. The vibration and controller products became part of Brüel & Kjær Sound & Vibration and the Royston, England, based company has now been integrated and renamed the Vibration Testing Systems business unit. The company’s products are used in the most demanding applications, from laboratory testing and structural analysis through to testing of complete systems. As a result of the acquisition, Brüel & Kjær are now able to offer complete vibration, acoustic and data acquisition and analysis solutions to their customers. Since the acquisition, a number of contracts have been secured with major aerospace manufacturers for complete system solutions, for example for satellite testing, and with automotive manufacturers where the systems are used, for example, to test hybrid vehicle batteries.
Case study
LDS Test and Measurement
On 30 September 2011, we completed the acquisition of the Omega Engineering business for a total consideration of US$485 million (approximately £311 million). Formerly privately owned, the company is headquartered in Stamford, Connecticut, USA, has five manufacturing facilities and two distribution/sales facilities and employs around 700 people. Omega is now a stand-alone business in the Industrial Controls segment.
Omega is a leading provider of sensors and controls for industrial testing and measurement applications, for controlling temperature, humidity, pressure, strain, force, flow, level, pH and conductivity. The company has a highly successful, defensible business model tailored to the needs of well-defined portions of the process control and industrial automation sectors. With strong, well-known brands (Omega and Newport), a loyal blue chip customer base, a broad intellectual property portfolio and high levels of repeat business, Omega has resilient revenue and earnings characteristics. The company is an excellent strategic and cultural fit for Spectris and a significant expansion of the product offering in the Industrial Controls segment and is expected to bring growth and margin opportunities under Spectris’ ownership.
Since the acquisition was completed, an experienced president has been appointed, financial reporting processes have been upgraded, efforts are underway to benefit from sales opportunities with other Spectris companies (Omega already sells some Spectris group products) and opportunities in the supply chain are being pursued. The majority of Omega’s sales are to the US domestic market currently and actions have already been initiated to grow sales in international markets, particularly China and Europe.
Case study
Omega Engineering
industrial instrumentation companies to achieve
success on a national or perhaps regional scale
but run out of momentum when faced with
the multiple challenges and investment
requirements of becoming a global business.
We are able to address these challenges, in
many cases by exploiting existing infrastructure
and sales channels within Spectris, and rapidly
take such businesses to a new level, thus
creating growth and value for our shareholders
while preserving the qualities of the business
that made it successful in the first place. There
are many other ways in which we can benefit
from bolt-on acquisitions but, in general,
we create value from bolt-ons by applying
our resources, routes to market, customer
relationships, application knowledge,
management expertise and global presence
to the acquired business to achieve superior
results.
Platform acquisitions
In addition to making regular bolt-on
acquisitions, Spectris will occasionally identify
an opportunity to acquire a much larger
business which provides productivity-enhancing
products and services to industrial customers
and which fits the strategic profile outlined
above. However, to qualify as a viable platform
acquisition, there also must be a significant
opportunity for Spectris to add value to such a
business so we will look for potential to develop
the business organically and to add value
through subsequent bolt-on acquisitions. Any
acquisition of this type is likely to be stand-
alone in nature with the business becoming a
new company within our portfolio rather than
being integrated into an existing company.
Adding value to a platform acquisition can be
achieved in a variety of ways, some of which,
such as accelerated internationalisation and
developing existing customer and industry
relationships, are akin to the opportunities we
see on bolt-ons but on a larger scale, while
other value-creating opportunities commonly
derive from our focus on operational excellence
and strengthening market positions through
innovation in keeping with our overall strategy.

Spectris plc Annual Report and Accounts 201112
21119.04 07/03/12 Proof 8
Strategy and Objectives
Our objective is to deliver shareholder value sustainably over the long term by supplying productivity-enhancing solutions for our customers.
www.spectris.comRead more online at
Our strategy Achievements
Strengthening market
positions through
innovation
We invest around 7% of sales each year in research and development in order to maintain our market-leading positions. We work closely with customers to develop solutions which are tailored to their specific requirements. Much of our technology is proprietary and protected by patents or process know-how. New products and applications may be developed in house, by acquiring bolt-on product lines or by collaboration and licensing agreements for proprietary technology in partnership with universities and other institutions.
> Expenditure on research and development grew by 17% to £75.8 million, or 7% of sales.
> Significant number of new products, applications and technologies introduced throughout the group. Amongst these is the award-winning Mastersizer 3000 particle size analyser, featuring highly sophisticated optics to simplify and automate particle sizing, and whose compact benchtop design is the product of extensive customer research. Also the recipient of an award is the new BT55 series of optical brightness transmitters. These feature an innovative light-emitting system for monitoring and controlling the pulp process and enable papermakers to rapidly improve their process and significantly reduce costs.
Increasing regional
expansion with a focus on
emerging markets
page 2See Group overview
We seek to grow our businesses around the world, with particular emphasis on industrialising markets such as China, India and Latin America. We continue to establish sales and group support facilities in these regions so that we are able to support our global customers wherever they are based.
> On a like-for-like basis, sales to China grew by 27% and sales to Latin America grew by 28%.
> New systems engineering centre opened in Mumbai, India.
> Additional regional office opened in Zibo, central Shandong province, China.
Growing existing
businesses through
acquisition
We seek to enhance the growth potential of our businesses by pursuing an active but disciplined approach to acquisitions, focusing on businesses which are strong players in specific application areas where there are significant barriers to entry.
> Invested £66.4 million (including cash acquired of £5.1 million) in three bolt-on acquisitions:
– A small product line addition to the Materials Analysis segment.
– IRM Group, a leading manufacturer of high technology measuring systems for the metals processing industry.
– Sixnet, a leading manufacturer of flexible industrial Ethernet switch, automation and
wireless solutions for the industrial market.
Building our presence
in key strategic growth
areas, both organically
and through acquisition
page 11See case study
We aim to grow our existing businesses organically by developing new products as well as pursuing opportunities for growth in new markets, such as nanotechnology and life sciences. Acquisitions are targeted at both existing and new markets.
> Product development programmes focused on building positions in our key market segments.
> Acquisition of Omega Engineering, a leading provider of sensors and controls for industrial testing and measurement applications, adds a significant strategic growth platform to our Industrial Controls segment.
> Aftersales, service and consumables are an important part of our business, representing 26% of sales.
Focusing on
operational excellence
We continue to focus on improving all aspects of our business through a range of actions including: process efficiencies, value pricing, optimising the business mix, cost competitiveness, designing products for low-cost production, reducing inventory and improving supply chain management.
> Components sourced or manufactured in lower-cost countries increased to approx. 14% of the total cost of materials for goods sold.
> Implementation of ERP system at our BTG operation.
> Opening of state-of-the-art manufacturing facility in Eindhoven, The Netherlands, for X-ray tube manufacture.

Spectris plc Annual Report and Accounts 2011 13
Busin
ess
Revi
ewG
over
nanc
eFi
nanc
ial S
tate
men
ts
21119.04 07/03/12 Proof 8
Key Performance Indicators
We monitor progress against the delivery of our strategic goals via four financial key performance indicators.
Sales
2011
+23%
2011
+15%
2010
+15%
2010
+12%
20090%
2009
-16%
2008
+19%
2008
+3%
2007
+3%
2007
+6%
Sales growth is a measure of how we are growing our business organically. We aim to achieve year-on-year growth in sales, on a like-for-like basis, which excludes the effects of currency translation and acquisitions or divestments.
cash conversion
total sales growth, continuing businesses
organic sales growth, continuing businesses, at constant currencies
2011
89%
2010
112%
2009
133%
2008
86%
2007
99%
We focus on cash generation and use cash conversion as a performance measure as we believe cash represents an effective measure of the quality of our earnings. Our target is to deliver high cash conversion of operating profit in each financial year. Cash conversion is defined by management as adjusted operating cash flow as a percentage of adjusted operating profit.
Return on sales
2011
18.2%
2010
15.8%
2009
10.1%
2008
15.0%
2007
15.8%
Return on sales is a measure of improving profitability in our business. Return on sales is defined as adjusted operating profit as a percentage of sales. Our intention is to achieve a mid-teens return on sales margin on average throughout the cycle.
Earnings per share
Non-financial kPis
2011
124.1p
2011
+43%
2010
86.6p
2010
+91%
2009
45.4p
2009
-38%
2008
72.8p
2008
+25%
2007
58.1p
2007
+33%
Earnings per share is a commonly used measure of financial performance for shareholders. We aim to achieve growth in adjusted earnings per share. Adjusted earnings excludes certain non-operational items as defined by management in Note 3. Adjusted earnings per share is defined as the ratio of adjusted earnings for the year to the weighted average number of ordinary shares outstanding during the year.
To measure the critical components of our Corporate Responsibility strategy, we have adopted the following key performance indicators. These are described in more detail in the Corporate Responsibility report on pages 32 to 37.
NB. Acquisitions are excluded in the year of acquisition1 Work-related accidents/ill health resulting in lost time in excess of 3 days
Adjusted EPS (pence)cash conversion
2011
65.6
2011
2.7
2010
92.8
2010
5.3
Accident incident RateReportable accidents1 per 1,000 employees
Growth (%)
Return on sales, continuing businesses
Energy consumption Mwh per £m revenue

Spectris plc Annual Report and Accounts 201114
21119.04 07/03/12 Proof 8
Principal Risks and Uncertainties
Risk description Potential impact Mitigation
1. Strengthening market positions through innovationNew product developmentIn order to strengthen our market positions and sustain competitive advantage, the group invests significantly in research and development. The development of new technologies and products involves risk including:
> The product being more expensive or taking longer to develop than originally planned
> The market for the product being smaller than originally envisaged
> The product failing to reach the production phase
> Reduced profitability and cash flow
> Loss of market share
> Failure to recoup investment in innovation
> Significant investment levels in research and development, maintained at around 7% of sales
> Project management disciplines are applied in product development programmes
> Working closely with customers to ensure that we develop solutions tailored to their specific needs
> New product developments are based on standard platforms, customised through high added-value applications engineering
> Extensive customer involvement during product development and prior to product launch (through beta evaluations)
Intellectual propertyOur business is focused on the design and manufacture of technologically advanced products and applications. Significant investment in research and development is made towards this end. As a consequence, we own and protect patents, trademarks, trade secrets, copyright information and intellectual property licenses.
The risk therefore exists that this intellectual property may be infringed by third parties or that we may inadvertently infringe third-party rights.
> Reduced profitability and cash flow
> Loss of market share
> Failure to recoup investment in innovation
> Procedures in place requiring all of our businesses to:
– maintain a watching brief on new applications
– undertake specific reviews prior to commencing new product development, acquisitions or licenses
– register intellectual property where appropriate
> Maintain a portfolio of intellectual property assets such that no single patent, trade secret or trademark is sufficiently important to present a material risk to the success of the company
2. Increasing regional expansion with a focus on emerging marketsPolitical and economic risksWe operate in a range of end user markets around the world and may be affected by political, economic or regulatory developments in any of these countries. Material adverse changes in the political and economic environments in the countries in which we operate have the potential to put at risk our ability to carry out our strategy.
Specifically, the group has reviewed its potential exposures to the current macro-economic uncertainty relating to the Eurozone economies. We believe that the broad spread of markets in which we operate substantially limits the risk associated with additional instability in any given territory. Whilst the group had sales into Europe of approximately £381 million in 2011 (34% of total group sales), sales into Greece, Ireland, Italy, Portugal and Spain represented just 5% of total sales for the year (approximately £57 million). The group does not have any significant operations or supply chain dependencies within these countries. Similarly, the group does not have any significant liquidity or funding risk in relation to these countries.
> Reduced profitability and cash flow
> Maintaining a broad spread of markets, products and customers limits risks associated with any given territory
> Ensure we remain structured in such a way that enables us to take prompt action in the event of any material change in the trading environment
> Monitor market intelligence
> Ensure we maintain a strong balance sheet and financial position
Laws and regulationsWe operate in a large number of jurisdictions and, as a consequence, we are subject to numerous domestic and international regulations and restrictions. These include laws and regulations covering product safety, export controls, anti-bribery, competition and false accounting.
Any failure by the group or its representatives to comply with relevant laws and regulations could result in civil or criminal liabilities leading to significant fines and penalties or the disqualification of the group from participation in government-related contracts for a period of time. In the event of a failure to comply with export control regulations, the group could also be exposed to restrictions being placed upon its ability to trade.
> Reduced sales, profitability and cash flow
> Reputational damage
> Diversion of management resources to address any resulting investigation
> Strong internal control framework, policies and culture
> Formal export controls compliance procedures in place, including strict product classification and transaction screening protocols
> Ethics training provided to all employees
> Regular monitoring of compliance
The group has a well-established process for identifying, evaluating and managing significant risks which forms a part of the group’s system of internal controls as described in the Directors’ Report on page 44.

Spectris plc Annual Report and Accounts 2011 15
Busin
ess
Revi
ewG
over
nanc
eFi
nanc
ial S
tate
men
ts
21119.04 07/03/12 Proof 8
Risk description Potential impact Mitigation
3. Growing existing businesses through acquisitionAcquisitionsA key element of our strategy is to grow the business portfolio through acquisition of stand-alone or bolt-on businesses which complement or extend the range of products and applications we can provide.
Integrating both the operations and personnel of acquired businesses can be a complex process. Potential risks therefore exist that the planned benefits from the acquisition may not be achieved as a result of problems encountered in integrating the acquired business, incorrect assumptions in the original business case, changing market conditions or deficiencies arising in the due diligence process. Further, the company could be exposed to past acts or omissions of the acquired business.
> Failure to achieve the benefits outlined in the business case
> Reduced profitability and cash flow
> Unforeseen liabilities
> Rigorous financial and legal assessment of target businesses
> Strict authority levels which, subject to size, involve review by the Board for such transactions
> Comprehensive representations and warranties in purchase agreements
> Extensive integration planning and execution
> Regular review against the business case for the acquired businesses
> Post-acquisition control reviews
4. Building our presence in key strategic growth areas, both organically and through acquisitionCompetitive activityThe nature of the marketplaces in which we operate means that all of our businesses are exposed to risk from competitor activity.
> Loss of market share
> Reduced profitability and cash flow
> Maintain market-leading positions through significant investment in research and development
> Diversified portfolio of products and markets limits the overall risk from any single competitor
> Maintain ability to react quickly to changes in customer and market demand
> Maintain a watching brief on new competitor activity
5. Focusing on operational excellenceSupply chain dependencies and disruptionThe company is exposed to the risk that some of the components it sources, particularly for custom-built items or older components, are provided by a single supplier and are therefore vulnerable to interruption of supply.
The company also manufactures components, from proprietary technologies, at a number of locations. Our ability to supply products to our customers could be adversely impacted by a disaster or other disruptive event at any of these sites.
Any interruption to the company’s supplies or related increase in costs may result in an adverse effect on the business’ financial position and future performance.
> Inability to fulfil customer orders resulting in lost sales and reputational damage
> Increased costs reduce profitability
> Loss of market share
> Strategic sourcing teams source lower-cost components across a range of markets
> Alternative sources of supply actively sought to reduce dependency upon single-source suppliers
> Safety stock levels established for critical components
> Business continuity plans and disaster prevention measures in place for all material manufacturing locations
> Business interruption insurance
> Strong contract review process
Fluctuations in exchange ratesBecause of the global nature of our business, we have operations which sell and purchase goods in foreign currencies and whose results we record in a variety of different currencies. We are therefore exposed to any significant changes in exchange rates between a number of different currencies.
> Unexpected variations in the company’s results
> Reduced profitability and cash flow
> Forward contracts cover up to 75% of forecast exposures up to 18 months ahead
> Natural hedging strategy, matching invoicing and purchasing currencies where practical
> Foreign currency investments hedged with borrowings in the same currency wherever possible
> Regular sensitivity analyses carried out to understand the impact of exchange rate movements on the group’s reporting
All significant risks are evaluated with reference to the group’s achievement of its strategic objectives as outlined on page 12. The key potential risks and uncertainties facing the group’s ability to deliver its strategy, together with mitigating actions, are described below.

Spectris plc Annual Report and Accounts 201116
21119.04 07/03/12 Proof 8
Chairman’s Statement
Dear Shareholder,
Spectris saw strong trading in 2011, with sales and
operating profit at record levels, building on the
momentum generated over the past few years, as
investment in new products, acquisitions and regional
expansion has continued to drive our business
growth. Our acquisition initiatives also continued,
with the addition of the Omega Engineering business
being a particular highlight. This adds a significant
strategic growth platform for our Industrial Controls
segment.
Reported sales increased by 23% to £1,106.2 million
(2010: £901.9 million) and adjusted operating profit*
grew by 42% to £201.5 million (2010: £142.1
million). Acquisitions contributed 7% to sales and
currency had a positive impact of 1%. Thus, on a
constant currency organic (like-for-like) basis, sales
grew by 15%. On a pro-forma basis, had each of the
four acquisitions taken place on the first day of the
year, sales would have been £1,218.2 million.
Operating margins increased by 2.4 percentage
points to 18.2%. Profit before tax increased by 45%
to £191.6 million (2010: £132.3 million) and earnings
per share increased by 43% from 86.6 pence to
124.1 pence.
During the year, the group invested £372.1 million in
acquisitions and net debt increased by £270.0 million
to £356.2 million at the end of December 2011.
At 31 December 2011, the group had cash of
£41.6 million and undrawn committed facilities
of £104.2 million.
The Board is proposing to pay a final dividend of 25.4
pence (2010: 20.9 pence), which, combined with the
interim dividend of 8.2 pence, gives a total for the
year of 33.6 pence (2010: 28.0 pence), an increase
of 20%. The dividend is covered 3.7 times. This is
consistent with our policy of making progressive
dividend payments based upon affordability and
sustainability. The dividend will be paid on 26 June
2012 to shareholders on the register at the close of
business on 1 June 2012.
Corporate governance
As a board, we are responsible to the company’s
shareholders for delivering shareholder value
sustainably over the long term through effective
management and good governance. We believe
that a robust discussion focused on the critical
strategic issues and risks is key to achieving these
aims and we are fortunate to have non-executive
directors with extensive industry and international
experience who can actively contribute to this
debate. The Board also seeks to develop and
maintain a good understanding of the company’s
operations by conducting site visits to two
locations each year in addition to inviting our
presidents and managing directors to present at
other meetings. We plan to recruit a further
non-executive director during 2012. We recognise
the benefits that diversity can bring to our business
and this will be a key element of the selection
process.
I am pleased to confirm that Spectris is in full
compliance with the UK Corporate Governance
Code. An evaluation of our Board in 2010 by
external consultants confirmed the effectiveness of
our governance processes in most dimensions,
John Hughes
Chairman
We are very pleased with our performance in 2011. The progress we made on all aspects of our strategy was fundamental to delivering these results.
33.6pDividend up 20%
£1,106.2mSales up 23%

Spectris plc Annual Report and Accounts 2011 17
Busin
ess
Revi
ewG
over
nanc
eFi
nanc
ial S
tate
men
ts
21119.04 07/03/12 Proof 8
with some recommendations for expanding the
terms of reference for Board committees. These
have now been updated, most notably in the case
of the audit and risk committee which now more
formally includes a review of the group’s risk
management processes and controls. The Board
committees are described more fully in the
Corporate Governance section of our annual report
and their terms of reference are available on our
website. In 2011, an internal assessment of the
Board by all members confirmed support for the
Board’s role, culture and policies.
Outlook
We are very pleased with our performance in 2011.
The progress we made on all aspects of our strategy
was fundamental to delivering these results. Whilst the
current macro-economic outlook remains uncertain,
the Board is confident that, as a result of continued
investment in new products and applications, together
with the growth opportunities and resilience which
our recent acquisitions provide, Spectris is strategically
well positioned for the year ahead.
John Hughes
Chairman
* Unless stated otherwise, figures
quoted for operating profit, net
interest, profit before tax, tax,
earnings per share and operating
cash flow are adjusted measures –
for explanation of adjusted figures
and reconciliation to the statutory
reported figures see Note 3.

Spectris plc Annual Report and Accounts 201118
21119.04 07/03/12 Proof 8
Chief Executive’s Review
Trading in 2011 was strong across all business
segments, regions and most end markets, resulting in
record sales and operating profit. On a reported basis,
sales for the year were 23% higher than in 2010.
Acquisitions contributed 7% and currency 1%,
resulting in constant currency organic (like-for-like)
sales growth of 15%.
Regionally, sales in Asia Pacific in the year grew by
17% on a like-for-like basis, with continued strength
in China, where sales increased by 27%. North
America grew by 14% and Europe was up by 13%.
Aftersales, service and consumables, which are an
important part of our business and provide a large
degree of resilience, represented 26% of total
group sales.
Adjusted operating margin, at 18.2%, is 2.4pp higher
than in 2010, as a result of the growth in sales and
continuing good cost control across our businesses,
with gross margins increasing by 0.2pp to 58.6%.
Cash conversion was in line with our expectations,
with 89% of operating profit converted into
operating cash. Capital expenditure increased
during the year, mainly due to an investment in
The Netherlands, where we opened a new state-
of-the-art manufacturing facility.
Strategy
We made significant progress on our strategy during
the year. Some of the highlights are illustrated below:
Strengthening market positions through
innovation
We maintained our investment in research and
development, with expenditure at £75.8 million, or
7% of sales, and we launched a number of new
products, technologies and applications across
the group, which are described in more detail in
the Operating Review which follows. Notable
amongst these was the Mastersizer 3000 particle
characterisation system from our Materials Analysis
segment, launched in September. This combines the
highest optical performance with intelligent software,
providing greater analysis capabilities in a compact,
sleekly-designed benchtop instrument. The system
has been received enthusiastically by customers and
has already won a major design award.
Increasing regional expansion with a focus on
emerging markets
Sales to Asia increased by 17% compared with the
prior year on a like-for-like basis. At 33% of total
group sales, this region is now a similar size to
Europe. In response to the continued growth in
demand, during the year Malvern Instruments
opened an additional regional sales office in central
Shandong province, China, and Beta LaserMike
established a direct sales operation in south-east Asia.
The acquisition of the industrial business of Sysmex in
the fourth quarter of 2010 has provided us with a
direct sales presence for materials analysis systems in
Japan and improved our market position there.
Building our presence in key strategic growth
areas, both organically and through acquisition
The acquisition of Omega Engineering at the end of
September 2011 represents a strategic platform for
growth within the Industrial Controls segment, which
now represents around 18% of total group sales on a
pro-forma basis. Integration of the business into the
Industrial Controls segment is proceeding well and
results for the first three months of ownership have
exceeded our expectations.
John O’Higgins
Chief Executive
We maintained our investment in research and development, with expenditure at 7% of sales, and launched a number of new products, technologies and applications across the group.
27%Increase in sales to China
£75.8mExpenditure on R&D up 17%

Spectris plc Annual Report and Accounts 2011 19
Busin
ess
Revi
ewG
over
nanc
eFi
nanc
ial S
tate
men
ts
21119.04 07/03/12 Proof 8
Growing existing businesses through acquisition
We made three bolt-on acquisitions during 2011. The
acquisition of IRM in August extends our gauging
product capabilities in the metals processing market
and the acquisition of Sixnet in October expands our
position in the industrial networking market. We also
acquired key intellectual property and other assets
relating to a line of benchtop X-ray analysers for the
Materials Analysis segment in October. The bolt-on
acquisitions made in 2010 have been successfully
integrated into the business and made a good
contribution in 2011.
In the Test and Measurement segment, the acquisitions
of nCode, LDS and Lochard, completed in 2008 and
2009, have accelerated sales in the automotive,
aerospace and environmental monitoring markets.
Together with the efficiencies achieved following the
integration of these businesses, this has resulted in a
return on sales for the segment of 15.8%.
Focusing on operational excellence
Initiatives to improve operational efficiency across
the group continued to deliver benefits. Our strategic
sourcing teams made excellent progress in the year
and the value of items sourced or manufactured in
lower-cost countries, principally Asia and Eastern
Europe, has now increased to approximately 14%
of the total spend on materials in cost of goods
sold (2010: 11%). We completed two significant
investments in 2011 to improve operational
efficiency: the first phase of a new enterprise resource
planning (ERP) system at our BTG business, which will
bring greater integration of all operational aspects
of the business into a single management system,
and a state-of-the-art manufacturing facility for our
PANalytical business in Eindhoven, The Netherlands,
which will bring greater efficiency to the production
of X-ray tubes. These investments, together with
many smaller projects across all of our operations,
ensure that our focus on the manufacture and supply
of critical components and products is done to the
highest levels of quality and efficiency.
John O’Higgins
Chief Executive

Spectris plc Annual Report and Accounts 201120
21119.04 07/03/12 Proof 8
Operating Review
Overview
Materials Analysis provides a range of analytical
instrumentation to the metals and mining,
pharmaceutical and fine chemicals and electronics
industries, and also to academic and research
institutions. Our products help customers to improve
accuracy and speed of materials analysis in the
laboratory and in process quality control. The
operating companies in this segment are Malvern
Instruments, PANalytical and Particle Measuring
Systems.
Segment performance
The metals, minerals and mining sector, the largest
end user market for this segment, recovered strongly
in 2011. Large investments by mining companies in
Australia, South Africa and Brazil all resulted in strong
orders for our X-ray analysis equipment. We also
saw particular interest in applications for analysing
precious metals and rare earth elements. The strategic
alliance established in 2010 with French company
Sodern, a subsidiary of the EADS group, to distribute
their neutron-based cross-belt analysers made good
progress and 2011 saw the first orders for a number
of these systems. These analysers are used in the
cement, minerals and coal industries for real-time
characterisation of raw materials and complement
the X-ray spectrometers PANalytical supplies to these
customers.
We saw good growth in sales to the pharmaceutical
sector, both for research into new drugs and in
response to stricter regulation and quality control
during drug manufacture. A Chinese pharmaceutical
research customer purchased our new X-ray research
platform, Empyrean, for analysing the active
ingredients in tablets in order to optimise drug
formulation. This is the first Empyrean system to be
installed in China for this application. We saw good
sales of our pharmaceutical facility monitoring
systems, particularly in North America and China.
These systems are used to monitor contamination
within sterile environments, thus ensuring the drug
is manufactured according to national safety
regulations.
Sales to the academic sector and to research
institutions worldwide were resilient. This was helped
by Latin America and China, where government
emphasis on increasing academic leadership and
development of the high technology sector resulted
in increased funding for research laboratories. Our
new X-ray research platform, Empyrean, launched
in 2010, continues to be well received by customers
and won an award for the best technology
innovations in 2011 from R&D Magazine. In a further
commendation, Malvern Instruments received the
2011 Queen’s Award for Enterprise in the category
of International Trade. This is the second year in
succession that the company has won a Queen’s
Award (the 2010 award was in the category of
Innovation, for the development of the Zetasizer
Nano particle characterisation system).
Materials Analysis
Highlights
> Strong recovery in metals and mining
> Demand from pharmaceutical market driven by new drug research and regulatory enforcement
> Academic/R&D markets strong, helped by initiatives in emerging markets to invest in academic leadership
> New facility opened for X-ray tube manufacture
£60.9mOperating profit up 54%
18.1%Return on sales up 3.6pp
£337.5mSales up 24%

Spectris plc Annual Report and Accounts 2011 21
Busin
ess
Revi
ewG
over
nanc
eFi
nanc
ial S
tate
men
ts
21119.04 07/03/12 Proof 8
Steadily increasing demand for our X-ray tubes
resulted in projected production capacity limitations
and in September we opened a new state-of-the-art
manufacturing facility in Eindhoven, The Netherlands,
for these critical components of our X-ray
instruments.
Segment outlook
The metals, minerals and mining sector has recovered
from the slowdown of 2009–2010, and we expect
investment to continue due to ongoing demand from
emerging markets where infrastructure projects are
driving expenditure for construction-related sectors.
Academic research in emerging markets will continue
to grow as these countries seek to increase the
number and quality of academic institutions.
Research into new drugs and stricter enforcement
of regulations on their manufacture are likely to
continue to drive demand for our products from the
pharmaceutical industry.
The Korea Electronics Technology Institute (KETI) is a government body leading research into electronics for Korean companies such as Samsung SDI. One key project is to develop a new lithium ion rechargeable battery to provide more powerful and lighter power cells for devices such as mobile phones, laptops, and electric cars. The research involves adding different materials such as iron or manganese to the existing lithium cobalt oxide technology to improve the performance of the battery. KETI used PANalytical’s Empyrean X-ray diffraction system to study changes in the size and structure of crystals inside the battery cell as the quantities of iron and manganese were adjusted. The result was a rechargeable battery with improved lifetime, superior charge/discharge cycling and low discharge losses.
Case study
PANalytical helps KETI to develop longer-life batteries

Spectris plc Annual Report and Accounts 201122
21119.04 07/03/12 Proof 8
Operating Review continued
Overview
Test and Measurement supplies test, measurement
and analysis equipment and software for product
design optimisation, manufacturing control, and
environmental monitoring systems. Markets are
principally the aerospace, automotive and consumer
electronics industries. For customers in the
automotive and aerospace industries, our products
and applications help them to design and test new
products whilst reducing time to market. In consumer
electronics, our equipment and software enable
customers to refine the performance and accuracy
of their products. In the environmental monitoring
market, the desire for higher standards of community
comfort is driving increasing demand. The operating
companies in this segment are Brüel & Kjær Sound &
Vibration and HBM.
Segment performance
The automotive market, a key end user market for
this segment, continued to recover. One area of
increasing R&D focus is electric cars and we received
an order from a major manufacturer of high
performance electric cars for torque transducers and
data acquisition equipment to test certain drivetrain
components. We also received an order for our data
acquisition system for endurance testing of tyres for
passenger cars and light trucks for a major Korean
tyre manufacturer. Our systems are used to measure
the internal pressure of the tyre, the loading force
and the speed of rotation in durability tests. Demand
was strong for our noise analysis instrumentation for
noise source identification both for customer comfort
and for certifying compliance with noise emission
regulations. We have also seen significant interest in
our noise evaluation technologies from high speed
train manufacturers.
Sales to the aerospace market grew strongly. In
China, significant investments in the aerospace
industry resulted in good demand for our data
acquisition products and we received key orders for
structural testing of aircraft materials and landing
gear for a new narrow-body commercial airliner. Our
products are also used for satellite launch simulation
and qualification testing and at the beginning of the
year, we received an important order from INPE, the
National Institute for Space Research in Brazil, for
satellite vibration and shock testing.
Consumer demand for electronic items such as smart
phones and tablet computers, and the requirement
for improved audio quality of these devices, has
resulted in manufacturers increasingly adding
in-line testing of components to end-of-line testing.
In response, we have adapted our acoustic and
vibration testing solutions, originally designed for
R&D applications, for use on production lines.
Furthermore, the increased use of voice control
technologies in communication and entertainment
systems has led to increased sales of our voice quality
evaluation systems.
Our environmental monitoring service business
continued to grow in the traditional airport noise
monitoring market, and we received new orders
from airports around the world as well as renewal
contracts for existing customers, including London’s
Heathrow and Stansted airports. New applications
for this business in mining and construction are also
proving particularly successful. We signed a number
of contracts for noise monitoring systems, including
the Crossrail infrastructure project for a new rail link
across London. Since much of the construction work
will take place in highly built-up areas, with night
work required in some instances, noise compliance is
a critical consideration for the building contractors.
Test and Measurement
Highlights
> Good demand from automotive market; new project wins for noise analysis and torque measurement
> New aerospace projects for structural testing of materials in China and vibration testing for satellites in Brazil
> Successful expansion of noise monitoring services into new applications
> Good progress in other markets, e.g. consumer electronics, power
£54.7mOperating profit up 57%
15.8%Return on sales up 4.1pp
£346.9mSales up 17%

Spectris plc Annual Report and Accounts 2011 23
Busin
ess
Revi
ewG
over
nanc
eFi
nanc
ial S
tate
men
ts
21119.04 07/03/12 Proof 8
In the power sector, our solutions are finding
increasing application in a number of areas. Growing
demand for electrical power and new energy sources
has necessitated expansion of the power grid and the
replacement of ageing power infrastructure in many
countries. We have seen steady demand for our
test and measurement solutions from a number of
customers for both component manufacture and
independent testing of equipment such as circuit
breakers, contactors and transformers. The Genesis
HighSpeed family of high-power measurement
products is ideally suited to applications in the power
industry and provides enhanced test capabilities in full
compliance with all relevant international standards.
For example, this product is being used at the
Kennedy Space Center in Florida to identify where
any damage may have occurred following lightning
strikes. Our data acquisition systems are also used
in the wind energy market and a wind turbine
manufacturer in China purchased our high capacity
torque transducers for testing gearboxes, generators
and main bearings in the design of a large off-shore
wind turbine. We also supply noise monitoring
equipment to measure the noise produced by wind
turbines and their component parts to ensure that
they meet regulation on noise levels which applies
in many countries. 2011 saw the sale of the first
commercial ground-based system with more than
100 microphones for noise source identification
of wind turbines. This technology is also used to
optimise new designs aimed at lowering noise levels
from the blades.
Segment outlook
The automotive sector is showing good growth
as new research programmes are established,
particularly in Asia, as well as further development
of vehicles such as hybrid and electric cars. New
aerospace programmes provide opportunities for
growth, and as these become more complex, our
products will remain in demand for applications such
as materials and structural integrity testing of aircraft
and, increasingly, satellites. Our products are also
increasingly being used for test and measurement
applications in other industry sectors such as
consumer electronics, energy and rail. Environmental
noise monitoring continues to grow as regulation
increases and we expect to continue to find more
widespread industrial and construction-related
applications for our services.
French sailor Alain Thébault wanted to build the fastest sailing boat in the world. But “flying” over the ocean with a boat demands innovative materials and technologies and so Alain relied on HBM’s measurement technology to help develop his ultra-fast trimaran, the Hydroptère. The main challenge was to develop aerodynamic hydrofoils providing sufficient lift above the surface of the water without causing turbulence and able to withstand a pressure of 45 tons. HBM’s instrumentation was installed on board to measure stability, speed, drag, vibration and oscillation, as well as the wear of the materials used. Alain’s speed of 51.36 knots (95 km/h) successfully broke the absolute world speed record for a sail-powered vessel.
Case study
World’s fastest sailing boat uses HBM’s measurement technology

Spectris plc Annual Report and Accounts 201124
21119.04 07/03/12 Proof 8
Operating Review continued
Overview
In-line Instrumentation provides process analytical
measurement, asset monitoring and on-line controls
for both primary processing and the converting
industries. Our products and applications provide
precision measurement in challenging operating
environments, ensuring process quality, asset uptime,
safety, and improved yield. The operating companies
in this segment are Beta LaserMike, Brüel & Kjær
Vibro, BTG Group, Fusion UV Systems, NDC Infrared
Engineering, and Servomex.
Segment performance
The In-line Instrumentation segment, which had a
strong recovery in 2010, returned to more normalised
growth levels during 2011, as expected. Operating
margins were 0.7pp lower as a result of sales of
service, spare parts and consumables, which are a key
feature of this segment, growing more slowly than
sales of new products.
Growth was strong in the energy and utilities sector,
where customers continued to focus on improving
productivity, efficiency and safety. During the year we
launched the NanoTrace II series of analysers. Based
on technology acquired with the Delta-F business,
these instruments measure oxygen at the lowest
detection level in the industry (parts per trillion). We
also launched the SERVOTOUGH LaserCompact,
which uses precision laser diode technology to detect
a wide range of gases for applications in the chemical
industry and in petrochemical processing. In the
power industry, there was good demand for our
safety monitoring systems for hydroelectric power
stations and we secured orders to install these
systems on three large hydroelectric power stations in
China, representing our first orders for this
application in the region. Our condition monitoring
systems were also selected for hydroelectric projects
in Austria, Brazil and Turkey. Vibration monitoring
provides early detection of a wide range of machine
faults and enables targeted maintenance actions
to prevent the unplanned shutdown of expensive
machinery. Our remote monitoring systems for wind
turbine monitoring continued to perform well and
we secured orders from China for pilot system
installations at two wind farms.
In the pulp and paper industry, several European and
North American producers of coated graphic papers
curtailed their production rates to adjust for softer
demand for print media following a strong recovery
in 2010. This effect was offset by strong demand for
our coating blades and rods in China where new
coated paper capacity came on line. There was also
good demand for our instruments, which are used to
control consistency and to improve operations across
both pulp production and paper manufacturing
processes. In the fourth quarter, we launched
a new series of optical brightness transmitters for
monitoring and controlling bleaching chemicals,
optical brightening agents and dyes. Equipped with a
UV light source for fluorescent measurement, these
instruments optimise chemical addition and reduce
operating costs during the pulping process. We also
continue to make good progress in tissue markets
and several large tissue manufacturers are now
employing our combined technology to improve
process productivity and product quality. New blade
materials in our coating blades are helping to reduce
operating costs and increase uptime and, in a trial
at one tissue mill, our new blades achieved a
50% longer lifetime between changes than the
conventional blades.
We saw strong demand from the converting
industries (web, film, plastics and packaging) for our
products. Continued investment by customers
in both separator film and coating lines for
production of lithium ion batteries, particularly in
China, resulted in a significant increase in orders for
our infrared measuring systems for this market
compared with the prior year. There was also good
demand for our scanners for measuring plastic film
in-line instrumentation
highlights
> Energy and utilities projects include chemical plant, hydro and wind power installations
> Continued success in tissue applications offsetting decline in traditional coated papers
> Strong demand for web, film and packaging solutions
> Investments in optical fibre and telecoms cable continue, especially in emerging markets
£63.8mOperating profit up 9%
20.6%Return on sales down 0.7pp
£308.9mSales up 13%

Spectris plc Annual Report and Accounts 2011 25
Busin
ess
Revi
ewG
over
nanc
eFi
nanc
ial S
tate
men
ts
21119.04 07/03/12 Proof 8
China’s long reliance on coal to generate its electricity is changing as the country plans to expand its hydropower capacity in a concerted effort to reduce carbon dioxide emissions. Brüel & Kjær Vibro’s safety monitoring systems are being used to monitor the generating units at three hydropower stations. Vibration monitoring provides early detection of a wide range of machine faults, enabling targeted maintenance actions to prevent the unplanned shutdown of expensive machinery. At the Xiaowan Dam, the world’s tallest double-arch dam and the second-largest hydroelectric power station in China, Brüel & Kjær Vibro’s monitoring systems are used on the six 700 MW installed hydro turbine generator units.
Case study
Brüel & Kjær Vibro helps China to expand renewable energy generation
and we launched a new system for blown film which
has been installed at two of the world’s largest
producers of complex packaging films. Blown film
production has become more sophisticated as the
industry enters new marketplaces: uniform barrier
layer thickness is especially important in films which
are converted into high performance packaging
films which extend the shelf life of foods and
medical products. Using our measurement and
control systems to achieve thickness uniformity,
manufacturers can reduce the variation in roll film
thickness by 40 to 60%. Our UV curing systems had
good success in China, with applications including
production of metallised plastics and decorating film.
The latter is beginning to replace conventional spray
coating operations for decorating the plastic housings
found on consumer electronics. With the acquisition
of the IRM business, we have expanded our product
line to include thickness and flatness gauging
products for the steel and aluminium industries,
with significant potential in China.
In the semiconductor and electronics market,
conditions were mixed. Demand for new generation
large screen televisions remains subdued; however,
demand for smaller, more compact items such as
tablet computers and smart phones is growing
rapidly. Advances in technology, for example the use
of polarising films to improve display and touch panel
performance, has resulted in investment in new
manufacturing processes and the associated UV
curing equipment required to achieve this. In the
wire and cable market, demand for optical fibre,
and telecom cable in general, grew strongly as
infrastructure investments in China and India
continued, together with the continued deployment
of fibre to the home in North America. Previously
mothballed equipment at customers’ sites is being
refurbished and upgraded to meet the increase in
demand, resulting in good sales of our UV curing
equipment and gauging systems.
Segment outlook
Investment activity is expected to continue in
hydrocarbon processing worldwide as oil and gas
producers seek further productivity and efficiency
improvements and as emissions regulations increase
compliance requirements. In the metals sector, the
acquisition of IRM Group will expand our market
position, particularly in the growing China market.
Demand from the electronics sector, including flat
panel displays, will be driven by smaller, portable
devices and demand for optical fibre is expected
to continue to grow as infrastructure projects in
emerging markets continue. In the pulp and paper
industry, current trends are expected to continue,
with demand for coated papers declining, mitigated
by growing demand for tissue products, particularly
in emerging markets. Service and support contracts
will continue to be an important feature of this
segment as customers seek to ensure uninterrupted
production capabilities.

Spectris plc Annual Report and Accounts 201126
21119.04 07/03/12 Proof 8
Operating Review continued
Overview
Industrial Controls supplies process measurement,
monitoring and control instrumentation and
networking products for manufacturing industries.
Our products provide track, trace and control
solutions during the manufacturing process,
instrumentation and displays for process monitoring
and control, data interfaces, and rugged Ethernet
switches for a broad range of manufacturing
industries. Sales are made both directly and indirectly
(via distributors) to end users as well as directly to
original equipment manufacturers, with a significant
proportion of repeat business. The operating
companies in this segment are Microscan, Omega
Engineering and Red Lion Controls.
Segment performance
The global manufacturing sector continued to grow
strongly and we saw good demand for our industrial
measurement, communication and control products,
augmented by the Sixnet and Omega Engineering
acquisitions.
Our automation products performed well, with high
demand for bar code readers and machine vision
systems. Track, trace and control technologies are
increasingly being adopted in response to the
growing requirement, and in some cases regulation,
for manufacturers to improve quality, safety and
efficiency. We sold our smart cameras to customers
in the food industry for validating packaged products
to meet food safety standards and to customers in
the electronics industry where they are used for
process control efficiency during the manufacture
of sub-assemblies for consumer electronics. In the
pharmaceutical industry, strict regulations regarding
product traceability resulted in sales of a number of
our products for packaging and labelling applications.
In June, we launched the AutoVision product family,
comprising smart cameras and software. This suite of
track, trace and control products has been very well
received and we have sold a number of systems into
applications ranging from checking the integrity of
car airbag seat covers to reading bar codes on
medical instruments.
Integration of the Omega Engineering business,
acquired at the end of September, into the Industrial
Controls segment is progressing well. The transition
to new ownership has proceeded smoothly
and a number of actions to enhance productivity
and introduce new products are under way. The
organisation is being expanded to increase the
company’s presence in Europe and to establish an
operation in China. These actions are expected to
accelerate growth in 2012 and beyond. Investments
in systems to improve the efficiency of the operations,
finance and administration functions are in the
planning stage and are expected to be initiated
during the course of the year. During 2011, Omega
introduced a number of new products to focus on
wireless communication. These enable users to
monitor and control processes remotely and are
particularly useful for retro-fitting instrumentation
in existing process lines.
Red Lion Controls completed the acquisition of Sixnet
in October. This has provided new product platforms,
and in particular wireless capability, for our industrial
automation offering and builds on the networking
products of N-Tron acquired in 2010. Integration of
Sixnet and N-Tron into Red Lion is proceeding on
industrial controls
highlights
> Strategic acquisitions contribute to good growth in sales
> Integration actions delivering results, e.g. productivity improvements, and sales ahead of expectations
> Strong demand for track, trace and control applications for product traceability
> Automation products finding new applications in process industries
£22.1mOperating profit up 132%
19.6%Return on sales up 3.7pp
£112.9mSales up 89%

Spectris plc Annual Report and Accounts 2011 27
Busin
ess
Revi
ewG
over
nanc
eFi
nanc
ial S
tate
men
ts
21119.04 07/03/12 Proof 8
track, and the enlarged company will be deploying a
consolidated go-to-market strategy over the next few
months. In its traditional business, Red Lion’s operator
panels are finding new applications in process
industries such as gas production and distribution
where they are used for control on drilling rigs and
on the compressors which move the gas through
miles of cross-country pipeline. Red Lion’s technology
enables customers to drive productivity improvements
through real-time visibility of data and, in October,
the company launched the ProducTVity Station, a
ready-to-use solution for collecting, recording and
displaying critical performance indicators and
machine status messages in production facilities.
Segment outlook
Whilst demand from the general manufacturing
sector will depend to some extent on the global
economy, recent acquisitions have strengthened our
position in monitoring, control and communication in
the industrial automation and process measurement
markets. Omega Engineering will provide good
opportunities for growth in emerging markets,
particularly China and Latin America.
Pharmaceutical manufacturers must meet stringent labelling requirements to ensure safety and prevent counterfeiting. The data on the label must be accurate and legible throughout the supply chain. US company, Modular Packaging Systems, designs and manufactures tablet counters and fillers and uses Microscan’s machine vision system to detect and verify labels in the bottle filling line. One camera verifies that the date/batch code and barcode on each label is correct and a second camera checks each bottle to detect any missing labels. Bottles with labels that do not meet the required specifications and unlabelled bottles are rejected further down the line.
Case study
Microscan’s vision system helps to meet packaging regulations

Spectris plc Annual Report and Accounts 201128
21119.04 07/03/12 Proof 8
Financial Review
Introduction
Spectris uses adjusted figures as key performance
measures in addition to those reported under
adopted IFRS. Adjusted figures exclude certain
non-operational items which management has
defined in Note 3. Unless otherwise stated, all profit,
earnings and operating cash flow figures referred to
below are adjusted measures.
Operating performance
Reported sales were up 22.6% at £1,106.2 million
(2010: £901.9 million). Favourable movements in
foreign currency exchange rates contributed
approximately £4.8 million (0.5%) and revenue from
acquisitions contributed approximately £65.1 million
(7.2%). Therefore, on an organic constant currency
(like-for-like) basis, sales increased by 14.9%
year-on-year.
Operating profit increased by 41.8% to £201.5
million (2010: £142.1 million). Movements in foreign
currency exchange rates had a positive effect of
approximately £2.0 million (1.4%) and acquisitions
contributed an additional £13.6 million (9.6%). The
increase in like-for-like operating profit of £43.8
million resulted from higher sales driving an increase
in gross margin of £81.0 million, offset by overheads
increasing by £37.2 million (predominantly personnel
costs). Gross margins increased to 58.6% of sales
(+0.2pp) and overheads reduced to 40.4% (-2.2pp),
with the result that operating margins increased by
2.4pp from 15.8% to 18.2%.
The year-on-year increase in net finance costs was
£0.1 million (from £9.8 million to £9.9 million). This
is due to a net increase of £0.8 million in financing
charges offset by a reduction in net pension-related
costs of £0.7 million. The £0.8 million increase in
financing charges is the net result of an increase in
charges arising from higher average net debt
mitigated by a reduction in average interest rates.
Profit before tax increased by 45% from £132.3
million to £191.6 million.
Statutory operating profit, after including acquisition-
related intangible asset amortisation of £21.8 million
(2010: £12.3 million), acquisition-related costs and
contingent consideration fair value adjustments of
£1.8 million (2010: £1.9 million) and acquisition-
related fair value adjustments to inventory of £2.1
million (2010: £nil), increased by 38% from £127.9
million to £175.8 million.
Statutory profit before tax increased by 38.5% from
£119.9 million to £166.0 million.
Clive Watson
Group finance director
` 2011 2010 IncreaseLike-for-like
increase
Sales (£m) 1,106.2 901.9 22.6% 14.9%
Adjusted operating profit (£m) 201.5 142.1 41.8% 30.8%
Operating margin 18.2% 15.8% +2.4pp
Statutory
Sales (£m) 1,106.2 901.9 22.6%
Operating profit (£m) 175.8 127.9 37.5%
Operating margin 15.9% 14.2% +1.7pp
Reported sales were up 22.6% at £1,106.2 million. On a like-for-like basis, sales increased by 14.9%. Adjusted operating profit increased by 41.8% to £201.5 million.
18.2%Operating margins up 2.4pp
£201.5mOperating profit up 42%

Spectris plc Annual Report and Accounts 2011 29
Busin
ess
Revi
ewG
over
nanc
eFi
nanc
ial S
tate
men
ts
21119.04 07/03/12 Proof 8
The reconciliation of statutory and adjusted measures is shown in the table below.
2011 2010
iFRS (Statutory)
£mAdjustments
£m
Spectris Adjusted
£m
IFRS (Statutory)
£mAdjustments
£m
Spectris Adjusted
£m
Sales 1,106.2 – 1,106.2 901.9 – 901.9
Gross margin 648.7 – 648.7 526.8 – 526.8
Operating profit before acquisition-related items 201.5 – 201.5 142.1 – 142.1
Amortisation of acquisition-related intangibles (21.8) 21.8 – (12.3) 12.3 –
Net acquisition-related costs and contingent consideration fair value adjustments (1.8) 1.8 – (1.9) 1.9 –
Acquisition-related fair value adjustments to inventory (2.1) 2.1 – – – –
operating profit 175.8 25.7 201.5 127.9 14.2 142.1
Profit on disposal of businesses 0.1 (0.1) – – – –
Unrealised changes in fair value of financial instruments (0.4) 0.4 – 1.4 (1.4) –
Net gains on retranslation of short-term inter-company loan balances 0.4 (0.4) – 0.4 (0.4) –
Net bank interest payable (9.8) – (9.8) (9.0) – (9.0)
Net IAS 19 finance income/(cost) 0.1 – 0.1 (0.5) – (0.5)
Other finance costs (0.2) – (0.2) (0.3) – (0.3)
Profit before tax 166.0 25.6 191.6 119.9 12.4 132.3
Acquisitions
The total cost of acquisitions in the year was £377.0
million (2010: £63.0 million), including £18.6 million
(2010: £0.8 million) for cash acquired. Included in the
total cost of acquisitions is an amount of £4.4 million
(2010: £4.1 million) attributable to the fair value of
deferred and contingent consideration expected to be
paid in future years offset by an estimated purchase
price adjustment receivable of £7.1 million (2010:
£nil). In addition, a further £7.9 million (2010:
£4.5 million) was paid in respect of prior year
acquisitions, making the net cash outflow in the year
£369.0 million (2010: £62.6 million). An amount of
£3.1 million (2010: £1.9 million) was spent on
related costs (mainly professional fees), which makes
the total acquisition-related cash outflow in 2011
£372.1 million (2010: £64.5 million). The acquisitions
all took place in the second half of 2011 and
contributed £65.1 million (2010: £11.6 million)
of incremental sales and £13.6 million (2010:
£1.2 million) of operating profit.
Taxation
The effective tax rate on adjusted profits was 24.8%
(2010: 24.2%), an increase of 0.6pp, mainly due to a
higher proportion of the profits being earned in the
more highly taxed USA. On a statutory basis, the
effective tax rate was 23.9% (2010: 19.8%). The
effective tax rate continues to be below the weighted
average statutory tax rate of 28.5% (2010: 27.6%),
primarily as a consequence of a tax-efficient
inter-company financing structure and research
and development tax incentives.
Earnings per share
Earnings per share increased by 43% from 86.6p to
124.1p, reflecting the net impact of a 45% increase
in profit before tax slightly offset by the increase in
the weighted average number of shares from 115.8
million in 2010 to 116.2 million in 2011 and the
increase in the tax rate to 24.8%.
124.1pEarnings per share up 43%
£191.6mProfit before tax up 45%

Spectris plc Annual Report and Accounts 201130
21119.04 07/03/12 Proof 8
Financial Review continued
Statutory basic earnings per share increased by 31% from 83.1p to
108.7p. The difference between the two measures is shown in the table
below.
2011 Pence
2010 Pence
Statutory basic earnings per share 108.7 83.1
Amortisation of acquisition-related intangible assets 18.8 10.6
Acquisition-related costs and contingent consideration fair value adjustments 1.6 1.6
Acquisition-related adjustments to inventory 1.8 –
Profit on disposal of businesses (0.1) –
Decrease/(increase) in fair value of cross-currency interest rate swaps 0.3 (1.2)
Net gains on retranslation of short-term inter-company loan balances (0.3) (0.3)
Tax effect of the above and other non-recurring items (6.7) (7.2)
Earnings per share 124.1 86.6
The weighted average number of shares outstanding during the year
was 116.2 million (2010: 115.8 million).
Cash flow
2011 £m
2010 £m
operating cash flow
Operating profit 201.5 142.1
Add back: depreciation and software amortisation 18.0 16.5
Working capital movement (11.2) 20.1
Capital expenditure (29.2) (18.9)
Operating cash flow 179.1 159.8
Operating cash flow conversion* 89% 112%
Non-operating cash flow
Tax paid (35.1) (21.0)
Net interest paid (12.1) (10.1)
Dividends paid (33.8) (28.9)
Acquisition of businesses, net of cash (369.0) (62.6)
Acquisition-related costs (3.1) (1.9)
Disposals 0.1 –
Exercise of share options 0.5 1.9
Exchange 3.4 0.5
Total non-operating cash flow (449.1) (122.1)
Operating cash flow 179.1 159.8
Movement in net debt (270.0) 37.7
* Operating cash flow as % of operating profit
Excluding acquisitions, the year end trade working capital to sales ratio
was 9.9% (2010: 9.8%). Including acquisitions, the year end trade
working capital to sales ratio was 12.3%. Average like-for-like trade
working capital, expressed as a percentage of sales, decreased to
9.0% (2010: 9.4%), reflecting the continuing focus on working capital
management.
Capital expenditure during the year equated to 2.6% of sales (2010:
2.1%) and, at £29.2 million (2010: £18.9 million), was 162% of
depreciation and software amortisation (2010: 115%). The increase in
capital expenditure is mainly property-related long-term investments,
primarily in The Netherlands, where we invested in a new state-of-the-
art manufacturing facility.
Overall, net debt increased by £270.0 million (2010: decrease of £37.7
million) from £86.2 million to £356.2 million. Interest cost, excluding
the financing charge arising from IAS 19, was covered by operating
profit 20 times (2010: 15.8 times).
Financing and treasury
The group finances its operations from both retained earnings and
third-party borrowings, the majority of which are currently at floating
rates of interest.
As at 31 December 2011, the group had £501 million of committed
facilities denominated in different currencies, consisting of £97 million
of private placements maturing in October 2013, a five-year £48
million term loan maturing in September 2015, a five-year £354
million revolving credit facility maturing in August 2016 and £2 million
from three bank loans secured on property of three of our businesses.
The revolving credit facility was signed in August 2011 to finance the
Omega Engineering acquisition, to refinance existing debt facilities and
for general corporate purposes. £104 million of this facility was
undrawn at the year end. In addition, the group had a cash balance of
£42 million and other uncommitted facilities, mainly in the form of
overdraft facilities at our local operations.
At the year end, the group borrowings amounted to £398 million, 37%
of which were at fixed interest rates (2010: 99%). The ageing profile at
the year end showed that 1% of the year end borrowing is due to
mature within one year (2010: 1%), 24% between one and two years
(2010: 1%) and 75% between two and five years (2010: 98%).
Currency
The group has both translational and transactional currency exposures.
Translational exposures arise on the consolidation of overseas company
results into sterling. Transactional exposures arise where the currency
of sale or purchase invoices differs from the functional currency in
which each company prepares its local accounts. The transactional
exposures include situations where foreign currency denominated
trade debtor, trade creditor and cash balances are held.
After matching currency of revenue with currency of costs wherever
practical, forward exchange contracts are used to hedge a proportion
(up to 75%) of the remaining forecast net transaction flows where
there is reasonable certainty of an exposure. At 31 December 2011,
approximately 57% of the estimated net euro, US dollar and Japanese
yen exposures for 2012 were hedged using forward exchange
contracts mainly against the Swiss franc, sterling, the euro and the
Danish krone.

Spectris plc Annual Report and Accounts 2011 31
Busin
ess
Revi
ewG
over
nanc
eFi
nanc
ial S
tate
men
ts
21119.04 07/03/12 Proof 8
The largest translational exposures are to the US dollar, euro, Danish
krone and Swiss franc. Translational exposures are not hedged. The
table below shows the key average exchange rates compared to
sterling during 2011 and 2010.
2011 (average)
2010 (average)
USD 1.60 1.55
EUR 1.15 1.17
JPY 128 135
To demonstrate the transaction and translation currency exposure
faced by the group, the table below shows the differences between
the group’s consolidated revenues and costs for each of the major
currencies in 2011 before reflecting the effect of transactional hedges
taken out in the year.
Revenue and cost by major currency:
USD* EUR* GBP JPY Other Total
Total sales (£m) 409 417 69 84 127 1,106
% of sales 37% 38% 6% 8% 11%
Total costs (£m)† (312) (342) (97) (47) (116) (914)
PBT by currency (£m) 97 75 -28 37 11 192
% of PBT 51% 39% -14% 19% 5%
* Dollar/euro categories include tracking currencies† Costs include interest of £3.8m in USD, £6.0m in EUR and £0.1m in GBP
The above table is for overall guidance only as the phasing of income
and the movement in the monthly average exchange rates during the
year can have a significant impact.
Defined benefit pension schemes
The company operates a number of pension schemes throughout the
group. The net pension liability in the balance sheet (before taking
account of the related deferred tax asset of £4.0 million) has decreased
to £13.1 million (2010: £14.1 million). The movement can be
summarised as follows:
£m
Deficit in defined benefit pension schemes at 1 January 2011 (14.1)
Settlement gain in UK 0.3
Actuarial losses (2.8)
Contributions in excess of service cost 3.2
Expected return on pension scheme assets net of interest costs on pension scheme liabilities 0.1
Exchange difference and other movements 0.2
Deficit in defined benefit pension schemes at 31 December 2011 (13.1)
The movement in individual plan deficits is shown in the table below:
UK Germany Netherlands Switzerland Total
Deficit as at 1 January 2011 (3.7) (7.1) (0.4) (2.9) (14.1)
Decrease/(increase) in deficit 2.4 0.8 – (2.2) 1.0
Deficit as at 31 December 2011 (1.3) (6.3) (0.4) (5.1) (13.1)
The reduction in the UK deficit is mainly due to the favourable asset
returns over the period and the deficit contributions (£2.6 million p.a.)
paid by the company. This beneficial impact was partially offset by
an increase in liabilities due to a lower discount rate (4.7%) as at
31 December 2011 (31 December 2010: 5.4%).
The group has undertaken an Enhanced Transfer Value exercise for
certain UK deferred members with a prospective pension entitlement
of less than £1,000 p.a. For IAS 19 valuation purposes as at
31 December 2011, this has been treated as a settlement, resulting in
a gain of £0.3 million credited to the statement of income (difference
between the total IAS 19 liabilities for the members less the total
amount paid from the plan).
The £2.2 million increase in the Swiss deficit arose mainly from an
increase in liability due to a lower discount rate used (2011: 2.25%;
2010: 2.75%).
Clive Watson
Group finance director

Spectris plc Annual Report and Accounts 201132
21119.04 07/03/12 Proof 8
Corporate Responsibility
Introduction
Spectris is a leading supplier of productivity-enhancing instrumentation
and controls. We employ around 7,500 people working from over 130
locations in more than 30 countries around the world. Our products are
used to monitor and control research and manufacturing processes,
enabling customers in a wide range of industries to enhance their
productivity and thereby also reduce their environmental impact.
We are committed to creating business growth through adding such
value for our customers, whilst also ensuring that our own impact on
the environment is minimised. Corporate responsibility (CR) underpins
our business strategy, and our primary corporate value of honesty and
integrity influences all of our dealings with our customers, employees
and communities in which we operate. The core areas of our CR
strategy are corporate governance, environment and climate change,
our people, our communities, customers and suppliers.
To measure the critical components of our CR strategy, we have
adopted the following key performance indicators:
Energy consumption2011 2010
MWh per £m revenue 65.6 92.8
Accident incident Rate2011 2010
Reportable accidents per 1,000 employees 2.7 5.3
Opportunities
Climate change, in particular, provides opportunities to develop new
products which contribute to reducing our customers’ impact on the
environment, for example by lowering energy consumption or raw
material usage. We recently helped a major cement company to
achieve a 20-30% reduction in CO2 emissions per tonne of cement
by developing a new type of clinker with a lower carbon footprint
(see case study on page 33). Our products are also used in the
development of renewable energy technologies, for example the
design and testing of new materials for wind turbine blades, solar
panels and lithium ion batteries for electric vehicles. Our systems are
also used for remote monitoring of wind turbines and hydroelectric
power stations.
Independent accreditation
Spectris continues to meet the criteria for membership of the
FTSE4Good index, the leading responsible investment benchmark.
The FTSE4Good inclusion criteria are enhanced regularly and demand
continued improvement in order to maintain inclusion in the index.
The criteria are assessed on a regular basis by the independent
research organisation EIRIS.
stations.
Approximately 60% of our manufacturing operations (by turnover) are
certified to the international environmental standard ISO 14001.
In 2011, as part of our commitment to environmental responsibility,
we commenced participation in the Carbon Disclosure Project, an
independent not-for-profit organisation reporting on corporate climate
change information. We were pleased to be placed in the top third of
all FTSE 350 companies responding.
Our environmental reporting processes have been established by
external consultants WS Atkins.
We have commenced a programme to audit significant suppliers
against relevant criteria stipulated in the social accountability standard
SA8000 and to date have audited the top 50% of key suppliers in
Asia. A number of the suppliers audited have committed to gaining
full SA8000 certification.
Corporate governance
Details of how the company complied with the principles of the UK
Corporate Governance Code during 2011 are described in detail in
the Directors’ Report.
Overall responsibility for developing corporate policies on
environmental, social, ethical and health and safety matters, and for
reviewing their effectiveness, lies with the Spectris Board of directors
and, in particular, the Chief Executive. These policies are mandated
across all business units and applied within each particular business,
taking account of local legislation and regulation. All policies are
reviewed periodically and any updates are communicated to the
operating companies. Each year we require the president and finance
director of each operating company to confirm that their business has
complied in full with our corporate policies. Any instances of
non-compliance must be reported. There were no material cases of
non-compliance in 2011.
This certification forms an integral part of the company’s system of
internal controls, and is regularly reviewed by the group’s internal
audit function and considered annually by the company’s external
auditors. Compliance testing is a formal part of internal audit reviews.
Through a structured review process, the internal audit function
undertakes visits to group locations on a rotational basis. These visits
involve an assessment of the business’ key internal controls as well as
compliance with the group’s policies and procedures. The results of
internal audits and any cases of non-compliance are reported to the
audit and risk committee.
Environment and climate change
Our core business of providing instruments and controls for the design
and manufacturing processes of major industrial companies helps our
customers to reduce their environmental impact in a number of ways.
We offer our customers products and technologies to reduce energy
consumption, make more efficient use of resources, and control
emissions. Furthermore, a number of our products are critical to the
development, manufacture and maintenance of renewable energy
generation technologies, as described above. Examples of the use of
Spectris’ products having a direct beneficial contribution to the
environment are shown on our website.
We also take the continuing reduction in our own environmental
impact seriously, as set out in our environmental policy, which is

Spectris plc Annual Report and Accounts 2011 33
Busin
ess
Revi
ewG
over
nanc
eFi
nanc
ial S
tate
men
ts
21119.04 07/03/12 Proof 8
published on our website. We endeavour to employ non-polluting
technology wherever possible in our operations and take steps to
reduce our energy consumption further. Design processes take into
account the operational lifetime of every product and end-of-life
removal or disposal. Consideration is also given to environment-
friendly production, packaging and shipping.
Environmental management systems
Approximately 60% of Spectris’ manufacturing operations (by
turnover) are certified to ISO 14001. In 2011, Brüel & Kjær’s facility at
Royston, England (formerly the LDS Test and Measurement business,
which was acquired in 2008), successfully achieved ISO 14001
certification.
No significant environmental incidents were recorded in 2011 and the
company received no environmental fines. In 2007, we reported that
investigative studies into a small area of contaminated land at Almelo
in The Netherlands, resulting from activities prior to ownership by
PANalytical, had been made and a remediation programme discussed
with the Dutch authorities. This programme has now been agreed and
removal of the contaminated soil, followed by pumping and filtering/
cleaning of the contaminated water will commence during 2012.
Climate change
Overall, Spectris has a low climate change impact, as our products do
not require substantial manufacturing processes at our facilities.
Nevertheless, we take the need to manage our carbon emissions
seriously and also acknowledge responsibility for our suppliers,
working with them to help reduce their impact on the environment.
Although we fall below the threshold for full participation in the UK
CRC Energy Efficiency Scheme and are only required to submit an
information disclosure, we are working to improve our environmental
performance and reduce our carbon emissions. With the help of
environmental consultants WS Atkins, we undertook a sustainability
and responsibility review in 2010 and during 2011 we put in place
actions across the group in response to their recommendations, which
are detailed below.
Our sustainability objectives are designed to improve our
environmental performance and increase the importance of health
and safety, human rights and ethics across the group. Roger Stephens,
company secretary, has overall responsibility for setting and
monitoring the sustainability strategy. The managing directors and
presidents of our business units are responsible for implementing the
strategy at a local level.
Energy
With regard to the environment, our initial priority is to focus on
accurate measurement and monitoring of three key parameters:
electricity, gas and water. In order to better understand and manage
our energy use, we have established a Key Performance Indicator
relating to energy consumption.
Energy consumption Mwh per £m revenue
92.82010
65.62011
We estimate that the above energy consumption metric covers 100% of our operations. Acquisitions are excluded in the year of acquisition.
Actions to deliver progress are focused on internal initiatives, rather
than group-wide targets, with the emphasis on businesses with the
greatest opportunities to improve. As a result, we made good progress
on reducing energy usage in 2011, with actions around the group
including installing energy-saving lighting and motion sensors and more
energy-efficient air conditioning systems at a number of sites. Fusion UV
Systems, one of our most intensive energy-using businesses, has
upgraded the facilities for life testing of their equipment at their North
American headquarters to be more efficient and this has enabled them
to reduce electricity consumption. Fusion aims to reduce energy usage
by 30% over the next three years. At our HBM facility in Germany,
electricity consumption has reduced despite a 15% increase in
production. PANalytical’s new X-ray tube facility at Eindhoven, The
Netherlands, which opened in September 2011, and which has been
designed to modern building standards, is expected to reduce
consumption of gas and electricity per m2 by 10% compared with the
old building. At PANalytical’s Almelo site in The Netherlands, gas
consumption in 2011 was 30% lower than in the prior year and
Cement production is
responsible for around 5%
of global man-made CO2
emissions. A large proportion
of these emissions result
from the decarbonisation
of limestone at high
temperatures to produce
clinker, the basic component of cement. Having already reduced
its carbon footprint by modernising installations, substituting
fossil fuels with alternative fuel sources and using additives to
produce less carbon intensive blended cements, one possible
way for the cement industry to make significant future
improvements is to develop completely new cement types.
Project AETHER™ is a project being led by Lafarge, world leader
in building materials, to develop a new class of cements which
require much less limestone and less energy to produce than
conventional Portland cements. The project has received funding
from the European Community’s LIFE+ environmental
programme. A first industrial demonstration trial to produce
AETHER clinkers was carried out in 2011 at Lafarge’s cement
plant in Burgundy, France, using PANalytical’s XRD and XRF
analysers and software for quality control and analysis. This trial
confirmed that AETHER clinkers could be produced at lower
temperatures and using significantly less energy than
conventional Portland cement clinker, generating 20-30% less
CO2 per tonne of cement. Independent testing is now ongoing
to assess the mechanical performance and durability of mortars
and concretes made with AETHER cements.
PANalytical helps to reduce carbon footprint in cement production

Spectris plc Annual Report and Accounts 201134
21119.04 07/03/12 Proof 8
electricity consumption for testing of high power instruments has also
been reduced following changes to production processes.
Water
As Spectris products do not require substantial manufacturing
processes, our sites are not large users of water. Nevertheless, we
recognise the importance of managing this limited natural resource,
particularly in certain parts of the world, and we seek accurate
site-specific water reports for all of our largest facilities. The data
collection exercise has already shown results in China, where evidence
of abnormally high consumption at one of our production facilities
enabled system modifications and a significant reduction in water
usage. At our Fusion UV Systems’ site in North America, overall water
usage has been reduced by 50% following installation of a chiller/
recirculation system used in bulb manufacturing. At our site in The
Netherlands, consumption of cooling water for a specific production
process has been reduced by 90% using closed circuit cooling.
Employees
We employ a highly skilled technical workforce of around 7,500
people, in more than 130 locations throughout the world, and are
committed to providing our staff with a creative working environment
with scope for individual responsibility and achievement.
Compensation and benefits, which are in line with other leading
companies in the sector, are designed to reward the achievement of
objectives.
Our employment policy is published on our website.
As part of our culture of respect, we believe that people with varied
backgrounds and perspectives add creativity to the company and thus
we encourage diversity in the workplace. We are committed to
providing equal employment opportunities in terms of recruitment and
employment, training and development, and promotion, regardless of
race, colour, religion, national origin, gender, sexual orientation, age,
disability or military veteran status.
The Board has discussed the recommendations in the Davies Report
‘Women on Boards’. The Board recognises the benefits of all facets of
diversity, including experience and perspective, both at Board level and
throughout our business. Any search firm engaged in a senior
executive or non-executive search assignment will be required to
adhere to the principles set out in the Voluntary Code of Conduct for
Executive Search Firms. However, the Board does not believe it would
be helpful to establish specific employment targets relating to
diversity.
Spectris operates globally in more than 30 countries and is focused on
growing its presence in industrialising economies such as China, India
and Latin America and across a broad base of end user markets. We
will continue to strengthen our existing group-wide inclusion policies
to attract and retain the most talented and appropriate people,
particularly reflecting the different markets and geographies in which
we operate.
Our value of treating others with respect carries over to our policy
against workplace discrimination and harassment. We strive to create
a culture of honesty, respect and professional excellence whilst
maintaining a healthy balance between working and personal lives,
with initiatives such as part-time and job share opportunities providing
family-friendly working conditions. Employee surveys are carried out in
a number of companies to measure the views of employees on
company issues and action plans agreed to address the issues raised.
Initiatives such as the Savings Related Share Option Scheme, available
to all UK employees, and grants under the group’s Performance Share
Plan made to senior management across the group, are designed to
encourage loyalty and performance.
A commitment to training and personal development emphasises the
importance of retaining staff throughout the group and ensuring that
all employees are encouraged to realise their full potential. Annual
reviews provide feedback on performance, set objectives and identify
training and development opportunities. Data on employee turnover is
monitored by individual businesses and reported to the Board on an
annual basis. Malvern and Servomex, our two principal UK businesses,
have received the Investors in People award for their programmes of
training, appraisal, employee development and skills recognition.
Graduate recruitment programmes and student work placements exist in
a number of our companies, providing opportunities for young people,
particularly scientists, to be introduced to the business environment.
Health and safety
We take health and safety seriously and strive to provide a workplace
at all of our sites where all employees feel safe and protected from
harm. Our policies regarding workplace health and safety are
implemented throughout the group, with each operating company
responsible for compliance with local legislation and regulations and
ensuring that the highest standards of health and safety are achieved
by its employees and by sub-contractors and suppliers. The company’s
health and safety policy can be viewed on our website.
Audits of health and safety policies and procedures are undertaken at
all major locations by external assessors acting on behalf of the
group’s insurers on an annual basis and recommendations are made
for improving practices where appropriate.
Any serious health and safety incidents are required to be reported by
the managing director of the business in an accident report to the
company secretary, who reports on such issues to the Board. All
accidents are thoroughly investigated and appropriate corrective and
In November, Dr E. Neil Lewis,
Chief Technology Officer at
Malvern Instruments, was
awarded the prestigious Ernst
Abbe Memorial Award of the
New York Microscopical
Society in recognition of his
outstanding contributions to
the science of microscopy, specifically for the development of
chemical imaging microscopy. Dr. Lewis (above, right) was
founder and president of Spectral Dimensions, Inc (SDI), the
company Malvern Instruments acquired in 2006.
Malvern Instruments’ scientist receives Award
Corporate Responsibility continued

Spectris plc Annual Report and Accounts 2011 35
Busin
ess
Revi
ewG
over
nanc
eFi
nanc
ial S
tate
men
ts
21119.04 07/03/12 Proof 8
preventative actions put in place. No work-related serious injuries or
deaths have been reported in the last ten years. Nevertheless, we have
established a formal system to monitor the health and safety situation
throughout the group by reporting work-related accidents or ill-health
resulting in lost time in excess of 3 days. The resulting data is shown
below expressed as a Key Performance Indicator.
Accident incident Rate (AiR) Reportable accidents1 per 1,000 employees
5.32010
2.72011
1 Work-related accidents/ill health resulting in lost time in excess of 3 daysAcquisitions are excluded in the year of acquisition
Our aim is to reduce the AIR to the lowest possible level and we are
working closely with our operating companies to achieve this. Within
the above figure, there were five significant work-related incidents
resulting in lost time in excess of 20 working days. These comprised
two employees with stress-related conditions, one employee who
suffered a fractured thumb whilst operating a machine, one employee
who was hit by a steel cable in the workplace and one employee who
slipped and fell in the office car park.
Human rights
Spectris believes in the fundamental rights of people in all parts of the
world and is committed to adopting internationally recognised human
rights standards wherever it operates. The company’s human rights
policy, which is available on our website, is consistent with the
Principles of Human Rights as set out in the International Labour
Organization’s Core Conventions, and includes policies on non-
discrimination, harassment, pay and forced labour.
Spectris takes its commitments to human rights seriously and our
operating companies are required to ensure that all employees are
aware of the policy and understand it. The Code of Business Ethics
also contains a section on human rights and employees are required to
ensure that all company operations adhere to these important
standards. Pay practices are monitored to ensure they are non-
discriminatory.
The region president is responsible for ensuring that the highest ethical
standards are maintained in all of our Asia-based operations. Spectris
has a number of sales offices in China and also factories which supply
high quality weighing components and particle characterisation
instruments. These comprise modern facilities, employ skilled workers,
adopt employment conditions consistent with best local practice, and
pay wages that are higher than average for the area.
HBM’s modern strain gauge
manufacturing facility at
Suzhou, China, is identical to its
European counterparts with
regard to the advanced
equipment used, safe working
conditions and environmental
awareness.
Advanced Production Facilities
Spectris considers human rights as part of its due diligence process for
acquisitions, ensuring that the core labour rights, including non-
discrimination, equal opportunities and freedom of association, of the
company to be acquired are taken into account.
Ethics
Our group philosophy is one of autonomy, with our operating
companies entrusted and empowered to run and manage their
businesses. We believe that establishing and maintaining an ethical
culture is critical to supporting our business model and ensuring our
continued business success and growth. Since 2009, we have had a
well-established formal Ethics Programme (the ‘Programme’) made up
of a number of elements.
Our Code of Business Ethics (the ‘Code’) is a central element of our
Programme. Our core values as set out in the Code underpin the way
we work. The Code applies to all our employees and is available in the
15 languages relevant to our operations. It provides a framework for
how we do business and includes a clear policy on anti-bribery and
corruption as well as dealings with customers, suppliers, colleagues,
conflicts of interest and human rights. A copy of our Code is available
within the corporate responsibility section on our website.
The Spectris Board and senior management team are fully committed
to responsible business conduct and demonstrate visible leadership in
this area. John O’Higgins, Chief Executive, and Roger Stephens,
company secretary, actively drive the Programme and fully engage
with our businesses on ethical and anti-corruption issues. The
company secretary chaired, and the Chief Executive attended,
the Spectris Global Ethical Leadership Conference in October 2011
at which all of our businesses were represented. In addition,
presentations and workshops on ethics, anti-bribery and corruption
In September, BTG’s new
PeakTotal2 in-line transmitter
won the Palme d’Or for
Innovation from ATIP, the
French paper association, for
its unique ability to measure
total consistency and ash
content. At the heart of the
new transmitter is an innovative light-emitting system that
measures reflectance from the slurry at very high frequency, using
advanced signal processing. The resulting data provides highly
accurate information about the fibre, fines, and filler content of
the pulp, with results unaffected by pulp colour or brightness
levels, helping paper manufacturers to reduce operating costs.
The BTG team (L to R): Bernard Rodriguez, Didier Conjeaud, Philippe Genest, Gwénaël Tartarat-Bardet, and Claude Vallier.
BTG wins Palme d’Or

Spectris plc Annual Report and Accounts 201136
21119.04 07/03/12 Proof 8
fraud risk are delivered at our annual Presidents’ meetings. During
the Board visit to our operations in China in June 2011, both the
Chairman and Chief Executive devoted a significant proportion of
presentations to local management to the importance of integrity in
all our business dealings. The Board and senior management team’s
commitment to the Programme was further demonstrated during the
year by the appointment of additional senior resource at the corporate
centre focused on embedding ethical leadership across the group and
implementing the Programme.
The Board is given regular updates on the Programme and ethical
issues across the group by the company secretary and the audit and
risk committee meets at least three times a year to consider the
effectiveness of the group’s internal controls, policies and procedures.
The group internal audit department carries out a rolling programme
of internal control reviews and compliance with the Code forms part
of the focus of these. This work is supplemented by specific, periodic
assessments of fraud risks (including bribery) in our operations.
Face-to-face training delivered by local operating company
management is core to engaging with employees on ethical issues and
is an integral part of raising knowledge and awareness of our Code.
Newly-hired staff receive training as part of their induction and there
are regular refresher courses for all employees. This is supplemented
with annual online training. During the year, an anti-bribery module
was successfully rolled out in 13 of our 14 operating companies. Our
business integration processes cover ethics and anti-bribery and the
remaining business – our recent acquisition, Omega Engineering – is in
the process of being assimilated into the Programme. An additional
online training module focused on conflicts of interest will be rolled
out across all of our businesses in early 2012. Ongoing training and
awareness is co-ordinated by ethics officers appointed within each
operating company and our Asia and Latin America sales companies.
The ethics officers are responsible for supporting their senior
leadership teams in embedding high ethical standards within their
businesses and facilitating the training and awareness process.
Our commitment to high standards of ethical behaviour pre-dates the
UK Bribery Act, but we are cognisant of the heightened legal risks
arising as a result of the new legislation and increased global
enforcement activity. As a result, an independent external risk
assessment was carried out in March 2011 to identify risks and test
the efficacy of the existing Programme. The review provided valuable
feedback. In addition, the Global Leadership Conference held in
October (the second since the Programme was launched) provided
feedback which formed the basis of the strategy for the next iteration
of the Programme. This, together with the results from the risk
assessment, has resulted in a number of initiatives to be developed
and implemented during the course of 2012. These include: continued
focus on developing ethical leadership across our businesses through a
series of senior management engagement days; increased emphasis
on face-to-face training for all employees; a revised version of the
Code and development of other supporting materials to be launched
in the first half of 2012; and formalisation of our third-party
management and due diligence framework.
Spectris places the highest importance on compliance with all
applicable export control regulations governing shipment of products
and appropriate detailed procedures are in place in each operating
company. Designated export control officers are responsible for the
development of these procedures, their administration and the
associated training of staff. Overall responsibility for the policy vests
with Roger Stephens, company secretary. The export control officers
are assisted in their duties by a dedicated group export control advisor,
who led a refresher conference for all export control officers in
September 2011. All companies are subject to periodic internal audit
of their procedures and associated conformity, with reporting annually
to the audit and risk committee. Our export control policy can be
viewed on our website.
We actively promote a speak-up culture at Spectris and employees are
encouraged to discuss issues of concern or any suspected violations of
the law or our Code with their managers. This is supplemented with
an externally-facilitated telephone and internet-based multi-lingual
hotline to enable employees and others to report concerns
anonymously if they wish. All reports are followed up and investigated
and reports are summarised and communicated to the audit and risk
committee on a six-monthly basis. In the past 12 months, the hotline
has been used on a number of occasions and the reports followed up
by the head of internal audit to conclusion. Spectris is committed to
protecting the career and reputation of employees who report
wrongdoing in accordance with established procedures, so long as
their disclosures are delivered in good faith and seek to safeguard the
best interests of the group.
Community
Our social responsibilities extend to the communities in which we
operate. Our companies provide charitable assistance to local causes
and also participate in a range of activities and educational initiatives
in support of their local communities. These include providing
apprenticeships and work placements for students, working with local
schools and colleges on science projects, and sponsorship of scientists
attending key scientific conferences.
Total donations to charities and community causes in 2011 were
£76,541, of which £10,935 were in the UK (2010: £27,429 of which
£8,286 in UK). This included donations to the Red Cross in response
to the tsunami and earthquake in Japan and the East Africa crisis, and
to other charities and local schools and colleges.
It is Spectris’ policy that donations or provision of support in kind to
political parties or campaigns are prohibited.
Customers
Spectris sells productivity-enhancing instrumentation and services to a
large number of customers around the world. We have developed
close working relationships with our customers and in many instances
involve them in the development of new products to ensure they meet
their requirements. Surveys of customer satisfaction are conducted on
a regular basis.
Corporate Responsibility continued

Spectris plc Annual Report and Accounts 2011 37
Busin
ess
Revi
ewG
over
nanc
eFi
nanc
ial S
tate
men
ts
21119.04 07/03/12 Proof 8
Suppliers
Spectris has no significant suppliers who are wholly dependent upon
the company’s business. Suppliers are paid in line with contractual and
legal obligations.
We recognise that our strategy of outsourcing non-core
manufacturing does not absolve us from responsibility for the
environmental impact of our suppliers and we work to help them
reduce their impact on the environment and ensure that their products
meet relevant legislation. Outsourcing of products and services is only
to quality-approved organisations which are regularly inspected and
audited by the group’s strategic sourcing team and local management.
Due to the high technology content of our instrumentation and
control products, suppliers of our parts need to have leading edge
manufacturing equipment and are subject to rigorous qualification
processes which cover both their technological capabilities and their
quality and regulatory conformance.
In order to gain improved assurance from suppliers, we are auditing
current, and screening new, significant suppliers (those providing
bespoke parts, assemblies and systems), against relevant criteria
stipulated in the social accountability standard SA8000. The audit
covers areas such as human rights, working conditions, health and
safety and environmental compliance, in addition to our ongoing
programme of quality and technological audits. The initiative has
commenced in Asia, where to date we have audited the top 50% of
key suppliers (by order value). The remainder will be audited by the
end of 2012. The audit covers all prospective suppliers of bespoke
parts and all existing suppliers where we purchase in excess of
$100,000/year and is carried out by Spectris internal auditors in Asia
who have all received external training and qualifications. No
fundamental non-conformances against our standards have been
discovered. Where minor non-compliance areas have been found,
corrective actions and completion dates have been agreed with the
suppliers. Suppliers have all been very co-operative in implementing
the necessary improvements, and a number have additionally
committed to gaining SA8000 certification through an approved
third-party auditing body. To date we have focused our attention on
our lower cost manufacturing sources in Asia and we may extend this
initiative to other regions as required. We will also be applying the
same auditing process to our three manufacturing facilities in China
with a target completion by end of 2012.
Contractual arrangements
The company has no contractual or other arrangements which are
essential to the business of the company, nor any key customers or
major suppliers upon which it is dependent.
The readers of Automation
World awarded Red Lion a
‘First Team Supplier’ in the
publication’s ‘Leadership in
Automation 2011’ programme.
Red Lion was honoured in three
different categories for its
industrial control products, as
well as for industrial networking products from the recently-
acquired Sixnet and N-Tron businesses.
Red Lion receives ‘First Team Supplier’ Award
Servomex has supported the
annual Great Servomex Egg
Race organised by Beacon
Community College in
Crowborough, England, for
twenty years, providing the
funding for materials,
refreshments and prizes. In
March, ninety enthusiastic pupils took part from different schools
in the area. Despite its name, this is not actually an egg race, but
a test of the children’s ingenuity and imagination. This year the
science challenge saw the pupils given the scenario of stranded
animals in a Kenyan nature reserve. Their task was to translate a
nature reserve sign, make a mask to disguise themselves so the
animals would not be scared and make a crane-like arm to lift
food to the animals. First prize was won by students from Jarvis
Brook school.
Servomex sponsors Great Egg Race

Spectris plc Annual Report and Accounts 201138
21119.04 07/03/12 Proof 8
Board of Directors
Nomination committee
John Hughes (chairman)
Peter Chambré
Russell King
John O’Higgins
John Warren
Remuneration committee
Russell King (chairman)
Peter Chambré
John Hughes
John Warren
Left to right: Jim Webster, John Warren, Roger Stephens, John O’Higgins, Peter Chambré, Russell King, John Hughes, Clive Watson
Audit and risk committee
John Warren (chairman)
Peter Chambré
Russell King
Senior independent director
John Warren

Busin
ess
Revi
ewG
over
nanc
eFi
nanc
ial S
tate
men
ts
Spectris plc Annual Report and Accounts 2011 39
John Hughes CBE, Chairman
John Hughes was appointed to the Board in 2007 and became non-executive Chairman in
2008. John was previously executive vice-president and chief operating officer of defence,
aerospace and electronic systems company Thales Group SA. He is currently non-executive
chairman of Sepura plc and Telecity Group plc as well as a non-executive director of Vitec
Group plc and CSG Systems International, Inc., a NASDAQ-listed company. John also serves as
an ambassador for the Alzheimer’s Society.
John O’Higgins, Chief Executive
John O’Higgins joined Spectris in 2006. Prior to joining Spectris, he was with Honeywell,
latterly as president of automation and control solutions, Asia Pacific. He began his career
with Daimler Benz in Stuttgart. John has engineering degrees from University College Dublin
and Purdue University and an MBA from INSEAD. John is a non-executive director of Exide
Technologies, a company listed on NASDAQ.
Clive Watson, group finance director
Clive Watson joined Spectris in 2006. He was previously at Borealis, a leading provider of
plastics solutions, where he was chief financial officer and executive vice president for
business support. Prior to this, he was group finance director at Thorn Lighting Group and
before that group finance director Europe with Black & Decker. Clive is a member of the
Institute of Chartered Accountants in England and Wales and the Chartered Institute of Tax
and holds a Bachelors degree in Commerce & Accounting from the University of Birmingham.
He is a non-executive director of Spirax-Sarco Engineering plc.
Jim Webster, business group director
Jim Webster, a metallurgy graduate, joined Spectris in 1993. He is responsible for the
operational supervision of a number of the group’s trading companies. He was previously
general manager of the European Wire and Cable Division of Raychem Corporation.
Peter Chambré, non-executive director
Peter Chambré was appointed to the Board in 2006. He is chairman of Xellia Group AS,
OneMed AB, 7TM Pharma AS, and Cancer Research Technology Ltd, all private companies,
and a non-executive director of BTG plc. He is also an adviser to private equity company 3i.
Peter was formerly chief executive officer of Cambridge Antibody Technology Group plc and
prior to that was chief operating officer of Celera Genomics Group and chief executive of
Bespak plc.
Russell King, non-executive director
Russell King was appointed to the Board in October 2010. He is a non-executive director of
Aggreko plc and non-executive chairman of Bergteamet AB, a private equity-owned Swedish
mining services company, and GeoProMining Ltd, a privately-owned mining company
operating in the CIS. Previously, Russell was chief strategy officer of Anglo American PLC and
a non-executive director of Anglo Platinum Ltd. Prior to that he spent over 20 years in senior
roles at ICI, gaining worldwide experience in its fertiliser, petrochemical and paint businesses.
John Warren, non-executive director
John Warren was appointed to the Board in 2006. He is a non-executive director of The Rank
Group Plc and Bovis Homes Group PLC. John was previously group finance director of WH
Smith PLC and United Biscuits plc and a non-executive director of Arla Foods UK plc, BPP
Holdings plc, RAC plc, Uniq plc and Rexam plc.
Roger Stephens, head of commercial and company secretary
Roger Stephens is an economics graduate and chartered company secretary. Prior to joining
Spectris in 1997, he held commercial roles in the power and construction sectors, specialising
in contract negotiation, litigation and claims resolution, IP exploitation and property
development.

Spectris plc Annual Report and Accounts 201140
21119.04 07/03/12 Proof 8
Directors’ Report
The directors present their report and accounts for the year ended 31
December 2011.
Principal activities
Spectris designs, develops and markets productivity-enhancing
instrumentation and controls. The businesses are grouped into four
segments for management and segmental reporting purposes:
Materials Analysis, Test and Measurement, In-line Instrumentation and
Industrial Controls. Further details of the trading companies within
each segment can be found in the Operating Review (pages 20 to 27).
Developments in the group’s business activities are discussed in the
Chairman’s Statement (page 16), the Chief Executive’s Review (page
18) and the Business Review (pages 1 to 37).
Acquisitions
During the year the following four acquisitions were made: (i) Omega
Engineering, which provides a broad range of process measurement
and control instrumentation to customers in industrial and academic
markets, selling directly to end users in these sectors via catalogue,
telephone and internet. The business will be integrated into the
Industrial Controls segment. (ii) Sixnet, which designs, builds and
markets rugged remote terminal units, I/O modules, Ethernet network
switches and wireless products for the broad industrial and process
market. Sixnet will be integrated into Red Lion Controls in the
Industrial Controls segment. (iii) IRM, a leading manufacturer of
gauging instrumentation for the metals market. IRM will be integrated
into NDC Infrared Engineering in the In-line Instrumentation segment.
(iv) Key intellectual property and other assets relating to a line of
benchtop X-ray analysers for the Materials Analysis segment.
The total cost of acquisitions during the year was £377.0 million,
including £18.6 million for cash acquired. Of this, £4.4 million is
attributable to the fair value of deferred and contingent consideration
expected to be paid in future years offset by an estimated purchase
price adjustment receivable of £7.1 million, resulting in a deferred
receivable of £2.7 million.
Disposals
On 1 January 2011, the group divested a sales operation in The
Netherlands for a profit of £0.1 million. The total consideration was
£0.1 million net of transaction costs.
Share capital
The share capital of the company comprises ordinary shares of 5p
each; each share carries the right to one vote at general meetings of
the company. The authorised and issued share capital of the company,
together with movements in the company’s issued share capital during
the year, is shown in Note 24 on page 99. The Articles of Association
of the company, available on the company’s website, contain
provisions governing the ownership and transfer of shares.
At the 2011 Annual General Meeting, shareholders authorised the
directors to make market purchases of the company’s ordinary shares
up to a maximum number of 11,593,000 shares, representing
approximately 10% of the issued share capital of the company, and
to either cancel the shares or hold them as Treasury shares which may
then be cancelled, sold for cash or transferred for the purposes of
the company’s share plans, depending on the best interests of the
company’s shareholders at the time. No such purchases were made
during the year. At the close of business on 16 February 2012,
the company had 125,005,123 ordinary shares in issue, of which
8,630,180 were held in Treasury. During the year 439,696 shares were
transferred out of Treasury to meet the company’s obligations under
its share plans and no shares were cancelled out of Treasury. An
authority to make further market purchases of the company’s ordinary
shares, if believed appropriate, will be sought at the forthcoming
Annual General Meeting although the Board has no present intention
of so doing.
Also included in the special business of the 2012 Annual General
Meeting are proposals to renew the directors’ authority to allot shares
up to prescribed limits.
At 16 February 2012, interests notified to the company in accordance
with Chapter 5 of the Disclosure and Transparency Rules comprised:
Black Rock Inc.
11,626,054 shares (9.99% material interest)
Standard Life Investments Limited
9,449,013 shares (8.12% material interest)
F & C Asset Management plc
5,700,126 shares (4.91% material interest)
Massachusetts Financial Services Company
5,611,725 shares (4.84% material interest)
Legal & General Group Plc
4,603,565 shares (3.99% material interest)
Kames Capital
4,492,354 shares (3.86% material interest)
Takeovers directive
Pursuant to Section 992 of the Companies Act 2006, which
implements the EU Takeovers Directive, the company is required to
disclose certain additional information. The disclosures not covered
elsewhere in this Annual Report are as follows:
The company’s Articles of Association (‘Articles’) give power to the
Board to appoint directors, but require directors to submit themselves
for election at the first Annual General Meeting following their
appointment and for re-election where they have been a director at
each of the preceding two Annual General Meetings and were not
appointed or re-appointed by the company at, or since, either such
meeting. The Articles may be amended by special resolution of the
shareholders and are available to view on the company’s website. As it
is now the company’s practice for all directors to submit themselves
for annual re-election, this is reflected in an amendment to the Articles
that will be proposed at the 2012 Annual General Meeting.
The Board of directors is responsible for the management of the
business of the company and may exercise all the powers of the
company subject to the provisions of the relevant statutes and the
company’s Articles. The Articles contain specific provisions and
restrictions regarding the company’s power to borrow money. Powers
relating to the issuing and buying back of shares are also included in
the Articles and such authorities are renewed by shareholders each
year at the Annual General Meeting.

Busin
ess
Revi
ewG
over
nanc
eFi
nanc
ial S
tate
men
ts
Spectris plc Annual Report and Accounts 2011 41
There are a number of agreements that take effect, alter or terminate
upon a change of control of the group following a takeover, such as
bank loan agreements and company share plans. None of these are
deemed to be significant in terms of their potential impact on the
business of the group as a whole. In addition, there is a service
contract between the company and one of its directors which provides
for compensation for loss of office or employment following a change
of control of the group (please refer to the Directors’ Remuneration
Report on page 50 for further explanation). It is also possible that
funding arrangements for the group’s defined benefit pension
arrangements would need to be enhanced following a change of
control if that resulted in a weakening of the employer covenant.
Dividend
Results for the group are set out in the consolidated statement of
income on page 56 and in the supporting notes. A final dividend of
25.4p per ordinary share is proposed for the year to 31 December
2011 (2010: 20.9p). With the interim dividend, this makes a total for
the year of 33.6p (2010: 28.0p). The final dividend will be paid on
26 June 2012 to shareholders on the register on 1 June 2012.
Research and development
Expenditure committed to research and development is focused on
new product development, applications engineering and process
integration. Costs are expensed as incurred, except where the
expenditure meets certain strict criteria for capitalisation. In the
year to 31 December 2011, amounts expensed totalled £75.8 million
(2010: £64.6 million), and no expenditure met the criteria for
capitalisation (2010: £nil).
Fixed assets
Whilst the market values of some properties differ from book values,
the directors believe that the differences are not material.
Payment of suppliers
The group’s policy on payment of suppliers is to ensure that terms of
payment accord with contractual and legal obligations. The company
had £nil trade creditors at the year end (2010: £nil).
Directors
The directors of the company are named on pages 38 and 39.
In accordance with the requirement of the UK Corporate Governance
Code, which the company adopted early with regard to annual
election of directors by shareholders, each director resigned at the
2011 Annual General Meeting, put himself up for re-election and was
re-elected. A change to the Articles, reflecting the resignation of each
director at every Annual General Meeting and their submission for
re-election at each such meeting, will be proposed at the 2012 Annual
General Meeting.
The directors’ total remuneration for the year and their interests in the
shares of the company and its subsidiaries at 31 December 2011 are
disclosed in the Directors’ Remuneration Report on pages 52 to 54.
In accordance with Section 236 of the Companies Act 2006 the
directors disclose a qualifying third-party indemnity provision entered
into between the company and its directors and officers which was
in force at the date of approval of this report. This indemnity gives
contractual force to the Indemnity of Officers provision contained
in the company’s Articles.
Auditors
Separate resolutions to re-appoint KPMG Audit Plc as auditors and to
authorise the directors to agree their remuneration will be proposed at
the Annual General Meeting.
Annual General Meeting
The Notice of Annual General Meeting to be held at the company’s
offices on Friday 20 April 2012 at 12.30 p.m. is contained in a
separate letter from the Chairman accompanying this report.
Corporate Governance
UK Corporate Governance Code statement of compliance
Spectris plc is subject to the UK Corporate Governance Code (‘the
Code’) that is appended to the Listing Rules of the UK Listing
Authority. The Code sets out principles and provisions relating to
the good governance of companies.
Corporate governance has been and remains the responsibility of the
whole Board. This statement describes how the company applied the
principles and complied with the provisions of the Code during 2011.
The Board considers that it was throughout the year and continues to
be in full compliance with the provisions set out in the Code.
Board composition and procedures
The Board meets formally at regular intervals throughout the year to
consider developments in relation to the company’s strategy and
long-term objectives and to review trading results and operational and
business issues. In particular, it deals with those matters reserved to it
for decision, including annual financial planning, the acquisition and
disposal of businesses, major capital expenditure, the appointment
and, where necessary, removal of directors and Board and senior
management succession. Additional meetings are convened as
required to consider specific topics requiring immediate decision.
Usually, at least two meetings each year are held at operating
locations and encompass a detailed review of the relevant business.
Through these meetings, the induction process on appointment and
the access given to the company’s operations and its staff, all directors
gain the knowledge of the company required for them to discharge
their duties. Operational decisions are delegated by the Board to
senior management at trading company level, over which the
executive directors exercise supervision. All directors receive detailed
progress reports one week prior to each Board meeting.
The Board currently comprises the Chairman, three executive directors
and three non-executive directors. The Board considers its non-
executive directors (Peter Chambré, Russell King and John Warren) to
be independent, in that none of them are or have ever been holders
of an executive office with the company. The positions of Chairman,
Chief Executive and senior independent director, are held by separate
individuals and, in accordance with the Code, the Board has adopted
written profiles for the first two of these. The non-executive directors
have all had senior experience in other organisations and offer
independent judgement on Board matters. The Chairman’s other
significant UK listed company interests are as non-executive chairman
of Sepura plc and Telecity Group plc and non-executive director of
Vitec Group plc and CSG International, Inc; the latter company being
quoted on NASDAQ. Mr Hughes is also chairman of privately-held
business Just Eat and Aircom International. The Board believes that the
Chairman’s obligations to the company are unaffected by these
directorships.

Spectris plc Annual Report and Accounts 201142
21119.04 07/03/12 Proof 8
There are procedures for individual Board members to receive
induction and training as appropriate and to solicit independent
professional advice at the group’s expense where specific expertise is
required in the course of exercising their duties. The Chairman reviews
and agrees with each director their training and development needs
annually. All directors have access to the company secretary, who is
responsible for ensuring compliance with appropriate statutes and
regulations.
The Board delegates specific responsibilities to Board committees,
notably the finance, nomination, remuneration, and audit and risk
committees. The terms of reference of these committees are published
on the company’s website and the following additional documents are
available to shareholders on application to the company secretary:
• schedule of matters reserved for decision by the Board;
• responsibilities of the Chairman, the Chief Executive and the
non-executive directors;
Board appointments and performance evaluation
The nomination committee consists of the Chairman, Chief Executive
and all non-executive directors. It is chaired by the Chairman, save in
the event of discussions relating to his succession when the senior
independent director takes the chair.
Following a decision of the Board that the appointment of a new
director is appropriate, the duty of the committee is to present for
Board consideration suitably qualified candidate(s). In making such
recommendations, the committee evaluates the balance of skills,
knowledge and experience on the Board and develops a description of
the role and required capabilities. Due regard is given to the benefits
of diversity on the Board and consideration is given to the time
commitment expected for the Chairman and non-executive director
positions. The Board uses external search firms to identify potential
non-executive directors and they conduct the process systematically,
utilising the evaluation of the committee and against a set of skills and
competences developed from the strategic needs of the business
today and in coming years, whilst also taking into account the present
strengths and any perceived gaps in the knowledge of the Board.
Candidates are then identified for interview. The committee also
makes recommendations to the Board regarding the re-election and/or
re-appointment of any director. Similar selection processes apply for
the appointment of a chairman.
• relations with shareholders;
• performance evaluation; and
• procedure for taking independent professional advice.
The Board has adopted the Institute of Chartered Secretaries and
Administrators’ Guidance Note of September 2009 on Board Meeting
Etiquette.
Under the Companies Act 2006, a director must avoid a situation
where he has, or may have, a direct or indirect interest that conflicts,
or may conflict, with the company’s interests. During the year, in
accordance with the powers and duties of directors laid down in
the company’s Articles, directors were asked to declare any such
conflict or potential conflict of interest to the Board for the Board’s
authorisation of a matter which otherwise may have given rise to a
conflict of interest. No such conflicts have been declared.
Recommendations are also made to the Board concerning succession
plans for both executive and non-executive directors and, in particular,
for the key roles of Chairman and Chief Executive. The committee also
recommends to the Board suitable candidates for the position of
senior independent director.
The nomination committee meets as the need arises. Its terms of
reference can be found on the company’s website.
The operation of the Board and its committees is reviewed by the
Board as a whole annually. The executive directors’ and company
secretary’s performances are appraised annually against objectives
established for the prior year. The contributions of the Chairman
and non-executive directors are reviewed annually by the senior
independent director and the Chairman, respectively, prior to their
being proposed to shareholders for re-election. Additionally, the
Chairman holds periodic meetings with the non-executive directors
only and, led by the senior independent director, the non-executives
have the opportunity to meet at least annually without the Chairman
present. In considering the Chairman’s performance, his other public
company interests were specifically addressed and found to be of
benefit to the Board, in that he brings experiences and insights gained
from these interests which assist the Board in its deliberations.
Directors’ Report continued
Board and committee meeting attendance 2011
BoardRemuneration
committeeAudit and
risk committeeNomination committee
Total meetings during year 15 5 3 3
J L M Hughes (Chairman) 15 5 N/A 3
J A Warren (senior independent director) 15 5 3 3
P A Chambré 15 5 3 3
R J King 15 5 3 3
J E O’Higgins (Chief Executive) 15 N/A N/A 3
C G Watson 15 N/A N/A N/A
J C Webster 14 N/A N/A N/A

Busin
ess
Revi
ewG
over
nanc
eFi
nanc
ial S
tate
men
ts
Spectris plc Annual Report and Accounts 2011 43
An externally-facilitated evaluation of the operation and performance
of the Board and its committees was conducted in 2010. An internal
process followed during 2011. This included submissions from all
Board members in response to a structured questionnaire focused
upon the more significant areas identified during the prior year’s
external process, notably strategy, Board structure and organisation,
succession planning and risk management. A summary of the
submissions received, including comparative data from the 2010
process, was considered at the November Board meeting, with a
number of areas for further debate and action recorded.
Diversity
The Board has considered the Davies Report ‘Women on Boards’ and
the associated consultation by the Financial Reporting Council on
whether to make further changes to the UK Corporate Governance
Code, requiring boards to establish a gender diversity policy. Whilst
the Board is opposed to numerical targets or quotas to address the
representation of specific groups, it recognises the strategic and
business benefits of having a balanced board. Due regard is therefore
given to the benefits of diversity as part of the Board’s normal
refreshment process, with appointments made from candidates with
the appropriate mix of skills, knowledge and experience, regardless of
gender or otherwise. The recruitment of an additional non-executive
director is currently in process and the executive search firm engaged
has signed up to the Voluntary Code of Conduct for Executive Search
Firms. It is therefore expected that a suitably diverse range of
candidates will be presented to the Nomination Committee.
As part of our culture of respect, we believe that people with varied
backgrounds and perspectives add creativity to our company and thus
we encourage diversity in the workplace. The Board recognises the
benefits of all facets of diversity, including experience and perspective,
both at Board level and throughout our business. Spectris operates
globally in more than 30 countries and is focused on growing its
presence in industrialising economies such as China, India and Latin
America and across a broad base of end user markets. We will
continue to strengthen our existing group-wide inclusion policies to
attract and retain the most talented and appropriate people reflecting
the different markets and geographies in which we operate.
Shareholder relations
Spectris conducts regular dialogue with institutional shareholders
and divulges such information as is permitted within the guidelines
of the Listing Rules. The content of presentations made after results
announcements may be accessed by individual investors on the
group’s website, www.spectris.com.
All shareholders are invited to participate in the Annual General
Meeting, where the Chairman, the Chief Executive and the chairmen
of the audit and risk and remuneration committees are available
to answer questions. The results of proxy votes are declared at the
Annual General Meeting after each resolution has been dealt with on
a show of hands. These are then published on the group’s website.
The Board is kept informed of the views of major shareholders
through periodic reports from the Chief Executive and the company’s
joint brokers J P Morgan Cazenove and RBS Hoare Govett. The
Chairman and non-executive directors have the opportunity to
attend the bi-annual analyst presentations.
Shareholders representing in excess of 2.5% of the company’s issued
share capital receive a standing invitation to meet the Chairman, the
senior independent director or new non-executive directors. Such
meetings would supplement if necessary, but not replace, the regular
meetings with the Chief Executive and group finance director.
Audit and risk committee
The audit and risk committee comprises the non-executive directors
and is chaired by John Warren, who has recent and relevant financial
experience as the former group finance director of both United
Biscuits plc and WH Smith PLC. Mr Warren is also the current
chairman of the audit committees of Bovis Homes Group PLC and The
Rank Group Plc. The committee meets at least three times each year
to consider the effectiveness of the group’s internal controls, policies
and procedures, the process of internal audit and the conduct and
outcome of the external audit. Its meetings are normally attended
by the Chairman, the Chief Executive, the group finance director,
the company secretary and the external and internal auditors. All
executive directors attend the year end audit committee meeting and
processes requiring the disclosure of relevant information by individual
directors to the auditor have been adopted. The committee confers
annually with both the head of internal audit and the external auditors
without the attendance of executive directors. Additionally, both the
external audit partner and the head of internal audit have the right
of direct access to the audit and risk committee chairman. The
committee’s terms of reference can be found on the company’s
website.
The committee is responsible for making recommendations to the
Board in relation to the appointment of the external auditor and
then for approving the external auditor’s remuneration, terms of
engagement and scope of work.
The committee has also adopted procedures governing and restricting
the appointment of the external auditor for non-audit services. The
following services are precluded:
• book-keeping or other services related to the accounting records or
financial statements of Spectris plc;
• financial information systems design and implementation;
• appraisal or valuation services, fairness opinions or contribution in
kind reports;
• actuarial services;
• internal audit outsourcing services;
• management functions or human resources;
• broker or dealer, investment adviser or investment banking
services; and
• legal services and expert services unrelated to the audit.
A cumulative annual cap of £200,000 is established for all other
non-audit services (save for acquisition due diligence and taxation
services) above which all engagements are subject to prior approval by
the audit and risk committee.

Spectris plc Annual Report and Accounts 201144
21119.04 07/03/12 Proof 8
The head of internal audit is employed by the group to perform
internal control reviews across the group according to a work
programme agreed by the committee. The head of internal audit is
assisted in this by five further internal auditors. The nature and scope
of the group’s internal control review resources is reviewed by the
audit and risk committee annually. The audit and risk committee
receives reports twice a year on the results of internal control reviews.
The committee has considered the risk of the withdrawal of their
auditor, KPMG Audit Plc, from the market in their risk evaluation and
planning and has concluded that the risk is small. In the event that the
company’s auditor did exit the market, a replacement appointment
would be made from audit firms of equivalent standing. KPMG Audit
Plc were appointed as the company’s auditors on 12 May 1998, but
the nominated audit partner has changed twice subsequently and will
change again prior to the 2012 audit. The position of auditor to the
company is kept under regular review, but KPMG Audit Plc’s in-depth
understanding of the company’s operations is considered by the
committee to be of benefit to both the company and its shareholders.
There are no contractual obligations that act to restrict the
committee’s choice of auditor.
Internal controls
The Board is ultimately responsible for the group’s system of internal
controls and for reviewing its effectiveness. However, such a system
is designed to manage rather than eliminate risk of failure to meet
business objectives and can provide only reasonable and not absolute
assurance against material misstatement or loss.
Consistent with the guidance provided for directors on internal control
by the Financial Reporting Council (‘Internal Control: Revised Guidance
for Directors on the Combined Code’), the Board confirms that there is
an ongoing process for identifying, evaluating and managing assessed
significant risks faced by the group, that this has been in place for the
year under review and up to the date of approval of the annual report
and accounts, that this process has been reviewed by the Board during
the year and that the group accords with the guidance. The Board
affirms the importance it attaches to the continuous review and
application of the guidance, the regular and systematic assessment
of the risks facing the group and the value of embedding risk
management and internal control systems within its business processes.
The group has an internal audit function which reviews the design and
effectiveness of internal controls across the group’s operations, including
financial, operational and compliance controls.
The processes which the Board and the audit and risk committee have
applied in reviewing the effectiveness of the group’s system of internal
controls are summarised below:
• an established process is in place whereby each business unit
regularly assesses, evaluates and reports risks of group significance.
Each business unit is required to document the management and
mitigating actions in place and proposed;
• regular review of the status of risks and corresponding mitigating
actions to ensure that risk management is embedded in day-to-day
management processes and decision-making as well as in the
annual strategic planning cycle;
• the effectiveness of risk management and mitigating actions is
reviewed regularly by the executive directors and twice yearly by
the audit and risk committee;
• additionally, the executive directors consider those risks to the
group’s strategic objectives which are not addressed within the
business units and develop appropriate approaches to managing
and mitigating these risks;
• annual financial plans for each business unit, significant capital
investments or contractual commitments and major acquisitions or
divestments are all subject to review and approval by the Board;
• a Group Accounting and Policies Manual sets out the minimum
standards and procedures to be applied in relation to those risk
areas which are regarded as significant in a group context;
• a process of self-assessment of compliance with the Manual and
reporting thereon has been established, providing for a
documented trail of accountability from business unit presidents
and finance directors to the audit and risk committee. The
necessary actions are taken by the audit and risk committee to
remedy any failings or weaknesses identified by its review of the
internal control system; and
• the executive directors report to the Board on changes in the
business and external environment which present significant risks.
The group finance director provides the Board with monthly
financial information which includes key performance indicators
and information on the group’s operating segments. Regular
reports on significant legal, ethics and compliance issues and
insurance matters are received from the company secretary.
Going concern
Having reviewed the group’s plans and available financial facilities,
the Board has a reasonable expectation that the group has adequate
resources to continue in operational existence for the foreseeable
future. For this reason it continues to adopt the going concern basis
in preparing the group’s accounts.
Business Review
The information that fulfils the requirements of the Business Review,
as required by Section 417 of the Companies Act 2006, and which
should be treated as forming part of this report by reference, is
included in the following sections of the annual report:
• Chairman’s statement on pages 16 and 17.
• Chief Executive’s review on pages 18 and 19.
• Group overview on pages 2 to 5.
• Operating review on pages 20 to 27, which includes a review of
the external environment.
• Principal risks and uncertainties are described on pages 14 to 15.
• Details of the principal operating subsidiaries are set out on pages
20 to 27.
• Financial review on pages 28 to 31.
• Corporate responsibility on pages 32 to 37, which includes the
company’s policy on treatment of its employees.
Directors’ Report continued

Busin
ess
Revi
ewG
over
nanc
eFi
nanc
ial S
tate
men
ts
Spectris plc Annual Report and Accounts 2011 45
Statement of directors’ responsibilities in respect of the annual
report and the financial statements
The directors are responsible for preparing the annual report and the
group and parent company financial statements, in accordance with
applicable law and regulations.
Company law requires the directors to prepare group and parent
company financial statements for each financial year. Under that
law they are required to prepare the group financial statements in
accordance with International Financial Reporting Standards (IFRS)
as adopted by the EU and applicable law and have elected to prepare
the parent company financial statements in accordance with UK
Accounting Standards and applicable law (UK Generally Accepted
Accounting Practice).
Under company law the directors must not approve the financial
statements unless they are satisfied that they give a true and fair view
of the state of affairs of the group and parent company and of their
profit or loss for that period. In preparing each of the group and
parent company financial statements, the directors are required to:
• select suitable accounting policies and then apply them
consistently;
• make judgements and estimates that are reasonable and prudent;
• for the group financial statements, state whether they have been
prepared in accordance with IFRS as adopted by the EU;
• for the parent company financial statements, state whether
applicable UK Accounting Standards have been followed, subject
to any material departures disclosed and explained in the parent
company financial statements; and
• prepare the financial statements on the going concern basis unless
it is inappropriate to presume that the group and parent company
will continue in business.
The directors are responsible for keeping adequate accounting
records that are sufficient to show and explain the parent company’s
transactions and disclose with reasonable accuracy at any time the
financial position of the parent company and enable them to ensure
that its financial statements comply with the Companies Act 2006.
They have general responsibility for taking such steps as are
reasonably open to them to safeguard the assets of the group
and to prevent and detect fraud and other irregularities.
Under applicable law and regulations, the directors are also
responsible for preparing a Directors’ Report, Directors’ Remuneration
Report and Corporate Governance Statement that complies with that
law and those regulations.
The directors are responsible for the maintenance and integrity of
the corporate and financial information included on the company’s
website. Legislation in the UK governing the preparation and
dissemination of financial statements may differ from legislation in
other jurisdictions.
The directors who held office at the date of approval of this Directors’
Report confirm that, so far as they are each aware, there is no relevant
audit information of which the company’s auditors are unaware; and
each director has taken all the steps that he ought to have taken as a
director to make himself aware of any relevant audit information and
to establish that the company’s auditors are aware of that information.
Responsibility statement of the directors in respect of the
annual report
We confirm that to the best of our knowledge:
• the financial statements, prepared in accordance with the
applicable set of accounting standards, give a true and fair view
of the assets, liabilities, financial position and profit or loss of the
company and the undertakings included in the consolidation taken
as a whole; and
• the information that is cross-referred from the Business Review
section of the Directors’ Report includes a fair review of the
development and performance of the business and the position of
the issuer and the undertakings included in the consolidation taken
as a whole, together with a description of the principal risks and
uncertainties that they face.
By order of the Board
Roger Stephens
Secretary
17 February 2012

Spectris plc Annual Report and Accounts 201146
21119.04 07/03/12 Proof 8
Directors’ Remuneration Report
Letter from Russell KingChairman of the remuneration committee
Dear Shareholder,
As the chairman of the remuneration committee, I am pleased to present to you the 2011 Directors’
Remuneration Report of Spectris plc.
Remuneration strategy
Your committee is acutely aware of increasing public scrutiny of executive pay and concern regarding
unmerited payments. At Spectris, the close linkage of reward to the performance of the company has
always been a guiding principle underlying our executive remuneration. The balance of remuneration for the
executive directors is, therefore, such that a very significant part of their overall reward is conditional upon the
attainment of demanding growth-related performance conditions over both the short and long term.
The key elements of the executive directors’ remuneration arrangements thus are:
• base salary and total package including benefits set at or modestly below the median of comparable UK
quoted companies, subject to adjustment up or down to reflect the experience and performance of
individual directors;
• on-target and maximum annual bonus of, respectively, 50% and 100% of salary, only payable on
achievement of stretching profit before tax and individual objectives;
• annual awards under the company’s performance share plan of up to 125% of salary, with vesting after
three years based half upon total shareholder return (‘TSR’) relative to the FTSE 250 index and half upon
real growth in adjusted earnings per share (‘EPS’); and
• long-term investment in the continuing growth of the company, with any annual bonus achieved in excess
of 60% and any performance share plan vesting having to be retained in Spectris shares until a minimum
two times base salary shareholding is achieved.
The anticipated reward mix for the Chief Executive, group finance director and business group director is
shown in the chart below. This assumes Performance Share Plan awards with a value on grant equal to 125%
of the director’s basic salary leading to an expected vesting of 55% of the award (68.75% of basic salary) and
an annual bonus on-plan expectation of 50% of salary.
2011 remuneration
The excellent financial performance of the company in 2011, with adjusted profit before tax (‘PBT’) rising by
45% to record levels, enabled the top end of the profitability target range established for the annual bonus to
be surpassed.
The company has also enjoyed good absolute and relative growth over the three years 2009 to 2011, with
adjusted EPS increasing by 70%, the share price by 140% and the annual dividend by 44% over the period.
Consequently, the performance share plan awards maturing on 25 February 2012 are expected to show
vesting at the upper end of both the EPS and TSR ranges.
Russell King
Chairman of the remuneration committee
■ Base pay 41%
■ Pension 10%
■ Annual bonus 21%
■ Performance Share Plan 28%

Busin
ess
Revi
ewG
over
nanc
eFi
nanc
ial S
tate
men
ts
Spectris plc Annual Report and Accounts 2011 47
Whilst only a snapshot in time, at the end of 2011 the performance share plan grants maturing in 2013
were on track for full vesting on both the EPS (173% growth over the two years 2010 and 2011) and TSR
(performance above upper quintile) performance conditions. The grants made in April 2011 are at a very early
point in their three-year performance period, but with 43% growth in EPS during 2011 and TSR at above
median to the end of 2011, they are so far on track to achieve some level of vesting.
The aggregate pre-tax pay achieved by each executive director in 2011 was as follows:
Base salary
Pensioncontributions
+ in lieu supplements
Benefits in kind + expenses
2011 Bonus
outcome
Share award
exercises
2011 total
£’000
2010 Total
£’000
J E O’Higgins 500 125 19 500 337 1,481 1,104
C G Watson 310 78 19 310 509 1,226 726
J C Webster 268 67 19 268 451 1,073 841
Future reviews
As we have previously advised, it is your committee’s practice only to undertake detailed reviews of executive
compensation every two years, or more, rather than annually. The next such review will be effective 1 January
2013. The committee had decided that a basic salary increase of 2.5% (5% for Mr Watson) should be
awarded to the executive directors at 1 January 2012. However, in light of the current uncertain macro-
economic environment, the executive directors have requested that implementation of this increase should be
deferred until such time as the outlook becomes clearer.
The next compensation review for the Chairman will take place on 1 January 2013 and the fees for the
non-executive directors will also be reviewed by the Board at that time.
Your committee has become aware that the current maximum level of annual award under the performance
share plan has, at 125% of salary, fallen materially behind market norms. The operation of the plan will be
reviewed during the coming year with the intention of submitting proposals to shareholders at the 2013
Annual General Meeting.
I hope that you will support the advisory vote on the 2011 Directors’ Remuneration Report which will be put
to the Annual General Meeting.
Yours faithfully
Russell King
Chairman of the remuneration committee
17 February 2012

Spectris plc Annual Report and Accounts 201148
21119.04 07/03/12 Proof 8
Directors’ Remuneration Report continued
The directors present their remuneration report for the year ended
31 December 2011.
Remuneration committee
The remuneration committee is responsible for recommending to the
Board the broad policy for the remuneration of the Chairman, the
Chief Executive, the executive directors and the company secretary.
The remuneration of non-executive directors is a matter reserved to
the Chairman and executive directors.
Within the terms of the agreed policy, the committee determines:
• the total individual remuneration packages including, where
appropriate, bonuses and share-based incentives;
• the targets for any performance-related incentives;
• the scope of any pension arrangements;
• contractual terms of engagement and any payments to be made
on termination;
• any major changes in employee benefit structures throughout the
company; and
• the policy for authorising claims for expenses from the Chairman
and Chief Executive.
The committee also monitors the level and structure of remuneration
for business unit presidents or managing directors and the head of
corporate development.
The remuneration committee comprises Russell King (chairman), Peter
Chambré, John Hughes and John Warren; being the Chairman (who
was independent on appointment) and the non-executive directors (all
of whom are independent). No member of the committee is a serving
executive at another listed company. The Chief Executive may be in
attendance by invitation and the committee takes into consideration
his recommendations regarding the remuneration of his executive
colleagues. The Chief Executive is not involved in discussions
concerning his own remuneration.
FIT Remuneration Consultants LLP was appointed in August 2011
to advise the committee on various aspects of the Chairman’s and
executive directors’ remuneration. Hewitt New Bridge Street separately
provide services to the company in compiling IFRS 2 reporting on
the company’s share plans and total shareholder return (‘TSR’)
performance calculations in relation to the company’s Performance
Share Plan. FIT Remuneration Consultants LLP was paid £14,660 in
respect of services undertaken in 2011 (2010: £nil). Hewitt New
Bridge Street was paid £51,817 in respect of services undertaken
in 2011 (2010: £30,534). Both FIT Remuneration Consultants LLP
and Hewitt New Bridge Street are members of the Remuneration
Consultants Group and adhere to its Code of Conduct.
The terms of reference of the remuneration committee can be found
on the company’s website and are available on request.
Remuneration policy
The Board, in considering the recommendations of the remuneration
committee, complied throughout the year with the provisions of
the UK Corporate Governance Code (including the principles for
performance-related remuneration set out in Section D). The policy
objective is to ensure that the high calibre individuals required at
board level are fairly and competitively remunerated and incentivised
in a manner consistent with the group’s strategic objectives and
compatible with its risk policies and internal control systems.
Clawback provisions were introduced from January 2011 to
enable variable remuneration to be reclaimed under exceptional
circumstances. Such provisions relate to bonus payments and to
awards made under the company’s Performance Share Plan, were
there to be any miscalculation of entitlement, misstatement of
accounts, or incidence of fraud.
The remuneration committee also regularly reviews the balance
between fixed and variable pay.
Salaries and fees
Base salaries and fees are established by reference to surveys of the
terms offered by comparable UK quoted companies. The starting point
for comparative surveys is the scope of the position and associated
performance of the Chairman, each executive director and the
company secretary. Excluding his own position and performance,
the Chief Executive is responsible for the definition of the scope of
positions and assessment of the performance of each executive
director, for consideration and approval by the remuneration
committee. Salaries for the executive directors are set at competitive
levels, typically based around the market median, although the
remuneration committee reserves the flexibility to respond to
individual circumstances which may cause salaries to be set at a level
higher or lower than market median. Due account is also taken of pay
conditions elsewhere in the company.
The committee had decided that a basic salary increase of 2.5% (5%
for Mr Watson) should be awarded to the executive directors at
1 January 2012. However, in light of the current uncertain macro-
economic environment, the executive directors have requested that
implementation of this increase should be deferred until such time as
the outlook becomes clearer.
A biennial compensation review for the Chairman is undertaken on
a similar basis as that for the executive directors and is next due at
1 January 2013. Fees for the non-executive directors will also next be
reviewed by the Board at that date. Neither the Chairman nor the
non-executive directors participate in the company’s incentive or
benefit programmes.
Bonuses
To align remuneration with shareholders’ interests, a proportion of
executive directors’ potential total remuneration is related to annual
corporate performance. Bonuses of up to 100% of base salary are
achievable upon the attainment of demanding profit before tax (75%
potential) and personal (25% potential) targets set in relation to
carefully considered business plans. Bonus payments commence only
at a level which shows an acceptable financial result in the context of
economic circumstances and market expectations, with an ‘on-plan’
performance yielding a payment of half the maximum potential.
Targets for maximum outturn are set at highly stretching, albeit
attainable, levels. Bonuses achieved in respect of 2011 performance,
based on the targets set at the start of the financial year, were as
follows (as a percentage of salary at 31 December 2011):
J E O’Higgins 100%
C G Watson 100%
J C Webster 100%

Busin
ess
Revi
ewG
over
nanc
eFi
nanc
ial S
tate
men
ts
Spectris plc Annual Report and Accounts 2011 49
Within the above bonus payments for Mr O’Higgins, Mr Watson and
Mr Webster, 75% related to the profitability target (as the stretch level
of performance was achieved) and 25% related to achievement of
personal targets.
The bonus arrangements for 2012 will operate in a similar manner to
those set out above in respect of 2011.
The remuneration committee keeps under review the company’s
share-based incentive arrangements and takes advice on market
practice. The committee is of the view that offering the opportunity to
be awarded and then retain shares in the company is an important
part of motivating and rewarding senior management by enabling
them to participate in the future growth in value of the company. The
Spectris Performance Share Plan (the ‘Plan’), is intended to support
this objective and to facilitate the retention of key employees over the
longer term.
Under the Plan, annual awards of shares are made which may vest at
the end of a three-year period subject to continued employment, the
satisfaction of challenging performance conditions and justification of
vesting in the context of the overall financial performance of the
company. The maximum award of performance shares that can be
made to a participant in any financial year is limited, under the rules of
the Plan approved in 2006, to shares with a market value equal to
125% of the participant’s salary. The committee’s current policy is to
determine awards to executive directors by reference to a base award
over shares worth 125% of salary, which may be flexed downwards
from year to year depending on corporate and personal performance.
The committee has kept the Plan under review and is conscious that an
award of 125% of salary has fallen materially below market norms and
hence the operation of the Plan will be reviewed during 2012, with the
intention of submitting proposals to shareholders at the 2013 AGM.
Awards to executive directors are currently structured so that half of
the award is subject to an earnings per share (‘EPS’) target and half
subject to a total shareholder return (‘TSR’) target. Each condition
operates over a fixed three-year period with no opportunity for
retesting. These performance criteria are summarised in the tables
below.
company EPS performance
% of award that vests (expressed as a percentage
of one-half of the total number of shares subject to an award)
Consumer Prices Index (‘CPI’) +
12% compound per annum
(‘c.p.a.’)
100%
Between CPI + 5% and 12%
c.p.a.
Pro-rata straight line between
25% and 100%
CPI + 5% c.p.a. 25%
Less than CPI + 5% c.p.a. 0%
company tSR performance relative to the FtSE 250 (excluding
investment trusts)
% of award that vests (expressed as a percentage
of one-half of the total number of shares subject to an award)
Upper quintile or above 100%
Between upper quintile and
median
Pro-rata straight line between
25% and 100%
Median 25%
Below median 0%
The TSR condition is also subject to the underpin that the committee
must satisfy itself that the company’s TSR growth is reflective of its
underlying financial performance.
The above criteria will continue to apply to Plan awards made in 2012.
For awards in excess of 100% of salary, the committee stipulates, in
accordance with undertakings provided on approval of the Plan, that
the percentage of an award that will vest for threshold performance
will be limited to 25% of a participant’s base salary rather than 25%
of the number of shares subject to an award, with pro-rata straight
line vesting from this lower point up to 100% of the award.
The committee considers the above performance conditions to be an
appropriate means of aligning the interests of participants with those
of longer-term shareholders. The TSR performance condition is
measured independently by Hewitt New Bridge Street and the EPS
condition is verified by the company’s auditors.
It is the intention of the committee that all future share-based
incentives granted to executive directors should be made solely under
the Plan. Executive directors may, however, continue also to participate
in grants made under the Spectris Savings Related Share Option
Scheme which is applicable to all UK employees.
Share retention
Each executive director is, subject to personal circumstances, required
to build a retained shareholding in Spectris plc greater than two times
base salary in value within a five-year period from appointment.
Executive directors are required to apply the post-tax benefit of any
vested Plan awards or any bonus payments exceeding 60% of base
salary to the acquisition of shares until this level of shareholding is
achieved. The executive directors all currently have holdings in excess
of this requirement.
Benefits
Mr O’Higgins and Mr Watson have defined contribution pension
arrangements to which the company currently contributes at a
rate of £50,000 p.a. In light of the government’s decision to reduce
the pension lifetime allowance to £1.5 million in 2012 and the
introduction of a maximum pension contribution allowance of
£50,000 p.a. from April 2011, the executive directors are entitled,
at their option, to a taxable salary supplement in lieu of pension
contributions otherwise payable by the company. Mr O’Higgins and
Mr Watson receive such salary supplements, to 25% of their base
salaries in excess of the £50,000 p.a. contributed by the company to

Spectris plc Annual Report and Accounts 201150
21119.04 07/03/12 Proof 8
Directors’ Remuneration Report continued
their pension arrangements. Mr Webster currently has no pension
arrangements contributed to by the company and therefore receives
25% of his base salary as a salary supplement in lieu of pension
contributions.
Company car and health insurance benefits are also made available to
executive directors, subject to income tax.
Contractual terms
All executive directors have rolling contracts subject to 12 months’
notice of termination by either party, or to summary notice in the
event by the director of serious breach of obligations, dishonesty,
serious misconduct or other conduct bringing the company into
disrepute.
Mr O’Higgins’ and Mr Watson’s contracts of employment also contain
an option, at the sole discretion of the Board, for the contract to be
terminated by way of payments in lieu of notice equivalent to 1.4 times
monthly basic salary (which was reduced, in 2011, from the previous
level of 1.65 times to exclude any element of compensation for loss of
bonus). In such circumstances, the director also becomes subject to a
contractual best endeavours obligation to seek alternative employment
and full mitigation reflective of any earnings from a new position
applies so as to reduce the payments otherwise due from the company
during the notice period. Additionally, bonus entitlements are calculated
to the date of termination only. The phased payment provision, subject
to reduction as explained above, applies in lieu of all remuneration and
benefits otherwise payable during the notice period and in full and final
settlement of all employment-related claims. The 0.4 uplift on monthly
salary accounts for the 25% employer pension contribution; company
car, insurance and fuel benefits; mobile telephone provision; life,
disability and medical expenses insurances and settlement of any
statutory employment claims that may arise from termination. No other
payments would be made, including any payment for forward bonus
expectation. Whether the Board elects to apply this payment in lieu
option would depend on the circumstances underlying termination and
the best interests of shareholders at the time.
Mr Webster’s contract, concluded in 1998, does not contain this
option, but does provide for a predetermined compensation payment
in lieu of notice (equivalent to total notice period remuneration –
salary, bonus and benefits) in the event of termination by the
employer within 12 months of a change in control of the group.
Termination payments in other circumstances would be a matter for
negotiation and remain, at the discretion of the committee, subject to
mitigation and/or reduction for accelerated payment.
The committee is aware of the best practice expectations set out in
the 2008 ABI/NAPF joint statement on executive contracts and
severance and has noted the update to the NAPF policy that was
published in January 2009. This guidance, and any future revisions,
will be taken into account before agreeing any future service
contracts. The committee is committed to continuous review of its
policies in the best interests of shareholders.
No compensation payments on termination of employment were
made during the year.
External appointments
Executive directors may retain any payments received in respect of
external non-executive appointments. Such appointments are limited
to one per director at any time and are subject to the approval of the
Board. Mr O’Higgins is a non-executive director of NASDAQ-listed
Exide Technologies and was paid a fee of $76,000 during 2011.
Mr Watson is a non-executive director of Spirax-Sarco Engineering plc
and was paid a fee of £52,000 during 2011. No other external
directorships are held by the executive directors.
Remuneration below board level
Remuneration for presidents of the group’s trading companies is set
at competitive levels to reflect the size, complexity and geographic
locations of these businesses. Base salaries fall within a range between
£132,000 and £318,000. Additionally, the group’s presidents
participate in share awards under the Spectris Performance Share
Plan (typically over 60% of base salary) and in profit-related bonus
arrangements linked to base salary and payable against their business
annual operating profit after exchange, plus or minus a financing
charge/credit arising from changes in working capital over the year.
On plan performance delivers a c. 30% of base salary bonus with the
upper limit of the payment range delivering 50% of base salary.
Internal relativity
The committee is sensitive to the need to set directors’ remuneration
having regard to pay and conditions in the group as a whole and
is satisfied that the approach taken by the company is fair and
reasonable in light of current market practice and the best interests
of shareholders.
Non-executive directors
Non-executive directors’ fees are reviewed biennially and agreed
by the Chairman and executive directors with reference to market
practice. The base fee is supplemented by allowances for chairmanship
of the audit and risk and remuneration committees and the pension
scheme trustee board. There is no participation in bonus, share option,
or pension arrangements and no participation in the Spectris
Performance Share Plan. All non-executive directors’ conditions of
appointment provide for a six-month period of notice and are
renewable at each Annual General Meeting, subject to review prior to
proposal for re-election. There is a presumption that appointments will
not continue beyond nine years in office, at which time non-executive
directors cease to be regarded as independent under the UK
Corporate Governance Code.

Busin
ess
Revi
ewG
over
nanc
eFi
nanc
ial S
tate
men
ts
Spectris plc Annual Report and Accounts 2011 51
Total shareholder return
The following graph indicates the value by the end of 2011 of £100 invested in Spectris plc 5p ordinary shares on 31 December 2006 compared
with the value of £100 invested in the FTSE 250 index (excluding investment trusts) over the same period. The graph was selected as the most
appropriate comparison measure because the company is a constituent member of the FTSE 250 index and the members of the FTSE 250 (excluding
Investment Trusts) form the comparator group for the purposes of the TSR performance test under the Spectris Performance Share Plan.
200
180
160
140
120
100
80
60
4031 December 2006
Valu
e (£
)
31 December 2007 31 December 2008 31 December 2009 31 December 2010 31 December 2011
120Spectris plc
FTSE 250 (excluding Investment Trusts)
Service contracts
The following table sets out a summary of the directors’ service contracts or terms of appointment. Executive directors’ service contracts provide,
subject to statutory rights, for automatic termination on the director reaching the age of 65.
Date of contract Expiry date Notice periodLength of service at
17 February 2012
Executive directors
J E O’Higgins 1.1.06 3.2.29 12 months 6 years 1 month
C G Watson 1.10.06 4.2.23 12 months 5 years 4 months
J C Webster 27.3.98 21.6.15 12 months 18 years 4 months
Non-executive directors
P A Chambré 1.8.06 renewable at each AGM 6 months 5 years 6 months
J L M Hughes 1.6.07 renewable at each AGM 6 months 4 years 8 months
R J King 12.10.10 renewable at each AGM 6 months 1 year 4 months
J A Warren 7.3.06 renewable at each AGM 6 months 5 years 11 months
Mr Webster’s contract provides for a predetermined compensation payment in lieu of notice (equivalent to total notice period remuneration –
salary, bonus and benefits) in the event of termination by the employer within 12 months of a change in control of the group.
Mr O’Higgins’ and Mr Watson’s contracts contain an optional provision, subject to a duty of mitigation, for phased monthly payments equivalent
to 1.4 times monthly salary in lieu of all remuneration and benefits otherwise payable during the notice period and full and final settlement of all
employment-related claims.
The graph above shows the value, at 31 December 2011, of £100 invested in Spectris plc
on 31 December 2006 compared with the value of £100 invested in the FTSE 250 Index
(excluding Investment Trusts) over the same period. Source: Thomson Reuters

Spectris plc Annual Report and Accounts 201152
21119.04 07/03/12 Proof 8
Directors’ Remuneration Report continued
Directors’ remuneration and interests
The auditors are required to report on the information contained in the following sections a) to e).
a) Emoluments of directors excluding pension contributions (£’000)
Salary and/or fees Bonus
Pension salary supplement
Benefits in kind
Taxable expenses
2011 total
2010 Total
Executive directors
J E O’Higgins 500 500 56 14 5 1,075 853
C G Watson 310 310 21 14 5 660 564
J C Webster 268 268 61 19 – 616 504
Non-executive directors
P A Chambré 42 – – – – 42 39
J L M Hughes 165 – – – – 165 140
R J King 50 – – – – 50 9
J A Warren 67 – – – – 67 61
A J Reading – – – – – – 19
1,402 1,078 138 47 10 2,675 2,189
Benefits in kind include company cars, private fuel and medical expenses insurance. Taxable expenses relate to allowances paid in lieu of company
cars and private fuel.
For Mr King and Mr Warren, their base fee of £42,000 p.a. is increased by an additional fee of £8,000 p.a. for their chairmanship of, respectively,
the remuneration and audit and risk committees. Additionally, Mr Warren receives a fee of £16,500 p.a. for his chairmanship of Spectris Pension
Trustees Limited.
b) Directors’ pensions
Company contributions to defined contribution plans:
2011 £’000
2010 £’000
J E O’Higgins 69 107
C G Watson 57 70
J C Webster 6 64
Total 132 241
c) Directors’ total remuneration
2011 £’000
2010 £’000
Aggregate emoluments 2,675 2,189
Company pension contributions to defined contribution schemes 132 241
Gains made on exercise of share-based incentives 1,297 508
4,104 2,938
d) Directors’ interests in options to purchase ordinary shares under the Spectris Savings Related Share Option Scheme (‘SAYE’)
Date granted
Options held
1 Jan 11
Granted during the
yearExercise price (p)
Exercised during the
year
Share price at date of
exercise (p)
Lapsed during the
year
Options held
31 Dec 11Date
exercisableExpiry
date
J E o’higgins
SAYE Oct 2009 1,255 723 1,255 Dec 2012 Jun 2013
total 1,255 1,255

Busin
ess
Revi
ewG
over
nanc
eFi
nanc
ial S
tate
men
ts
Spectris plc Annual Report and Accounts 2011 53
e) Directors’ share awards under the Spectris Performance Share Plan
Number of shares
subject to award at 1 Jan 11
Date granted
Exercise price
(p)
Granted during
the year
Addition
of reinvested dividends*
Exercised during
the year
Market price at exercise
(p)
Lapsed during
the year
Number of shares
subject to award at
31 Dec 11
Market value
of each share at date of award
(p)Date
exercisable Expiry
date
J E o’higgins
53,400 Feb 2008 5 6,616 (28,000) 1210.20 (3,017) 28,999 786.5 Feb 2011 Feb 2018
96,600 Feb 2009 5 96,600 434.5 Feb 2012 Feb 2019
65,400 Mar 2010 5 65,400 818.5 Mar 2013 Mar 2020
Apr 2011 5 44,600 44,600 1401 Apr 2014 Apr 2021
215,400 235,599
c G watson
34,900 Feb 2008 5 3,581 (36,509) 1400.50 (1,972) 0 786.5 Feb 2011 Feb 2018
63,200 Feb 2009 5 63,200 434.5 Feb 2012 Feb 2019
42,800 Mar 2010 5 42,800 818.5 Mar 2013 Mar 2020
Apr 2011 5 27,600 27,600 1401 Apr 2014 Apr 2021
140,900 133,600
J c webster
31,700 Feb 2008 5 3,253 (33,161) 1363.6385 (1,792) 0 786.5 Feb 2011 Feb 2018
57,500 Feb 2009 5 57,500 434.5 Feb 2012 Feb 2019
38,900 Mar 2010 5 38,900 818.5 Mar 2013 Mar 2020
Apr 2011 5 23,900 23,900 1401 Apr 2014 Apr 2021
128,100 120,300
total 484,400 96,100 13,450 (97,670) (6,781) 489,499
* Under the terms of the Performance Share Plan, notional dividends of the company are applied over award shares during the performance
period and exercise period to date of exercise, thus increasing the number of award shares granted. These additional award shares are subject
to application of the performance criteria attaching to the award.
The above awards were made as conditional rights to acquire shares (structured as nominal cost options) and the number of shares awarded was
based on the mid-market closing price of the company’s shares on the business day prior to the date of grant. In respect of the 2011 award, for
each of Mr O’Higgins, Mr Watson and Mr Webster, the value of the award was equivalent to 125% of their base salaries at the date of grant.
Following satisfaction, in whole or part, of the performance criteria attaching to the awards (as summarised on page 49), the directors may call
for the release to them of the vested shares during the above-shown exercise periods.
The awards granted to Mr O’Higgins, Mr Watson and Mr Webster in 2008 of 53,400, 34,900 and 31,700 award shares, respectively, became
exercisable and were exercised by Mr O’Higgins, in part, and by Mr Watson and Mr Webster, in full, during the year. The awards had two
performance conditions attaching to them. The TSR target was met in full (50% of the award) and the EPS target was met to 44.35% of the
award. In determining the level of vesting against the TSR target, the committee took into account the company’s underlying financial
performance. The awards were satisfied from the company’s treasury shares.
The Spectris Performance Share Plan operates within the dilution limits laid down by the Association of British Insurers. 3.4% of the 5% limit has
been utilised.

Spectris plc Annual Report and Accounts 201154
21119.04 07/03/12 Proof 8
Directors’ Remuneration Report continued
Mr O’Higgins retained 28,000 shares arising from the part exercise of his 2008 award on 25 October 2011. The gain on exercise was £337,456.
Mr Watson retained 19,500 shares arising from the exercise of his 2008 award on 10 March 2011 and sold 17,009 shares. The gain on exercise
was £509,483.
Mr Webster sold all 33,161 shares arising from the exercise of his 2008 award on 21 March 2011. The gain on exercise was £450,538.
The aggregate gains on exercise for all directors under the company’s share plans were thus £1,297,477 (2010: £508,456).
f) Directors’ interests
The following directors or their families had beneficial interests in the ordinary shares of the company:
Shareholdings
2011 31 Dec
(or date of resignation)
2011 1 Jan
(or date of appointment)
J L M Hughes 8,000 8,000
J E O’Higgins 131,319 103,319
P A Chambré 5,451 5,344
R J King 3,000 3,000
J A Warren 3,000 3,000
C G Watson 52,982 32,745
J C Webster 118,310 118,310
There were no changes to the above interests between the year end and the date of this report.
No director had during the year or at the end of the year any material interest in any contract of significance to the group’s business.
At 31 December 2011 the middle market closing share price on the London Stock Exchange was 1289p. The highest share price in the year was
1679p and the lowest was 1039p.
g) Loans to directors
During the year there were no outstanding loans to any director.
By order of the Board
Russell King
Chairman of the committee
17 February 2012
Company No. 02025003

Busin
ess
Revi
ewG
over
nanc
eFi
nanc
ial S
tate
men
ts
21119.04 06/03/12 Proof 7
Spectris plc Annual Report and Accounts 2011 55
Independent Auditor’s Report to the Members of Spectris plc
We have audited the financial statements of Spectris plc for the year ended 31 December 2011 which comprise the consolidated statement of income, the consolidated statement of comprehensive income, the consolidated statement of changes in equity, the consolidated statement of financial position, the consolidated statement of cash flows, the parent company balance sheet and the related notes. The financial reporting framework that has been applied in the preparation of the group financial statements is applicable law and International Financial Reporting Standards (IFRS) as adopted by the EU. The financial reporting framework that has been applied in the preparation of the parent company financial statements is applicable law and UK Accounting Standards (UK Generally Accepted Accounting Practice).
This report is made solely to the company’s members, as a body, in accordance with Chapter 3 of Part 16 of the Companies Act 2006. Our audit work has been undertaken so that we might state to the company’s members those matters we are required to state to them in an auditor’s report and for no other purpose. To the fullest extent permitted by law, we do not accept or assume responsibility to anyone other than the company and the company’s members, as a body, for our audit work, for this report, or for the opinions we have formed.
Respective responsibilities of directors and auditor
As explained more fully in the Directors’ Responsibilities Statement set out on page 45, the directors are responsible for the preparation of the financial statements and for being satisfied that they give a true and fair view. Our responsibility is to audit, and express an opinion on, the financial statements in accordance with applicable law and International Standards on Auditing (UK and Ireland). Those standards require us to comply with the Auditing Practices Board’s (APB’s) Ethical Standards for Auditors.
Scope of the audit of the financial statements
A description of the scope of an audit of financial statements is provided on the APB’s website at www.frc.org.uk/apb/scope/private.cfm
Opinion on financial statements
In our opinion:• the financial statements give a true and fair view of the state of the group’s and of the parent company’s affairs as at 31 December 2011 and
of the group’s profit for the year then ended;• the group financial statements have been properly prepared in accordance with IFRS as adopted by the EU;• the parent company financial statements have been properly prepared in accordance with UK Generally Accepted Accounting Practice; and• the financial statements have been prepared in accordance with the requirements of the Companies Act 2006; and, as regards the group
financial statements, Article 4 of the IAS Regulation.
Opinion on other matters prescribed by the Companies Act 2006
In our opinion:• the part of the Directors’ Remuneration Report to be audited has been properly prepared in accordance with the Companies Act 2006; and• the information given in the Directors’ Report for the financial year for which the financial statements are prepared is consistent with the
financial statements.
Matters on which we are required to report by exception
We have nothing to report in respect of the following:Under the Companies Act 2006 we are required to report to you if, in our opinion:• adequate accounting records have not been kept by the parent company, or returns adequate for our audit have not been received from
branches not visited by us; or• the parent company financial statements and the part of the Directors’ Remuneration Report to be audited are not in agreement with the
accounting records and returns; or• certain disclosures of directors’ remuneration specified by law are not made; or• we have not received all the information and explanations we require for our audit.
Under the Listing Rules we are required to review:• the directors’ statement, set out on page 44, in relation to going concern;• the part of the Corporate Governance Statement on page 41 relating to the company’s compliance with the nine provisions of the UK
Corporate Governance Code specified for our review; and• certain elements of the report to shareholders by the Board on directors’ remuneration.
IK Bone (Senior Statutory Auditor)
for and on behalf of KPMG Audit Plc, Statutory Auditor
Chartered Accountants15 Canada SquareLondonE14 5GL17 February 2012

Spectris plc Annual Report and Accounts 201156
21119.04 06/03/12 Proof 7
Consolidated Statement of Income For the year ended 31 December 2011
Note2011
£m2010
£m
Continuing operations
Revenue 5 1,106.2 901.9
Cost of sales (457.5) (375.1)
Gross profit 648.7 526.8
Indirect production and engineering expenses (88.0) (75.4)
Sales and marketing expenses (238.9) (206.0)
Administrative expenses (146.0) (117.5)
Operating profit before acquisition-related items 201.5 142.1
Net acquisition-related costs and contingent consideration fair value adjustments (1.8) (1.9)
Acquisition-related fair value adjustments to inventory (2.1) –
Amortisation of acquisition-related intangible assets (21.8) (12.3)
Operating profit 3, 6 175.8 127.9
Profit on disposal of businesses 26 0.1 –
Financial income 9 7.2 8.2
Finance costs 9 (17.1) (16.2)
Profit before tax 166.0 119.9
Taxation - UK 10 (2.6) (5.5)
Taxation - Overseas 10 (37.1) (18.2)
Profit after tax for the year from continuing operations attributable to owners of the company 126.3 96.2
Basic earnings per share 12 108.7p 83.1p
Diluted earnings per share 12 106.9p 81.6p
Interim dividends paid and final dividends proposed for the year (per share) 11 33.60p 28.00p
Dividends paid during the year (per share) 11 29.10p 24.95p
Spectris uses adjusted figures as key performance measures in addition to those reported under adopted IFRS. Reconciliations showing how the
adjusted performance measures are derived from those reported under adopted IFRS are set out in Note 3.

Busin
ess
Revi
ewG
over
nanc
eFi
nanc
ial S
tate
men
ts
21119.04 06/03/12 Proof 7
Spectris plc Annual Report and Accounts 2011 57
Consolidated Statement of Comprehensive Income For the year ended 31 December 2011
Note2011
£m2010
£m
Profit for the year attributable to owners of the company 126.3 96.2
Other comprehensive income:
Net (loss)/gain on effective portion of changes in fair value of forward exchange contracts (3.8) 0.7
Foreign exchange movements on translation of overseas operations (5.5) 1.3
Net gain on changes in fair value of effective portion of hedges of net investment in overseas operations 2.0 2.2
Actuarial (loss)/gain arising on pension schemes, net of foreign exchange 8 (2.6) 2.1
Tax on items recognised directly in other comprehensive income 10 1.1 0.1
Total comprehensive income for the year attributable to owners of the company 117.5 102.6

Spectris plc Annual Report and Accounts 201158
21119.04 06/03/12 Proof 7
Consolidated Statement of Changes in Equity For the year ended 31 December 2011
Share capital
£m
Share premium
£m
Retained earnings
£m
Translation reserve
£m
Hedging reserve
£m
Merger reserve
£m
Capital redemption
reserve£m
Total equity
£m
Balance at 1 January 2011 6.2 231.4 197.5 75.3 (0.2) 3.1 0.3 513.6
Profit for the year – – 126.3 – – – – 126.3
Other comprehensive income:
Net loss on effective portion of changes in fair value of forward exchange contracts, net of tax – – – – (3.4) – – (3.4)
Foreign exchange movements on translation of overseas operations – – – (5.5) – – – (5.5)
Net gain on changes in fair value of effective portion of hedges of net investment in overseas operations, net of tax – – – 2.0 – – – 2.0
Actuarial loss arising on pension schemes, net of exchange and tax – – (1.9) – – – – (1.9)
Total comprehensive income for the year – – 124.4 (3.5) (3.4) – – 117.5
Distributions to and transactions with owners:
Equity dividends paid – – (33.8) – – – – (33.8)
Share-based payments, net of tax – – 6.4 – – – – 6.4
Share options exercised from own shares (treasury) purchased – – 0.5 – – – – 0.5
Balance at 31 December 2011 6.2 231.4 295.0 71.8 (3.6) 3.1 0.3 604.2

Busin
ess
Revi
ewG
over
nanc
eFi
nanc
ial S
tate
men
ts
21119.04 06/03/12 Proof 7
Spectris plc Annual Report and Accounts 2011 59
Consolidated Statement of Changes in Equity For the year ended 31 December 2010
Share capital
£m
Share premium
£m
Retained earnings
£m
Translation reserve
£m
Hedging reserve
£m
Merger reserve
£m
Capital redemption
reserve£m
Total equity
£m
Balance at 1 January 2010 6.2 231.4 119.5 70.9 (0.5) 3.1 0.3 430.9
Profit for the year – – 96.2 – – – – 96.2
Other comprehensive income:
Net gain on effective portion of changes in fair value of forward exchange contracts, net of tax – – – – 0.3 – – 0.3
Foreign exchange movements on translation of overseas operations – – – 1.3 – – – 1.3
Net gain on changes in fair value of effective portion of hedges of net investment in overseas operations, net of tax – – – 3.1 – – – 3.1
Actuarial gain arising on pension schemes, net of exchange and tax – – 1.7 – – – – 1.7
Total comprehensive income for the year – – 97.9 4.4 0.3 – – 102.6
Distributions to and transactions with owners:
Equity dividends paid – – (28.9) – – – – (28.9)
Share-based payments, net of tax – – 7.1 – – – – 7.1
Share options exercised from own shares (treasury) purchased – – 1.9 – – – – 1.9
Balance at 31 December 2010 6.2 231.4 197.5 75.3 (0.2) 3.1 0.3 513.6
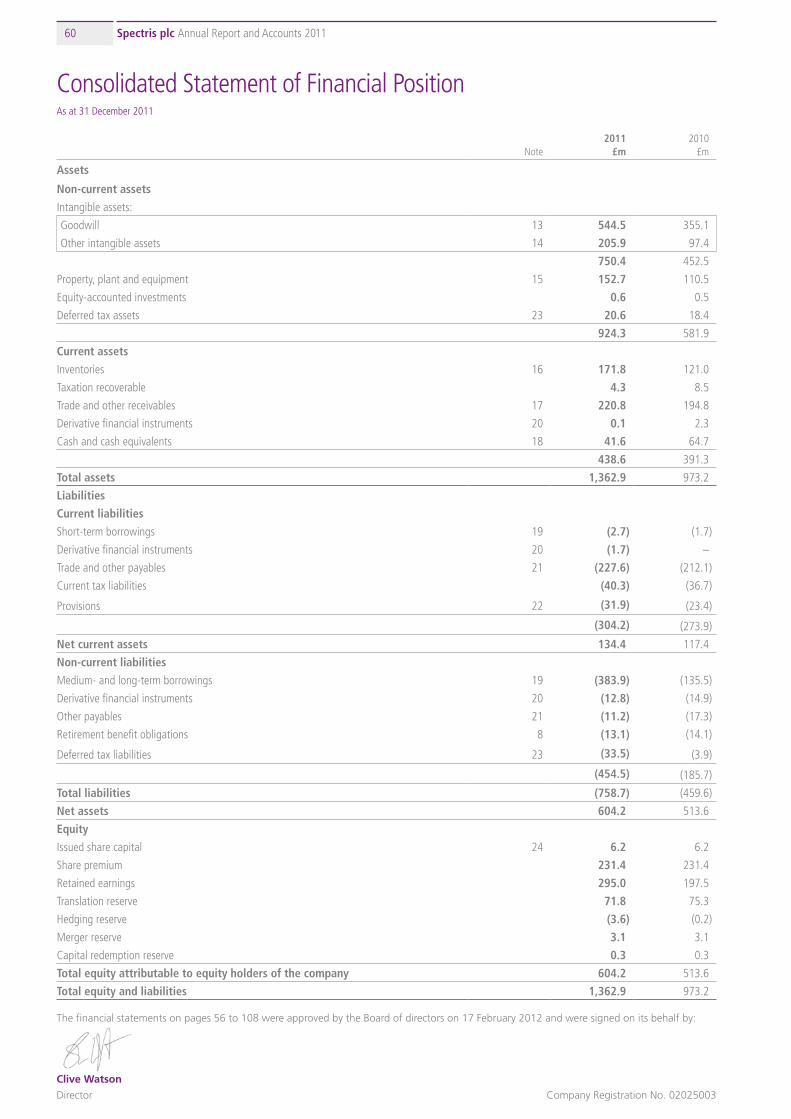
Spectris plc Annual Report and Accounts 201160
21119.04 06/03/12 Proof 7
Consolidated Statement of Financial Position As at 31 December 2011
Note2011
£m2010
£m
Assets
Non-current assets
Intangible assets:
Goodwill 13 544.5 355.1
Other intangible assets 14 205.9 97.4
750.4 452.5
Property, plant and equipment 15 152.7 110.5
Equity-accounted investments 0.6 0.5
Deferred tax assets 23 20.6 18.4
924.3 581.9
Current assets
Inventories 16 171.8 121.0
Taxation recoverable 4.3 8.5
Trade and other receivables 17 220.8 194.8
Derivative financial instruments 20 0.1 2.3
Cash and cash equivalents 18 41.6 64.7
438.6 391.3
Total assets 1,362.9 973.2
Liabilities
Current liabilities
Short-term borrowings 19 (2.7) (1.7)
Derivative financial instruments 20 (1.7) –
Trade and other payables 21 (227.6) (212.1)
Current tax liabilities (40.3) (36.7)
Provisions 22 (31.9) (23.4)
(304.2) (273.9)
Net current assets 134.4 117.4
Non-current liabilities
Medium- and long-term borrowings 19 (383.9) (135.5)
Derivative financial instruments 20 (12.8) (14.9)
Other payables 21 (11.2) (17.3)
Retirement benefit obligations 8 (13.1) (14.1)
Deferred tax liabilities 23 (33.5) (3.9)
(454.5) (185.7)
Total liabilities (758.7) (459.6)
Net assets 604.2 513.6
Equity
Issued share capital 24 6.2 6.2
Share premium 231.4 231.4
Retained earnings 295.0 197.5
Translation reserve 71.8 75.3
Hedging reserve (3.6) (0.2)
Merger reserve 3.1 3.1
Capital redemption reserve 0.3 0.3
Total equity attributable to equity holders of the company 604.2 513.6
Total equity and liabilities 1,362.9 973.2
The financial statements on pages 56 to 108 were approved by the Board of directors on 17 February 2012 and were signed on its behalf by:
Clive Watson
Director Company Registration No. 02025003

Busin
ess
Revi
ewG
over
nanc
eFi
nanc
ial S
tate
men
ts
21119.04 06/03/12 Proof 7
Spectris plc Annual Report and Accounts 2011 61
Consolidated Statement of Cash Flows For the year ended 31 December 2011
Note2011
£m2010
£m
Cash flows from operating activities
Profit after tax 126.3 96.2
Adjustments for:
Tax 10 39.7 23.7
Profit on disposal of businesses 26 (0.1) –
Finance costs 9 17.1 16.2
Financial income 9 (7.2) (8.2)
Depreciation 15 14.9 14.4
Amortisation of intangible assets 14 24.9 14.4
Acquisition-related fair value adjustments to inventory 2.1 –
Contingent consideration fair value adjustments 28 (1.3) –
Gain on sale of property, plant and equipment 6 (0.4) (0.1)
Equity-settled share-based payment transactions 7 6.4 6.6
Operating profit before changes in working capital and provisions 222.4 163.2
Increase in trade and other receivables (7.3) (18.5)
Increase in inventories (24.3) (15.1)
Increase in trade and other payables 9.6 56.6
Increase/(decrease) in provisions and employee benefits 4.0 (10.8)
Corporation tax paid (35.1) (21.0)
Net cash from operating activities 169.3 154.4
Cash flows from investing activities
Purchase of property, plant and equipment and software (29.2) (18.9)
Proceeds from sale of property, plant and equipment 0.8 1.4
Acquisition of businesses, net of cash acquired 28 (369.0) (62.6)
Proceeds from disposal of businesses 0.1 –
Interest received 0.7 1.0
Net cash flows used in investing activities (396.6) (79.1)
Cash flows from financing activities
Interest paid (12.8) (11.1)
Dividends paid 11 (33.8) (28.9)
Proceeds from exercise of share options (treasury shares) 0.5 1.9
Proceeds from borrowings 295.0 46.8
Repayment of borrowings (45.8) (52.8)
Net cash flows generated/(used) in financing activities 203.1 (44.1)
Net (decrease)/increase in cash and cash equivalents (24.2) 31.2
Cash and cash equivalents at beginning of year 63.3 33.7
Effect of foreign exchange rate changes 1.4 (1.6)
Cash and cash equivalents at end of year 18 40.5 63.3
Reconciliation of changes in cash and cash equivalents to movements in net debt Note2011
£m2010
£m
Net (decrease)/increase in cash and cash equivalents (24.2) 31.2
Proceeds from borrowings (295.0) (46.8)
Repayment of borrowings 45.8 52.8
Effect of foreign exchange rate changes 3.4 0.5
Movement in net debt (270.0) 37.7
Net debt at start of year 19 (86.2) (123.9)
Net debt at end of year 19 (356.2) (86.2)

Spectris plc Annual Report and Accounts 201162
21119.04 06/03/12 Proof 7
Notes to the Accounts
1. Accounting policies
General information
Spectris plc is a public limited company incorporated and domiciled in the United Kingdom, whose shares are publicly traded on the London
Stock Exchange.
These financial statements are presented in millions of pounds sterling rounded to the nearest one decimal place. Foreign operations are included
in accordance with the policies set out below.
Statement of compliance and basis of preparation
The group financial statements have been prepared and approved by the directors in accordance with International Financial Reporting Standards
as adopted by the EU (adopted IFRS). The company has elected to prepare its parent company financial statements in accordance with UK
Generally Accepted Accounting Practice; these are presented on pages 109 to 116.
The financial statements are prepared on the historical cost basis except that derivative financial instruments are stated at fair value.
The group’s business activities, together with factors likely to affect its future development, performance and position, are set out in the Business
Review on pages 1 to 27. The financial position of the group, its cash flows, liquidity position and borrowing facilities are described in the
Financial Review on pages 28 to 31. In addition, Note 2 to the financial statements includes the group’s objectives, policies and processes for
managing its capital; its financial risk management objectives; details of its financial instruments and hedging activities; and its exposure to credit
risk and liquidity risk.
Having reviewed the group’s plans and available financial facilities, the Board has a reasonable expectation that the group has adequate resources
to continue its operational existence for the foreseeable future. For this reason, it continues to adopt the going concern basis in preparing the
group’s accounts. There are no key sensitivities identified in relation to this conclusion.
The preparation of financial statements in conformity with adopted IFRS requires management to make judgements, estimates and assumptions
that affect the application of policies and reported amounts of assets and liabilities, income and expenses. The key judgements made in respect
of the appropriateness of the group accounting policies relate to:
• the timing of revenue recognition where the group has some responsibility for installation activity;
• the classification of financial instruments in relation to hedge accounting;
• the classification of retirement benefit arrangements between defined benefit and defined contribution schemes;
• the point at which development activity meets the cost capitalisation threshold.
The directors do not consider the practical application of any of these judgements to involve significant subjectivity or uncertainty.
The estimates and associated assumptions used are continually evaluated and are based on historical experience and various other factors that
are believed to be reasonable under the circumstances. Actual results may differ from these estimates. Revisions to accounting estimates are
recognised in the period in which the estimate is revised if the revision affects only that period or in the period of the revision and future periods
if the revision affects both current and future periods. Estimates that have the most significant effect on the amounts recognised in the financial
statements are recognised in the following areas:
• business combinations in relation to the determination of the fair value of acquired assets and liabilities (Note 28);
• goodwill in relation to the assumptions underpinning impairment testing (Note 13);
• retirement benefit schemes in relation to the assumptions used to value plan assets and liabilities (Note 8);
• provisions and contingent liabilities in relation to determining the quantum and timing of management’s best estimate of outflows
(Notes 22 and 29).
The accounting policies set out below have been applied consistently by group entities to all periods presented in these financial statements.
New standards and interpretations not yet adopted
There are a number of new standards, amendments to standards and interpretations that are not yet effective for the year ended 31 December
2011. None of these have been adopted early in preparing these consolidated financial statements. None of these are anticipated to have any
impact on the results or statement of financial position reported in these consolidated financial statements. None of these new standards,
amendments to standards and interpretations not yet effective are anticipated to materially change the group’s published accounting policies.

Busin
ess
Revi
ewG
over
nanc
eFi
nanc
ial S
tate
men
ts
21119.04 06/03/12 Proof 7
Spectris plc Annual Report and Accounts 2011 63
1. Accounting policies continued
Basis of consolidation
The consolidated financial statements include the results of the company and all of its subsidiary undertakings and associates (equity-accounted
investments).
A subsidiary is an entity controlled by the group. Control is the power to govern the financial and operating policies of the entity so as to obtain
benefits from its activities. The financial statements of subsidiaries are included in the consolidated financial statements from the date that
control commences until the date that control ceases.
Associates are those entities in which the group has significant influence, but not control, over the financial and operating policies. Significant
influence is presumed to exist when the group holds between 20% and 50% of the voting power of another entity. Associates are accounted for
using the equity method of accounting and are recognised initially at cost.
Intra-group balances and any unrealised gains and losses or income and expenses arising from intra-group transactions are eliminated in
preparing the consolidated financial statements.
The assets and liabilities of foreign operations, including goodwill and fair value adjustments arising on consolidation, are translated into
sterling at exchange rates ruling at the balance sheet date. The revenues and expenses of foreign operations are translated into sterling at
average exchange rates. Foreign exchange differences arising on retranslation are recognised directly in a separate translation reserve within the
statement of changes in equity.
Foreign currency transactions
Transactions in foreign currencies are translated at the foreign exchange rate ruling at the date of the transaction. Monetary assets and liabilities
denominated in foreign currencies at the balance sheet date are translated at the exchange rate ruling at that date with any exchange differences
arising on retranslation being recognised in the statement of income. Non-monetary assets and liabilities that are measured in terms of historical
cost in a foreign currency are translated using the exchange rate at the date of the transaction.
Derivative financial instruments may be purchased to hedge the group’s exposure to changes in foreign exchange rates. The accounting policies
applied in these circumstances are described under the heading “Derivative financial instruments and hedge accounting” below.
Interest-bearing borrowings
Interest-bearing borrowings are recognised initially at fair value less attributable transaction costs. Subsequent to initial recognition, interest-
bearing borrowings are stated at amortised cost with any difference between cost and redemption value being recognised in the statement of
income over the period of the borrowings on an effective interest basis.
Derivative financial instruments and hedge accounting
The group uses derivative financial instruments to hedge its exposure to foreign exchange and interest rate risks arising from operating and
financing activities. In accordance with its treasury policy, it does not hold or use derivative financial instruments for trading or speculative
purposes.
Derivative financial instruments are presented as current or non-current based on their contracted maturity dates.
Cash flow hedge accounting
Derivative financial instruments may be transacted to hedge the variability in cash flows of a recognised asset or liability, or of highly probable
forecast transactions, caused by changes in exchange rates.
Derivative financial instruments are carried in the balance sheet at fair value. Where a derivative financial instrument is designated in a cash
flow hedge relationship with a highly probable forecast transaction, the effective part of any gain or loss arising is recognised in the hedging
reserve via the statement of comprehensive income. The ineffective part of any gain or loss is recognised in the statement of income. When the
forecast transaction subsequently occurs and results in the recognition of a financial asset or liability that impacts on the statement of income,
the associated cumulative gain or loss is removed from the hedging reserve and presented within the statement of income. When the forecast
transaction subsequently occurs and results in the recognition of a non-financial asset or liability, the associated cumulative gain or loss is
removed from the hedging reserve and included within the initial cost of the non-financial asset or liability.
Hedge accounting is discontinued when the hedging instrument expires or is either sold, terminated or exercised without replacement or rollover;
or the group revokes the designation; or the hedging instrument no longer qualifies for hedge accounting.
If a derivative financial instrument is not formally designated in a cash flow hedge relationship, any change in fair value is recognised in the
statement of income.

Spectris plc Annual Report and Accounts 201164
21119.04 06/03/12 Proof 7
1. Accounting policies continued
Net investment hedge accounting
The group uses US dollar and euro-denominated borrowings and derivative financial instruments as a hedge against the translation exposure
on the group’s net investment in overseas companies. Where the hedge is fully effective at hedging the variability in the net assets of such
companies caused by changes in exchange rates, the changes in value of the borrowings are recognised in the statement of comprehensive
income. The ineffective part of any change in value caused by changes in exchange rates is recognised in the statement of income.
The group takes advantage of cross-currency swaps for some of its US dollar-denominated private placement borrowings. The swaps have the
effect of converting fixed rate US dollar borrowings into “synthetic” fixed rate euro-denominated borrowings. The value of the element of the
swap that locks interest payments at a fixed euro interest rate changes as US dollar variable interest rates, euro variable interest rates and foreign
currency exchange rates change. Under IAS 39’s rules, such changes in value are considered to be ineffective as a net investment hedge and
accordingly they are recognised in the statement of income.
Business combinations and goodwill
The group applies IFRS 3 (Revised) ‘Business Combinations’ for transactions arising after 1 January 2010. This changed the group’s definition
of the cost of business combinations and the treatment of contingent consideration. The subsequent accounting for contingent consideration
depends on whether this was initially recognised as equity or as a liability and whether the event is considered a measurement period adjustment.
Transaction costs on a business combination are expensed as incurred.
For transactions relating to acquisitions before 1 January 2010, subsequent adjustments to contingent consideration are made against goodwill,
and the transaction costs on a business combination are included in the cost of acquisition and thus capitalised.
All business combinations are accounted for by applying the purchase method. Goodwill represents the excess of the fair value of the purchase
consideration for the interests in subsidiary undertakings over the net fair value to the group of the identifiable assets, liabilities and contingent
liabilities acquired. In respect of acquisitions prior to 1 January 2004, goodwill is included on the basis of its deemed cost which represents the
amount recorded previously under UK GAAP. Prior to 1 January 1998, goodwill was written off to reserves in the year of acquisition.
Goodwill arising on acquisitions is stated at cost less any accumulated impairment losses. Impairment losses on goodwill are not reversed. From
1 January 2004, goodwill is allocated on acquisition to cash-generating units that are anticipated to benefit from the combination, and is no
longer amortised but is tested annually for impairment. Impairment is determined by assessing the recoverable amount of the cash-generating
unit to which the goodwill relates. This estimate of recoverable amount is determined at each balance sheet date. The group’s identified cash-
generating units are smaller than reportable segments.
The estimate of recoverable amount requires significant assumptions to be made and is based on a number of factors such as the near-term
business outlook for the cash-generating unit, including both its operating profit and operating cash flow performance. Where the recoverable
amount of the cash-generating unit is less than the carrying amount, an impairment loss is recognised. Where goodwill forms part of a cash-
generating unit and part of the operation within that unit is disposed of, the goodwill associated with the operation disposed of is included in
the carrying amount of the operation when determining the gain or loss on disposal. Goodwill disposed of in this circumstance is measured on
the basis of the relative values of the operation disposed of and the portion of the cash-generating unit retained.
Segmental reporting
An operating segment is a distinguishable component of the group that is engaged in business activities from which it may earn revenues and
incur expenses, and whose operating results are reviewed regularly by the Chief Operating Decision Maker to make decisions about resources to
be allocated to the segment and assess its performance, and for which discrete financial information is available.
Reportable segments are operating segments that either meet the thresholds and conditions set out in IFRS 8 or are considered by the Board to
be appropriately designated as reportable segments.
Segment results are the results reviewed by the Chief Operating Decision Maker and represent adjusted operating profits (for definitions, see
Note 3) and include an allocation of head office expenses. Segment results exclude tax and financing items.
Segment assets comprise goodwill, other intangible assets, property, plant and equipment, inventories, trade and other receivables. Segment
liabilities comprise trade and other payables, provisions and other payables. Unallocated items represent corporate and deferred taxation
balances, defined benefit scheme liabilities and all components of net debt.
Notes to the Accounts continued

Busin
ess
Revi
ewG
over
nanc
eFi
nanc
ial S
tate
men
ts
21119.04 06/03/12 Proof 7
Spectris plc Annual Report and Accounts 2011 65
1. Accounting policies continued
Intangible assets
The cost of acquiring software (including associated implementation costs where applicable) that is not specific to an item of property, plant and
equipment is classified as an intangible asset.
Self-funded research and development costs are charged to the statement of income in the year in which they are incurred unless development
expenditure meets certain strict criteria for capitalisation. These criteria include demonstration of the technical feasibility and intent of completing
a new intangible asset that will be available for sale and that the asset will generate probable future economic benefits. From the point where
expenditure meets the criteria, development costs are capitalised and amortised over their useful economic lives. The directors consider that, due
to the nature of projects undertaken, the proportion of development costs incurred that meets the criteria for capitalisation is immaterial.
Other intangible assets that are separately acquired by the group are stated at cost less accumulated amortisation and impairment losses.
Subsequent expenditure is capitalised only when it increases the future economic benefits, otherwise it is expensed as incurred.
Intangible assets arising from a business combination are recognised at fair value.
Amortisation of intangible assets is charged to administrative expenses in the statement of income on a straight-line basis over the estimated
useful lives of intangible assets determined on an asset-by-asset basis. The estimated useful lives are as follows:
Software — 3 to 5 years
Patents and contractual rights — up to 10 years, dependent upon the nature of the underlying contractual right
Technology — up to 10 years, dependent upon the nature of the underlying technology acquired
Trade names — up to 20 years
Customer-related — 3 to 10 years, dependent upon the underlying contractual arrangements and specific circumstances such as customer
retention experience
Property, plant and equipment
Property, plant and equipment is stated at cost (which from 1 January 2009 includes capitalised borrowing costs where appropriate) less
accumulated depreciation and impairment losses. The group recognises in the carrying amount of property, plant and equipment the additions
that are appropriate to capitalise and the subsequent costs of replacing the parts of such items when there are future economic benefits that will
flow to the group and its cost can be measured reliably. Cost includes expenditure that is directly attributable to the acquisition of the asset cost.
All other costs are recognised in the statement of income as an expense as they are incurred.
Depreciation is recognised in the statement of income on a straight-line basis to write off the cost, less the estimated residual value (which is
reviewed annually), of property, plant and equipment over its estimated useful life. The depreciation charge is revised where useful lives are
different from previously estimated, or where technically obsolete assets are required to be written down. Where parts of an item of plant and
equipment have separate lives, they are accounted for and depreciated as separate items. Land is not depreciated. Estimated useful lives are as
follows:
Freehold and long leasehold property — 20 to 40 years
Short leasehold property — over the period of the lease
Plant and equipment — 3 to 20 years
Impairment of tangible and intangible assets excluding goodwill
The carrying amount of the group’s assets is reviewed at each balance sheet date to determine whether there is any indication of impairment. If
any such indication exists, the asset’s recoverable amount is estimated. Where the asset does not generate cash flows that are independent from
other assets, the group estimates the recoverable amount of the cash-generating unit to which the asset belongs. Any intangible asset with an
indefinite useful life is tested for impairment annually and whenever there is an indication that the asset may be impaired. The group currently
has no such assets.
Recoverable amount is the higher of fair value less costs to sell and value in use. In assessing value in use, the estimated future cash flows are
discounted to their present value using a pre-tax discount rate that reflects current market assessments of the time value of money and the risks
specific to the asset for which the estimates of future cash flows have not been adjusted.

Spectris plc Annual Report and Accounts 201166
21119.04 06/03/12 Proof 7
1. Accounting policies continued
If the recoverable amount of an asset is estimated to be less than its carrying amount, the carrying amount is reduced to its recoverable amount
with the impairment loss recognised as an operating expense immediately.
Where an impairment loss subsequently reverses, the carrying amount of the asset is increased to the revised estimate of its recoverable amount,
but so that the increased carrying amount does not exceed the carrying amount that would have been determined had no impairment loss been
recognised for the asset in prior years. A reversal of an impairment loss is recognised as income immediately.
Trade and other receivables
Trade and other receivables are initially recognised at their fair value and are subsequently reduced by appropriate allowances for estimated
irrecoverable amounts. Discounting is applied where it is expected to have a material impact.
Inventories
Inventories and work in progress are carried at the lower of cost and net realisable value. Inventory acquired as part of business combinations
is valued at fair value less cost to sell. Cost represents direct costs incurred and, where appropriate, production or conversion costs and other
costs to bring the inventory to its existing location and condition. In the case of manufacturing inventory and work in progress, cost includes an
appropriate share of production overheads based on normal operating capacity. Inventory is accounted for on a first-in, first-out basis or, in some
cases, a weighted average basis is used if deemed more appropriate for the business. Provision is made to write down slow-moving and obsolete
items to net realisable value, based on an assessment of technological and market developments and on an analysis of historic and projected
usage with regard to quantities on hand.
Cash and cash equivalents
Cash and cash equivalents comprises cash balances and call deposits. Bank overdrafts that are repayable on demand and form an integral part of
the group’s cash management are included as a component of cash equivalents for the purposes of the statement of cash flows.
Trade and other payables
Trade and other payables are initially recognised at fair value.
Provisions
A provision is recognised in the balance sheet when the group has a present legal or constructive obligation as a result of a past event and it is
probable that an outflow of economic benefits will be required to settle the obligation. In respect of warranties, a provision is recognised when
the underlying products or services are sold. Provisions are recognised at an amount equal to the best estimate of the expenditure required to
settle the group’s liability. Obligations arising from restructuring plans are recognised when detailed formal plans have been established and when
there is a valid expectation that such a plan will be carried out.
Post-retirement benefits
The group operates pension schemes providing benefits based on final pensionable pay. The assets of the schemes are held separately from
those of the group. The group’s net obligation in respect of defined benefit pension plans is calculated separately for each plan by estimating
the amount of future benefit that employees have earned in return for their service in the current and prior periods; that benefit is discounted to
determine its present value, and the fair value of any plan assets is deducted. The discount rate is determined by reference to market yields at the
balance sheet date on high quality corporate bonds that have maturity dates approximating to the terms of the group’s obligations.
The calculation is performed by a qualified actuary using the projected unit method. Actuarial gains and losses are recognised in full in the year in
which they arise in the statement of comprehensive income.
When the benefits of a plan are improved, the portion of the increased benefit relating to past service by employees is recognised as an expense
in the statement of income on a straight-line basis over the average period until the benefits become vested. To the extent that the benefits
vest immediately, the expense is recognised immediately in the statement of income. Similarly, any cost or income relating to the curtailment or
settlement of a pension scheme is recognised as a cost or income immediately in the statement of income.
For defined contribution schemes, the assets are held separately from those of the group in independently administered funds. Payments to
defined contribution schemes are charged to the statement of income as they fall due.
In certain countries, the group participates in industry-wide defined benefit-type pension arrangements. In such circumstances, it is not possible
to determine the amount of any surplus or deficit attributable to the group and the pension costs are accounted for as if the arrangements were
defined contribution schemes. These are not material to the group and accordingly no additional disclosures are provided.
Notes to the Accounts continued

Busin
ess
Revi
ewG
over
nanc
eFi
nanc
ial S
tate
men
ts
21119.04 06/03/12 Proof 7
Spectris plc Annual Report and Accounts 2011 67
1. Accounting policies continued
Other long-term employee benefits
The group’s net obligation in respect of long-term employee benefits other than pension plans is the amount of future benefit that employees
have earned in return for their service in the current and prior periods; that benefit is discounted to determine its present value, and the fair value
of any plan assets is deducted. The discount rate is determined by reference to market yields at the balance sheet date on high quality corporate
bonds that have maturity dates approximating to the terms of the group’s obligations.
Share-based payments
The fair value of equity-settled employee share option grants is calculated at the grant date. The resulting cost is charged to the statement of
income over the vesting period of the plans. The value of the charge is adjusted to reflect expected and actual levels of options that vest, except
where forfeiture is only due to share prices not achieving the threshold for vesting.
Revenues
Revenues comprise sales to outside customers after discounts and excluding value added tax and similar sales taxes.
Revenue from the sale of goods is recognised in the statement of income when the significant risk and rewards of ownership of the goods
have been transferred to the customer, which is typically on delivery. For contracts that involve a significant element of installation or testing of
equipment, revenue is recognised at the point of customer acceptance. Revenue from services rendered is recognised in the statement of income
in proportion to the measurement of the stage of completion of services rendered as at the balance sheet date. This is assessed by reference to
the amount of time incurred in proportion to the total expected time to be taken to deliver the service.
Occasionally, the initial contract covers both the supply of goods and ongoing support, servicing and maintenance. For such contracts revenue is
allocated across the components in line with their relative value and each element is accounted for as described above.
The group has an immaterial amount of activity accounted for under IAS 11, Construction Contracts, and accordingly the applicable disclosures
for these types of contracts are not provided.
Interest payable and receivable
Interest payable comprises the interest payable on borrowings calculated using the effective interest method. Interest receivable is recognised in
the statement of income as it accrues.
Leasing
Leases are classified as finance leases whenever the terms of the lease transfer substantially all the risks and rewards of ownership to the lessee.
All other leases are classified as operating leases.
Rentals payable under operating leases are charged to the statement of income on a straight-line basis over the term of the relevant lease.
Benefits received and receivable as an incentive to enter into an operating lease are also spread on a straight-line basis over the lease term.
Taxation
Tax on the profit or loss for the year comprises both current and deferred tax. Tax is recognised in the statement of income except to the extent
that it relates to items recognised either in other comprehensive income or directly in equity, in which case tax is recognised in the statement of
comprehensive income or statement of changes in equity, respectively.
Current tax is the expected tax payable on the taxable income for the year, using tax rates enacted or substantively enacted at the balance sheet
date, and any adjustments to tax payable in respect of previous years.
Deferred tax is provided using the balance sheet method, providing for temporary differences between the carrying amounts of assets and
liabilities for financial reporting purposes and the amounts used for taxation purposes. A deferred tax asset is recognised only to the extent that
it is probable that future taxable profits will be available against which the asset can be utilised.
Additional income taxes that arise from the distribution of intra-group dividends are recognised at the same time as the liability to pay the
related dividend.

Spectris plc Annual Report and Accounts 201168
21119.04 06/03/12 Proof 7
2. Financial risk management
The group’s multinational operations and debt financing expose it to a variety of financial risks. In the course of its business, the group is exposed
to foreign currency risk, interest rate risk, liquidity risk, and credit risk. Financial risk management is an integral part of the way the group is
managed. Financial risk management policies are set by the Board of directors. These policies are implemented by a central treasury department
that has formal procedures to manage foreign exchange risk, interest rate risk, and liquidity risk, including, where appropriate, the use of
derivative financial instruments. The group has clearly defined authority and approval limits.
In accordance with its treasury policy, the group does not hold or use derivative financial instruments for trading or speculative purposes. Such
instruments are only used to manage the risks arising from operating or financial assets or liabilities or highly probable future transactions. The
quantitative analysis of financial risk is included in Note 20.
(a) Foreign currency risk
Foreign currency risk arises both where sale or purchase transactions are undertaken in currencies other than the respective functional currencies
of group companies (transactional exposures) and where the results of overseas companies are consolidated into the group’s reporting currency
of £ sterling (translational exposures). The group has operations around the world which record their results in a variety of different local
functional currencies. In countries where the group does not have operations, it invariably has some customers or suppliers that transact in a
foreign currency. The group is therefore exposed to the changes in foreign currency exchange rates between a number of different currencies but
the group’s primary exposures relate to the US dollar, euro, Danish krone, Swiss franc and Japanese yen. Where appropriate, the group manages
its foreign currency exposures using derivative financial instruments.
The group manages its transactional exposures to foreign currency risks through the use of forward exchange contracts. Forward exchange
contracts are typically used to hedge highly probable transactions which can be forecast to occur from anything between 1 and 18 months into
the future.
The group’s translational exposures to foreign currency risks can relate both to the statement of income and net assets of overseas subsidiaries.
The group’s policy is not to hedge the translational exposure that arises on consolidation of the statement of income of overseas subsidiaries.
The group finances overseas company investments partly through the use of foreign currency borrowings in order to provide a natural hedge
of foreign currency risk arising on translation of the group’s foreign currency subsidiaries. The quantitative analysis of foreign currency risk is
included in Note 20.
(b) Interest rate risk
Interest rate risk comprises both the interest rate price risk that results from borrowing at fixed rates of interest and also the interest cash flow risk
that results from borrowing at variable rates. Where appropriate, interest rate swaps are used to manage the group’s interest rate profile.
As at 31 December 2011 the majority of the group’s borrowings attract floating rates of interest linked to LIBOR and therefore the group’s
principal interest rate risk is a cash flow risk. Quantitative analysis of interest rate risk is included in Note 20.
(c) Liquidity risk
Liquidity risk represents the risk that the group will not be able to meet its financial obligations as they fall due. The group’s approach to
managing this risk is to ensure, as far as possible, that it will always have sufficient liquidity to meet its liabilities when due, under both normal
and stressed conditions, without incurring unacceptable losses or risking damage to the group’s reputation. The group manages this risk through
the use of regularly updated cash flow and covenant compliance forecasts and a liquidity headroom analysis which is used to determine funding
requirements. Adequate committed lines of funding are maintained from high quality investment grade lenders. The facilities committed to the
group as at 31 December 2011 are set out in Note 19.
(d) Credit risk
Credit risk arises because a counterparty may fail to perform its obligations. The group is exposed to credit risk on financial assets such as cash
balances, derivative financial instruments, trade and other receivables.
The group’s credit risk is primarily attributable to its trade receivables. The amounts recognised in the balance sheet are net of appropriate
allowances for doubtful receivables, estimated by the group’s management based on prior experience and their assessment of the current
economic environment. Trade receivables are subject to credit limits and control and approval procedures in the operating companies. Due to
its large geographic base and number of customers, the group is not exposed to material concentrations of credit risk on its trade receivables.
Quantitative analysis of credit risk to receivables is included in Note 17.
Credit risk associated with cash balances and derivative financial instruments is managed centrally by transacting with an existing relationship
bank with strong investment grade rating. Accordingly, the group’s associated credit risk is limited. The group has no significant concentration of
credit risk.
The group’s maximum exposure to credit risk is represented by the carrying amount of each financial asset, including derivative financial
instruments, in the group balance sheet (see Note 20).
Notes to the Accounts continued

Busin
ess
Revi
ewG
over
nanc
eFi
nanc
ial S
tate
men
ts
21119.04 06/03/12 Proof 7
Spectris plc Annual Report and Accounts 2011 69
2. Financial risk management continued
Capital management
The Board considers equity shareholders’ funds together with committed debt facilities as capital for the purposes of funding the group’s
operations. Total managed capital at 31 December is:
2011
£m2010
£m
Equity shareholders’ funds (page 60) 604.2 513.6
Committed debt facilities 500.9 229.5
1,105.1 743.1
Ordinary shares are classified as equity. Incremental costs directly attributable to the issue of ordinary shares and share options are recognised as a
deduction from equity, net of any tax effects.
The Board’s policy is to maintain a strong capital base so as to maintain investor, creditor and market confidence and to sustain future
development of the business. The Board of directors monitors both the demographic spread of shareholders and the level of dividends to
ordinary shareholders.
The Board encourages employees to hold shares in the company. This is carried out through a Save As You Earn option scheme in the UK, as well
as Performance Share Plans. Full details of these schemes are given in the Share-based payments note (Note 25) of these accounts.
The Board seeks to maintain a balance between the higher returns that might be possible with higher levels of borrowings, the advantages and
security afforded by a sound capital position and the benefits of an implied investment grade credit rating.
In line with this objective, the group financed its 2011 acquisitions from existing cash and a new US$550 million five-year revolving credit facility.
The main financial covenants in the company’s debt facilities are the ratio of net debt to adjusted earnings before interest, tax, depreciation and
amortisation and the ratio of finance charges to adjusted earnings before interest, tax and amortisation. At 31 December 2011 the company
had, and is expected to continue to have, significant headroom under these financial covenant ratios.
From time to time the group purchases its own shares in the market; the timing of these purchases depends on market prices. Buy and sell
decisions are made on a specific transaction basis by the Board.
There were no changes to the group’s approach to capital management during the year.
Neither the company nor any of its subsidiaries are subject to externally imposed capital requirements.
3. Adjusted performance measures
Spectris uses adjusted figures as key performance measures in addition to those reported under adopted IFRS. Adjusted figures exclude certain
non-operational items which management has defined as amortisation and impairment of acquisition-related intangible assets, acquisition-
related costs and contingent consideration fair value adjustments, acquisition-related fair value adjustments to inventory, profits or losses on
termination or disposal of businesses, unrealised changes in the fair value of financial instruments, gains or losses on retranslation of short-term
inter-company loan balances, related tax effects and other tax items which do not form part of the underlying tax rate (see Note 10).
Management has modified the definition of the adjusted performance measures to include acquisition-related fair value adjustments to inventory
carried at fair value less cost to sell, to provide an adjusted profit measure that will include results from acquired businesses on a consistent basis
over time to assist comparison of performance. This adjustment was not material in the past.
The adjusted performance measures are derived from the reported figures under adopted IFRS as follows:
Adjusted operating profit
Note2011
£m2010
£m
Operating profit as reported under adopted IFRS 175.8 127.9
Net acquisition-related costs and contingent consideration fair value adjustments 28 1.8 1.9
Acquisition-related fair value adjustments to inventory 28 2.1 –
Amortisation of acquisition-related intangible assets 14 21.8 12.3
Adjusted operating profit 201.5 142.1

Spectris plc Annual Report and Accounts 201170
21119.04 06/03/12 Proof 7
3. Adjusted performance measures continued
Adjusted operating profit by segment – 2011
Note
Materials Analysis
£m
Test and Measurement
£m
In-lineInstrumentation
£m
Industrial Controls
£m
2011 Total
£m
Operating profit as reported under adopted IFRS 56.0 48.5 60.3 11.0 175.8
Net acquisition-related costs and contingent consideration fair value adjustments – 0.3 (0.9) 2.4 1.8
Acquisition-related fair value adjustments to inventory – – 0.2 1.9 2.1
Amortisation of acquisition-related intangible assets 4.9 5.9 4.2 6.8 21.8
Adjusted operating profit: segment result under adopted IFRS 4 60.9 54.7 63.8 22.1 201.5
Adjusted operating profit by segment – 2010
Note
Materials Analysis
£m
Test and Measurement
£m
In-lineInstrumentation
£m
Industrial Controls
£m
2010 Total
£m
Operating profit as reported under adopted IFRS 34.7 28.3 57.1 7.8 127.9
Net acquisition-related costs and contingent consideration fair value adjustments 1.2 0.2 0.3 0.2 1.9
Amortisation of acquisition-related intangible assets 3.6 6.3 0.9 1.5 12.3
Adjusted operating profit: segment result under adopted IFRS 4 39.5 34.8 58.3 9.5 142.1
Return on sales by segment – 2011Materials Analysis
Test and Measurement
In-lineInstrumentation
Industrial Controls
2011Total
Using operating profit as reported under adopted IFRS 16.6% 14.0% 19.5% 9.7% 15.9%
Using adjusted operating profit 18.1% 15.8% 20.6% 19.6% 18.2%
Return on sales by segment – 2010Materials Analysis
Test and Measurement
In-lineInstrumentation
Industrial Controls
2010 Total
Using operating profit as reported under adopted IFRS 12.8% 9.5% 20.9% 13.0% 14.2%
Using adjusted operating profit 14.5% 11.7% 21.3% 15.9% 15.8%
Notes to the Accounts continued

Busin
ess
Revi
ewG
over
nanc
eFi
nanc
ial S
tate
men
ts
21119.04 06/03/12 Proof 7
Spectris plc Annual Report and Accounts 2011 71
3. Adjusted performance measures continued
Reconciliation to adjusted profit before tax and adjusted operating profit
Note2011
£m2010
£m
Profit before tax as reported under adopted IFRS 166.0 119.9
Add/(deduct):
Net acquisition-related costs and contingent consideration fair value adjustments 28 1.8 1.9
Acquisition-related fair value adjustments to inventory 28 2.1 –
Amortisation of acquisition-related intangible assets 14 21.8 12.3
Net gains on retranslation of short-term inter-company loan balances 9 (0.4) (0.4)
Profit on disposal of businesses 26 (0.1) –
Decrease/(increase) in fair value of cross-currency interest rate swaps 20 0.4 (1.4)
Adjusted profit before tax 191.6 132.3
Adjusted net finance costs (see below) 9.9 9.8
Adjusted operating profit 201.5 142.1
Adjusted net finance costs
Note2011
£m2010
£m
Net interest costs as reported under adopted IFRS 9 (9.9) (8.0)
Decrease/(increase) in fair value of cross-currency interest rate swaps 20 0.4 (1.4)
Net gains on retranslation of short-term inter-company loan balances 9 (0.4) (0.4)
Adjusted net finance costs (9.9) (9.8)
Adjusted operating cash flow
Note2011
£m2010
£m
Net cash from operating activities under adopted IFRS 169.3 154.4
Acquisition-related costs paid 28 3.1 1.9
Corporation tax paid 35.1 21.0
Purchase of property, plant and equipment and software (29.2) (18.9)
Proceeds from sale of property, plant and equipment 0.8 1.4
Adjusted operating cash flow 179.1 159.8

Spectris plc Annual Report and Accounts 201172
21119.04 06/03/12 Proof 7
3. Adjusted performance measures continued
Adjusted earnings per share
Note2011
£m2010
£m
Profit after tax as reported under adopted IFRS 126.3 96.2
Adjusted for:
Net acquisition-related costs and contingent consideration fair value adjustments 28 1.8 1.9
Acquisition-related fair value adjustments to inventory 28 2.1 –
Amortisation of acquisition-related intangible assets 14 21.8 12.3
Profit on disposal of businesses 26 (0.1) –
Decrease/(increase) in fair value of cross-currency interest rate swaps 20 0.4 (1.4)
Net gains on retranslation of short-term inter-company loan balances 9 (0.4) (0.4)
Tax effect of the above and other non-recurring items 10 (7.8) (8.3)
Adjusted earnings 144.1 100.3
Weighted average number of shares outstanding (millions) 12 116.2 115.8
Adjusted earnings per share (pence) 124.1 86.6
Adjusted diluted earnings per shareNote 2011 2010
Adjusted earnings (as above) (£m) 144.1 100.3
Diluted weighted average number of shares outstanding (millions) 12 118.1 117.9
Adjusted diluted earnings per share (pence) 122.0 85.1
Basic and diluted earnings per share in accordance with IAS 33 are disclosed in Note 12.
Analysis of net debt for management purposes
Note2011
£m2010
£m
Bank overdrafts 1.1 1.4
Bank loans – secured 1.9 2.2
Bank loans – unsecured 298.3 48.3
Unsecured loan notes 85.3 85.3
Cross-currency interest rate swaps – currency portion 20 11.2 13.7
Total borrowings 397.8 150.9
Cash balances 18 (41.6) (64.7)
Net debt 356.2 86.2
4. Operating segments
The group has four reportable segments, as described below, which are the group’s strategic business units. These units offer different applications, assist companies at various stages of the production cycle and are focused towards specific industries. These segments reflect the internal reporting provided to the Chief Operating Decision Maker (considered to be the Board) on a regular basis. The following summary describes the operations in each of the group’s reportable segments.
• Materials Analysis provides a range of analytical instrumentation to the metals and mining, pharmaceutical and fine chemicals, and electronics industries, and also to academic and research institutions.
• Test and Measurement supplies test, measurement and analysis equipment and software for product design optimisation, manufacturing control and environmental monitoring systems.
• In-line Instrumentation provides process analytical measurement, asset monitoring and on-line controls for both primary processing and the converting industries.
• Industrial Controls supplies process measurement, monitoring and control instrumentation and networking products for manufacturing industries.
Further details of the nature of these segments and the products and services they provide are contained in the Business Review on pages
4 to 27.
Notes to the Accounts continued

Busin
ess
Revi
ewG
over
nanc
eFi
nanc
ial S
tate
men
ts
21119.04 06/03/12 Proof 7
Spectris plc Annual Report and Accounts 2011 73
4. Operating segments continued
Information about reportable segments Segment revenue Inter-segment revenue External customer revenue Reportable segment profit
2011£m
2010£m
2011£m
2010£m
2011£m
2010£m
2011£m
2010£m
Materials Analysis 337.5 271.7 – (0.1) 337.5 271.6 60.9 39.5
Test and Measurement 347.3 298.2 (0.4) (0.8) 346.9 297.4 54.7 34.8
In-line Instrumentation 309.2 273.7 (0.3) (0.6) 308.9 273.1 63.8 58.3
Industrial Controls 113.3 60.5 (0.4) (0.7) 112.9 59.8 22.1 9.5
Eliminate inter-segment sales (1.1) (2.2) 1.1 2.2 – – – –
Total continuing operations 1,106.2 901.9 – – 1,106.2 901.9 201.5 142.1
Net acquisition-related costs and contingent consideration fair value adjustments (1.8) (1.9)
Acquisition-related fair value adjustments to inventory (2.1) –
Amortisation of acquisition-related intangibles (21.8) (12.3)
Operating profit 175.8 127.9
Profit on disposal of businesses* 0.1 –
Financial income* 7.2 8.2
Finance costs* (17.1) (16.2)
Profit before tax 166.0 119.9
Tax* (39.7) (23.7)
Profit after tax 126.3 96.2
Reportable segment profit is consistent with that presented to the Chief Operating Decision Maker. Inter-segment pricing is on an arm’s length
basis. Segments are presented on the basis of actual inter-segment charges made.
* Not allocated to reportable segments in reporting to the Chief Operating Decision Maker
Carrying amount of segment assets Carrying amount of segment liabilities†
2011£m
2010£m
2011£m
2010£m
Materials Analysis 346.6 256.2 (107.6) (104.6)
Test and Measurement 433.2 346.9 (94.4) (93.9)
In-line Instrumentation 291.8 224.3 (50.1) (46.6)
Industrial Controls 224.7 51.9 (18.6) (7.7)
Total segment assets and liabilities 1,296.3 879.3 (270.7) (252.8)
Cash and borrowings* 41.6 64.7 (386.6) (137.2)
Derivative financial instruments* 0.1 2.3 (14.5) (14.9)
Net pension liability* – – (13.1) (14.1)
Taxation* 24.9 26.9 (73.8) (40.6)
Consolidated total assets and liabilities 1,362.9 973.2 (758.7) (459.6)
* Not allocated to reportable segments in reporting to the Chief Operating Decision Maker. † Segment liabilities are presented here on a voluntary basis.

Spectris plc Annual Report and Accounts 201174
21119.04 06/03/12 Proof 7
4. Operating segments continued
Additions to non-current assets Depreciation and amortisation Impairment charges
2011£m
2010£m
2011£m
2010£m
2011£m
2010£m
Materials Analysis 18.7 22.8 10.3 7.4 – –
Test and Measurement 9.9 13.0 13.1 14.1 – –
In-line Instrumentation 12.4 24.2 8.4 5.3 – –
Industrial Controls 345.8 28.8 8.0 2.0 – –
386.8 88.8 39.8 28.8 – –
Geographical segments
The group’s operating segments are each located in several geographical locations and sell on to external customers in all parts of the world. No
individual country amounts to more than 3% of turnover, other than those noted below.
The following is an analysis of revenue by geographical destination.
Materials Analysis
£m
Test and Measurement
£m
In-lineInstrumentation
£m
Industrial Controls
£m
2011 Total
£m
UK 11.8 13.1 8.4 3.3 36.6
Germany 20.0 65.7 28.1 7.7 121.5
France 14.1 20.2 9.3 1.8 45.4
Rest of Europe* 56.2 62.5 52.3 6.0 177.0
USA 60.6 52.7 76.2 68.1 257.6
Rest of North America 11.7 4.7 7.9 6.8 31.1
Japan 28.5 29.1 29.6 0.7 87.9
China 46.9 43.9 50.0 8.5 149.3
South Korea 13.6 12.9 6.1 2.7 35.3
Rest of Asia Pacific 40.8 21.9 20.8 5.5 89.0
Rest of the world 33.3 20.2 20.2 1.8 75.5
337.5 346.9 308.9 112.9 1,106.2
Materials Analysis
£m
Test and Measurement
£m
In-lineInstrumentation
£m
Industrial Controls
£m
2010 Total
£m
UK 10.5 11.3 7.6 2.0 31.4
Germany 19.0 54.7 26.0 4.8 104.5
France 11.7 18.1 7.8 1.3 38.9
Rest of Europe* 43.8 56.2 46.9 3.5 150.4
USA 55.5 49.5 63.0 34.9 202.9
Rest of North America 8.7 4.9 8.0 2.8 24.4
Japan 19.2 23.5 30.1 0.4 73.2
China 33.0 32.4 41.5 4.3 111.2
South Korea 10.9 11.2 5.1 1.7 28.9
Rest of Asia Pacific 32.3 19.3 18.7 3.3 73.6
Rest of the world 27.0 16.3 18.4 0.8 62.5
271.6 297.4 273.1 59.8 901.9
Notes to the Accounts continued

Busin
ess
Revi
ewG
over
nanc
eFi
nanc
ial S
tate
men
ts
21119.04 06/03/12 Proof 7
Spectris plc Annual Report and Accounts 2011 75
4. Operating segments continued
The following is an analysis of the carrying amount of non-current segment assets, analysed by the geographical area in which the assets are
located.Non-current assets
2011£m
2010£m
UK 80.1 75.6
Germany 27.5 29.3
France 0.2 0.4
Rest of Europe* 281.6 260.4
USA 450.6 124.9
Rest of North America 5.9 6.3
Japan 4.1 4.2
China 10.1 13.1
South Korea 0.2 0.2
Rest of Asia Pacific 41.6 43.4
Rest of the world 1.8 5.7
903.7 563.5
* Principally in Denmark and Switzerland
5. Revenue
An analysis of the group’s revenue is as follows:
2011£m
2010£m
Sale of goods 963.6 778.3
Services rendered 142.6 123.6
Revenue 1,106.2 901.9
No individual customer accounted for more than 2% of external revenue in either 2011 or 2010.
Spectris does not have the necessary information readily available to disclose the revenue from external customers for each product and service,
or each group of similar products and services, and the cost to develop this would be excessive.
6. Operating profit
Operating profit has been arrived at after charging:
2011£m
2010£m
Net foreign exchange losses 0.3 0.3
Research and development expenditure 75.8 64.6
Depreciation of property, plant and equipment 14.9 14.4
Amortisation of intangible assets 24.9 14.4
Gain on sale of property, plant and equipment (0.4) (0.1)
Research and development expenditure now includes costs that relate to specific customer contracts.
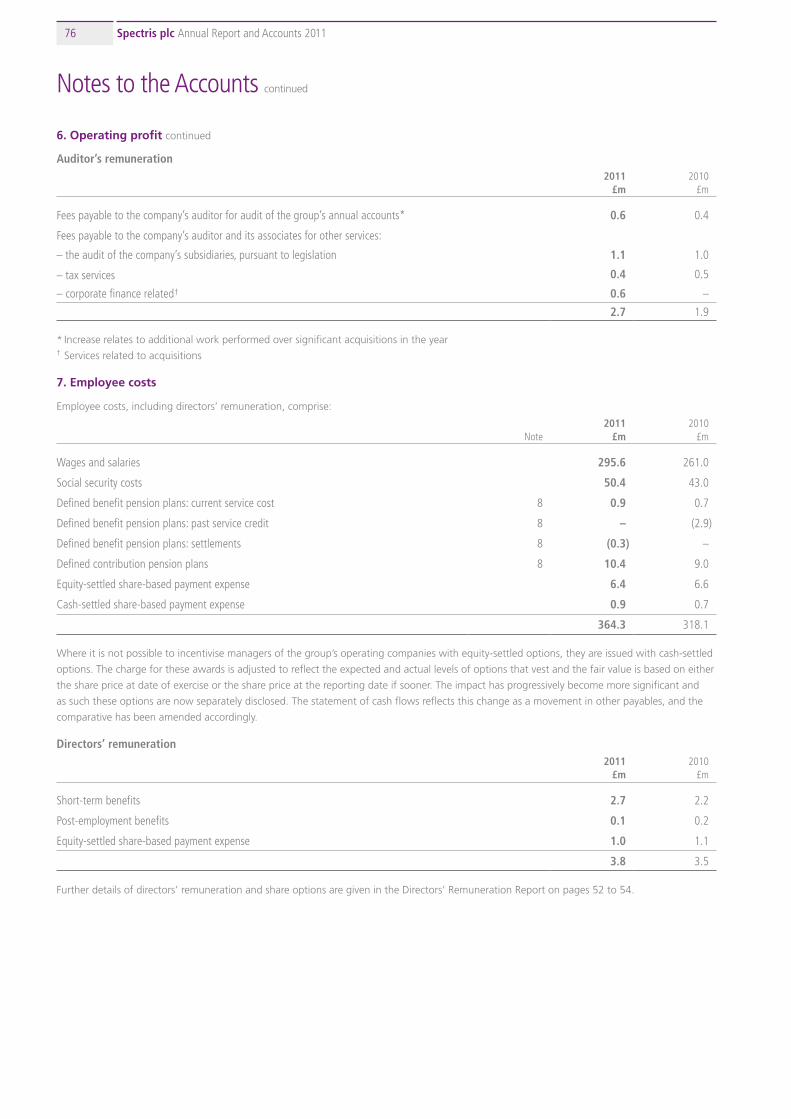
Spectris plc Annual Report and Accounts 201176
21119.04 06/03/12 Proof 7
6. Operating profit continued
Auditor’s remuneration2011
£m2010
£m
Fees payable to the company’s auditor for audit of the group’s annual accounts* 0.6 0.4
Fees payable to the company’s auditor and its associates for other services:
– the audit of the company’s subsidiaries, pursuant to legislation 1.1 1.0
– tax services 0.4 0.5
– corporate finance related† 0.6 –
2.7 1.9
* Increase relates to additional work performed over significant acquisitions in the year† Services related to acquisitions
7. Employee costs
Employee costs, including directors’ remuneration, comprise:
Note2011
£m2010
£m
Wages and salaries 295.6 261.0
Social security costs 50.4 43.0
Defined benefit pension plans: current service cost 8 0.9 0.7
Defined benefit pension plans: past service credit 8 – (2.9)
Defined benefit pension plans: settlements 8 (0.3) –
Defined contribution pension plans 8 10.4 9.0
Equity-settled share-based payment expense 6.4 6.6
Cash-settled share-based payment expense 0.9 0.7
364.3 318.1
Where it is not possible to incentivise managers of the group’s operating companies with equity-settled options, they are issued with cash-settled
options. The charge for these awards is adjusted to reflect the expected and actual levels of options that vest and the fair value is based on either
the share price at date of exercise or the share price at the reporting date if sooner. The impact has progressively become more significant and
as such these options are now separately disclosed. The statement of cash flows reflects this change as a movement in other payables, and the
comparative has been amended accordingly.
Directors’ remuneration2011
£m2010
£m
Short-term benefits 2.7 2.2
Post-employment benefits 0.1 0.2
Equity-settled share-based payment expense 1.0 1.1
3.8 3.5
Further details of directors’ remuneration and share options are given in the Directors’ Remuneration Report on pages 52 to 54.
Notes to the Accounts continued

Busin
ess
Revi
ewG
over
nanc
eFi
nanc
ial S
tate
men
ts
21119.04 06/03/12 Proof 7
Spectris plc Annual Report and Accounts 2011 77
7. Employee costs continued
Average number of employees2011
Number2010
Number
Production and engineering 3,270 2,904
Sales and marketing 2,534 2,296
Administrative 643 581
6,447 5,781
8. Retirement benefit schemes
Spectris plc operates funded defined benefit and defined contribution pension plans for the group’s qualifying employees in the UK. In addition,
11 overseas subsidiaries (2010: 12 overseas subsidiaries) in three overseas countries provide defined benefit plans. Other UK and overseas
subsidiaries have their own defined contribution plans invested in independent funds.
Defined contribution plans
The total cost of the defined contribution plans for the year ended 31 December 2011 was £10.4m (2010: £9.0m). There were no outstanding or
prepaid contributions to these plans as at 31 December 2011 or 31 December 2010.
Defined benefit plans
The last full actuarial valuations were carried out as at the following dates:
Plan name
Date of last full actuarial valuation
German:
Brüel & Kjær GmbH* 31 December 2011
Brüel & Kjær Vibro GmbH 31 December 2011
BTG Instruments GmbH (formerly BTG Mütek GmbH) 31 December 2011
Spectris Germany GmbH (formerly Spectris GmbH Sensoren und Systeme) 31 December 2011
Hottinger Baldwin Messtechnik GmbH* 31 December 2011
PANalytical GmbH 31 December 2011
Dutch:
HBM Netherlands BV 31 December 2009
Brüel & Kjær BV 31 December 2009
Brüel & Kjær Vibro AS, Dutch branch (formerly Brüel & Kjær Vibro BV) 31 December 2009
Hottinger Baldwin Messtechnik GmbH, Dutch branch* 31 December 2009
Swiss:
BTG Eclépens SA 31 December 2011
UK:
Spectris Pension Plan 31 December 2008
* The previous LDS Test and Measurement plans have been included into other Dutch and German plans
The valuations were updated to 31 December 2011 for IAS 19 purposes by qualified independent actuaries.
A valuation is underway in relation to the Spectris Pension Plan (UK).

Spectris plc Annual Report and Accounts 201178
21119.04 06/03/12 Proof 7
8. Retirement benefit schemes continued
The total company contributions made to the defined benefit plans during the year ended 31 December 2011 were £4.1m (2010: £5.6m).
Contributions for 2012 are expected to be as follows:
Plan name Expected 2012 contributions
£m
German:
Spectris Germany GmbH 0.1
Hottinger Baldwin Messtechnik GmbH 0.4
Swiss:
BTG Eclépens SA 0.9
UK:
Spectris Pension Plan 2.6
Total 4.0
The above contribution rates are subject to review at future valuations and periodic certifications of the Schedule of Contributions.
The Spectris Pension Plan (UK) was closed to future accural of benefits with effect from 31 December 2009.
The major assumptions used by the actuary to value the liabilities of the defined benefit plans were:
UK plans2011
% p.a.2010
% p.a.
Discount rate 4.70 5.40
Salary increases 4.50 4.90
Pension increases in payment:
RPI max 5% (LPI)* 2.90 3.20
RPI max 3% 2.40 2.60
RPI max 2.5% 2.10 2.30
RPI min 3%, max 5% 3.60 3.70
CPI max 5% 2.10 2.70
Pension increases in deferment:
RPI 3.00 3.40
CPI 2.10 2.70
Inflation assumption:
RPI 3.00 3.40
CPI 2.10 2.70
*LPI is Limited Price Indexation
Mortality rate assumptions:
Pensioner life expectancy assumed in the 31 December 2011 valuation is based on the following table:
Current and future pensioners PxA00 tables with medium cohort projections and a +1 year age rating and a 1% p.a. underpin to future improvements
Samples of the age which pensioners are assumed to live to are as follows:Males Females
Pensioner aged 65 in 2011 86.7 89.0
Pensioner aged 65 in 2021 87.6 90.0
Notes to the Accounts continued

Busin
ess
Revi
ewG
over
nanc
eFi
nanc
ial S
tate
men
ts
21119.04 06/03/12 Proof 7
Spectris plc Annual Report and Accounts 2011 79
8. Retirement benefit schemes continued
German plans2011
% p.a.2010
% p.a.
Discount rate 4.70 4.80
Salary increases 3.00 3.00
Pension increases in payment 2.00 2.00
Inflation assumption 2.00 2.00
Mortality rate assumptions:
Pensioner life expectancy assumed in the 31 December 2011 valuation is based on the following table:
Current pensioners and future pensioners Dr K Heubeck pension tables 2005 G
Samples of the age which pensioners are assumed to live to are as follows:Males Females
Pensioner aged 60 in 2011 83.5 87.6
Pensioner aged 60 in 2021 84.8 88.9
Dutch plans2011
% p.a.2010
% p.a.
Discount rate 5.20 5.20
Salary increases 3.00 3.00
Inflation assumption 2.00 2.00
Mortality rate assumptions:
Pensioner life expectancy assumed in the 31 December 2011 valuation is based on the following table:
Current pensioners and future pensioners Prognosetafel 2005-2050 tables
Sample ages to which pensioners are expected to live are not available (but this table covers improving life expectancies and is a general standard
in the Netherlands). These details will be provided when the next actuarial assessment of this pension scheme is made at 31 December 2012.
Swiss plans2011
% p.a.2010
% p.a.
Discount rate 2.25 2.75
Salary increases 1.00 1.00
Inflation assumption 1.00 1.00
Mortality rate assumptions:
Pensioner life expectancy assumed in the 31 December 2011 valuation is based on the following table:
Current pensioners and future pensioners BVG 2010 P12
Samples of the age which pensioners are assumed to live to are as follows:Males Females
Pensioner aged 60 in 2011 84.7 87.0
Pensioner aged 60 in 2021 85.6 87.9

Spectris plc Annual Report and Accounts 201180
21119.04 06/03/12 Proof 7
8. Retirement benefit schemes continued
Amounts recognised in the statement of income
UK plans Overseas plans Total
2011£m
2010£m
2011£m
2010£m
2011£m
2010£m
Current service cost – – 0.9 0.7 0.9 0.7
Interest cost 5.1 5.3 0.9 0.7 6.0 6.0
Expected return on scheme assets (5.6) (5.3) (0.5) (0.2) (6.1) (5.5)
Settlement gain (UK) (0.3) – – – (0.3) –
Past service credit – (2.9) – – – (2.9)
(0.8) (2.9) 1.3 1.2 0.5 (1.7)
On materiality grounds, the current service cost is recognised solely in administrative expenses in the statement of income. The interest cost and
expected return on scheme assets are recognised in finance costs and financial income, respectively, in the statement of income. Actuarial losses
or gains are recognised in the statement of comprehensive income.
During the year, insurance premiums for death-in-service benefits were paid amounting to £0.3m (2010: £0.2m).
The total return on scheme assets in the year (and reimbursed rights) was £12.3m (2010: £10.2m).
In July 2010, the UK government announced that CPI should be used as the basis for statutory minimum pension increases instead of RPI. The
impact on benefits of this change for the UK plan was a credit to the statement of income in 2010 of £2.9m, within administrative expenses.
Amounts recognised in the statement of comprehensive income
UK plans Overseas plans Total
2011£m
2010£m
2011£m
2010£m
2011£m
2010£m
Actuarial (losses)/gains recognised in the current year (1.0) 3.2 (1.8) (0.8) (2.8) 2.4
Exchange gains/(losses) in the current year – – 0.2 (0.1) 0.2 (0.1)
Loss on inclusion of Dutch plan – – – (0.2) – (0.2)
Total (losses)/gains recognised in the current year (1.0) 3.2 (1.6) (1.1) (2.6) 2.1
Cumulative actuarial losses since 1 January 2004 (35.1) (34.1) (5.7) (4.1) (40.8) (38.2)
Amounts recognised in the balance sheet
UK plans Overseas plans Total
2011£m
2010£m
2011£m
2010£m
2011£m
2010£m
Present value of defined benefit obligations (104.3) (96.9) (28.5) (26.0) (132.8) (122.9)
Fair value of scheme assets 103.0 93.2 16.7 15.6 119.7 108.8
Net deficit in schemes (1.3) (3.7) (11.8) (10.4) (13.1) (14.1)
Notes to the Accounts continued

Busin
ess
Revi
ewG
over
nanc
eFi
nanc
ial S
tate
men
ts
21119.04 06/03/12 Proof 7
Spectris plc Annual Report and Accounts 2011 81
8. Retirement benefit schemes continued
Reconciliation of movement in net deficit
UK plans Overseas plans Total
2011£m
2010£m
2011£m
2010£m
2011£m
2010£m
At 1 January (3.7) (14.3) (10.4) (9.2) (14.1) (23.5)
Expected return on plan assets 5.6 5.3 0.5 0.2 6.1 5.5
Contributions from sponsoring company 2.6 4.5 1.5 1.1 4.1 5.6
Current service cost – – (0.9) (0.7) (0.9) (0.7)
Interest cost (5.1) (5.3) (0.9) (0.7) (6.0) (6.0)
Actuarial (losses)/gains (1.0) 3.2 (1.8) (0.8) (2.8) 2.4
Settlement gain (UK) 0.3 – – – 0.3 –
Exchange difference – – 0.2 (0.1) 0.2 (0.1)
Past service credit – 2.9 – – – 2.9
Inclusion of three additional Dutch plans – – – (0.2) – (0.2)
At 31 December (1.3) (3.7) (11.8) (10.4) (13.1) (14.1)
Analysis of movement in the present value of the defined benefit obligation
UK plans Overseas plans Total
2011£m
2010£m
2011£m
2010£m
2011£m
2010£m
At 1 January 96.9 96.4 26.0 20.9 122.9 117.3
Current service cost – – 0.9 0.7 0.9 0.7
Interest cost 5.1 5.3 0.9 0.7 6.0 6.0
Actuarial losses 7.0 1.6 2.0 0.7 9.0 2.3
Settlement gain (UK) (0.3) – – – (0.3) –
Exchange difference – – (0.3) 1.6 (0.3) 1.6
Contributions from scheme members – – 0.8 0.7 0.8 0.7
Benefits paid (4.4) (3.5) (1.8) (1.1) (6.2) (4.6)
Past service credit – (2.9) – – – (2.9)
Settlement of Swiss plan – – – 1.2 – 1.2
Inclusion of three additional Dutch plans – – – 0.6 – 0.6
At 31 December 104.3 96.9 28.5 26.0 132.8 122.9
Analysis of defined benefit obligation
UK plans Overseas plans Total
2011£m
2010£m
2011£m
2010£m
2011£m
2010£m
Present value of unfunded defined benefit obligation – – 5.9 6.8 5.9 6.8
Present value of funded defined benefit obligation 104.3 96.9 22.6 19.2 126.9 116.1

Spectris plc Annual Report and Accounts 201182
21119.04 06/03/12 Proof 7
8. Retirement benefit schemes continued
Reconciliation of movement in fair value of plan assets
UK plans Overseas plans Total
2011£m
2010£m
2011£m
2010£m
2011£m
2010£m
At 1 January 93.2 82.1 15.6 11.7 108.8 93.8
Expected return on plan assets 5.6 5.3 0.5 0.2 6.1 5.5
Actuarial gains/(losses) 6.0 4.8 0.2 (0.1) 6.2 4.7
Exchange difference – – (0.1) 1.5 (0.1) 1.5
Contributions from sponsoring company 2.6 4.5 1.5 1.1 4.1 5.6
Contributions from scheme members – – 0.8 0.7 0.8 0.7
Benefits paid (4.4) (3.5) (1.8) (1.1) (6.2) (4.6)
Settlement of Swiss plan – – – 1.2 – 1.2
Inclusion of three additional Dutch plans – – – 0.4 – 0.4
At 31 December 103.0 93.2 16.7 15.6 119.7 108.8
Analysis of the scheme assets and expected rate of returnExpected return Fair value of assets
UK plans2011
%2010
%2011
£m2010
£m
Equity instruments 7.5 7.3 32.1 29.0
Debt instruments 5.3 5.5 67.3 66.2
Other assets 3.0 4.0 3.6 (2.0)
5.9 6.1 103.0 93.2
Expected return Fair value of assets
German plans2011
%2010
%2011
£m2010
£m
Insurance policies 4.7 4.8 1.3 1.2
Expected return Fair value of assets
Dutch plans2011
%2010
%2011
£m2010
£m
Insurance policies 4.7 5.2 1.2 1.3
Expected return Fair value of assets
Swiss plans2011
%2010
%2011
£m2010
£m
Insurance policies 2.5 3.0 14.2 13.1
The overall expected return on assets is calculated as the weighted average of the expected return on each individual asset class. The expected
return on equity instruments is the sum of inflation, dividend yield and economic growth, less investment expenses. The return on debt
instruments is based on the current market yield on bonds. The expected return on other assets reflects market conditions for interest rate swaps.
Notes to the Accounts continued

Busin
ess
Revi
ewG
over
nanc
eFi
nanc
ial S
tate
men
ts
21119.04 06/03/12 Proof 7
Spectris plc Annual Report and Accounts 2011 83
8. Retirement benefit schemes continued
History of experience adjustments2011
£m2010
£m2009
£m2008
£m2007*
£m
Present value of defined benefit obligations (132.8) (122.9) (117.3) (98.5) (93.7)
Fair value of scheme assets 119.7 108.8 93.8 90.0 82.6
Deficit in the scheme (13.1) (14.1) (23.5) (8.5) (11.1)
Experience adjustment on scheme liabilities: Amount (£m) (1.2) (2.3) (23.0) 10.0 4.8
Percentage of scheme liabilities (%) (0.9) (1.9) (19.6) 10.2 5.1
Experience adjustment on scheme assets: Amount (£m) 6.2 4.7 3.3 (8.0) 1.1
Percentage of scheme assets (%) 5.2 4.3 3.5 (9.0) 1.3
* The history of experience for 2007 excludes the German and Dutch LDS Test and Measurement plans as they were new acquisitions in 2008.
It also excludes the Swiss plan that had not previously been treated as a defined benefit arrangement.
9. Finance costs and financial income
Financial income
Note2011
£m2010
£m
Interest receivable 0.7 0.9
Increase in fair value of cross-currency interest rate swaps 20 – 1.4
Net gains on retranslation of short-term inter-company loan balances 0.4 0.4
Expected return on pension scheme assets 6.1 5.5
7.2 8.2
Finance costs
Note2011
£m2010
£m
Interest payable on loans and overdrafts 10.5 9.9
Decrease in fair value of cross-currency interest rate swaps 20 0.4 –
Interest cost on pension scheme liabilities 6.0 6.0
Other finance costs 0.2 0.3
17.1 16.2
Net interest costs of £9.8m (2010: £9.0m) for the purposes of the calculation of interest cover comprise bank interest receivable of £0.7m
(2010: £0.9m), and interest payable on loans and overdrafts of £10.5m (2010: £9.9m).

Spectris plc Annual Report and Accounts 201184
21119.04 06/03/12 Proof 7
10. Taxation
2011 2010
UK£m
Overseas£m
Total£m
UK£m
Overseas £m
Total£m
Current tax charge 6.3 41.9 48.2 4.8 24.5 29.3
Adjustments in respect of current tax of prior years (0.4) (1.5) (1.9) (0.6) (6.8) (7.4)
Deferred tax – origination and reversal of temporary differences (3.3) (3.3) (6.6) 1.3 0.5 1.8
2.6 37.1 39.7 5.5 18.2 23.7
The standard rate of corporation tax for the year, based on the weighted average of tax rates applied to the group’s profits, is 28.5% (2010:
27.6%). The tax charge for the year is lower than the standard rate of corporation tax for the reasons set out in the following reconciliation:
2011£m
2010£m
Profit before taxation 166.0 119.9
Corporation tax at standard rate of 28.5% (2010: 27.6%) 47.3 33.1
Non-taxable income and gains (3.8) (2.8)
Non-deductible expenditure 1.8 1.7
Movements on unrecognised deferred tax assets 0.5 0.3
Research and development tax incentives (3.4) (2.1)
Other current year tax items (0.3) (0.4)
Change in tax rates (0.1) (0.1)
Adjustments relating to prior year acquisitions and disposals – (4.3)
Other adjustments to prior year current and deferred tax charges (2.3) (1.7)
Total taxation 39.7 23.7
Factors that may affect the future tax charge
The group’s tax charge in future years is likely to be affected by the proportion of profits arising, and the effective tax rates, in the various
territories in which the group operates.
Tax on items recognised directly in other comprehensive income2011
£m2010
£m
Tax on net (loss)/gain on effective portion of changes in fair value of forward exchange contracts (0.4) 0.4
Tax on changes in fair value of effective portion of hedges of net investment in overseas operations – (0.9)
Tax on actuarial (loss)/gain arising on pension schemes, net of foreign exchange (0.7) 0.4
Aggregate current and deferred tax credit relating to items that are charged directly to the statement of comprehensive income (1.1) (0.1)
Notes to the Accounts continued

Busin
ess
Revi
ewG
over
nanc
eFi
nanc
ial S
tate
men
ts
21119.04 06/03/12 Proof 7
Spectris plc Annual Report and Accounts 2011 85
10. Taxation continued
The following tax charges relate to items of income and expense that are excluded from the group’s adjusted performance measures.
Tax on items of income and expense that are excluded from the group’s adjusted profit before tax2011
£m2010
£m
Tax (credit)/charge on unrealised change in fair value of cross-currency interest rate swaps (0.1) 0.4
Tax credit on amortisation of intangible assets (6.5) (4.0)
Tax credit on acquisition-related costs (0.4) (0.1)
Tax credit on acquisition-related fair value adjustments to inventory (0.8) –
Tax credit on retranslation of short-term inter-company loan balances – (0.3)
Tax credit relating to prior year acquisitions and disposals – (4.3)
Total tax credit (7.8) (8.3)
The effective adjusted tax rate for the year was 24.8% (2010: 24.2%) as set out in the reconciliation below.
Reconciliation of total tax charge on adopted IFRS basis to adjusted tax charge
Note2011
£m2010
£m
Total tax charge on adopted IFRS basis 39.7 23.7
Tax credit on items of income and expense that are excluded from the group’s adjusted profit before tax 7.8 8.3
Adjusted tax charge 47.5 32.0
Adjusted profit before tax 3 191.6 132.3
11. Dividends
Amounts recognised and paid as distributions to owners of the company in the year2011
£m2010
£m
Final dividend for the year ended 31 December 2010 of 20.9p (2009: 17.85p) per share 24.3 20.7
Interim dividend for the year ended 31 December 2011 of 8.2p (2010: 7.1p) per share 9.5 8.2
33.8 28.9
Amounts arising in respect of the year 2011
£m2010
£m
Interim dividend for the year ended 31 December 2011 of 8.2p (2010: 7.1p) per share 9.5 8.2
Proposed final dividend for the year ended 31 December 2011 of 25.4p (2010: 20.9p) per share 29.6 24.2
39.1 32.4
The proposed final dividend is subject to approval by shareholders at the Annual General Meeting and has not been included as a liability in these
financial statements.
12. Earnings per share
Basic earnings per share amounts are calculated by dividing net profit for the year attributable to ordinary shareholders by the weighted average
number of ordinary shares outstanding during the year (excluding treasury shares).
Diluted earnings per share amounts are calculated by dividing the net profit attributable to ordinary shareholders by the weighted average
number of ordinary shares outstanding during the year but adjusted for the effects of dilutive options. The key features of share option contracts
are described in Note 25.

Spectris plc Annual Report and Accounts 201186
21119.04 06/03/12 Proof 7
12. Earnings per share continued
Basic earnings per share2011 2010
Profit after tax (£m) 126.3 96.2
Weighted average number of shares outstanding (millions) 116.2 115.8
Basic earnings per share (pence) 108.7 83.1
Diluted earnings per share2011 2010
Profit after tax (£m) 126.3 96.2
Basic weighted average number of shares outstanding (millions) 116.2 115.8
Weighted average number of dilutive 5p ordinary shares under option (millions) 2.6 2.2
Weighted average number of 5p ordinary shares that would have been issued at average market value from proceeds of dilutive share options (millions) (0.7) (0.1)
Diluted weighted average number of shares outstanding (millions) 118.1 117.9
Diluted earnings per share (pence) 106.9 81.6
13. Goodwill
Cost Note £m
At 1 January 2010 363.5
Recognised on acquisitions 28 24.3
Adjustments to contingent consideration for transactions under IFRS 3 (2004) 28 8.3
Exchange differences (3.7)
At 31 December 2010 392.4
Recognised on acquisitions 28 195.8
Adjustments to contingent consideration for transactions under IFRS 3 (2004) 28 (1.0)
Exchange differences (6.5)
At 31 December 2011 580.7
Accumulated amortisation and impairment losses
At 1 January 2010 38.7
Exchange differences (1.4)
At 31 December 2010 37.3
Exchange differences (1.1)
At 31 December 2011 36.2
Carrying amount
At 31 December 2011 544.5
At 31 December 2010 355.1
At 1 January 2010 324.8
Notes to the Accounts continued

Busin
ess
Revi
ewG
over
nanc
eFi
nanc
ial S
tate
men
ts
21119.04 06/03/12 Proof 7
Spectris plc Annual Report and Accounts 2011 87
13. Goodwill continued
In accordance with the requirements of IAS 36, Impairment of Assets, goodwill is allocated to the group’s cash-generating units which are
represented by the group’s trading businesses. The most significant elements of the group’s total consolidated goodwill of £544.5m at
31 December 2011 are allocated to PANalytical: £95.0m (2010: £97.7m), BTG: £53.6m (2010: £54.7m), HBM: £66.9m (2010: £72.3m), Brüel &
Kjær Sound & Vibration: £73.2m (2010: £68.9m) and Omega Engineering: £174.7m (2010: n/a). Except for Omega Engineering, the acquired
entities are quickly integrated into existing group companies with the result that it is not appropriate to consider their individual performance
when determining cash-generating units and performing goodwill impairment testing. Each cash-generating unit is assessed for impairment
annually and whenever there is a specific indication of impairment. Omega Engineering is a stand-alone entity which is operating separately
within the Industrial Controls segment. As such, it is being treated as a cash-generating unit for goodwill impairment testing. For all cash-
generating units, there were no indications of impairment in 2011.
As part of the annual impairment test review, the carrying value of goodwill (for all businesses excluding Omega Engineering) has been assessed with
reference to value in use to perpetuity, reflecting the projected cash flows of each cash-generating unit based on actual operating results, the most
recent budget for the next financial year, and strategic review projections for 2013 and 2014. For Omega Engineering the carrying value of goodwill
has been assessed by reference to the acquisition business plan that assumed a sales growth in line with that anticipated for the rest of the Spectris
group, margins consistent with recent history, certain synergies in procurement and sales channels and reduced working capital.
The key assumptions on which the value in use calculations are based (for all businesses excluding Omega Engineering) relate to business
performance over the next three years, long-term growth rates beyond 2014 and the discount rates applied. There are no individually significant
business level cash flow assumptions in respect of any business that materially impact the impairment testing. The key judgements are the level
of revenue and operating margins anticipated and the proportion of operating profit converted to cash in each year. Growth rates for the period
beyond 2014 are assumed to be 2.5% (2010: 2.5%), which is considered to be at or below long-term market trends for each business. The cash
flow projections have been discounted using entity-specific pre-tax discount rates between 13% and 18% (2010: 12% and 17%). These rates
have been determined by taking the size of business and specific geographic and industry risk factors into account. No impairment charge has
been required to be recognised in either 2011 or 2010.
The directors do not consider that there are any reasonable possible sensitivities for these businesses that could arise in the next 12 months
that could result in an impairment charge arising. For illustration, the directors have continued to consider the following specific individual
sensitivities:
• a 2% increase in the pre-tax discount rate applied to each business would result in an impairment of £nil (2010: £nil);
• if the long-term growth rate assumption was reduced to 1% no impairment would arise (2010: £nil); and
• if the cash flow projections of all businesses were reduced by 25% for the next two years no impairment would arise (2010: £nil).
The directors consider that operating results in 2011 confirm that none of the group’s brought forward trading businesses have suffered
permanent diminutions in value as a result of recent difficult economic conditions.
Reflecting the fact that it represents 32% of total goodwill, the directors consider the goodwill related to the Omega Engineering business to
be individually significant and accordingly have provided additional commentary for this business. The lowest level of headroom on goodwill
impairment testing among the cash-generating units at 31 December 2011 is in respect of the Omega Engineering business, reflecting the
proximity of the acquisition date to the year end. However, having regard to trading activity post acquisition and the conservative assumptions
built into the acquisition business case, the directors do not believe there is a significant risk of material impairment of goodwill arising in the next
12 months. The pre-tax discount rate applied to the cash flows is 16% with a long-term growth rate assumption of 2.5% per annum and a long-
term conversion of operating profit to cash of 90%. Reflecting the highly dispersed customer base, wide range of industries served and extensive
product list, no other individual assumptions have been identified that are material to this assessment.

Spectris plc Annual Report and Accounts 201188
21119.04 06/03/12 Proof 7
14. Other intangible assets
Cost
Patentsand
contractualrights
£m
Trade names
£mTechnology
£m
Customer-related intangibles
£mSoftware
£mTotal
£m
At 1 January 2010 12.6 – 41.1 35.1 28.1 116.9
Additions – – – – 1.9 1.9
Recognised on acquisitions 4.1 – 12.1 20.3 0.1 36.6
Disposals – – – – (0.5) (0.5)
Exchange differences 0.3 – 2.0 1.5 (0.2) 3.6
At 31 December 2010 17.0 – 55.2 56.9 29.4 158.5
Additions – – – – 2.7 2.7
Transfers from property, plant and equipment – – – – 2.5 2.5
Recognised on acquisitions (Note 28) 3.2 63.3 43.7 19.2 0.2 129.6
Disposals – – – – (0.3) (0.3)
Exchange differences 0.2 0.3 – 0.3 (0.3) 0.5
At 31 December 2011 20.4 63.6 98.9 76.4 34.2 293.5
Accumulated amortisation and impairment losses
At 1 January 2010 9.5 – 6.7 9.3 21.1 46.6
Disposals – – – – (0.3) (0.3)
Charge for the year 1.5 – 5.0 5.8 2.1 14.4
Exchange differences 0.2 – – 0.6 (0.4) 0.4
At 31 December 2010 11.2 – 11.7 15.7 22.5 61.1
Disposals – – – – (0.3) (0.3)
Charge for the year 1.2 0.8 9.1 10.7 3.1 24.9
Transfers from property, plant and equipment – – – – 1.9 1.9
Exchange differences – – 0.1 0.3 (0.4) –
At 31 December 2011 12.4 0.8 20.9 26.7 26.8 87.6
Carrying amount
At 31 December 2011 8.0 62.8 78.0 49.7 7.4 205.9
At 31 December 2010 5.8 – 43.5 41.2 6.9 97.4
At 1 January 2010 3.1 – 34.4 25.8 7.0 70.3
Of the total amortisation charge of £24.9m (2010: £14.4m), the amount attributable to the amortisation of acquisition-related intangible assets
was £21.8m (2010: £12.3m).
The transfers from property, plant and equipment to software in 2010 relate to identifiable software assets.
Notes to the Accounts continued

Busin
ess
Revi
ewG
over
nanc
eFi
nanc
ial S
tate
men
ts
21119.04 06/03/12 Proof 7
Spectris plc Annual Report and Accounts 2011 89
15. Property, plant and equipment
CostFreehold property
£mLeasehold property
£m
Plant and equipment
£mTotal
£m
At 1 January 2010 95.9 10.1 136.1 242.1
Additions 4.6 1.2 11.5 17.3
Recognised on acquisitions – – 0.4 0.4
Disposals (1.9) (0.4) (7.3) (9.6)
Transfers from/(to) plant and equipment 0.3 – (0.3) –
Exchange differences (0.9) 0.5 1.8 1.4
At 31 December 2010 98.0 11.4 142.2 251.6
Additions 9.8 0.8 15.9 26.5
Recognised on acquisitions (Note 28) 25.4 0.1 7.7 33.2
Disposals (0.2) (0.4) (6.7) (7.3)
Transfers to other intangible assets – – (2.5) (2.5)
Exchange differences (1.9) 0.1 (1.5) (3.3)
At 31 December 2011 131.1 12.0 155.1 298.2
Accumulated depreciation and impairment
At 1 January 2010 30.6 6.7 97.2 134.5
Charge for the year 2.6 0.9 10.9 14.4
Disposals (1.8) (0.4) (6.5) (8.7)
Exchange differences (0.5) 0.3 1.1 0.9
At 31 December 2010 30.9 7.5 102.7 141.1
Charge for the year 2.9 1.3 10.7 14.9
Disposals (0.1) (0.4) (6.4) (6.9)
Transfers to other intangible assets – – (1.9) (1.9)
Exchange differences (0.8) 0.1 (1.0) (1.7)
At 31 December 2011 32.9 8.5 104.1 145.5
Carrying amount
At 31 December 2011 98.2 3.5 51.0 152.7
At 31 December 2010 67.1 3.9 39.5 110.5
At 1 January 2010 65.3 3.4 38.9 107.6
The amount recognised in the carrying amount of items of plant and equipment in the course of its construction was £3.9m (2010: £1.0m).
No borrowing costs met the required criteria for capitalisation during the year (2010: £nil).
The group has pledged land and buildings having a carrying amount of approximately £1.9m (2010: £2.2m) to secure bank loans granted to
the group.

Spectris plc Annual Report and Accounts 201190
21119.04 06/03/12 Proof 7
16. Inventories
2011£m
2010£m
Raw materials 67.2 46.5
Work in progress 29.4 23.6
Finished goods 75.2 50.9
171.8 121.0
In the ordinary course of business, the group makes provision for slow-moving, excess and obsolete inventory as appropriate.
Inventory is stated after charging impairments of £1.6m (2010: £4.0m) and crediting reversals of previous impairments of £1.7m (2010: £2.5m).
Impairments and reversals of impairments are included within operating profit.
The calculation of the group’s inventory provision requires the use of various estimates and assumptions in relation to the impact of technology
and market changes on future demand for on-hand inventory across a very large number of individual product lines. Reversals of previous
inventory provisions arise when these estimates prove pessimistic and actual product demand is higher than assumed. This normally occurs when
the product lifecycle is longer than anticipated. There are no individually significant provision reversals. The directors do not consider there to be
significant levels of estimation risk in the determination of inventory provisions with regard to the total value of inventory.
Inventory carried at fair value less cost to sell is £19.2m (2010: £0.2m) due to the acquisitions as described in Note 28.
In 2011, raw materials and changes in finished goods and work in progress recognised within cost of sales amounted to £301.4m (2010: £243.2m).
17. Trade and other receivables
2011£m
2010£m
Trade receivables 191.4 168.8
Prepayments and accrued income 12.3 10.4
Other receivables 17.1 15.6
220.8 194.8
Included within prepayments and accrued income and other receivables above are amounts receivable in more than one year of £6.3m (2010: £5.3m).
Trade receivables are non-interest bearing. Standard credit terms provided to customers differ according to business and country, and are typically
between 30 and 60 days. Trade receivables and other receivables are stated after net impairments recognised and utilised during the year of £4.5m
(2010: £3.3m) and reversals of impairments of £2.2m (2010: £1.4m). Impairments and reversals of impairments are included within operating profit.
The maximum exposure to credit risk for trade receivables at 31 December by geographic region was:
2011£m
2010£m
UK 7.7 6.2
Germany 19.1 17.5
France 10.9 10.3
Rest of Europe 37.8 36.5
USA 47.2 37.6
Rest of North America 7.6 5.8
Japan 17.1 15.6
China 12.9 10.6
South Korea 4.9 4.9
Rest of Asia Pacific 14.2 13.7
Rest of the world 12.0 10.1
191.4 168.8
Notes to the Accounts continued

Busin
ess
Revi
ewG
over
nanc
eFi
nanc
ial S
tate
men
ts
21119.04 06/03/12 Proof 7
Spectris plc Annual Report and Accounts 2011 91
17. Trade and other receivables continued
Impairment losses
The ageing of trade receivables and related impairment provisions at 31 December was:
2011 2010
Gross£m
Impairment£m
Gross£m
Impairment£m
Not past due 141.3 0.6 128.3 0.3
One month past due 35.0 0.2 27.6 0.1
Two months past due 10.4 0.1 8.1 0.3
Three months past due 5.2 0.2 3.6 0.2
Over three months past due 9.7 9.1 9.0 6.9
201.6 10.2 176.6 7.8
The movement in the allowance for impairment in respect of trade receivables during the year was as follows:
2011£m
2010£m
Balance at 1 January 7.8 5.8
Impairment loss recognised 5.4 4.3
Impairment loss utilised (0.9) (1.0)
Impairment loss released (2.2) (1.4)
Exchange differences 0.1 0.1
Balance at 31 December 10.2 7.8
An impairment has been recorded against the trade receivables that the group believes may not be recoverable. In the case of trade receivables
that are past due, management makes an assessment of the risk of non-collection, taking into account factors such as any disputes, or other
factors delaying payment, and the risk of bankruptcy or other failure of the customer to meet their obligations. For trade receivables that are not
past due, taking into account good historic collection experience, management records an impairment charge only where there is a specific risk
of non-collection. All trade receivables past due for more than 120 days have been fully provided in line with the group’s credit risk policy. There
is no material unprovided risk in relation to EU countries.
The fair value of trade and other receivables approximates to book value due to the short-term maturities associated with these items. There is no
impairment risk identified with regards to prepayments and accrued income or other receivables where no amounts are past due.
18. Cash and cash equivalents
Analysis of balances of cash and cash equivalents
Note2011
£m2010
£m
Cash balances 41.6 64.7
Bank overdrafts 19 (1.1) (1.4)
Cash and cash equivalents in the statement of cash flows 40.5 63.3
The group’s exposure to interest rate risk and a sensitivity analysis for financial assets and liabilities is disclosed in Note 20.

Spectris plc Annual Report and Accounts 201192
21119.04 06/03/12 Proof 7
19. Borrowings
Current
Effective interest rate
Earlier of repricing date
or maturity date2011
£m2010
£m
Bank loans – secured see below see below 1.6 0.3
Bank overdrafts on demand 1.1 1.4
2.7 1.7
Non-current
Effective interest rate
Earlier of repricing date
or maturity date2011
£m2010
£m
Bank loans – secured see below see below 0.3 1.9
Bank loans – unsecured 1.78% 14 Aug 2016 249.7 –
Bank loans unsecured – $75.6m 3.12% 10 Sep 2015 48.6 48.3
Unsecured loan notes – 2003 $100m 6.08% 15 Oct 2013 64.4 63.9
Unsecured loan notes – 2003 €25m 5.56% 15 Oct 2013 20.9 21.4
Total unsecured borrowings 383.6 133.6
Total non-current borrowings 383.9 135.5
At 31 December 2011, the group had available £104.2m (2010: £80.0m) of undrawn committed borrowing facilities in respect of which all
conditions precedent had been met.
Secured bank loans
Bank loans are secured by fixed charges over property at three of the group’s subsidiaries. Of these, £1.4m is denominated in Chinese renminbi
and is repayable by instalments until December 2012 with a fixed interest rate of 7.5%, £0.4m is denominated in US dollars and is repayable by
instalments until December 2014 with a variable interest rate of LIBOR plus a small margin, and £0.1m is denominated in euros and is repayable
by instalments until December 2012 with a variable interest rate of LIBOR plus a small margin.
Unsecured loan notes
The interest rates on the unsecured loan notes are those contracted on the underlying borrowings before taking into account any cross-currency
interest rate swaps, and remain fixed until redemption. On issue of the US$100m loan notes in October 2003, the group entered into a cross-
currency interest rate swap which has the effect of converting this US dollar borrowing into fixed interest euro-denominated debt. The combined
effect of the borrowing and swap arrangement results in euro debt of €90.5m with a fixed interest rate of 5.64%. This interest rate remains fixed
until redemption.
Under adopted IFRS, where cross-currency interest rate swaps are used, the value of the underlying US dollar borrowing is presented in this
borrowings note and the value of the related cross-currency interest rate swaps is presented separately within derivative financial instruments in
Note 20. For management purposes, the value attributed to the portion of the swap arrangements that converts US dollar borrowings into euro
borrowings is viewed as part of the group’s net debt, as analysed below.
Analysis of net debt
Note2011
£m2010
£m
Bank overdrafts 1.1 1.4
Bank loans – secured 1.9 2.2
Bank loans – unsecured 298.3 48.3
Unsecured loan notes 85.3 85.3
Cross-currency interest rate swaps – currency portion 20 11.2 13.7
Total borrowings 397.8 150.9
Cash balances 18 (41.6) (64.7)
Net debt 356.2 86.2
Notes to the Accounts continued

Busin
ess
Revi
ewG
over
nanc
eFi
nanc
ial S
tate
men
ts
21119.04 06/03/12 Proof 7
Spectris plc Annual Report and Accounts 2011 93
20. Financial instruments
Fair value and carrying amount of financial instruments2011 2010
Carryingamount
£m
Fairvalue
£m
Carryingamount
£m
Fairvalue
£m
Trade and other receivables excluding prepayments 208.5 208.5 184.4 184.4
Trade and other payables excluding deferred income (215.2) (215.2) (209.0) (209.0)
Cash and cash equivalents 41.6 41.6 64.7 64.7
Floating rate borrowings (250.6) (250.6) (1.8) (1.8)
Fixed rate borrowings (136.0) (143.7) (135.4) (145.0)
Forward exchange contracts (1.6) (1.6) 2.3 2.3
Cross-currency interest rate swaps (12.8) (12.8) (14.9) (14.9)
(366.1) (373.8) (109.7) (119.3)
The fair value of floating rate borrowings approximates to the carrying value because interest rates are at floating rates where payments are reset
to market rates at intervals of less than one year.
The fair value of fixed rate borrowings and derivative financial instruments is estimated by discounting the future contracted cash flow, using
appropriate yield curves, to the net present values.
The fair value of forward exchange contracts outstanding as at 31 December 2011 is a net liability of £1.6m (2010: asset of £2.3m), of which
£1.7m has been debited to the hedging reserve (2010: £1.9m credit) and £0.1m credited to the statement of income (2010: £0.4m credit). These
contracts mature over periods not exceeding 15 months. A summary of the movements in the hedging reserve during the year is presented
below. There was no ineffectiveness arising with regards to cash flow hedges in either 2011 or 2010.
Analysis of movements in hedging reserve2011
£m2010
£m
At 1 January (0.2) (0.5)
Amounts removed from statement of changes in equity and included in statement of income during the year (2.5) (0.6)
Amounts recognised in statement of changes in equity during the year (0.9) 0.9
At 31 December (3.6) (0.2)
The fair value of forward exchange contracts is determined using discounted cash flow techniques based on readily available market data and
represents a Level 2 measurement in the fair value hierarchy under IFRS 7.
The amount included in the statement of income is split between revenue and administrative expenses depending on the nature of the hedged item.
The following table shows the contractual forward exchange contracts hedging designated transactional exposures. These contracts mature in
the next 15 months, therefore, the cash flows and resulting effect on profit and loss are expected to occur within the next 15 months.
Forward exchange contracts at 31 December 2011 2010
Foreign currency sale amount (£m) 110.2 93.7
Percentage of total:
US dollar 34% 24%
Euro 37% 41%
Japanese yen 27% 30%
Other 2% 5%

Spectris plc Annual Report and Accounts 201194
21119.04 06/03/12 Proof 7
20. Financial instruments continued
Cross-currency interest rate swaps
The value of the group’s cross-currency interest rate swaps can effectively be split into two components: a portion that is attributable to
converting a 100m US dollar-denominated borrowing liability into a euro-denominated borrowing liability (the currency portion) – the value of
this portion changes as currency exchange rates change – and a portion that is attributable to converting fixed rate US dollar interest payments
into fixed rate euro interest payments (the interest portion) – the value of this portion of the swap changes as US dollar variable interest rates,
euro variable interest rates and foreign currency exchange rates change.
Under adopted IFRS, the underlying US dollar borrowings are required to be presented separately in the balance sheet from the cross-currency
interest rate swaps. In addition, the fair value of the cross-currency interest rate swaps is required to be recognised in full on the balance sheet.
The table below shows the movements in the total value of the cross-currency interest rate swaps during the year and also how it is attributed to
its currency and interest portions.
Fair value of cross-currency interest rate swapsCurrency
portion£m
Interest portion
£m
Total value
£m
As at 1 January 2010 (18.5) (2.6) (21.1)
Change in fair value recognised in statement of comprehensive income 4.8 – 4.8
Change in fair value recognised in statement of income – 1.4 1.4
As at 31 December 2010 (13.7) (1.2) (14.9)
Change in fair value recognised in statement of comprehensive income 2.5 – 2.5
Change in fair value recognised in statement of income – (0.4) (0.4)
As at 31 December 2011 (11.2) (1.6) (12.8)
Together with the group’s €25m borrowing, this combination of the underlying US dollar borrowings and cross-currency interest rate swap has
been designated as a net investment hedge of the group’s net investment in its European businesses. However, the interest portion of the swap
is ineffective in this hedging relationship. Accordingly, the change in value of the currency portion of the swap is recognised together with the
change in value of the underlying US dollar borrowings in the statement of comprehensive income, and the change in value of the interest
portion of the swap is recognised in the statement of income within financing costs. The group’s US$75.6m borrowings have been designated as
a net investment hedge of the group’s net investment in its US businesses.
The fair value of cross-currency interest rate swaps is determined using discounted cash flow techniques based on readily available market data
and represents a Level 2 measurement in the fair value hierarchy under IFRS 7. The principal borrowing amounts match exactly with the related
unsecured loan note borrowings as described in Note 19.
The table below shows the maturity profile of the gross cash flows related to financial liabilities.
Maturity of financial liabilities2011
Bank loans and overdrafts
£m
Secured bank loans
£m
Unsecured loans
£m
Cross-currency swap
£mTotal
£m
Due within one year 1.1 1.6 12.0 0.4 15.1
Due between one and two years – 0.2 97.5 11.6 109.3
Due between two and five years – 0.1 321.0 – 321.1
1.1 1.9 430.5 12.0 445.5
Notes to the Accounts continued

Busin
ess
Revi
ewG
over
nanc
eFi
nanc
ial S
tate
men
ts
21119.04 06/03/12 Proof 7
Spectris plc Annual Report and Accounts 2011 95
20. Financial instruments continued
Maturity of financial liabilities2010
Bank loans and overdrafts
£m
Secured bank loans
£m
Unsecured loans
£m
Cross-currency swap
£mTotal
£m
Due within one year 1.4 0.3 6.6 0.5 8.8
Due between one and two years – 1.7 6.6 0.5 8.8
Due between two and five years – 0.3 143.1 14.2 157.6
1.4 2.3 156.3 15.2 175.2
Trade and other payables (Note 21) are substantially due within one year.
It is not expected that the cash flows described above could occur significantly earlier or at substantially different amounts.
Interest rate exposure of financial assets and liabilities by currencyFinancial assets Financial liabilities 2011
Fixed rate£m
Floating rate£m
Non-interest bearing
£mTotal
£m
Fixed rate£m
Floating rate£m
Total£m
Net financial assets/
(liabilities)£m
Sterling – – 0.8 0.8 – – – 0.8
Euro – 10.9 3.2 14.1 (96.6) – (96.6) (82.5)
US dollar – 10.4 1.9 12.3 (48.6) (250.6) (299.2) (286.9)
Japanese yen – 0.2 0.2 0.4 – – – 0.4
Other 0.8 6.8 6.4 14.0 (2.0) – (2.0) 12.0
0.8 28.3 12.5 41.6 (147.2) (250.6) (397.8) (356.2)
Interest rate exposure of financial assets and liabilities by currency
Financial assets Financial liabilities 2010
Fixed rate£m
Floating rate£m
Non-interest bearing
£mTotal
£m
Fixed rate£m
Floating rate£m
Total£m
Net financial
assets/(liabilities)
£m
Sterling – 38.8 0.2 39.0 – – – 39.0
Euro 0.3 5.2 2.7 8.2 (99.1) – (99.1) (90.9)
US dollar 0.4 3.8 0.2 4.4 (48.3) (1.3) (49.6) (45.2)
Japanese yen – 0.7 – 0.7 – (0.1) (0.1) 0.6
Other 2.6 6.0 3.8 12.4 (1.7) (0.4) (2.1) 10.3
3.3 54.5 6.9 64.7 (149.1) (1.8) (150.9) (86.2)
The above exposures are net of the cross-currency interest rate swap.

Spectris plc Annual Report and Accounts 201196
21119.04 06/03/12 Proof 7
20. Financial instruments continued
Sensitivity analysis
At 31 December 2011 it is estimated that a general increase of one percentage point in interest rates would decrease the group’s profit before
tax by approximately £2.2m (2010: increase of £0.5m).
Based on foreign exchange translational exposures for the year ended 31 December 2011 it is estimated that a ten percentage point weakening
in the value of the US dollar against £ sterling would have decreased the group’s profit before tax by approximately £4.5m (2010: £2.2m), a
ten percentage point weakening in the value of the euro/Danish krone against £ sterling would have decreased the group’s profit before tax
by approximately £6.2m (2010: £2.9m) and a ten percentage point weakening in the value of the Swiss franc against £ sterling would have
decreased the group’s profit before tax by approximately £2.2m (2010: £2.2m). In addition, a ten percentage point weakening in the value of the
US dollar against £ sterling would have decreased the group’s net assets by approximately £48.8m and a ten percentage point weakening in the
value of the euro against £ sterling would have decreased the group’s net assets by approximately £54.0m; exposures to other currencies are not
considered to have a material impact on net assets.
21. Trade and other payables
Current 2011
£m2010
£m
Trade payables 91.9 84.7
Accruals 94.2 85.2
Deferred income 23.6 20.4
Other non-trade payables 17.9 21.8
227.6 212.1
Non-current
Other non-trade payables 11.2 17.3
The fair value of trade and other payables approximates to book value due to the short-term maturities associated with these items.
The effect of discounting on non-current amounts is not material.
22. Provisions
Reorganisation£m
Product warranty
£m
Legal,contractual
and other£m
Total£m
At 1 January 2011 1.4 8.4 13.6 23.4
Additional provision in the year 2.1 5.9 7.2 15.2
Acquired on acquisition – 0.4 0.5 0.9
Utilised during the year (0.8) (3.7) (1.4) (5.9)
Released during the year (0.7) (0.4) (0.6) (1.7)
At 31 December 2011 2.0 10.6 19.3 31.9
Provisions are all presented as current liabilities.
Provisions are discounted to reflect the time value of money where the effect is significant, generally only where it is anticipated that a liability
will crystallise in more than one year.
Notes to the Accounts continued

Busin
ess
Revi
ewG
over
nanc
eFi
nanc
ial S
tate
men
ts
21119.04 06/03/12 Proof 7
Spectris plc Annual Report and Accounts 2011 97
22. Provisions continued
Reorganisation
Reorganisation provisions relate to committed restructuring plans in place within the business and represent the directors’ best estimate of the
cost to complete the restructuring. Costs are expected to be incurred within one year and there is little judgement in determining the amount.
Product warranty
Product warranty provisions reflect commitments made to customers on the sale of goods in the ordinary course of business and included within
the group’s standard terms and conditions. Warranty commitments typically apply for a 12-month period, with the occasional extension up to 36
months. These extended warranties are not significant. The provision represents the directors’ best estimate of the group’s liability based on past
experience and, barring significant unforeseen events, there is little judgement involved in determining the amount.
Legal, contractual and other
Legal, contractual and other comprises mainly amounts reserved against open legal and contractual disputes. The company has on occasion
been required to take legal or other actions to protect its intellectual property rights, to enforce commercial contracts or otherwise and similarly
to defend itself against proceedings brought by other parties. Provisions are made for the expected costs associated with such matters, based
on past experience of similar items and other known factors, taking into account professional advice received, and represent management’s best
estimate of the likely outcome. The timing of utilisation of these provisions is frequently uncertain, reflecting the complexity of issues and the
outcome of various court proceedings and negotiations. Contractual and other provisions represent the directors’ best estimate of the cost of
settling future obligations although there is a higher degree of judgement involved. Unless specific evidence exists to the contrary, these reserves
are shown as current.
However, no provision is made for proceedings which have been or might be brought by other parties against group companies unless
management, taking into account professional advice received, assesses that it is more likely than not that such proceedings may be successful.
Contingent liabilities associated with such proceedings have been identified, but the directors are of the opinion that any associated claims that
might be brought can be resisted successfully, and therefore the possibility of any material outflow in settlement in excess of amounts provided is
assessed as remote.
23. Deferred tax
Deferred tax is calculated in full on temporary differences under the liability method using the current corporate tax rate in the relevant local
jurisdiction.
The movement on the deferred tax account is shown below.
2011£m
2010£m
At 1 January (14.5) (22.4)
Exchange adjustments 0.3 0.1
Acquisition of subsidiary undertakings 34.9 5.7
Deferred tax on changes in fair value of forward exchange contracts recognised in statement of comprehensive income (0.7) 0.4
Deferred tax on actuarial gains and losses on pension schemes recognised in statement of comprehensive income (0.8) 0.4
Deferred tax on share-based payments recognised in equity 0.3 (0.5)
Charged to statement of income in the year (see Note 10) (6.6) 1.8
At 31 December 12.9 (14.5)
Comprising:
Deferred tax liabilities 33.5 3.9
Deferred tax assets (20.6) (18.4)
12.9 (14.5)

Spectris plc Annual Report and Accounts 201198
21119.04 06/03/12 Proof 7
23. Deferred tax continued
The movements in deferred tax assets and liabilities during the year are shown below. Deferred tax assets and liabilities are only offset where
there is a legally enforceable right of offset and they relate to income taxes levied by the same taxation authority.
Net deferred tax (assets)/liabilities
Accelerated tax depreciation
£m
Accruals and
provisions£m
Tax losses
£m
Unrealised profit on
inter-company
transactions£m
Pension schemes
£m
Goodwill and
intangible assets
£mOther
£m
2011Total
£m
At 1 January 2011 (2.4) (14.3) (2.6) (6.3) (3.5) 13.3 1.3 (14.5)
Exchange adjustments – 0.3 – – – – – 0.3
Acquisition of subsidiary undertakings – – – – – 34.9 – 34.9
Deferred tax on changes in fair value of forward exchange contracts recognised in statement of comprehensive income – – – – – – (0.7) (0.7)
Deferred tax on actuarial loss on pension schemes recognised in statement of comprehensive income – – – – (0.8) – – (0.8)
Deferred tax on share-based payments recognised in equity – – – – – – 0.3 0.3
Charged/(credited) to statement of income 4.2 (10.7) 1.6 (1.3) 0.3 0.3 (1.0) (6.6)
At 31 December 2011 1.8 (24.7) (1.0) (7.6) (4.0) 48.5 (0.1) 12.9
Net deferred tax (assets)/liabilities
Accelerated tax depreciation
£m
Accruals and
provisions£m
Tax losses
£m
Unrealised profit on
inter-company
transactions£m
Pension schemes
£m
Goodwill and
intangible assets
£mOther
£m
2010Total
£m
At 1 January 2010 (1.2) (10.6) (3.8) (3.6) (5.2) 5.4 (3.4) (22.4)
Exchange adjustments – 0.1 – – – – – 0.1
Acquisition of subsidiary undertakings – – – – – 5.7 – 5.7
Deferred tax on changes in fair value of forward exchange contracts recognised in statement of comprehensive income – – – – – – 0.4 0.4
Deferred tax on actuarial gain on pension schemes recognised in statement of comprehensive income – – – – 0.4 – – 0.4
Deferred tax on share-based payments recognised in equity – – – – – – (0.5) (0.5)
Charged/(credited) to statement of income (1.2) (3.8) 1.2 (2.7) 1.3 2.2 4.8 1.8
At 31 December 2010 (2.4) (14.3) (2.6) (6.3) (3.5) 13.3 1.3 (14.5)
Notes to the Accounts continued

Busin
ess
Revi
ewG
over
nanc
eFi
nanc
ial S
tate
men
ts
21119.04 06/03/12 Proof 7
Spectris plc Annual Report and Accounts 2011 99
23. Deferred tax continued
Unrecognised temporary differences
Deferred tax assets have not been recognised on the following temporary differences due to the degree of uncertainty over both the amount and
utilisation of the underlying tax losses and deductions in certain jurisdictions. There is no expiry date associated with losses.
2011£m
2010£m
Tax losses 23.1 29.0
Other temporary differences 9.0 9.6
32.1 38.6
The UK corporation tax rate was reduced to 26% with effect from 1 April 2011 and a further reduction to 25% will take effect from 1 April
2012, being substantively enacted on 5 July 2011. These rate reductions have had no material impact on the financial statements as at
31 December 2011.
A further phased reduction in the UK tax rate to 23% is planned but has not yet been substantively enacted. No account will be taken of the
expected further rate reduction until substantive enactment of these changes. However, for indicative purposes only, had the UK main corporate
tax rate been reduced to 23% the net impact on recognised deferred tax assets and liabilities at 31 December 2011 would not have been
material.
It is likely that the unremitted earnings of overseas subsidiaries would qualify for the UK dividend exemption such that no UK tax would be due
upon remitting these earnings to the UK. However, £34.9m (2010: £22.5m) of those earnings may still result in a tax liability, principally as a
result of the dividend withholding taxes levied by the overseas tax jurisdictions in which those subsidiaries operate. These tax liabilities are not
expected to exceed £1.8m (2010: £1.2m), of which only £0.3m has been provided as the group is able to control the timing of the dividends. It is
not expected that further amounts will crystallise in the foreseeable future.
24. Share capital and reserves
2011 2010
Number of shares
millions
£m
Number of shares
millions
£m
Authorised:
Ordinary shares of 5p each 210.0 10.5 210.0 10.5
Issued and fully paid:
At 1 January 125.0 6.2 125.0 6.2
At 31 December 125.0 6.2 125.0 6.2
The group has one class of ordinary voting shares which carry no right to fixed income.
Other reserves
Movements in reserves are set out in the Consolidated Statement of Changes in Equity. The retained earnings reserve also includes own shares
purchased by the company and treated as treasury shares (see Note 27). The nature and purpose of other reserves forming part of equity are as
follows:
Translation reserve
The foreign currency translation reserve is used to record exchange differences arising from the translation of the financial statements of foreign
subsidiaries, including gains or losses arising on net investment hedges.
Hedging reserve
This reserve records the cumulative net change in the fair value of forward exchange contracts where they are designated as effective cash flow
hedge relationships.
Merger reserve
This reserve arose on the acquisition of Servomex Limited in 1999, a purchase satisfied substantially by the issue of share capital and therefore
eligible for merger relief under the provisions of section 612 of the Companies Act 2006.
Capital redemption reserve
This reserve records the historical repurchase of the group’s own shares.

Spectris plc Annual Report and Accounts 2011100
21119.04 06/03/12 Proof 7
25. Share-based payments
Under the Save As You Earn Share Option Scheme, equity shares are issued following a vesting period of three years. Options may be exercised
during a six-month period following the vesting date, and exercise prices are determined according to the mid-market closing share price
prevailing on the day before the date of grant. There are no performance criteria associated with options granted under the Save As You Earn
Share Option Scheme.
The Executive Share Option Scheme and the Save As You Earn Share Option Scheme were set up in order to provide executives and selected
employees with options to purchase ordinary shares in the company. Under the Executive Share Option Scheme, exercise prices are determined
according to the mid-market closing share price prevailing on the day before the date of grant. Share options granted under the Executive Share
Option Scheme are also subject to performance criteria, being the fulfilment of earnings growth targets. Options vest after a period of three
years, and have a maximum term of ten years.
Under the Performance Share Plan (unapproved share options as defined by HMRC), the exercise price is the nominal cost of the company’s shares.
Awards to Spectris plc executives and senior managers are subject to performance criteria; 50% of the award being based on fulfilment of an
adjusted earnings growth target (EPS) and 50% subject to a total shareholder return target (TSR). Awards made to executives and senior managers
of the group’s operating companies in 2008 and 2009 have performance criteria subject to EPS in respect of 50% of the award and operating
company profit targets in respect of 50% of the award. For awards made in 2010 and 2011, the performance criteria are EPS in respect of 33.33%
of the award and operating company profit targets in respect of 66.67% of the award. Operating company manager awards are entirely subject to
operating company profit targets. Awards vest after a period of three years and must be exercised during the seven-year period following vesting.
During 2011, Performance Share Plan options were granted that were approved share options as defined by HMRC. The performance criteria and
vesting conditions are consistent with the unapproved options granted described above.
Share options outstanding at the end of the year
SAYE – Year of grant
2011 2010
Exercise price£
Exercise year
Numberthousands
Numberthousands
2007 8.37 2011 – 7
2008 7.66 2012 8 35
2009 7.23 2013 49 51
2010 10.19 2014 18 19
2011 13.81 2015 33 –
108 112
Executive Share Option Scheme – Year of grant
2011 2010
Exercise price£
Exercise period
Numberthousands
Numberthousands
2001 3.58–4.99 2004–2011 – 60
2004 4.06–4.62 2007–2014 5 7
2005 5.89 2008–2015 5 5
10 72
Performance Share Plan (unapproved) – Year of grant
2011 2010
Exercise price£
Exercise period
Numberthousands
Numberthousands
2007 0.05 2010–2017 10 23
2008 0.05 2011–2018 198 709
2009 0.05 2012–2019 1,348 1,391
2010 0.05 2013–2020 897 943
2011 0.05 2014–2021 657 –
3,110 3,066
Notes to the Accounts continued

Busin
ess
Revi
ewG
over
nanc
eFi
nanc
ial S
tate
men
ts
21119.04 06/03/12 Proof 7
Spectris plc Annual Report and Accounts 2011 101
25. Share-based payments continued
Performance Share Plan (approved) – Year of grant
2011 2010
Exercise price£
Exercise period
Numberthousands
Numberthousands
2011 11.30 2014-2021 7 –
Movements in the year
SAYE
2011 2010
Number thousands
Weighted average
exercise price £
Value of shares
£mNumber
thousands
Weighted average
exercise price £
Value of shares
£m
At 1 January 112 7.95 0.9 133 7.52 1.0
Granted 33 13.81 0.5 19 10.19 0.2
Exercised (33) 7.77 (0.3) (32) 7.66 (0.2)
Lapsed (4) 8.58 – (8) 7.12 (0.1)
At 31 December 108 9.77 1.1 112 7.95 0.9
Exercisable at 31 December 8 7.66 0.06 7 8.37 0.03
Executive Share Option Scheme
2011 2010
Number thousands
Weighted average
exercise price £
Value of shares
£mNumber
thousands
Weighted average
exercise price £
Value of shares
£m
At 1 January 72 3.92 0.28 396 5.17 2.1
Exercised (61) 3.75 (0.23) (299) 5.49 (1.7)
Lapsed (1) 3.75 – (25) 5.04 (0.1)
At 31 December 10 4.98 0.05 72 3.92 0.3
Exercisable at 31 December 10 4.98 0.05 72 3.92 0.3
Performance Share Plan (unapproved)
2011 2010
Number thousands
Weighted average
exercise price £
Value of shares
£mNumber
thousands
Weighted average
exercise price £
Value of shares
£m
At 1 January 3,066 0.05 0.15 2,694 0.05 0.14
Shares granted 657 0.05 0.03 972 0.05 0.05
Addition of reinvested dividends 55 0.05 – 17 0.05 –
Exercised (346) 0.05 (0.02) (89) 0.05 (0.01)
Lapsed (322) 0.05 (0.01) (528) 0.05 (0.03)
At 31 December 3,110 0.05 0.15 3,066 0.05 0.15
Exercisable at 31 December 208 0.05 0.01 23 0.05 –

Spectris plc Annual Report and Accounts 2011102
21119.04 06/03/12 Proof 7
25. Share-based payments continued
Share-based payment expense
Share options are valued using a stochastic option pricing model, with support from an independent remuneration consultant. The TSR
performance condition was included in the calculation of fair value under the Performance Share Plan. For options granted in 2011 and 2010,
the fair value of options granted and the assumptions used in the calculation are as follows:
SAYEPerformance Share Plan
(unapproved)
2011 2010 2011 2010
Weighted average share price (pence) 1039 1075 1391 815
Weighted average exercise price (pence) 1381 1019 5 5
Expected volatility 42.1% 41.2% 41.0% 41.6%
Expected life 3.25 yrs 3.25 yrs 3 yrs 3 yrs
Risk-free rate 0.9% 1.1% 1.8% 3.1%
Expected dividends (expressed as a yield) 2.8% 2.3% 0%–2.3% 0%–1.9%
Fair value per option (pence) 157 264 – –
Weighted average fair values at date of grant (pence):
Equity-settled (TSR condition) 925 564
Equity-settled (profit condition) 1392 810
Equity-settled (EPS condition) 1382 810
Cash-settled (profit condition) 1337 779
Cash-settled (EPS condition) 1337 779
Weighted average fair values at 31 December (pence):
Cash-settled (profit condition) 1219 1253
Cash-settled (EPS condition) 1219 1253
The assumptions used for the Performance Share Plan (approved) are as follows: grant date share price 1039p, grant date exercise price 1130p,
expected volatility 42%, risk-free rate 0.8%, and expected dividends (expressed as a yield) 2.8%. The fair values at the date of grant were 183p,
224p and 224p for the TSR, profit and EPS conditions, respectively.
The expected volatility is based on historical volatility over the expected term. The expected life is the average expected period to exercise. The
risk-free rate of return is the yield on zero-coupon UK government bonds of a term consistent with the assumed option life.
The group recognised a total charge of £7.3m (2010: £7.3m) in the statement of income, of which £6.4m (2010: £6.6m) related to equity-settled
share-based payment transactions.
26. Disposal of business
On 1 January 2011, the group divested a sales operation in The Netherlands for a profit of £0.1m. The total consideration was £0.1m net of
transaction costs.
The group did not divest any businesses during 2010.
27. Treasury shares
At 31 December 2011, the group held 8,634,064 treasury shares (2010: 9,073,760); 439,696 of these shares were issued to satisfy options
exercised by employees which were granted under the group’s share schemes (2010: 419,815). No shares were repurchased by the group during
the year (2010: nil) and no shares were cancelled during the year (2010: nil).
Notes to the Accounts continued

Busin
ess
Revi
ewG
over
nanc
eFi
nanc
ial S
tate
men
ts
21119.04 06/03/12 Proof 7
Spectris plc Annual Report and Accounts 2011 103
28. Acquisitions
On 10 August 2011, the group acquired 100% of the share capital of IRM Group, a company based in Belgium, which extends the group’s
capabilities in measuring systems for the metals industry, for a consideration of £10.9m (£6.7m net of cash acquired). The excess of the fair value
of the consideration paid over the fair value of the net assets acquired is represented by the following intangible assets: customer-related (mainly
the benefits arising from the installed product base), technology, contractual rights and goodwill of £1.7m, £1.0m, £0.1m and £3.1m, respectively.
The goodwill arising is considered to represent the value of the acquired workforce and related know-how, and the ability to exploit Spectris’
know-how to further develop IRM’s product offering and to expand IRM’s routes to market. This business has been integrated into the In-line
Instrumentation segment.
On 30 September 2011, the group acquired 100% of the share capital of Omega Engineering, a company based in the USA, which broadens
Spectris’ range of process measurement and control instrumentation to customers in the industrial and academic markets, for a total
consideration of £310.6m (£297.1m net of cash acquired), including £3.0m deferred consideration and an expected working capital adjustment
receivable from the seller of £7.1m. The excess of the fair value of the consideration paid over the fair value of the net assets acquired is
represented by the following intangible assets: customer-related (order backlog), contractual rights (including supplier contracts and marketing-
related), trade names (Omega and related brands), technology and goodwill of £0.6m, £3.0m, £63.3m, £28.7m and £174.1m, respectively. The
company sells a wide range of products to a large customer base of principally engineers across a broad group of industries. The customer base
has been developed through focused marketing and excellence in order fulfilment which has created a high degree of brand awareness and
customer loyalty. It is this brand loyalty (together with the product base), rather than long-term customer supply agreements, that represents
the source of customer orders. Accordingly, the principal intangible assets identified are the Omega and related trade names which have strong
profile and recognition, particularly in North America. The goodwill arising is considered to represent the value of the acquired workforce and
related know-how, and the benefits that will accrue as the company exploits Spectris’ global presence and knowledge of international markets to
expand Omega’s routes to market outside of North America. This business has been integrated into the Industrial Controls segment.
On 5 October 2011, the group acquired 100% of the share capital of Sixnet, a company based in the USA, which extends the group’s capabilities
in industrial networking products, for a total consideration of £47.4m (£46.5m net of cash acquired), including £0.4m deferred consideration.
The excess of the fair value of the consideration paid over the fair value of the net assets acquired is represented by the following intangible
assets: customer-related (order book and customer relationships), technology, other intangibles and goodwill of £16.9m, £6.4m, £0.1m and
£18.6m, respectively. The goodwill arising is considered to represent the value of the acquired workforce and related know-how, and the ability
to use Spectris’ sales and distribution channels to expand Sixnet’s routes to markets (both geographic and industry) where it currently makes
limited sales. This business has been integrated into the Industrial Controls segment.
On 20 October 2011, the group acquired certain of the trade and assets of a company based in Finland which extends the group’s capabilities
in critical detector technology, for a total consideration of £8.1m, including £1.0m contingent on the future performance of the business.
No goodwill arose on the acquisition with the excess of the fair value of the consideration paid over the fair value of the net assets acquired
represented by technology-based intangibles of £7.6m. This business has been integrated into the Materials Analysis segment.
The assets and liabilities acquired as a result of the above transactions, together with the aggregate purchase consideration, are summarised
below. The revenue and operating profit contribution from the acquisitions in the year to the group’s results for the year were £36.3m and
£7.5m, respectively. Group revenue and operating profit would have been £1,218.2m and £189.4m (adjusted operating profit: £226.8m),
respectively, had each of these acquisitions taken place on the first day of the year.
On acquisitions prior to 1 January 2010, the deferred and contingent consideration has been revised to reflect the increased earn-out payments
amounting to £0.7m that were not accrued at 31 December 2010 and the decreased earn out payments amounting to £3.0m that were accrued
at 31 December 2010 but are now not required with a corresponding decrease to goodwill of £1.7m. The balance of £1.3m would have created
a credit balance in goodwill and has thus been credited to the statement of income in line with IFRS 3 (2004). The group also paid £7.2m in
respect of prior years’ acquisitions, which had been accrued as deferred or contingent consideration at 31 December 2010.
Acquisition-related costs of £3.1m have been recognised in the statement of income under IFRS 3 (Revised) and included within administrative
expenses.
Acquisition-related costs and the credit arising on the reduction in deferred and contingent consideration have been excluded from the adjusted
operating profit (see Note 3).

Spectris plc Annual Report and Accounts 2011104
21119.04 06/03/12 Proof 7
28. Acquisitions continued
The following fair value tables are provisional, reflecting the timing of the acquisitions, and are expected to be finalised within 12 months of the
acquisition date.
Net assets acquired under 2011 acquisitions 2011
Book value £m
Adjustments £m
Fair value £m
Intangible fixed assets 0.2 129.4 129.6
Tangible fixed assets 14.0 19.2 33.2
Deferred tax asset 1.8 (1.6) 0.2
Inventories 30.5 (1.6) 28.9
Trade and other receivables 20.3 (0.2) 20.1
Trade and other payables (12.4) (1.1) (13.5)
Provisions (1.2) 0.4 (0.8)
Deferred tax liabilities – (35.1) (35.1)
Cash 18.6 – 18.6
Net assets acquired 71.8 109.4 181.2
Goodwill 195.8
Total consideration in respect of 2011 acquisitions 377.0
Analysis of cash outflow in consolidated cash flow statement
Total consideration in respect of 2011 acquisitions 377.0
Adjustment for cash acquired on 2011 acquisitions (18.6)
Deferred and contingent consideration on 2011 acquisitions to be paid in future years (4.4)
Working capital adjustment receivable in future years 7.1
Cash paid in 2011 in respect of 2011 acquisitions 361.1
Prior year acquisitions
Purchase price adjustment re prior year acquisition* 0.7
Deferred and contingent consideration in relation to prior years’ acquisitions:
– accrued at 31 December 2010 7.2
Cash paid in 2011 in respect of prior years’ acquisitions 7.9
Net cash outflow relating to acquisitions 369.0
* An additional purchase price of £0.7m in relation to prior period acquisitions has been paid during the year based on updated expectations
Due to their contractual due dates, the fair value of receivables acquired (shown above) approximates the gross contractual amounts receivable.
The amount of gross contractual receivables not expected to be recovered is immaterial.
There are no material contingent liabilities recognised in accordance with paragraph 23 of IFRS 3 (Revised).
£39.0m of the goodwill arising on acquisitions in the year is expected to be amortised and deductible for tax purposes.
Notes to the Accounts continued

Busin
ess
Revi
ewG
over
nanc
eFi
nanc
ial S
tate
men
ts
21119.04 06/03/12 Proof 7
Spectris plc Annual Report and Accounts 2011 105
28. Acquisitions continued
Net assets acquired for significant 2011 acquisitions 2011
Net assets acquired for Omega EngineeringBook value
£mAdjustments
£mFair value
£m
Intangible fixed assets – 95.6 95.6
Tangible fixed assets 11.4 18.9 30.3
Deferred tax asset 1.3 (1.1) 0.2
Inventories 24.9 (1.7) 23.2
Trade and other receivables 14.4 (0.1) 14.3
Trade and other payables (6.6) (0.5) (7.1)
Provisions – (0.5) (0.5)
Deferred tax liabilities – (33.0) (33.0)
Cash 13.5 – 13.5
Net assets acquired 58.9 77.6 136.5
Goodwill 174.1
Total consideration 310.6
Adjustment for cash acquired (13.5)
Net consideration 297.1
The fair values of the intangible and tangible assets have been determined on the following basis:
• Intangible assets – an independent valuation
• Tangible assets – by management based on current market prices2011
Net assets acquired for SixnetBook value
£mAdjustments
£mFair value
£m
Intangible fixed assets 0.2 23.4 23.6
Tangible fixed assets 1.5 (0.1) 1.4
Deferred tax asset 0.5 (0.5) –
Inventories 3.1 0.1 3.2
Trade and other receivables 4.2 (0.1) 4.1
Trade and other payables (3.5) – (3.5)
Provisions (0.1) – (0.1)
Deferred tax liabilities – (0.8) (0.8)
Cash 0.9 – 0.9
Net assets acquired 6.8 22.0 28.8
Goodwill 18.6
Total consideration 47.4
Adjustment for cash acquired (0.9)
Net consideration 46.5

Spectris plc Annual Report and Accounts 2011106
21119.04 06/03/12 Proof 7
28. Acquisitions continued
The following table presents the information related to 2010 acquisitions, reflected in the comparative figures.
Net assets acquired under 2010 acquisitions2010
Book value £m
Adjustments £m
Fair value £m
Intangible fixed assets 0.1 36.5 36.6
Tangible fixed assets 0.5 (0.1) 0.4
Inventories 4.1 (0.2) 3.9
Trade and other receivables 4.5 – 4.5
Trade and other payables (1.7) – (1.7)
Provisions (0.1) – (0.1)
Deferred tax liabilities – (5.7) (5.7)
Cash 0.8 – 0.8
Net assets acquired 8.2 30.5 38.7
Goodwill 24.3
Total consideration in respect of 2010 acquisitions 63.0
Analysis of cash outflow in consolidated cash flow statement
Total consideration in respect of 2010 acquisitions 63.0
Adjustment for cash acquired on 2010 acquisitions (0.8)
Deferred and contingent consideration on 2010 acquisitions to be paid in future years (4.1)
Cash paid in 2010 in respect of 2010 acquisitions 58.1
Prior year acquisitions
Purchase price adjustment re prior year acquisition* 8.3
Deferred and contingent consideration in relation to prior year acquisitions:
– accrued at 31 December 2009 4.5
– accrued during 2010 but not paid at 31 December 2010* (8.3)
Cash paid in 2010 in respect of prior year acquisitions 4.5
Net cash outflow relating to acquisitions 62.6
* An additional purchase price of £8.3m in relation to prior year acquisitions was accrued (but not paid) during 2010 based on updated expectations of the amounts to be paid under contingent consideration arrangements
Notes to the Accounts continued

Busin
ess
Revi
ewG
over
nanc
eFi
nanc
ial S
tate
men
ts
21119.04 06/03/12 Proof 7
Spectris plc Annual Report and Accounts 2011 107
28. Acquisitions continued
Net assets acquired for significant 2010 acquisitions 2010
Net assets acquired for N-TronBook value
£mAdjustments
£mFair value
£m
Intangible fixed assets 0.1 13.6 13.7
Tangible fixed assets 0.1 – 0.1
Inventories 1.5 0.3 1.8
Trade and other receivables 1.8 – 1.8
Trade and other payables (1.2) – (1.2)
Net assets acquired 2.3 13.9 16.2
Goodwill 16.7
Total consideration 32.9
Adjustment for cash acquired –
Net consideration 32.9
29. Contingent liabilities
Royal Bank of Scotland
Spectris plc and its UK subsidiaries are party to a cross guarantee arrangement to support trade finance facilities provided by the bank. They are
also party to a cross guarantee arrangement that allows individual subsidiaries to borrow from the bank on overdraft within the overall borrowing
limit agreed with the bank. Spectris plc has provided a parent company guarantee to support trade finance facilities provided by the bank to its
subsidiaries in various countries outside of the UK and USA. Spectris plc has also provided a parent company guarantee to support overdraft and
intra-day facilities provided by the bank to its subsidiaries who participate in the cross-border euro zero balance pooling arrangement. An amount
of £15.3m (2010: £11.2m) was outstanding at 31 December 2011.
JP Morgan Chase NA
Spectris plc has provided a parent company guarantee to JP Morgan Chase NA to support trade finance facilities provided by the bank to its
subsidiaries in the USA. An amount of £0.9m (2010: £1.4m) was outstanding at 31 December 2011.
Other banks
Group companies have, in the normal course of business, provided bonds and guarantees through local banking arrangements amounting to
£9.0m (2010: £8.5m).
Legal
Refer to Note 22 ‘Provisions’.
30. Operating lease arrangements
Total commitments under non-cancellable operating leases2011 2010
Property£m
Other£m
Property£m
Other£m
Not later than one year 9.6 3.4 5.9 2.9
Later than one year and not later than five years 26.4 6.2 14.3 5.4
Later than five years 5.6 – 5.3 –
41.6 9.6 25.5 8.3
Group companies are party to a number of operating leases, mainly for plant and machinery, including motor vehicles and property rentals. The
arrangements do not impose any significant restrictions on the group.
During the year £10.8m (2010: £10.6m) was recognised in the statement of income in respect of operating lease rental payments.

Spectris plc Annual Report and Accounts 2011108
21119.04 06/03/12 Proof 7
31. Capital commitments
At 31 December 2011, the group had entered into contractual commitments for the acquisition of property, plant and equipment and software
amounting to £3.1m (2010: £2.0m) which have not been provided for.
32. Related party transactions
Details of directors’ remuneration (being the key management personnel) are summarised in Note 7 and shown in detail in the Directors’
Remuneration Report on page 52. There were no other related party transactions requiring disclosure.
33. Subsidiary undertakings
The following are the group’s principal subsidiary undertakings. They operate mainly in the countries of incorporation. All the subsidiaries are
involved in the manufacture and sale of materials analysis systems, test and measurement equipment, in-line instrumentation and industrial
controls.
Spectris plc holds 100% of the ordinary share capital of all the subsidiaries either directly or indirectly through intermediate holding companies.
Country of incorporation
Brüel & Kjær VTS Limited (formerly LDS Test and Measurement Limited) UK
Malvern Instruments Limited UK
Servomex Group Limited UK
Brüel & Kjær EMS Pty Ltd (formerly Lochard Limited) Australia
Spectris China Limited China
Brüel & Kjær Sound & Vibration Measurement A/S Denmark
Brüel & Kjær Vibro A/S Denmark
Hottinger Baldwin Messtechnik GmbH Germany
Spectris Company Limited Japan
BTG Eclépens SA Switzerland
PANalytical BV The Netherlands
Beta LaserMike Inc USA
Fusion UV Systems Inc USA
Microscan Systems Inc USA
NDC Infrared Engineering Inc USA
Omega Engineering Inc USA
Particle Measuring Systems Inc USA
Red Lion Controls Inc USA
Sixnet Holdings LLC USA
Notes to the Accounts continued

Busin
ess
Revi
ewG
over
nanc
eFi
nanc
ial S
tate
men
ts
21119.04 06/03/12 Proof 7
Spectris plc Annual Report and Accounts 2011 109
Note2011
£m2010
£m
Fixed assets
Intangible fixed assets 36 1.1 1.6
Tangible fixed assets 37 2.1 0.2
Fixed asset investments 38 251.4 247.1
254.6 248.9
Current assets
Debtors 39 498.9 398.2
Cash at bank 5.3 35.1
504.2 433.3
Creditors: due within one year
Other creditors 40 (130.7) (179.0)
(130.7) (179.0)
Net current assets 373.5 254.3
Debtors: due after more than one year
Debtors 41 307.3 170.6
Total assets less current liabilities 935.4 673.8
Creditors: due after more than one year
Medium- and long-term borrowings 42 (429.4) (168.7)
Derivative financial instruments 43 (12.8) (15.0)
(442.2) (183.7)
Provisions for liabilities and charges 44 (2.7) (2.7)
Net assets 490.5 487.4
Capital and reserves
Called up share capital 45 6.2 6.2
Share premium account 46 231.4 231.4
Merger reserve 46 3.1 3.1
Capital redemption reserve 46 0.3 0.3
Special reserve 46 34.1 34.1
Profit and loss account 46 215.4 212.3
Equity shareholders’ funds 490.5 487.4
The financial statements on pages 109 to 116 were approved by the Board of directors on 17 February 2012 and were signed on its behalf by:
Clive Watson
Director Company Registration No. 02025003
Company Balance SheetAs at 31 December 2011

Spectris plc Annual Report and Accounts 2011110
21119.04 06/03/12 Proof 7
34. Accounting policies
The separate financial statements of the company are presented as required by the Companies Act 2006. As permitted by that Act, the separate
financial statements have been prepared in accordance with applicable accounting standards in the United Kingdom. In accordance with the
exemption provided by Section 408 of the Companies Act 2006, the company has not presented its own profit and loss account.
The company has taken the exemption available in respect of the requirements of FRS 29, Financial Instruments: Disclosures.
Basis of accounting
The accounts are prepared on the historical cost basis, except that derivative financial instruments are stated at fair value as described below.
Derivative financial instruments
The company uses derivative financial instruments to hedge the group’s exposure to foreign exchange and interest rate risks arising from
operating and financing activities. In accordance with its treasury policy, it does not hold or use derivative financial instruments for trading or
speculative purposes.
Cross-currency interest rate swaps
The company takes advantage of cross-currency interest rate swaps for some of its US dollar-denominated private placement borrowings. The
swaps have the effect of converting fixed rate US dollar borrowings into fixed rate euro-denominated borrowings.
The underlying US dollar borrowings are required to be presented separately in the balance sheet from the cross-currency interest rate swaps. In
addition, the fair value of the cross-currency interest rate swap is required to be recognised in full on the balance sheet. All changes in value are
recognised in the profit and loss account.
Financial guarantees
Where the company enters into financial guarantee contracts to guarantee the indebtedness of other companies within its group, the company
considers these to be insurance arrangements and accounts for them as such. In this respect, the company treats the guarantee contract as a
contingent liability until such time as it becomes probable that the company will be required to make a payment under the guarantee.
Foreign currencies
Transactions in foreign currencies are translated at the foreign exchange rate ruling at the date of the transaction. Monetary assets and liabilities
denominated in foreign currencies at the balance sheet date are translated at the exchange rate ruling at that date with any exchange differences
arising on retranslation being recognised in the profit and loss account. Non-monetary assets and liabilities that are measured in terms of
historical cost in a foreign currency are translated using the exchange rate at the date of the transaction.
Tangible fixed assets and depreciation
Tangible fixed assets are stated at historic cost.
Depreciation is calculated to write off the difference between the cost or valuation of fixed assets and their residual value over their estimated
useful lives on a straight-line basis. Land is not depreciated. Estimated useful lives are as follows:
Freehold property — 20 to 40 years
Leasehold improvements — over the period of the lease
Office equipment — 3 to 5 years
Intangible fixed assets and amortisation
Intangible fixed assets purchased by the company are capitalised at their cost.
Amortisation of intangible assets is charged to administrative expenses in the profit and loss account on a straight-line basis over the estimated
useful lives of intangible assets. The estimated useful lives are as follows:
Software — 3 to 5 years
Fixed asset investments
Investments in subsidiaries are stated at cost less, where appropriate, provisions for impairment.
Trade and other receivables
Trade and other receivables are initially recognised at fair value and subsequently measured at their amortised cost, reduced by appropriate
allowances for estimated irrecoverable amounts.
Trade and other payables
Trade and other payables are initially recognised at fair value and are subsequently measured at amortised cost.
Notes to the Company’s Accounts

Busin
ess
Revi
ewG
over
nanc
eFi
nanc
ial S
tate
men
ts
21119.04 06/03/12 Proof 7
Spectris plc Annual Report and Accounts 2011 111
34. Accounting policies continued
Taxation
The charge for taxation is based on the profit for the year and takes into account taxation deferred because of timing differences between
the treatment of certain items for taxation and accounting purposes. Deferred tax is recognised, without discounting, in respect of all timing
differences between the treatment of certain items for taxation and accounting purposes which have arisen but not reversed by the balance
sheet date, except as otherwise required by FRS 19.
Leasing
Annual payments under operating leases are charged to the profit and loss account on an accruals basis.
Post-retirement benefits
The company participates in group operated defined contribution and defined benefit pension schemes. The assets of the schemes are held
separately from those of the company in independently administered funds. The company is unable to identify its share of the group defined
benefit scheme’s underlying assets and liabilities and therefore accounts for it as a defined contribution scheme. The amounts charged against
profits represent contributions payable to the schemes in respect of the accounting period.
Share-based payments
The fair value of the options granted is measured using an option pricing model, taking into account the terms and conditions upon which the
options were granted. The amount recognised as an expense is adjusted to reflect the actual number of awards for which the related service
and non-market vesting conditions are expected to be met, such that the amount ultimately recognised as an expense is based on the number
of awards that do meet the related service and non-market performance conditions at the vesting date. For share-based payment awards with
non-vesting conditions, the grant date fair value of the share-based payment is measured to reflect such conditions and there is no true-up for
differences between expected and actual outcomes.
Where the company grants options over its own shares to the employees of its subsidiaries it recognises an increase in the cost of investment
in its subsidiaries equivalent to the equity-settled share-based payment charge recognised in its subsidiary’s financial statements with the
corresponding credit being recognised directly in equity. In cases where a subsidiary is recharged for the share-based payment expense, no such
increase in investment is recognised.
Cash flow statement
The company has not presented a separate cash flow statement in accordance with the exemption provided by FRS 1 (Revised), as its cash flows
are included within the cash flows of the group, as set out elsewhere in this Annual Report.
35. Employee costs and other information
Employee costs, including directors’ remuneration 2011
£m2010
£m
Wages and salaries 6.1 4.7
Social security costs 2.0 1.8
Defined benefit pension plans 1.6 3.5
Defined contribution pension plans 0.3 0.4
Share-based payment expense 1.7 1.9
11.7 12.3
2011Number
2010Number
Average number of employees 33 29
Directors’ remuneration
Further details of directors’ remuneration and share options are given in Note 7 to the group’s consolidated financial statements and in the
Directors’ Remuneration Report on pages 52 to 54.
Auditor’s fees
Details regarding the remuneration of the company’s auditor are included in Note 6 to the group’s consolidated financial statements under “Fees
payable to the company’s auditor for the audit of the group’s annual accounts”.

Spectris plc Annual Report and Accounts 2011112
21119.04 06/03/12 Proof 7
36. Intangible fixed assets
Cost
Software costs
£m
At 1 January 2011 2.8
Additions 0.1
At 31 December 2011 2.9
Amortisation
At 1 January 2011 1.2
Charge for the year 0.6
At 31 December 2011 1.8
Net book value
At 31 December 2011 1.1
At 31 December 2010 1.6
37. Tangible fixed assets
Cost
Freeholdproperty
£m
Leasehold improvements
£m
Officeequipment
£mTotal
£m
At 1 January 2011 – 0.5 0.6 1.1
Additions 1.9 – – 1.9
At 31 December 2011 1.9 0.5 0.6 3.0
Depreciation
At 1 January 2011 – 0.4 0.5 0.9
At 31 December 2011 – 0.4 0.5 0.9
Net book value
At 31 December 2011 1.9 0.1 0.1 2.1
At 31 December 2010 – 0.1 0.1 0.2
The company purchased a freehold property during in the year for use as the group’s headquarters. The building is currently undergoing
refurbishment, therefore no depreciation has been charged for the year.
Notes to the Company’s Accounts continued

Busin
ess
Revi
ewG
over
nanc
eFi
nanc
ial S
tate
men
ts
21119.04 06/03/12 Proof 7
Spectris plc Annual Report and Accounts 2011 113
38. Fixed asset investments
Cost
Investments in subsidiary undertakings
£m
At 1 January 2011 316.7
Additions 38.2
Disposals (33.9)
At 31 December 2011 321.0
Provision for impairment
At 1 January 2011 69.6
At 31 December 2011 69.6
Net book value
At 31 December 2011 251.4
At 1 January 2011 247.1
During the year, Spectris Group Holdings Limited, a wholly-owned subsidiary, bought back 33,874,203 ordinary shares of £1 each (pursuant to
and in accordance with the provisions of section 694(2) of the Companies Act 2006) at par value. On the same date, Spectris Group Holdings
Limited issued 40,140,931 redeemable ordinary shares of €1 each for a consideration of £33.9m, included in the additions above.
Further details regarding the investments in subsidiaries are given in Note 33 to the group’s consolidated financial statements.
39. Debtors
Amounts falling due within one year 2011
£m2010
£m
Amounts owed by group undertakings 493.1 394.4
Other debtors 0.3 0.5
Prepayments and accrued income 2.6 0.7
Corporation tax 1.2 1.0
Deferred tax asset 1.5 1.6
Derivative financial instrument 0.2 –
498.9 398.2
Derivative financial instrument assets represent the value of forward exchange contracts at the year end. Further details regarding the company’s
forward exchange contracts are set out in Note 20 of the group’s consolidated financial statements.
40. Creditors: due within one year
2011£m
2010£m
Amounts owed to group undertakings 122.2 172.9
Other taxation and social security – 0.2
Accruals and deferred income 8.5 5.9
130.7 179.0
Further details regarding the company’s borrowings are set out in Note 19 of the group’s consolidated financial statements.

Spectris plc Annual Report and Accounts 2011114
21119.04 06/03/12 Proof 7
41. Debtors: due after more than one year
2011£m
2010£m
Medium- and long-term debtors:
Amounts owed by group undertakings 307.3 170.6
42. Creditors: due after more than one year
2011£m
2010£m
Medium- and long-term borrowings:
Amounts owed to group undertakings 45.9 35.1
Unsecured bank loans 298.3 48.3
Unsecured loan notes 85.2 85.3
429.4 168.7
Further details regarding the company’s borrowings are set out in Note 19 of the group’s consolidated financial statements.
43. Derivative financial instruments
2011£m
2010£m
Cross-currency interest rate swaps 12.8 14.9
Forward exchange contracts – 0.1
12.8 15.0
Further details regarding the company’s cross-currency interest rate swaps and forward exchange contracts are set out in Note 20 of the group’s
consolidated financial statements.
44. Provisions for liabilities and charges
£m
At 1 January 2011 2.7
Utilised during the year (0.1)
Charged during the year 0.1
At 31 December 2011 2.7
Provisions represent the directors’ best estimate of settling various potential claims against the company arising in the ordinary course of business.
Notes to the Company’s Accounts continued

Busin
ess
Revi
ewG
over
nanc
eFi
nanc
ial S
tate
men
ts
21119.04 06/03/12 Proof 7
Spectris plc Annual Report and Accounts 2011 115
45. Share capital
2011 2010
Number of shares million £m
Number of shares million £m
Authorised:
Ordinary shares of 5p each 210.0 10.5 210.0 10.5
Issued and fully paid:
At 1 January 125.0 6.2 125.0 6.2
At 31 December 125.0 6.2 125.0 6.2
No ordinary shares were issued upon exercise under share option schemes (2010: nil).
Share options have been granted to subscribe for ordinary shares of Spectris plc. Full details of share options currently in issue, including those
issued during the year, together with information regarding the basis of calculation of the share-based payment expense, is contained in Note 25
to the group’s consolidated financial statements.
The company recognised total expenses of £1.7m related to equity-settled share-based payment transactions in 2011 (2010: £1.9m). In addition,
the company recognised a charge of £4.7m (2010: £4.7m) related to equity-settled share-based transactions for certain employees of other
group companies.
46. Reserves
Sharepremiumaccount
£m
Mergerreserve
£m
Capitalredemption
reserve£m
Specialreserve
£m
Profit and loss
account£m
Total£m
At 1 January 2011 231.4 3.1 0.3 34.1 212.3 481.2
Profit for the year – – – – 30.0 30.0
Equity dividends paid – – – – (33.8) (33.8)
Share-based payments – – – – 6.4 6.4
Share options exercised from own shares (treasury) purchased – – – – 0.5 0.5
At 31 December 2011 231.4 3.1 0.3 34.1 215.4 484.3
The purpose of the merger reserve and capital redemption reserve is detailed in Note 24 of the group’s consolidated financial statements.
The special reserve was created historically following the cancellation of an amount of share premium for the purpose of writing off goodwill.
The special reserve is not distributable.

Spectris plc Annual Report and Accounts 2011116
21119.04 06/03/12 Proof 7
47. Reconciliation of movement in equity shareholders’ funds
2011£m
2010£m
Profit for the year 30.0 47.7
Equity dividends paid in the year (33.8) (28.9)
Share-based payments 6.4 6.6
Share options exercised from own shares (treasury) purchased 0.5 1.9
Net increase in equity shareholders’ funds 3.1 27.3
Opening equity shareholders’ funds 487.4 460.1
Closing equity shareholders’ funds 490.5 487.4
48. Pensions
The company operates the Spectris Pension Plan, a UK defined benefit pension plan that is closed to new members. Further details of the
Spectris Pension Plan are contained in Note 8 to the group’s consolidated financial statements. The company is unable to identify its share of the
Plan’s underlying assets and liabilities and therefore accounts for the Plan as a defined contribution scheme. In accordance with the Schedule of
Contributions in place for the Spectris Pension Plan for the financial year ending 31 December 2011, employer contributions were £1.6m per
annum. The actuary certified in 2010 that this level of contribution was adequate for the purposes of securing the statutory funding objective.
No additional contribution was made during the year (2010: £1.9m) towards the Spectris Pension Plan. Contributions paid in the year to the
Spectris Pension Plan were £1.6m (2010: £3.5m) and the amounts outstanding at the year end were £0.1m (2010: £0.1m). Contributions paid in
the year to defined contribution plans were £0.3m (2010: £0.4m). The company has undertaken an Enhanced Transfer Value exercise for certain
UK deferred members with a prospective pension entitlement of less than £1,000 per annum. The total estimated cost for this exercise for the
year ended 31 December 2011 is expected to be £0.5m.
49. Related party disclosures
The company has taken advantage of the exemption under FRS 8, Related Party Disclosures, not to disclose related party transactions between
the company and wholly-owned subsidiaries.
There are no material transactions with directors and other related parties of the company except those relating to remuneration and share
dealing disclosed in the Directors’ Remuneration Report, enclosed within this Annual Report.
50. Commitments
Annual commitments for operating leases expiringLand and buildings
2011£m
2010£m
Between one and two years 0.2 –
Between two and five years – 0.2
At the balance sheet date the company had capital commitments of £1.2m in respect of the refurbishment of freehold property for which
provision has not been made (2010: £nil).
51. Contingent liabilities
There are no contingent liabilities as at the year end. The cross guarantee arrangements to support trade finance facilities are stated in Note 29 of
the group’s consolidated financial statements.
Notes to the Company’s Accounts continued

21119.04 06/03/12 Proof 7
Shareholder Information
Financial calendar
Annual General Meeting and Interim
management statement 20 April 2012
Record date for 2011 final dividend 1 June 2012
2011 final dividend payable 26 June 2012
2012 Interim results 27 July 2012
Interim management statement 19 October 2012
2012 Preliminary results February 2013
Company secretary
R J Stephens, FCIS
Registered office
Spectris plc
Station Road
Egham
Surrey
TW20 9NP
England
Tel: +44 (0)1784 470470
Email: [email protected]
Company registered in England, No. 2025003
Auditors
KPMG Audit Plc
Bankers
Royal Bank of Scotland Plc
Solicitors
Macfarlanes LLP
Brokers
Jefferies Hoare Govett
J P Morgan Cazenove
Financial PR advisers
FTI Consulting
Registrars
Equiniti Limited
Aspect House
Spencer Road
Lancing
West Sussex
BN99 6DA
The registrars provide a range of shareholder services on-line at
www.shareview.co.uk
Share price information
The company’s ordinary shares are listed on the London Stock
Exchange. The latest share price is available via the company’s
website at www.spectris.com
E-mail news service
To receive details of press releases and other announcements
as they are issued, register with the e-mail alert service on the
company’s website at www.spectris.com
Photography
Board photography by Ross Vincent
Hydroptère image on front cover and page 23 by Guilain Grenier
Xiaowan Hydroelectric power station on page 25 by Chen Haining/
Xinhua Press/Corbis
‘Spectris’ is a trademark of Spectris plc and is protected by registration
in the United Kingdom and other jurisdictions. Other product names
referred to in this annual report are registered or unregistered
trademarks or registered names of Spectris plc or its subsidiary
companies and are similarly protected.
This report is printed on Revive 50 White Silk, a
recycled paper containing 50% recycled waste and
50% virgin fibre which is manufactured at a mill
certified to the ISO 14001 environmental standard.
The pulp used in this product is bleached using an
elemental chlorine free process.
© Spectris plc March 2012
Designed and printed by Jones and Palmer
Spectris plc Annual Report and Accounts 2011 117

21119.04 06/03/12 Proof 7
Spectris plcStation RoadEghamSurreyTW20 9NPEngland
T: +44 (0)1784 470470F: +44 (0)1784 [email protected]
Spectris plc Annual Report and Accounts 2011