enhancing financial transparency to mitigate climate
TRANSCRIPT
ENHANCING FINANCIAL TRANSPARENCY TO MITIGATE CLIMATE CHANGE: TOWARDS A CLIMATE RISKS AND OPPORTUNITIES REPORTING INDEX
Documents de travail GREDEG GREDEG Working Papers Series
Jeanne AmarSamira DemariaSandra Rigot
GREDEG WP No. 2020-52https://ideas.repec.org/s/gre/wpaper.html
Les opinions exprimées dans la série des Documents de travail GREDEG sont celles des auteurs et ne reflèlent pas nécessairement celles de l’institution. Les documents n’ont pas été soumis à un rapport formel et sont donc inclus dans cette série pour obtenir des commentaires et encourager la discussion. Les droits sur les documents appartiennent aux auteurs.
The views expressed in the GREDEG Working Paper Series are those of the author(s) and do not necessarily reflect those of the institution. The Working Papers have not undergone formal review and approval. Such papers are included in this series to elicit feedback and to encourage debate. Copyright belongs to the author(s).
Enhancing financial transparency to mitigate climate change:
Towards a Climate Risks and Opportunities Reporting Index ∗†
J. Amar‡, S. Demaria§, S. Rigot¶
GREDEG Working Paper No. 2020–52
This version: December 2020
Abstract
As climate change introduces more risks and uncertainties into the economy and the financial
system, information failures limit the understanding of its financial impact on companies. In
order to create the necessary conditions for transparency regarding these risks, the Financial
Stability Board has set up an international working group, the Task Force on Climate-related
Financial Disclosures (TCFD), with the aim of enhancing climate related corporate disclosures.
On the basis of these recommendations and using a rigorous methodology, we develop an orig-
inal composite index: the Climate Risks and Opportunities Reporting Index (CRORI). This
reliable and reproducible index is the first indicator providing a standardized measure of the
extent to which companies comply with the TCFD’s recommendations. Then, in order to en-
sure the robustness of our index, we calculate the CRORI of CAC 40 companies over the period
2015-2018. Using various statistical techniques (Cronbach alpha, principal component analysis,
etc.), we conclude that the CRORI methodology is satisfactory. Moreover, such an empirical
analysis gives a first insight into the evolution of companies’ compliance with the TCFD recom-
mendations. Our results reveal a trend towards improved voluntary disclosure of climate-related
information, particularly in the case of large companies and CO2-intensive companies.
JEL classification: G38; M41; Q51; Q56; F39; G3
Keywords: Climate disclosures; CSR reporting; climate-related risk; TCFD recommendations.
Fundings: This work was financed by ADEME (Agency for Ecological Transition) and by the
Chair Energy and Prosperity under the aegis of the Fondation du Risque.
∗The authors are grateful for the comments and remarks received at the ANC, Infiniti Conference and the internalseminars at the University of Cote d’Azur. The authors also thank Sylvain Borie and Alain Grandjean for theiradvice.†The following paper is a preliminary step in the robust construction of the CRORI : Demaria et al (2019) A
new measure of environmental reporting practice based on the recommendations of the Task Force on Climate-related Financial Disclosures. AFC 2019,May 2019, Paris,France. http://d.repec.org/n?u=RePEc:hal:journl:halshs-02407136r=ene‡University of Cote d’Azur, GREDEG, CNRS. [email protected].§University of Cote d’Azur, GREDEG, CNRS. [email protected].¶University Paris 13, CEPN UMR 7234. [email protected]
1
1 Introduction
Global warming and energy transition are crucial challenges for the global economy. They introduce
greater uncertainty and involve twofold risk into the economy and financial activity. On the one
hand, physical risks result from the damage caused directly by weather and climate phenomena
triggered by changes in the climate system (damage to firm’s assets, infrastructure and supply
chains). On the other hand, transition risks stem from changes in the regulatory environment and
the public policies (carbon market, carbon taxation, CO2 emission quotas, green taxation, infor-
mation disclosures...) used to “mainstream” long-term climate objectives into economy (Burke and
Hsiang (2015), Stern (2013)). In the context of 2-Degree Scenario, despite a wide acceptance of the
need to reduce emissions, information failures limit understanding of the financial climate related
risks. Indeed the demand for meaningful market information is broad, ranging from depositors,
policyholders, shareholders, creditors, through to rating agencies, credit and market analysts, and
the financial media. Data are necessary for companies to get an idea of the vulnerability risks of
their climate change activities or for investors eager to achieve the decarbonation objectives of their
portfolios.
More generally, disclosure of information requirements for financial and non-financial corpora-
tions are key part of market discipline. According to efficient market theory, market discipline is
the basis of the self-regulation, it reflects the influence investors and other stakeholders can have
on an institution’s behaviour and risk profile. Disclosure of information helps to build stakeholder
confidence that the institution is presenting an accurate and reliable picture of its financial position,
and complying with all relevant laws, regulations and rules; enables diverse private sector stake-
holders to monitor the institution and make appropriate and well-informed decisions on whether
to invest in the institution; and create a well-informed market, which is a precondition for improv-
ing the efficiency of the financial system by helping to better allocate society’s scarce resources.
Thereby, through the financial transparency and confidence between market participants that it
is supposed to establish, market discipline legitimizes the creation of high-quality and internation-
ally updated disclosures on a financial institution’s performance, strength, and risk profile. While
regulated financial information is an essential basis for investment decision-making, it is currently
considered insufficient to reflect the complex reality of the company and its contribution to value
2
creation in terms of social and environmental issues. There is a need for a complementary infor-
mation by providing all business stakeholders with quality non-financial information to assess their
contribution to sustainable economic and financial development in general. Indeed, although there
is a wide range of frameworks that guide environmental disclosure practices1, which offer elements
of a solution for structuring the content of non-financial information, they lack coordination and
consistency. Moreover, there is great heterogeneity at the thematic and operational levels.2 In
addition, reporting structures are complex and disparate, reducing the readability of non-financial
information. The multiple options available lead to excessive flexibility that hinders comparability.
Finally, external control of non-financial information is not widespread. Thus, while the dynamics
observed are real, they remain fragile because non-financial information remains incomplete, of
uneven quality and difficult to compare.
In this context, in 2015, at COP 21, the Financial Stability Board set up an international
working group, the Task Force on Climate-related Financial Disclosures (TCFD)3, in order to create
the necessary conditions for transparency regarding climate risks and opportunities and to make
recommendations for a better harmonisation of the non-financial reporting framework. Specifically,
the TCFD is intended to guide companies in providing clear, comparable and consistent disclosure to
provide investors with information about their governance, strategy, risk management and metrics
practices (see Section 3.1). The TCFD’s report (TCFD (2017)) provides a new framework through
a set of recommendations for companies to improve their climate change disclosure practices. Its
final recommendations (TCFD (2017)) take the form of a grid of themes which is on the way to
becoming the international reference for climate issues. It is interesting to note that the number
of firms supporting this recommendation has risen sharply since 2017, which can be explained by
: i) a desire to anticipate regulatory constraints ; ii) the need to respond to users’ expectations
1Over the past twenty years or so, there has been a real dynamic in the non-financial information of companiesvia private or public initiatives leading to a plethora of standards : GRI guidelines, Integrated reporting or CarbonDisclosure Project among others.
2The general reference frameworks available constitute significant advances in terms of substance, even if they canstill be largely improved. The sector-specific frameworks available have practical attractions, but can be reductive,particularly if they are proposed as a substitute for general-purpose frameworks. Significant progress has been madein the development of thematic climate reference frameworks, which make it possible to envisage convergence. Theother thematic reference frameworks relating to environmental issues (other than climate, social and governanceissues) are less developed and still remain too general.
3The task force is composed of data users (like JP Morgan, Aviva investors or Industrial and commercial bank ofChina), data preparers (Tata steel, Daimler, BNP Paribas...) and other experts (Deloitte, KPMG, PWC...).
3
; and iii) the fact that it is the only grid that makes it possible to identify the effects (negative
and positive) of climate change on the company. The ongoing widespread adoption of this new
framework would ensure that the effects of climate change become routinely considered in business
and investment decisions. It would also help companies to be more responsible and far-sighted in
their approach to climate issues, which would lead to smarter, more efficient allocation of capital,
and help smooth the transition to a more sustainable, low-carbon economy.
While there is an extensive literature aiming at assessing the level of voluntary environmental
disclosures, in accordance with the applicable guidelines, there is a wide variety of environmental
reporting indices which makes it difficult to compare results. This may be namely explained by
numerous methodological shortcomings in the calculation of these indices. In addition, the rec-
ommendations of the TCFD (which differ widely from other frameworks) are becoming the new
standard for environmental and climate disclosure, making indices created on the basis of older
frameworks out of date. It is therefore essential to develop a standard and reliable measure of the
level of disclosure of environmental information in line with the prevailing framework.
This paper aims to fill a gap in the literature by constructing an original composite index which
assesses the level of companies voluntary environmental disclosures, with respect to the recom-
mendations of the TCFD. More precisely, using a rigorous methodology, we develop the Climate
Risks and Opportunities Reporting Index (CRORI), which aims to provide a widely accepted, stan-
dardized measure of the extent to which companies comply with the TCFD’s recommendations.
To do so, we rely on TCFD recommendations which provides a strong analytical framework to
identify relevant data and combine them into a single index. In order to test the robustness of our
methodology, we then compute the CRORI for CAC 40’s companies over the period 2015-2018. In
addition, this empirical analysis gives a first insight of the evolution of the level of compliance of
companies with the TCFD’s recommendations. Anticipating on our results we find that both data
selection and the aggregation system are adequate, indicating that the CRORI meets its objectives
and can be considered as a reliable indicator of companies voluntary environmental disclosure with
regard to the TCFD’s recommendations. In addition, the results of the empirical analysis reveal a
trend towards improved voluntary disclosure of environmental information, especially in the case
of large companies with high CO2 emissions.
4
This paper contributes to the existing body of studies on environmental disclosures in the
following aspects. First, the CRORI is a methodological contribution in terms of environmental
and climate reporting indices reliable and replicable. In order to allow its wide distribution within
the research and professional communities, the CRORI methodology and our database are available
as open data 4. Second, the CRORI is a real contribution to research on environmental reporting
because it is the first index to measure the effect of climate change on companies, unlike existing
indices which focus on the impact of companies on climate change. Third, this paper includes
the first empirical study on the application of the TCFD recommendations, which provides first
insights of the effect of the TCFD’s recommendations on companies’ climate reporting practices.
The remainder of this paper is organized as follows. In Section 2, we presents the extant
literature on environmental information disclosures, especially by reviewing the heterogeneity of
disclosures indices used on this issue. In Section 3, we describe the data and methodology used to
build the CRORI. In Section 4, we develop an empirical analysis. Concluding remarks are presented
in Section 5.
2 Literature
Over the past 40 years, there has been an increasing number of academic works using an environ-
mental disclosure score. There are two types of environmental indices that must be distinguished.
The first are quantitative environmental performance indices that aggregate technical measures
such as the quantity of GHG emissions or pollution 5. The second are environmental reporting
disclosure indices that measure the level of transparency of the firm in this area. In this second
stream of works, the research themes are of threefold. First many authors question whether the
level of disclosure of environmental information is related to financial performance (Clarkson et al.
(2008); Qiu et al. (2016)). The authors investigate whether voluntary disclosure of environmen-
tal and/or climate information affects financial indicators such as ROA, levrage, or cost of equity
(El Ghoul et al. (2011); Latridis (2010)). Then other studies aim rather to identify the explanatory
4www.crorindex.com.5See for example Tyteca (1996), Mazziotta (2013) or Zhou et al. (2017).
5
determinants of a more or less high level of environmental disclosure. In particular, they study the
relationship between the level of environmental or climate information disclosed and the type of
governance, sector of activity, or media exposure (Cormier et al. (2005); Reverte (2009); Minutolo
et al. (2019)). Finally another way of research study whether this information is valued by analysts
and investors (Cormier and Magnan (2015); Latridis (2013)). These studies relate an environmen-
tal score to the level of relevance of this information perceived by investors or analysts. The idea
is to measure how this information is taken into account for the investment decision.
All of these articles use a score similar to a composite index to measure environmental dis-
closure6 which correspond to the explained variable of the models. Their relevance is therefore
a prerequisite for a good understanding of the studied phenomenon. According to Al-Tuwaijri
et al. (2004) the methodology to define a disclosure-scoring measure is first to identify certain
environmental issues, then to analyze the environmental disclosure of each issue using a ”yes/no”
scoring methodology and after individual issues are quantified from a content analysis, researchers
determine the aggregate score for each firm. However, when we look at the articles devoted to
the study of voluntary environmental disclosure, we see a surprising diversity of published results.
For example, it is noticeable that there are many contradictory results about the determinants of
voluntary disclosure. Thus many researches found that financial performance (measured by debt
ratio, return on investment, stock market returns, Tobin’s Q, and firm size) of firms can be af-
fected by the level of environmental indices(Sen et al. (2011); Latridis (2010)) while at the same
time Guidry and Patten (2012) and Chung and Cho (2018) conclude that there is no systematic
relationship between financial variables and the differences in environmental disclosure between the
firms studied.
According to Clarkson et al. (2008) this finding can be explained by methodological pitfalls. As
underlined by the OECD (Nardo et al. (2008)), the construction of a composite index must follow
a specific and transparent methodology, which is not the case for the indices used in the litera-
ture. According to Fatemi et al. (2018), research on the extent and the quality of ESG reporting
has, for the most part, been based on ratings and checklists developed by individual researchers
who manually collected the data from annual reports or corporate websites (e.g.,Wiseman (1982)
6A composite indicator is formed when individual indicators are compiled into a single index on the basis if anunderlying model.
6
Cormier and Magnan (2003) Cho et al. (2006) Lock and Seele (2015) Pistoni et al. (2018)).Helfaya
and Whittington (2019) underline that the use of unweighted disclosure indices, using more than
one measure of quantity,to assess the quality of corporate disclosure is also problematic and has
been criticised on its fundamental assumption that all disclosed and measured items are equally
important. In the same way Venturelli et al. (2017) consider that measurement has been hampered
by a lack of clarity in theoretical frameworks and empirical methods for the Corporate Social Re-
sponsibility construct. This deficiency is probably due to the fact that it is difficult to express social
or environmental identity in a synthetic index, as to create such an index requires the selection
and standardization of the variables, the building of the indicators, and the choice of a method for
aggregation and weighting (Savaneu et al. (2014)).
3 Construction of the CRORI
According to Ebert and Welsch (2004), environmental indices provide a condensed description of
multi-dimensional environmental states by aggregating several variables (or indicators) into a single
quantity. The construction of such indices is not straightforward, as underlined by Nardo et al.
(2008) who list the key steps for constructing composite indicators which may be summarized
as follows : i) the criterion included in a composite indicator should be selected and aggregated
according to a strong analytical framework; ii) the data included in the indicator should ensure
comparability over time and space, be relevant to explain the studied phenomenon and combined
without statistical bias; and iii) a robustness/sensitivity analysis should be performed in order to
to test the suitability of the data set and the robustness of the methodology. The remainder of
this Section details the analytical framework we rely on, the data and aggregation method used to
compute the CRORI.
3.1 The analytical framework: the recommendations of the TCFD
The 2007-2008 financial crisis was an important reminder of the repercussions that weak corporate
governance and risk management practices can have on asset values. This resulted in increased
demand for transparency from firms on their governance structures, strategies and risk management
practices. Without the right information, investors may incorrectly price or value assets, leading
7
to a misallocation of capital. To create the necessary conditions for transparency regarding climate
risks and opportunities, Financial Stability Board has launched an international initiative: the
TCFD. The objective of this working group was to make recommendations related to physical
and transition risks associated with climate change. More precisely, its objective was to develop
voluntary, clear, comparable, consistent climate-related risk disclosures for use by companies in
providing information to investors, lenders, insurers and other stakeholders.
In June 2017, the TCFD published a final report (TCFD (2017)) that established recommen-
dations that take the form of a grid of themes for which companies may provide information on
their practices in terms of governance, strategy, risk management and environmental metrics and
objectives, taking into account specific sector features (materials and buildings, transport, energy,
food and finance). The aim is to improve the information provided by companies in their financial
fillings on Climate Risks and Opportunities (CROs) in these four areas taking into account specific
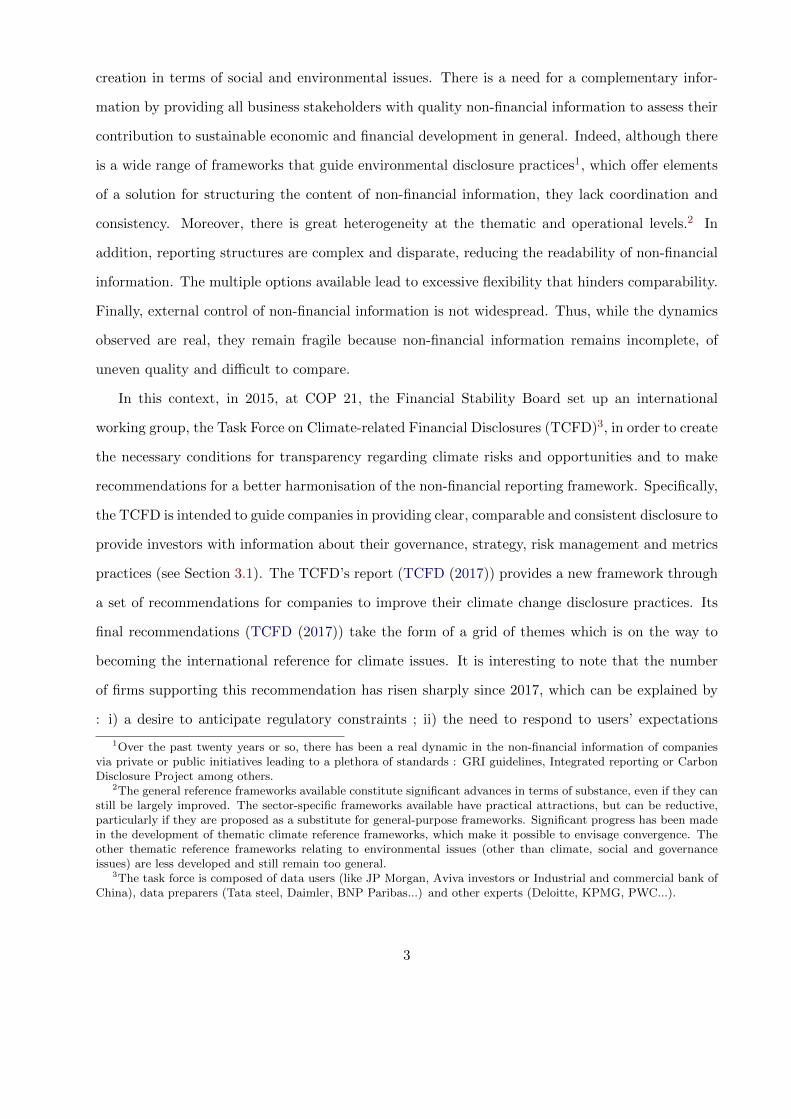
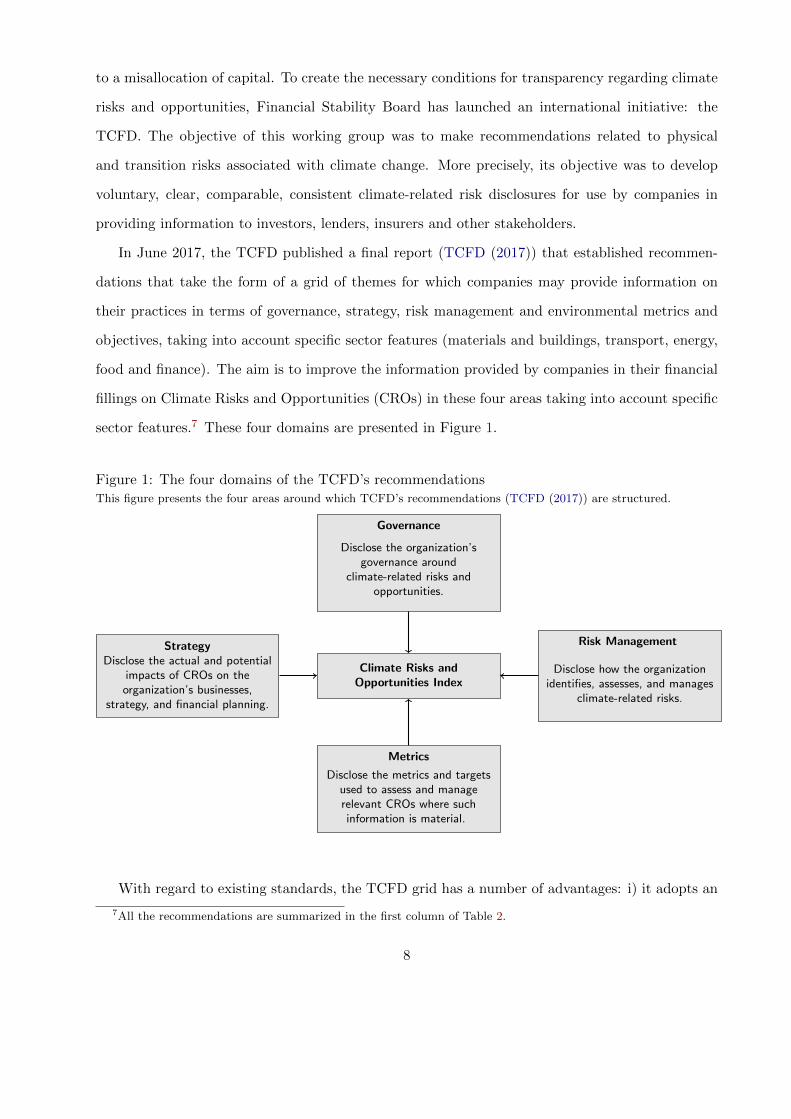
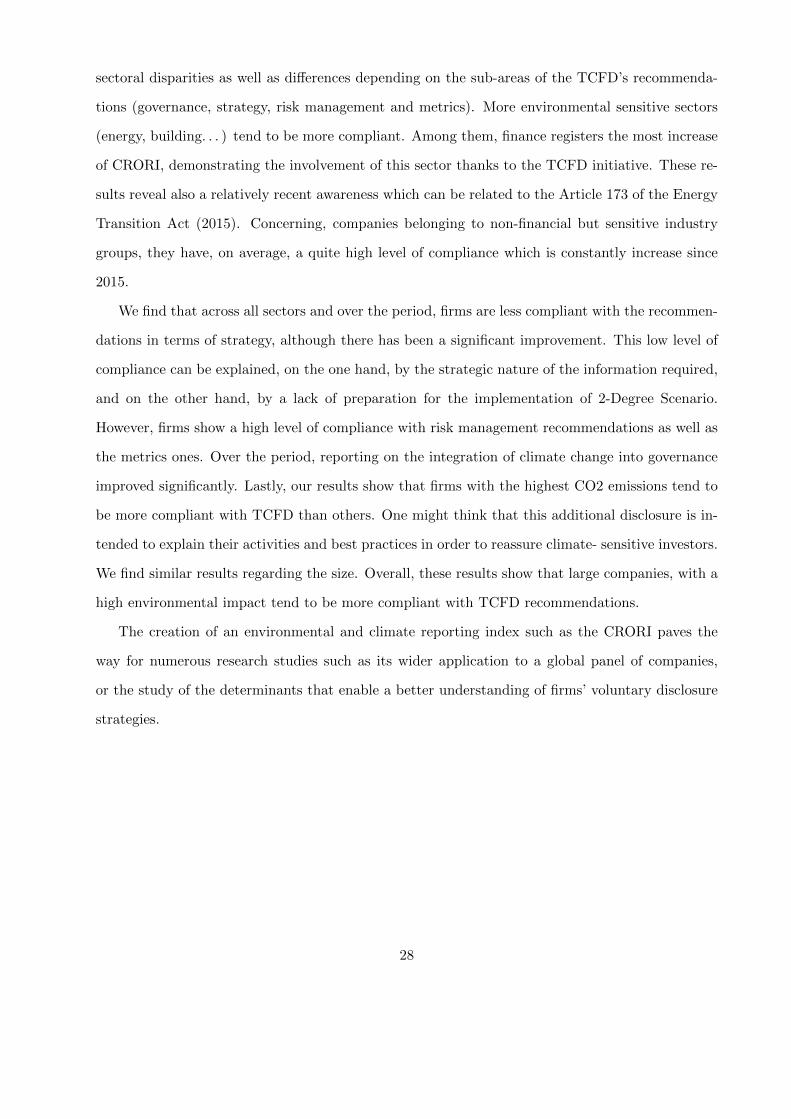
sector features.7 These four domains are presented in Figure 1.
Figure 1: The four domains of the TCFD’s recommendationsThis figure presents the four areas around which TCFD’s recommendations (TCFD (2017)) are structured.
Climate Risks andOpportunities Index
Governance
Disclose the organization’sgovernance around
climate-related risks andopportunities.
StrategyDisclose the actual and potential
impacts of CROs on theorganization’s businesses,
strategy, and financial planning.
Risk Management
Disclose how the organizationidentifies, assesses, and manages
climate-related risks.
Metrics
Disclose the metrics and targetsused to assess and managerelevant CROs where suchinformation is material.
With regard to existing standards, the TCFD grid has a number of advantages: i) it adopts an
7All the recommendations are summarized in the first column of Table 2.
8
original approach, compared with other international organizations8 by focusing, not on companies’
impact on climate change, but on the impacts of climate change on companies; ii) it makes it possible
to bring together in a single document many indicators presented in the various existing grids9; iii)
it focuses specifically on climate risks and opportunities (CROs) and not on Corporate and Social
Responsability; iv) it adopts a forward-looking approach asking firms to disclose not only on their
past performance but also on what they will implement to face the CRO and requires information
on the resilience of the companies’ business in relation to low carbon scenarios (including 2-Degree
Scenario); and v) it is an international initiative (and not a state initiative) better able to promote
the ”level playing field”. All these reasons explain the increasing interest worldwide since 2015 for
the TCFD grid, which seems to have become a global reference (albeit not binding) for financial
transparency related to climate risk. Table 1 presents the evolution of the number of TCFD
supporters by region since 2017, which stands at 984 in 2020 compared to 282 just three years
earlier. In addition, it has received support from the French Government, the European Union’s
HLEG (2018), and the European Union’s Technical Experts Group on Sustainable Finance (TEGSF
(2019)). This has led to the integration of TCFD’s recommendations into the Guidelines on non-
financial reporting: ’Supplement on reporting climate-related information’ ( EU (2019)). This
growing interest requires a better understanding of the firms’ reporting practices with regard to
climate risk.
8Such as the Global Reporting Initiative (GRI) and the International Integrated Reporting Council (IIRC).9Thus the technical appendix accompanying the recommendations makes it possible to identify the alignment of
Recommended Disclosures with Other Frameworks (TCFD (2016)).
9
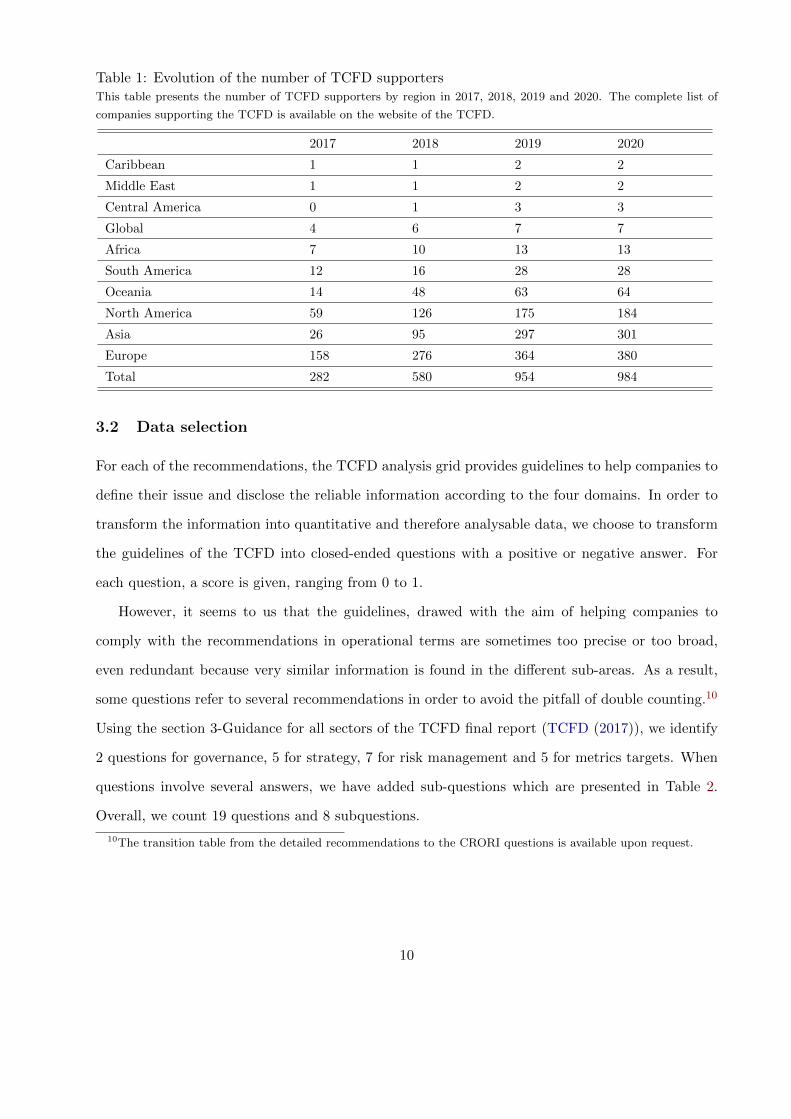
Table 1: Evolution of the number of TCFD supportersThis table presents the number of TCFD supporters by region in 2017, 2018, 2019 and 2020. The complete list of
companies supporting the TCFD is available on the website of the TCFD.
2017 2018 2019 2020
Caribbean 1 1 2 2
Middle East 1 1 2 2
Central America 0 1 3 3
Global 4 6 7 7
Africa 7 10 13 13
South America 12 16 28 28
Oceania 14 48 63 64
North America 59 126 175 184
Asia 26 95 297 301
Europe 158 276 364 380
Total 282 580 954 984
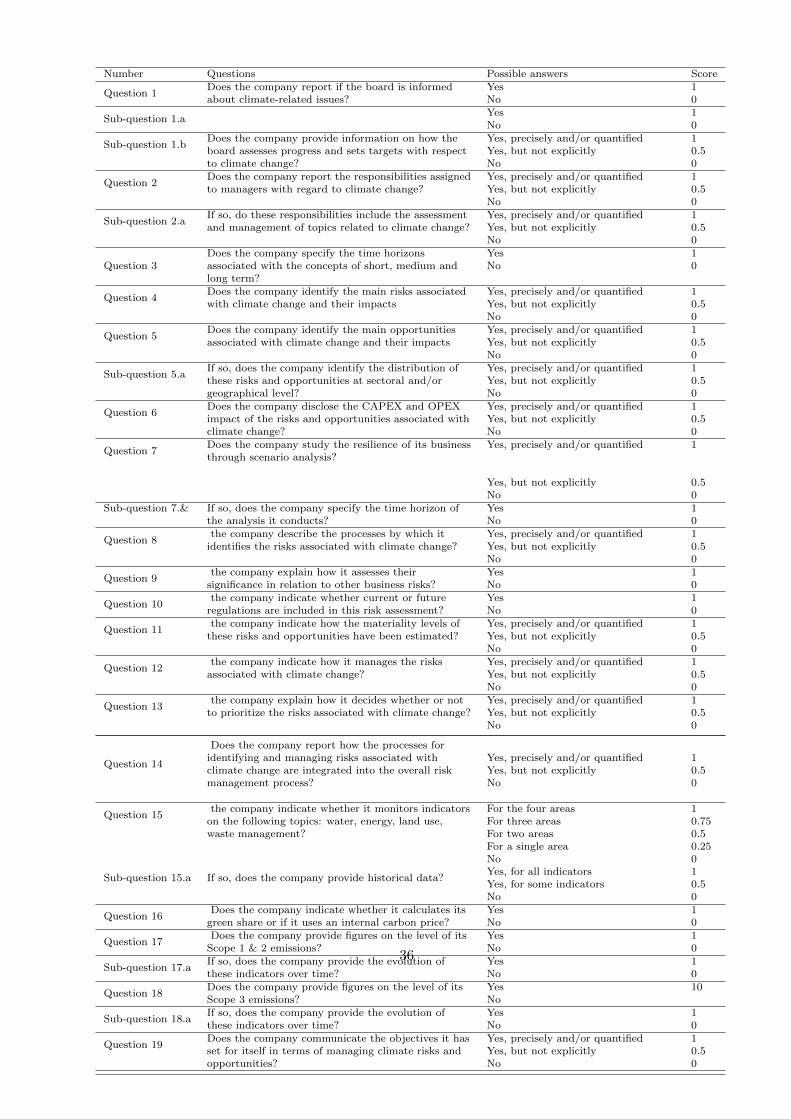
3.2 Data selection
For each of the recommendations, the TCFD analysis grid provides guidelines to help companies to
define their issue and disclose the reliable information according to the four domains. In order to
transform the information into quantitative and therefore analysable data, we choose to transform
the guidelines of the TCFD into closed-ended questions with a positive or negative answer. For
each question, a score is given, ranging from 0 to 1.
However, it seems to us that the guidelines, drawed with the aim of helping companies to
comply with the recommendations in operational terms are sometimes too precise or too broad,
even redundant because very similar information is found in the different sub-areas. As a result,
some questions refer to several recommendations in order to avoid the pitfall of double counting.10
Using the section 3-Guidance for all sectors of the TCFD final report (TCFD (2017)), we identify
2 questions for governance, 5 for strategy, 7 for risk management and 5 for metrics targets. When
questions involve several answers, we have added sub-questions which are presented in Table 2.
Overall, we count 19 questions and 8 subquestions.
10The transition table from the detailed recommendations to the CRORI questions is available upon request.
10
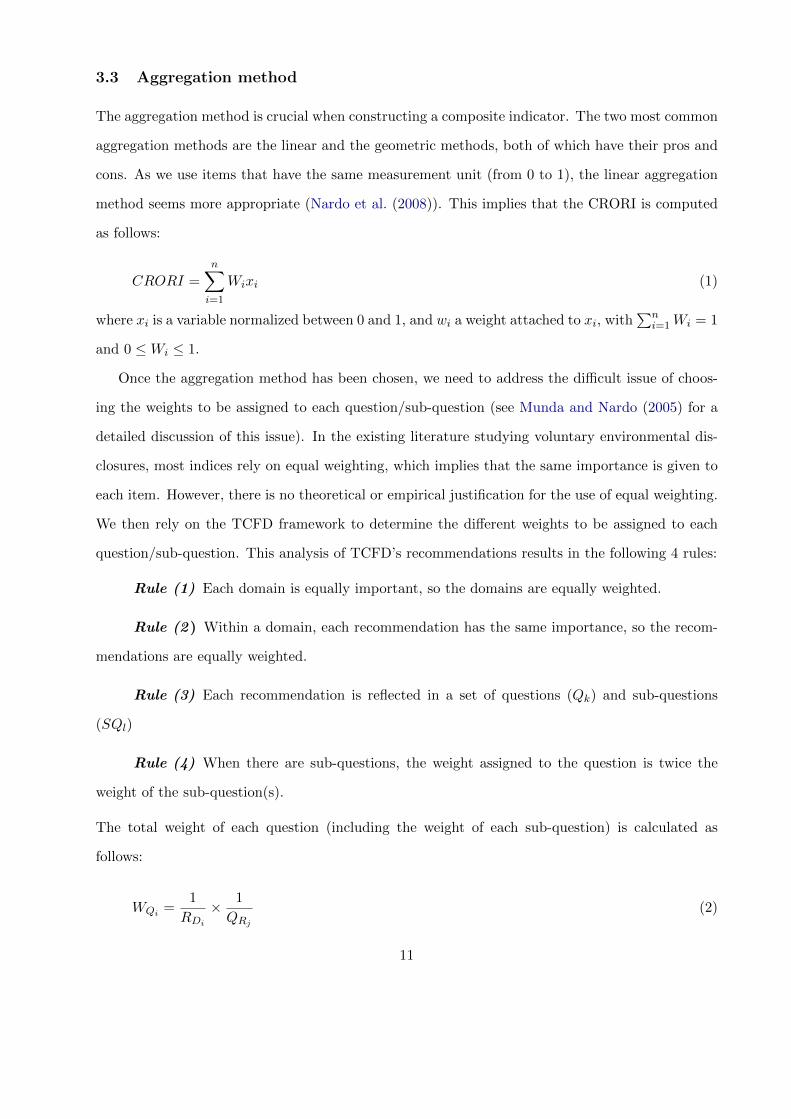
3.3 Aggregation method
The aggregation method is crucial when constructing a composite indicator. The two most common
aggregation methods are the linear and the geometric methods, both of which have their pros and
cons. As we use items that have the same measurement unit (from 0 to 1), the linear aggregation
method seems more appropriate (Nardo et al. (2008)). This implies that the CRORI is computed
as follows:
CRORI =
n∑i=1
Wixi (1)
where xi is a variable normalized between 0 and 1, and wi a weight attached to xi, with∑n
i=1Wi = 1
and 0 ≤Wi ≤ 1.
Once the aggregation method has been chosen, we need to address the difficult issue of choos-
ing the weights to be assigned to each question/sub-question (see Munda and Nardo (2005) for a
detailed discussion of this issue). In the existing literature studying voluntary environmental dis-
closures, most indices rely on equal weighting, which implies that the same importance is given to
each item. However, there is no theoretical or empirical justification for the use of equal weighting.
We then rely on the TCFD framework to determine the different weights to be assigned to each
question/sub-question. This analysis of TCFD’s recommendations results in the following 4 rules:
Rule (1) Each domain is equally important, so the domains are equally weighted.
Rule (2) Within a domain, each recommendation has the same importance, so the recom-
mendations are equally weighted.
Rule (3) Each recommendation is reflected in a set of questions (Qk) and sub-questions
(SQl)
Rule (4) When there are sub-questions, the weight assigned to the question is twice the
weight of the sub-question(s).
The total weight of each question (including the weight of each sub-question) is calculated as
follows:
WQi =1
RDi
× 1
QRj
(2)
11
with Di the ith domain, RDi the number of recommendation for each domain i (i = 1, 2, 3, 4)
and QRj the number of question for each recommendation.
When there are sub-questions, we derive the weight assigned to the question and its sub-questions
from Equation (2) and Rule (4).
The questions and sub-questions associated with each recommendation, as well as their respective
weights in the construction of the index, are detailed in Table 2.
12
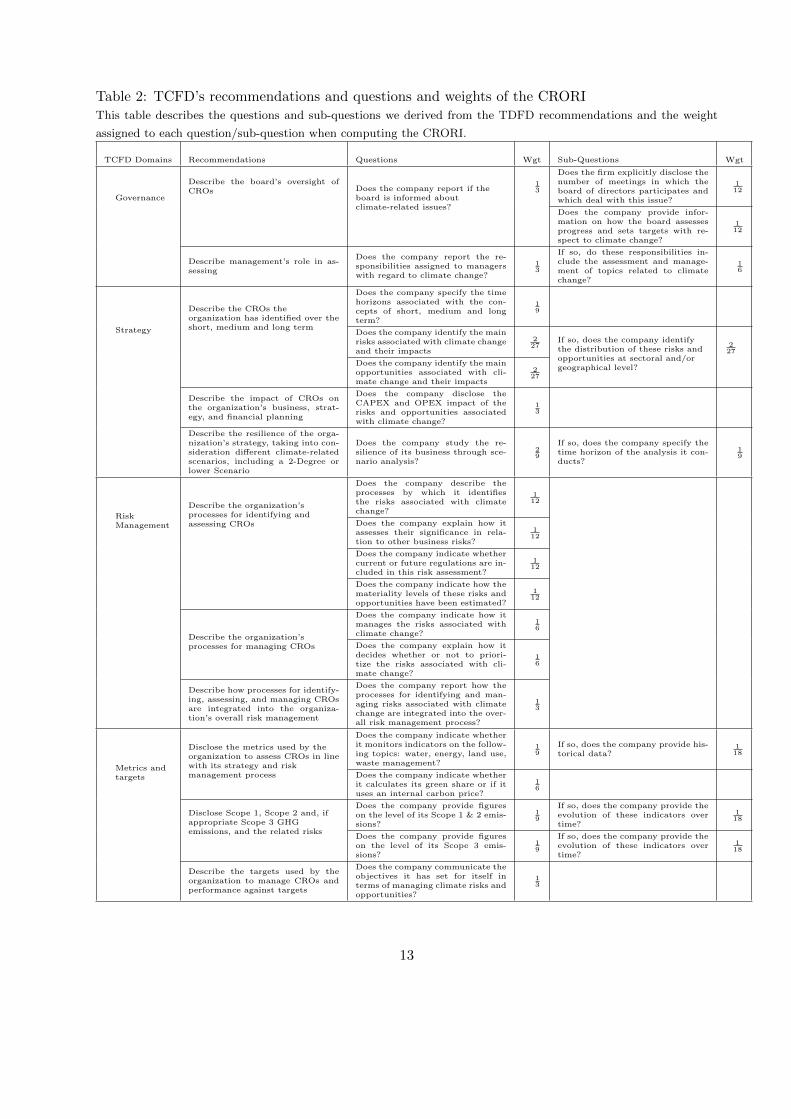
Table 2: TCFD’s recommendations and questions and weights of the CRORIThis table describes the questions and sub-questions we derived from the TDFD recommendations and the weight
assigned to each question/sub-question when computing the CRORI.
TCFD Domains Recommendations Questions Wgt Sub-Questions Wgt
Governance
Describe the board’s oversight ofCROs Does the company report if the
board is informed aboutclimate-related issues?
13
Does the firm explicitly disclose thenumber of meetings in which theboard of directors participates andwhich deal with this issue?
112
Does the company provide infor-mation on how the board assessesprogress and sets targets with re-spect to climate change?
112
Describe management’s role in as-sessing
Does the company report the re-sponsibilities assigned to managerswith regard to climate change?
13
If so, do these responsibilities in-clude the assessment and manage-ment of topics related to climatechange?
16
Strategy
Describe the CROs theorganization has identified over theshort, medium and long term
Does the company specify the timehorizons associated with the con-cepts of short, medium and longterm?
19
Does the company identify the mainrisks associated with climate changeand their impacts
227
If so, does the company identifythe distribution of these risks andopportunities at sectoral and/orgeographical level?
227
Does the company identify the mainopportunities associated with cli-mate change and their impacts
227
Describe the impact of CROs onthe organization’s business, strat-egy, and financial planning
Does the company disclose theCAPEX and OPEX impact of therisks and opportunities associatedwith climate change?
13
Describe the resilience of the orga-nization’s strategy, taking into con-sideration different climate-relatedscenarios, including a 2-Degree orlower Scenario
Does the company study the re-silience of its business through sce-nario analysis?
29
If so, does the company specify thetime horizon of the analysis it con-ducts?
19
RiskManagement
Describe the organization’sprocesses for identifying andassessing CROs
Does the company describe theprocesses by which it identifiesthe risks associated with climatechange?
112
Does the company explain how itassesses their significance in rela-tion to other business risks?
112
Does the company indicate whethercurrent or future regulations are in-cluded in this risk assessment?
112
Does the company indicate how themateriality levels of these risks andopportunities have been estimated?
112
Describe the organization’sprocesses for managing CROs
Does the company indicate how itmanages the risks associated withclimate change?
16
Does the company explain how itdecides whether or not to priori-tize the risks associated with cli-mate change?
16
Describe how processes for identify-ing, assessing, and managing CROsare integrated into the organiza-tion’s overall risk management
Does the company report how theprocesses for identifying and man-aging risks associated with climatechange are integrated into the over-all risk management process?
13
Metrics andtargets
Disclose the metrics used by theorganization to assess CROs in linewith its strategy and riskmanagement process
Does the company indicate whetherit monitors indicators on the follow-ing topics: water, energy, land use,waste management?
19
If so, does the company provide his-torical data?
118
Does the company indicate whetherit calculates its green share or if ituses an internal carbon price?
16
Disclose Scope 1, Scope 2 and, ifappropriate Scope 3 GHGemissions, and the related risks
Does the company provide figureson the level of its Scope 1 & 2 emis-sions?
19
If so, does the company provide theevolution of these indicators overtime?
118
Does the company provide figureson the level of its Scope 3 emis-sions?
19
If so, does the company provide theevolution of these indicators overtime?
118
Describe the targets used by theorganization to manage CROs andperformance against targets
Does the company communicate theobjectives it has set for itself interms of managing climate risks andopportunities?
13
13
4 Empirical study
4.1 The CRORI of CAC 40 companies
4.1.1 The sample
We compute the CRORI for the 39 largest market capitalization on Euronext Paris (the CAC 40
index)11 from 2015 to 2018. The choice of studying French companies is explained by the fact that :
i) France is regarded as a country with a considerable number of regulations regarding mandatory
environmental disclosures ; ii) the French government supports the implementation of TCFD’s
recommendations at EU and G20 level ; and iii) the existing French reporting regulation is not far
apart from TCFD.
We focus in particular on CAC 40 companies, as these are the ones most subject to strict en-
vironmental legislation12. In addition, for the period 2015-2016, the TCFD recommendations had
not yet been issued, so only the firms reporting significant disclosure can be studied. On the other
hand, for 2017-2018, the TCFD recommendations were not binding, so only large companies could
be expected to change their disclosure policies These companies may indeed go further than the
regulations by disclosing voluntary information because they may be subject to pressure from stake-
holders (NGOs, analysts, the general public, etc.) regarding the dissemination of environmental
information.
The aim of this empirical analysis is twofold. First, to test the methodological robustness of
the CRORI, and second, to compare voluntary environmental disclosure practices before and after
the publication of TCFD’s recommendations.
4.1.2 Data collection
In order to compute the CRORI of CAC 40 companies, we performed a content analysis13 of their
reference documents. We followed the recommendations of Krippendorff (2012) to ensure that the
analysis is stable, reliable and reproducible. Specifically, we applied the following coding process:
11Technip was removed from the sample due to a merger during the study period.12The New Economic Regulations Act (NER Act, 2001), subsequently, the Grenelle II Bill (2010) and the Energy
Transition and Green Growth Act (2015)13This research method is widely used in studies on environmental information disclosure (Beck et al. (2010),
Bouten et al. (2011), Hooks and van Staden (2011)).
14
i) the coding grid was developed with the support of two experts on TCFD issues ; ii) Several
encoders coded the same report simultaneously ; and iii) the results have been evaluated in order
to ensure their consistency. In line with Al-Tuwaijri et al. (2004) and Pistoni et al. (2018), we used
a coding scale (ranging from 0 to 1) in order to more accurately capture the level of detail of the
disclosed information. It should be noted that this coding process depends on whether or not the
firm discloses the information (i.e., presence of information) and the level of detail provided, not
on the relevance of the information provided.
The choice to rely only on the reference documents published each year by the companies14 lies
first on the fact that they are recognised as the main channel for a company to communicate with
its shareholders (Wiseman (1982)). Most of the time, these reports provide very detailed infor-
mation (on the firm’s financial situation, it’s CSR, etc.) and are subject to oversight by a market
regulator.Hence the choice to collect and analyse information in the reference documents audited
annually and containing more structured, comprehensive and therefore more reliable information
(Beck et al. (2010)). This positioning is consistent with most studies of voluntary or mandatory
environmental disclosure (Wiseman (1982), Damak-Ayadi (2010), Chelli et al. (2014), Chauvey
et al. (2015)).
4.2 Robustness and sensitivity analysis
4.2.1 Assessing the reliability of the questions composing the CRORI
As pointed out by the OECD (Nardo et al. (2008)), one of the most common pitfalls in composite
index construction is double counting, which occurs when two collinear indicators are included in
an index. It is then essential to include only indicators that exhibit a low degree of correlation
in our index. Table 3 presents the correlation matrix on the 19 questions15. We find that the
questions are weakly correlated since most coefficients are inferior to 0.5 and the highest one is
0.64816, which leads to the conclusion that the risk of double counting in the CRORI is negligible.
14Even if some companies publish a report specifically dedicated to CSR or sustainable development, such reportsare not mandatory and publication frequency is at the discretion of the firms. Moreover, as stated by Michelon et al.(2015), the information in the independent CSR reports is more unclear than in the CSR section of the annual report.
15We do not include sub-questions in this analysis because they are necessarily highly correlated to the questionthey complement.
16We also checked for multicollinearity by calculating the VIFs of the 19 questions. This is not an issue here asthere are all inferior to 2.5. Results are available upon request.
15
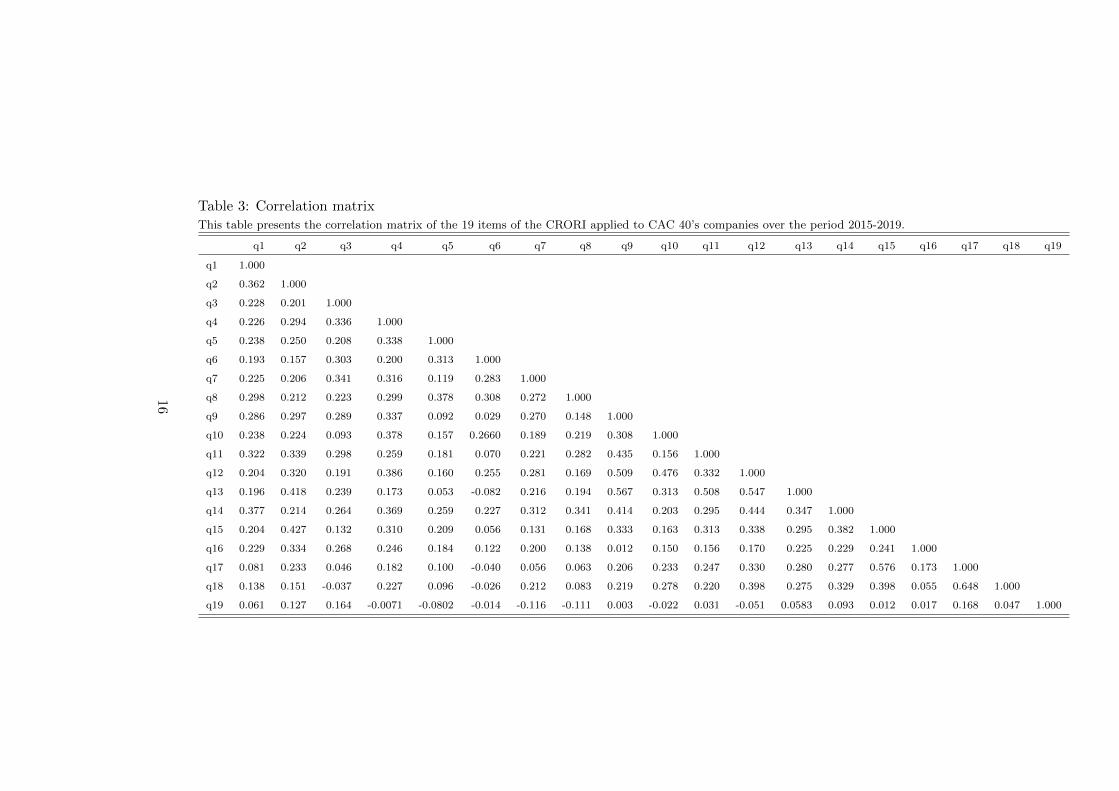
Table 3: Correlation matrixThis table presents the correlation matrix of the 19 items of the CRORI applied to CAC 40’s companies over the period 2015-2019.
q1 q2 q3 q4 q5 q6 q7 q8 q9 q10 q11 q12 q13 q14 q15 q16 q17 q18 q19
q1 1.000
q2 0.362 1.000
q3 0.228 0.201 1.000
q4 0.226 0.294 0.336 1.000
q5 0.238 0.250 0.208 0.338 1.000
q6 0.193 0.157 0.303 0.200 0.313 1.000
q7 0.225 0.206 0.341 0.316 0.119 0.283 1.000
q8 0.298 0.212 0.223 0.299 0.378 0.308 0.272 1.000
q9 0.286 0.297 0.289 0.337 0.092 0.029 0.270 0.148 1.000
q10 0.238 0.224 0.093 0.378 0.157 0.2660 0.189 0.219 0.308 1.000
q11 0.322 0.339 0.298 0.259 0.181 0.070 0.221 0.282 0.435 0.156 1.000
q12 0.204 0.320 0.191 0.386 0.160 0.255 0.281 0.169 0.509 0.476 0.332 1.000
q13 0.196 0.418 0.239 0.173 0.053 -0.082 0.216 0.194 0.567 0.313 0.508 0.547 1.000
q14 0.377 0.214 0.264 0.369 0.259 0.227 0.312 0.341 0.414 0.203 0.295 0.444 0.347 1.000
q15 0.204 0.427 0.132 0.310 0.209 0.056 0.131 0.168 0.333 0.163 0.313 0.338 0.295 0.382 1.000
q16 0.229 0.334 0.268 0.246 0.184 0.122 0.200 0.138 0.012 0.150 0.156 0.170 0.225 0.229 0.241 1.000
q17 0.081 0.233 0.046 0.182 0.100 -0.040 0.056 0.063 0.206 0.233 0.247 0.330 0.280 0.277 0.576 0.173 1.000
q18 0.138 0.151 -0.037 0.227 0.096 -0.026 0.212 0.083 0.219 0.278 0.220 0.398 0.275 0.329 0.398 0.055 0.648 1.000
q19 0.061 0.127 0.164 -0.0071 -0.0802 -0.014 -0.116 -0.111 0.003 -0.022 0.031 -0.051 0.0583 0.093 0.012 0.017 0.168 0.047 1.000
16
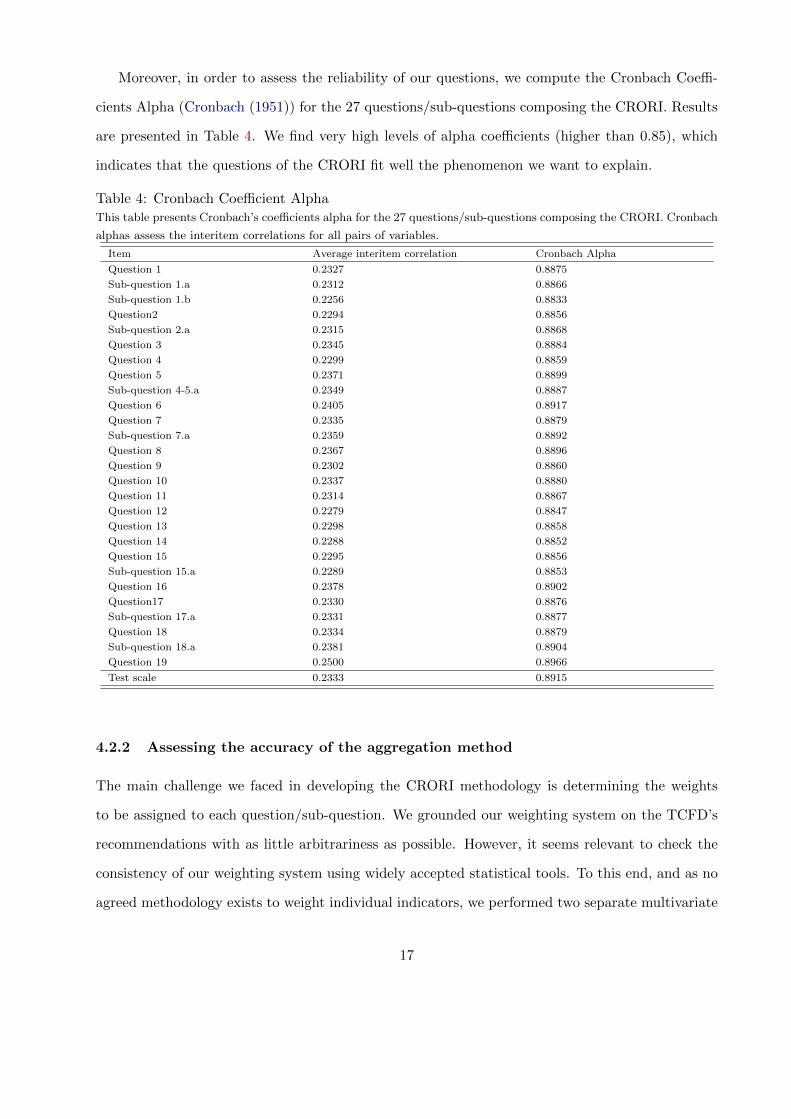
Moreover, in order to assess the reliability of our questions, we compute the Cronbach Coeffi-
cients Alpha (Cronbach (1951)) for the 27 questions/sub-questions composing the CRORI. Results
are presented in Table 4. We find very high levels of alpha coefficients (higher than 0.85), which
indicates that the questions of the CRORI fit well the phenomenon we want to explain.
Table 4: Cronbach Coefficient AlphaThis table presents Cronbach’s coefficients alpha for the 27 questions/sub-questions composing the CRORI. Cronbach
alphas assess the interitem correlations for all pairs of variables.
Item Average interitem correlation Cronbach Alpha
Question 1 0.2327 0.8875
Sub-question 1.a 0.2312 0.8866
Sub-question 1.b 0.2256 0.8833
Question2 0.2294 0.8856
Sub-question 2.a 0.2315 0.8868
Question 3 0.2345 0.8884
Question 4 0.2299 0.8859
Question 5 0.2371 0.8899
Sub-question 4-5.a 0.2349 0.8887
Question 6 0.2405 0.8917
Question 7 0.2335 0.8879
Sub-question 7.a 0.2359 0.8892
Question 8 0.2367 0.8896
Question 9 0.2302 0.8860
Question 10 0.2337 0.8880
Question 11 0.2314 0.8867
Question 12 0.2279 0.8847
Question 13 0.2298 0.8858
Question 14 0.2288 0.8852
Question 15 0.2295 0.8856
Sub-question 15.a 0.2289 0.8853
Question 16 0.2378 0.8902
Question17 0.2330 0.8876
Sub-question 17.a 0.2331 0.8877
Question 18 0.2334 0.8879
Sub-question 18.a 0.2381 0.8904
Question 19 0.2500 0.8966
Test scale 0.2333 0.8915
4.2.2 Assessing the accuracy of the aggregation method
The main challenge we faced in developing the CRORI methodology is determining the weights
to be assigned to each question/sub-question. We grounded our weighting system on the TCFD’s
recommendations with as little arbitrariness as possible. However, it seems relevant to check the
consistency of our weighting system using widely accepted statistical tools. To this end, and as no
agreed methodology exists to weight individual indicators, we performed two separate multivariate
17
analysis which have been widely used to construct composite indices or assess their consistency.
First, we perform a multiple linear regression17, which, as pointed out by Nardo et al. (2008),
despite its shortcomings, may be useful to verify and adjust weights. Formally, we estimate :
CRORIi,t = α+ β1q1 + β2q2 + ...+ β27q27 + ε (3)
where β1 to β127 are the regression coefficients (weights) of the questions qj (j = 1, ..., 27)), α is
the estimated constant and ε is a random error component.
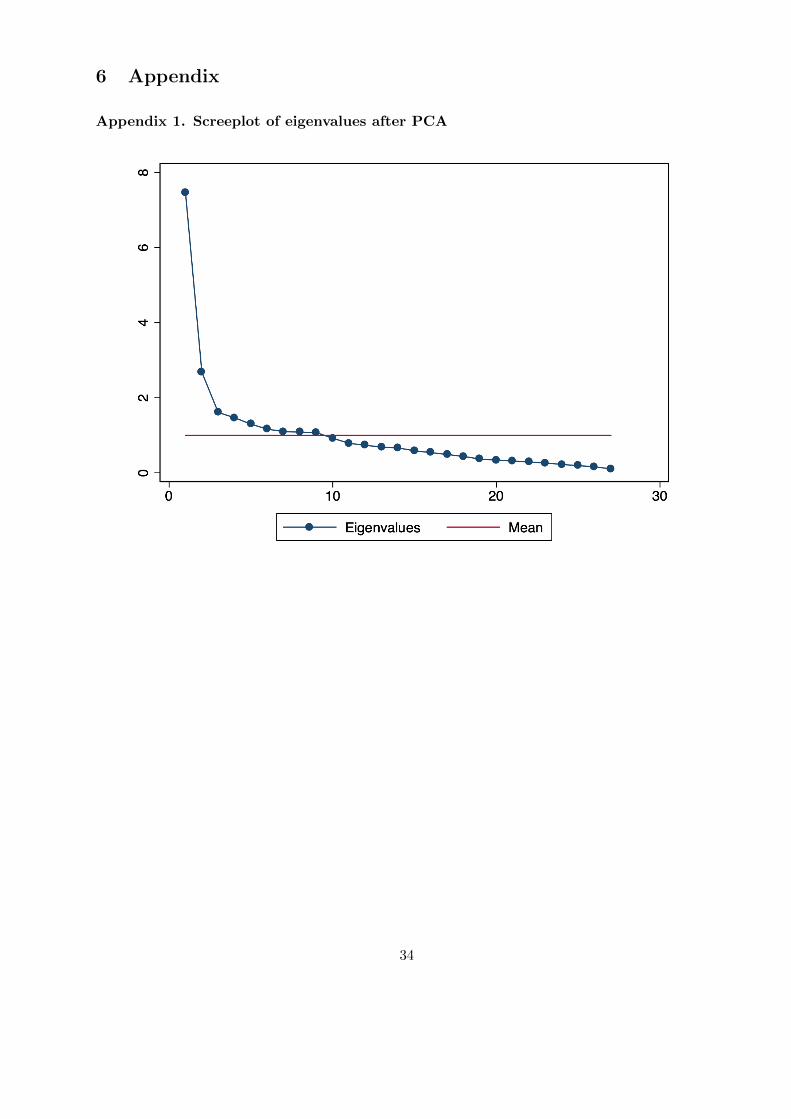
Second, we perform a principal component analysis (PCA) which is widely used to determine
appropriate weights in the construction of composite indicators. We use the screeplot (see Appendix
1) in order to determine the number of components to be included in the analysis. We retain 9
components which explain 70.09% of the total variance18.
Table 5 presents the summary statistics of the differences between, on the one hand, the weights
used in the calculation of the CRORI and, on the other hand, the weights obtained by linear regres-
sion and principal component analysis. We find that, on average, there are very small differences
between the different methods (less than 0.2 percentage points), which indicates that our weighting
system is satisfying.
Table 5: Descriptive statistics of the differences between the analytical weights and the weightsobtained from PCA and linear regressionThis table gives the descriptive statistics of the differences between the weights used to compute the CRORI and the
weights obtained from PCA and linear regression. We compute |WgtCRORI −WgtPCA| (respectively |WgtCRORI −WgtREG|) for each question by making the absolute difference of the weights used to compute the CRORI and the
weights obtained from PCA (resp. linear regression).
Variable Obs Mean Std. Dev. Min Max
|WgtCRORI −WgtPCA| 27 0.0175 0.0162 0.0002 0.0669
|WgtCRORI −WgtREG| 27 0.0126 0.0113 0.0015 0.0485
We then compute the CRORI with these three different weighting systems in order to assess
how strongly it affects results. We perform two t-tests of mean differences and variance differences,
presented in Table 6. In both cases, we cannot reject the nul hypothesis of equality of means or
variance, which indicates that the stastistical properties or the CRORI remain the same with the
these two stastistical-based weighting systems.
17This method is, for example, used by Eurostat to determine the weights of the The Economic Sentiment Indicator.18Results of the PCA are available upon request
18
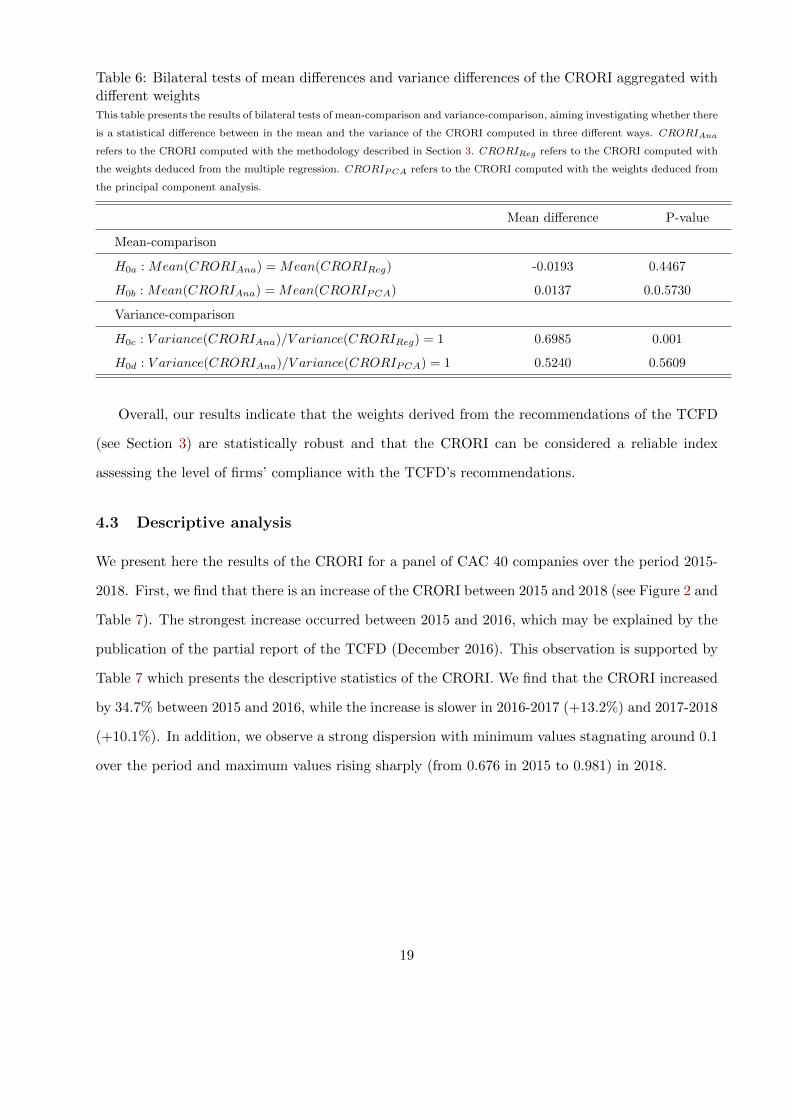
Table 6: Bilateral tests of mean differences and variance differences of the CRORI aggregated withdifferent weightsThis table presents the results of bilateral tests of mean-comparison and variance-comparison, aiming investigating whether there
is a statistical difference between in the mean and the variance of the CRORI computed in three different ways. CRORIAna
refers to the CRORI computed with the methodology described in Section 3. CRORIReg refers to the CRORI computed with
the weights deduced from the multiple regression. CRORIPCA refers to the CRORI computed with the weights deduced from
the principal component analysis.
Mean difference P-value
Mean-comparison
H0a : Mean(CRORIAna) = Mean(CRORIReg) -0.0193 0.4467
H0b : Mean(CRORIAna) = Mean(CRORIPCA) 0.0137 0.0.5730
Variance-comparison
H0c : V ariance(CRORIAna)/V ariance(CRORIReg) = 1 0.6985 0.001
H0d : V ariance(CRORIAna)/V ariance(CRORIPCA) = 1 0.5240 0.5609
Overall, our results indicate that the weights derived from the recommendations of the TCFD
(see Section 3) are statistically robust and that the CRORI can be considered a reliable index
assessing the level of firms’ compliance with the TCFD’s recommendations.
4.3 Descriptive analysis
We present here the results of the CRORI for a panel of CAC 40 companies over the period 2015-
2018. First, we find that there is an increase of the CRORI between 2015 and 2018 (see Figure 2 and
Table 7). The strongest increase occurred between 2015 and 2016, which may be explained by the
publication of the partial report of the TCFD (December 2016). This observation is supported by
Table 7 which presents the descriptive statistics of the CRORI. We find that the CRORI increased
by 34.7% between 2015 and 2016, while the increase is slower in 2016-2017 (+13.2%) and 2017-2018
(+10.1%). In addition, we observe a strong dispersion with minimum values stagnating around 0.1
over the period and maximum values rising sharply (from 0.676 in 2015 to 0.981) in 2018.
19
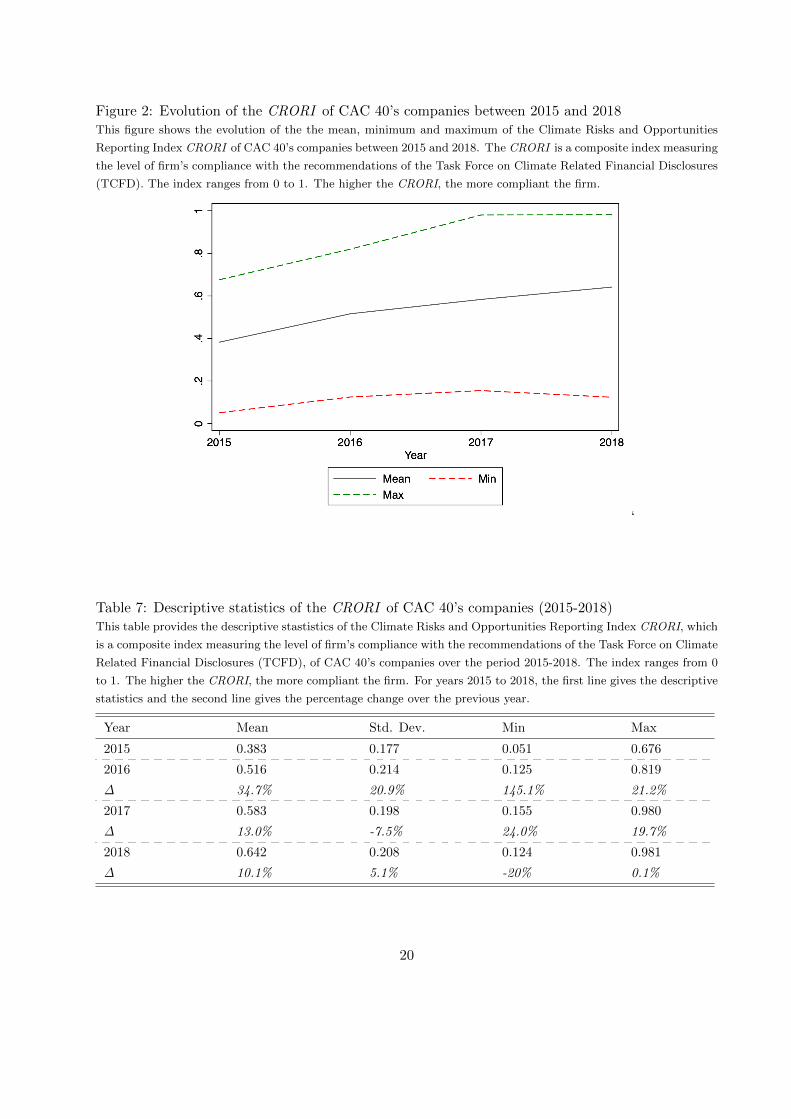
Figure 2: Evolution of the CRORI of CAC 40’s companies between 2015 and 2018This figure shows the evolution of the the mean, minimum and maximum of the Climate Risks and Opportunities
Reporting Index CRORI of CAC 40’s companies between 2015 and 2018. The CRORI is a composite index measuring
the level of firm’s compliance with the recommendations of the Task Force on Climate Related Financial Disclosures
(TCFD). The index ranges from 0 to 1. The higher the CRORI, the more compliant the firm.
‘
Table 7: Descriptive statistics of the CRORI of CAC 40’s companies (2015-2018)This table provides the descriptive stastistics of the Climate Risks and Opportunities Reporting Index CRORI, which
is a composite index measuring the level of firm’s compliance with the recommendations of the Task Force on Climate
Related Financial Disclosures (TCFD), of CAC 40’s companies over the period 2015-2018. The index ranges from 0
to 1. The higher the CRORI, the more compliant the firm. For years 2015 to 2018, the first line gives the descriptive
statistics and the second line gives the percentage change over the previous year.
Year Mean Std. Dev. Min Max
2015 0.383 0.177 0.051 0.676
2016 0.516 0.214 0.125 0.819
∆ 34.7% 20.9% 145.1% 21.2%
2017 0.583 0.198 0.155 0.980
∆ 13.0% -7.5% 24.0% 19.7%
2018 0.642 0.208 0.124 0.981
∆ 10.1% 5.1% -20% 0.1%
20
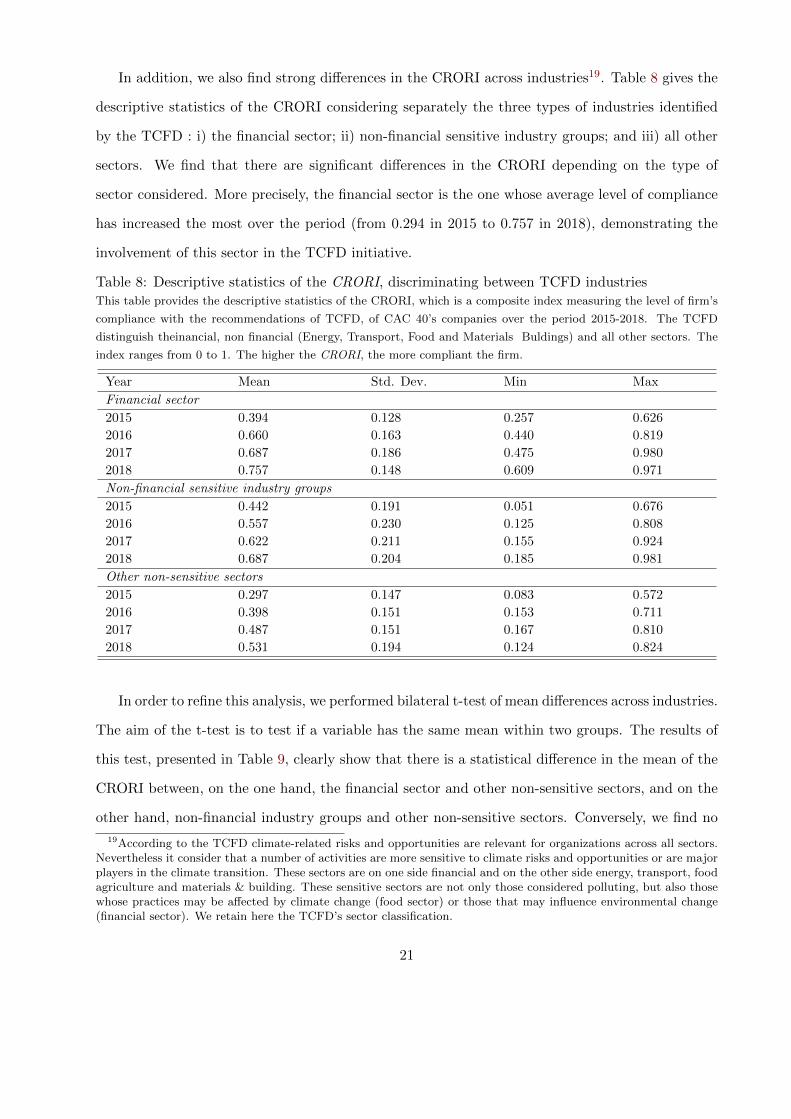
In addition, we also find strong differences in the CRORI across industries19. Table 8 gives the
descriptive statistics of the CRORI considering separately the three types of industries identified
by the TCFD : i) the financial sector; ii) non-financial sensitive industry groups; and iii) all other
sectors. We find that there are significant differences in the CRORI depending on the type of
sector considered. More precisely, the financial sector is the one whose average level of compliance
has increased the most over the period (from 0.294 in 2015 to 0.757 in 2018), demonstrating the
involvement of this sector in the TCFD initiative.
Table 8: Descriptive statistics of the CRORI, discriminating between TCFD industriesThis table provides the descriptive statistics of the CRORI, which is a composite index measuring the level of firm’s
compliance with the recommendations of TCFD, of CAC 40’s companies over the period 2015-2018. The TCFD
distinguish theinancial, non financial (Energy, Transport, Food and Materials Buldings) and all other sectors. The
index ranges from 0 to 1. The higher the CRORI, the more compliant the firm.
Year Mean Std. Dev. Min Max
Financial sector
2015 0.394 0.128 0.257 0.626
2016 0.660 0.163 0.440 0.819
2017 0.687 0.186 0.475 0.980
2018 0.757 0.148 0.609 0.971
Non-financial sensitive industry groups
2015 0.442 0.191 0.051 0.676
2016 0.557 0.230 0.125 0.808
2017 0.622 0.211 0.155 0.924
2018 0.687 0.204 0.185 0.981
Other non-sensitive sectors
2015 0.297 0.147 0.083 0.572
2016 0.398 0.151 0.153 0.711
2017 0.487 0.151 0.167 0.810
2018 0.531 0.194 0.124 0.824
In order to refine this analysis, we performed bilateral t-test of mean differences across industries.
The aim of the t-test is to test if a variable has the same mean within two groups. The results of
this test, presented in Table 9, clearly show that there is a statistical difference in the mean of the
CRORI between, on the one hand, the financial sector and other non-sensitive sectors, and on the
other hand, non-financial industry groups and other non-sensitive sectors. Conversely, we find no
19According to the TCFD climate-related risks and opportunities are relevant for organizations across all sectors.Nevertheless it consider that a number of activities are more sensitive to climate risks and opportunities or are majorplayers in the climate transition. These sectors are on one side financial and on the other side energy, transport, foodagriculture and materials & building. These sensitive sectors are not only those considered polluting, but also thosewhose practices may be affected by climate change (food sector) or those that may influence environmental change(financial sector). We retain here the TCFD’s sector classification.
21
statistically significant difference between the two sensitive type of sectors (i.e. the financial sector
and non-financial sensitive industry groups). These results reveal a relatively recent awareness in
financial industry which can be related to the Article 173 of the Energy Transition Act (2015). This
article compels banks and investors to report on how they are addressing climate change. Similar
to the Paris Agreement signed at COP 21, the TCFD considers that the financial sphere has a huge
responsibility as a motivator, and significant capacity to move the economy towards a low-carbon
trajectory. Companies belonging to non-financial but sensitive industry groups have, on average, a
quite high level of compliance (0.687 in 2018) which is constantly increasing since 2015. This may
be explained by the fact that these companies belong to sectors of activity that are particularly
sensitive to physical risks (natural disasters) and/or transition risks (regulatory changes) related to
climate change. Finally, we note a lower level of compliance for firms in other non-sensitive sectors.
Table 9: Bilateral tests of mean differences of CRORI across industry groupsThis table presents the p-value of two-group mean-comparison tests performed across the three industry groups defined by
the TCFD recommendations. The financial sector includes banks, insurance companies, asset owners and asset managers.
Non-financial sensitive industry groups includes energy, transportation, materials and buildings and agriculture, food and forest
products. Other non-sensitive industries includes all other industries.
Null hypothesis Mean difference P-value
H01 = Mean(Financial) = Mean(Non− Financial) 0.0478 0.3560
H02 = Mean(Financial) = Mean(Other) 0.1964 0.001 ***
H03 = Mean(Non− Financial) = Mean(Other) 0.1486 0.001 ***
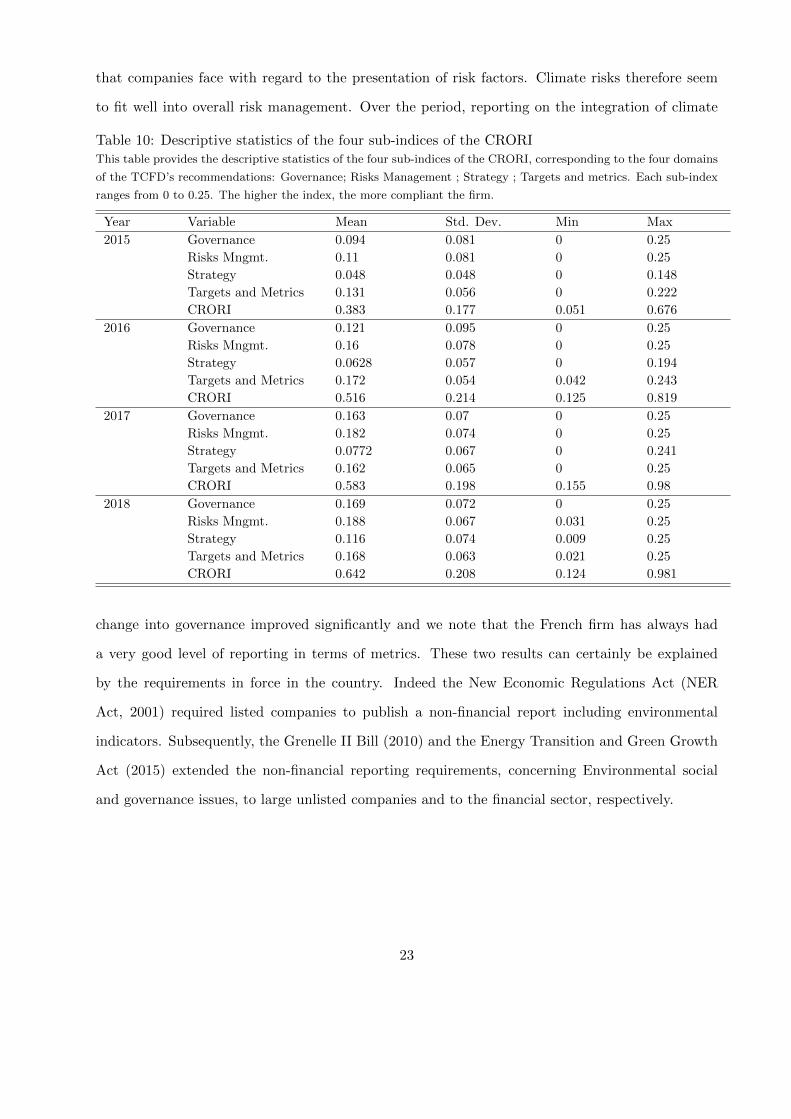
As the CRORI is composed of four sub-indices (corresponding to the four domains of the
TCFD’s recommendations), we compute the descriptive statistics of each sub-index, presented in
Table 10. In addition, Figure 3 show the relative importance of each sub-index of the CRORI
over the period 2015-2018. We find that the level of compliance is not identical according to the
types of recommendations. Indeed, across all sectors and over the period, firms are less compliant
with the recommendations in terms of strategy, although there has been a significant improvement.
This low level of compliance can be explained on the one hand by the strategic nature of the
information required and on the other hand by a lack of preparation for the implementation of
2-Degree Scenario. The firms of the sample show a high level of compliance with risk management
recommendations. This can be explained by the French regulatory requirements (AMF 2014-14)
22
that companies face with regard to the presentation of risk factors. Climate risks therefore seem
to fit well into overall risk management. Over the period, reporting on the integration of climate
Table 10: Descriptive statistics of the four sub-indices of the CRORIThis table provides the descriptive statistics of the four sub-indices of the CRORI, corresponding to the four domains
of the TCFD’s recommendations: Governance; Risks Management ; Strategy ; Targets and metrics. Each sub-index
ranges from 0 to 0.25. The higher the index, the more compliant the firm.
Year Variable Mean Std. Dev. Min Max
2015 Governance 0.094 0.081 0 0.25
Risks Mngmt. 0.11 0.081 0 0.25
Strategy 0.048 0.048 0 0.148
Targets and Metrics 0.131 0.056 0 0.222
CRORI 0.383 0.177 0.051 0.676
2016 Governance 0.121 0.095 0 0.25
Risks Mngmt. 0.16 0.078 0 0.25
Strategy 0.0628 0.057 0 0.194
Targets and Metrics 0.172 0.054 0.042 0.243
CRORI 0.516 0.214 0.125 0.819
2017 Governance 0.163 0.07 0 0.25
Risks Mngmt. 0.182 0.074 0 0.25
Strategy 0.0772 0.067 0 0.241
Targets and Metrics 0.162 0.065 0 0.25
CRORI 0.583 0.198 0.155 0.98
2018 Governance 0.169 0.072 0 0.25
Risks Mngmt. 0.188 0.067 0.031 0.25
Strategy 0.116 0.074 0.009 0.25
Targets and Metrics 0.168 0.063 0.021 0.25
CRORI 0.642 0.208 0.124 0.981
change into governance improved significantly and we note that the French firm has always had
a very good level of reporting in terms of metrics. These two results can certainly be explained
by the requirements in force in the country. Indeed the New Economic Regulations Act (NER
Act, 2001) required listed companies to publish a non-financial report including environmental
indicators. Subsequently, the Grenelle II Bill (2010) and the Energy Transition and Green Growth
Act (2015) extended the non-financial reporting requirements, concerning Environmental social
and governance issues, to large unlisted companies and to the financial sector, respectively.
23
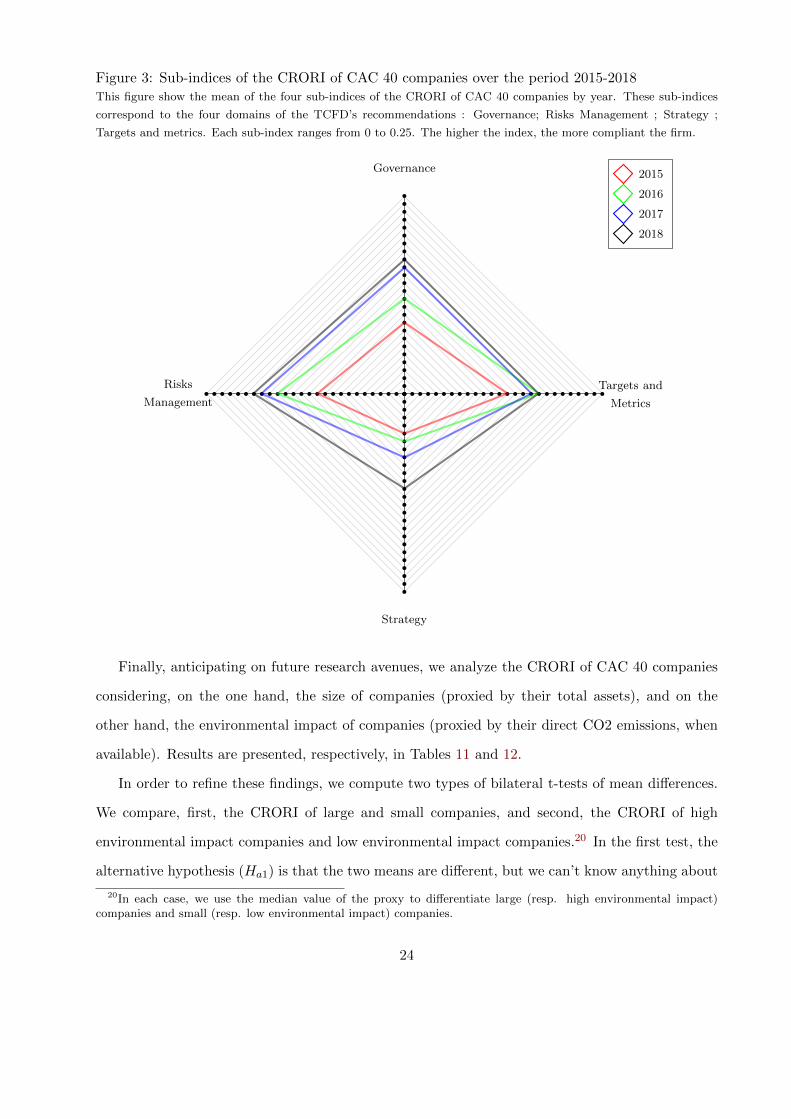
Figure 3: Sub-indices of the CRORI of CAC 40 companies over the period 2015-2018This figure show the mean of the four sub-indices of the CRORI of CAC 40 companies by year. These sub-indices
correspond to the four domains of the TCFD’s recommendations : Governance; Risks Management ; Strategy ;
Targets and metrics. Each sub-index ranges from 0 to 0.25. The higher the index, the more compliant the firm.
Governance
Risks
Management
Strategy
Targets and
Metrics
2015
2016
2017
2018
Finally, anticipating on future research avenues, we analyze the CRORI of CAC 40 companies
considering, on the one hand, the size of companies (proxied by their total assets), and on the
other hand, the environmental impact of companies (proxied by their direct CO2 emissions, when
available). Results are presented, respectively, in Tables 11 and 12.
In order to refine these findings, we compute two types of bilateral t-tests of mean differences.
We compare, first, the CRORI of large and small companies, and second, the CRORI of high
environmental impact companies and low environmental impact companies.20 In the first test, the
alternative hypothesis (Ha1) is that the two means are different, but we can’t know anything about
20In each case, we use the median value of the proxy to differentiate large (resp. high environmental impact)companies and small (resp. low environmental impact) companies.
24
the direction of that difference. In the second test, the alternative hypothesis (Ha2) is that the first
mean is inferior to the second mean, which complement the results of the first test. Results are
presented in Table 13.
Table 11: Descriptive statistics of the CRORI depending on the companie’s total assetsThis table presents the descriptive statistics (mean, standard deviation, minimum and maximum) of the CRORI of
CAC 40 companies over the period 2015-2018 according to their total assets.
Quartile mean sd min max
1 0.500792 0.229002 0.083333 0.923611
2 0.513584 0.231856 0.125 0.916667
3 0.563353 0.190795 0.155093 0.981481
4 0.574866 0.215158 0.111111 0.980324
Table 12: Descriptive statistics of the CRORI depending on the environmental impact of companiesThis table presents the descriptive statistics (mean, standard deviation, minimum and maximum) of the CRORI of
CAC 40 companies over the period 2015-2018 according to their level of direct CO2 emissions.
Quartile Mean St. Dev. Min Max
1 0.471958 0.212563 0.083333 0.895833
2 0.525926 0.208356 0.125 0.981481
3 0.566303 0.177742 0.111111 0.856481
4 0.629266 0.229711 0.155093 0.980324
Regarding firms’ size, we find that, on average, the CRORI of large companies (third and
fourth quartiles) is significantly higher than the CRORI of smaller companies (first and second
quartile). In addition, regarding the bilateral tests of mean-comparison considering small vs. large
companies, we can reject the null hypothesis of equality of means and conclude that, on average,
large companies tend to be more compliant with the TCFD’s recommendations.
Similarly, we find that companies with a high environmental impact (third and fourth quartiles)
display, on average, a higher CRORI than companies with a lower environmental impact (first and
second quartiles). The outcome of the bilateral tests of mean-differences confirm this result as
we find that the CRORI of high environmental impact companies is significantly higher than the
CRORI of low environmental impact companies. This result shows that firms with the highest
CO2 emissions tend to be more compliant with TCFD than others. One might think that this
additional disclosure is intended to explain their activities and best practices in order to reassure
climate-sensitive investors.
25
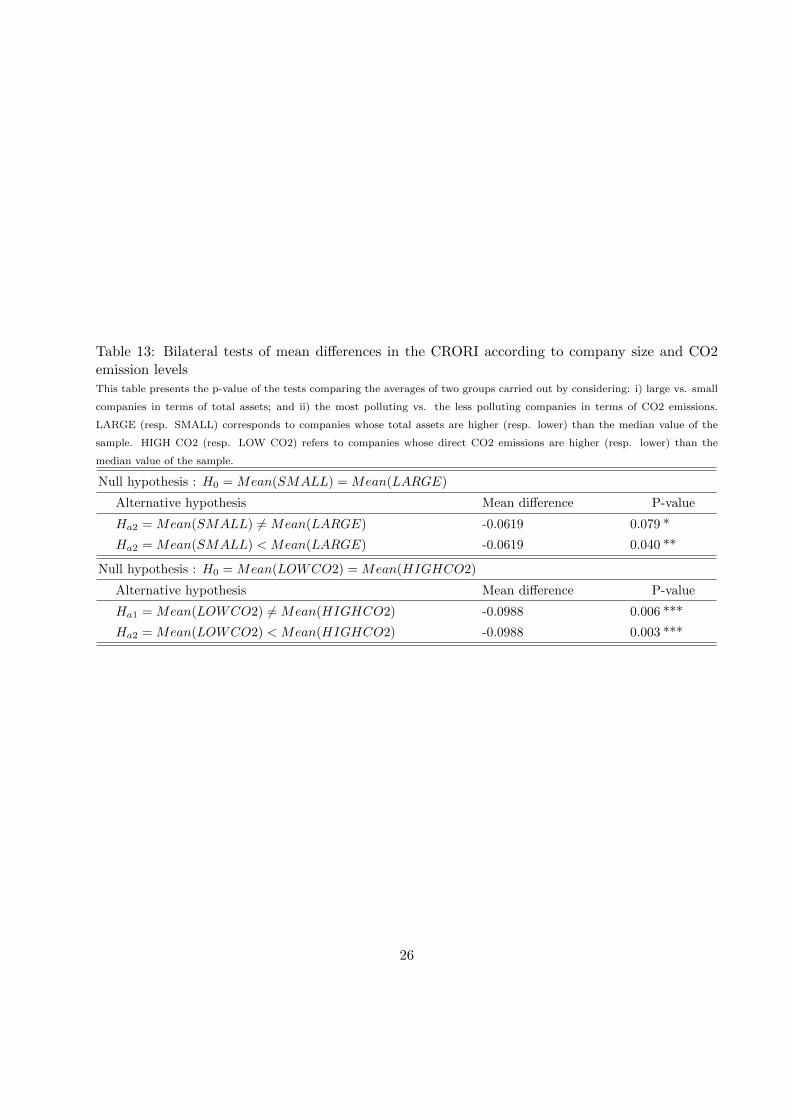
Table 13: Bilateral tests of mean differences in the CRORI according to company size and CO2emission levelsThis table presents the p-value of the tests comparing the averages of two groups carried out by considering: i) large vs. small
companies in terms of total assets; and ii) the most polluting vs. the less polluting companies in terms of CO2 emissions.
LARGE (resp. SMALL) corresponds to companies whose total assets are higher (resp. lower) than the median value of the
sample. HIGH CO2 (resp. LOW CO2) refers to companies whose direct CO2 emissions are higher (resp. lower) than the
median value of the sample.
Null hypothesis : H0 = Mean(SMALL) = Mean(LARGE)
Alternative hypothesis Mean difference P-value
Ha2 = Mean(SMALL) 6= Mean(LARGE) -0.0619 0.079 *
Ha2 = Mean(SMALL) < Mean(LARGE) -0.0619 0.040 **
Null hypothesis : H0 = Mean(LOWCO2) = Mean(HIGHCO2)
Alternative hypothesis Mean difference P-value
Ha1 = Mean(LOWCO2) 6= Mean(HIGHCO2) -0.0988 0.006 ***
Ha2 = Mean(LOWCO2) < Mean(HIGHCO2) -0.0988 0.003 ***
26
5 Conclusion
This paper investigates corporates disclosures, considered as one of the means to enhance financial
transparency regarding climate risks and opportunities. To reduce information failures which limit
understanding of the financial consequences of these risks, we compute an original composite index:
the Climate Risk and Opportunity Reporting Index (CRORI), which aims at assessing the level
of firms’ compliance with the new predominant framework, the TCFD’s recommendations. Then,
we test the robustness of the index by computing the CRORI of CAC 40 companies (which are
submitted to the stringent environmental information disclosures requirements over the period
2015-2018).
This new index aims to provide a widely accepted, standardized and replicable measure of the
extent to which companies comply with the TCFD’s recommendations. Contrary to some of earlier
studies on environmental reporting, the CRORI is the first indicator that measures the effect of
climate change on companies, unlike existing indices which focus on the impact of companies on
climate change. The methodology underlying the CRORI makes it a robust and reliable indicator
(several tests have been successfully carried out). Moreover, it is a replicable indicator thanks
to the open data availability of the CRORI database, thus allowing a wide diffusion within the
community of researchers but also professionals.
In light of these benefits, we argue, in this paper, that the construction of such an index is crucial
to better understand the effects of climate risks on firms and to allow investors to make informed
decisions about the impact of climate risks on their operations and future capital investments
and to accelerate portfolio alignment with a 2-Degree trajectory. In addition, this new index has
policy contributions, as it can enable assessment and regulatory authorities, as well as investors,
to assess the relevance of the information disclosed on the markets. This index could therefore
make it possible to discriminate between good and greenwashing practices. This tool can also be
useful for companies that wish to assess themselves and benchmark the level of disclosure of their
competitors.
Furthermore, our empirical analysis give first insights of companies’ disclosure practices in re-
lation to the TCFD’s recommendations. Our results highlight that major French companies are
more and more compliant with the TCFD over the period 2015-2018. However, this increase hides
27
sectoral disparities as well as differences depending on the sub-areas of the TCFD’s recommenda-
tions (governance, strategy, risk management and metrics). More environmental sensitive sectors
(energy, building. . . ) tend to be more compliant. Among them, finance registers the most increase
of CRORI, demonstrating the involvement of this sector thanks to the TCFD initiative. These re-
sults reveal also a relatively recent awareness which can be related to the Article 173 of the Energy
Transition Act (2015). Concerning, companies belonging to non-financial but sensitive industry
groups, they have, on average, a quite high level of compliance which is constantly increase since
2015.
We find that across all sectors and over the period, firms are less compliant with the recommen-
dations in terms of strategy, although there has been a significant improvement. This low level of
compliance can be explained, on the one hand, by the strategic nature of the information required,
and on the other hand, by a lack of preparation for the implementation of 2-Degree Scenario.
However, firms show a high level of compliance with risk management recommendations as well as
the metrics ones. Over the period, reporting on the integration of climate change into governance
improved significantly. Lastly, our results show that firms with the highest CO2 emissions tend to
be more compliant with TCFD than others. One might think that this additional disclosure is in-
tended to explain their activities and best practices in order to reassure climate- sensitive investors.
We find similar results regarding the size. Overall, these results show that large companies, with a
high environmental impact tend to be more compliant with TCFD recommendations.
The creation of an environmental and climate reporting index such as the CRORI paves the
way for numerous research studies such as its wider application to a global panel of companies,
or the study of the determinants that enable a better understanding of firms’ voluntary disclosure
strategies.
28
References
S. Al-Tuwaijri, T. Christensen, and K. Hughes. The relations among environmental disclosure, en-
vironmental performance, and economic performance: A simultaneous equations approach. Ac-
counting, Organizations and Society, 29:447–471, 02 2004. doi: 10.1016/S0361-3682(03)00032-1.
A. C. Beck, D. Campbell, and P. J. Shrives. Content analysis in environmental reporting research:
Enrichment and rehearsal of the method in a british–german context. The British Accounting
Review, 42:207–222, 2010. ISSN 0890-8389. doi: 10.1016/j.bar.2010.05.002.
L. Bouten, P. Everaert, L. Van Liedekerke, L. De Moor, and J. Christiaens. Corporate social
responsibility reporting: A comprehensive picture? Special issue: Social and Environmental
Accounting and Accountability, 35:187–204, 2011. ISSN 0155-9982. doi: 10.1016/j.accfor.2011.
06.007.
M. Burke and S. Hsiang. Global non-linear effect of temperature on economic production. Nature,
527(7577):235–239, 2015.
J.-N. Chauvey, S. Giordano-Spring, C. Cho, and D. Patten. The normativity and legitimacy of csr
disclosure: Evidence from france. Journal of Business Ethics, 130:789–803, 2015. ISSN 01674544.
M. Chelli, J. Richard, and S. Durocher. France’s new economic regulations: insights from institu-
tional legitimacy theory. Accounting, Auditing & Accountability Journal, 27:283–316, 2014. ISSN
13680668.
C. H. Cho, D. M. Patten, and R. W. Roberts. Corporate political strategy: An examination
of the relation between political expenditures, environmental performance, and environmental
disclosure. Journal of Business Ethics, 67(2):139–154, 2006.
J. Chung and C. H. Cho. Current trends within social and environmental accounting research:
A literature review. Accounting Perspectives, 17(2):207–239, 2018. ISSN 1911382X. doi:
10.1111/1911-3838.12171. URL http://search.ebscohost.com/login.aspx?direct=true&
db=bth&AN=131095672&lang=fr&site=ehost-live.
29
P. M. Clarkson, Y. Li, G. D. Richardson, and F. P. Vasvari. Revisiting the relation between
environmental performance and environmental disclosure: An empirical analysis. Accounting,
Organizations and Society, 33:303–327, 2008. ISSN 0361-3682. doi: 10.1016/j.aos.2007.05.003.
D. Cormier and M. Magnan. Environmental reporting management: a continental european
perspective. Journal of Accounting and Public Policy, 22:43–62, 2003. ISSN 0278-4254. doi:
10.1016/S0278-4254(02)00085-6.
D. Cormier and M. Magnan. The economic relevance of environmental disclosure and its impact on
corporate legitimacy: An empirical investigation. Business Strategy & the Environment (John
Wiley & Sons, Inc), 24(6):431–450, 2015.
D. Cormier, M. Magnan, and B. Van Velthoven. Environmental disclosure quality in large ger-
man companies: Economic incentives, public pressures or institutional conditions? European
Accounting Review, 14(1):3–39, 2005. ISSN 09638180. doi: 10.1080/0963818042000339617.
URL http://search.ebscohost.com/login.aspx?direct=true&db=bth&AN=17384890&lang=
fr&site=ehost-live.
L. J. Cronbach. Coefficient alpha and the internal structure of tests. Psychometrika, 16:297–334,
1951.
S. Damak-Ayadi. Le reporting social et environnemental suite a l’application de la loi nre en france.
Comptabilite - Controle - Audit, 16:53–81, 2010. ISSN 12622788.
U. Ebert and H. Welsch. Meaningful environmental indices: a social choice approach. Journal of
Environmental Economics and Management, 47(2):270–283, 2004.
S. El Ghoul, O. Guedhami, C. C. Y. Kwok, and D. R. Mishra. Does corporate social responsibility
affect the cost of capital? Journal of Banking & Finance, 35(9):2388–2406, 2011.
EU. Guidelines on non-financial reporting: Supplement on reporting climate-related information.
June 2019.
A. Fatemi, M. Glaum, and S. Kaiser. Esg performance and firm value: The moderating
role of disclosure. Global Finance Journal, 38:45–64, 2018. ISSN 1044-0283. doi: https:
30
//doi.org/10.1016/j.gfj.2017.03.001. URL http://www.sciencedirect.com/science/article/
pii/S1044028316300680.
R. P. Guidry and D. M. Patten. Voluntary disclosure theory and financial control variables: An
assessment of recent environmental disclosure research. Accounting Forum, 36:81–90, 2012. ISSN
0155-9982. doi: 10.1016/j.accfor.2012.03.002.
A. Helfaya and M. Whittington. Does designing environmental sustainability disclosure quality
measures make a difference? Business Strategy & the Environment, 2019.
HLEG. Final report of the high-level expert group on sustainable finance. Report, 2018.
J. Hooks and C. J. van Staden. Evaluating environmental disclosures: The relationship between
quality and extent measures. The British Accounting Review, 43:200–213, 2011. ISSN 0890-8389.
doi: 10.1016/j.bar.2011.06.005.
K. Krippendorff. Content Analysis: An introduction to its methodology. 3rd Revised edition, sage
publications inc edition, 2012.
G. Latridis. International financial reporting standards and the quality of financial statement
information. International review of financial analysis, 19:193–204, 2010.
G. Latridis. Environmental disclosure quality: Evidence on environmental performance, corporate
governance and value relevance. Emerging Markets Review, 14:55–75, 2013. doi: DOI10.1016/j.
ememar.2012.11.003.
I. Lock and P. Seele. Analyzing sector-specific csr reporting: Social and environmental dis-
closure to investors in the chemicals and banking and insurance industry. Corporate So-
cial Responsibility & Environmental Management, 22(2):113–128, 2015. ISSN 15353958. doi:
10.1002/csr.1338. URL http://search.ebscohost.com/login.aspx?direct=true&db=bth&
AN=101736220&lang=fr&site=ehost-live.
P. A. Mazziotta, Matteo. ethods for constructing composite indices: One for all or all for one?
Rivista italiana di economia, demografia e statistica, LXVII:67–80, 2013.
31
G. Michelon, S. Pilonato, and F. Ricceri. Csr reporting practices and the quality of disclosure: An
empirical analysis. Critical Perspectives on Accounting, 33:59–78, 2015. ISSN 1045-2354. doi:
10.1016/j.cpa.2014.10.003.
M. C. Minutolo, W. D. Kristjanpoller, and J. Stakeley. Exploring environmental, social, and
governance disclosure effects on the sp 500 financial performance. Business Strategy and the
Environment, 28(6):1083–1095, 2019. ISSN 0964-4733.
G. Munda and M. Nardo. Constructing consistent composite indicators: The issue of weights. 01
2005.
M. Nardo, M. Saisana, A. Saltelli, S. Tarantola, A. Hoffman, and E. Giovannini. Handbook on
Constructing Composite Indicators and User Guide, volume 2005. 09 2008.
A. Pistoni, L. Songini, and F. Bavagnoli. Integrated reporting quality: An empirical analysis. Cor-
porate Social Responsibility & Environmental Management, 25(4):489–507, 2018. ISSN 15353958.
doi: 10.1002/csr.1474. URL http://search.ebscohost.com/login.aspx?direct=true&db=
bth&AN=130671784&lang=fr&site=ehost-live.
Y. Qiu, A. Shaukat, and R. Tharyan. Environmental and social disclosures: Link with corporate
financial performance. The British Accounting Review, 48:102–116, 2016. ISSN 0890-8389. doi:
10.1016/j.bar.2014.10.007.
C. Reverte. Determinants of corporate social responsibility disclosure ratings by spanish listed
firms. Journal of Business Ethics, 88(2):351–366, 2009.
T. G. Savaneu, M.-M. Abdrudan, A. Giurgiu, L. E. Mester, and N. Bugnar. Measuring corpo-
rate social responsibility practices of micro and small enterprises – pilot study. In INTERNA-
TIONAL MANAGEMENT CONFERENCE, 2014. doi: https://ideas.repec.org/a/rom/mancon/
v8y2014i1p826-836.html.
M. Sen, K. Mukherjee, and J. Pattanayak. Corporate environmental disclosure practices in india.
Journal of Applied Accounting Research, 12:139–156, 2011. ISSN 0967-5426. doi: 10.1108/
09675421111160709.
32
N. Stern. The structure of economic modeling of the potential impacts of climate change: Graft-
ing gross underestimation of risk onto already narrow science models. Journal of Economic
Literature, 51(3):838–859, 2013.
TCFD. Implementing the recommendations of the task force on climate-related financial disclosures.
Report, December 2016.
TCFD. Recommendations of the task force on climate-related financial disclosure. 2017.
TEGSF. Report on climate-related disclosures. Report, European Commission, January 2019.
D. Tyteca. On the measurement of the environmental performance of firms— a literature re-
view and a productive efficiency perspective. Journal of Environmental Management, 46(3):
281–308, 1996. ISSN 0301-4797. doi: https://doi.org/10.1006/jema.1996.0022. URL http:
//www.sciencedirect.com/science/article/pii/S0301479796900225.
A. Venturelli, F. Caputo, R. Leopizzi, G. Mastroleo, and C. Mio. How can csr identity be evaluated?
a pilot study using a fuzzy expert system. Journal of Cleaner Production, 141:1000–1010, 2017.
J. Wiseman. An evaluation of environmental disclosures made in coporape annual reports. Ac-
counting, Organizations & Society, 7:53–63, 1982. ISSN 03613682.
P. Zhou, M. A. Delmas, and A. Kohli. Constructing meaningful environmental indices: A non-
parametric frontier approach. Journal of Environmental Economics and Management, 85:21–34,
2017.
33
6 Appendix
Appendix 1. Screeplot of eigenvalues after PCA
34

Appendix B: Coding grid
35
Number Questions Possible answers Score
Question 1Does the company report if the board is informedabout climate-related issues?
Yes 1No 0
Sub-question 1.aYes 1No 0
Sub-question 1.bDoes the company provide information on how theboard assesses progress and sets targets with respectto climate change?
Yes, precisely and/or quantified 1Yes, but not explicitly 0.5No 0
Question 2Does the company report the responsibilities assignedto managers with regard to climate change?
Yes, precisely and/or quantified 1Yes, but not explicitly 0.5No 0
Sub-question 2.aIf so, do these responsibilities include the assessmentand management of topics related to climate change?
Yes, precisely and/or quantified 1Yes, but not explicitly 0.5No 0
Question 3Does the company specify the time horizonsassociated with the concepts of short, medium andlong term?
Yes 1No 0
Question 4Does the company identify the main risks associatedwith climate change and their impacts
Yes, precisely and/or quantified 1Yes, but not explicitly 0.5No 0
Question 5Does the company identify the main opportunitiesassociated with climate change and their impacts
Yes, precisely and/or quantified 1Yes, but not explicitly 0.5No 0
Sub-question 5.aIf so, does the company identify the distribution ofthese risks and opportunities at sectoral and/orgeographical level?
Yes, precisely and/or quantified 1Yes, but not explicitly 0.5No 0
Question 6Does the company disclose the CAPEX and OPEXimpact of the risks and opportunities associated withclimate change?
Yes, precisely and/or quantified 1Yes, but not explicitly 0.5No 0
Question 7Does the company study the resilience of its businessthrough scenario analysis?
Yes, precisely and/or quantified 1
Yes, but not explicitly 0.5No 0
Sub-question 7.& If so, does the company specify the time horizon ofthe analysis it conducts?
Yes 1No 0
Question 8the company describe the processes by which it
identifies the risks associated with climate change?Yes, precisely and/or quantified 1Yes, but not explicitly 0.5No 0
Question 9the company explain how it assesses their
significance in relation to other business risks?Yes 1No 0
Question 10the company indicate whether current or future
regulations are included in this risk assessment?Yes 1No 0
Question 11the company indicate how the materiality levels of
these risks and opportunities have been estimated?Yes, precisely and/or quantified 1Yes, but not explicitly 0.5No 0
Question 12the company indicate how it manages the risks
associated with climate change?Yes, precisely and/or quantified 1Yes, but not explicitly 0.5No 0
Question 13the company explain how it decides whether or not
to prioritize the risks associated with climate change?Yes, precisely and/or quantified 1Yes, but not explicitly 0.5No 0
Question 14
Does the company report how the processes foridentifying and managing risks associated withclimate change are integrated into the overall riskmanagement process?
Yes, precisely and/or quantified 1Yes, but not explicitly 0.5No 0
Question 15the company indicate whether it monitors indicators
on the following topics: water, energy, land use,waste management?
For the four areas 1For three areas 0.75For two areas 0.5For a single area 0.25No 0
Sub-question 15.a If so, does the company provide historical data?Yes, for all indicators 1Yes, for some indicators 0.5No 0
Question 16Does the company indicate whether it calculates its
green share or if it uses an internal carbon price?Yes 1No 0
Question 17Does the company provide figures on the level of its
Scope 1 & 2 emissions?Yes 1No 0
Sub-question 17.aIf so, does the company provide the evolution ofthese indicators over time?
Yes 1No 0
Question 18Does the company provide figures on the level of itsScope 3 emissions?
YesNo
10
Sub-question 18.aIf so, does the company provide the evolution ofthese indicators over time?
Yes 1No 0
Question 19Does the company communicate the objectives it hasset for itself in terms of managing climate risks andopportunities?
Yes, precisely and/or quantified 1Yes, but not explicitly 0.5No 0
36
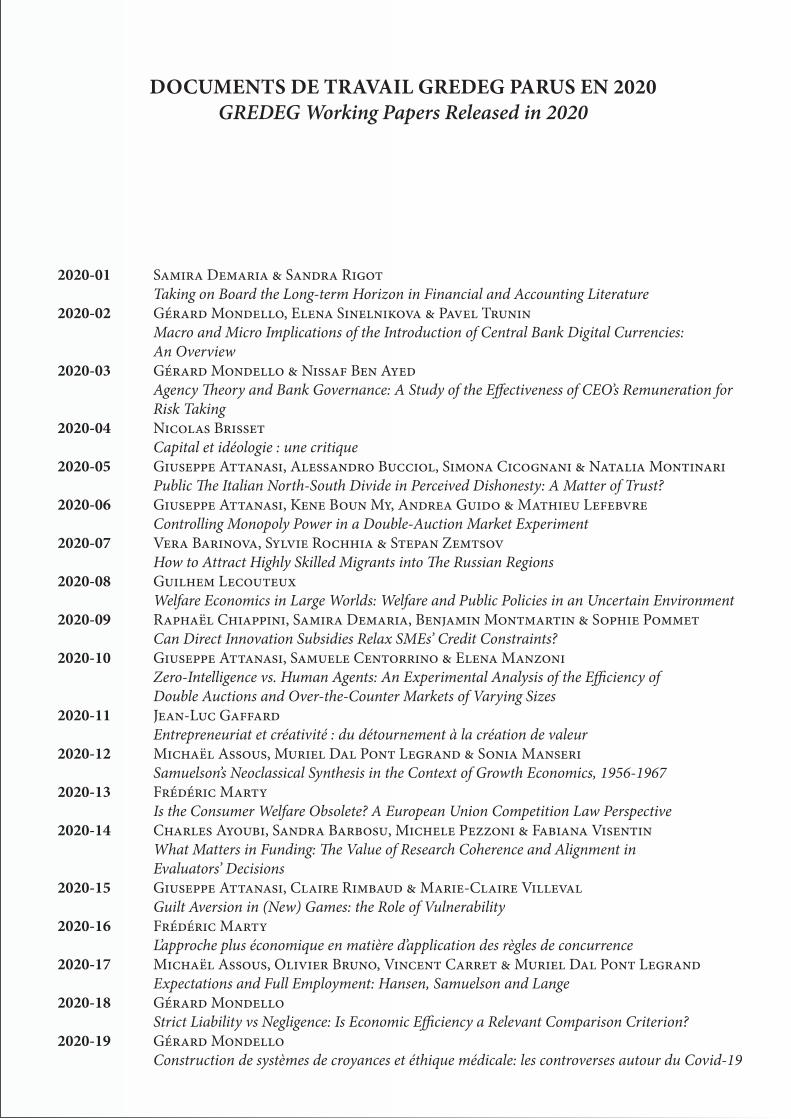
DOCUMENTS DE TRAVAIL GREDEG PARUS EN 2020GREDEG Working Papers Released in 2020
2020-01 Samira Demaria & Sandra Rigot Taking on Board the Long-term Horizon in Financial and Accounting Literature2020-02 Gérard Mondello, Elena Sinelnikova & Pavel Trunin Macro and Micro Implications of the Introduction of Central Bank Digital Currencies: An Overview2020-03 Gérard Mondello & Nissaf Ben Ayed Agency Theory and Bank Governance: A Study of the Effectiveness of CEO’s Remuneration for Risk Taking2020-04 Nicolas Brisset Capital et idéologie : une critique2020-05 Giuseppe Attanasi, Alessandro Bucciol, Simona Cicognani & Natalia Montinari Public The Italian North-South Divide in Perceived Dishonesty: A Matter of Trust?2020-06 Giuseppe Attanasi, Kene Boun My, Andrea Guido & Mathieu Lefebvre Controlling Monopoly Power in a Double-Auction Market Experiment2020-07 Vera Barinova, Sylvie Rochhia & Stepan Zemtsov How to Attract Highly Skilled Migrants into The Russian Regions2020-08 Guilhem Lecouteux Welfare Economics in Large Worlds: Welfare and Public Policies in an Uncertain Environment2020-09 Raphaël Chiappini, Samira Demaria, Benjamin Montmartin & Sophie Pommet Can Direct Innovation Subsidies Relax SMEs’ Credit Constraints?2020-10 Giuseppe Attanasi, Samuele Centorrino & Elena Manzoni Zero-Intelligence vs. Human Agents: An Experimental Analysis of the Efficiency of Double Auctions and Over-the-Counter Markets of Varying Sizes2020-11 Jean-Luc Gaffard Entrepreneuriat et créativité : du détournement à la création de valeur2020-12 Michaël Assous, Muriel Dal Pont Legrand & Sonia Manseri Samuelson’s Neoclassical Synthesis in the Context of Growth Economics, 1956-19672020-13 Frédéric Marty Is the Consumer Welfare Obsolete? A European Union Competition Law Perspective2020-14 Charles Ayoubi, Sandra Barbosu, Michele Pezzoni & Fabiana Visentin What Matters in Funding: The Value of Research Coherence and Alignment in Evaluators’ Decisions2020-15 Giuseppe Attanasi, Claire Rimbaud & Marie-Claire Villeval Guilt Aversion in (New) Games: the Role of Vulnerability2020-16 Frédéric Marty L’approche plus économique en matière d’application des règles de concurrence2020-17 Michaël Assous, Olivier Bruno, Vincent Carret & Muriel Dal Pont Legrand Expectations and Full Employment: Hansen, Samuelson and Lange2020-18 Gérard Mondello Strict Liability vs Negligence: Is Economic Efficiency a Relevant Comparison Criterion?2020-19 Gérard Mondello Construction de systèmes de croyances et éthique médicale: les controverses autour du Covid-19
2020-20 Giuseppe Attanasi, Michela Chessa, Sara Gil Gallen & Patrick Llerena A Survey on Experimental Elicitation of Creativity in Economics2020-21 Mattia Guerini, Patrick Musso & Lionel Nesta Estimation of Threshold Distributions for Market Participation2020-22 Rodolphe Dos Santos Ferreira When Muth’s Entrepreneurs Meet Schrödinger’s Cat2020-23 Adel Ben Youssef & Adelina Zeqiri Hospitality Industry 4.0 and Climate Change2020-24 Olivier Bruno & Melchisedek Joslem Ngambou Djatche Monetary and Prudential Policy Coordination: impact on Bank’s Risk-Taking2020-25 Adel Ben Youssef, Mounir Dahmani & Ludovic Ragni Technologies de l’information et de la communication, compétences numériques et performances académiques des étudiants2020-26 Aurélien Goutsmedt, Matthieu Renault & Francesco Sergi European Economics and the Early Years of the “International Seminar on Macroeconomics”2020-27 Matthieu Renault Theory to the Rescue of Large-scale Models: Edmond Malinvaud’s Alternative View on the Search for Microfoundations2020-28 Marta Ballatore, Lise Arena & Agnès Festré The Use of Experimental Methods by IS Scholars: An Illustrated Typology2020-29 Agnès Festré & Stein Østbye Michael Polanyi on Creativity in Science2020-30 Romain Plassard Making a Breach: The Incorporation of Agent-Based Models into the Bank of England’s Toolkit2020-31 Nicolas Brisset Qu’est-ce qu’un contexte ? Quentin Skinner et l’histoire des idées2020-32 Nicolas Brisset & Benoît Walraevens Thomas Piketty, le capitalisme et la société juste2020-33 Riccardo Camboni, Alberto Corsini, Raffaele Miniaci & Paola Valbonesi Mapping Fuel Poverty Risk at the Municipal Level: A Small-Scale Analysis of Italian Energy Performance Certificate, Census and Survey Data2020-34 Giuseppe Attanasi, Michela Chessa, Carlo Ciucani & Sara Gil Gallen Children’s GrI-Creativity: Effects of Limited Resources in Creative Drawing2020-35 Gérard Mondello Building Belief Systems and Medical Ethics: The Covid-19 Controversies2020-36 Flavio Calvino, Daniele Giachini & Mattia Guerini The Age Distribution of Business Firms2020-37 Jean-Sébastien Lenfant Great Expectations. Hicks on expectations from Theory of Wages (1932) to Value and Capital (1939) (long version)2020-38 Patrice Bougette & Christophe Charlier Subsidies and Countervailing Measures in the EU Biofuel Industry: A Welfare Analysis2020-39 Sylvie Rivot Information and Expectations in Policy-Making: Friedman’s Changing Approaches to Macroeconomic Dynamics2020-40 Melchisedek Joslem Ngambou Djatche Monetary Policy, Prudential Policy, and Bank’s Risk-Taking: A Literature Review2020-41 Jean-Luc Gaffard De la crise sanitaire à la crise économique ou la double exigence2020-42 Sothearath Seang & Dominique Torre Which Kind of Blockchain Application for Local Complementary Currencies ?
2020-43 Thierry Kirat & Frédéric Marty L’originalisme des juges fédéraux américains ou l’établissement de fondements constitutionnels au libéralisme économique depuis les années 19702020-44 Flora Bellone, Catherine Laffineur & Sophie Pommet Public Aid for Born Globals: A Diagnostic for the French Economy2020-45 Flora Bellone, Çilem Selin Hazır & Toshiyuki Matsuura Adjusting to China Competition: Evidence from Japanese Plant-product-level Data2020-46 Damien Bazin & Naceur Khraief Bt ou non Bt : telle est la question...2020-47 Damien Bazin & Naceur Khraief L’économie du suicide : le cas des agriculteurs du coton Bt en Inde2020-48 Damien Bazin & Naceur Khraief La technologie Bt est-elle sans risque pour le paysan indien ?2020-49 Mattia Guerini, Philipp Harting & Mauro Napoletano Governance Structure, Technical Change and Industry Competition2020-50 Thomas Grebel, Mauro Napoletano & Lionel Nesta Distant but Close in Sight. Firm-level Evidence on French-German Productivity Gaps in Manufacturing2020-51 Frédéric Marty Protecting the Competitive Process, not a Competitive Structure - Reflections on the book by Nicolas Petit Big Tech and the Digital Economy2020-52 Jeanne Amar, Samira Demaria & Sandra Rigot Enhancing Financial Transparency to Mitigate Climate Change: Towards a Climate Risks and Opportunities Reporting Index