enhancing efficacy of herbicides to control …
TRANSCRIPT

ENHANCING EFFICACY OF HERBICIDES TO CONTROL CHEATGRASS ON
MONTANA RANGE, PASTURE, AND CONSERVATION
RESERVE PROGRAM (CRP)
by
Krista Ann Ehlert
A thesis submitted in partial fulfillment of the requirements for the degree
of
Master of Science
in
Land Resources and Environmental Sciences
MONTANA STATE UNIVERSITY Bozeman, Montana
April 2013

©COPYRIGHT
by
Krista Ann Ehlert
2013
All Rights Reserved

ii
APPROVAL
of a thesis submitted by
Krista Ann Ehlert
This thesis has been read by each member of the thesis committee and has been found to be satisfactory regarding content, English usage, format, citation, bibliographic style, and consistency and is ready for submission to The Graduate School.
Dr. Jane Mangold (Co-Chair)
Dr. Richard Engel (Co-Chair)
Approved for the Department of Land Resources and Environmental Sciences
Dr. Tracy Sterling
Approved for The Graduate School
Dr. Ronald W. Larsen

iii
STATEMENT OF PERMISSION TO USE
In presenting this thesis in partial fulfillment of the requirements for a master’s
degree at Montana State University, I agree that the Library shall make it available to
borrowers under rules of the Library.
If I have indicated my intention to copyright this thesis by including a copyright
notice page, copying is allowable only for scholarly purposes, consistent with “fair use”
as prescribed in the U.S. Copyright Law. Requests for permission for extended quotation
from or reproduction of this thesis in whole or in parts may be granted only by the
copyright holder.
Krista Ann Ehlert April 2013

iv
ACKNOWLEDGEMENTS I would like to thank my advisors, Drs. Jane Mangold and Rick Engel, for
providing their thoughtful feedback and encouragement throughout my project, as well as
my committee member, Dr. Cathy Zabinski. Help in guiding me through graduate school
and field work was provided whole-heartedly and selflessly by Hilary Parkinson, Noelle
Orloff, and Rosie Wallander. A big thank you goes to all the people who helped with
long and hot field work days, followed by hours of weighing and sorting samples: Sam
Carlson, Hazal Ural, Laura Bosacker, Torrin Daniels, and Daniel France. Parts of my
project would not have been possible if not for the following people providing access to
equipment and support: Dr. Barbara Keith, Dr. Zach Miller, Dr. Fabian Menalled, and Dr.
Linnea Skoglund. I would not have been able to get through this project if not for help
from the MSU PGC staff, especially Dave Baumbauer. Cooperation for this project was
greatly appreciated from Jeff Hockett in Havre, MT, and Roger Hammersmark in Big
Timber, MT, whom allowed access to their land for my field studies. Thanks goes to the
NRCS CIG program, as well as the Montana Noxious Weed Trust Fund, for providing
funding for my project, in addition to scholarships I received from the Montana Weed
Control Association. I would further like to thank my friends for all of their
encouragement, those that are near and far. And I would lastly like to say thank you a
million times to my family, especially my mom and dad, who always seem to have the
right thing to say at the right time. This truly has been a memorable learning experience,
and an enjoyable one at that.

v
TABLE OF CONTENTS
1. PROJECT BACKGROUND AND OBJECTIVES ........................................................ 1 Introduction ..................................................................................................................... 1 Literature Review ............................................................................................................ 2
Cheatgrass Origin and Distribution ........................................................................ 2 Biology .................................................................................................................... 5 Impacts .................................................................................................................... 6 Integrated Management of Cheatgrass .................................................................... 8 Chemical Control .................................................................................................. 10 Biological Control ................................................................................................. 14
Project Justification and Objectives ................................................................................ 19
2. EFFECTS OF IMAZAPIC RATE, APPLICATION TIMING, AND PLANT LITTER ON CHEATGRASS-INFESTED RANGE AND CRP LANDS ........................................ 20
Introduction ................................................................................................................... 20
Materials and Methods ................................................................................................. 22 Site Description ..................................................................................................... 22 Weather Data ........................................................................................................ 23 Experimental Design ............................................................................................. 23 Herbicide Applications ......................................................................................... 24 Vegetation Sampling ............................................................................................. 26 Statistical Analysis ................................................................................................ 26
Results .......................................................................................................................... 27 Climate (Average Precipitation) .......................................................................... 27 Experiment I. – Rate x Litter ................................................................................ 30
Cheatgrass (BRTE) ................................................................................... 30 Perennial Grasses (PG) ............................................................................. 35 Exotic Perennial Forbs (EPF) ................................................................... 35 Native Perennial Forbs (NPF) .................................................................. 35
Experiment II. – Rate x Timing ............................................................................ 35 Cheatgrass (BRTE) .................................................................................. 35 Perennial Grasses (PG) ............................................................................ 38 Exotic Perennial Forbs (EPF) .................................................................. 38 Native Perennial Forbs (NPF) .................................................................. 38
Discussion .................................................................................................................... 39 Implications ........................................................................................................... 42

vi
TABLE OF CONTENTS – CONTINUED
3. IMAZAPIC PERSISTENCE IN A SEMIARID CLIMATE AT CHEATGRASS-INFESTED RANGELAND AND CRP SITES ........................... 44
Introduction ................................................................................................................... 44
Materials and Methods ................................................................................................. 46 Site and Field Experimental Description .............................................................. 46 Soil Sampling ........................................................................................................ 48 Bioassay ................................................................................................................ 49 Statistical Analysis ................................................................................................ 51
Results .......................................................................................................................... 51 Big Timber ............................................................................................................ 51
Cucumber ................................................................................................. 51 Cheatgrass ................................................................................................ 55
Havre ..................................................................................................................... 57 Cucumber ................................................................................................. 57 Cheatgrass ................................................................................................ 61
Discussion .................................................................................................................... 63 Implications ........................................................................................................... 65
4. INTEGRATING THE HERBICIDE IMAZAPIC AND THE FUNGAL PATHOGEN PYRENOPHORA SEMENIPERDA TO CONTROL CHEATGRASS ................................................................................... 67
Introduction ................................................................................................................... 67
Materials and Methods ................................................................................................. 71 Experimental Design ............................................................................................. 71 Pyrenophora semeniperda Inoculum Preparation ................................................ 71 Pyrenophora semeniperda Inoculum Application ................................................ 72 Greenhouse Conditions and Seed Planting ........................................................... 73 Data Collection ..................................................................................................... 74 Statistical Analysis ................................................................................................ 74
Results .......................................................................................................................... 74 Cheatgrass Emergence .......................................................................................... 74 Cheatgrass Density ................................................................................................ 76 Cheatgrass Biomass .............................................................................................. 77
Discussion .................................................................................................................... 79 Implications ........................................................................................................... 83

vii
TABLE OF CONTENTS – CONTINUED
5. SUMMARY OF FINDINGS AND DIRECTIONS FOR FUTURE RESEARCH ................................................................................................. 85
LITERATURE CITED ..................................................................................................... 88 APPENDICES ................................................................................................................ 100 APPENDIX A: Chapter Two Statistical Model .................................................. 101 APPENDIX B: Chapter Three Statistical Model ................................................ 103 APPENDIX C: Chapter Four Statistical Model and Supplemental Information .................................................................................. 112

viii
LIST OF TABLES
Table Page
1.1. Common rangeland herbicides for cheatgrass management ............................................................................................. 11 2.1. Application date, cheatgrass growth stage, and weather conditions for Experiment I (Rate x Litter) and Experiment II (Rate x Timing) at Big Timber and Havre for 2011 and 2012 ...................................................................................................... 25 2.2. Vegetation sampling date, application timing from the previous year, and weeks post-application for Experiment I (Rate x Litter) and Experiment II (Rate x Timing) at Big Timber and Havre for 2011 and 2012 ............................................................. 27 2.3. Species found at each site by plant functional group ................................................. 28 2.4. Experiment I – Rate x Litter. P-values from ANOVA on functional group cover and biomass at Big Timber and Havre ........................................................................................... 31 2.5. Experiment II – Rate x Timing. P-values from ANOVA on functional group cover and biomass at Big Timber and Havre ........................................................................................... 36 3.1. Application date and weather conditions for 2011 and 2012 at Big Timber and Havre .................................................................................. 48 3.2. Soil sampling date and corresponding days post-application (DPA) at Big Timber and Havre for 2011 and 2012 .............. 49 3.3. P-values from ANOVA on cucumber and cheatgrass biomass at each sampling date (days post-application, DPA) for Big Timber ........................................................................................................... 52 3.4. Mean absolute biomass (mg plant-1) for cucumber and cheatgrass at each sampling date (days post-application, DPA) for the 2011 and 2012 bioassays for Big Timber .................................................... 53

ix
LIST OF TABLES - CONTINUED
Table Page 3.5. P-values from ANOVA on cucumber and cheatgrass biomass at each sampling date (days post-application, DPA) for Havre .................................................................... 58 3.6. Absolute mean biomass (mg plant-1) for cucumber and cheatgrass at each sampling date (days post-application, DPA) for the 2011 and 2012 bioassays for Havre ............................................................... 59 4.1. P-values from ANOVA on cheatgrass emergence ..................................................... 75 4.2. P-values from ANOVA on cheatgrass density and biomass ..................................... 76

x
LIST OF FIGURES
Figure Page
1.1. Cheatgrass .................................................................................................................... 3 1.2. Cheatgrass infested rangeland ...................................................................................... 3
1.3. Cheatgrass seeds bearing Pyrenophora semeniperda stromata ................................................................................................ 17 2.1. Precipitation for the long-term average, September 2010-August 2011, and September 2011-August 2011 for a) Big Timber and b) Havre ................................................................................. 29 2.2. Cheatgrass cover as affected by year, imazapic rate, and litter at Big Timber for Experiment I (Rate x Litter) .................................. 32 2.3. Cheatgrass biomass as affected by year, imazapic rate, and litter at Big Timber for Experiment I (Rate x Litter) .................................. 33 2.4. Cheatgrass biomass as affected by year, imazapic rate, and litter at Havre for Experiment I (Rate x Litter) ........................................... 34 2.5. Cheatgrass cover as affected by year, imazapic rate, and application timing at Havre for Experiment I (Rate x Timing) .................. 37 3.1. Cucumber biomass as percent of the control for the a) 2011 and b) 2012 bioassays for Big Timber .................................................. 54 3.2. Cheatgrass biomass as percent of the control for the a) 2011 and b) 2012 bioassays for Big Timber ................................................... 56 3.3. Cucumber biomass as percent of the control for the a) 2011 and b) 2012 bioassays for Havre ............................................................ 60 3.4. Cheatgrass biomass as percent of the control for the a) 2011 and b) 2012 bioassays for Havre ............................................................ 62 4.1. Cheatgrass emergence as affected by Pyrenophora semeniperda and seeding depth ........................................................... 75

xi
LIST OF FIGURES - CONTINUED
Figure Page 4.2. Cheatgrass density as affected by Pyrenophora semeniperda, imazapic, and seeding depth ..................................................................................... 77 4.3. Cheatgrass biomass as affected by Pyrenophora semeniperda and imazapic treatments ............................................................................................ 78 4.4. Cheatgrass biomass as affected by Pyrenophora semeniperda
treatment and seeding depth ..................................................................................... 79

xii
ABSTRACT
Chemical control of cheatgrass has recently focused on imazapic; factors such as application rate and timing and the presence of plant litter can influence imazapic’s efficacy. Herbicides minimally impact the seedbank so integrating a seed-killing pathogen like Pyrenophora semeniperda may result in more effective and sustainable control. My research objectives were to 1) test the effect of imazapic application rate and timing and plant litter on cheatgrass and desired plant species in range and Conservation Reserve Program (CRP) lands, 2) conduct a soil bioassay to determine imazapic persistence as affected by imazapic rate, presence of plant litter, and time after herbicide application, and 3) determine whether the fungal pathogen P. semeniperda combined with a single imazapic application would provide greater control of cheatgrass than either strategy used alone.
Objective 1 was carried out in range and CRP lands over two years with a factorial combination of four imazapic rates, two litter manipulation treatments and/or two application timings. In general, all three imazapic rates were equally effective in controlling cheatgrass compared to the non-sprayed control. Litter manipulation treatments had little effect on imazapic efficacy, but early application of imazapic resulted in more consistent cheatgrass control.
Objective 2 was conducted in the greenhouse using soil samples collected over a six month period from the field study for Objective 1. Cucumber and cheatgrass were used as indicator species. All three herbicide rates reduced both species’ biomass below that of the control. Again, litter manipulation had a minimal effect, and imazapic was found to persist through the following spring after spraying.
Objective 3 was explored in a greenhouse experiment using a factorial combination of two imazapic treatments, two P. semeniperda treatments, and three seeding depths. Pyrenophora semeniperda reduced cheatgrass emergence, while cheatgrass biomass and density were affected by imazapic and the integration of imazapic and P. semeniperda. Imazapic and P. semeniperda did not favorably interact to reduce biomass and density; however, integrating these two tools holds promise as P. semeniperda can reduce the seedbank, and imazapic can control seedlings that escape pathogen-caused mortality.

1
CHAPTER ONE
PROJECT BACKGROUND AND OBJECTIVES
Introduction
Cheatgrass (Bromus tectorum) is an annual grass native to Eurasia that currently
infests millions of hectares of rangeland in western North America (Mack 1981, Rice
2005). Control of cheatgrass has often centered on the application of synthetic herbicides
(Davison and Smith 2007, Elseroad and Rudd 2011, Hirsch et al. 2012, Pellant et al.
1999, Peterson et al. 2010). However, a single control method is often not effective in
achieving sustainable control of an invasive weed (DiTomaso 2000, Sheley and Krueger-
Mangold 2003). Integrated pest management (IPM) allows land managers more effective
and long-term means to manage the invasion of cheatgrass. Integrated pest management
is an ecologically sound mix of available and effective control tactics that include
physical, biological, and chemical control methodologies (Norris 2011).
The overall goal of this project was to refine cheatgrass control practices for
Montana’s semiarid environment, which include the use of synthetic herbicides, and new
practices that combine chemical and biological control to provide more effective and
long-term control. Specifically, this project focused on the use of the herbicide imazapic
(Plateau®) and the fungal pathogen Pyrenophora semeniperda. First, I explored the
efficacy of imazapic in the field as it relates to application rate and timing and plant litter
presence. Second, I used a greenhouse bioassay to investigate how imazapic application
rate and plant litter influence imazapic persistence in the soil. Lastly, I investigated the

2 integration of imazapic with P. semeniperda and assessed cheatgrass control as it relates
to location of cheatgrass seeds within the soil profile. My intent was to determine
whether a favorable response exists by integrating chemical and biological tactics, thus
enhancing cheatgrass control.
In this chapter, I review the literature relevant to this project, starting with
cheatgrass origin and distribution. I then discuss cheatgrass biology, impacts, and
strategies for its management. Lastly, I provide an in-depth description of chemical
control and biological control, focusing on imazapic and P. semeniperda.
Literature Review
Cheatgrass Origin and Distribution
The invasion of cheatgrass (Figures 1.1 and 1.2) is considered one of the most
significant plant invasions in North America (Mack 2011). It was introduced to North
America through contaminated crop seed and ship ballasts that originated in eastern
Europe and western Asia (Mack 1981). Cheatgrass was first reported in British Columbia
in 1890 (Mack 1981) and now infests 22.3 million hectares in 17 western states (Rice
2005). The spread of cheatgrass is believed to be due to overgrazing in the late 1800s,
abandoned homesteads during the Great Depression, and heavy plowing practices that
produced disturbed sites suitable for invasion (Pickford 1932, Rickard and Cline 1980).

3
Figure 1.1. Cheatgrass. (USDA NRCS PLANTS Database).
Figure 1.2. Cheatgrass infested rangeland. (redorbit.com)
Cheatgrass has been especially problematic in the Great Basin, an area consisting
of portions of Nevada, Utah, Idaho, Oregon, and California (National Park Service 2012).
Plant communities within the Great Basin have experienced a decrease in species
richness, leading to fewer native bunchgrasses and annual forbs (Knapp 1996). While
cheatgrass invasion in the Great Basin was partly due to overgrazing in the late 1800s
that led to substantial range deterioration into the early 1900s (Pickford 1932, Vale
1974), cheatgrass also seized an unoccupied niche that was open because of the lack of

4 native annual grasses (Knapp 1996). Moreover, cheatgrass has a high degree of
phenotypic plasticity because of genetic variation among individual plants within a
population and the ability of these plants to cross-pollinate (Ashley and Longland 2007).
This results in hybrid vigor and provides an advantage over native grasses (Ashley and
Longland 2007, Mack and Pyke 1983).
Cheatgrass was first reported in Montana in 1898, and now exists in every county
(Rice 2003). Like the Great Basin, Montana’s semiarid climate is favorable for cheatgrass
given the seasonal timing of precipitation that leads to water availability during the fall,
winter, and spring months. This provides a broad window of time for cheatgrass
germination (Bradford and Lauenroth 2006) that is followed by drought-like conditions
in the summer. Cheatgrass can germinate even during the winter, as long as the soil is not
frozen (Mack 2011). The seasonal precipitation patterns in Montana and the Great Basin
are similar to those found in cheatgrass’ native range (Knapp 1996).
Global climate change is predicted to enhance cheatgrass expansion in Montana
and the western U.S. (Bradley 2009). Bioclimatic envelope models using summer
precipitation variables as the best predictors of cheatgrass presence indicate that
decreased summer precipitation (June – September) will result in large portions of
Montana, Wyoming, Utah, and Colorado becoming climatically suitable for cheatgrass
invasion (Bradley 2009). Thus, because native perennial grasses grow later in the spring
relative to cheatgrass, and because their growth continues through the summer, they are
at a competitive disadvantage for water resources under decreased summer precipitation
(Bradley 2009, Stewart and Hull 1949). With the spread of cheatgrass into previously

5 unoccupied areas, the need to develop new management strategies becomes even more
imperative.
Biology
Cheatgrass’ competitive advantages result from prolific seed production, a
continuous (fall through spring) germination strategy, and the ability to utilize soil water
and nitrogen (N) efficiently. Cheatgrass is capable of producing up to 6,000 seeds plant-1
(Young and Evans 1978), creating densities of 4,800 – 19,000 seeds m-2 (Hempy-Mayer
and Pyke 2008, Humphrey and Schupp 2001). Although cheatgrass is considered a winter
annual that germinates in the fall after primary dormancy ends, it can also behave as a
summer annual that germinates in the spring when moisture is present. This continuous
germination characteristic is due to secondary dormancy (Harmon et al. 2012). Seeds
entering secondary dormancy during the winter add to the carryover spring seed bank
(Young and Evans 1975, Young et al. 1969). In semiarid climates, seed production and
seed bank persistence vary with site attributes and precipitation patterns. Above-normal
precipitation leads to greater seed production and higher seed densities (13,942 seeds m-2)
relative to drought conditions (3,567 seeds m-2) (Smith et al. 2008). If precipitation
patterns following cheatgrass seed production favor fall germination, then the fraction of
seeds carried over to the spring is reduced. In general, cheatgrass seeds do not persist
beyond the second carryover year (Smith et al. 2008).
Nitrogen and water are co-limiting resources in semiarid rangelands, hence
effective use of soil water and N are critical for species survival (Archer and Bowman
2002). Cheatgrass produces more biomass, tillers, and root length per unti leaf N relative

6 to native perennials under a wide range of available N environments (Vasquez et al.
2008). James (2008b) attributed this response to higher leaf N productivity, defined as the
rate of dry matter gain per leaf N per unit time (Garnier et al. 1995). Cheatgrass also
efficiently utilizes water relative to native plants (Pellant 1996). Cheatgrass had greater
root length relative to perennial grass species like bluebunch wheatgrass
(Pseudoroegneria spicata), bottlebrush squirreltail (Elymus elymoides), and crested
wheatgrass (Agropyrum desertorum) under varying soil N levels (James 2008a). This
allows cheatgrass to effectively use soil moisture and nutrients, making them less
available to surrounding native plants (Chambers et al. 2007, Harris 1967, Sperry et al.
2006, Stewart and Hull 1949). Thus, cheatgrass has competitive traits that allow it to
outperform natives, in addition to its life history characteristics of prolific seed
production and carryover seed bank.
Impacts
The impacts of cheatgrass on rangelands are negative and include a reduction in
the diversity of native plants, altered fire regimes, and economic losses. Cheatgrass
decreases native plant diversity such that revegetation is sometimes necessary to restore
productive, properly functioning ecosystems (Epanchin-Niell et al. 2009). Cheatgrass-
invaded sites had approximately 10% perennial grass cover compared to uninvaded sites
with > 50% perennial grass cover (Leger 2008). Additionally, cheatgrass dries out early
in the summer and acts as a continuous carpet of highly flammable fine fuel. Cheatgrass-
infested rangeland is 10-500 times more likely to burn relative to rangeland dominated by
native bunchgrasses, and the fire season can be extended up to three months (Hull 1965).

7 Large and frequent fires weaken native vegetation but have little impact on cheatgrass
populations. This positive feedback loop between cheatgrass and the fire cycle
contributes to the success of cheatgrass within the Great Basin (Peters and Bunting 1994,
Whisenant 1990).
Economic impacts from cheatgrass invasions are associated with control costs and
decreased rangeland forage quality. The estimated costs of revegetation, fire suppression,
and chemical control, are $185, $175, and $173 per hectare, respectively (BLM 1999).
Cheatgrass monocultures result in an unpredictable forage base due to the plant’s
dependency on precipitation for biomass production. Cheatgrass also has a narrow
window of palatability because of awned seeds and its tendency to dry out by late spring
or early summer (Klemmedson and Smith 1964, Murray et al. 1978, Rice 2005). While
cheatgrass crude protein (CP) is relatively high (27%) early in the season relative to other
grasses (16% for Idaho fescue (Festuca idahoensis)), it has the fewest days of adequate
CP (7.5% CP) across the entire growing season compared to other common rangeland
grasses (Ganskopp and Bohnert 2001). Furthermore, the CP concentration of common
rangeland forage species, e.g.western wheatgrass (Pascopyrum smithii), increases when
cheatgrass is suppressed (Haferkamp et al. 2001a). Cheatgrass suppression reduces soil
water use, allowing perennial forage species to continue growth later into the growing
season. Prescribing management strategies that improve cheatgrass control in rangelands
can reduce the economic losses associated with control costs and decreased forage quality
that occur because of cheatgrass infestations.

8 Integrated Management of Cheatgrass
Improving degraded communities and decreasing noxious weed invasion and
spread is a key goal for rangeland management, which can successfully be met by using
economical and sustainable integrated strategies (DiTomaso 2000). Integrated pest
management (IPM) incorporates an ecological sound mix of available and effective
control tactics including physical, biological, and chemical control methodologies (Norris
2011).
Physical or mechanical methods attempt to remove the targeted plant or damage it
to the point where it is unable to survive (DiTomaso et al. 2010). Tillage is a common
mechanical control method used for cheatgrass in cropping systems, but is not practicable
for many rangeland sites where soils are thin or rocky. In addition, the disturbance from
tillage can create disturbed sites that cheatgrass or other invasive plants are quick to
occupy (DiTomaso et al. 2010). Prescribed grazing strategies have sometimes been used
to control invasive plants, such as cheatgrass, in rangelands. Prescribed grazing requires
that the timing, intensity, and frequency of grazing events be manipulated to have the
greatest effect on the targeted weed (DiTomaso et al. 2010). Grazing to control
cheatgrass is most applicable during the spring when biomass, nutritional value, and
palatability are high (Klemmedson and Smith 1964, Murray et al. 1978, Rice 2005);
however, recent work suggested fall grazing of cheatgrass can reduce fuel loads on
Nevada rangeland and potentially decrease the risk of fire in subsequent years (Schmelzer
et al. 2008). Grazing reduces cheatgrass seed production and seed bank density which can

9 lead to improved rangeland health (Call et al. 2008), provided grazing is managed to
minimize the impact on desirable species (DiTomaso et al. 2010).
Prescribed fire can be integrated with other tools to improve management of
cheatgrass and other annual invasive grasses (DiTomaso et al. 2010). An imazapic
treatment following prescribed fire reduced cheatgrass cover from 82% to 9% over a two-
year period in Colorado (Calo et al. 2012). Prescribed fire can also stimulate re-sprouting
perennial species, which may improve their ability to compete against annual grasses
(DiTomaso et al. 2010). For example, imazapic application after a prescribed burn
resulted in ten times more perennial bunchgrass cover relative to a control treatment in a
study investigating revegetation of medusahead (Taeniatherum caput-medusae)-infested
rangeland in Oregon (Davies 2010). The synergistic effect of prescribed fire with
herbicide applications likely reflects better contact between the herbicide and the targeted
plant because of a reduction in plant litter at the soil surface (Fowers 2011, Sheley et al.
2007).
Cheatgrass control methods are often integrated with revegetation when rangeland
is so severely deteriorated that few desirable species are present (DiTomaso et al. 2010).
Research has focused on using competitive native and introduced perennial species in
cheatgrass-infested lands (Cox and Anderson 2004, Davies et al. 2010, Hull and Stewart
1948). Selecting desirable species adapted to the site’s soil conditions, elevation, climate,
precipitation, and fire regimes improves the probability of success (Allen 1995,
DiTomaso 2000, Epanchin-Niell et al. 2009, Jacobs et al. 1999). Revegetation may be the
best option for long-term, sustainable management of cheatgrass invasions (DiTomaso

10 2000). For example, one model parameterized for the Wyoming big sagebrush
community, predicted that if revegetation was not implemented, 72% of the landscape
would be covered by a cheatgrass monoculture after 50 years (Epanchin-Niell et al.
2009).
Chemical Control
Synthetic herbicides are widely used to control cheatgrass in cropping systems.
However, application to rangelands may be limited to severely affected sites where
herbicide use will lead to the improved productivity of desired plant species and grazing
opportunities. Herbicides reduce labor costs associated with hand and mechanical
weeding and are easy to apply while being highly effective (Ross and Lembi 1999,
Radosevich et al. 2007). Rangeland herbicides used to control cheatgrass include
sulfometuron methyl, rimsulfuron, glyphosate, and imazapic (Bussan and Dyer 1999)
(Table 1.1).
Sulfometuron methyl and rimsulfuron are acetolacetate synthase (ALS) inhibitors
that hinder the synthesis of branched chain amino acids needed for cell growth (Peterson
et al. 2010). Sulfometuron methyl has been used on Great Basin rangelands to control
cheatgrass and reduce its competition with seeded species (Pellant et al. 1999). Remnant
perennial grasses in treated plots showed improved plant vigor relative to a non-sprayed
control, potentially improving rangeland rehabilitation results (Pellant et al. 1999).

11
Table 1.1. Common rangeland herbicides for cheatgrass management.
Name Trade Name Family Chemical Structure
Avg. Soil
Half-Life
(days)
Sulfometuron methyl +
chlorosulfuron Landmark® Sulfonylurea
30
Rimsulfuron Matrix® Sulfonylurea
18-21
Glyphosate RoundUp® Amino acid derivative
47
Imazapic Plateau® Imidazolinone
120
Herbicide effectiveness can be influenced by soil properties such as pH. Hirsch et
al. (2012) investigated rimsulfuron effects on cheatgrass and two revegetation species,
crested wheatgrass (Agropyrum desertorum) and bottlebrush squirreltail (Elymus
elymoides), in salt desert shrub and sagebrush sites. The pH of the soil was 7.9 at the
sagebrush site and was 9.5 at the salt desert site. Herbicide activity as measured by
seedling emergence, biomass production, and seedling mortality was greater in the
sagebrush soil. The authors attributed this effect to greater herbicide adsorption and

12 residual bioavailability at the lower pH, resulting in prolonged exposure of the seedlings
to rimsulfuron.
Glyphosate is an aromatic amino acid synthesis inhibitor that selectively controls
cheatgrass if application occurs in the spring while cheatgrass is actively growing but
before desirable species break dormancy (Bussan and Dyer 1999). Glyphosate was
applied as part of a management strategy for cheatgrass control and perennial grass
establishment in Wyoming rangelands (Whitson and Koch 1998). Cheatgrass control was
greater than 92%, on average, after three sequential years of glyphosate application; a
single year of glyphosate application limited control to less than 60%. However,
glyphosate reduced the perennial grasses available to compete with cheatgrass.
Cheatgrass control is possible with repeated glyphosate applications combined with
replacing annual grasses with competitive cool-season perennials to improve competition
(Whitson and Koch 1998).
Recent cheatgrass management on western rangelands has focused on imazapic, a
member of the imidazolinone herbicide family (Davison and Smith 2007, Elseroad and
Rudd 2011, Morris et al. 2009). Imazapic is an ALS inhibitor that is absorbed through
leaves, stems, and roots (BASF Corporation 2008, Peterson et al. 2010). Imazapic
efficacy has been evaluated across the western U.S. with variable results. In Oregon,
imazapic reduced cheatgrass frequency to zero without affecting native species
abundance in semiarid grassland and shrub-steppe (Elseroad and Rudd 2011). In Nevada,
cheatgrass biomass decreased by more than 50% with imazapic application relative to a
non-sprayed control after two growing seasons (Davison and Smith 2007). In Utah,

13 variation in cheatgrass control and seeded species establishment was observed in salt
desert shrub and Wyoming big sagebrush communities that were seeded with perennial
plants following imazapic application (Morris et al. 2009). The survival of seeded
perennial plants, such as crested wheatgrass, can be inhibited if cheatgrass densities are
above a critical threshold of 43 seedlings m-2 (Evans 1961). This suggests sites can return
to pretreatment levels within two years if cheatgrass densities are not below this critical
threshold, despite seeding after imazapic application (Morris et al. 2009).
In Montana imazapic application for cheatgrass control has produced inconsistent
results. A meta-analysis of 25 trials from across Montana found cheatgrass control
ranging from 20% to 95% (Mangold et al., in review). The meta-analysis revealed post-
emergent (foliar) application to be more effective than pre-emergent (soil) application,
although both application methods are recommended on the label (BASF Corporation
2008). Disconnection between empirical data and label recommendations suggest the
need for an investigation into the factors influencing imazapic persistence.
Imazapic persistence is related to how quickly it degrades, and thus, its
corresponding availability for plant uptake. Imazapic is primarily degraded through soil
microbial activity. The average soil half-life of imazapic is 120 days (Tu et al. 2001), but
the half-life can range from 31 to 233 days (American Cyanamid 2000). Soil properties
can influence imazapic persistence. For example, the persistence of imidazolines
increases as soil pH decreases (Loux and Reese 1992). High clay and soil organic matter
also increase imazapic persistence due to greater surface area and charge density
(Colquhoun 2006, Ulbrich et al. 2005). Increased adsorption in such soils corresponds

14 with decreased availability for microbial degradation (Loux and Reese 1992). Microbial
degradation is favored in warm, moist soils (Prostko et al. 2005, Ulbrich et al. 2005).
Additionally, imidazolines can be adsorbed by plant litter at the soil surface,
which can further reduce imazapic efficacy. This is demonstrated in studies investigating
the invasive annual grass medusahead. Kyser et al. (2007) observed limited uptake of
imazapic by medusahead because of the presence of plant litter. Monaco et al. (2005)
found that medusahead control using imazapic was greater after implementing a complete
burn to eliminate litter. Decreasing or removing litter may reduce the concentration of
imazapic needed to reduce medusahead cover because of improved herbicide contact
with the target plant (DiTomaso et al. 2006, Sheley et al. 2007).
Biological Control
Biological control may offer alternatives for improving cheatgrass control, with
the deliberate use of natural enemies to achieve the goal of not eradicating the weed, but
rather reduce its presence to a tolerable level (Watson 1989, Wilson and McCaffrey
1999). Biological control can potentially address the need for targeted and effective
environmentally benign methods that can be used in conjunction with restoration seeding
(Meyer et al. 2008a). Fungal pathogens have been the focus of most research
investigating biological control of cheatgrass (Dooley and Beckstead 2010, Meyer et al.
2008a, Stewart 2009).
Three pathogens that target different stages of cheatgrass’s life history are the
focus of current research (Meyer et al. 2008a). Ustilago bullata, a head smut pathogen
with high host-specificity is endemic in nearly every cheatgrass population and is easily

15 grown in culture (Meyer et al. 2008a). Ustilago bullata infects cheatgrass seedlings that
emerge during the fall. The pathogen overwinters in vegetative tissues and grows upward
during bolting in the spring, eventually infecting floral meristems, and preventing seed
set (Meyer et al. 2008a). However, major differences exist in U. bullata susceptibility
among cheatgrass genotypes because of resistance polymorphism among and within
cheatgrass populations (Meyer et al. 2001).
Tilletia fusca is a host specific chestnut bunt that infects seedlings and can persist
long term because of a soil spore bank (Meyer et al. 2008a). Tilletia fusca infects
cheatgrass seedlings and grows systemically, preventing seed production (Meyer et al.
2008a). Infection is enhanced at colder temperatures and under persistent snow cover
(Meyer et al. 2008a). Tilletia fusca is most likely effective in mesic habitats where
autumn precipitation and persistent snow cover is likely to occur (Meyer et al. 2008a).
Pseudomonas fluorescens D7, a deleterious rhizobacterium, is an alternative
biological control to fungal pathogens proposed by Meyer et al. (2008a). Pseudomonas
fluorescens D7 is host specific to cheatgrass and widespread effects on non-target species
do not exist (Kennedy et al. 2001). A phytotoxin of P. fluorescens D7 reduces cheatgrass
biomass by inhibiting root elongation and reducing seedling vigor (Kennedy et al. 1991,
Tranel et al. 1993). However, cheatgrass seeds inoculated with P. fluorescens D7 did not
experience mortality under laboratory or field conditions (Kennedy et al. 1991).
Pyrenophora semeniperda is a generalist grass fungal pathogen that causes minor
leaf spot, seed infection, and death of at least 36 genera of annual and perennial grasses
(Medd et al. 2003, Meyer et al. 2008a). The name “black fingers of death” (BFOD) is

16 ascribed to this pathogen because of black finger-like stromata that emerge from infected
seeds (Figure 1.3) (Meyer et al. 2008a). Pyrenophora semeniperda can be observed as its
anamorph, or asexual state, Drechslera campanulata (Medd et al. 2003). Pyrenophora
semeniperda over-summers as mycelium in seed and plant debris, with stromata
developing from the mycelium to produce conidiophores and conidia (Medd et al. 2003).
Conidia that are carried to the inflorescence directly infect the developing ovary of
cheatgrass seeds during anthesis, resulting in seed death (Medd et al. 2003).
Pyrenophora semeniperda is most effective in arid environments where drought
conditions occur during seed ripening, leading to greater disease incidence on dormant
seeds in the seed bank relative to mesic environments (Meyer et al. 2008b). Cheatgrass
populations in arid habitats (199 mm mean annual precipitation (MAP)) experienced 50
times more seed mortality than in mesic habitats (486 mm MAP) as a result of P.
semeniperda infection (Beckstead et al. 2007, Meyer et al. 2007). In mesic habitats, non-
dormant cheatgrass seeds germinate more quickly and escape P. semeniperda-caused
mortality (Beckstead et al. 2007). In essence, germinating seeds compete with P.
semeniperda for seed resources, so a “race for survival” occurs between the fungal
pathogen and the seed (Beckstead et al. 2007). In contrast, cheatgrass seeds that fail to
germinate in the fall, remain dormant over the winter, and germinate in the spring are
more susceptible to P. semeniperda infection and mortality.

17
Figure 1.3. Cheatgrass seeds bearing Pyrenophora semeniperda stromata.
An advantage of using P. semeniperda as a biological control for annual grasses is
its ability to infect the carryover seed bank and inhibit spring cheatgrass germination,
especially under dry fall conditions (Medd and Campbell 2005). However, if conditions
are favorable for fall cheatgrass germination, it may still be beneficial to use P.
semeniperda. Fall herbicide application can decrease growth or kill cheatgrass seedlings
while P. semeniperda can infect and kill non-germinating seeds over the winter.
Disadvantages of using P. semeniperda include logistics of mass production,
environmental constraints, and spillover effects. Mass-producing inoculum is expensive
and complex depending on what type of inoculum is used; conidial suspensions are more
costly relative to mycelium fragments (Medd and Campbell 2005). Sodium alginate can
be used to prepare pellets containing mycelium fragments as a more cost-effective
inoculum type; however, such pellets have one-third the infection level of conidial
suspensions.
Spillover effects of P. semeniperda onto sensitive crops and native grasses are a
major concern associated with its use as a biological control (Medd and Campbell 2005).
Pathogen spillover occurs when one host species supports high pathogen loads, causing

18 indirect disease-mediated consequences for co-occurring host species (Beckstead et al.
2010). Cheatgrass serves as a reservoir for P. semeniperda, so the potential exists for it to
negatively affect native grass seeds before germination or emergence occurs (Beckstead
et al. 2010). Beckstead et al. (2010) reported spillover effects on five native grasses that
co-occur with cheatgrass: Indian ricegrass (Achnatherum hymenoides), squirreltail
(Elymus elymoides), needle and thread (Hesperostipa comate), Sandberg bluegrass (Poa
secunda), and bluebunch wheatgrass. Of these grasses, bluebunch wheatgrass, Sandberg
bluegrass, and Indian ricegrass experienced 35-80% P. semeniperda-caused seed
mortality (Beckstead et al. 2010).
To mitigate spillover effects on native grasses, P. semeniperda could be applied
where pure cheatgrass monocultures exist, especially in situations where revegetation is
necessary. Grass species with low susceptibility to P. semeniperda could be used for
revegetation, or seeds could be treated with a fungicide prior to seeding (Miller et al., in
preparation, Meyer et al. 2008a). The risks associated with spillover effects must be
evaluated against the benefits of using P. semeniperda as a biological control. Cheatgrass
seed mortality can reach > 90% due to P. semeniperda infection, which may provide
seeded desirable species the chance to establish in cheatgrass-infested rangeland
(Beckstead et al. 2010).
Pyrenophora semeniperda has potential as a biological control agent, but further
research is necessary to overcome the limitations of mass production, environmental
constraints, and spillover effects. This pathogen integrated with other management tools
like herbicides and revegetation will potentially improve control of one of the most

19 problematic annual grasses on western rangeland. Combining herbicides and P.
semeniperda may be beneficial because neither tool used alone has proven one hundred
percent effective. To my knowledge, no studies exist that have investigated integrating
chemical and biological control for cheatgrass.
Project Justification and Objectives
Improving invasive plant management with integrated management techniques,
such as herbicides and biological controls, has been recognized as a sustainable and
economic approach to aggressive invaders like cheatgrass (DiTomaso 2000, DiTomaso et
al. 2010, Krueger-Mangold et al. 2006, Masters and Sheley 2001). This project focused
on the use of imazapic and the fungal pathogen Pyrenophora semeniperda for control of
cheatgrass in Montana. The first study investigated imazapic efficacy as affected by
application rate and timing and plant litter. The second study determined imazapic
persistence in the soil as affected by application rate and plant litter. The third study
integrated imazapic application with P. semeniperda inoculation to determine whether
the two methods produced a response that would lead to greater cheatgrass control than
either method alone.

20
CHAPTER TWO
EFFECTS OF IMAZAPIC RATE, APPLICATION TIMING, AND PLANT LITTER
ON CHEATGRASS-INFESTED RANGE AND CRP LANDS
Introduction
The invasion of cheatgrass (Bromus tectorum) is one of the most significant plant
invasions in North America, with 22.3 million infested hectares in 17 western states (Rice
2005). Cheatgrass has been problematic in the Great Basin and more recently in Montana
where its expansion may be enhanced even further in the future because of global climate
change (Bradley 2009). The impacts of cheatgrass on rangelands include a reduction in
plant community diversity, altered fire regimes, economic losses, and an unpredictable
forage base for livestock and wildlife (BLM 1999, Epanchin-Niell et al. 2009, Hull 1965,
Klemmedson and Smith 1964, Leger 2008, Murray et al. 1978, Peters and Bunting 1994,
Rice 2005, Whisenant 1990). Improved cheatgrass management can reduce the ecological
and economic impacts associated with large-scale infestations.
Cheatgrass can outperform many native plants due to its prolific seed production
(Humphrey and Schupp 2001), carryover seed bank (Harmon et al. 2012), and effective
use of soil moisture (Pellant 1996) and nutrients (Chambers et al. 2007, Harris 1967,
James 2008b, Sperry et al. 2006, Stewart and Hull 1949, Vasquez et al. 2008). As a
winter annual, cheatgrass usually germinates in the fall after primary seed dormancy
ends. However, in Montana’s semiarid climate where moisture is sometimes scarce in the
fall, a significant fraction of the cheatgrass seed bank may not germinate until the spring

21 when rainfall becomes more plentiful. The ability to continually germinate from the fall
through the spring makes control of this weed particularly difficult.
Chemical control of cheatgrass on western rangelands has recently focused on
imazapic (Plateau®, BASF Corporation 2008), a member of the imidazolinone herbicide
family (Davison and Smith 2007, Elseroad and Rudd 2011, Morris et al. 2009). Imazapic
is an acetolacetate synthase (ALS) inhibitor that is absorbed through leaves, stems, and
roots (BASF Corporation 2008, Peterson et al. 2010). It is currently labeled for both
foliar (post-emergent) and soil applications (pre-emergent), although results from
preliminary trials have revealed improved efficacy with post-emergent application
relative to pre-emergent application (Mangold et al., in review). Reduced efficacy of pre-
emergent application may be due to surface plant litter that often accumulates at
cheatgrass-infested sites. Surface litter may serve as sorption sites for herbicide resulting
in less contact with cheatgrass seedlings. Actions to reduce plant litter, including
prescribed fire, increase the efficacy of imazapic (Calo et al. 2012, DiTomaso et al. 2006,
Sheley et al. 2007). However, direct contact between imazapic and foliage is more likely
to occur once seedlings have emerged, compared to pre-emergent applications, regardless
of the presence of surface plant litter.
Optimal imazapic application rates for cheatgrass control have not been reviewed
in detail in the literature. Recommended ates of 40 to 240 g active ingredient (a.i.) ha-1 (2
to 12 oz. product ha-1) are on the Plateau® label (BASF Corporation 2008). Morris et al.
(2009) reported that as imazapic rate increased, cheatgrass cover decreased; this
response, though, was dependent on year and site characteristics including precipitation,

22 soil organic matter, and disturbance history. Kyser et al. (2007) found that control of
medusahead (Taeniatherum caput-medusae) and other annual grasses, including
cheatgrass, increased as imazapic rate increased. Imazapic efficacy was improved by
reducing the litter layer with tillage, mowing and raking, or burning, suggesting that
imazapic was adsorbing to plant litter (Kyser et al. 2007). Lack of consensus on an
optimal imazapic application rate, especially as it relates to site characteristics, likely
contributes to the variable cheatgrass control that often occurs with imazapic use.
The objective of this study was to test the effect of imazapic application rate and
timing, and plant litter on cheatgrass control and desired plant species in range and
Conservation Reserve Program (CRP) lands. It was predicted that greater cheatgrass
control and an increase in desired perennial grasses and forbs would occur with
increasing imazapic application rate. Further, greater cheatgrass control would occur
when plant litter was reduced. Lastly, it was hypothesized that early post-emergent
application of imazapic would result in greater cheatgrass control and an increase in
desired perennial grasses and forbs relative to late post-emergent application.
Materials and Methods
Site Description
Field studies were conducted over two years at a rangeland site 35 km south of
Big Timber, Montana (45° 35’ 45.01”, -110° 10’ 28.23”), and a CRP site 23 km south of
Havre, Montana (48° 27’ 9.59”, -109° 52’ 33.42”). Soil at Big Timber is a Winspect
cobbly loam (Typic Calciustoll) and has a pH of 6.6. Mean annual precipitation and air
temperature are 387 mm and 7.2°C, respectively. Soil at Havre is an Evanston loam

23 (Aridic Agriustoll) and has a pH of 7.1. Mean annual precipitation is 295 mm, and air
temperature is 5°C.
Weather Data
Monthly precipitation data from 1894-2012 (Big Timber) and 1961-2012 (Havre)
were compiled from the Western Regional Climate Center (NCDC 2002). Observations
were taken from stations located at Big Timber, Montana (Big Timber) and Havre
Weather Service Office (WSO), Havre, Montana (Havre).
Experimental Design
Two experiments were established at each field site. Experiment I (Rate x Litter)
consisted of a factorial combination of four imazapic application rates (0, 80, 160, and
240 g a.i. ha-1; hereafter referred to as control, low, medium, and high) and two litter
treatments (reduced, ambient). The experiment was arranged in a randomized split-block
design with imazapic rate as the whole plot (18.3 m x 3.0 m), and litter treatment as the
subplot (9.1 m x 3.0 m), with four replications. The reduced litter treatment was achieved
by hand raking with a lawn rake immediately prior to imazapic application. The ambient
litter treatment was undisturbed.
Experiment II (Rate x Timing) consisted of a factorial combination of four
imazapic application rates (0, 80, 160, and 240 g a.i. ha-1; hereafter referred to as control,
low, medium, and high) and two application timings (early, late). Early application
occurred when cheatgrass seedlings had one to two leaves, on average; late application
occurred when cheatgrass seedlings had three to four leaves, on average. The experiment
was arranged in a randomized split-block design with imazapic rate as the whole plot

24 (18.3 m x 3.0 m), and application timing as the subplot (9.1 m x 3.0 m), with four
replications. Experiments I and II were run over two years (2011, 2012) at different
locations within the same fields.
Herbicide Applications
Imazapic was applied as Plateau® (BASF Corporation 2008). The herbicide was
mixed with water plus the non-ionic surfactant (0.10% volume/volume) Penetrator®
(Helena Chemical Company) and applied using a CO2 backpack sprayer delivering 157 L
ha-1 water at 3 kg cm-2 pressure across a boom width of 3 m. Date of application,
cheatgrass growth stage, and weather conditions at the time of imazapic application for
Experiment I and Experiment II are summarized in Table 2.1. Experiment I herbicide
applications corresponded with the early application for Experiment II.

25
Table 2.1. Application date, cheatgrass growth stage, and weather conditions for Experiment I (Rate x Litter) and Experiment II (Rate x Timing) at Big Timber and Havre
for 2011 and 2012. Experiment I herbicide applications corresponded with the early application for Experiment II.
Timing Date Growth Stage Weather ConditionsEarly 9/29/2010 1-2 leaf 1.0 km hr-1 wind
10˚C63% rel. humidity
Late 10/18/2010 1-2 leaf 5.0 km/hr wind13˚C
29% rel. humidity
Timing Date Growth Stage Weather ConditionsEarly 9/23/2010 1-2 leaf 1.0 km hr-1 wind
17˚C51% rel. humidity
Late 10/12/2010 3-4 leaf 0 km hr-1 wind14˚C
33% rel. humidity
Timing Date Growth Stage Weather ConditionsEarly 9/20/2011 Pre-emergent 8.0 km hr-1 wind
8˚C62% rel. humidity
Late 10/18/2011 1-2 leaf 7 km hr-1 wind-1˚C
54% rel. humidity
Timing Date Growth Stage Weather ConditionsEarly 9/28/2011 1-2 leaf 6.0 km hr-1 wind
18˚C23% rel. humidity
Late 10/13/2011 3-4 leaf 2.0 km hr-1 wind4˚C
66% rel. humidity
Havre
Big Timber2011
Big Timber
Havre
2012

26 Vegetation Sampling
Vegetation sampling occurred 36-42 weeks post-herbicide application for both
years of Experiment I and Experiment II (Table 2.2). Sampling dates corresponded to
proximate peak standing crop, except at Big Timber in 2012 where cheatgrass was
starting to drop seed due to droughty conditions. Foliar cover was recorded by species in
three 20 x 50 cm frames (Daubenmire 1959) randomly placed within each sub-plot, and
then species’ data were placed into functional groups for analysis. Biomass was clipped
by functional group from the same Daubenmire frames used to estimate percent cover.
Biomass was dried at 65°C for a minimum of 72 hours at the Plant Growth Center,
Montana State University, Bozeman, MT, USA Functional groups included cheatgrass
(BRTE), perennial grasses (PG), exotic perennial forbs (EPF), and native perennial forbs
(NPF). Species found at each site are listed by functional group in Table 2.3.
Statistical Analysis
Analysis of variance (ANOVA) of cover and biomass were performed using Proc
Mixed in SAS 9.3 (SAS Institute Inc. 2012, Appendix A). Sites were analyzed separately
for Experiment I and II. For Experiment I (Rate x Litter), year (2011, 2012) and imazapic
application rate (control, low, medium, and high) were treated as fixed effects. For
Experiment II (Rate x Timing), year, imazapic application rate and application timing
(early, late) were treated as fixed effects. Block was a random effect for both
experiments. Means separations tests were performed using the PDIFF option in the
LSMEANS statement when the main effects or interactions were significant at ɑ < 0.05.

27
Table 2.2. Vegetation sampling date, application timing from the previous year, and weeks post-herbicide application for Experiment I (Rate x Litter) and Experiment II (Rate
x Timing) at Big Timber and Havre for 2011 and 2012. Experiment I weeks post-application corresponded with the early application timing for Experiment II.
Sampling Date Timing Weeks Post-ApplicationEarly 40Late 37
Sampling Date Timing Weeks Post-ApplicationEarly 42Late 39
Sampling Date Timing Weeks Post-ApplicationEarly 41Late 37
Sampling Date Timing Weeks Post-ApplicationEarly 39Late 37
6/25 - 6/27/2012
7/2 - 7/3/2012
7/11 - 7/13/2011
Big Timber
Havre
7/5 - 7/8/2011
2011
2012
Havre
Big Timber
Results
Climate (Average Precipitation)
At Big Timber, precipitation for September 2010 – August 2011 fluctuated
throughout the year and was consistently higher than the long-term average from
February – May 2011 (Figure 2.1a). Average monthly precipitation for September 2011 –
May 2012 aligned closely with the long-term average, but was lower than the long-term
average for June – August 2012. Additionally, precipitation for September 2011 – May
2012 was lower than that for September 2010 – August 2011.

28
Table 2.3. Species found at each site by plant functional group. An “X” in the column under a site indicates that the species was found at that site.
Scientific Name Big Timber Havre
Agropyron cristatum - XBromus inermis - XKoeleria macrantha X XPascopyrum smithii (Agropyron smithii) X XPoa compressa X XPoa secunda X XPseudoroegneria spicata (Agropyron spicata) X XStipa comata - -Stipa viridula X -Leymus cinereus - X
Medicago sativa X XCirsium arvense X -Cynoglossum officinale X -Taraxacum officinale X XTragopogon dubius X X
Arabis drummondii X -Artesima fridgida X XArtemisia ludoviciana X -Astragalus adsurgens (Astragalus laxmannii) X -Comandra umbellata X -Liatris spp. X -Liatris punctata X -Phlox spp. X -Potentilla pensylvanica X -Psoralea tenuiflora (Psoralidium tenuiflorum) X -Sphaeralcea grossulariifolia X XVicia americana X -Lygodesmia spp. X -
Perennial Grasses (PG)
Native Perennial Forbs (NPF)
Exotic Perennial Forbs (EPF)

29
Month
Sept. Oct.Nov.
Dec.Jan.
Feb.March
April MayJune July Aug.
Prec
ipita
tion
(mm
)
0
50
100
150
200
250
Long-term Average Sept. 2010 - Aug. 2011 Sept. 2011 - Aug. 2012
a) Big Timber.
Month
Sept. Oct.Nov.
Dec.Jan.
Feb.March
April MayJune July Aug.
Prec
ipita
tion
(mm
)
0
20
40
60
80
100Long-term Average Sept. 2010 - Aug. 2011 Sept. 2011 - Aug. 2012
b) Havre. Figure 2.1. Precipitation for the long-term average, September 2010-August 2011, and September 2011-August 2011 for Big Timber and Havre.

30 At Havre, monthly average precipitation varied for September 2010 – August
2011, and was generally higher than the long-term average (Figure 2.1b). Monthly
average precipitation for September 2011 – February 2012 was lower than the long-term
average, and increased during the spring from March – May 2012. During the summer
from June – August 2012, the monthly average precipitation was lower than the long-
term average.
Experiment I. – Rate x Litter
Cheatgrass (BRTE) At Big Timber, the interaction of imazapic rate, litter, and
year influenced BRTE cover (P = 0.0064) and biomass (0.0426) (Table 2.4). Cheatgrass
cover was higher in 2011 than 2012. In 2011, reduced litter resulted in similar BRTE
cover in the control (43%) and low (34%) imazapic rate treatments; cover was lower and
similar in the medium (19%) and high (16%) imazapic rate treatments (Figure 2.2). This
differed from ambient litter, which resulted in similar BRTE cover in the control, low and
high imazapic rate treatments (19, 24, and 15%, respectively); cheatgrass cover was
highest at 33% in the medium imazapic rate treatment. In 2012, reduced litter had similar
BRTE cover across all imazapic rates. Cheatgrass cover in ambient litter was highest in
the control at 23%; cheatgrass cover was similarly decreased by the low, medium, and
high imazapic rate treatments.

31
Table 2.4. Experiment I – Rate x Litter. P-values from ANOVA on functional group cover and biomass at Big Timber and Havre.
Fixed effects df BRTE PG EPF NPFYear 1 < 0.0001 0.6561 0.6077 0.0356Litter 1 0.8915 0.3579 0.0805 0.3772Rate 3 < 0.0001 0.0827 0.1462 0.1298Litter x Year 1 0.1181 0.6777 0.4319 0.9426Rate x Year 3 0.1232 0.7924 0.5632 0.0557Rate x Litter 3 0.1060 0.2610 0.8305 0.0798Rate x Litter x Year 3 0.0064 0.0691 0.9404 0.9834
Fixed effects df BRTE PG EPF NPFYear 1 < 0.0001 0.4934 0.8587 0.0640Litter 1 0.2025 0.9626 0.0617 0.8923Rate 3 0.0006 0.2060 0.4098 0.4811Litter x Year 1 0.1712 0.3906 0.9447 0.6987Rate x Year 3 0.0588 0.7786 0.9730 0.1324Rate x Litter 3 0.6706 0.4902 0.4016 0.1042Rate x Litter x Year 3 0.0426 0.2997 0.9731 0.4286
Fixed effects df BRTE PG EPF NPFYear 1 0.2453 0.0219 0.1463 N/SLitter 1 0.1086 0.6663 0.7286 N/SRate 3 < 0.0001 0.3691 0.4832 N/SLitter x Year 1 0.5983 0.0803 0.7286 N/SRate x Year 3 0.1422 0.0625 0.4173 N/SRate x Litter 3 0.0523 0.1243 0.6455 N/SRate x Litter x Year 3 0.5130 0.0638 0.8468 N/S
Fixed effects df BRTE PG EPF NPFYear 1 0.1982 0.0008 0.2763 N/SLitter 1 0.1003 0.5174 0.0537 N/SRate 3 0.0006 0.8388 0.7392 N/SLitter x Year 1 0.0924 0.4363 0.0817 N/SRate x Year 3 0.0766 0.8369 0.1157 N/SRate x Litter 3 0.1594 0.4533 0.2492 N/SRate x Litter x Year 3 0.0167 0.3485 0.2515 N/S
HavreCover
Biomass
Big TimberCover
Biomass
Functional groups indicated as follows: cheatgrass (BRTE), perennial grasses (PG), exotic perennial forbs (EPF), and native perennial forbs (NPF). N/S signifies a non-significant model because of the infrequent
occurrence of observations.

32
Che
atgr
ass
Cov
er (%
)
0
10
20
30
40
50Control Low Medium High
Litter Treatment
2011 2012
Reduced Ambient Reduced Ambient
Figure 2.2. Cheatgrass cover as affected by year, imazapic rate, and litter at Big Timber for Experiment I (Rate x Litter). Error bars indicate 1 SE of the mean. Lower case letters indicate means that are different within a litter treatment for each year. An “*” indicates means that are different between litter treatments across an imazapic rate for each year.
Similar to cover, cheatgrass biomass at Big Timber was higher in 2011 than 2012.
In the reduced litter treatment, BRTE biomass decreased as imazapic rate increased.
Biomass was reduced by about 30, 60, and 80%, in the low, medium and high imazapic
rate treatments, respectively, compared to the control (Figure 2.3). Similar results
occurred in ambient litter in 2011 where BRTE biomass decreased with increasing
imazapic rate, although the relationship was not as strong. In 2012, reduced litter had
* b
b
* a
* a a
* b
ab
a
a
a
a
a a a a
b
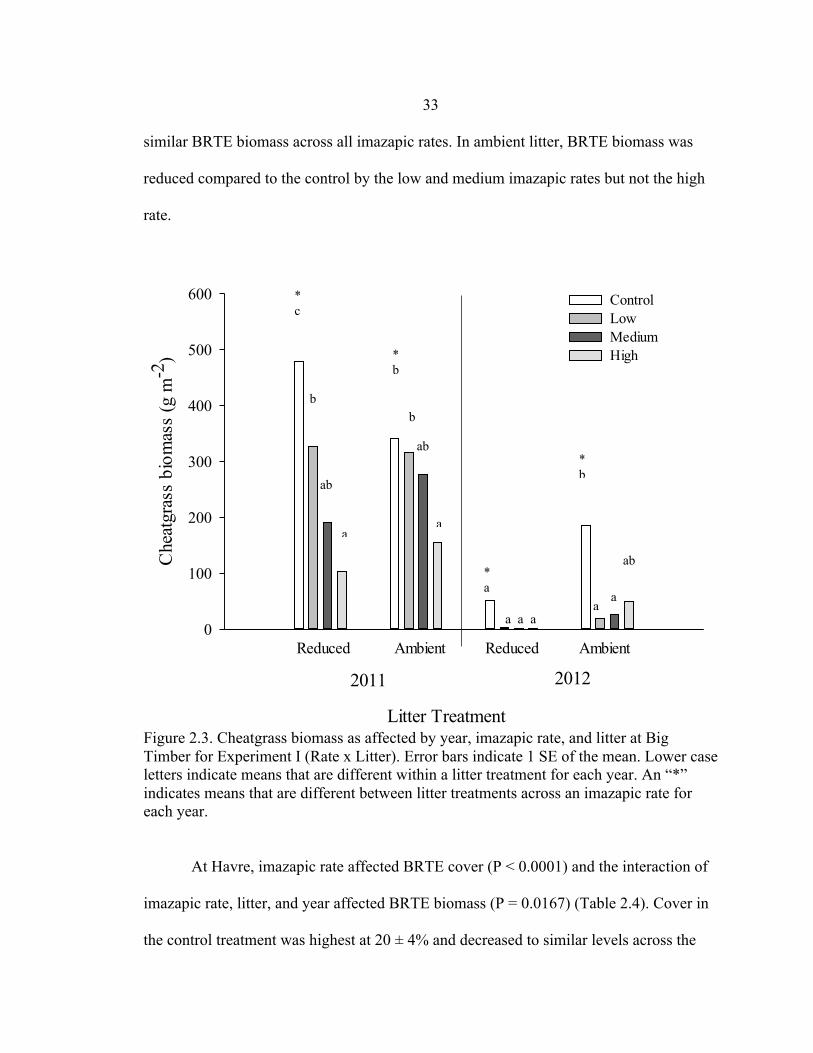
33 similar BRTE biomass across all imazapic rates. In ambient litter, BRTE biomass was
reduced compared to the control by the low and medium imazapic rates but not the high
rate. C
heat
gras
s bi
omas
s (g
m-2
)
0
100
200
300
400
500
600 Control Low Medium High
Litter Treatment
2011 2012
Reduced Ambient Reduced Ambient
Figure 2.3. Cheatgrass biomass as affected by year, imazapic rate, and litter at Big Timber for Experiment I (Rate x Litter). Error bars indicate 1 SE of the mean. Lower case letters indicate means that are different within a litter treatment for each year. An “*” indicates means that are different between litter treatments across an imazapic rate for each year.
At Havre, imazapic rate affected BRTE cover (P < 0.0001) and the interaction of
imazapic rate, litter, and year affected BRTE biomass (P = 0.0167) (Table 2.4). Cover in
the control treatment was highest at 20 ± 4% and decreased to similar levels across the
b b
* c
* b
ab
a
ab * a
a a a
* b
ab
a
aa

34 low, medium, and high imazapic rate treatments (3 ± 1, 1 ± 0, and 0 ± 0%, respectively).
Reduced and ambient litter treatments resulted in similar trends for BRTE biomass in
2011; biomass exhibited a trend of decreasing biomass with increasing imazapic rate,
however statistically the means for the low, medium, and high imazapic rates were not
different from each other (Figure 2.4). In 2012, the reduced and ambient litter treatments
resulted in similar BRTE biomass across all imazapic rates.
Che
atgr
ass
Biom
ass
(g m
-2)
0
200
400
600
800
1000 Control Low Medium High
Litter Treatment
2011 2012
Reduced Ambient Reduced Ambient
Figure 2.4. Cheatgrass biomass as affected by year, imazapic rate, and litter at Havre for Experiment I (Rate x Litter). Error bars indicate 1 SE of the mean. Lower case letters indicate means that are different within a litter treatment for each year. An “*” indicates means that are different between litter treatments across an imazapic rate, for each year.
* b
a
a a
* b
a a a
a
a a a
a
a
a a

35 Perennial Grasses (PG) Perennial grass cover and biomass were not affected by
treatments at Big Timber (Table 2.4). At Havre, year influenced PG cover (P = 0.0219)
and biomass (P = 0.0008) (Table 2.4). Perennial grass cover in 2011 was 12 ± 2%, which
was three times higher than it was in 2012 (4 ± 1%). The same trend occurred for PG
biomass, which was nearly 20 times higher in 2011 (829.2 ± 170.3 g m-2) compared to
2012 (42.3 ± 15.4 g m-2).
Exotic Perennial Forbs (EPF) Exotic perennial forb cover and biomass were not
affected by treatments at either site (Table 2.4).
Native Perennial Forbs (NPF) At Big Timber, NPF cover was affected by year (P
= 0.0356, Table 2.4). Native perennial forb cover in 2011 was 9 ± 1%, and decreased to 5
± 1% in 2012. Infrequent occurrence of NPF at Havre resulted in non-significant models
for cover and biomass.
Experiment II. – Rate x Timing
Cheatgrass (BRTE) Cheatgrass cover was affected by year and imazapic rate (P =
0256 and 0.0029, respectively) and biomass (P = 0.0002 and 0.0005, respectively) at Big
Timber (Table 2.5). Cheatgrass cover was lower in 2012 than in 2011 (8 ± 3% versus 25
± 3%). Cheatgrass cover decreased from 28 ± 4% in the control treatment to similar
levels in the low (13 ± 5%), medium (14 ± 4%), and high (10 ± 3%) imazapic rate
treatments, across years. Similar trends occurred for cheatgrass biomass. Cheatgrass
biomass decreased from 268.5 ± 29.9 g m-2 in 2011 to 37.2 ± 9.6 g m-2 in 2012. Biomass
decreased compared to the control (249.95 ± 39.28 g m-2) as imazapic rate increased,

36 with the low, medium, and high imazapic rates resulting in similar BRTE biomass, across
years (144.1 ± 47.2, 133.3 ± 46.6, and 83.9 ± 27.0 g m-2, respectively).
Table 2.5. Experiment II – Rate x Timing. P-values from ANOVA on functional group cover and biomass at Big Timber and Havre.
Fixed effects df BRTE PG EPF NPFYear 1 0.0256 0.0065 0.7682 0.0216Timing 1 0.4431 0.1411 0.8287 0.7598Timing x Year 1 0.2176 0.7618 0.1132 0.7414Rate 3 0.0029 0.0283 0.2478 0.9680Rate x Year 3 0.1125 0.2263 0.8915 0.0863Rate x Timing 3 0.4758 0.7489 0.8379 0.6278Rate x Timing x Year 3 0.4780 0.7356 0.1317 0.2920
Fixed effects df BRTE PG EPF NPFYear 1 0.0002 0.0014 0.0794 0.3319Timing 1 0.2672 0.0534 0.8325 0.4750Timing x Year 1 0.1599 0.6727 0.2117 0.3939Rate 3 0.0005 0.0338 0.3577 0.7837Rate x Year 3 0.4211 0.1265 0.7245 0.2309Rate x Timing 3 0.0875 0.5505 0.6519 0.4593Rate x Timing x Year 3 0.1043 0.5484 0.7651 0.9686
Fixed effects df BRTE PG EPF NPFYear 1 < 0.0001 0.2475 0.0215 N/STiming 1 0.2012 0.3862 0.1891 N/STiming x Year 1 0.2156 0.0532 0.1080 N/SRate 3 < 0.0001 0.7221 0.7000 N/SRate x Year 3 < 0.0001 0.5341 0.7631 N/SRate x Timing 3 0.0124 0.1907 0.6794 N/SRate x Timing x Year 3 0.0105 0.1761 0.5948 N/S
Fixed effects df BRTE PG EPF NPFYear 1 0.0013 0.1541 0.0819 N/STiming 1 0.7943 0.0208 0.2479 N/STiming x Year 1 0.9915 0.1125 0.2011 N/SRate 3 0.2816 0.6888 0.3435 N/SRate x Year 3 0.4672 0.4428 0.2533 N/SRate x Timing 3 0.0682 0.1140 0.5529 N/SRate x Timing x Year 3 0.1484 0.6467 0.5861 N/S
HavreCover
Biomass
Big TimberCover
Biomass
Functional groups indicated as follows: cheatgrass (BRTE), perennial grasses (PG), exotic perennial forbs (EPF), and native perennial forbs (NPF). N/S signifies a non-significant model because of the infrequent
occurrence of observations.

37 At Havre, year, imazapic rate, and timing interacted to influence cheatgrass cover
(P = 0.0105) (Table 2.5). In 2011, the early application was more effective in reducing
BRTE cover than the late application (Figure 2.5). In the early application treatment, all
imazapic rates reduced BRTE cover below that of the control. With the late application,
only the high imazapic rate reduced BRTE cover below that of the control. In 2012,
BRTE cover was zero regardless of imazapic rate or timing.
Che
atgr
ass
Cov
er (%
)
0
20
40
60
80
100 Control Low Medium High
Application Timing
2011 2012
Early Late Early Late
Figure 2.5. Cheatgrass cover as affected by year, imazapic rate, and application timing at Havre for Experiment II (Rate x Timing). Error bars indicate 1 SE of the mean. Lower case letters indicate means that are different within a litter treatment for each year. An “*” indicates means that are different between litter treatments across an imazapic rate, for each year.
a a a a
a a a a
* b * *
ab b
a
* b
* * a a a

38 Perennial Grasses (PG) At Big Timber, the main effects of year and imazapic rate
influenced PG cover (P = 0.0065 and 0.0283, respectively) and biomass (P = 0.0014 and
0.0338) (Table 2.5). Perennial grass cover was approximately two times higher in 2011
(14 ± 1%) than it was in 2012 (6 ± 1%). Perennial grass cover was 6 ± 1% in the control
treatment. Applying imazapic at any rate doubled PG cover to 12 ± 2% in the low
imazapic rate treatment and 11 ± 2% in the medium and high imazapic rate treatments.
Similar trends occurred for PG biomass. In 2011 PG biomass was approximately two
times higher than it was in 2012 (181.3 ± 14.1 g m-2 versus 78.0 ± 12.4 g m-2,
respectively). Biomass was similar in the low, medium, and high imazapic rate treatments
(141.2 ± 29.7, 143.0 ± 18.1, 148.6 ± 22.4 g m-2, respectively), which were all higher than
the control (85.7 ± 16.9 g m-2).
Perennial grass cover at Havre was not affected by imazapic rate or timing
treatments, however, PG biomass was influenced by timing (P = 0.0208, Table 2.5). The
late application (534.0 ± 115.2 g m-2) doubled PG biomass relative to the early
application (261.4 ± 34.7 g m-2).
Exotic Perennial Forbs (EPF) Treatments did not effect EPF cover and biomass at
Big Timber; however, EPF cover at Havre was affected by year (P = 0.0215, Table 2.5).
There was no EPF cover in 2011; in 2012, EPF cover increased to 5 ± 1%.
Native Perennial Forbs (NPF) Native perennial forb cover was influenced by year
(P = 0.0216, Table 2.5) at Big Timber. In 2011, NPF cover was 13 ± 1%, which
decreased to 7 ± 1% in 2012. At Havre, infrequent occurrence of NPF resulted in non-
significant models for cover and biomass.

39
Discussion
Successful chemical control of cheatgrass in rangeland and CRP is dependent on
understanding herbicide efficacy as it relates to application rate and timing and plant
litter. Imazapic rate influenced cheatgrass control at both Big Timber and Havre for
Experiments I (Rate x Litter) and II (Rate x Timing). For Experiment I, cheatgrass cover
at Big Timber was highly variable; however, cheatgrass biomass decreased as imazapic
rate increased. At Havre, the low, medium, and high imazapic rates were equally
effective in reducing cheatgrass biomass. Few differences were seen among imazapic
rates at either site in 2012, which may be attributed to minimal cheatgrass presence even
in the control treatment. These results demonstrate the year-to-year variation in
cheatgrass populations that can be associated with site characteristics such as
precipitation, temperature regimes, disturbance, and competitive abilities of co-occurring
species (Chambers et al. 2007).
For Experiment II, the low, medium, and high imazapic rates were equally
effective in reducing cheatgrass cover and biomass at Big Timber. This was also the case
at Havre for the early application in 2011, however, only the high imazapic rate reduced
cheatgrass cover below that of the control for the late application. In general, cheatgrass
control was achieved even with a low imazapic rate, which reduces the potential of non-
target injury. If application is delayed (i.e. late post-emergent versus early post-emergent)
then higher imazapic rates may be warranted. Further, similar to Experiment I, there was
minimal cheatgrass presence at Big Timber and Havre in 2012, again demonstrating the
year-to-year variation in cheatgrass populations.

40 Annual variability in precipitation timing and amount greatly influences
cheatgrass establishment and growth (Mack and Pyke 1983, Miller et al. 2006,
Schwinning and Ehleringer 2001). For example, precipitation patterns from the previous
year regulated the size and persistence of cheatgrass carryover seed banks in semiarid
sites in western Utah (Smith et al. 2008). Smith et al. (2008) state that above-average
precipitation resulted in higher seed production, which in turn would likely lead to greater
cheatgrass populations, which is what occurred in my experiment at both sites in 2011.
Cheatgrass emergence in the fall and growth the following spring depend on
precipitation. While variable at both sites, monthly average precipitation in fall 2010 and
March – May 2011 was near or higher than the long-term average, accounting for higher
cheatgrass presence in 2011. During fall 2011, average monthly precipitation was lower
than the long-term average, which may have resulted in much lower cheatgrass in
summer 2012.
Precipitation patterns may also explain the response of perennial grasses at Havre
in 2011. Perennial grasses typically rely on precipitation for the current spring and
summer in which they are actively growing, instead of precipitation from the previous
fall (Cable 1975). Consequently, lower average monthly precipitation during the summer
months explains the decrease in perennial grasses, even though cheatgrass was generally
controlled with imazapic. Furthermore, the increase in perennial grasses at Havre in 2011
may be associated with higher than average precipitation that occurred in June at this site.
However, precipitation patterns are not solely responsible for increases in perennial
grasses, as perennial grasses increased at Big Timber as a result of imazapic application.

41
Litter treatment had little effect on cheatgrass control, suggesting that decreasing
plant litter will not necessarily increase the efficacy of imazapic. This conflicts with
studies investigating medusahead and other annual grass control, which have
demonstrated increased control with imazapic when it is applied after a prescribed burn
(Davies 2010, Monaco et al. 2005, Sheley et al. 2007). In Experiment I, litter was
reduced by manual raking, which may not be as effective as prescribed burning in terms
of increasing physical contact between the herbicide and targeted plant (Calo et al. 2012,
Sheley et al. 2007, DiTomaso et al. 2006). Moreover, the effect of litter was only visible
in the non-sprayed control plots, suggesting that litter manipulation by manual raking
may influence microsite conditions to be more favorable to cheatgrass growth.
My results suggest that imazapic efficacy can be improved by properly
implementing the correct application timing. There was no influence of application
timing on cheatgrass control at Big Timber; however, the targeted application timings
were not as well-achieved at Big Timber as they were at Havre (Table 2.1). Application
timing was more significant at Havre where both the early and late application occurred
at the targeted cheatgrass growth stage. In 2011, the early application resulted in better
cheatgrass control than the late application, and control was more consistent across rates.
This coincides with results from other trials in Montana, which suggested improved
efficacy with early post-emergent (1-2 leaves) application relative to late post-emergent
(3-4 leaves) application (Mangold et al., in review). In a study investigating the use of
glufosinate for annual weed control, growth stage influenced herbicide efficacy; water
soluble herbicides can penetrate the cuticle of younger plants more effectively than older

42 plants (Steckel et al. 1997). Early post-emergent application offers the added benefit of
treating cheatgrass once it is visible and land managers can be more confident that
cheatgrass will be present the following growing season. This is in contrast to pre-
emergent application where land managers risk applying herbicide even though
cheatgrass may not emerge because of unfavorably dry fall conditions.
Implications
Overall, the findings of these experiments provide evidence that successful
control of cheatgrass in Montana can occur with imazapic application; however, results
are highly dependent on the annual variability of cheatgrass populations, which is linked
to seasonal precipitation. Findings from this study suggest that all imazapic rates perform
similarly, providing land managers with an economically viable option of applying a low
imazapic rate (~80 g a.i. ha-1). In addition, early application of imazapic is recommended,
as it provides more consistent cheatgrass control. Finally, surface litter removal is likely
to have little or no impact on imazapic efficacy and cheatgrass control.
Although imazapic provided cheatgrass control, the annual variability in
cheatgrass populations raises concerns about being able to predict the appropriate
imazapic rate to apply or whether herbicide application is necessary at all. More long-
term (> 2 years) research is needed to address the annual variability in cheatgrass
populations. Consequently, future research should incorporate climate data, specifically
precipitation, into models that are capable of forecasting cheatgrass populations. Doing
so would help land managers prioritize areas for management (Maxwell et al. 2009, Rew
et al. 2005) and reduce costs associated with cheatgrass control. Furthermore, future

43 research should also focus on other tools that may either overcome herbicide limitations
(i.e. when/if to spray, rates to spray), or augment herbicide efficacy in the field. Other
tools that could be incorporated into cheatgrass management include biological controls,
as well as their integration with herbicides.

44
CHAPTER THREE
IMAZAPIC PERSISTENCE IN A SEMIARID CLIMATE AT CHEATGRASS-
AFFECTED RANGELAND AND CRP SITES
Introduction
The invasion of cheatgrass (Bromus tectorum) is considered one of the most
significant plant invasions in North America with 22.3 million infested hectares in 17
western states (Rice 2005). Cheatgrass has been problematic in the Great Basin, and more
recently in Montana, where its expansion may be enhanced in the future by global
climate change (Bradley 2009). As a winter annual, cheatgrass germinates in the fall after
primary seed dormancy ends, overwinters as a seedling and resumes growth in the early
spring (Mack and Pyke 1983, Pellant 1996). The impacts of cheatgrass on rangelands
include a reduction in plant community diversity, altered fire regimes, economic losses,
and an unpredictable forage base for livestock and wildlife (BLM 1999, Epanchin-Niell
et al. 2009, Hull 1965, Klemmedson and Smith 1964, Leger 2008, Murray et al. 1978,
Peters and Bunting 1994, Rice 2005, Whisenant 1990).
Chemical control of cheatgrass on rangelands has recently focused on imazapic
(Plateau®, BASF Corporation 2008), a member of the imidazolinone herbicide family
(Davison and Smith 2007, Elseroad and Rudd 2011, Morris et al. 2009). Imazapic is an
acetolacetate synthase (ALS) inhibitor that is absorbed through leaves, stems, and roots
(BASF Corporation 2008, Peterson et al. 2010). It is currently labeled for both foliar
(post-emergent) and soil (pre-emergent) applications. Field trials in Montana have

45 revealed post-emergent applications are more effective than pre-emergent applications
(Mangold et al., in review). Reduced efficacy of pre-emergent applications may be a
result of herbicide sorption to surface plant litter that often accumulates at cheatgrass
affected sites. Disagreement between field results and label recommendations for
imazapic suggest the need for an investigation into the factors influencing efficacy,
including persistence in soils of Montana’s semiarid climate.
Imazapic persistence has been studied under a range of conditions and is often
linked to soil properties. Imidazolinone persistence increases as soil pH decreases (pH 4.5
to 6.5) (Loux and Reese 1992). In addition, imazapic persistence increases in soils with
high clay and soil organic matter content (Colquhoun 2006, Ulbrich et al. 2005), because
of increased adsorption which decreases availability for microbial degradation (Loux and
Reese 1992). Imazapic persistence has been studied extensively in cropping systems for
the purpose of determining rotation restrictions. In Brazil, imazapic persistence reduced
yield of a non-tolerant genotype of rice at 371 days post-application and plant injury was
evident up to 705 days post-application (Marchesan et al. 2010). Marchesan et al. (2010)
explained that the pronounced persistence of imazapic may be attributed to the saturated
nature and low pH (4.5) of the soils in their study system. In Georgia, only four months
was required for imazapic to degrade sufficiently such that oat production was not
affected; this likely occurred because the study was conducted under irrigated conditions,
which when combined with rainfall, exceeded the long-term rainfall averages (~540 mm)
(Prostko et al. 2005). In the cooler and more arid climate of Alberta, Canada,

46 imidazolinone herbicides reduced yields of rotational crops that were seeded one year
post-application (Moyer and Esau 1996).
Soil bioassays are a common method used to assess herbicide persistence
(Cobucci et al. 1998, Eberle and Gerber 1976, Streibig 1988). A soil bioassay is defined
as a measure of a plant’s response to soil herbicide residue (Ranft et al. 2010). Because
soil bioassays are simple and easily repeatable, they are conducted to determine the
influence of soil organic matter, soil pH, and microbial degradation on herbicide
persistence (Cutulle et al. 2009, Ranft et al. 2010). Species like cucumber (Cucumis
sativus) are often used for bioassays because they are highly sensitive to herbicide
residues (Ulbrich et al. 2005).
The objective of this study was to conduct a soil bioassay using cucumber and
cheatgrass to determine imazapic persistence as it relates to imazapic rate, presence of
plant litter, and time after herbicide application. It was predicted that cucumber and
cheatgrass biomass would decrease with increasing imazapic rate. Further, higher
cucumber and cheatgrass biomass would occur with the presence of plant litter because
of imazapic’s adsorption to the litter layer, reducing its susceptibly to degradation. Lastly,
it was hypothesized that the effect of imazapic on cucumber and cheatgrass biomass
reduction would diminish with time as a result of herbicide degradation.
Materials and Methods
Site and Field Experiment Description
Soil for the bioassay was collected from field trials conducted at two locations
during 2010-2011 and 2011-2012, hereafter referred to as 2011 and 2012, respectively.

47 The field sites included a rangeland site 35 km south of Big Timber, Montana (45° 35’
45.01”, -110° 10’ 28.23”), and a Conservation Reserve Program (CRP) site 23 km south
of Havre, Montana (48° 27’ 9.59”, -109° 52’ 33.42”). Soil at Big Timber is a Winspect
cobbly loam (Typic Calciustoll) with a pH of 6.6 (0-10 cm depth). Mean annual
precipitation and air temperature are 387 mm and 7.2°C, respectively. The plant
community at Big Timber consists of perennial grasses (e.g. Pascopyrum smithii and
Psedoroegneria spicata), exotic perennial forbs (e.g. Taraxacum officinale and
Tragopogon dubius), and native perennial forbs (e.g. Artemesia fridgida) (Table 2.3,
Chapter 2). The soil at Havre is an Evanston loam (Aridic Agriustoll) with a pH of 7.1 (0-
10 cm depth). Mean annual precipitation and air temperature are 295 mm and 5 °C,
respectively. The plant community at Havre is dominated by seeded native and perennial
grasses and to a lesser extent exotic perennial forbs, most of which are also found at Big
Timber (Table 2.3, Chapter 2). Both sites are infested with cheatgrass.
The field experiment consisted of a factorial combination of four imazapic
application rates (0, 80, 160, and 240 g a.i. ha-1; hereafter referred to as control, low,
medium, and high) and two litter treatments (reduced, ambient). The experiment was
arranged in a randomized split-block design at each site with imazapic rate as the whole
plot (18.3 m x 3.0 m) and litter treatment as the subplot (9.1 m x 3.0 m), with four
replications. The reduced litter treatment was achieved by hand raking with a lawn rake
immediately prior to imazapic application. The ambient litter treatment was undisturbed.
Imazapic was applied as Plateau® (BASF Corporation 2008). The herbicide was mixed
with water plus the non-ionic surfactant (0.10% volume/volume) Penetrator® (Helena

48 Chemical Company) and applied using a CO2 backpack sprayer delivering 157 L ha-1
water at 3 kg cm-2 pressure across a boom width of 3 m. Date of application and weather
conditions at the time of imazapic application are summarized in Table 3.1.
Table 3.1. Application date and weather conditions for 2011 and 2012 at Big Timber and Havre.
Date Weather Conditions Date Weather Conditions9/29/2010 1.0 km hr-1 wind 9/20/2011 8.0 km hr-1 wind
10˚C 8˚C63% rel. humidity 62% rel. humidity
Date Weather Conditions Date Weather Conditions9/23/2010 1.0 km hr-1 wind 9/28/2011 6.0 km hr-1 wind
17˚C 18˚C51% rel. humidity 23% rel. humidity
Havre
Big Timber2011
Big Timber
Havre
2012
Soil Sampling
At Havre, five soil sampling events occurred in 2011 and six sampling events
occurred in 2012 (Table 3.2). At Big Timber, four sampling events occurred in 2011 and
six sampling events occurred in 2012. In 2011, no sampling event was conducted ~56
days post-application (DPA) at Big Timber because of snow cover and frozen soil. In
2012, both field sites were sampled during the summer because 2011 results suggested
imazapic persisted in the soil beyond ~190-200 DPA. At each sampling event, three soil
cores were dug at three random locations within each plot (9 cores per plot) using a 7 cm
dia. tulip bulb planter. Soil core depth was 10 cm at Havre but only 8 cm at Big Timber
due to rock fragments. The nine soil cores collected from each plot were composited and
placed in 2 L Ziploc© freezer bags and frozen (0°C) within four hours of sampling. Soil

49 samples remained frozen until all sampling events were completed. Soils were then
prepared for the bioassay beginning with drying in an oven at 50°C for 72 hours followed
by sieving to remove coarse rock fragments (> 2 mm). All coarse litter material was
retained.
Table 3.2. Soil sampling date and corresponding days post-application (DPA) at Big Timber and Havre for 2011 and 2012.
Date DPA Date DPA9/29/2010 0 9/20/2011 010/13/2010 14 10/5/2011 1510/29/2010 30 10/18/2011 28N/A - 11/17/2011 58
4/10/2011 193 3/23/2012 185N/A - 7/3/2012 287
Date DPA Date DPA9/24/2010 0 9/29/2011 010/8/2010 14 10/12/2011 1310/22/2010 28 10/25/2011 2611/19/2010 56 11/28/2011 604/14/2011 202 3/29/2012 182N/A - 6/27/2012 272
Big Timber Big Timber2011
HavreHavre
2012
N/A indicates that no soil sampling occurred.
Bioassay
Soil bioassays were conducted in 1.3 L pots filled with approximately 500 g soil.
For each sampling event, 32 samples were collected (four imazapic rates, two litter
treatments, four blocks). Processed soil samples from each sampling event were
separated into two different pots, one for cheatgrass and the other for cucumber. In 2011

50 there were a total of 256 pots for Big Timber and 320 pots for Havre, and 384 pots each
for Big Timber and Havre in 2012.
Cheatgrass seeds were collected prior to the study and stored in cold-wet storage
until use. Cucumber seeds (cv. Straight Eight, American Meadows, Williston, VT) were
kept at room temperature (20°C) until use. Seeds were pre-germinated and five seeds of
cucumber or cheatgrass were planted in each pot. Pots were placed in a greenhouse at the
Montana State University Plant Growth Center (PGC), Bozeman, MT USA. Greenhouse
light and temperature conditions were maintained at 21.1˚C day/12.8˚C night.
Supplemental light was applied as needed to achieve 12-hour days. Pots were moved by
block every five to seven days to minimize the effect of location in the greenhouse. Pots
were watered daily throughout both trials to avoid drought stress (i.e. visual evidence of
wilting). Two soil bioassays were conducted corresponding with the 2011 and 2012 field
trials.
In 2012, cheatgrass seedlings that emerged from the seedbank were removed
from both cheatgrass and cucumber pots approximately 14 days after planting. Pots were
then thinned every 14 days until harvest. At 28 days, total biomass (roots and shoots) of
each species was harvested and weighed. Root were separated from the soil, and gently
triple-washed with water. After harvest, biomass was dried in a drying oven at the PGC at
65°C for a minimum of 48 hours and summarized as mg plant-1for analysis, based on the
count of plants present in each pot.

51 Statistical Analysis
Analysis of variance (ANOVA) of cucumber and cheatgrass biomass was
performed using Proc Mixed in SAS 9.3 (SAS Institute Inc. 2012, Appendix B). The
result of Levene’s test for homogeneity of variances indicated that the variances between
imazapic rates were not equal. Thus, a model with unequal variances was specified in
Proc Mixed by using the REPEATED statement with the GROUP = option; GROUP =
rate was used to specify a different residual variance for each imazapic rate. Imazapic
application rate (control, low, medium, high), plant litter (reduced, ambient), block, and
the interaction of rate and litter were included as independent effects. The DIFF option in
the LSMEANS statement was used to separate means when independent effects were
found to be significant (α = 0.05). The analysis indicated that in general, the low,
medium, and high imazapic rates similarly reduced cucumber and cheatgrass biomass
within each sampling date relative to the control. Consequently, biomass means within
each sampling date were averaged across each respective rate and normalized as percent
of the control. Tables of mean absolute biomass and graphs of relative biomass are
presented for each site.
Results
Big Timber
Cucumber Imazapic significantly reduced cucumber biomass at each sampling
event in 2011 (Table 3.3). However, there was no difference in response among the three
application rates (low, medium, and high) relative to the control (Table 3.4). In 2011,

52 biomass was 39-55%, 37-43%, and 34-43% of the control across all sampling dates for
the low, medium, and high imazapic rates, respectively (Figure 3.1a). In 2012, imazapic
affected cucumber biomass only at 58 DPA, when it was equally reduced by the low
(32% of control), medium (31% of control), and high (25% of control) imazapic rates
(Figure 3.1b).
Litter influenced cucumber biomass only at 287 DPA (P = 0.0351, Table 3.3).
Between litter treatments, ambient litter resulted in higher cucumber biomass relative to
reduced litter, but only for the low imazapic rate (143 ± 25 versus 82 ± 17 mg plant-1).
Table 3.3. P-values from ANOVA on cucumber and cheatgrass biomass at each sampling date (days post-application, DPA) for Big Timber.
Effect df 0 14 30 N/A 193 N/ARate 3 0.0004 0.0046 0.0103 - 0.0063 -Litter 1 0.8199 0.5928 0.6625 - 0.4561 -Litter x Rate 3 0.9191 0.7973 0.7040 - 0.4117 -
Effect df 0 15 28 58 185 287Rate 3 0.0584 0.2637 0.0560 0.0121 0.1027 0.3051Litter 1 0.9510 0.2721 0.9514 0.4921 0.7879 0.0351Litter x Rate 3 0.6131 0.3186 0.6932 0.8153 0.7873 0.0672
Effect df 0 14 30 N/A 193 N/ARate 3 < 0.0001 0.0001 < 0.0001 - 0.0015 -Litter 1 0.5837 0.3447 0.4950 - 0.4359 -Litter x Rate 3 0.8901 0.4252 0.8082 - 0.1953 -
Effect df 0 15 28 58 185 287Rate 3 0.0319 0.0052 0.0005 0.0004 < 0.0001 < 0.0001Litter 1 0.2194 0.8143 0.4052 0.6767 0.3222 0.3842Litter x Rate 3 0.6311 0.8156 0.4908 0.1519 0.4036 0.4459
Big TimberCucumber
2011
2012
2012
Cheatgrass2011
N/A indicates that no soil sampling occurred.

53
Table 3.4. Mean absolute biomass (mg plant-1) for cucumber and cheatgrass at each sampling date (days post-application, DPA) for the 2011 and 2012 bioassays for Big
Timber.
Rate 0 14 30 N/A 193 N/AControl 121 b 116 b 108 b - 201 b -Low 48 a 49 a 60 ab - 106 a -Medium 45 a 48 a 46 a - 85 a -High 41 a 43 a 43 a - 87 a -
Rate 0 15 28 58 185 287Control 163 b 117 a 302 b 355 b 277 a 114 aLow 87 a 87 a 98 a 113 a 162 a 113 aMedium 81 a 86 a 76 a 108 a 120 a 100 aHigh 92 ab 80 a 99 a 88 a 114 a 90 a
Rate 0 14 30 N/A 193 -Control 30 c 33 b 43 c - 92 c -Low 6 b 8 a 9 b - 25 b -Medium 5 ab 7 a 5 a - 24 b -High 4 a 4 a 4 a - 11 a -
Rate 0 15 28 58 185 287Control 35 b 21 b 135 c 155 c 188 b 33 cLow 3 a 4 a 8 b 11 b 46 a 28 bMedium 3 a 2 a 6 ab 5 a 16 a 27 abHigh 3 a 3 a 3 a 4 a 11 a 25 a
Days Post-Application (DPA)2012
Days Post-Application (DPA)
Days Post-Application (DPA)
Days Post-Application (DPA)
2012
Cheatgrass2011
Big TimberCucumber
2011
N/A indicates that no soil sampling occurred. Within a column, means followed by the
same letter are not significantly different at the P < 0.05 level for each species.

54
Days Post-Application (DPA)
0 50 100 150 200 250 300
Biom
ass a
s per
cent
of c
ontro
l
0.0
0.2
0.4
0.6
0.8
1.0Low Medium High
a) 2011.
Days Post-Application (DPA)
0 50 100 150 200 250 300
Biom
ass a
s per
cent
of c
ontro
l
0.0
0.2
0.4
0.6
0.8
1.0
Low Medium High
b) 2012. Figure 3.1. Cucumber biomass as percent of the control for the 2011 and 2012 bioassays for Big Timber.

55
Cheatgrass Cheatgrass biomass was affected by imazapic rate at each sampling
date in 2011 and 2012 (Table 3.3). Within each sampling date in 2011, cheatgrass
biomass was reduced below that of the control by the low, medium, and high imazapic
rates (Table 3.4). Specifically, across sampling dates biomass was 20-27% of the control
with the low imazapic rate, 12-27% with the medium rate, and 10-13% with the high
imazapic rate (Figure 3.2a). Significant differences among rates occurred at 0, 30, and
193 DPA (Table 3.4).
In 2012, all imazapic rates reduced cheatgrass biomass below that of the control
(Table 3.4). The low imazapic rate resulted in cheatgrass biomass that was 6-84% of the
control across sampling dates, which was a similar range for the low (3-80%) and high
(2-74%) imazapic rates (Figure 3.2b). For all three imazapic rates, biomass became
nearer that of the control toward the end of the sampling period (287 DPA).
Differences in rates were observed at 28, 58, and 287 DPA (Table 3.4). At 28
DPA, the high imazapic rate resulted in the lowest biomass (3 ± 1 mg plant-1) relative to
the control (135 ± 18 mg plant-1), with intermediate biomass occurring with the medium
imazapic rate (6 ± 2 mg plant-1), followed by the low imazapic rate (8 ± 1 mg plant-1);
this same trend occurred at 287 DPA. At 58 DPA, the medium and high imazapic rates
resulted in similarly low biomass (5 ± 1 and 4 ± 0 mg plant-1, respectively), relative to the
low imazapic rate (11 ± 2 mg plant-1) and the control (155 ± 22 mg plant-1).

56
Days Post-Application (DPA)
0 50 100 150 200 250 300
Bio
mas
s as p
erce
nt o
f con
trol
0.0
0.2
0.4
0.6
0.8
1.0 Low Medium High
a) 2011.
Days Post-Application (DPA)
0 50 100 150 200 250 300
Biom
ass a
s per
cent
of c
ontro
l
0.0
0.2
0.4
0.6
0.8
1.0Low Medium High
b) 2012. Figure 3.2. Cheatgrass biomass as percent of the control for the 2011 and 2012 bioassays for Big Timber.

57 Havre
Cucumber In 2011, imazapic rate had no effect on cucumber biomass except at
202 DPA (Table 3.5). At 202 DPA, the low (179 ± 18 mg plant-1), medium (100 ± 13 g
plant-1), and high (116 ± 13 mg plant-1) imazapic rates resulted in similar biomass, but
only the medium and high rates were different than the control (289 ± 42 mg plant-1)
(Table 3.6). In general, biomass was 40-85% of the control across sampling dates and
imazapic rates (Figure 3.3a).
The interaction of imazapic rate and litter influenced biomass at 14 DPA (P =
0.0345, Table 3.5) in 2011. Reduced litter resulted in higher biomass (143 ± 12 mg plant-
1) than ambient litter (57 ± 21mg plant-1), but only for the control. Overall, the effect of
litter was minimal, and no general trend occurred.
In 2012, imazapic rate influenced cucumber biomass at each sampling date (Table
3.5). In general, cucumber biomass was similar across the low, medium, and high
imazapic rates (Table 3.6). However, at 182 DPA biomass with the medium (79 ± 8 mg
plant-1) and high (83 ± 10 mg plant-1) rates was significantly lower than biomass at the
low rate (145 ± 14 mg plant-1) (Table 3.6). Additionally, at 272 DPA only the high
imazapic rate (68 ± 7 mg plant-1) resulted in significantly lower biomass than the control
(153 ± 22 mg plant-1). Across sampling dates, the low imazapic rate resulted in biomass
that was 13-64% of the control; biomass was generally lower with the medium (11-49%
of the control) and high (8-45%) imazapic rates (Figure 3.3b).

58 Table 3.5. P-values from ANOVA on cucumber and cheatgrass biomass at each sampling
date (days post-application, DPA) for Havre.
Effect df 0 14 28 56 202 N/ARate 3 0.1717 0.0896 0.1291 0.0758 0.0112 -Litter 1 0.9069 0.2534 0.8212 0.8442 0.1881 -Litter x Rate 3 0.8251 0.0345 0.6762 0.6580 0.6968 -
Effect df 0 13 26 60 182 272Rate 3 0.0032 0.0057 < 0.0001 0.0199 0.0031 0.0204Litter 1 0.1578 0.6818 0.0956 0.3544 0.0562 0.4623Litter x Rate 3 0.2057 0.6889 0.4830 0.7681 0.1636 0.7140
Effect df 0 14 28 56 202 N/ARate 3 0.0017 0.0036 0.1519 0.0018 < 0.0001 -Litter 1 0.6215 0.3233 0.3521 0.1009 0.8801 -Litter x Rate 3 0.7328 0.2440 0.2501 0.4196 0.8900 -
Effect df 0 13 26 60 182 272Rate 3 0.0001 0.0029 0.0021 0.0012 0.0019 0.0020Litter 1 0.3982 0.7606 0.0446 0.6058 0.9510 0.7542Litter x Rate 3 0.2521 0.9402 0.1826 0.8778 0.8920 0.0695
HavreCucumber
2011
2012
2012
Cheatgrass2011
N/A indicates that no soil sampling occurred.

59
Table 3.6. Absolute mean biomass (mg plant-1) for cucumber and cheatgrass at each sampling date (days post-application, DPA) for the 2011 and 2012 bioassays for Havre.
Rate 0 14 28 56 202 N/AControl 111 a 100 a 108 a 120 a 289 b -Low 64 a 70 a 76 a 78 a 179 ab -Medium 75 a 84 a 64 a 60 a 100 a -High 56 a 59 a 58 a 65 a 116 a -
Rate 0 13 26 60 182 272Control 359 b 438 b 392 b 273 b 557 c 153 bLow 45 a 89 a 75 a 79 ab 145 b 98 abMedium 40 a 57 a 50 a 44 a 79 a 75 abHigh 49 a 34 a 53 a 49 a 83 a 68 a
Rate 0 14 28 56 202 N/AControl 22 c 23 b 13 a 17 b 89 b -Low 9 abc 9 b 9 a 10 b 59 b -Medium 5 ab 7 ab 9 a 6 ab 24 ab -High 3 a 5 a 6 a 5 a 13 a -
Rate 0 13 26 60 182 272Control 39 b 94 c 55 b 71 c 123 b 42 bLow 12 a 19 b 18 a 12 b 34 a 33 bMedium 6 a 6 a 5 a 6 ab 8 a 17 aHigh 4 a 6 a 4 a 4 a 8 a 17 a
HavreCucumber
2011Days Post-Application (DPA)
Days Post-Application (DPA)
2012
Cheatgrass2011
Days Post-Application (DPA)
Days Post-Application (DPA)
2012
N/A indicates that no soil sampling occurred. Within a column, means followed by the
same letter are not significantly different at the P < 0.05 level for each species.

60
Days Post-Application (DPA)
0 50 100 150 200 250 300
Biom
ass a
s per
cent
of c
ontro
l
0.0
0.2
0.4
0.6
0.8
1.0Low Medium High
a) 2011.
Days Post-Application (DPA)
0 50 100 150 200 250 300
Biom
ass a
s per
cent
of c
ontro
l
0.0
0.2
0.4
0.6
0.8
1.0Low Medium High
b) 2012. Figure 3.3. Cucumber biomass as percent of the control for the 2011 and 2012 bioassays for Havre.

61
Cheatgrass In 2011, imazapic rate influenced cheatgrass biomass at each sampling
date except at 28 DPA (Table 3.5). The low, medium, and high imazapic rates reduced
cheatgrass biomass below that of the control at 0 and 14 DPA (Table 3.6). At 56 DPA,
the medium and high imazapic rates reduced biomass the most (6 ± 0 and 5 ± 0 mg plant -
1, respectively). The low imazapic rate resulted in 10 ± 2 mg plant-1, which was similar to
the control (17 ± 2 mg plant-1). This same trend occurred at 202 DPA, when biomass
began approaching that of the control; the medium and high imazapic rates resulted in 24
± 4 mg plant-1 and 13 ± 3 mg plant-1, respectively. The low imazapic rate (59 ± 11 mg
plant-1) and the control (89 ± 11 mg plant-1) were similar. Across all sampling dates, the
low imazapic rate resulted in biomass that was 37-73% of the control, and the medium
imazapic rate was 23-66% of the control (Figure 3.4a). Biomass was 14-45% of the
control with the high imazapic rate.
In 2012, imazapic rate influenced cheatgrass biomass at each sampling date and
litter affected biomass at 26 DPA (Table 3.5). Generally, the low, medium, and high
imazapic rates equally reduced cheatgrass biomass below that of the control (Table 3.6).
At the last sampling date (272 DPA), the control (42 ± 6 mg plant-1) and low (33 ± 4 mg
plant-1) imazapic rate were similar, while the medium and high imazapic rates equally
reduced cheatgrass biomass (17 ± 3 and 17 ± 4 mg plant-1, respectively) (Table 3.6).
Across all sampling dates, the low imazapic rate resulted in biomass that was 16-78% of
the control, while the medium and high imazapic rates resulted in biomass that ranged
from 6-40% of the control (Figure 3.4b).

62
Days Post-Application (DPA)
0 50 100 150 200 250 300
Biom
ass a
s per
cent
of c
ontro
l
0.0
0.2
0.4
0.6
0.8
1.0Low Medium High
a) 2011.
Days Post-Application (DPA)
0 50 100 150 200 250 300
Biom
ass a
s per
cent
of c
ontro
l
0.0
0.2
0.4
0.6
0.8
1.0Low Medium High
b) 2012. Figure 3.4. Cheatgrass biomass as percent of the control for the 2011 and 2012 bioassays for Havre.

63
Discussion
Imazapic degradation in Montana’s semiarid climate appears to occur slowly, as
imazapic persisted in the soil through the following spring. Consequently, imazapic is
able to inhibit cheatgrass growth both in the fall and the following spring. In general,
across both sites and both trials, all three imazapic rates reduced cucumber and cheatgrass
biomass below that of the control, supporting the idea of slow herbicide degradation and
increased imazapic persistence. These findings led me to reject the hypothesis that a
higher reduction in biomass would occur with high imazapic rates relative to low rates. In
addition, imazapic degradation did not appear to occur at either site in 2011; however, it
did appear that degradation occurred in 2012 somewhere between the fifth (~180 DPA)
and sixth sampling dates (~280 DPA), which was accompanied by an increase in
cucumber and cheatgrass biomass. These findings demonstrate the importance of the
additional sampling event that occurred in 2012. Thus, I can partially accept my
hypothesis that as time after imazapic application increased, imazapic would become less
persistent in the soil.
Similar annual grass control for one or more years across different imazapic rates
has been reported elsewhere (Sheley et al. 2007, Elseroad and Rudd 2011, Davison and
Smith 2007). In a study investigating medusahead control in southeast Oregon, unburned
fields that were sprayed with 175 to 210 g a.i. ha-1of imazapic resulted in similarly low
annual grass cover (Sheley et al. 2007). The imazapic rates used by Sheley et al. (2007)
coincide with the medium (160 g a.i. ha-1) and high (240 g a.i. ha-1) imazapic rates used
in my study. Even an imazapic rate of 70 g a.i. ha-1, slightly lower than my low rate of 80

64 g a.i. ha-1, has been reported to reduce cheatgrass compared to unsprayed plots (Elseroad
and Rudd 2011). In another study, plots sprayed with 105 g a.i. ha-1 resulted in reduced
cheatgrass productivity in a Nevada fuelbreak (Davison and Smith 2007).
While most studies do not directly investigate imazapic persistence, they do
suggest that imazapic is able to persist in the soil and provide cheatgrass control. Davison
and Smith (2007) and others (Owen et al. 2011, Sheley et al. 2007) found cheatgrass
control one year post-treatment at a range of application rates. Further, Elseroad and
Rudd (2011) suggest that cheatgrass control can last three to four years after imazapic
application. In contrast, my study investigated imazapic persistence only ~9 months post-
application. However, my findings suggest that imazapic persists through the following
spring and likely undergoes degradation sometime between the spring and summer (~180
to 270 DPA). Thus, fall spraying provides control of cheatgrass by acting on seedlings
that emerge in both the fall and spring.
Imazapic appears to degrade slowly over time in Montana’s semiarid climate.
Microbial degradation is the primary route of imazapic degradation in the soil and is
favored in warm, moist soils (Prostko et al. 2005, Ulbrich et al. 2005). This is evident in a
study investigating rotation restrictions for oat in Georgia; four months post-application,
imazapic had degraded to such a degree that it no longer affected oat yields (Prostko et al.
2005). However, in Alberta, Canada, which has a climate more similar to Montana,
imidazolinone herbicides reduced yields of rotational crops that were seeded one year
post-application (Moyer and Esau 1996), which indicates that microbial degradation
occurs more slowly in dry, cool climates.

65
The presence of plant litter had a minimal effect on either cucumber or cheatgrass
biomass and therefore did not appear to affect imazapic persistence. Thus, I rejected my
hypothesis that the presence of plant litter would result in higher biomass because of
imazapic’s adsorption and decreased degradation. This is in contrast to studies
investigating control of medusahead and other annual grasses, which have shown
increased annual grass control with imazapic after implementing a prescribed burn to
eliminate litter (Davies 2010, Monaco et al. 2005, Sheley et al. 2007). In my study, litter
was reduced by manual raking, which may not have been as effective as prescribed
burning in terms of increasing physical contact between the herbicide and targeted plant
(Calo et al. 2012, DiTomaso et al. 2006, Sheley et al. 2007).
Soil bioassays provide insight into herbicide persistence and degradation that
perhaps is not immediately visible in a field setting. Although soil bioassays have been
conducted with cucumber (Ulbrich et al. 2005), my findings suggest that cucumber is
perhaps not sensitive enough to imazapic residues. This is supported by the higher
biomass that occurred for cucumber plants (< 180 DPA) relative to cheatgrass.
Consequently, cucumber may be as good of an indicator species as the targeted species
when imazapic persistence and degradation over time are investigated in a semiarid
region.
Implications
Overall, the findings of this study provide evidence that imazapic degradation
occurs slowly in Montana’s semiarid climate, suggesting that fall applications of
imazapic will continue to provide cheatgrass control through the following spring.

66 Regardless of imazapic rate applied, cheatgrass control is not dependent on the presence
or absence of plant litter. Controlling cheatgrass seedlings in both fall and spring
increases the likelihood of successful management, and control is possible even when
applying low imazapic rates (80 g a.i. ha-1).
Because of imazapic’s persistence into the spring, questions arise as to whether or
not its soil residual activity negatively affects desired plant communities. However,
results from my field experiment investigating imazapic application rate and timing and
plant litter (Chapter 2) and other studies (Davison and Smith 2007) indicate that desired
plant communities are not negatively affected by imazapic’s soil residual activity. This is
encouraging in that carefully timed imazapic applications at low rates can control
cheatgrass without negatively impacting the resident plant community.

67
CHAPTER FOUR
INTEGRATING THE HERBICIDE IMAZAPIC AND THE FUNGAL PATHOGEN
PYRENOPHORA SEMENIPERDA TO CONTROL CHEATGRASS
Introduction
Cheatgrass (Bromus tectorum) is an exotic winter annual grass that infests
millions of hectares of rangeland in western states, outcompeting native species and
negatively affecting ecosystems (BLM 1999, Epanchin-Niell et al. 2009, Rice 2005,
Sperry et al. 2006, Whisenant 1990, Young et al. 1969). As a prolific seed producer, a
single cheatgrass plant is capable of producing up to 6,000 seeds (Young and Evans
1978), which can result in densities of 4,800-19,000 seeds m-2 (Hempy-Mayer and Pyke
2008, Humphrey and Schupp 2001). In addition, cheatgrass is able to germinate from fall
through early spring, allowing a portion of the seed bank to carryover and escape control
from a single herbicide application. Cheatgrass infested sites often have a dense layer of
plant litter that can serve as a sorption site for herbicides, consequently limiting plant
herbicide-uptake. Thus, controlling cheatgrass with traditional management methods such
as synthetic herbicides becomes more difficult when compounded by its carryover seed
bank and accompanying dense plant litter layer.
Cheatgrass control on western rangelands has recently focused on imazapic
(Plateau®, BASF Corporation 2008), a member of the imidazolinone herbicide family
(Davison and Smith 2007, Elseroad and Rudd 2011, Morris et al. 2009). Imazapic is an
acetolacetate synthase (ALS) inhibitor that is absorbed through leaves, stems, and roots

68 (BASF Corporation 2008, Peterson et al. 2010). In Montana, imazapic efficacy has been
inconsistent (Mangold et al., in review).
Imazapic efficacy can be influenced by several factors. First, application timing
can impact herbicide efficacy (DiTomaso 2000). Imazapic is labeled for application to
the soil prior to cheatgrass emergence (pre-emergent) or to cheatgrass foliage after
emergence (post-emergent) (BASF Corporation 2008). Second, plant litter may reduce
efficacy, especially with pre-emergent application. Surface litter may serve as a sorption
site for herbicides resulting in less contact with cheatgrass seedlings. Third, efficacy can
be influenced by application rate. Rates of 2 to 12 oz. product ha-1 (corresponding to 40
and 240 g a.i. ha-1) are suggested on the Plateau® label (BASF Corporation 2008).
Varying rates have been tested for annual grass control, including cheatgrass and
medusahead (Taeniatherum caput-medusae); however, responses have been highly
variable and often depend on site characteristics (i.e. precipitation, soil organic matter,
disturbance history) (Kyser et al. 2007, Morris et al. 2009). Integrating other control tools
with herbicides is necessary because herbicides alone are not consistently effective
(DiTomaso et al. 2010, Masters and Sheley 2001). Furthermore, incorporating other tools
may result in more economical and sustainable control of cheatgrass.
The integration of the fungal pathogen Pyrenophora semeniperda with imazapic
may improve cheatgrass management (Dooley and Beckstead 2010, Meyer et al. 2008a,
Stewart 2009). Pyrenophora semeniperda is a generalist grass fungal pathogen that
causes minor leaf spot, seed infection, and death of at least 36 genera of annual and
perennial grasses (Medd et al. 2003, Meyer et al. 2008a). The name “black fingers of

69 death” is ascribed to this pathogen because of black, finger-like stromata that emerge
from infected seeds (Meyer et al. 2008a). Conidia carried to the inflorescence infect the
developing ovary of cheatgrass seeds during anthesis (Medd et al. 2003). These infected
mature seeds disperse to the ground, where the fungus over summers as mycelium;
stromata develop from the mycelium, producing more conidia to further the infection
cycle, resulting in seed death, with seed mortality reaching 90-100% (Beckstead et al.
2010, Medd et al. 2003, Meyer et al. 2007).
The ability of P. semeniperda to infect and kill cheatgrass seeds is greater under
arid conditions (199 mm mean annual precipitation (MAP)) than mesic conditions (486
mm MAP) (Beckstead et al. 2007, Meyer et al. 2007). This may be due to greater
dispersal of conidia, increased infection of undispersed cheatgrass seeds (Meyer et al.
2008b), and competition between the plant and fungus for carbohydrates in the seed,
referred to as a “race for survival” (Beckstead et al. 2007). Under mesic conditions,
cheatgrass seeds germinate and seedling growth proceeds quickly because of ample
moisture, allowing cheatgrass to utilize seed reserves faster than the fungus (Beckstead et
al. 2007). Under arid conditions, cheatgrass seeds may be either slow to germinate or
may remain dormant over the winter because of insufficient moisture; these seeds are
therefore more susceptible to P. semeniperda infection and mortality.
In general, soil-borne fungal pathogens that normally infect at or below the soil
surface are protected from environmental extremes, allowing them to persist and
continually infect target plants (Boyette et al. 1984, Jones and Hancoock 1990,
Weidemann 1988). Plant litter increases soil moisture and water availability (Fowler

70 1986), decreases incoming radiation (Facelli and Pickett 1991), and reduces temperature
fluctuations (Weaver and Rowland 1952). Cheatgrass litter was found to facilitate seed
infection by P. semeniperda due to microsite modification (Beckstead et al. 2011). Evans
and Young (1970) showed that cheatgrass litter reduced average maximum daily spring
soil surface temperatures from 28°C to 19°C and increased average minimum
temperatures from 0°C to 5°C. Such conditions are similar to optimal conditions for P.
semeniperda sporulation (Campbell et al. 1996, 2003). Thus, certain microsite conditions
may be more favorable to P. semeniperda than others, thus influencing cheatgrass
infection and mortality rates.
Integrating imazapic with P. semeniperda may improve management of one of the
most problematic annual grasses on western rangeland. Herbicides like imazapic are most
effective on recently emerged cheatgrass seedlings, while P. semeniperda can infect the
carryover seed bank and inhibit slower-germinating cheatgrass seeds (Medd and
Campbell 2005). Combining herbicides and P. semeniperda may be beneficial because
herbicides alone are not 100 percent effective, and P. semeniperda has shown promise in
exploratory research conducted in the field and greenhouse.
I conducted a greenhouse study to determine the effects of integrating imazapic
and P. semeniperda on cheatgrass emergence, density, and biomass across varying
cheatgrass seeding depths. Cheatgrass emergence was predicted to decrease with P.
semeniperda inoculation. Cheatgrass density and biomass were predicted to be lowest
when imazapic and P. semeniperda were combined compared to either treatment applied
alone or a non-treated control.

71
Materials and Methods
Experimental Design
Two P. semeniperda treatments (inoculated, non-inoculated), two imazapic
treatments (sprayed, non-sprayed), and three seeding depth treatments (0.6 cm below the
soil surface (buried), at the soil surface (surface), and within the litter layer (litter)) were
factorially arranged for a total of 12 treatments. Treatments were replicated eight times in
a randomized, complete block design. Two trials were conducted. Trial one occurred 7
February through 19 March, 2012 and trial two occurred 20 July through 31 August,
2012.
Pyrenophora semeniperda Inoculum Preparation
Pyrenophora semeniperda inoculum was prepared using a modified single
conidia isolation method (Stewart 2009). An isolate of P. semeniperda was obtained from
cropland located near Amsterdam, Montana (Miller et al., in preparation). Stromata from
cheatgrass seeds that carried this isolate were removed with sterilized tweezers, and then
placed onto damp blotter paper for 24 hours to produce conidia.
Stromata bearing conidia were placed into a 1.5 mL vial containing a 1%
Tween®/H20 solution, which was shaken vigorously for 15 seconds to release the conidia.
The solution was spread evenly using a sterile glass rod onto a Petri dish containing water
agar. Conidia were allowed to germinate at room temperature (20˚C) for 14-16 hours.
Using a dissecting scope, germinated conidia were identified based on the presence of a
clear germination tube, as long as or longer than the conidia (Miller et al., in preparation).
An X-Acto® knife dipped in ethyl alcohol (ETOH) and flame-sterilized was used to

72 transfer a single conidium onto a Petri dish containing modified alphacel medium
(MAM) (Stewart 2009).
Four-40 watt cool-white and four-40 watt black light florescent tubes were
positioned 40 cm above the Petri dishes to provide a 12 hour near visible ultraviolet
(NUV) (320-420 nm) photoperiod. Petri dishes were maintained at room temperature
(20°C). Petri dishes were checked for contaminants every two to three days, and an X-
Acto® knife dipped in ETOH and flame-sterilized was used to remove bacterial
contaminants.
After 12 days, conidia were harvested from the Petri dishes by rinsing the surface
with 5 mL of sterile deionized (DI) water, and gently scraping the surface with a rubber-
tipped glass stirring rod. Additional water was used as needed to gently scrape the surface
clean. The conidia solution was poured into a sterile glass jar. A haemocytometer was
used to quantify conidia concentration, and sterile DI water was added until a 5,000
conidia mL-1 concentration was achieved for the inoculum (Beckstead et al. 2007). The
inoculum was stored at 5˚C until seed inoculation.
Pyrenophora semeniperda Inoculum Application
Cheatgrass seeds previously collected at crop and rangeland sites in Montana
were surface sterilized to remove unwanted surface debris and microbial material by
submerging them for 60 seconds in 70% ETOH, 60 seconds in 10% bleach, 60 seconds in
70% ETOH, and then rinsing with DI water for 30 seconds. Cheatgrass seeds were
inoculated by placing them in Petri dishes containing P. semeniperda inoculum (20 seeds,

73 4 mL inoculum per Petri dish) and shaking them on a shaker table for 14 hours at 50 rpm
to allow for the absorption of P. semeniperda inoculum.
Greenhouse Conditions and Seed Planting
The study was conducted in a greenhouse at the Plant Growth Center (PGC),
Montana State University (MSU), Bozeman, Montana, USA. Greenhouse temperature
was maintained at 21.1˚C day and 12.8˚C night. Supplemental light was applied as
needed to achieve 12-hour days. A potting medium consisting of equal parts PGC Soil
Mix and Sunshine Mix #1 (the “50/50 mix,” Appendix C) was placed into 96 2.2 L pots
(15 cm dia.). All pots were seeded on the same day and all received a 0.5-1.0 cm layer of
cheatgrass litter (1.0 g pot-1) on the soil surface. Cheatgrass litter was collected from Big
Timber, MT, prior to the study and autoclaved to sterilize any cheatgrass seeds present.
Twenty cheatgrass seeds (inoculated or non-inoculated) were planted into each pot at the
appropriate seeding depth, and allowed to grow to the two-leaf stage (approximately 17
days). Upon reaching the two-leaf stage, imazapic in the form of Plateau® (BASF
Corporation 2008) was applied at 120 g a.i. ha-1 to half the pots (48) using a Generation
III Spray Booth (DeVries Manufacturing). Pots were placed back into the greenhouse and
rotated within each block every five to seven days to minimize the effect of location in
the greenhouse. Pots were watered daily throughout both trials to avoid drought stress
(i.e. visual evidence of wilting). The duration of trials one and two were 40 and 42 days,
respectively.

74 Data Collection
Cheatgrass emergence was recorded every 7 days and immediately prior to
imazapic application. Aboveground biomass of cheatgrass in each pot was harvested by
clipping plants at the soil level. Biomass was dried at 65°C for 72 hours and weighed.
Cheatgrass density per pot at the time of biomass harvest was recorded.
Statistical Analysis
To evaluate the effect of P. semeniperda and seeding depth on cheatgrass
emergence, an analysis of variance (ANOVA) was performed using a generalized linear
mixed effects model for binomially distributed data (R software, R Core Team 2012;
lme4 package, Bates et al. 2012; Appendix C). Fixed effects were P. semeniperda and
seeding depth. Random effects were trial and block. To analyze the effect of P.
semeniperda, imazapic, and seeding depth on final cheatgrass density and biomass, a
linear mixed effects model was conducted with the fixed effects of P. semeniperda,
imazapic, and seeding depth (Appendix C). Random effects were trial and block. The
multcomp package (Hothorn et al. 2008) was used to conduct means separations. Means
separations were examined for each significant main effect and interaction (α = 0.05).
Results
Cheatgrass Emergence
Pyrenophora semeniperda and seeding depth interacted to influence cheatgrass
emergence (P < 0.0001) (Table 4.1). The inoculated treatment decreased cheatgrass
emergence by 30-60% compared to the non-inoculated treatment, regardless of seeding

75 depth (Figure 4.1). The non-inoculated, buried seeded treatment had higher emergence
(69 ± 2%) than the surface and litter seeding depths (43 ± 2% and 48 ± 3%, respectively).
In the inoculated treatment, emergence was lowest for the buried seeding depth (11 ±
2%) and highest for the litter seeding depth (19 ± 2%). The surface seeding depth (13 ±
2%) resulted in emergence intermediate between the two other seeding depths.
Table 4.1. P-values from ANOVA on cheatgrass emergence.
Fixed effects df PP. semeniperda 1 < 0.0001Seeding Depth 2 < 0.0001P. semeniperda x Seeding Depth 2 < 0.0001
Cheatgrass Emergence
P. semeniperda Treatment
Non-Inoculated Inoculated
% E
mer
genc
e
0
20
40
60
80 Buried Surface Litter
a
Figure 4.1. Cheatgrass emergence as affected by Pyrenophora semeniperda and seeding depth. Error bars indicate 1 SE of the mean. Bars with different letters are statistically different at ɑ = 0.05.
d
c
c
b
a
ab

76 Cheatgrass Density
Pyrenophora semeniperda, imazapic, and seeding depth interacted to influence
cheatgrass density (P = 0.0332, Table 4.2). Density in the control, buried seeded
treatment was highest at 16 ± 1 plants pot-1 (Figure 4.2). Density was similar for the
surface and litter seeding depths (12 ± 1 and 11 ± 1, respectively). Results were similar
for the imazapic treatment; the buried seeding depth had the highest density (14 ± 1),
followed by the surface (8 ± 1) and litter (11± 1) seeding depths. The P. semeniperda and
imazapic + P. semeniperda treatments resulted in similar densities across seeding depths.
Table 4.2. P-values from ANOVA on cheatgrass density and biomass. Density Biomass
Fixed effects df P PP. semeniperda 1 < 0.0001 < 0.0001Imazapic 1 0.0022 < 0.0001Seeding Depth 2 < 0.0001 0.7887P. semeniperda x Imazapic 1 0.0133 < 0.0001P. semeniperda x Seeding Depth 2 < 0.0001 0.0450Imazapic x Seeding Depth 2 0.2727 0.2837P. semeniperda x Imazapic x Seeding Depth 2 0.0332 0.0514
The buried seeding depth resulted in similar densities for the control (16 ± 1) and
imazapic (14 ± 1) treatments, which were higher than P. semeniperda (3 ± 1) and
imazapic + P. semeniperda (4 ± 1) treatments. Densities for the surface seeding depth
were different between the control (12 ± 1) and the imazapic treatment (8 ± 1) but similar
between the P. semeniperda and imazapic + P. semeniperda treatments (3 ± 0). The litter
seeding depth behaved similarly to the buried seeding depth in that the control and
imazapic treatments were similar to each other (11 ± 1) and higher than the P.

77 semeniperda (5 ± 1) and imazapic + P. semeniperda (3 ± 0) treatments. Density was
similar across all seeding depths in the P. semeniperda and imazapic + P. semeniperda
treatments.
Treatment
Den
sity
(plan
ts p
ot-1
)
0
2
4
6
8
10
12
14
16
18 Buried Surface Litter
Imazapic,P. semeniperda
Control Imazapic
P. semeniperda
Figure 4.2. Cheatgrass density as affected by Pyrenophora semeniperda, imazapic, and seeding depth. Error bars indicate 1 SE of the mean. Bars with different lower case letters are significantly different (ɑ = 0.05) among seeding depths within a treatment. Bars with different upper case letters are significantly different (ɑ = 0.05) among treatments within a seeding depth.
Cheatgrass Biomass
Cheatgrass biomass was influenced by the interaction of imazapic and P.
semeniperda (P < 0.0001, Table 4.2). Cheatgrass biomass was highest in the control at
B a
B b
A a
Ca B
a
B b
B a
A a A
a A a
A a
A a

78 1.9 ± 0.1 g pot-1 and decreased to 0.8 ± 0.1 g pot-1 in the P. semeniperda treatment
(Figure 4.3). Biomass was lower in the imazapic (0.4 ± 0.0 g pot-1) and imazapic + P.
semeniperda (0.2 ± 0.0 g pot-1) treatments.
Figure 4.3. Cheatgrass biomass as affected by Pyrenophora semeniperda and imazapic treatments. Error bars indicate 1 SE of the mean. Bars with different letters are statistically different at ɑ = 0.05.
Cheatgrass biomass was also influenced by the interaction of P. semeniperda and
seeding depth (P = 0.0450, Table 4.2). While seeding depths within a P. semeniperda
treatment did not differ from each other, biomass decreased 70, 57, and 46% between P.
semeniperda treatments for the buried, surface, and litter seeding depths, respectively
(Figure 4.4).
c
a
a
b

79
Seeding Depth
Buried Surface Litter
Che
atgr
ass b
iom
ass (
g po
t-1)
0.0
0.2
0.4
0.6
0.8
1.0
1.2
1.4
1.6 Non-ioculated Inoculated
Figure 4.4. Cheatgrass biomass as affected by Pyrenophora semeniperda treatment and seeding depth. Error bars indicate 1 SE of the mean. Bars with different letters are significantly different at ɑ = 0.05.
Discussion
Pyrenophora semeniperda inoculation decreased cheatgrass emergence, density,
and biomass, leading me to accept my hypotheses that P. semeniperda would decrease
cheatgrass emergence. However, imazapic and P. semeniperda did not interact favorably,
thus leading me to reject the hypothesis that imazapic integrated with P. semeniperda
would result in decreased cheatgrass density and biomass compared to either treatment
applied alone.
b
a a
b b
a

80 Several studies have demonstrated that the use of an herbicide may increase
susceptibility to a fungal pathogen (Amsellem et al. 1990, Hodgson et al. 1988, Keen et
al. 1982, Rahe et al. 1990, Sharon et al. 1992, Wymore et al. 1987). For example,
sicklepod (Senna obtusifloia) sprayed with glyphosate was inhibited from producing
phytoalexins (antimicrobial substances) which increased its susceptibility to the pathogen
Alternaria cassiae (Sharon et al. 1991). Although my findings did not reveal a similar
relationship between imazapic and P. semeniperda, I found that P. semeniperda
effectively reduces cheatgrass emergence and density, while imazapic more effectively
reduces cheatgrass biomass.
The most favorable conditions for P. semeniperda infection and growth may
occur just below the soil surface as indicated by lower cheatgrass emergence with the
buried seeding depth relative to the surface and litter seeding depths. Greenhouse
conditions for this study were slightly lower than optimal for P. semeniperda growth and
sporulation (Campbell et al. 1996, 2003). However, the combined insulation properties of
the litter and soil may have buffered temperatures in the seed microsite enough to
encourage P. semeniperda infection. This is supported by Beckstead et al. (2011), who
found higher field-killed seed densities in high-litter patches relative to low-litter patches,
demonstrating that cheatgrass litter may modify seed microsites to favor P. semeniperda
seed infection and mortality.
Large amounts of plant litter may be present where cheatgrass control is
implemented. Although plant litter can reduce imazapic efficacy (Kyser et al. 2007), my
research (Chapters 2 and 3) suggests the reduction is minimal. Instead, plant litter may

81 favorably alter seed microsite conditions to enhance P. semeniperda infection (Beckstead
et al. 2011). Pyrenophora semeniperda infection in the field would also be augmented by
cheatgrass litter which serves as an inoculum source (Beckstead et al. 2011). For this
reason, actions to reduce plant litter to improve imazapic efficacy (i.e. prescribed fire)
(Calo et al. 2012, DiTomaso et al. 2006, Sheley et al. 2007) may not be necessary,
helping to reduce control costs associated with cheatgrass control.
Fall-applied herbicides like imazapic are most effective on recently emerged
cheatgrass seedlings, and P. semeniperda can infect the carryover seed bank and inhibit
cheatgrass germination. Findings from my study indicate that P. semeniperda could be
applied in advance of cheatgrass germination and emergence (mid- to late summer or
early fall) to affect cheatgrass emergence and density. After cheatgrass emergence,
imazapic could be applied to reduce cheatgrass biomass and even kill seedlings. Thus, P.
semeniperda can reduce the seedbank and limit future cheatgrass populations while
imazapic can control seedlings that escape pathogen-caused mortality.
Because P. semeniperda is a generalist grass pathogen, integrating imazapic with
P. semeniperda in the field raises concerns about spillover effects onto sensitive crops
and native grasses. Pathogen spillover occurs when one host species supports high
pathogen loads, causing indirect disease-mediated consequences for co-occurring host
species (Beckstead et al. 2010). Cheatgrass serves as a reservoir for P. semeniperda, so
the potential exists for P. semeniperda to infect and kill seeds of native grasses that co-
occur with cheatgrass (Beckstead et al. 2010). Beckstead et al. (2010) reported spillover
effects on five native grasses that co-occur with cheatgrass: Indian ricegrass

82 (Achnatherum hymenoides), squirreltail (Elymus elymoides), needle and thread
(Hesperostipa comate), Sandberg bluegrass (Poa secunda), and bluebunch wheatgrass.
Of these grasses, bluebunch wheatgrass, Sandberg bluegrass, and Indian ricegrass
experienced 35-80% P. semeniperda-caused seed mortality (Beckstead et al. 2010).
To mitigate spillover effects of P. semeniperda onto native grasses, P.
semeniperda application could primarily occur where pure cheatgrass monocultures exist,
especially in situations where revegetation is necessary. To prevent crop seeds or seeds
used for revegetation from becoming infected by P. semeniperda, species with low
susceptibility to P. semeniperda could be used or seeds could be treated with a fungicide
prior to seeding (Meyer et al. 2008a, Miller et al., in preparation). Spillover could also be
minimized by using P. semeniperda isolates that have the greatest host specificity
(Campbell 1996). The risks associated with spillover effects must be evaluated against
the benefits of using P. semeniperda as a biological control. Cheatgrass seed mortality
can reach > 90% due to P. semeniperda infection, which could provide seeded desirable
species the chance to establish in cheatgrass-infested rangeland (Beckstead et al. 2010).
Different rates of P. semeniperda inoculum and imazapic could influence
cheatgrass control. An optimal P. semeniperda inoculation rate would improve cheatgrass
control and minimize the risk of spillover. In my study only one inoculum and one
imazapic rate were used under controlled greenhouse conditions, and their effect was
only measured on cheatgrass. Because of varying biotic and abiotic conditions, these
same rates applied in the field may not be as successful, or may result in residual P.
semeniperda that could affect seeded desirable species. Further, extremely high P.

83 semeniperda inoculation rates could hinder cheatgrass emergence, density, and biomass
to the degree that imazapic application is unnecessary. Careful consideration of field
environmental conditions and the determination of appropriate inoculum and imazapic
rates are needed before imazapic and P. semeniperda can be integrated to control large-
scale cheatgrass infestations.
Implications
Although imazapic and P. semeniperda did not interact favorably, my findings
suggest that they offer a two-pronged approach to controlling cheatgrass: P. semeniperda
limited cheatgrass emergence and density and imazapic reduced cheatgrass biomass.
Imazapic application has produced inconsistent results (Chapters 2) and may not be the
most economical or sustainable control method available (Mangold et al., in review,
Morris et al. 2009). Fall application of synthetic herbicides has no impact on the
cheatgrass seed bank, leaving tens of thousands of seeds to germinate in the spring or
following fall. Laboratory and small-plot field research conducted to date (Beckstead et
al. 2007, 2010, 2011, Medd and Campbell 2005, Meyer et al. 2007, 2008b) has
demonstrated consistent cheatgrass mortality with P. semeniperda inoculation; however,
this approach has not been implemented in the field at a scale relevant to management.
Thus, implementing P. semeniperda with herbicides like imazapic may overcome
limitations associated with herbicide efficacy and longevity (i.e. inability to affect the
carryover seed bank).
More research is needed to test the risks, benefits and feasibility of P.
semeniperda for cheatgrass control. Field evaluations are needed to determine if spillover

84 effects are negligible, or if grass species with minimal P. semeniperda susceptibility or
fungicide applications are needed to lessen spillover risks. The logistics of mass
producing inoculum, finding an effective and economical field application method, and
determining an optimal inoculum rate also require further investigation (Medd and
Campbell 2005). Despite the additional research that is needed before commercial field-
scale application, P. semeniperda shows promise as a biological control agent for
cheatgrass. By integrating herbicides like imazapic and P. semeniperda, producers and
land managers may be able to improve management of one of the most problematic
annual grasses on western rangeland.

85
CHAPTER FIVE
SUMMARY OF FINDINGS AND DIRECTIONS FOR FUTURE RESEARCH
The invasion of cheatgrass is one of the most significant plant invasions in North
America. Most published research about cheatgrass control has emphasized the use of
herbicides, with recent focus on imazapic. However, the effects of rate and application
timing, and plant litter on imazapic efficacy have not been well documented. In addition,
integrating herbicides such as imazapic with a biological control has not been addressed
in the literature. To expand the information on cheatgrass control, I investigated how
different factors affect imazapic efficacy and persistence, as well determining whether a
favorable relationship exists between imazapic and Pyrenophora semeniperda, a seed-
killing fungal pathogen.
My first objective was to test the effect of imazapic application rate and timing,
and plant litter on cheatgrass control and desired plant species in range and Conservation
Reserve Program (CRP) lands. Results suggest that successful control of cheatgrass in
Montana can occur with imazapic; however, results are highly dependent on the annual
variability of cheatgrass populations, which is linked to seasonal precipitation. In general,
all imazapic rates reduced cheatgrass cover and biomass. Moreover, cheatgrass control
was achieved with a low imazapic rate, (70 g a.i. ha-1) which not only reduces the
potential of non-target injury, but also lessens economic costs associated with control. I
also found that early application of imazapic provides more consistent cheatgrass control,
meaning that cheatgrass can be treated once it becomes visible, giving land managers
confidence that it will be present the following growing season. Lastly, the effect of litter

86 was minimal, which suggests that decreasing plant litter will have little or no impact on
imazapic efficacy and cheatgrass control.
My second objective was to conduct a soil bioassay to determine imazapic
persistence as it relates to imazapic rate, plant litter presence, and time after herbicide
application. Findings suggest that herbicide degradation in Montana’s semiarid climate
appears to occur slowly. In fact, imazapic persisted in the soil through the following
spring. All three imazapic rates reduced cucumber and cheatgrass biomass below that of
the control. As in the field study associated with Objective 1, plant litter had a minimal
effect on cucumber or cheatgrass biomass and therefore did not appear to affect imazapic
persistence. Overall, applying imazapic in the fall not only controls cheatgrass seedlings
that emerge in the fall, but also controls spring-emerging seedlings, increasing the
likelihood of successful management.
My third objective was to determine the effects of integrating imazapic and P.
semeniperda on cheatgrass emergence, density, and biomass across varying seeding
depths. Although imazapic and P. semeniperda did not interact favorably, P.
semeniperda was found to effectively reduce cheatgrass emergence and density, while
imazapic effectively reduced biomass. The influence of P. semeniperda was heightened
just below the soil surface as indicated by lower cheatgrass emergence with the buried
seeding depth relative to the surface and litter seeding depths. This may have occurred
because of the combined insulation properties of the litter and soil, which likely led to
favorable seed microsite conditions for P. semeniperda infection. Thus, P. semeniperda
could be applied in advance of cheatgrass germination and emergence, allowing it to

87 inhibit cheatgrass emergence. After emergence, imazapic could be applied to reduce
cheatgrass biomass or even kill seedlings. Overall, P. semeniperda is able to reduce the
seedbank and limit future cheatgrass populations while imazapic can control any
seedlings that escape pathogen-caused mortality.
Future research on imazapic efficacy should incorporate climate data, specifically
precipitation, into models that are capable of forecasting cheatgrass populations. This
would give land managers the ability to prioritize areas for management. More long-term
(>2 years) research is also needed, to further investigate imazapic efficacy and
persistence. Such research should address the annual variability in cheatgrass populations
and how that influences management decisions. In addition, long-term research would
determine the ability of residual herbicides like imazapic to control cheatgrass beyond
one to two years post-treatment. Lastly, varying biotic and abiotic conditions in the field
may lessen the effectiveness of the inoculum and imazapic rates used in my study, or they
may result in residual P. semeniperda that could negatively affect seeded desirable
species.
The results of my work contribute to the knowledge of cheatgrass control as it
relates to chemical and biological control methods, specifically imazapic and P.
semeniperda. I hope that this information contributes to a more thorough understanding
of cheatgrass control in Montana’s semiarid climate, allowing greater control in the
future.

88
LITERATURE CITED

89 Allen, E. B. 1995. Restoration ecology: limits and possibilities in arid and semiarid lands. Pages 7-15 in Wildland shrub and arid land restoration symposium. Intermountain Research Station, Las Vegas, NV.
American Cyanamid Company. 2000. Plateau herbicide, for weed control, native grass establishment and turf growth suppression on roadsides and other noncrop areas. PE-47015. Parsippany, NJ.
Amsellem, Z., A. Sharon, J. Gressel, and P. C. Quimby, Jr. 1990. Complete abolition of high inoculum threshold of two mycoherbicides (Alternaria cassiae and A. crassa) when applied in invert emulsion. Phytopathology 80:925-929.
Archer, S., and A. Bowman. 2002. Understanding and managing rangeland plant communities. Pages 63–80 in A. C. Grice and K. C. Hodgkinson, editors. Global Rangelands: Progress and Prospects. CAB International.
Ashley, M.C., and W.S. Longland. 2007. Microsatellite evidence of facultative outcrossing in cheatgrass (Bromus tectorum): Implications for the evolution of invasiveness. Plant Species Biology 22:197-204.
Bates, D., M. Maechler, and B. Bolker. 2012. lme4: Linear mixed-effects models using S4 classes. R package version 0.999999-0. http://CRAN.R-project.org/package=lme4.
BASF Corporation. 2008. Plateau® herbicide label. 26 Davis Drive, Research Triangle Park, NC 27709.
Beckstead, J., S.E. Meyer, B.M. Connolly, M.B. Huck, and L.E. Street. 2010. Cheatgrass facilitates spillover of a seed bank pathogen onto native grass species. Journal of Ecology 98:168-177.
Beckstead, J., S.E. Meyer, C. J. Molder, and C. Smith. 2007. A race for survival: Can Bromus tectorum seeds escape Pyrenophora semeniperda-caused mortality by germinating quickly? Annals of Botany 99:907-914.
Boyette, C. D., G. E. Templeton, and L. R. Oliver. 1984. Texas gourd (Cucurbita texana) control with Fusarium solani f.sp. cucurbitae. Weed Sci. 32:649-657.
Bradford, J.B., and W.K. Lauenroth. 2006. Controls over invasion of Bromus tectorum: The importance of climate, soil, disturbance and seed availability. Journal of Vegetation Science 17:693-704.
Bradley, B.A. 2009. Regional analysis of the impacts of climate change on cheatgrass invasion shows potential risk and opportunity. Global Change Biology 15:196-208.

90 Bureau of Land Management (BLM). 1999. Out of Ashes, An Opportunity. Bureau of
Land Management, National Office of Fire and Aviation, Boise, ID.
Bussan, A. J., and W. E. Dyer. 1999. Herbicides and rangeland. Pages 116-132 in R. L. Sheley and J. K. Petroff, editors. Biology and Management of Noxious Rangeland Weeds. Oregon State University Press, Corvallis, OR.
Cable, D.R. 1975. Influence of precipitation on perennial grass production in the semidesert southwest. Ecology 56:981-986.
Call, C.A, J.M. Diamond, and N. Devoe. 2008. Effects of grazing and fire on seed dynamics and species composition of cheatgrass dominated rangeland. Joint meeting of the Society for Range Management and the America Forage and Grassland Council. Poster Presentation. Available at:
http://srm.confex.com/srm/2008/techprogram/MEETING.HTM. Accessed 07/31/2012.
Calo, A., S. Brause, and S. Jones. 2012. Integrated treatment with a prescribed burn and postemergent herbicide demonstrates initial success in managing cheatgrass in a northern Colorado natural area. Natural Areas Journal 32:300-304.
Campbell, M.A., R.W. Medd, and J.F. Brown. 1996. Growth and sporulation of Pyrenophora semeniperda in vitro: effects of culture media, temperature, and pH. Mycological Research 100:311-317.
Campbell, M.A., R.W. Medd, and J.B. Brown. 2003. Optimizing conditions for growth and sporulation of Pyrenophora semeniperda. Plant Pathology 52:448-454.
Chambers, J.C., B.A. Roundy, R.R. Blank, S.E. Meyer, and A. Whittaker. 2007. What makes Great Basin sagebrush ecosystems invasible by Bromus tectorum? Ecological Monographs 77:117-145.
Christy, A. L., K. A. Herbst, S. J. Kostka, J. P. Mullen, and P. S. Carlson. 1993. Synergizing weed biocontrol agents with chemical herbicides. p. 87-100 in S. 0. Duke, J. J. Menn, and J. R. Plimmer, eds. Pest Control with Enhanced Environmental Safety, ACS Symp. Ser. 524. American Chemical Society, Washington, DC.
Cobucci, T., H.T. Prates, C.L.M. Falcao, and M.M.V Rezende. 1998. Effect of imazamox, fomesafen, and acifluorfen soil residue on rotational crops. Weed Science 46:258-263.
Colquhoun, J. 2006. Herbicide persistence and carryover. University of Wisconsin Extension.

91 Cox, R. D., and V. J. Anderson. 2004. Increasing native diversity of cheatgrass-
dominated rangeland through assisted succession. Journal of Range Management 57:203-210.
Cutulle, M.A., J.S. McElroy, R.W. Millwood, J.C. Sorochan, and C.N. Stewart. 2009. Selection of bioassay method influences detection of annual bluegrass resistance to mitotic-inhibiting herbicides. Crop Science 49:1088-1095.
Davies, K. W. 2010. Revegetation of medusahead-invaded sagebrush steppe. Rangeland Ecology & Management 63:564–571. doi: 10.2111/REM-D-09-00127.1.
Davies, K. W., A. M. Nafus, and R. L. Sheley. 2010. Non-native competitive perennial grass impedes the spread of an invasive annual grass. Biological Invasions 12:3187-3194.
Daubenmire, R. 1959. A canopy-coverage method of vegetation analysis. Northwest Science 33: 43-66.
Davison, J.C., and E.G. Smith. 2007. Imazapic provides 2-year control of weedy annuals in a seeded Great Basin fuelbreak. Native Plants Journal 8:91-95.
DiTomaso, J.M. 2000. Invasive weeds in rangelands: Species, impacts, and management. Weed Science 48:255-265.
DiTomaso, J.M., M.L. Brooks, E.B. Allen, R. Minnich, P.M. Rice, and G.B. Kyser. 2006. Control of invasive weeds with prescribed burning. Weed Technology 20:535-548.
DiTomaso, J.M., R.A. Masters, and V.F. Peterson. 2010. Rangeland invasive plant management. Rangelands 32:43-47.
Dooley, S.R., and J. Beckstead. 2010. Characterizing the interaction between a fungal seed pathogen and a deleterious rhizobacterium for biological control of cheatgrass. Biological Control 53:197-203.
Eberle, D. O., and H. R. Gerber. 1976. Comparative studies of instrumental and bioassay methods for the analysis of herbicide residues. Archives of Environmental Contamination and Toxicology 4:101-118.
Elseroad, A.C., and N.T. Rudd. 2011. Can imazapic increase native species abundance in cheatgrass (Bromus tectorum) invaded native plant communities? Rangeland Ecology & Management 64:641-648.
Epanchin-Niell, R., J. Englin, and D. Nalle. 2009. Investing in rangeland restoration in the Arid West, USA: Countering the effects of an invasive weed on the long-term fire cycle. Journal of Environmental Management 91:370-379.

92 Evans, R. A. 1961. Effects of different densities of downy brome (Bromus tectorum) on
growth and survival of crested wheatgrass (Agropyron desertorum) in the greenhouse. Weeds 9:216-223.
Evans, R. A. and J. A. Young. 1970. Plant litter establishment of alien annual weed species in rangeland communities. Weed Sci. 18:697-703.
Facelli, J.M. and Pickett, S.T.A. 1991. Plant litter: light interception and effects on an old-field plant community. Ecology 72:1024-1031.
Fowers, B. 2011. Ecologically-based manipulation practices for managing Bromus tectorum-infested rangelands. M.S. thesis. Utah State University, Logan, UT.
Fowler, N.L. 1986. Microsite requirements for germination and establishment of three grass species. American Midland Naturalist 115: 131–145.
Ganskopp, D., and D. Bohnert. 2001. Nutritional dynamics of 7 northern Great Basin grasses. Journal of Range Management 54:640-647.
Garnier, E., O. Gobbin, and H. Poorter. 1995. Nitrogen productivity depends on photosynthetic nitrogen use efficiency and on nitrogen allocation within the plant. Annals of Botany 76:667-672.
Haferkamp, M.R., E E. Grings, R.K. Heitschmidt, M.D. Macneil, and M.G. Karl. 2001a. Suppression of annual bromes impacts rangeland: animal responses. Journal of Range Management 54:663-668.
Harmon, D.N., D.D. Clements, and J.A.Young. 2012. Effects of maternal environment on cheatgrass seed dormancy. In: Proceedings of Society for Range Management, January 29-February 3, 2012, Spokane, Washington. 65:46.
Harris, G.A. 1967. Some competitive relationships between Agropyron spicatum and Bromus tectorum. Ecological Monographs 37:89-111.
Hempy-Mayer, K., and D.A. Pyke. 2008. Defoliation effects on Bromus tectorum seed production: implications for grazing. Rangeland Ecology & Management 61:116-123.
Hirsch, M.C., T.A. Monaco, C.A. Call, and C.V. Ransom. 2012. Comparison of herbicides for reducing annual grass emergence in two Great Basin soils. Rangeland Ecol Manage 65:66-75.
Hodgson, R.H., L.A. Wymore, A.K. Watson, R.H. Snyder, and A. Collette. 1988. Efficacy of Colletotrichum coccodes and thidiazuron for velvetleaf (Abutilon theophrasti) control in soybean (glycine-max). Weed Technology 2:473-480.

93 Hothorn, T., F. Bretz, and P. Westfall. 2008. Simultaneous inference in general
parametric models. Biometrical Journal 50:346-363.
Hull, A.C., Jr. 1965. Cheatgrass – a persistent homesteader. Pages 20-26 in Proceedings, cheatgrass symposium, 1965, July 27-30. U.S. Department of the Interior, Oregon Bureau of Land Management, Vale, OR.
Hull, A.C., Jr., and G. Stewart. 1948. Replacing cheatgrass by reseeding with perennial grass on southern Idaho ranges. American Society of Agronomy Journal 40:694-703.
Humphrey, L.D., and E.W. Schupp. 2001. Seed banks of Bromus tectorum-dominated communities in the Great Basin. W.N. Am. Nat 61:85-92.
Jacobs, J.S., M.F. Carpinelli, and R.L. Sheley. 1999. Revegetating noxious weed-infested rangeland. Pages 133-141 in R.L. Sheley and J.K. Petroff, editors. Biology and Mangement of Noxious Rangeland weeds. Oregon State University, Corvallis, OR.
James, J.J. 2008a. Effect of soil nitrogen stress on the relative growth rate of annual and perennial grasses in the Intermountain West. Plant Soil 310:201-210.
James, J.J. 2008b. Leaf nitrogen productivity as a mechanism driving the success of invasive annual grasses under low and high nitrogen supply. Journal of Arid Environments 72:1775-1784.
Jones, R. W. and J. G. Hancock. 1990. Soilbome fungi for biological control of weeds. p. 276-286 in R. E. Hoagland, ed. Microbes and Microbial Products as Herbicides, ACS Symp. Ser. 439. American Chemical Society, Washington, DC.
Julien, M.H. 1992. Biological control of weeds: a world catalogue of agents and their target weeds. Academic Press, New York, N.Y
Keen, N.T., M.J. Holliday, and M. Yoshikawa. 1982. Effects of glyphosate on glyceollin production and the expression of resistance to Phytophthora megasperma F sp glycinea in soybean. Phytopathology 72:1467-1470.
Kennedy, A.C., L.F. Elliott, F.L. Young, and C.L. Douglas. 1991. Rhizobacteria suppressive to the weed downy brome. Soil Science Society of America Journal 55:722-727.
Kennedy, A.C., B.N. Johnson, and T.L. Stubbs. 2001. Host range of a deleterious rhizobacterium for biological control of downy brome. Weed Science 49:792-797.
Klemmedson, J.O., and J.G. Smith. 1964. Cheatgrass (Bromus tectorum). Botanical Review 30:226-262.

94 Knapp, P.A. 1996. Cheatgrass (Bromus tectorum L.) dominance in the Great Basin
desert: History, persistence, and influences to human activities. Global Environ. Change 6:37-52.
Krueger-Mangold, J., R.L. Sheley, and T.J. Svejcar. 2006. Toward ecologically-based invasive plant management on rangeland. Weed Science 54:597-605.
Kyser, G.B., J.M. DiTomaso, M.P. Doran, S.B. Orloff, R.G. Wilson, D.L. Lancaster, D.F. Lile, and M.L. Porath. 2007. Control of medusahead (Taeniatherum caput-medusae) and other annual grasses with imazapic. Weed Technology 21:66-75.
Leger, E. 2008. The adaptive value of remnant native plants in invaded communities: an example from the Great Basin. Ecological Applications 18:1226-1235.
Louda, S., and R.A. Masters. 1993. Biological control of weeds in Great Plains rangelands. Great Plains Research 3:215-247.
Loux, M.M., and K.D. Reese. 1992. Effect of soil pH on adsorption and persistence of imazaquin. Weed Science 40:490-496.
Mack, R.N. 1981. Invasion of Bromus tectorum L. into western North America: An ecological chronicle. Agro-Ecosystems 7:145-165.
Mack, R.N. 2011. Fifty years of 'waging war on cheatgrass', research advances, while meaningful control languishes. Pages 253-265 in D. M. Richardson, editor. Fifty Years of Invasion Ecology: The Legacy of Charles Elton. Wiley-Blackwell, Oxford, U.K.
Mack, R.N., and D.A. Pyke. 1983. The demography of Bromus tectorum: variation in time and space. Journal of Ecology 71:69-93.
Mangla, S., R.L. Sheley, J.J. James, and S.R. Radosevich. 2011. Field growth comparisons of invasive alien annual and native perennial grasses in monocultures. Journal of Arid Environments 75:206-210.
Mangold, J., H. Parkinson, C. Duncan, P. Rice, E. Davis, and F. Menalled. Controlling downy brome (Bromus tectorum L.) with imazapic on Montana rangeland. Invasive Plant Science and Management. In review.
Marchesan, E., F.M. dos Santos, M. Grohs, L.A. de Avila, S.L.O. Machado, S.A. Senseman, P.F.S. Massoni, and G.M.S. Sartori. 2010. Carryover of imazethapyr and imazapic to nontolerant rice. Weed Technology 24:6-10.
Masters, R.A., and R.L. Sheley. 2001. Principles and practices for managing rangeland invasive plants. Journal of Range Management 54:502-517.

95 Maxwell, B.D., E. Lehnhoff, and L.J. Rew. 2009. The rationale for monitoring invasive
plant populations as a crucial step for management. Invasive Plant Science and Management 2:1-9.
Medd, R.W., and M.A. Campbell. 2005. Grass seed infection following inundation with Pyrenophora semeniperda. Biocontrol Science and Technology 15:21-36.
Medd, R.W., G.M. Murray, and D.I. Pickering. 2003. Review of the epidemiology and economic importance of Pyrenophora semeniperda. Australasian Plant Pathology 32:539-550.
Meyer, S.E., J. Beckstead, P.S. Allen, and D.C. Smith. 2008b. A seed bank pathogen causes seedborne disease: Pyrenophora semeniperda on undispersed grass seeds in western North America. Can. J. Plant Pathol. 30:525-533.
Meyer, S E., D.L. Nelson, and S. Clement. 2001. Evidence for resistance polymorphism in the Bromus tectorum – Ustilago bullata pathosystem: implications for biocontrol. Canadian Journal of Plant Pathology 23:19-27.
Meyer, S.E., D.L. Nelson, S. Clement, and J. Beckstead. 2008a. Cheatgrass (Bromus tectorum) biocontrol using indigenous fungal pathogens. USDA Forest Service Proceedings RMRS-P-52:61-67.
Meyer, S.E., J. Beckstead, P.S. Allen, and D.C. Smith. 2008b. A seed bank pathogen causes seedborne disease: Pyrenophora semeniperda on undispersed grass seeds in western North America. Can. J. Plant Pathol. 30:525-533.
Meyer, S.E., D. Quinney, D.L. Nelson, and J. Weaver. 2007. Impact of the pathogen Pyrenophora semeniperda on Bromus tectorum seedbank dynamics in North American cold deserts. Weed Technology 47:54-62.
Miller, Z., H. Parkinson, and J. Mangold. Preliminary assessment of potential and risk of the proposed cheatgrass biocontrol agent (Pyrenophora semeniperda) in cereal crops and rangelands. Journal of Applied Ecology. In preparation.
Miller, M.E., R.L. Reynolds, S.W. Beatty, and J. Belnap. 2006. Performance of Bromus tectorum L. in relation to soil properties, water additions, and chemical amendments in calcareous soils of southeastern Utah, USA. Plant Soil 288:1–18.
Monaco, T.A., T.M. Osmond, and S.A. Dewey. 2005. Medusahead control with fall- and spring-applied herbicides on northern Utah foothills. Weed Technology 19:653-658.
Morris, C., T.A. Monaco, and C.W. Rigby. 2009. Variable impacts of imazapic rate on downy brome (Bromus tectorum) and seeded species in two rangeland communities. Invasive Plant Science and Management 2:110-119.

96 Moyer, J. R., and R. Esau. 1996. Imidazolinone herbicide effects on following rotational
crops in southern Alberta. Weed Technology 10:100-106.
Murray, R.B., H.F. Mayland, and P.J. Van Soest. 1978. Growth and nutritional value to cattle of grasses on cheatgrass range in southern Idaho. Research Paper INT-199. USDA Forest Service, Intermountain Forest and Range Experiment Station, Ogden, UT. 57 p.
National Climate Data Center (NCDC). 2002. Montana Climate Summary. www.noaa.gov
National Park Service. 2012. The Great Basin. http://www.nps.gov/grba/planyourvisit/the-great-basin.htm
Norris, R.F. 2011. Integrated Pest Management. Pages 353-355 in Simberloff, D., and M. Rejmanek, editors. 2011. Encyclopedia of Biological Invasions. University of California Press. 765 p.
Owen, S.M., C.H. Sieg, and C.A. Gehring. 2011. Rehabilitating downy brome (Bromus tectorum)–invaded shrublands using imazapic and seeding with native shrubs. Invasive Plant Science and Management 4:223-233.
Pellant, M. 1996. Cheatgrass: The Invader that Won the West. Bureau of Land Management, Idaho State Office, Boise, ID. 22 p.
Pellant, M., J. Kaltenecker, and S. Jirik. 1999. Use of OUST® Herbicide to Control Cheatgrass in the Northern Great Basin. USDA Forest Service Proceedings RMRS-P-9:322-326.
Peters, E.F., and S.C. Bunting. 1994. Conditions pre- and post-occurrence of annual grasses on the Snake River Plain. Pages 31-36 in S.B. Monsen and S.G. Kitchen, editors. Proceedings-Ecology and Management of Annual Rangelands. USDA Forest Service, Intermountain Research Station, Ogden, UT. General Technical Report INT-GTR-313.
Peterson, D.E., C.R. Thompson, D.E. Shoup, and B.L. Olson. 2010. Herbicide Mode of Action. Kansas State University Extension.
Pickford, G.D. 1932. The influence of continued heavy grazing and promiscuous burning on spring-fall ranges in Utah. Ecology 13:159-171.
Prostko, E.P., T.L. Grey, R.N. Morgan, and J.W. Davis. 2005. Oat (Avena sativa) response to imazapic residues. Weed Technology 19:875-878.
97 R Core Team. 2012. R: A language and environment for statistical computing. R
Foundation for Statistical Computing, Vienna, Austria. ISBN 3-900051-07-0. http://www.R-project.org/.
Rahe, J.E., C.A. Levesque, and G.S. Johal. 1990. Pages 260-275 in R.E. Hoagland, editor. Microbes and Microbial Products as Herbicides. ACS Symposium Series No. 439. American Chemical Society, Washington, D.C.
Radosevich, S.R., J.S. Hold, and C.M Ghersa. 2007. Ecology of weeds and invasive plants: Relationships to agriculture and natural resource management. Third edition. John Wiley & Sons, Inc., Hoboken, NJ. 454 p.
Ranft, R. D., S. S. Seefeldt, M. Zhang, and D. L. Barnes. 2010. Development of a soil bioassay for triclopyr residues and comparison with a laboratory extraction. Weed Technology 24:538-543.
Rew, L.J., B.D. Maxwell, and R. Aspinall. 2005. Predicting the occurrence of nonindigenous species using environmentally remotely sensed data. Weed Science 53:2236-241.
Rice, P.M. 2003. Invaders database system, University of Montana, Missoula, MT. http://invader.dbs.umt.edu.
Rice, P.M. 2005. Downy brome, Bromus tectorum L. Invasive plants of range and wildlands and their environmental, economic, and societal impacts. Ed. C.A. Duncan and J.K. Clark. Weed Science Society of America 147-170.
Rickard, H., and J.F. Cline. 1980. Cheatgrass Communities : Effect of plowing on species composition and productivity. Northwest Science 54:216-221.
Ross, M.A., and C.A. Lembi. 1999. Applied Weed Science. Second edition. Burgess, Minneapolis, MN.
SAS Version 9.3 for Windows 7. 2012. SAS Institute Inc., Cary, NC, USA.
Schmelzer, L., B.L. Perryman, K. Conley, T. Wuliji, L.B. Bruce, and K. Piper. 2008. Fall grazing to reduce cheatgrass fuel loads. Society for Range Management 2008.
Schwinning, S., and J.R. Ehleringer. 2001. Water use trade-offs and optimal adaptations to pulse-driven arid ecosystems. J. Ecol. 89:464-480.
Sharon, A., Z. Amsellem, and J. Gressel. 1992. Glyphosate suppression of an elicited defense response – increased susceptibility of Cassia obtusifolia to a mycoherbicide. Plant Physiology 98:654-659.

98 Sheley, R.L., MF. Carpinelli, and K.J. Reever Morgan. 2007. Effect of imazapic on target
and nontarget vegetation during revegetaion. Weed Technology 21:1071-1081.
Sheley, R.L., and J. Krueger-Mangold. 2003. Principles for restoring invasive plant-infested rangeland. Weed Science 51:260-265.
Sheppard, A.W. 1992. Predicting biological weed control. Trends Ecol. Evol. 7:290-296.
Smith, D.C., S.E. Meyer, and V.J. Anderson. 2008. Factors affecting Bromus tectorum seed bank carryover in western Utah. Rangeland Ecol. Manag. 61:430-436.
Sperry, L.J., J. Belnap, and R.D. Evans. 2006. Bromus tectorum invasion alters nitrogen dynamics in an undisturbed arid grassland ecosystem. Ecology 87:603-615.
Steckel, G.J., L.M. Wax, F. William Simmons, and W.H. Phillips III. 1997. Glufosinate efficacy on annual weeds is influenced by rate and growth stage. Weed Technology 11:484-488.
Stewart, G., and A. C. Hull. 1949. Cheatgrass (Bromus tectorum L.) – an ecologic intruder in southern Idaho. Ecology 30:58-74.
Stewart, T.E. 2009. The grass seed pathogen Pyrenophora semeniperda as a biocontrol agent for annual brome grasses. M.S. thesis. Brigham Young University, Provo, UT.
Streibig, J. C. 1988. Herbicide bioassay. Weed Research 28:479-484.
Tranel, P.J., D.R. Gealy, and A.C. Kennedy. 1993. Inhibition of downy brome (Bromus tectorum) root growth by a phytotoxin from Pseudomonas fluorescens strain D7. Weed Technology 7:131-139.
Tu, M., C. Hurd, and J.M. Randall. 2001. Weed Control Methods Handbook. The Nature Conservancy, Version: April 2001. http://tncweeds.ucdavis.edu.
Ulbrich, A.V., J.R.P. Souza, and D. Shaner. 2005. Persistence and carryover effect of imazapic and imazapyr in Brazilian cropping systems. Weed Technology 19:986-991.
USDA, NRCS. The PLANTS database. National Plant Data Team, Greensboro, NC. http://plants.usda.gov.
Vale, T.R. 1974. Sagebrush conversion projects: an element of contemporary environmental change in the western United States. Biological Conservation 6:274-284.

99 Vasquez, E., R. Sheley, and T. Svejcar. 2008. Nitrogen enhances the competitive ability
of cheatgrass (Bromus tectorum) relative to native grasses. Invasive Plant Science and Management 1:284-295.
Watson, A.K. 1989. Current advances in bioherbicide research. In Proceedings of the Brighton Crop Protection Conference. Weeds 3:987-996.
Weaver, J.E. and Rowland, N.W. 1952. Effects of excessive natural mulch on development, yield, and structure of native grassland. Botanical Gazette 114:1-19.
Weidemann, G. J. 1988. Effects of nutritional amendments on conidial production of Fusarium solani f.sp. cucurbitae on sodium alginate granules and on control of Texas gourd. Plant Dis. 72:757-759.
Whisenant, S.G. 1990. Changing fire frequencies on Idaho’s Snake River Plains: ecological and management implications. Pages 4-10 in E.D. McArthur, E.M. Romney, S.D. Smith, and P.T. Tueller, editors. Proceedings of the Symposium on Cheatgrass Invasion, Shrub Die-off, and Other Aspects of Shrub Biology and Management. USDA Forest Service, Intermountain Research Station, Ogden, UT. Technical Report INT-GTR-313.
Whitson, T.O.M.D., and D.W. Koch. 1998. Control of downy brome (Bromus tectorum) with herbicides and perennial grass competition. Weed Technology 12:391-396.
Wilson, L.M., and J.P. McCaffrey. 1999. Biological control of noxious rangeland weeds. Pages 97-116 in R.L. Sheley and J.K. Petroff, editors. Biology and Management of Noxious Rangeland Weeds. Oregon State University Press, Corvallis, OR.
Wymore, L.A., A.K. Watson, and A.R. Gotlieb. 1987. Interaction between Colletotrichum coccodes and thidazuron for control of velvetleaf (Abutilon theophrasti). Weed Science 35:377-383.Young, J.A., and R.A. Evans. 1975. Germinability of seed reserves in a big sagebrush community. Weed Science 23:358-364.
Young, J.A., and R.A. Evans. 1978. Population dynamics after wildfires in sagebrush grasslands. Journal of Range Management 31:283-289.
Young, J.A., R.A. Evans, and R.E. Eckert. 1969. Wheatgrass establishment with tillage and herbicides in a mesic medusahead community. Journal of Range Management 22:151-155.

100
APPENDICES

101
APPENDIX A
CHAPTER TWO STATISTICAL MODEL

102
Statistical Model
Proc Mixed for Experiment I (Rate x Litter) and Experiment II (Rate x Timing). Note that for Experiment II, “litter” is replaced with “application timing.”
model Functional Group = year litter litter*year rate rate*year litter*rate litter*rate*year/ddfm=kr; random block(year) litter*block(year) rate*block(year)

103
APPENDIX B
CHAPTER THREE STATISTICAL MODEL

104
Statistical Model
Input e.g.) Big Timber Cheatgrass 2012, i.e. “BTcheat2012”
Obs trial block rate litter trt d1 d2 d3 d4 d5 d6
1 2 1 0 no 1 12.0 7.6 42.0 82.0 104.0 12
2 2 2 0 no 1 82.0 16.5 112.0 125.8 212.0 26
3 2 3 0 no 1 26.0 34.0 214.0 196.0 172.0 22
4 2 4 0 no 1 65.0 27.7 118.0 188.0 202.0 36
5 2 1 0 yes 2 13.1 15.2 136.0 60.0 188.0 18
6 2 2 0 yes 2 24.0 14.0 134.0 166.0 198.0 42
7 2 3 0 yes 2 19.1 18.8 188.0 180.0 164.0 60
8 2 4 0 yes 2 40.0 38.0 136.0 240.0 264.0 50
9 2 1 4 no 3 3.5 3.9 7.9 3.1 18.0 18 10 2 2 4 no 3 4.0 4.0 6.0 5.2 10.2 5 11 2 3 4 no 3 3.2 5.0 3.5 10.4 64.0 38 12 2 4 4 no 3 2.8 0.9 8.0 7.7 16.7 36 13 2 1 4 yes 4 4.0 2.7 15.8 14.3 42.6 14 14 2 2 4 yes 4 4.5 8.9 7.5 8.0 28.0 34 15 2 3 4 yes 4 2.4 4.3 3.6 15.6 54.0 26 16 2 4 4 yes 4 1.9 5.2 10.0 24.1 . 52 17 2 1 8 no 5 3.6 1.9 0.7 6.8 8.5 30 18 2 2 8 no 5 0.6 2.5 4.2 2.3 5.1 24 19 2 3 8 no 5 2.5 2.0 5.5 5.8 28.6 18 20 2 4 8 no 5 5.3 2.3 3.1 6.0 40.7 36 21 2 1 8 yes 6 2.3 2.7 8.5 2.1 9.9 24 22 2 2 8 yes 6 1.8 1.6 4.6 5.0 9.7 18 23 2 3 8 yes 6 2.3 1.7 2.1 2.5 10.3 26 24 2 4 8 yes 6 1.2 3.6 16.0 6.6 16.0 36 25 2 1 12 no 7 2.8 2.7 6.0 4.1 11.7 18 26 2 2 12 no 7 1.7 2.4 2.2 4.0 5.0 30

105
Obs trial block rate litter trt d1 d2 d3 d4 d5 d6
27 2 3 12 no 7 2.0 1.6 4.4 3.1 22.0 30 28 2 4 12 no 7 5.0 4.0 1.3 5.8 8.2 24 29 2 1 12 yes 8 2.2 2.7 4.3 4.3 21.0 18 30 2 2 12 yes 8 5.0 4.0 3.6 3.4 6.0 16 31 2 3 12 yes 8 1.5 2.5 3.2 1.9 6.1 26 32 2 4 12 yes 8 1.2 1.2 2.6 3.4 3.8 36
Note: “trial,” 1 = 2011, 2 = 2012; “rate” is in oz product/A; “litter,” no = reduced litter, yes = ambient litter; d1 = 0 DPA; d2 = 15 DPA; d3 = 28 DPA; d4 = 58 DPA; d5 = 185 DPA; d6 = 287 DPA. Model Statement proc mixed data = BTcheat2012 covtest cl ic; class block rate litter; model d1 = block rate litter rate*litter /ddfm=KR outp=R; repeated/ group=rate; lsmeans rate litter rate*litter / diff adjust=Tukey; Output Note: Only output for d1 is given.
Model Information
Data Set WORK.BTCHEAT2012 Dependent Variable d1 Covariance Structure Variance Components Group Effect rate Estimation Method REML Residual Variance Method None Fixed Effects SE Method Kenward-Roger Degrees of Freedom Method Kenward-Roger

106
Class Level Information
Class Levels Values
block 4 1 2 3 4 rate 4 0 4 8 12 litter 2 no yes
Dimensions
Covariance Parameters 4 Columns in X 19 Columns in Z 0 Subjects 32 Max Obs Per Subject 1
Number of Observations
Number of Observations Read 32 Number of Observations Used 32 Number of Observations Not Used 0
Iteration History
Iteration Evaluations -2 Res Log Like Criterion
0 1 179.64218300 1 2 135.67814214 0.00398222 2 1 132.02083664 0.00943035 3 1 129.30114324 0.02428899 4 1 127.10628944 0.05751304 5 1 125.55894254 0.09156402 6 1 123.50059010 0.00197289 7 1 122.01443357 0.00197669 8 1 120.84695780 0.00135810

107
Iteration History
Iteration Evaluations -2 Res Log Like Criterion
9 1 120.78475576 0.00006106 10 1 120.78215887 0.00000019 11 1 120.78215124 0.00000000
Convergence criteria met.
Covariance Parameter Estimates
Cov Parm Group Estimate Standard
Error Z
Value Pr > Z Alpha Lower Upper
Residual rate 0 602.77 348.12 1.73 0.0417 0.05 250.24 2924.99 Residual rate 4 0.3240 0.2772 1.17 0.1212 0.05 0.1001 5.5205 Residual rate 8 3.5534 2.1775 1.63 0.0514 0.05 1.4159 19.7586 Residual rate 12 2.8119 1.6629 1.69 0.0454 0.05 1.1486 14.3832
Fit Statistics
-2 Res Log Likelihood 120.8 AIC (smaller is better) 128.8 AICC (smaller is better) 131.3 BIC (smaller is better) 134.6
Null Model Likelihood Ratio Test
DF Chi-Square Pr > ChiSq
3 58.86 <.0001

108
Information Criteria
Neg2LogLike Parms AIC AICC HQIC BIC CAIC
120.8 4 128.8 131.3 130.7 134.6 138.6
Type 3 Tests of Fixed Effects
Effect Num DF Den DF F Value Pr > F
block 3 4.04 2.68 0.1810 rate 3 9.07 4.61 0.0319 litter 1 6.13 1.87 0.2194 rate*litter 3 9.07 0.60 0.6311
Least Squares Means
Effect litter rate Estimate Standard
Error DF t Value Pr > |t|
rate 0 35.1500 8.6802 6 4.05 0.0067 rate 4 3.2875 0.2013 2.73 16.34 0.0008 rate 8 2.4500 0.6665 5.33 3.68 0.0128 rate 12 2.6750 0.5929 5.72 4.51 0.0046 litter no 13.8750 3.0859 6.13 4.50 0.0039 litter yes 7.9062 3.0859 6.13 2.56 0.0420 rate*litter no 0 46.2500 12.2757 6 3.77 0.0093 rate*litter yes 0 24.0500 12.2757 6 1.96 0.0978 rate*litter no 4 3.3750 0.2846 2.73 11.86 0.0020 rate*litter yes 4 3.2000 0.2846 2.73 11.24 0.0023 rate*litter no 8 3.0000 0.9425 5.33 3.18 0.0224 rate*litter yes 8 1.9000 0.9425 5.33 2.02 0.0964 rate*litter no 12 2.8750 0.8384 5.72 3.43 0.0151 rate*litter yes 12 2.4750 0.8384 5.72 2.95 0.0270

109
Differences of Least Squares Means
Effect litter
rate
litter
_rate
Estimate
Standard Error DF
t Value
Pr > |t|
Adjustment Adj P
rate 0 4 31.8625
8.6825 6 3.67 0.0104
Tukey-Kramer
0.0218
rate 0 8 32.7000
8.7058 6.07
3.76 0.0093
Tukey-Kramer
0.0192
rate 0 12 32.4750
8.7004 6.05
3.73 0.0096
Tukey-Kramer
0.0198
rate 4 8 0.8375 0.6962 6.46
1.20 0.2712
Tukey-Kramer
0.6401
rate 4 12 0.6125 0.6261 7.04
0.98 0.3604
Tukey-Kramer
0.7649
rate 8 12 -0.2250 0.8920 10.4
-0.25 0.8058
Tukey-Kramer
0.9940
litter no yes 5.9688 4.3641 6.13
1.37 0.2194
Tukey 0.2194
rate*litter
no 0 yes 0 22.2000
17.3604 6 1.28 0.2482
Tukey-Kramer
0.8863
rate*litter
no 0 no 4 42.8750
12.2790 6 3.49 0.0129
Tukey-Kramer
0.0803
rate*litter
no 0 yes 4 43.0500
12.2790 6 3.51 0.0127
Tukey-Kramer
0.0788
rate*litter
no 0 no 8 43.2500
12.3118 6.07
3.51 0.0124
Tukey-Kramer
0.0780
rate*litter
no 0 yes 8 44.3500
12.3118 6.07
3.60 0.0111
Tukey-Kramer
0.0689
rate*litter
no 0 no 12 43.3750
12.3043 6.05
3.53 0.0123
Tukey-Kramer
0.0767
rate*litter
no 0 yes 12 43.7750
12.3043 6.05
3.56 0.0118
Tukey-Kramer
0.0733
rate*litter
yes 0 no 4 20.6750
12.2790 6 1.68 0.1432
Tukey-Kramer
0.6975
rate*litter
yes 0 yes 4 20.8500
12.2790 6 1.70 0.1404
Tukey-Kramer
0.6899

110
Differences of Least Squares Means
Effect litter
rate
litter
_rate
Estimate
Standard Error DF
t Value
Pr > |t|
Adjustment Adj P
rate*litter
yes 0 no 8 21.0500
12.3118 6.07
1.71 0.1376
Tukey-Kramer
0.6836
rate*litter
yes 0 yes 8 22.1500
12.3118 6.07
1.80 0.1216
Tukey-Kramer
0.6353
rate*litter
yes 0 no 12 21.1750
12.3043 6.05
1.72 0.1356
Tukey-Kramer
0.6776
rate*litter
yes 0 yes 12 21.5750
12.3043 6.05
1.75 0.1296
Tukey-Kramer
0.6600
rate*litter
no 4 yes 4 0.1750 0.4025 2.73
0.43 0.6957
Tukey-Kramer
0.9997
rate*litter
no 4 no 8 0.3750 0.9846 6.46
0.38 0.7155
Tukey-Kramer
0.9999
rate*litter
no 4 yes 8 1.4750 0.9846 6.46
1.50 0.1813
Tukey-Kramer
0.7924
rate*litter
no 4 no 12 0.5000 0.8854 7.04
0.56 0.5898
Tukey-Kramer
0.9986
rate*litter
no 4 yes 12 0.9000 0.8854 7.04
1.02 0.3431
Tukey-Kramer
0.9600
rate*litter
yes 4 no 8 0.2000 0.9846 6.46
0.20 0.8453
Tukey-Kramer
1.0000
rate*litter
yes 4 yes 8 1.3000 0.9846 6.46
1.32 0.2316
Tukey-Kramer
0.8705
rate*litter
yes 4 no 12 0.3250 0.8854 7.04
0.37 0.7244
Tukey-Kramer
0.9999
rate*litter
yes 4 yes 12 0.7250 0.8854 7.04
0.82 0.4397
Tukey-Kramer
0.9872
rate*litter
no 8 yes 8 1.1000 1.3329 5.33
0.83 0.4446
Tukey-Kramer
0.9866
rate*litter
no 8 no 12 0.1250 1.2615 10.4
0.10 0.9230
Tukey-Kramer
1.0000
rate*litter
no 8 yes 12 0.5250 1.2615 10.4
0.42 0.6857
Tukey-Kramer
0.9998

111
Differences of Least Squares Means
Effect litter
rate
litter
_rate
Estimate
Standard Error DF
t Value
Pr > |t|
Adjustment Adj P
rate*litter
yes 8 no 12 -0.9750 1.2615 10.4
-0.77 0.4568
Tukey-Kramer
0.9907
rate*litter
yes 8 yes 12 -0.5750 1.2615 10.4
-0.46 0.6579
Tukey-Kramer
0.9996
rate*litter
no 12 yes 12 0.4000 1.1857 5.72
0.34 0.7479
Tukey-Kramer
1.0000

112
APPENDIX C
CHAPTER FOUR STATSTICAL MODELS AND SUPPLEMENTAL INFORMATION

113
Statistical Models
Emergence require(lme4) library(MASS) emergence<-glmer(Prop.~BFOD*Seed.Depth+(1|Trial.By.Rep), binomial,weights=Possible,data=beforespray) summary(aov(emergence)) Density require(nlme) density<-lme(Density~BFOD*HERB*PD, random=~1|Trial.By.Rep,data=BFODd) density summary(density) anova(density) Biomass require(lme4) library(MASS) biomass<-lmer(Bm.per.pot~BFOD*HERB*PD+(1|Trial.By.Rep), data=BFODd) summary(biomass) summary(aov(biomass))
Supplemental Information
Specifications of the PGC 50/50 Mix Description PGC Soil Mix Equal parts (by volume) of loam soil: washed
concrete sand:Canadian Sphagnum peat moss. AquaGro 2000 G wetting agent is blended in at
594 g per cubic meter of soil mix. Aerated steam pasteurized at 70˚C for 60 minutes.
Sunshine Mix #1 Canadian Sphagnum Peat Moss, perlite, vermiculite, starter nutrient charge, wetting agent,
and Dolomitic lime.