enhancing dengue fever modeling through a multi …
TRANSCRIPT
ENHANCING DENGUE FEVER MODELING THROUGH A MULTI-SCALE
ANALYSIS FRAMEWORK – A CASE STUDY IN THE CENTRAL
VALLEY OF COSTA RICA
DISSERTATION
Presented to the Graduate Council of
Texas State University-San Marcos
in Partial Fulfillment
of the Requirements
for the Degree
Doctor of PHILOSOPHY
by
Robinson Roberto Campos Rodríguez, B.A., M.S.
San Marcos, Texas
August 2013

ENHANCING DENGUE FEVER MODELING THROUGH A MULTI-SCALE
ANALYSIS FRAMEWORK – A CASE STUDY IN THE CENTRAL
VALLEY OF COSTA RICA
Committee Members Approved:
__________________________
Sven Fuhrmann, Chair
__________________________
John Tiefenbacher
__________________________
Richard Dixon
__________________________
Rodion Podorozhny
Approved:
________________________
J. Michael Willoughby
Dean of the Graduate College
COPYRIGHT
by
Robinson Roberto Campos Rodríguez
August 2013
FAIR USE AND AUTHOR’S PERMISSION STATEMENT
Fair Use
This work is protected by the Copyright Laws of the United States (Public Law 94-553,
section 107). Consistent with fair use as defined in the Copyright Laws, brief quotations
from this material are allowed with proper acknowledgement. Use of this material for
financial gain without the author’s expressed written permission is not allowed.
Duplication Permission
As the copyright holder of this work I, Robinson Roberto Campos Rodríguez, authorize
duplication of this work, in whole or in part, for educational or scholarly purposes only.

v
ACKNOWLEDGEMENTS
I would never have been able to finish my dissertation without the guidance of my
committee members, help from friends, and support from my family.
I would like to express my deepest gratitude to my advisor, Dr. Sven Fuhrmann,
for his excellent guidance, caring attitude, patience, and for providing me with an
appropriate atmosphere for doing research. In addition, I would also like to thank all my
committee members for guiding my research for the past several years and helping me to
develop a scholarly background in my research area. Special thanks go to Dr. Richard
Dixon, who was willing to participate on my committee at the last moment. Professor
Emeritus Dick Richardson of the University of Texas served on my committee early on
and gave me many ideas and a great deal of encouragement until he could no longer
participate due to illness.
I would like to thank Diane Click who as good friend was always willing to help
and give her best suggestions. It would have been a much more difficult task without her.
Many thanks to all those people that I may not be able to mention here for helping me
and supporting me all this years of study. My research would not have been possible
without their help. I would also like to thank my parents. They were always supporting
me and encouraging me with their best wishes. Finally, I would like to thank my best
friend, Allen Click. He was always there cheering me up and stood by me through the
good times and bad.
This manuscript was submitted on July 2, 2013.

vi
TABLE OF CONTENTS
Page
ACKNOWLEDGEMENTS .................................................................................................v
LIST OF TABLES ........................................................................................................... viii
LIST OF FIGURES ........................................................................................................... ix
LIST OF ABBREVIATIONS ............................................................................................ xi
ABSTRACT ..................................................................................................................... xiii
CHAPTER
I. INTRODUCTION
1.1 Problem Statement .......................................................................................1
1.2 Scope ............................................................................................................5
1.3 Hypothesis and Research Questions ............................................................8
1.4 Methodological Approach .........................................................................10
1.5 Expected Results ........................................................................................15
II. REVIEW OF RELATED LITERATURE
2.1.1 Dengue Fever .......................................................................................18
2.1.2 Social and Cultural Aspects of the Disease .........................................22
2.1.3 GIS and Statistical Applications to Epidemiology ..............................29
2.1.4 Computer and Mathematical Modeling ...............................................33
2.1.5 Agent-Based Modeling ........................................................................35
III. RESEARCH DESIGN AND METHODOLOGY
3.1.1 The Study Area ....................................................................................54
3.1.2 Base Data for the Study .......................................................................56
3.1.3 GIS Analysis ........................................................................................57
3.1.4 ArcGIS Geo-statistical Analyst............................................................58
3.1.5 Agent-based Modeling Analysis ..........................................................59
3.1.6 Proposed Framework for Dengue Fever Modeling .............................62

vii
IV. ANALYSIS OF DATA / RESULTS
4.1.1 Organization of Data Analysis .............................................................73
4.1.2 Research Questions and Associated Hypotheses .................................75
4.1.3 Analysis of Data ...................................................................................76
V. FINDINGS, CONCLUSIONS, AND IMPLICATIONS
5.1.1 Findings..............................................................................................112
5.1.2 Conclusions ........................................................................................116
5.1.3 Implications and Limitations .............................................................118
5.1.4 Future Research .................................................................................121
5.1.5 Summary of the Study .......................................................................124
WORKS CITED .............................................................................................................129

viii
LIST OF TABLES
Table Page
1. Statistical Models and ABMs Complement Each Other .............................................38
2. Susceptibility Analysis of the Annual Rates of Dengue Cases....................................74
3. Result of Geographic Weighted Regression ................................................................89
4. High Rates of Dengue Fever Zones ...........................................................................90
5. Medium Rates of Dengue Fever Zones .......................................................................92
6. Low Rates of Dengue Fever Zones ..............................................................................94
7. Selected Zones: High, Medium, and Low Rates of Dengue Fever ..............................96
8. Excel Table Created by Simulation .............................................................................99
ix
LIST OF FIGURES
Figure Page
1. The Epidemiological Progress of the Disease ...............................................................1
2. A Computational Epidemiology View...........................................................................3
3. An Overview of the Framework ....................................................................................8
4. The Central Valley of Costa Rica ................................................................................11
5. A Conceptual Model View ..........................................................................................13
6. The Mosquito and Temperature ...................................................................................18
7. Computational Models Steps .......................................................................................34
8. A Simplistic View of Agent-Based Modeling .............................................................35
9. Validation and Verification Methods...........................................................................44
10. Comparing Outputs to Historical Data ........................................................................46
11. Stages of Agent-Based Modeling ................................................................................48
12. The Study Area (The Greater Metropolitan Area) .......................................................55
13. Elements Affecting the Disease ...................................................................................59
14. The Waterfall Model of Software Engineering ...........................................................61
15. The Overall Propose Framework Flowchart of the Model ..........................................62
16. The GIS Outline for the Analysis of the Secondary Data ............................................64
17. The Dengue Fever Agent-Based Model ......................................................................66
18. Different Stages of the SEIR Infection Model .............................................................67
19. Possible Stages of an Epidemic Model ........................................................................67
20. The Compartmental Phases of the ABM .....................................................................68
21. The Data Flow Affecting the SEIR Model ..................................................................69
22. An Overview of the Class Diagram .............................................................................71
23. MA Maps: % Poor Condition Houses, and Dengue Rates ..........................................76
24. MA Maps: Pop Density, % Males, % Poor Condition Houses, Dengue Rates ...........77
25. Precipitation (Point Interpolation) and Rates of Dengue Cases ...................................78
26. Temperature (Point Interpolation) and Rates of Dengue Case ....................................78
27. Summer Average High Temperatures and Rates of Dengue .......................................79
28. Point Interpolation: Precipitation .................................................................................80
29. Point Interpolation: Temperature .................................................................................80
30. Percentage of Urban Population, and Rates of Dengue Fever .....................................81
31. GWR: Precipitation and Supported Table ...................................................................82
32. GWR: Averages Temperatures and Supported Table ..................................................83
33. GWR: % Poor Conditions Houses and Supported Table.............................................84

x
34. GWR: % Overcrowded Houses and Supported Table .................................................85
35. GWR: Land Use and Supported Table ........................................................................86
36. GWR: % High school and More and Supported Table................................................87
37. GWR: % Houses with 1 to 2 Rooms and Supported Table .........................................88
38. High Rates of Dengue Fever Zones .............................................................................91
39. Medium Rates of Dengue Fever Zones .......................................................................93
40. Low Rates of Dengue Fever Zones ..............................................................................95
41. Selected Zones: High, Medium, and Low Rates of Dengue Fever ..............................97
42. Graphical User Interface (GUI) ...................................................................................98
43. High Rates Map of Dengue Fever Cases, Atenas ......................................................100
44. Loading Data Into the Simulation ..............................................................................101
45. Manipulate and Change Scenarios for the Simulation (What-If Scenarios) ..............102
46. Agents (Humans) Socio-economics and Demographics Characteristics ...................103
47. Main DFABM Packages and Classes ........................................................................104
48. A Close Up of Atenas Canton Simulation and Symbology .......................................105
49. Number of Simulated Cases and Temperature, Canton of Atenas ............................106
50. Simulated Cases, (Susceptible→Exposed→Infected→Resistance) ..........................106
51. Canton of Atenas, Simulated Cases Compared to Real Cases...................................107
52. Rainy Season and Number of Dengue Cases, Alvarado ............................................107
53. Visualization Output of the Simulation .....................................................................110
54. Interdisciplinary Approach ........................................................................................121
55. Learning Agents .........................................................................................................123
56. The Study of Vulnerability ........................................................................................124

xi
LIST OF ABBREVIATIONS
ABM ................................................................................................ Agent-Based Modeling
ABMs ................................................................................................... Agent-Based Models
DFABM ......................................................................... Dengue Fever Agent-Based Model
API ............................................................................... Application Programming Interface
CCSS .................................................................................................... Social Security Fund
CDC .................................................................. Center for Disease Control and Prevention
DF ................................................................................................................... Dengue Fever
DFABM ......................................................................... Dengue Fever Agent-Based Model
DHF........................................................................................... Dengue Hemorrhagic Fever
DSS ............................................................................................... Dengue Shock Syndrome
DV ......................................................................................................... Dependent Variable
GIS ..................................................................................... Geographic Information System
GMA ........................................................................................... Greater Metropolitan Area
GUI ................................................................................................ Graphical User Interface
INEC ............................................................... National Institute of Statistics and Censuses
IMN .................................................................................. National Meteorological Institute
IV ........................................................................................................ Independent Variable
MA Maps ...................................................................................... Multiple Attributes Maps
MAS .................................................................................................... Multi-Agent Systems
MDPs ........................................................................................ Markov Decision Processes
SIR ................................................................................... Susceptible, Infective, Resistance

xii
SPSS ................................................................... Statistical Package for the Social Sciences
V&V ...........................................................................................Verification and Validation

xiii
ABSTRACT
ENHANCING DENGUE FEVER MODELING THROUGH A MULTI-SCALE
ANALYSIS FRAMEWORK – A CASE STUDY IN THE CENTRAL
VALLEY OF COSTA RICA
by
Robinson Roberto Campos Rodríguez
Texas State University-San Marcos
August 2013
SUPERVISING PROFESSOR: SVEN FUHRMANNS
Dengue fever is the second most widespread tropical disease after malaria and
affects populations of more than 100 countries (Derouich and Boutayeb 2006). It is
considered one of the most severe viral diseases in terms of morbidity and mortality
(Guzmán and Kourí 2004). Over the last decade, dengue fever has become the most
wide-spread vector-borne disease in Costa Rica (CCSS 2008). However, only a few
research studies have been conducted in Costa Rica to investigate the factors influencing
the rates of dengue fever. While GIS and statistical analysis have been used in research
studies, agent-based modeling has not been applied to the study of dengue. This study
emphasizes how traditional macro level GIS analysis and the implementation of a micro-
level dengue fever agent-based model can be merged into a novel framework for the

xiv
study of dengue fever in the Central Valley of Costa Rica. One of the main objectives
was to develop an agent-based model, which integrated GIS to simulate the spread of
dengue fever disease in an urban environment, as a result of an individual’s interactions
in a geospatial context.
Precipitation, temperature, socio-economic and demographic variables were
analyzed using these technologies to identify the factors affecting the rates of dengue
fever in the study area. GIS was used to map dengue risk and the spatial distribution and
vulnerability of dengue risk in the study area using geographically weighted regression.
The Dengue Fever Agent Based Model (DFABM) was developed using the Java
programming language and the open-source MASON simulator, a multi-threaded agent-
based simulation platform. The DFABM represented daily movements and interactions of
people, the environment, and the vector, relative to dengue cases. The simulation
examined detailed data about each scenario to identify the significant events occurring
during outbreaks. The data employed included the number of susceptible, exposed, and
infected people. The locations (described by longitude and latitude) and temporal data
describing infected individuals were also collected for analysis. The DFABM tracked the
factors affecting dengue fever, including precipitation, temperature, and the most
important demographic and socio-economic characteristics of the population in the study
area.
The research questions guiding this study were: Does a community-level dengue
fever agent-based model (DFABM) produce results comparable (agree) to those produced
by traditional macro-level GIS analysis? Does a community-based dengue fever agent-
based model (DFABM) enhance traditional geographic information system analysis and

xv
could it aid in predicting future dengue fever outbreaks? The findings of the community-
level ABM generated similar results to (they were in agreement with) the traditional GIS
analysis technique. Likewise, the DFABM enhanced traditional methods of analysis and
could aid in predicting dengue fever outbreaks. Therefore, the coupling of GIS and ABM
was the optimal research design for the study of dengue fever in the Central Valley of
Costa Rica.

1
CHAPTER I
INTRODUCTION
1.1 Problem Statement
Dengue fever (DF) is the second most widespread tropical disease after malaria
(Derouich and Boutayeb 2006). Dengue fever (including the more severe dengue
hemorrhagic fever (DHF)), is considered one of the most severe viral diseases in terms of
morbidity and mortality (Guzmán and Kourí 2004). Dengue fever is transmitted to
humans through the bite of the infected Aedes aegypti mosquito. DF can be caused by the
four dengue viruses: DEN 1, 2, 3, and 4. Although the four viruses are closely related, the
serotype provides only life-long immunity to one specific virus (Rigau-Pérez et al. 1998).
There is no cross-protective immunity between the serotypes, so a person may have as
many as four dengue infections during his/her life (Gubler and Trent 1993).
Figure 1. The Epidemiological Progress of the Disease

2
Dengue fever affects people in more than 100 countries (Derouich and Boutayeb
2006). In Costa Rica, cases of dengue have been recorded since 1993 with more than
180,000 cases reported through December 2008 (CCSS 2008). The CCSS (2008) indicate
several patterns, most noticeably a fluctuation of reported dengue fever cases. In 2007,
26,000 dengue fever cases were reported while 2008 data indicated 8,000 infections.
Researchers have concluded weather variables contributed substantially to the spread and
control of dengue fever (Kolivras and Comrie 2004; Patz 2002; Patz et al. 1998). In
addition, several studies have also shown that socioeconomic and demographic
characteristics influence disease patterns (Aiken and Leigh 1978; Campbell-Lendrum and
Woodruff 2006; Caprara et al. 2009; Goldstein 1990; Mondini and Chiaravalloti-Neto
2008; Suarez et al. 2005; Weinhold 2004). However, only a few research studies have
been conducted in Costa Rica to investigate these dengue fever spread factors, i.e. the
relationship of rates of dengue fever cases to weather variability and socioeconomic and
demographic variables. Data accessibility and data quality might have contributed to the
small number of studies in Costa Rica (Troyo et al. 2009). However, studies in other
countries have shown the value of geo-databases, mapping and GIS analysis in spatial-
temporal dengue fever modeling (Ali et al. 2003; Kolivras 2006; Moreno-Sanchez et al.
2006; Morrison et al. 1998; Vogel 2002). Moreover, research indicates that the
integration and coupling of an agent-based computational dengue fever model with
quantitative and qualitative spatial analysis could assist health officials in predicting and
preventing dengue fever outbreaks (Aschorn 2004; Brown et al. 2005).

3
Computational Models in Epidemiology
Computational epidemiology combines the fields of computer science,
mathematics, geographic information science, and epidemiology to identify certain risk
factors related to how diseases spread.
Figure 2. A Computational Epidemiology View
A comprehensive understanding of the epidemiology of a population under study
and knowledge in mathematical, statistical and computer modeling are prerequisites to
rigorous quantitative risk analyses. Epidemiology is the study of the social and
environmental dynamics of health promotion and disease prevention processes in
populations and computer modeling can give researchers insight into understanding the
mechanisms of disease dynamics both through data analysis and theoretical framework.
Mathematical models, with the aid of computer simulations, are useful theoretical and
experimental tools for building and testing theories on complex biological systems
involving disease, assessing quantitative theories, determining sensitivities to changes in

4
parameter values, and estimating key parameters from data (Lawson and Williams 2001).
The magnitude of modern epidemiological problems and the large data sets that may
arise necessitate the use of computational methods for studying these large and complex
models. New computational methods must be devised to solve the dynamics of multiple
interacting strains of viruses, as well as pattern analysis and simulation to solve problems
with the spatial spread of disease, and an early detection of new diseases through rapid
response surveillance systems. Computational methods for simulating stochastic
processes in complex spatial environments and in large networks are making it possible
to simulate more complex biological interactions.
Purpose of this study
The purpose of this research was to develop a multi-scale analysis framework that
applies geographic information systems (GIS) and agent based modeling (ABM) methods
to identify and analyze the variables affecting the rates of dengue fever in the Central
Valley of Costa Rica. GIS methods were used to analyze the available data, collected
from government agencies, at the macro-level. Then a community level dengue fever
agent based model (DFABM) was implemented for a micro level analysis of three urban
zones of the study area. The research assessed the spatial and temporal distribution of
dengue fever cases in the Central Valley of Costa Rica relative to weather characteristics,
demographic and socioeconomic variables.
The integration and coupling of an agent based dengue fever model (DFABM)
with Geographic Information Systems (GIS) could assist researchers when data collection
is not an option and/or only partial datasets are available from previous outbreaks. This
research design using GIS and an ABM offers a novel framework for the understanding,

5
identification, and possible prevention of dengue outbreaks. Coupling computational
simulation models with other technologies such as GIS may enrich traditional methods of
analysis. Being able to supplement and/or simulate the datasets (that may exist) by
exploiting the causal relations between the variables affecting the disease could assist
researchers understand and describe the complex process of dengue fever at the micro
level by exploring the patterns that arise from interactions among the rules leading each
agent. In agent based modeling a system is modeled as a collection of autonomous
decision-making entities called agents. Each agent executes various behaviors appropriate
for the system they represent and separately assesses its situation and makes decisions on
the basis of a set of rules, allowing unexpected behaviors to emerge (Bonabeau 2002).
The rules for the individual agent allow researchers to investigate the collective behavior
of the system or the possible emergent behavior from micro- to macro-levels. Therefore,
the emerging behavioral analysis of the data collected may be used for containment and
prevention purposes of dengue outbreaks. This research facilitated the study of complex
system explorations, which are difficult to accomplish with analytical and GIS models
alone and/or impossible to study in reality.
1.2 Scope
Infectious diseases are among the main causes of human deaths (Derouich and
Boutayeb 2006; McMichael 2004; Weinhold 2004) and nearly half of the world’s
population lives in areas that pose a dengue fever threat (Derouich and Boutayeb 2006;
Rigau-Pérez et al. 1998). The Aedes aegypti mosquito, the carrier of dengue fever and
several related viruses, infects nearly 50 million people annually. An average of 500,000
people are hospitalized each year and about 2.5 percent of them die (Maantay 2002;

6
Roberts 2002; Satterthwaite 2003). Dengue fever places a heavy burden on public health
systems in many tropical countries. Several mosquito species that act as disease vectors
have adapted to living in or near human settlements in tropical areas (including Costa
Rica) (Roberts 2002; Vogel 2002). Currently, no vaccine or treatment exists for dengue
fever (Kapella 2006). According to the Center for Disease Control and Prevention (2008),
new dengue viruses, strains, and serotypes will continue to be introduced into tropical
areas with densely populated human settlements. Densely populated (i.e. urban) tropical
environments are high-risk areas for inhabitants and are breeding sites for Aedes
mosquitoes (Van-Benthem et al. 2005). Increasing populations and weather variability
have exposed more people to infectious diseases and extended the mosquitoes’
geographic ranges (CDC 2008; Vogel 2002). Furthermore, increasing temperatures and
extreme weather conditions have enhanced mosquito survival and have extended its
geographic range (Kovats et al. 2001; McMichael, Woodruff, and Hales 2006).
Over the last decade, dengue fever has become the most wide-spread vector-borne
disease in Costa Rica (CCSS 2008). Research in Costa Rica has been limited due to
financial constraints and lack of human resources (Troyo et al. 2006). The Aedes aegypti
mosquito was eliminated from Costa Rica in 1960. It reappeared in some regions of the
country during the 1970s however, and by 1993 it was reported throughout the country
(Troyo et al. 2006). In Costa Rica, more research is needed to identify the local variables
(as well as the relationships among them) that affect the disease.
This research is focused on the Central Valley in Costa Rica. The Central Valley
region consists of urban and semi-urban areas (CCSS 2008; IMN 2008). The monthly
precipitation amounts and average monthly temperatures as well as socio-economic and

7
demographic characteristics of the population form optimal conditions for the survival of
the Aedes aegypti mosquito and the spread of dengue fever (CCSS 2008). This study
analyzes the relationships between the rates of dengue fever and precipitation,
temperature, socio-economic, and demographic characteristics of the population in the
Central Valley region of Costa Rica from 1993 to 2008. The demographic and socio-
economics characteristics of the population that are considered include: education,
income, household density, age differences, sex differences, housing, land cover, and
urbanization.
The partial dengue fever datasets that are available in Costa Rica were
supplemented by exploiting the causal relations between the variables that describe the
disease process by implementing an agent-based model. This research will enhance
dengue fever modeling though a multi-scale analysis framework. A traditional method of
analysis, geographic information systems, was used for the macro-scale assessment of the
rates of dengue fever in relation to the variables affecting the disease (these include
temperature, precipitation, and socio-economics and demographic characteristics of the
population). The micro-scale analysis of dengue fever rates was achieved using a
community-level computational ABM based on the same variables as the macro-analysis.
The multi-scale framework will develop an understanding of the modeling process using
geographic information systems and agent-base modeling combined. The framework
integrated time/space GIS layers and data collection/analysis in an agent- based model of
dengue fever and analyzed the results of the agent’s interactions. These were compared
to the macro-scale method of analysis, the behavior that emerges from micro- to macro-
scale interactions.
8
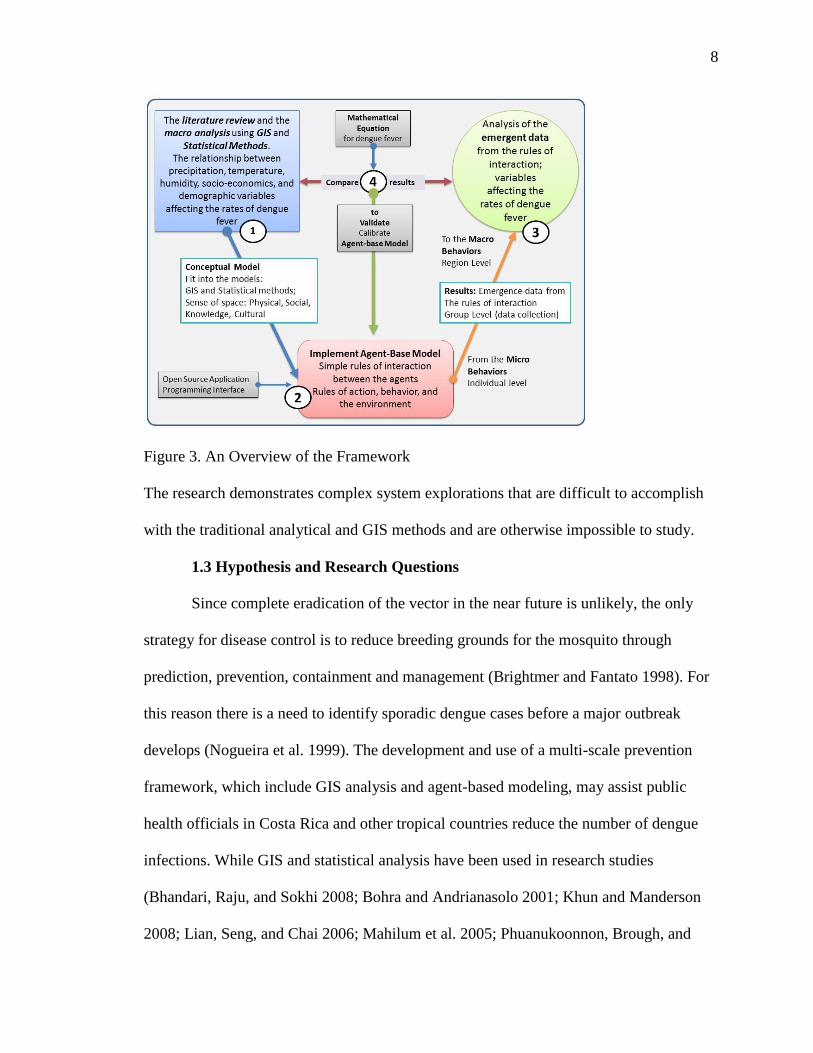
Figure 3. An Overview of the Framework
The research demonstrates complex system explorations that are difficult to accomplish
with the traditional analytical and GIS methods and are otherwise impossible to study.
1.3 Hypothesis and Research Questions
Since complete eradication of the vector in the near future is unlikely, the only
strategy for disease control is to reduce breeding grounds for the mosquito through
prediction, prevention, containment and management (Brightmer and Fantato 1998). For
this reason there is a need to identify sporadic dengue cases before a major outbreak
develops (Nogueira et al. 1999). The development and use of a multi-scale prevention
framework, which include GIS analysis and agent-based modeling, may assist public
health officials in Costa Rica and other tropical countries reduce the number of dengue
infections. While GIS and statistical analysis have been used in research studies
(Bhandari, Raju, and Sokhi 2008; Bohra and Andrianasolo 2001; Khun and Manderson
2008; Lian, Seng, and Chai 2006; Mahilum et al. 2005; Phuanukoonnon, Brough, and

9
Bryan 2006; Suarez et al. 2005), agent-based modeling has not been applied to prediction
and management of the disease. Therefore, ABMs may further the understanding of the
complex spatial behavior of dengue fever by identifying the environmental, demographic
and behavioral rules of the agents (humans and mosquitoes). In conjunction with
established spatial analysis methods the ABM enhanced the understanding of dengue and
assist in projecting patterns to predict potential dengue outbreaks. The ability to
understand and predict how a disease manifests in a population at large is critical for
disease monitoring, intervention, and control strategies and an agent-based model is an
important tool in this effort. This study demonstrates how traditional macro level GIS
analysis methods and the implementation of a micro-level agent-based model can be
merged into a novel framework for dengue fever prevention. This study answers the
following research questions:
1. Does a community-level dengue fever agent-based model (DFABM) produce
results comparable (agree) to those produced by traditional macro-level GIS
analysis?
2. Does a community-based dengue fever agent-based model (DFABM) enhance
traditional geographic information system analysis and could it aid in predicting
future dengue fever outbreaks?
Although the study will focus on the research questions stated above, this research will
discuss the following questions as well:
a) What are the current approaches and limitations of dengue fever modeling in
Costa Rica?

10
b) What are the results and limitations of the macro-level modeling approach?
Which aspects of the spatial analysis are useful? Which need to be modified and
reviewed at a different (micro-level) scale?
c) What are the limitations and design requirements for a community-level agent-
based model?
d) What are the results of the micro-level agent-based modeling?
e) What are the essential components for a multi-scale dengue-fever analysis
framework?
f) How could the framework be used for dengue fever prevention and possibly
prediction purposes?
1.4 Methodological Approach
This study focuses on the Greater Metropolitan Area (GMA) or Central Valley of
Costa Rica. The Central Valley is a highly populated urban and semi-urban area with
more than two million inhabitants that concentrates more than 50 per cent of Costa Rica’s
population in just 4 per cent of its national territory (INEC 2011). San Jose, Alajuela,
Cartago, and Heredia provinces form part of the GMA. This region is characterized by an
average daily temperature of 24 degrees Celsius and precipitation of 245 mm per month
(CCSS 2008; IMN 2008). The climate, interacting with the dense population, creates an
optimal set of conditions for the proliferation of the Aedes aegypti mosquito and the
spread of dengue fever to people (CCSS 2008).

11
Figure 4. The Central Valley of Costa Rica
The datasets of most importance to this study are: rates of reported dengue cases,
weather descriptors (including precipitation and temperature), and demographics and
socio-economic measures of the population. The monthly number of dengue cases
reported from 1993 to 2008 were obtained for all the cantons of the study region from the
Costa Rica Department of Epidemiological Surveillance Unit at the Ministry of Health
(Ministerio-de-Salud 2008). The weather information for the same period, 1993-2008,
was provided by the Costa Rica National Meteorological Institute (IMN 2008). The
weather information contains data from:
Twelve rain gauge weather stations located across the districts of the study area;

12
Twelve weather stations located in different districts of the study area measuring
monthly average high and low temperature in degrees centigrade.
The demographic and socio-economic characteristics of the population were obtained
from the population census of 2000 provided by the National Institute of Statistics and
Census of Costa Rica, INEC. Lastly, all the geographic information layers were provided
by the Geography Department of the National University of Heredia, UNA, Costa Rica,
the University of Costa Rica, UCR and the Regional and Urban Planning of the Greater
Metropolitan Area Central Valley of Costa Rica, PRUGAM.
Method of Analysis
Geographic Information Systems was used to generate a risk map of dengue
incidents, with several risk levels, i.e., very high, high, medium and low risks of
contracting dengue fever. GIS was also used to map the spatial distribution of dengue in
the study area using Geographically Weighted Regression (GWR). These methods reveal
the correlation between dengue fever cases, meteorological factors and demographic and
socio-economic variables affecting dengue fever reported cases.
The dengue fever agent-based model included the most important variables
identified through a review of the literature identified as affecting the rates of dengue
fever and were combined with GIS in the macro analysis. The dengue fever agent-based
model represented the daily interactions of humans with respect to the environment, and
the mosquito vector relative to the rates of dengue cases. The simulation examined
detailed data (infected people) and strived to identify the significant events occurring
during outbreaks. The data employed included the number of susceptible, infected, and
recovered people. The locations (based on longitude and latitude) and temporal data

13
(month and year) corresponding to the infected individuals were also analyzed (see figure
5).
Figure 5. A Conceptual Model View
Furthermore, the ABM compiled the factors that ostensibly affect dengue fever
spread. An agent-based modeling approach is developed here that integrates GIS and
statistical models to simulate the spread of dengue fever disease in an urban environment,
as a byproduct of individuals' geospatial interactions. The model was developed in the
MASON simulator, a multi-threaded agent-based simulation platform that offers a
modeling paradigm and a set of tools for simulation of complex systems like that which
produces dengue fever. The ABM process involves: 1) defining a conceptual model using
domain knowledge about agent types, agent rules, environmental factors, spatial layout

14
and rules of interaction; 2) defining the quantitative and qualitative data collection for
each time interval of the model; 3) implementing the model using the MASON API
toolkit; and 4) running and fine-tuning the model until it is calibrated and validation and
verification of the model using observational data or a mathematical equation for dengue
fever.
The two hypotheses for this study were:
Hypothesis I:
H0: The analysis of the emergence data of a community level agent based model of
dengue fever (DFABM), which studied the same variables of the macro analysis
(precipitation, temperature, demographic, and socio-economics features of the
population), disagreed with Geographic Information System (GIS) analysis.
Ha: The analysis of the emergence data of the community level agent based model of
dengue fever (DFABM), which studied the same variables of the macro analysis
(precipitation, temperature, demographic, and socio-economics features of the
population), agreed with traditional methods of GIS analysis.
Hypothesis II:
H0: An agent based model (community level) of dengue fever (DFABM) does not
enhance traditional methods of analysis using Geographic Information System (GIS)
analysis and does not further the understanding and possible prediction of dengue
outbreaks.
Ha: A community based dengue fever agent based model (DFABM) enhances traditional
methods of analysis using Geographic Information System (GIS) and furthers the
understanding and possible prediction of dengue outbreaks.

15
1.5 Expected Results
Analytical modeling follows well-established methodological protocols
(Leombruni et al. 2005). The increasing availability of ABMs for complex global,
national and community-based systems enables supplementation of traditional analytical
methods (Aschorn 2004; Skvortsov et al. 2007). ABMs can be used for quantitative,
qualitative, experimental, and participatory research (Boero and Squazzoni 2005).
A dengue fever ABM offers a methodological approach that exemplifies the
diversity of intervening components, such as environmental factors, disease vectors and
hosts. ABMs provide options to determine spatial behaviors, spatial distributions through
rapid insertion of new components and natural consideration of non-linear interactions
between agents (Isidoro et al. 2009). These abilities facilitate the exploration of the
numerous ways dengue fever develops over geographical space, behaves, interacts and/or
evolves. ABM supports experimentation in ways, which would not be possible in the real
world (Castle and Crooks 2006; Osgood 2007; Torrens 2010). Thus, the implemented
dengue fever ABM will be an appropriate analysis technique for implementing a
geospatial dengue fever simulation (Castle and Crooks 2006; Torrens 2010). This study
was expected to show that:
The results of the community level dengue fever agent based model yielded
similar results as Geographical Information Systems analysis.
An agent based model of dengue fever would enhance traditional methods of GIS
analysis in the understanding and possible prediction of dengue outbreaks.
The coupling of Geographic Information Systems (GIS) and Agent Based
Modeling (ABM) are well suited for a dengue fever and other studies of mosquito

16
vectored tropical diseases. Computation intensive properties of ABMs, however, could
become problematic for simulating large systems. An ABM of dengue fever may be
especially helpful to assist researchers when data collection is not an option and/or only
partial datasets are available by supplementing the existing datasets and/or exploiting the
causal relations between the various variables that describe the disease process.
In Costa Rica, one of the main epidemiological limitations is data availability.
The current data and its resolution may not reveal the relationships that may exist
between rates of dengue fever outbreaks and precipitation, temperature, socio-economic
and demographic characteristics. Also, the primary data generated by the ABM and its
analysis may not reveal relationships between dengue fever outbreaks and precipitation,
temperature, socio-economic and demographic characteristics.
A community-level agent based model, can help to identify possible future
patterns of dengue and therefore could support community preventions programs. ABMs
are representations of reality. They are designed to have enough robustness to meet their
intended purposes. Yet, researchers must remember that, when analyzing ABM results,
their findings are only partial representations of a complex problem. Overall, ABM
results must be used carefully (Sullivan and Mordechai 2000).
The framework used here is a novel approach to investigate, analyze, and
experiment with ABMs to study dengue fever. Traditional methods of analysis using
statistical and GIS methods are well known among dengue fever researchers (Ai-leen and
Song 2000; Ali et al. 2003; Almeida, Medronho, and Valencia 2009; Almeida et al. 2007;
Braga et al. 2010; Eisen and Lozano-Fuentes 2009; Syed et al. 2010; Troyo et al. 2009).
Nevertheless, in Costa Rica, there have been no studies that use ABMs and/or couple GIS
17
and ABM methods. One of the major difficulties with GIS and analytical methods that
use differential equations has been the growing mathematical complexity and detail of
models used to represent the many aspects of the phenomena under investigation. (Bagni,
Berchi, and Cariello 2002). The construction of a model that simulates or represents a
dengue epidemic could provide a valid tool for decision-making and disease intervention.
Changes in population composition and dynamics, as well as, the changing
demographics and geography of the region under investigation require the design of
models that bring together knowledge of the specific variables affecting the disease.
Computational models supports the identification of factors and mechanisms of epidemic
spread during the descriptive phase and allows the examination of different scenarios in
determining sensitivities to changes in parameter values, and estimation key parameters
from data in a reasonably rapid way (Bagni, Berchi, and Cariello 2002). These
computational models characteristics are essential in order to be able to carry out
qualitative and quantitative evaluation of strategy choices to select the best control and
eradication practices for a specific disease such as dengue fever. The ability to predict
and understand how a disease might manifest in the population under study is essential
for disease monitoring, intervention and control strategies.
18
CHAPTER II
REVIEW OF RELATED LITERATURE
2.1 Dengue Fever
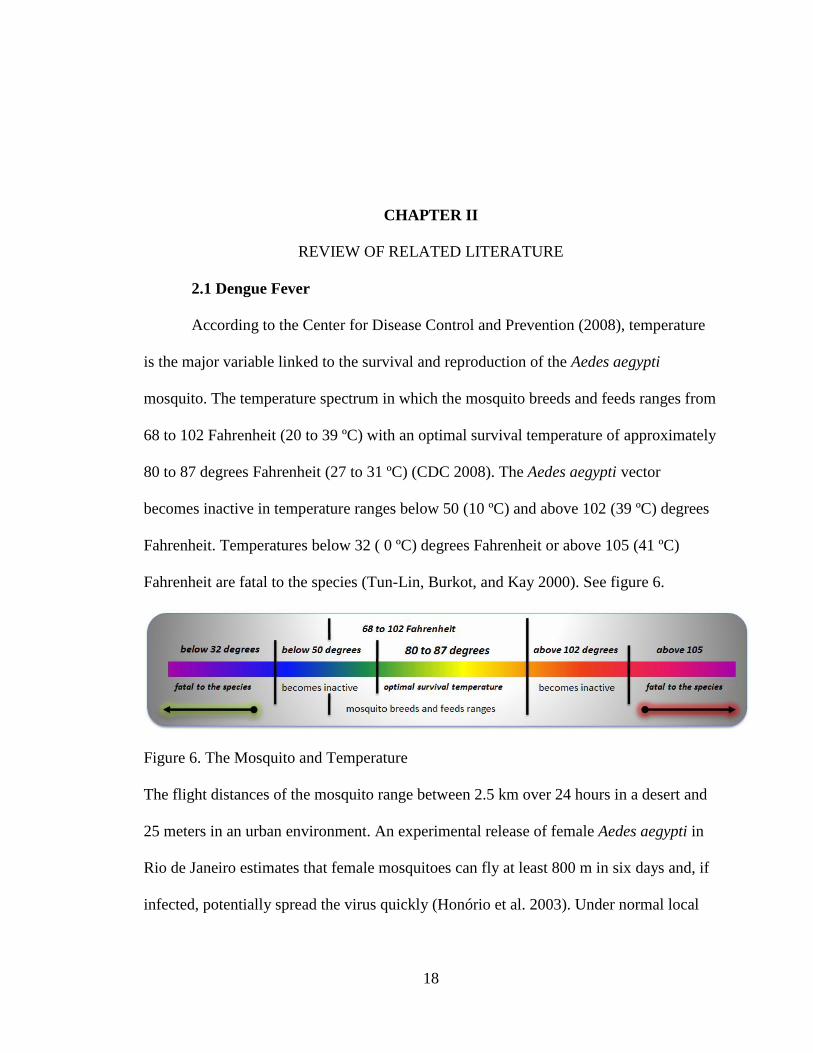
According to the Center for Disease Control and Prevention (2008), temperature
is the major variable linked to the survival and reproduction of the Aedes aegypti
mosquito. The temperature spectrum in which the mosquito breeds and feeds ranges from
68 to 102 Fahrenheit (20 to 39 ºC) with an optimal survival temperature of approximately
80 to 87 degrees Fahrenheit (27 to 31 ºC) (CDC 2008). The Aedes aegypti vector
becomes inactive in temperature ranges below 50 (10 ºC) and above 102 (39 ºC) degrees
Fahrenheit. Temperatures below 32 ( 0 ºC) degrees Fahrenheit or above 105 (41 ºC)
Fahrenheit are fatal to the species (Tun-Lin, Burkot, and Kay 2000). See figure 6.
Figure 6. The Mosquito and Temperature
The flight distances of the mosquito range between 2.5 km over 24 hours in a desert and
25 meters in an urban environment. An experimental release of female Aedes aegypti in
Rio de Janeiro estimates that female mosquitoes can fly at least 800 m in six days and, if
infected, potentially spread the virus quickly (Honório et al. 2003). Under normal local

19
meteorological conditions, Aedes aegypti need 11-12 days to develop from egg to adult
(Heukelbach et al. 2001).
Climate variability has an impact on many infectious diseases around the world
(Ebi et al. 2006; Epstein 2002; Kolivras and Comrie 2004; Patz 2002; Patz et al. 1998;
Reiter 2001; Tibbetts 2007; Zhang, Bi, and Hiller 2008). Moisture or precipitation levels
and temperature patterns indirectly influence diseases by providing optimal
environmental conditions for the growth, reproduction, and survival of the host species
(Epstein 2002; Gage et al. 2008; Kolivras and Comrie 2004; Kovats et al. 2001). Patz
(2002) found a strong relationship between weather variability and epidemiological
diseases. Many vector-borne diseases exhibit seasonal and thus weather sensitive patterns
(Gubler et al. 2001).
Social and cultural aspects are also significant factors in the effectiveness of
dengue control programs. However, these aspects are often not considered when creating
and implementing prevention and control programs (Itrat et al. 2008; Suarez et al. 2005).
A study in Villavicencio, in southeastern Colombia described low-income and high-
income communities and their differing sanitary practices, which influence dengue
prevention and control (Suarez et al. 2005). Across all income levels, Itrat et al. (2008)
concluded disease control programs were mainly focused on avoidance of mosquito bites
rather than eradication of the mosquito population. The use of anti-mosquito spray was
the most commonly encouraged preventive measure and television was considered the
most important and useful source of information for disease prevention (Acharya et al.
2005; Itrat et al. 2008). Suarez et al. (2005) indicate that public perceptions of dengue
fever and public policies advertised in booklets, flyers and on television differ radically

20
from people’s everyday reality in terms of what protections individuals can financially
afford or what actions people can take to eliminate the mosquito breeding grounds. The
study indicates that income differences are useful predictors of the success or failure of
public prevention policies.
The widespread use of insecticides has been a dominant approach to controlling
Aedes aegypti mosquitoes populations in several countries such as Brazil, Cambodia, and
Thailand (Chantha, Guyant, and Hoyer 1998; Khun and Manderson 2007; Thavara et al.
2004). Insecticide treatments used to contain or prevent diseases may create a false sense
of safety and pose future health hazards (Khun and Manderson 2007). For example,
Khun and Manderson (2007) suggested mosquitoes rapidly re-colonize sprayed territories
and female mosquitoes utilize new breeding habitats. Insecticide resistance, which occurs
in vector populations after continued application of the same insecticide, also serves as an
important impediment to sustainable control. For these reasons, Spiegel et al. (2005)
suggested limiting insecticide applications only to government interventions. Therefore,
better public education and consistent government interventions in mosquito habitats and
breeding grounds could increase the effectiveness of mosquito population management.
Programs for the Control of Dengue
Before the 1980s, dengue fever and especially dengue hemorrhagic fever were
uncommon diseases in the tropics of the western hemisphere (Gubler 2002). However, in
the last two decades, dengue epidemics have become a significant public health hazard in
tropical regions (Gubler 2002). The lack of resources for public health surveillance,
management and research programs, in addition to demographic and societal changes,
urbanization, and modern transportation have contributed greatly to the increased spread

21
of dengue (Gubler 1998; Gubler 2002; Spiegel et al. 2005; Tol and Dowlatabadi 2001).
The increased movement of people and mosquitoes within and between regions has
enlarged the geographical distribution of dengue fever (Gubler 2002; Gubler and Meltzer
1999). For example, there are four modes of human transportation that contribute to the
dissemination of the dengue vector: ships, railways, automobiles, and air travel (Kuno
1995).
Khun (2007) suggested that community programs are required to establish and
sustain vector control and the extent to which these programs succeed or fail depends on
the ability of government officers to maintain an association with the local community. A
study conducted in Trinidad and Tobago on knowledge, attitudes, prevention and control
of dengue fever found the need for well-defined environmental sanitation strategies when
planning community-based vector control (Rosenbaum et al. 1995). The findings indicate
that even if there is a high level of dengue fever awareness, there is poor understanding of
the disease symptoms and hence little concern about the health risk associated with the
disease or prevention efforts (Mahilum et al. 2005; Rosenbaum et al. 1995).
Community-based intervention approaches are essential when controlling
outbreaks of dengue fever and offer the highest success rates for program sustainability in
the control of the Aedes aegypti mosquito (Ayyub et al. 2006; Chantha, Guyant, and
Hoyer 1998; Khun and Manderson 2007; Nam et al. 2004; Phuanukoonnon, Brough, and
Bryan 2006; Toledo Romani et al. 2007). Persuading communities to recognize their
potential exposure and susceptibility to the disease and identify the benefits of dengue
larva control is essential for successful control initiatives of dengue (Khun and
Manderson 2007; Phuanukoonnon, Brough, and Bryan 2006). Year-around community-

22
based programs’ emphasis ought to be on interrupting the diffusion cycle at an early
phase through larva mosquito control sustainable practices (Nam et al. 2004; Spiegel et
al. 2005). Simple community-based vector management measures, which may include
cleanup campaigns before rainy seasons followed by routine garbage pickup during the
rainy season, could prevent outbreaks of dengue fever and guarantee larva control
sustainable practices (Bulto et al. 2006; Kittayapong et al. 2006). For example, many
mosquitoes exploit discarded containers and other urban garbage as breeding grounds
(Chepesiuk 2003).
Therefore, effective control programs need to address social and ecological
factors influencing the program’s effectiveness such as the mosquito’s behavior, public
education programs, the demographic and socio-economic characteristics of the
community (Spiegel et al. 2005; Suarez et al. 2005). Programs and campaigns need to be
targeted locally and modified seasonally to address potentially shifting ecologies of both
humans and the mosquito vector activities (Itrat et al. 2008; Spiegel et al. 2005). The
prevention of dengue epidemics by early case detection (to geographically contain the
spread of infection) and by prevention of virus transmission to the mosquito population
should be a priority of public health professionals (McBride et al. 1998).
2.2 Social and Cultural Aspects of the Disease
Dengue is endemic in most tropical countries and some of the reasons for its
continuation can be related to socioeconomic factors (Mondini and Chiaravalloti-Neto
2008). The identification of these socioeconomic and others factors such as demographic,
behavioral, and housing quality involved in the transmission of infectious diseases such
as dengue is key to the implementation of effective control measures against the disease

23
(Guha-Sapir and Schimmer 2005). Some of the variables that predicted the spatial
distribution were people with the lowest socio-economic levels, the percentage of
illiterate heads of household, number of residents in a home, the percentage of female
heads of households in an area, the percentage of residents in an area who earn less than
minimum wage, population density, and homes lacking water services, waste collection
or sewage systems (Braga et al. 2010; Costa and Natal 1998; Guha-Sapir and Schimmer
2005; Mondini and Chiaravalloti-Neto 2008; Teixeira et al. 2002).
Knowledge, attitude, and practices against the disease
Poor knowledge of control methods, incompatibility of control practices with
people’s beliefs, and dengue knowledge are significantly related to the transmission of
dengue (Phuanukoonnon, Brough, and Bryan 2006). For instance, a study in Trinidad and
Tobago on knowledge, attitudes, and practice regarding dengue found a high level of
awareness about dengue, but there was poor understanding of the symptoms and little
concern about the health risks (Rosenbaum et al. 1995). Persuading people to recognize
their potential exposure and susceptibility to the disease can benefit dengue control
(Phuanukoonnon, Brough, and Bryan 2006). For example, people with knowledge of the
disease more often reported the use of preventive actions, indicating the value of
education programs as a tool in dengue prevention (Benthem et al. 2002). A study in
Mexico found that housewives, the unemployed and the elderly have poorer
understanding of the disease compared to students and persons of younger age and
therefore, may be more likely to be at higher risks of being infected by dengue (Espinoza-
Gómez et al. 2003).

24
Education
Educational levels of individuals have been analyzed as a possible risk factor
influencing the disease (Almeida, Medronho, and Valencia 2009; ko, Chen, and Yeh
1992; Vasconcelos et al. 1998). For example, during a seven-year surveillance study in
Belo Horizonte, Brazil, incidence rates of dengue were correlated with low educational
level (Almeida et al. 2007). Low education levels were associated with the distribution of
dengue fever cases in Singapore (Ma et al. 2004). But other studies indicated illiteracy
was not associated with dengue (Heukelbach et al. 2001; Spiegel et al. 2007).
Income
Social status or income was a significant determinant of dengue cases in rural
Puerto Rico (Torres 1997). The outbreak was greatest in low-income communities and in
urban and semi-rural areas. Low-income communities were prone to environmental and
social problems that contributed to the spread of dengue such as site and situation
(marginal land next to rivers), crowding, poor housing and water storing due to broken
pipes, water contamination, and garbage and trash accumulation, including discarded
automobile tires. A study performed in Brazil reported low socio-economic status of
residents was a high risk factor for dengue transmission (Penna 2004). Another Brazilian
study indicated deprived socioeconomic areas are three times higher in infection than
those of higher socioeconomic areas (Braga et al. 2010). The Mexico-USA border has
higher rates of dengue incidents on the Mexican side than on the American one (Reiter,
Lathrop, and Bunning 2003). Researchers concluded that the low occurrence of dengue
on the USA side was primarily due to economic factors. As cities improve environmental
quality through better sanitation and water supply, the patterns of dengue cases reflect

25
factors that are less related to socioeconomic variables (Mondini and Chiaravalloti-Neto
2008).
Household density
A study of the spatial exposure to dengue in a Brazilian urban area showed
incident rates of dengue were characterized by household density and higher in children
and elderly women (Almeida et al. 2007). In Cuba, a study indicated crowded living
conditions are a risk factor associated with dengue (Spiegel et al. 2007). A Singapore
study found household sizes greater than eight members were at higher risk for
contracting dengue (Ma et al. 2004).
Race and Ethnicity
According to a Cuban research study and others, whites are more likely to
develop severe dengue disease such as dengue hemorrhagic fever or dengue shock
syndrome than blacks (Bravo, Guzmán, and Kouri 1987; Guzmán et al. 2000; Kouri et al.
1989). A comparison of the proportions of individuals with DHF/DSS with ethnic
distribution indicated that the frequency of DHF/DSS both among children and adults
was significantly higher among whites (Bravo, Guzmán, and Kouri 1987). A Brazilian
study found that both Afro-Brazilian ethnicity and African ancestry were protected
against DHF (Blanton et al. 2008). Furthermore, even though dengue viruses circulate in
Africa, there have been no reported epidemics of DHF (Gubler 1998). In Asia, two
studies reported racial differences in disease incidences between Chinese, Malaysian, and
Indians (Goh 1997; Shekhar and Huat 1992). The Chinese appear to be more vulnerable
to DHF than Malaysian followed by Indians (Shekhar and Huat 1992).

26
Age Differences
Classical dengue (dengue fever) is primarily a disease of older children and adults
(Gubler and Meltzer 1999). However, dengue hemorrhagic fever is typically
acknowledged to be a childhood disease under 15 (Aiken and Leigh 1978). In Thailand,
dengue fever/dengue hemorrhagic fever is a leading cause of hospitalization and death
among children (Vanwambeke et al. 2006). Also, DHF is an important cause of morbidity
in Southeast Asia and used to occur almost exclusively in young children, but in recent
years DHF is becoming common in both children and adults (Wichmann et al. 2004).
Gender Differences
Knowledge of differences in male-female is important for public health control
programs against dengue (Guha-Sapir and Schimmer 2005). Various studies have shown
male-female differences. For example, studies and surveillance data showed difference in
infection rates, being highest in males than females (Agarwal et al. 1999; Goh et al. 1987;
Wali et al. 1999). However, Puerto Rican studies reported no or insignificant differences
in male-females patients and suggested that both sexes are equally affected (Rigau-Perez
et al. 2001; Waterman et al. 1985). Other studies did not find any correlation evidence
between dengue and gender (Bartley et al. 2002; Blanton et al. 2008; Bongsebandhu-
phubhakdi et al. 2008; Braga et al. 2010; Espinoza-Gómez et al. 2003; Siqueira-Junior et
al. 2008; Spiegel et al. 2007; Teixeira et al. 2002; Vasconcelos et al. 1998).
Housing and Land Cover
Dengue infection is more likely to take place at home (Sujariyakul et al. 2005).
The pattern and structure of housing may be a risk factor for dengue (Thammapalo et al.
2008) and housing type and condition have been related to incidences of dengue fever
27
(Caprara et al. 2009; Van-Benthem et al. 2005). A study in two Puerto Rican
communities showed that wood constructed housing vs. concrete housing and slum
housing were risk variables significantly associated with increases of dengue incidence
(Waterman et al. 1985). In Thailand, dengue incidents were associated with the
percentages of shop-houses, houses in rows connected to one another by a common
walking path and with their windows and/or doors open though the day, brick houses
(lower interval temperature and high humidity) and houses with poor garbage disposal
practices (garbage disposal near the house) (Thammapalo et al. 2008). People living in
houses surrounded by natural and agricultural land cover had lower risk of dengue
infection.
Therefore, land cover could be an significant risk determinant for dengue
infection, depending on whether the landscape surrounding people supports a large
mosquito population or not, generally by providing breeding habitats (Vanwambeke et al.
2006). Patterns of urban occupation such as living close to junkyards and dump sites are
associated to dengue (Braga et al. 2010). High vector density and the proximity of vector-
breeding sites to human hosts are two major risk factors for dengue transmission (Lian,
Seng, and Chai 2006). Furthermore, dengue transmission is facilitated in any vector-
infested places where people gather together, such as schools, commercial
establishments, churches/temples, factories, hospitals, and theaters (Kuno 1995).
Urbanization
The population growth in cities and the urbanization of rural areas in the tropics
over the past few decades has contributed to more frequent epidemics of dengue (Kuno
1995; Tapia-Conyer, Méndez-Galván, and Gallardo-Rincón 2009). Poor health is
28
associated with poverty, malnutrition, poor housing, inadequate sanitation, as well as
with inadequate health services (Goldstein 1990; ko, Chen, and Yeh 1992; Rodriguez-
Figueroa et al. 1995; Weinhold 2004). Higher population density resulting from
urbanization has created an increase in breeding sites for the vector in domestic settings
(e.g., plastic containers, automobile tires) and environmental sanitation problems, e.g.,
limited garbage collection and irregularity of water supply (Caprara et al. 2009; Torres
1997). The breeding habitats of the mosquito are influenced by housing types/density,
and the living habits of people (Aiken and Leigh 1978). Squatter settlements and slums
lacking piped water and adequate sewage facilities provide breeding sites for mosquitoes
(Aiken and Leigh 1975). When piped water is available but unreliable, people collect
water in storage tanks and others containers, which may result in higher vector densities
(Barrera, Avila, and Gonzalez-Tellez 1993; Brightmer and Fantato 1998; Caprara et al.
2009).
Expansion of Travel and Trade
Expanding travel and trade and rapid urban population growth are significantly
related to the spread of dengue fever (Brightmer and Fantato 1998; Caprara et al. 2009;
Gubler and Trent 1993; Kay and Nam 2005). For example, an early outbreak of dengue
spread in Australia was likely to have been caused by train passengers carrying the virus
(Wolstenholme 1993). The introduction of dengue outbreaks in China and Taiwan were
associated with the migration of people or the return of travelers from dengue-endemic
places (Harn et al. 1993; Qiu et al. 1993). Increases of tourism to endemic areas can
increase dengue risk in previously dengue-free places (Ayyub et al. 2006; Bulugahapitiya
et al. 2007; Guzmán and Kouri 2002). Ayyub et al. (2006) found that 27 of 39 confirmed

29
cases of people having dengue were actually imported from others countries (countries in
Asia, Africa, and Middle East) rather than the country of study (Saudi Arabia). Dengue
has become common in western travelers to the tropics (Lindbäck et al. 2003) and they
play a double role; potential victims and vehicles for the spread of dengue (Brightmer and
Fantato 1998; Jelinek 2000).
2.3 GIS and Statistical Applications to Epidemiology
Spatial epidemiology is the description and analysis of geographically indexed
health data. It is the spatial variation in disease risk or incidence, with respect to
demographic, environmental, behavioral, economic and weather variability linked to a
disease (Elliott and Wartenberg 2004; Ostfeld, Glass, and Keesing 2005). Geographic
Information Systems (GIS) are automated systems for the capture, storage, retrieval,
analysis, and display of spatial data. When geographic distributions are part of the
problem under study, GIS offers new and expanding opportunities, especially for
epidemiology, allowing a spatial perspective of disease (Clarke, McLafferty, and
Tempalski 1996). One of the main objectives of mapping diseases is to find out about the
spatial distribution of a disease and identify areas that could potentially experience
epidemics (Wen et al. 2006). Geographic information systems are increasingly popular in
epidemiological studies to provide needed spatial analysis tools (Betts 1997; Beyea and
Hatch 1999; Nuckols, Ward, and Jarup 2004). For instance, GIS has been used for
disease mapping, geographic correlation studies and disease-cluster analysis such as
malaria and dengue fever (Alderson 2004; Ali et al. 2003; Betts 1997; Elliott and
Wartenberg 2004; Morrison et al. 1998).
Research utilizing GIS technology, and analytical mapping can be conducted at

30
different geographical scales from large- (village-level) to small-scale (continent-based)
models and at various temporal resolutions (days to years) (Kitron 2000). At the
continental scale, climate change may be a good predictor of disease distribution. For
example, GIS has been used to produce analytical maps of malaria epidemics in Africa
(Craig, Snow, and le Sueur 1999). At a large-scale, human and environmental factors
including socio-economic, cultural differences, and rural and urban use practices may be
important for explaining epidemiological diseases (Ebi et al. 2006).
One of the challenges for large-scale epidemiological studies has been gaining
access to sufficient data to assure accurate and reliable analysis. However, advances in
GIS-compatible health databases create opportunities to examine both human and
environmental factors that may explain spatial variations of epidemiological diseases
(Elliott and Wartenberg 2004; Vine, Degnan, and Hanchette 1997). Most diseases occur
as a result of the combined effects of humans and their environment (Schmidt 2006). GIS
may play an important role in understanding not only the environmental factors but
cultural, socio-economic, and demographic factors as well, affecting diseases (Mennecke,
Crossland, and Killingsworth 2000).
GIS technology may be used to compile and present the epidemiological data and
spatial analysis required for making public health risk assessments (Betts 1997;
Jankowski and Nyerges 2001). GIS has been used to characterize transmission patterns
during a community-wide outbreak of dengue and dengue hemorrhagic in Dhaka,
Bangladesh (Ali et al. 2003). In this study, clusters of dengue illnesses and high-density
vector populations were observed in distinct sectors of the city and used for planning
target interventions by public health officials. A cluster was defined as the incidence of

31
more than the expected number of people diagnosed with dengue within a specific
geographic area. Precise knowledge of the distribution of dengue infection is valuable for
planning and evaluating prevention and control programs (Van-Benthem et al. 2005).
Many scientific fields have made use of modern computational methods
especially those that use methods of discrete mathematics. These efforts have been
guided by algorithms, models, and concepts of theoretical computer science that make
these tools more available than they were in the past. Other fields, in particular,
geography have made use of spatial mapping tools like GIS, which have great
applicability to the field of epidemiology.
The major development in epidemiology that makes tools of discrete mathematics
and theoretical computer science especially relevant is the use of GIS. These systems
allow analytic approaches to spatial data that were not used previously. GIS permits the
analysis of spatial data generated by other resources, such as global positioning systems
(GPS) and remote sensing. When combined with data from surveillance and management
activities, GIS and GPS provide powerful tools for analysis and decision making by
providing an integrated approach to disease control and surveillance at local, regional and
national levels (Clarke, McLafferty, and Tempalski 1996).
The main development in epidemiology in the last two decades is the increase in
the availability and power of computing systems and the development of software to deal
with the relations of spatially explicit data (Glass 2000). The ability to input, store,
manipulate and present the spatial relation of health events to other important features of
interest is the critical characteristic of the field. As such, GIS, which has experienced an
explosive growth as a scientific tool, is likely to continue to impact the field, especially as

32
these tools are joined with other technologies such as agent-based modeling, and
statistical tools. It seems likely that using mapped environmental features stored in GIS
databases as predictors for variable outcomes in epidemiological studies could be used
with a substantial degree of success in computer modeling.
Another development is the availability of large and disparate digital databases on
subjects related to disease. Modern methods of data mining can clearly be of use here.
Data mining methods, grounded in theoretical computer science and statistics, are
relevant to spatial-temporal patterning, which focus on identifying diseases that reach
epidemic stage and construction of exposure categories. It may also be useful to develop
an integrated genetic epidemiological information system that could integrate clinical and
research information, so that scientists, policy makers and health professionals can plan
and evaluate population-based disease prevention strategies and also provide educational
materials for health professionals and the public (Muin and Khoury 1997).
The use of GIS methods, are well known in the research of epidemiological
studies such as dengue fever (Bhandari, Raju, and Sokhi 2008; Braga et al. 2010; Caprara
et al. 2009; Cummings et al. 2009; Eisen and Lozano-Fuentes 2009; Mondini and
Chiaravalloti-Neto 2008; Pathirana, Kawabata, and Goonetilake 2009; Syed et al. 2010;
Thammapalo et al. 2008; Troyo et al. 2009; Wu et al. 2009). Using GIS-based spatial
analysis tools researches can derive new information from the existing data, analyze
spatial relationships, build spatial models, and perform complex raster operations to find
suitable locations for the spread of dengue fever to conduct risk assessments and possible
predict dengue risk outbreaks. Nevertheless, few studies in Costa Rica have utilized GIS

33
technology in the study of dengue fever and there are no known studies using computer
modeling such as agent-based modeling.
2.4 Computer and Mathematical Modeling
Geographers gather and analyze many different kinds of data including physical
measurements, observation of behavior, archives, explicit reports, and data collected from
computational modeling (Montello and Sutton 2006). Computational modeling, defined
as computer simulations of simplified representations of portions of reality, evaluates
theoretical structures and processes expressed mathematically (Montello and Sutton
2006). Advantages of computer technology and software have made computational
modeling an attractive method of data collection. Experimentation with computational
modeling is done by changing the parameters or variables of a system and analyzing the
differences in the experiment outcomes (Goldstone and Gureckis 2009; Montello and
Sutton 2006). Modeling gives empirical access to events or systems that no longer exist
or do not yet exist, are very rare, or operate over spatial and temporal scales that are too
large to bring into the laboratory (Kirkby et al. 1993; Montello and Sutton 2006;
Valanides and Angeli 2008). The system under study is often a complex nonlinear
system where simple, intuitive analytical solutions are not available or difficult to apply.
Unlike the other types of data collection, in which portions of reality are directly
measured, computer models simulate those portions of reality. The model outputs are
treated conceptually as if they were measurements and the simulated data are typically
compared to standard empirical measurements for validation and verification (Montello
and Sutton 2006; Sargent 2008). Some disadvantages of modeling are: extensive
computational resource requirements, extensive training in computer science and

34
mathematics and the results might not be accurate or a good representation of reality. The
figure below shows the steps associated with building a computational model.
Figure 7. Computational Models Steps (Montello and Sutton, 2006, page 130)
It is clear by following the steps in a computational model that this type of data
collection method is complex and requires extensive computational resources. However,
when data collection is limited and/or not an option, it is possible to supplement the data
by looking at the possible causal relationships between the variables that describe a
particular disease process using computer modeling (Barendregt et al. 2003). On the other
hand, computational models are partial (miniature and incomplete) representations of
reality consequently, the outputs of these models such as agent-based models must be
analyzed with diligence and care (Sullivan and Mordechai 2000).
35
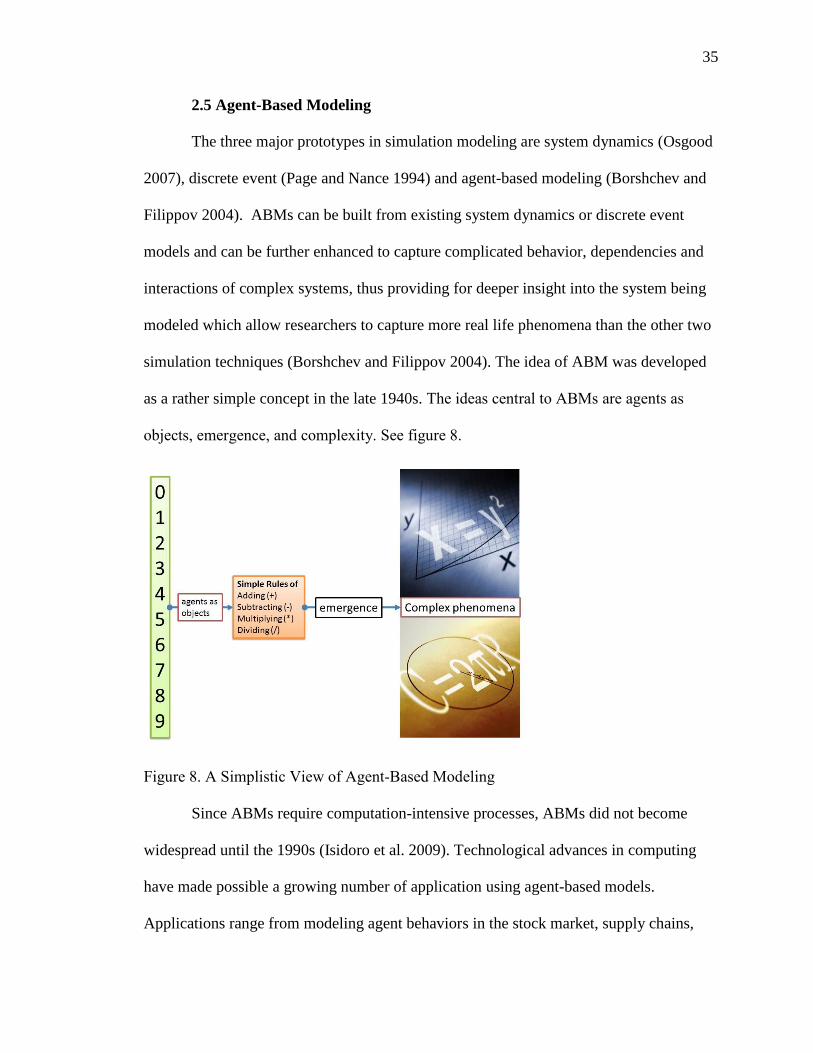
2.5 Agent-Based Modeling
The three major prototypes in simulation modeling are system dynamics (Osgood
2007), discrete event (Page and Nance 1994) and agent-based modeling (Borshchev and
Filippov 2004). ABMs can be built from existing system dynamics or discrete event
models and can be further enhanced to capture complicated behavior, dependencies and
interactions of complex systems, thus providing for deeper insight into the system being
modeled which allow researchers to capture more real life phenomena than the other two
simulation techniques (Borshchev and Filippov 2004). The idea of ABM was developed
as a rather simple concept in the late 1940s. The ideas central to ABMs are agents as
objects, emergence, and complexity. See figure 8.
Figure 8. A Simplistic View of Agent-Based Modeling
Since ABMs require computation-intensive processes, ABMs did not become
widespread until the 1990s (Isidoro et al. 2009). Technological advances in computing
have made possible a growing number of application using agent-based models.
Applications range from modeling agent behaviors in the stock market, supply chains,

36
and consumer markets, to predicting the spread of epidemics, the threat of bio-warfare,
and the factors responsible for the fall of ancient civilizations (Bonabeau 2002; Macal
and North 2007). ABMs combine elements of game theory, artificial intelligence,
complex systems, emergence, computational sociology, multi-agent systems, and
evolutionary programming. It has been proposed that agent-based models may
compliment the study of social sciences, in addition to argumentation and formalization
(Gilbert and Terna 2000; Macal and North 2005; Macy and Willer 2002).
Agent-based modeling is the process of building an abstraction of a system for a
specific purpose (Galan et al. 2009). The abstraction of what is being modeled may only
retain features that are considered the most relevant to model; may make assumptions
about unknown aspects of the system; and/or most commonly simplify aspects of the
system modeled (Galan et al. 2009; Perez and Dragicevic 2009). ABMs, multi-agent
system, and multi-agent simulation are types of computational models where multiple
entities sense stochastically response to conditions in their local environments,
mimicking complex large-scale systems behavior (Sanchez 2002). ABMs simulate the
actions and interactions of autonomous agents, both individual and collective entities,
with a view to assessing their effects on the system as a whole through simple internal
rules for decision-making, movement and actions (Sanchez 2002). With an ABM, in
contrast to other methods, it is possible to formalize complex theories about processes,
carry out experiments and observe the occurrence of emergence phenomena (Gilbert and
Terna 2000; Grimm et al. 2005; Macy and Willer 2002).
The models simulate the simultaneous operations and interactions of multiple
agents, in an attempt to re-create and predict the appearance of complex phenomena

37
(Torrens 2010). The process is one of emergence from the lower- (micro-) level of
systems to a higher- (macro-) level (Auchincloss and Diez Roux 2008; Grimm et al.
2005). This aggregate behavior of the simulated system is the result of the dense
interaction of the relatively simple behaviors of the individual simulated agents (Sanchez
2002). The key notion in this type of modeling is that simple behavioral rules govern the
interactions of individual agents as they generate or emerge into complex behavior. These
individual agents are typically characterized as bounded rational, presumed to be acting
in what they perceive as their own environment such as reproduction, socio-economic
and demographic characteristics, or social status, using heuristics or simple decision-
making rules and likewise may experience learning and adaptation to their environment
(Getchell 2008; Macal and North 2010; Patlolla et al. 2006; Perez and Dragicevic 2009;
Torrens 2010).
Most agent-based models are composed of: (1) numerous agents specified at
various scales (agent-granularity); (2) decision-making heuristics; (3) learning rules or
adaptive processes; (4) an interaction topology; and (5) a non-agent environment (Macal
and North 2010). Using simple rules, agent-based modeling can result in the study of far
more complex and interesting behaviors including emerging social patterns that can
appear suddenly, transform and/or disappear (Macy and Willer 2002; Sanchez 2002).
They consist of dynamically interacting rule-based agents commonly implemented in
software as objects (Axtell 2000) and the environment within which they interact can
simulate real world-like complexity. They could be intelligent and purposeful, situated or
located in some space and time, encoded in algorithmic form in a computer programs
(Axtell 2000).The modeler, designer, or researcher implements or creates those

38
characteristics relevant to the agents and make assumptions about the system though the
most relevant variables to the situation being studied and then observes the phenomena
emerging from the agent’s interactions. Sometimes the results of the model are equilibria,
or an interesting emergent pattern may appear including an incoherent or by chance
unexpected result of the system modeled because of a computers implementations errors
or misunderstanding of how the system work. Even though agent-based models are not
the main stream of geography research they are becoming an important tool,
complimenting the study of social sciences and are becoming increasingly popular
(Gilbert and Terna 2000; Macal and North 2005; Macy and Willer 2002).
Traditional Methods and Agent-Based Modeling
ABM could complement and/or enhance traditional analytical methods
(Auchincloss and Diez Roux 2008). See Table 1 below.
Table 1. Statistical Models and ABMs Complement Each Other
Statistical Models Agent based models
Are an abstraction of a social process for
which data are collected
Presuppose rules of behavior
Goal: similarity between prediction and
observation
Challenge the validity of these rules
Understand why specific rules are applied Verify whether these micro based rules can or
cannot explain macroscopic regularities
Are often applied to formulate theories
Induction: find patterns in data Deduction: find consequences of assumptions
Constitute abstraction of an objective
Allow to implement a large set of agent
characteristics
Allow for a high level of heterogeneity
Allow to model endogenous social networks
Statistical Models and ABMs complement each other.

39
As stated in Table 1, statistical models and ABMs could complement each other.
Where analytical methods enable researchers to characterize the equilibria of a system,
ABMs may allow the possibility of generating that equilibrium. Agent based models can
explain the emergence of higher order patterns or can be used to identify lever points,
defined as moments in time in which interventions have extreme consequences, and to
distinguish among types of path dependency and rather than focusing on stable states,
ABMs adapt to internal and external pressures so as to maintain their functionalities and
system’s robustness (Axtell 2000).
Macro-simulation techniques are normally based on mathematical models where
the characteristics of a population are averaged together and the model attempts to
simulate changes in these averaged characteristics for the entire population (Davidsson
2001). In macro- simulations, the set of individuals is viewed as a structure that can be
characterized by a number of variables, whereas in micro-simulations such as ABM the
structure is viewed as emergent phenomena from the interactions between the individual
agents (Davidsson 2001).
Most of the methods to analyze the spread of dengue fever focus on developing
mathematical models (Jacintho et al. 2010). One drawback of mathematical models is to
disregard the importance of micro-level behavior, concentrating on the macro-level
phases of the system (Jacintho et al. 2010). Therefore, simulation models differ from
traditional models in the sense that they allow: (i) the study of how the modeled system
behaves in certain condition; (ii) the examination of the consequences of changing
internal behaviors of the system; and (iii) vice versa (Jacintho et al. 2010). Another

40
important difference is even though live testing is preferred (traditional methods), ABM
could be an attractive method because the technology, cost, and time limitations prohibit
or made impossible extensive live testing for the studying of complex systems (Sanchez
2002). However, this approach requires considerable computational power to simulate
individual agents and parameter tuning is not trivial, it lacks the formalism provided by
differential equations (Isidoro et al. 2009).
Some of the simulation model goals are to discover and formalize theoretical
models, to develop a better understanding of some features of the system, to test
hypotheses of the modeled system and predict future actions and behaviors (Jacintho et
al. 2010). Agent-based simulations provide an adequate infrastructure to model and
understand processes related to social interactions of the relationship established between
local and global behavior. These relationships may lead to explicit chains of cause and
effect of how internal agent components affect the global agents behavior (Jacintho et al.
2010). The use of agent-based modeling is well suitable for describing complex systems
in general, and a useful approach for modeling population dynamics and disease
transmission (Isidoro et al. 2009). They offer a natural way to exemplify the diversity of
intervening components, such as environmental factors, disease vectors and disease hosts,
and the possibility to determine spatial behavior distribution, rapid insertion of new
components and the natural consideration of non-linear interactions between agents
(Isidoro et al. 2009).
There are presently three main approaches to epidemiological modeling:
equation-based modeling with analytical models, agent-based modeling which are
computer models where populations are presented as a system of interacting software

41
agents, and closely associated or complementary to ABM, network-based modeling
where social interactions are modeled based on a network theory approach (Skvortsov et
al. 2007). Agent-based simulation is the most flexible in terms of a realistic scenario
evaluation and has become increasingly popular (Galan et al. 2009; Gilbert and Terna
2000; Haynes, Cohen, and Ritter 2009; Isidoro et al. 2009; Jacintho et al. 2010; Macal
and North 2010; Malleson, Heppenstall, and See 2010; Sanchez 2002; Skvortsov et al.
2007; Sullivan and Mordechai 2000; Tan and Lau 2007). On the other hand, traditional
analytical modeling in the social sciences follows or relies on a very well established
methodological protocol both with respect to the way models are presented and to the
kinds of analysis that are performed (Leombruni et al. 2005). Computer-simulated
models often lack such a reference to an accepted methodological standard which implies
one of the main reasons for the skepticism amongst mainstream social scientists that
results in a low acceptance of papers with agent-based methodology in the top journals
(Leombruni et al. 2005). The increasing availability of computer resources in recent time
allows high fidelity modeling of complex systems on global, national and community
levels that could be used to actually enhance traditional methods of analysis (Skvortsov et
al. 2007).
There is a long tradition of analytic modeling in science, where formal structures
using mathematics are employed to represent aspects of natural phenomena and to predict
them (Galan et al. 2009). In computational modeling there is a formal representation that
is animated by the computer to produce the outcomes of the model, which may be in the
form of a computer program or an algorithm plus a set of equations (Galan et al. 2009).
One of the advantages of ABM is that it still has the formal object for the model (as

42
traditional methods), which can be replicated, checked and used by other researchers but
is autonomous from the need to be able to derive general results as the analytical
modeling approach (Galan et al. 2009). Consequently the use of dynamic models such as
ABM could complement and/or enhance traditional epidemiological analysis
(Auchincloss and Diez Roux 2008). For example, ABMs have been gradually adopted in
the social and geographical sciences to investigate processes involving interactions
between heterogeneous agents and dynamics interactions between agents and
environment (Brown et al. 2005; Brown and Robinson 2006; Malleson 2009; Malleson,
Heppenstall, and See 2010; Torrens 2006). Thus, it may be useful to combine modeling
techniques e.g., regression, ABM, and dynamic equations (Auchincloss and Diez Roux
2008).
Characteristics of Agent-Based Modeling
The task of emergence complexity requires attention of the agents themselves
including their diversity, connectedness, and level of interactions. A typical agent-based
model has three elements: a set of agents, their attributes and behaviors; a set of agent
relationships and methods of interaction (an underlying topology of connectedness
defines how and with whom agents interact); and the agent’s environment (agents interact
with their environment in addition to other agents) (Macal and North 2010). According to
Macal and North (2010) an agent has several characteristics: is a self-contained, modular,
and uniquely identifiable individual; is autonomous and self-directed; has a state that
varies over time; is social having dynamic interactions with other agents that influence its
behavior; may be adaptive, for example, by having rules or more abstract mechanisms
that modify its behaviors; may be goal-directed, having goals to achieve with respect to

43
its behaviors; and finally agents may be heterogeneous - agent simulations often consider
the full range of agent diversity across a population. A researcher must consider, identify,
model, and program these elements to create an agent-based model.
The ABM flexibility in representing dynamic and highly adaptive physical or
human phenomena facilitates the exploration of ideas about the numerous ways
geographical systems develop, behave, interact and evolve, and often support
experimentation within geographical systems in ways that may not be possible in the real
world (Castle and Crooks 2006; Torrens 2010). Therefore, ABM techniques make
possible a methodological approach for the spatial sciences that could be used as the
building-blocks for analysis as well as experimentation for developing geospatial
simulations (Castle and Crooks 2006; Torrens 2010). Primarily because of the value
placed on spatial science and behavioral geography in ABM work, this method is helping
to infuse geographical perspectives and spatial thinking into an interdisciplinary approach
(Torrens 2010).
Verification & Validation of Agent-Based Models
One of the most important aspects of simulation models is to ensure both the
conceptual and the computational models represent, in a reliable way, the target system
by using the processes of validation and verification (V&V) (David, Simão-Sichman, and
Coelho 2005; Jacintho et al. 2010; Küppers and Lenhard 2005; Ormerod and Rosewell
2009; Wilensky and Rand 2007; Yilmaz 2006). An acceptable degree of adherence
validation aims to assure that the conceptual model represents the target system or
verifies the conceptual model is correctly translated to the computational environment
(Jacintho et al. 2010).
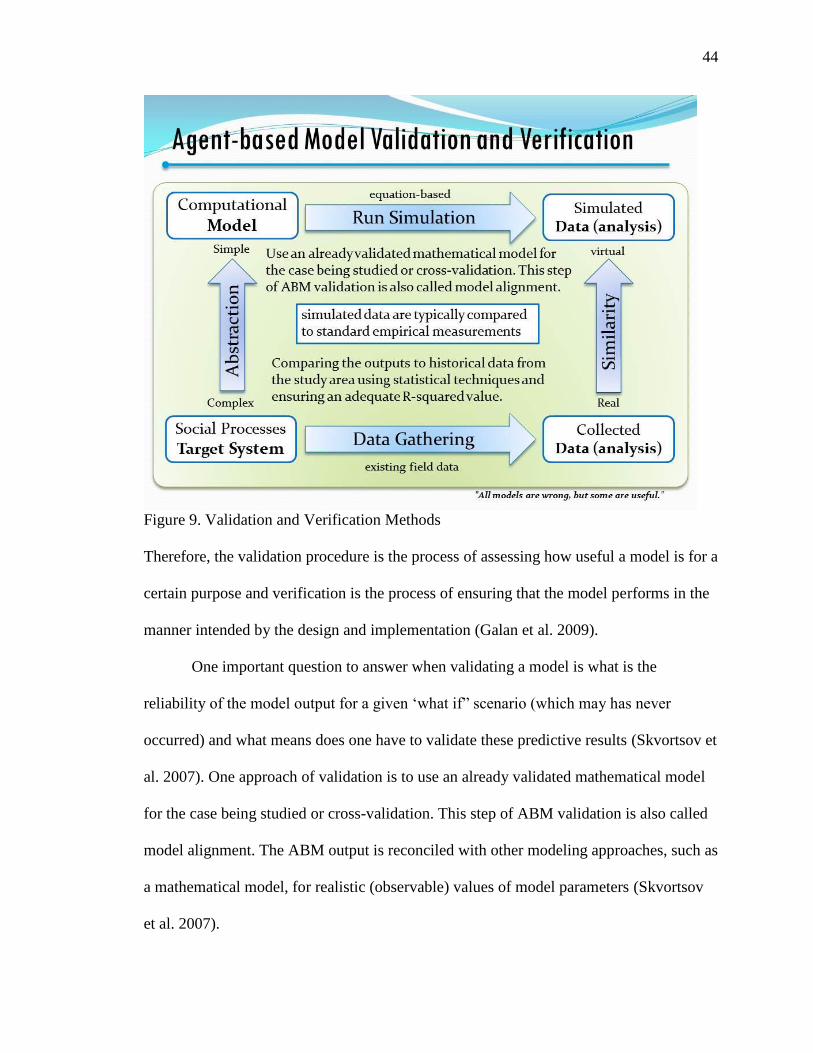
44
Figure 9. Validation and Verification Methods
Therefore, the validation procedure is the process of assessing how useful a model is for a
certain purpose and verification is the process of ensuring that the model performs in the
manner intended by the design and implementation (Galan et al. 2009).
One important question to answer when validating a model is what is the
reliability of the model output for a given ‘what if” scenario (which may has never
occurred) and what means does one have to validate these predictive results (Skvortsov et
al. 2007). One approach of validation is to use an already validated mathematical model
for the case being studied or cross-validation. This step of ABM validation is also called
model alignment. The ABM output is reconciled with other modeling approaches, such as
a mathematical model, for realistic (observable) values of model parameters (Skvortsov
et al. 2007).

45
Therefore, a critical factor for a high fidelity epidemiological model is the ability
to independently validate its predictive results (Skvortsov et al. 2007). But, it is often
very difficult and/or (sometimes) impossible to validate epidemiological models due to a
lack of reliable field data (the simulated event may have never occurred) or there are
ethical reasons the model could not be validated. Consequently, the choice of validation
techniques in such situations is to use cross-validation or model alignment, which means
to run a validated model for some scenarios (where the result is known) or to compare its
output with other available models that have been validated. For example, validating the
model by using a statistical methodology for the analysis of stochastic SIR (Susceptible
→Infective→Removed or Resistance) epidemic models or SEIR (Susceptible→Exposed
→Infected→Resistance) mathematical models (Bobashev et al. 2007; Britton, Kypraios,
and O'Neill 2011; Dunham 2005; Epstein et al. 2008; O'Neill 2002) using equation-based
approaches or by comparing existing field data using a statistical model (Ford, Kaufman,
and Eiron 2006; Skvortsov et al. 2007). Stochastic epidemic models are appropriate
stochastic processes that can be used to model disease propagation. The use of stochastic
epidemic models naturally facilitates estimation of important epidemiological parameters
including learning and implicit representation of population demographics.
Consequently, to produce accurate computer simulation models that approximate
the real system under study and/or modeled, the steps of calibration, verification, and
validation should be used. A model should be calibrated by adjusting any available
parameters in order to adjust how the model operates and simulates the process so that it
matches the problem being studied. The calibrated model should be verified by obtaining
output data from the model and comparing it to what is expected from the input data.

46
Finally, validate the model by comparing the outputs to historical data from the study
area and GIS.
Figure 10. Comparing Outputs to Historical Data
If the outputs do not reasonably match historic values during the validation process, the
model should be reviewed and updated. The validation process establishes the credibility
of the model by demonstrating its ability to replicate actual scenarios of the real world.
The importance of model validation underscores the need for careful planning, design
and implementation of the model.
Challenges of Agent-Based Modeling Complexity
ABM is one of the techniques that can be used to model social systems and what
differentiates this approach from others is that it enables a more direct correspondence

47
between the entities in the target system and the parts of the model that represent them:
the agents (Galan et al. 2009; Gilbert and Terna 2000). However, one problem with
computer simulations is that they can be very complex, so that understanding them in
reasonable detail is not a straightforward exercise and ABMs are generally
mathematically intractable (high complexity, difficult to solve) (Galan et al. 2009).
Consequently, it is apparent that a prerequisite to understanding a simulation is to ensure
there is no significant disparity between what the programmer thinks the computer code
is doing and what it is actually doing (Galan et al. 2009).
Nevertheless, no matter how careful researchers have designed and built the
simulation, it may contain bugs, or code that does something different than what is
expected. Therefore, achieving internal validity is harder than it might appear because of
not knowing whether a sudden result in the model is an echo of a bug in the
programming, or a consequence of the model itself (Galan et al. 2009; Gore and
Reynolds 2010). Hence, the unexpected behaviors in simulations need justification, so
that decision-makers and subject matter experts can separate valid behaviors from design
or coding errors (Gore and Reynolds 2010) and ABMs are known for unexpected
behaviors that emerge as the simulation executes. Consequently, implementing of ABMs
is not a straightforward task. The following figure shows the different stages in the
complex process of designing, implementing and using an ABM.

48
Figure 11. Stages of Agent-Based Modeling
The first stage’s aim is to produce the main conceptualization of the target system,
defining the objectives and the purpose of the model. The second stage transforms the
non-formal model into the formal requirements specifications that the third stage needs to
formulate the executable model such as inputs and output. The final stage is to transfer
this executable model into a software program. Any mismatch or misunderstood transfer
between stages is to the next stage a possible error (Galan et al. 2009). For example,
unexpected or unjustified emergent behaviors often occur in ABMs where the simulation
specification are incomplete or the application domain is poorly understood (Gore and
Reynolds 2010).
49
Agent-Based Models and Epidemiology
The possibilities or advantage that ABMs possess as a bottom-up approach to
model the spread of epidemics, have been used in epidemiology to study and track the
movement of infected individuals and their contacts in a social system and in geographic
space (Bagni, Berchi, and Cariello 2002; Dunham 2005; Gordon 2003; Isidoro et al.
2009; Jacintho et al. 2010; Patlolla et al. 2006; Skvortsov et al. 2007; Tan and Lau 2007).
ABMs allow interaction between individuals (agents) and are capable of overcoming the
limitations of different approaches such as cellular automata and classical epidemic
models, allowing the study of specific spatial characteristics of the spread of epidemics
and addressing the naturally stochastic nature of the epidemic process (Perez and
Dragicevic 2009). Consisting of a population of individual simple actors (agents), an
environment, and a set of rules governing the agents (Durlauf 1997), actions in ABM take
place through the agents or self-contained programs that collect information from their
environment (surroundings) and use these actions to determine how to act next (Axtell
2000; Macal and North 2005). This allows ABMs in the study of epidemiology to follow
the progression of a disease through each individual (agent) even when populations
become highly heterogeneous by health status during simulations, and also tracks the
contacts of each individual with others in a social networks and geographical areas (Perez
and Dragicevic 2009). Therefore, ABMs capability to produce emergent macro-effects
from micro-rules have assisted as a foundation for the development of different
methodological frameworks in epidemiology (Patlolla et al. 2006).
Epidemiologic applications using ABM approaches are mostly designed to allow
epidemiological researchers to conduct an initial "what-if" analysis with the purpose of

50
assessing a systems behavior under various circumstances and evaluating which
alternative control programs to adopt in order to control epidemics. Although these
models effectively track the progression of the disease, they need to add physical
infrastructures such as road networks, and real geographic environments to account for
more realistic complex interactions among susceptible and infected individuals (Perez
and Dragicevic 2009). Another important application of ABM in epidemiology is the
modeling of vector-borne diseases such as dengue fever or malaria and the changes in
their incidence that are attributable to climatic variability such as temperature,
precipitation, and humidity (Chengbin, Haiyan, and Zhiwei 2008; Isidoro et al. 2009;
Jacintho et al. 2010; Linard et al. 2009; Lloyd King 2009). Nonetheless, none of these
models had incorporated geo-spatial characteristics such as adding GIS layers into their
models as to study and simulate more realistic epidemiological problems.
Therefore, an interesting feature of coupling GIS and ABM developments is the
intersection of these two major methodological developments for social simulations
allows new scientific and policy analysis and could enhance or enrich policy-making
analysis by simulating the complexity of these problems (Kim 2007). Furthermore,
spatial effects on health problems could emerge from complex interdependent processes
in which individuals interact with each other and their environment, and in which both
the individuals and the environment adapt and change over time (Auchincloss and Diez
Roux 2008). Traditional epidemiological research study designs and statistical regression
methods examine these dynamic methods, which have constrained the types of questions
asked, the answers received, and the hypotheses and theoretical explanations that are
developed (Auchincloss and Diez Roux 2008). Hence, ABM could enhance or

51
complement traditional methods of analysis. Also, results from collected data obtained
from epidemiological simulation can complement and/or help in the decision-making
process, in the understanding and evaluation of these complex systems, and in reducing
implementation time and cost of those problems being studied (Jacintho et al. 2010).
Applications of computer modeling
Although the basic goal of any kind of data mining is prediction (Shalizi 2006),
computer modeling has many other applications, namely furthering theory development
and addresses the reasons for when or why to build models in the social sciences (Axtell
2000; Epstein 2008). Knowing that the main value of simulation in the social sciences is
for theory development rather than for prediction (Gilbert and Terna 2000), computer
modeling is used to:
Explain and/or understanding complex systems, which is very distinct from
predict;
Guide data collection (modeling is one of the types of data collection);
Illuminate core dynamics (as somebody famous said “all models are wrong, but
some are useful”);
Suggest dynamical analogies (unrelated processes have formally identical
models);
Discover new questions (curiosity lead to new questions);
Promote a scientific habit of mind (the freedom to doubt);
Bound (bracket) outcomes to plausible ranges;
Illuminate core uncertainties;
Offer crisis options in near-real time;

52
Demonstrate tradeoffs / suggest efficiencies;
Challenge the robustness of prevailing theory through perturbations;
Expose prevailing wisdom as incompatible with available data;
Train practitioners;
Discipline the policy dialogue;
Educate the general public; and
Reveal the apparently simple (complex) to be complex (simple).
The benefits of ABM over other modeling techniques can be understood in three
statements: (i) to capture emergent phenomena; (ii) provides a natural description of a
system; and (iii) have flexibility to incorporate more elements (variables) (Bonabeau
2002). The ability of ABM to deal with emergent phenomena is what drives any of the
others benefits. There are several benefits or ways to how and when ABMs could
enhance others types of research methodology, such as quantitative and qualitative
research methods (Aschorn 2004). ABMs should be viewed as models included with
quantitative, qualitative, experimental, and participatory methodology (Boero and
Squazzoni 2005). According to Aschorn (2004), ABMs are useful for problems where:
there are many interrelated factors, high uncertainty, and where a novel approach with
competitive differentiation is the goal; emergent behaviors are to be modeled; all the way
down; interactions between agents are complex, nonlinear, or discontinuous; spatial
issues are of interest, i.e. social networks; the population is heterogeneous; and agents
exhibit learning and adaptive behaviors, i.e. dynamic strategies.
Most or all of these characteristics are presented in epidemiological research

53
problems studies and proposed dengue fever research, making dengue fever a good
candidate for building an ABM. Thus, ABM is intended to complement and enhance
rather than displace traditional approaches (Aschorn 2004; Gilbert and Terna 2000).

54
CHAPTER III
RESEARCH DESIGN AND METHODOLOGY
3.1 The Study Area
Costa Rica is located on the Central American isthmus, lying between latitudes 8°
and 12° north, and longitudes 82° and 86° west. Costa Rica comprises an area of 51,100
sq. km (19,730 sq. mi.) with a population of 4,563,539 people in 2010, and an annual
population growth rate of 1.347%. The major cities, which constitute the Greater
Metropolitan Area (GMA), are San Jose, Alajuela, Cartago, and Heredia which have a
combined population of 2.1 million. The terrain is rugged, and a central range of
mountains separates the eastern and western coastal plains. Costa Rica’s climate is mild
in the central highlands, and tropical and subtropical in coastal areas. Most of the people
are descendants of Europeans rather than of mestizo (i.e. mixed) descent. Their origins
are European and mestizo 94%, African 3%, Chinese 1%, Amerindian 1%, and other 1%.
The literacy rate in Costa Rica is 94.9%. Its residents have an average life expectancy of
79 years (INEC 2011; Lytle 2011).
This study focuses on the Greater Metropolitan Area or Central Valley of Costa
Rica (Figure 12). The Central Valley is a highly populated, urban and semi-urban, area
with more than two million inhabitants. It contains more than 50 per cent of the total
population in an area comprising just 4 per cent of the national territory (INEC 2011;
Lytle 2011). In this setting, there are many ideal habitats for the Aedes mosquitoes and
many breeding sites for the vector (Van-Benthem et al. 2005). The Central Valley has a

55
mean elevation of 1,161 meters (3809.06 feet) above sea level and is characterized by a
climate with an annual average temperature of 23 degrees Centigrade (74 degrees
Fahrenheit) and precipitation of 150 millimeters (5.9 inches) per month (CCSS 2008;
IMN 2008).
Figure 12. The Study Area (The Greater Metropolitan Area)

56
These parameters constitute an optimal set of conditions for the survival of the Aedes
aegypti mosquito and the spread of dengue fever (CCSS 2008). In Costa Rica, there is a
need for more research on the local variables that affect dengue fever and their
relationships. The Department of Health is the entity that directs and conducts
surveillance programs for dengue. Another public institution that works closely with the
Department of Health is the Costa Rican Social Security Fund or Caja Costarricense de
Seguro Social. This government institution is in charge of public health care services and
social security. Most of this organization’s control programs against dengue focus on
public education, using such tools as school and television programs (Troyo et al. 2006).
3.2 Base Data for the Study
The number of dengue cases each month from 1993 to 2008 were obtained for all
the cantons of the study area from the Costa Rica Department of Epidemiological
Surveillance Unit at the Ministry of Health (Ministerio-de-Salud 2008). The weather
information for the same period, 1993-2008, including temperature and precipitation
rates, were acquired from the Costa Rica National Meteorological Institute (IMN 2008).
The weather information contains data from:
Twelve rain gauge weather stations located in different districts of the study area;
and
Twelve weather stations located in different districts of the study area from which
monthly average high and low temperatures in degrees centigrade.
The demographic and socio-economic characteristics of the population were
obtained from the population census of 2000 provided by the National Institute of

57
Statistics and Census of Costa Rica, INEC. Lastly, all the geographic information layers
were provided by the Geography Department of the National University of Heredia,
UNA, Costa Rica, the University of Costa Rica, UCR and the Regional and Urban
Planning of the Greater Metropolitan Area Central Valley of Costa Rica, PRUGAM.
The variables gathered for analysis included weather characteristics (precipitation
and temperature) and demographic characteristics of the region’s residents. These were
evaluated for their relationships to reported rates of dengue fever. The independent
variables of the study are temperature, precipitation, and socio-economic and other
characteristics of the population. The dependent variable is the reported number of
dengue cases.
3.3 GIS Analysis
GIS was used to create maps depicting the risk, or the likely patterns, or spatial
distribution, or areas for the potential for outbreaks of dengue fever (Jarup 2004). By
supplementing GIS with space-time permutation scan statistic tools, the spatial variation
of dengue incidence can be mapped using geographically weighted regression, or GWR
(Brunsdon, Fotheringham, and Charlton 1996; Harris, Brunsdon, and Fotheringham
2011; Wheeler and Páez 2010). GWR mapping and analysis were used in this research to
determine the spatial correlation between dengue fever occurrence and the meteorological
and demographic variables.
Identifying Areas of High Risk to dengue fever using GIS
To identify zones possessing high dengue fever potential, a risk assessment map
was created by comparing where people live, the potential for exposure to the mosquito,
and the probability of presence of the disease. By mathematically combining these three
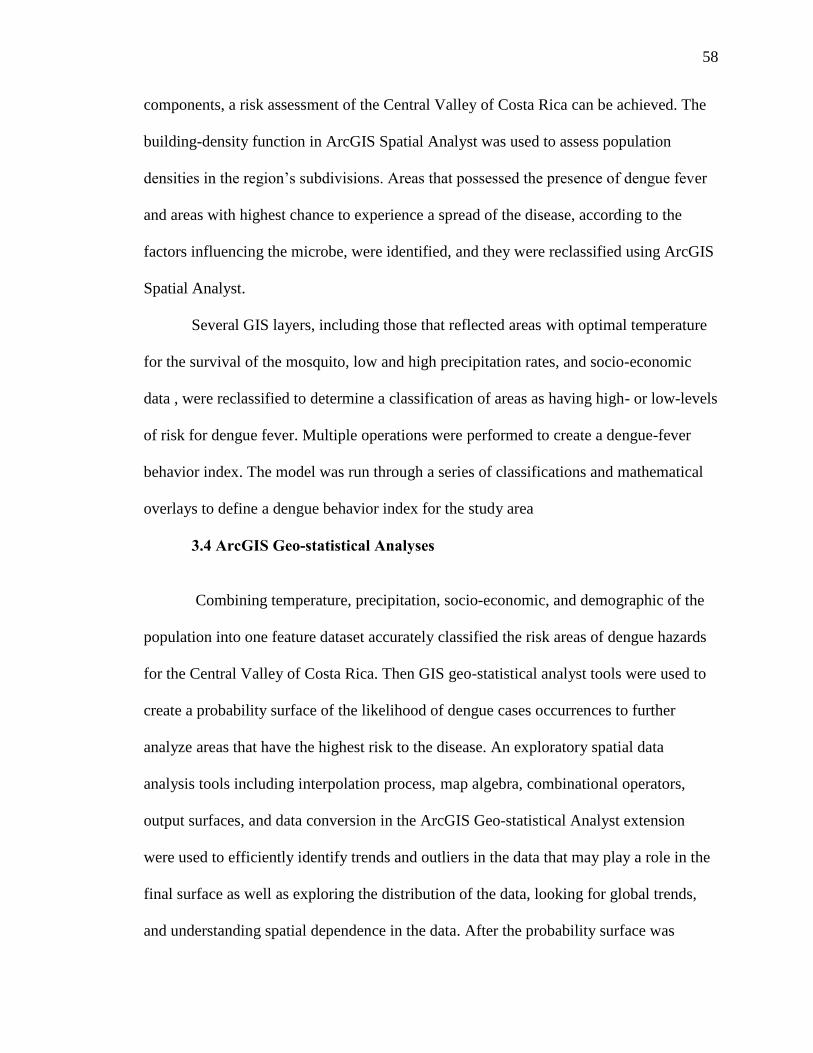
58
components, a risk assessment of the Central Valley of Costa Rica can be achieved. The
building-density function in ArcGIS Spatial Analyst was used to assess population
densities in the region’s subdivisions. Areas that possessed the presence of dengue fever
and areas with highest chance to experience a spread of the disease, according to the
factors influencing the microbe, were identified, and they were reclassified using ArcGIS
Spatial Analyst.
Several GIS layers, including those that reflected areas with optimal temperature
for the survival of the mosquito, low and high precipitation rates, and socio-economic
data , were reclassified to determine a classification of areas as having high- or low-levels
of risk for dengue fever. Multiple operations were performed to create a dengue-fever
behavior index. The model was run through a series of classifications and mathematical
overlays to define a dengue behavior index for the study area
3.4 ArcGIS Geo-statistical Analyses
Combining temperature, precipitation, socio-economic, and demographic of the
population into one feature dataset accurately classified the risk areas of dengue hazards
for the Central Valley of Costa Rica. Then GIS geo-statistical analyst tools were used to
create a probability surface of the likelihood of dengue cases occurrences to further
analyze areas that have the highest risk to the disease. An exploratory spatial data
analysis tools including interpolation process, map algebra, combinational operators,
output surfaces, and data conversion in the ArcGIS Geo-statistical Analyst extension
were used to efficiently identify trends and outliers in the data that may play a role in the
final surface as well as exploring the distribution of the data, looking for global trends,
and understanding spatial dependence in the data. After the probability surface was

59
created, a final risk assessment map was generated showing the high-risk areas of dengue
fever for the Central Valley of Costa Rica.
3.5 Agent-based Model Analysis
The ABM was based on the most important variables identified in the literature
review and the GIS analysis of the data collected influencing the spread of dengue fever.
Namely, the human interactions with the environment, the characteristics of the vector
including traveling distance, reproduction rate, mosquito’s breeding grounds, and climate
variability such as temperature and precipitation (see figure 13).
Figure 13. Elements Affecting the Disease
These elements made the development of the model simple yet robust and capable
of extracting useful information (data) from the manipulation of the different scenarios
that may occur from changes in the input parameters and/or by assigning different
properties rules to the various factors based on the characteristics of the disease. The
model represented the daily movements and interactions of people, the environment, and
the vector (mosquitoes) in a community, simulates the spread of dengue disease in an

60
urban area. The agent-based model could allow for the assessment of disease prevention,
intervention, and eventually response strategies as well as an experimental test tool for
analyzing the parameters affecting the disease within an urban area.
The simulation provided detailed information about each simulated scenario and
the significant events that may happen during an outbreak simulation—including the
number of susceptible, infected, and recovered people—along with a time stamp and
current location. Likewise, the model keeps track of all the others factors affecting the
numbers of cases including precipitation, temperature, and/or the most important
demographic and socio-economics characteristics of the population. The objective of this
study was to develop an agent-based modeling approach that integrated GIS and ABM to
simulate the spread of dengue fever disease in an urban environment, as a result of
individual’s interactions in a geospatial context. The main objective was to implement a
framework for modeling the spatial and temporal progression of dengue fever affecting
multiple populations in a geographically distributed location. GIS methods were used to
analyze the available data collected from government agencies at the macro level of the
whole study area. Then, a community-level agent-based model was implemented for a
micro-level analysis of three urban zones in the study area.
Implementation of the Agent-based Model
This section outlines the design and implementation of an ABM, spatially explicit
simulation for the study of dengue in a community-based population of two of the 48
cantons of the study area that will be selected from the macro analysis. There are many
simulation toolkits available including REPAST, MASON, AnyLogic, NetLogo, STEM,
JADE, and much more which requiring various levels of programming experience

61
(Bellifemine, Poggi, and Rimassa 2001; Dunham 2005; Luke et al. 2004). One of those,
the MASON toolkit, which is a set of open source Java-based libraries for agent-based
modeling, was used in the study for the implementing the ABM (Luke et al. 2004).
MASON is quite user friendly, and has all the required elements for creating a realistic
dengue epidemiology model (Dunham 2005; Luke et al. 2004). For a list and assessment
of others ABM toolkits refers to http://jasss.soc.surrey.ac.uk/7/1/6.html (Allan 2009;
Getchell 2008; Macal and North 2005).
The implementation of the agent-based model followed the waterfall model of the
software development process (Thummadi et al. 2011). During this stage, several
documents were written including software requirements specifications, software systems
architecture, interface design specification, software component detailed design,
annotated source code, software test plan, and software test procedures. This process was
noted following the phases in the diagram.
Figure 14. The Waterfall Model of Software Engineering

62
3.6 Proposed Framework for Dengue Fever Modeling
The following figure details the key components of the framework for the multi-
scale analysis of dengue fever in the Central Valley of Costa Rica. The framework is
composed of two analysis techniques: the macro analysis using GIS and the micro
analysis using the agent-based model. See figure 15.
Figure 15. The Overall Propose Framework Flowchart of the Model
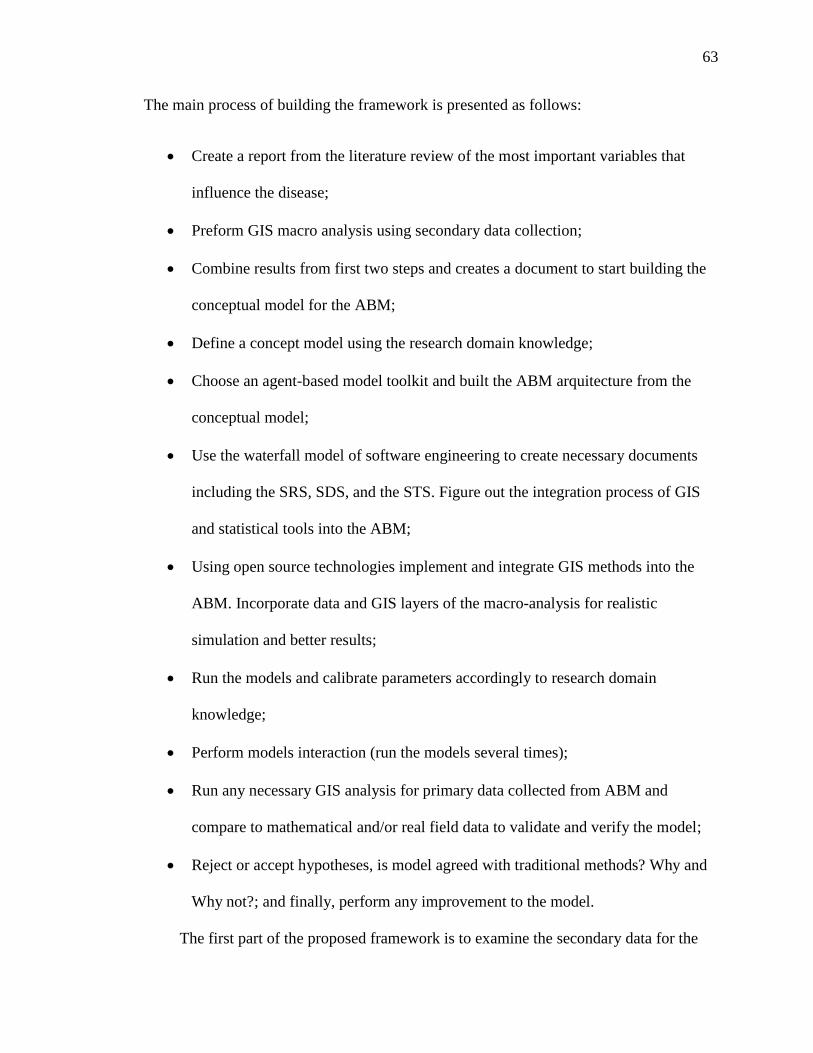
63
The main process of building the framework is presented as follows:
Create a report from the literature review of the most important variables that
influence the disease;
Preform GIS macro analysis using secondary data collection;
Combine results from first two steps and creates a document to start building the
conceptual model for the ABM;
Define a concept model using the research domain knowledge;
Choose an agent-based model toolkit and built the ABM arquitecture from the
conceptual model;
Use the waterfall model of software engineering to create necessary documents
including the SRS, SDS, and the STS. Figure out the integration process of GIS
and statistical tools into the ABM;
Using open source technologies implement and integrate GIS methods into the
ABM. Incorporate data and GIS layers of the macro-analysis for realistic
simulation and better results;
Run the models and calibrate parameters accordingly to research domain
knowledge;
Perform models interaction (run the models several times);
Run any necessary GIS analysis for primary data collected from ABM and
compare to mathematical and/or real field data to validate and verify the model;
Reject or accept hypotheses, is model agreed with traditional methods? Why and
Why not?; and finally, perform any improvement to the model.
The first part of the proposed framework is to examine the secondary data for the

64
macro-level analysis using GIS. The steps are presented as follows: Collect the required
data for analysis; get familiar with data, and prepare for spatial and tabular analysis
(GIS); reclassify and derived necessary data from input dataset; combine datasets and
perform GIS analysis; evaluated and interpret results; produced final maps and tabular
reports; perform any other required analysis and reject or accept hypothesis; and finally
use the collected results of macro analysis for implementing the ABM (see figure 16).
Figure 16. The GIS Outline for the Analysis of the Secondary Data

65
The second part of the framework is the implementation of the agent-based
model. The ABM model was developed in the MASON simulator, a multithreaded agent
based simulation platform which offer a modeling pattern and a set of tools for the
simulation of complex systems such as dengue fever. The platform is implemented in
Java and makes use of several open source libraries which provide tools for spatial
organization, visualization, event scheduling, simulation output, and class
implementation. The simulation was performed in discrete time and two dimensional
space using GIS layers of the study area. The main actors (agents) in the simulation are
humans, and mosquitoes. Other elements that were simulated are temperature and
precipitation. Agents are discrete and independent decision-making entities which have
socio-economic and demographic characteristics. When prompted to act, each agent
analyzes its current situation and/or location, e.g. what resources are available, what other
agents are in the area, and acts accordingly, based on a set of rules implemented.
Elements are real valued objects which obey predetermined rules of the environment,
such as physical laws of precipitation and temperature.
The process of building the ABM is shown as follows:
Define a concept model using the research domain knowledge. Define agent
types, their rules, environment, space and rules of interaction.
Define the quantitative and qualitative data collection for each time interval of the
model.
Implement the model (MASON toolkit) from the concept model.
Run the model, collect data, and compare the results with a calibration data set.
Repeat first four steps until model is calibrated.

66
Validate and verify the model using data from the research domain or a
mathematical equation for dengue fever. See figure 17 below.
Figure 17. The Dengue Fever Agent-Based Model
The ABM was validated using cross-validation or model alignment, run a
validated model for some scenarios where the result is known. The two methods to
validate the dengue fever ABM are SEIR (Susceptible, Exposed, Infected, Resistance)
mathematical models (Bobashev et al. 2007; Dunham 2005; Epstein et al. 2008) using
equation-based approaches, and/or comparing existing field data using a statistical model
(Ford, Kaufman, and Eiron 2006; Skvortsov et al. 2007). The SEIR model represents a
sub-model inside the ABM of dengue fever.

67
Figure 18. Different Stages of the SEIR Infection Model
Figure 18 represents the different states of the SEIR infection model, to simulate
the progress of and epidemic in a human population. Lpi: latency period, Ipi: infectious
period, ti: first day that an individual is exposed to the virus for the first time, xLP: number
of days for an exposed individual to become infective, and xIP: number of days for an
individual to recover from the disease (Perez and Dragicevic 2009). The figures (19 and
20) below depict flowcharts of possible states in an epidemic model SIS, SIR, SEIS, and
SEIR and their multiple compartmental phases.
Figure 19. Possible Stages of an Epidemic Model

68
Figure 20. The Compartmental Phases of the ABM
The probability in transition between stages in the SIER model used Markov
Decision Processes (MDPs). MDPs offer a mathematical framework for modeling
sequential decision-making in situations where outcomes are partly random and partly
under the control of a decision maker (Yinyu 2011). MDP is one of the most fundamental
dynamic decision models in social science as well as mathematical science, physical
science, and management science. Modern applications include dynamic planning,
support learning, social networking, and almost all other dynamic/sequential decision
making problems (Yinyu 2011).

69
Figure 21. The Data Flow Affecting the SEIR Model
The application of the Dengue Fever Agent-Based Model (DFABM) simulation
system implemented several Java classes. It is composed of four packages, the dfabm,
GUI, exceptions, and File package. This packages uses the functionality of the open
source MASON framework, the Geo Mason package and several others open Java
libraries. The GUI package is composed of three classes; the DFABMWithUI, the
PanelSymbology, and the PanelFile. These three classes handled the visualization of the
Graphical User Interface (GUI), allowing for change of simulation parameters. The
exception package, which is composed of one class, handles any input/output (I/O) error
messages that may occur during the simulation. The File package, which contains four
classes, handles the reads and the writes of any data used by the simulation. Finally, the
core dfabm package contains the main classes that control the simulation. To travel from
home to work (Building class) and vice-versa, the agents (Human class) use the shortest

70
path algorithm (AStart class) to find his/her way out in the road layer. The DFABM is the
main class that oversees the others ones.
The StudyArea class manages the attributes and operations (get and set) of the study
area. Also, assign the socio-economic and demographic characteristics to each one of the
agents (Humans). The WeatherData class supervises the attributes and operations of the
meteorological characteristics for the study area (precipitation and temperature).
RowInformation class handles the output files, the Excel and the GIS files created by the
simulation. DengueCases class controls the reads and writes of the number of dengue
cases used in the simulation. Building class implements the attributes and operations of
houses and work buildings. It also handles the actual infection of agents. Thus, the rules
and probabilities of infections are oversees by this class. Human class handles the
attributes and operations of the agents (Humans). It supervises the different stages of the
humans (SEIR states). Besides, it takes care of the human portrayal for the simulation,
and its location. The DFABM is the main class that oversee the others classes. This class
implements the rules and interactions between the agents (see figure 22 below).

71
Figure 22. An Overview of the Class Diagram
This diagram only represents the main classes and packages that were used in the
implementation of the dengue fever agent based model (DFABM). They do not contain
any of the properties and/or methods.
In summary, Agent Based Model (ABM) and Geographic Information System
(GIS) analysis may provide a valuable framework or methodology for the study of
dengue fever in the Central Valley of Costa Rica. Precipitation, temperature, socio-
economic and demographics variables were analyzed using these technologies to possibly
identify factors affecting the rates of dengue fever cases in the study area. GIS was used
to generate risk maps of dengue incidences, as well as to map the spatial distribution and
vulnerability of dengue risk surfaces in the study area using weighted regression.
The implementation of the dengue fever agent based model (DFABM) included
the most important variables affecting the rates of dengue fever as identified from the

72
literature review and GIS analysis. The agent-based model represented daily movements,
changes and interactions of humans, the environment, and the vector in relation to the
appearance of dengue cases. The simulation collects data about each scenario and the
significant events that may happen during an outbreak simulation. The simulation models
physical processes and evaluate “what if” scenarios of the disease. Through evaluation
and experimentation of the “what if” scenarios the model may act or evolve into a
decision support system. Topics of computation time, durations of processes, and number
of agents were assessed in the software design specification. Complementing traditional
methods of analysis with an agent based model may yield enhanced analysis techniques
for the study of dengue fever.

73
CHAPTER IV
ANALYSIS OF DATA / RESULTS
4.1 Organization of Data Analysis
The framework is composed of two analysis techniques: the macro analysis using
Geographic Information Systems (GIS) and the micro analysis using the dengue fever
agent based model (DFABM). GIS was used to analyze the available data collected from
government agencies, universities, and private agencies at the macro level of the study
area. Then, a community level dengue fever agent based model was implemented for a
micro level analysis of three urban zones in the study area.
The study focused on the Greater Metropolitan Area or Central Valley of Costa
Rica. The base data utilized for the study was; annual rates of dengue cases, weather
information, which included temperature and precipitation; demographic and socio-
economic characteristics of the population, which include, sex, age differences,
education, household density, land cover (percentage of urbanization), household
condition; and geographic information layers for the study area, which included roads,
built areas, borders, neighborhoods, and segments for each of the 35 zones of the study
area. Table 2 depicts the variables used for the susceptibility analysis of the annual rates
of dengue cases

74
Table 2. Susceptibility Analysis of the Annual Rates of Dengue Cases
Sensibility Exposure
Weather Scale of Analysis Rate Exposure Area
Temporal Spatial
Temperature (c) 1993-2008 Canton Seasonal Grand Metropolitan Area (GMA)
Average low and high temperature Summer
Average low and high temperature Winter
Precipitation (mm) 1993-2008 Canton Seasonal GMA
Summer precipitation Summer
Winter precipitation Winter
Socio-economics variables Census 2000 Canton GMA
% of urban population (land use)
% high school and more (education)
% of economically active and students (occupation)
Average occupants (housing)
% of houses condition poor (housing)
% of overcrowded housing
Demographics variables Census 2000 Canton GMA
% of males
% of group age 0 to 9
% of group age 65 and over
Analysis Techniques
GIS was used to create risk maps depicting likely patterns, spatial distribution,
and/or areas for outbreaks of dengue fever. The spatial variation of dengue incidence was
mapped using geographical weighted regression (GWR). GWR was utilized to
understand the relationships between dengue fever occurrences, demographic and socio-
economic variables of the population distribution, as well as the meteorological factor of
temperature and precipitation. GIS was also used to identify high risk zones to dengue
fever. Several GIS layers, including areas with optimal temperature for the survival of the
mosquito, precipitation, socio-economic, and demographic areas were reclassified to
obtain the areas of high, medium, and low risk for dengue fever. The ABM was based on

75
the most important variables identified in the literature review and the GIS analysis
identified as influencing the annual rates of dengue fever (see Table 2).
4.2 Research Questions and Associated Hypotheses
This study focused on the following research questions:
Research Question I: Does a community-level dengue fever agent-based model
(DFABM) produce results comparable (agree) to those produced by traditional macro-
level GIS analysis?
The resulting hypothesis for this research question was:
Hypothesis I: H0: The analysis of the emergence data of the community level dengue
fever agent-based model, which studied the same variables of the macro analysis
(precipitation, temperature, demographic, and socio-economics features of the
population), disagreed with traditional macro-level GIS analysis.
Ha: The analysis of the emergence data of the community level dengue fever agent-based
model, which studied the same variables of the macro analysis (precipitation,
temperature, demographic, and socio-economics features of the population), agreed with
traditional macro-level GIS analysis.
Question II: Does a community-based dengue fever agent-based model (DFABM)
enhance traditional geographic information system analysis and could it aid in predicting
future dengue fever outbreaks?
The resulting hypothesis for this research question was:
Hypothesis II: H0: A community level agent-based model of dengue fever (DFABM)
does not enhance GIS analysis and further the understanding and possible prediction of
dengue outbreaks.

76
Ha: A community level agent-based model of dengue fever (DFABM) enhances GIS
analysis and furthers the understanding or possible prediction of dengue outbreaks.
4.3 Analysis of Data
Performing the Geographic Information System Analysis
The GIS analysis used the variables depicted on page 69 (see Table 2). Thematic
mapping (i.e. choropleth maps) was used to represent these variables: population density,
precipitation, temperature, rates of dengue fever, and demographic of the population.
Most of the maps are Multiple Attributes Maps (MA Maps). They symbolize the data
using more than one attribute, creating a multivariate display to provide an initial analysis
and assist with visualization across the study area. These maps reflect the spatial
variability of the potential predictors (independent variables) within the region.
Therefore, the map analysis depicts a visualization of the variance explained by each of
the independent variables.
Figure 23. MA Maps: % Poor Condition Houses, and Dengue Rates

77
Maps indicate the majority of cantons with the highest rates of dengue fever also have the
highest averages temperatures, more precipitation, and highest percentages of houses on
poor condition. For instance, the area of Mora is a zone with warm, rainy, high
temperatures.
Figure 24. MA Maps: Pop Density, % Males, % Poor Condition Houses, Dengue Rates
When examining this second map (figure 24) and considering the rates of dengue
cases, the analysis appeared to depict these three variables together were not good
predictors to the rates of dengue cases, indicating a possible different variable affecting
the rates. The following figures depict interpolation maps of precipitation and
temperature. Figure 27, representing summer averages high temperatures and rates of
dengue fever indicated high temperatures was a variable affect, or is related to the
reported cases of dengue fever.

78
Figure 25. Precipitation (Point Interpolation) and Rates of Dengue Cases
Figure26. Temperature (Point Interpolation) and Rates of Dengue Case

79
Figure 27. Summer Average High Temperatures and Rates of Dengue
The following maps show others characteristics of the study area such as percentages of
urban population, interpolation of the weather points with the division of the study area
which correspond to the 35 cantons or zones. The interpolation method was used to
construct new data points within the range of the discrete set of the weather stations
points used in the study. Costa Rica is divided in seven provinces and the study area
covers 35 zones of four of those provinces. The map analysis depicts the study area as
divide into cantons, and the distribution of rates of dengue cases.

80
Figure 28. Point Interpolation: Precipitation
Figure 29. Point Interpolation: Temperature

81
Figure 30. Percentage of Urban Population, and Rates of Dengue Fever
Performing Geographically Weighted Regression (GWR)
The spatial variation of dengue incidence was mapped using geographically
weighted regression (GWR). GWR was utilized to understand the relationships between
dengue fever occurrences, demographic and socio-economic variables of the population
distribution, as well as the meteorological factor of temperature and precipitation.
Following there are series of maps and tables that show the output of the variability of the
independent variables, IV, with respect to the dependent variable, DV.

82
Figure 31. GWR: Precipitation and Supported Table

83
Figure 32. GWR: Averages Temperatures and Supported Table

84
Figure 33. GWR: % Poor Conditions Houses and Supported Table

85
Figure 34. GWR: % Overcrowded Houses and Supported Table

86
Figure 35. GWR: Land Use and Supported Table

87
Figure 36. GWR: % High school and More and Supported Table

88
Figure 37. GWR: % Houses with 1 to 2 Rooms and Supported Table

89
Table 3. Result of Geographic Weighted Regression
Independent Variables (IV) R2 R2 Adjusted % of the variation in the Dependent Variable (DV)
Total Precipitation 0.660559 0.490281 49 %
Averages Temperatures 0.52181 0.376437 38 %
% Poor Conditions Houses 0.813255 0.722182 72 %
% Overcrowded Houses 0.705287 0.550934 55 %
Land Use (% urban population) 0.694892 0.532532 53 %
% high school and more (education) 0.655652 0.466227 47 %
% Houses with 1 to 2 Rooms 0.698188 0.535499 54 %
Table 3 depicts the percentages of poor conditions houses had on the highest
percentage of variation on the rates of dengue fever. Others variables were not important
to the percentage of variation in the dependent variable (rates of dengue fever), such as
age, sex, occupation, and percentages of houses occupants. Geographic Weighted
Regression, which is a local form of linear regression used to model spatially varying
relationships, was an important way to visualize space instead of number.
Identified High Risk Zones of Dengue Rates
Geographic Information System (GIS) was used to identify high risk zones to
dengue fever. Several GIS layers, including areas with optimal temperature, precipitation,
socio-economic, and demographic areas were analyzed and reclassified to obtain the
areas of high, medium, and low risk rates of dengue fever. From these results, three zones
(cantons) were selected with high, medium, and low rates of dengue fever for agent based
modeling assessment (see Table 7). These three areas were used to run the DFABM
simulation in addition to calibrate and validated the model. They were also used to
compare and depict the results of the emergence data of the simulation. Figures below are
multiple attributes maps. The attributes were used for analysis and depicted rates of
dengue fever, total precipitation, and average temperature. Particular cantons with high

90
rates of dengue fever identified were; Atenas, Alajuela, Mora, and Santa Ana. Table 4
describes the variables that characterized the identified zones. Specific cantons with
medium rates of dengue fever were; Moravia, Barva, and Santa Barbara. Table 5 explains
the characterized zones. Finally, those cantons documented with low rates of dengue
fever were Alvarado, Valverde Vega, and Oreamuno and are depicted in Table 6.
Table 4. High Rates of Dengue Fever Zones
Independent Variables (predictor) Atenas Alajuela Mora Santa Ana
COD_CANTON 205 201 107 109
CANTON Atenas Alajuela Mora Santa Ana
Summer Precipitation 2647 10074 2647 2138
Winter Precipitation 28952 48469 28952 24485
Annual Precipitation 31598 58543 31598 26623
Summer Average Low Temperature 19.90 12.87 19.90 18.36
Winter Average Low Temperature 19.77 13.71 19.77 18.90
Summer Average High Temperature 32.14 21.12 32.14 27.27
Winter Average High Temperature 29.02 21.29 29.02 27.12
Average Low Temperature 19.8 13.4 19.8 18.7
Average High Temperature 30.3 21.2 30.3 27.2
Average Temperature 25.1 17.3 25.1 22.9
Total Population 22479 222853 21666 34507
Percentage Males 50.52 50.10 50.03 48.97
Summer Number Dengue Cases 62 1045 65 88
Winter Number Dengue Cases 1072 5626 564 839
Summer Rates Dengue Cases 27.58 46.89 30.00 25.50
Winter Rates Dengue Cases 476.89 252.45 260.32 243.14
Total Number Dengue Cases 1134 6671 629 927
Total Rates Dengue Cases 504.47 299.35 290.32 268.64
Percentage Age 0 To 9 18.12 19.30 20.58 19.16
Percentage Age 65 and More 7.47 5.66 6.16 5.44
Percentage Urban Population 27.6 55.4 39.8 52.2
Percentage High School and More 43.9 46.5 42.5 52.6
Percentage Workers and Students 48.77 48.77 48.02 52.93
Total Housing 5720 55496 5469 8600
Average Occupants 4 4 4 4
Percentage Poor Conditions Houses 6.48 8.08 10.15 7.96
Percentage Overcrowded Houses 3.20 6.40 6.40 5.90

91
Some important facts emerging from the data and map analysis for the high rates dengue
were: they have the highest percentages of overcrowded and poor conditions houses;
seasonal temperatures are always high, winter (low and high) average temperatures were
high, which were optimal for the vector; high precipitation patterns with warm winters;
and high percentages of males.
Figure 38. High Rates of Dengue Fever Zones

92
Table 5. Medium Rates of Dengue Fever Zones
Independent Variables (predictor) Moravia Barva Santa Barbara
COD_CANTON 114 402 404
CANTON Moravia Barva Santa Barbara
Summer Precipitation 9809 4152 4152
Winter Precipitation 31827 36777 36777
Annual Precipitation 41636 40930 40930
Summer Average Low Temperature 14.79 14.57 14.57
Winter Average Low Temperature 15.74 15.34 15.34
Summer Average High Temperature 21.82 25.39 25.39
Winter Average High Temperature 23.11 25.25 25.25
Average Low Temperature 15.3 15.0 15.0
Average High Temperature 22.6 25.3 25.3
Average Temperature 19.0 20.2 20.2
Total Population 50419 32440 29181
Percentage Males 47.92 49.41 50.18
Summer Number Dengue Cases 27 33 8
Winter Number Dengue Cases 175 114 141
Summer Rates Dengue Cases 5.36 10.17 2.74
Winter Rates Dengue Cases 34.71 35.14 48.32
Total Number Dengue Cases 202 147 149
Total Rates Dengue Cases 40.06 45.31 51.06
Percentage Age 0 To 9 16.02 19.01 20.35
Percentage Age 65 and More 6.53 5.13 4.90
Percentage Urban Population 82.6 53.2 41.8
Percentage High School and More 68.4 58.9 47.7
Percentage Workers and Students 56.41 51.82 48.20
Total Housing 13406 7765 7099
Average Occupants 4 4 4
Percentage Poor Conditions Houses 4.50 5.79 6.11
Percentage Overcrowded Houses 3.20 4.10 5.00
Some significant details of medium rates of dengue cantons were they have fewer
percentages of overcrowded and poor conditions houses, seasonal temperatures fluctuated
between high and low; high precipitation patterns, but continued highest percentages of
males.

93
Figure 39. Medium Rates of Dengue Fever Zones

94
Table 6. Low Rates of Dengue Fever Zones
Independent Variables (predictor) Alvarado Valverde Vega Oreamuno
COD_CANTON 306 212 307
CANTON Alvarado Valverde Vega Oreamuno
Summer Precipitation 11342 2035 5294
Winter Precipitation 27553 31534 23042
Annual Precipitation 38895 33569 28336
Summer Average Low Temperature 13.21 16.99 14.27
Winter Average Low Temperature 12.90 18.51 15.88
Summer Average High Temperature 20.25 30.96 23.29
Winter Average High Temperature 20.61 29.13 24.50
Average Low Temperature 13.0 17.9 15.2
Average High Temperature 20.5 29.9 24.0
Average Temperature 16.7 23.9 19.6
Total Population 12290 16239 39032
Percentage Males 50.87 49.29 49.79
Summer Number Dengue Cases 0 2 4
Winter Number Dengue Cases 0 2 22
Summer Rates Dengue Cases 0.00 1.23 1.02
Winter Rates Dengue Cases 0.00 1.23 5.64
Total Number Dengue Cases 0 4 26
Total Rates Dengue Cases 0.00 2.46 6.66
Percentage Age 0 To 9 22.10 21.60 21.93
Percentage Age 65 and More 4.89 5.83 4.54
Percentage Urban Population 18.5 33.9 73.4
Percentage High School and More 23.7 34.5 41.1
Percentage Workers and Students 43.49 44.91 47.96
Total Housing 2700 3927 8513
Average Occupants 5 4 5
Percentage Poor Conditions Houses 5.74 10.42 6.31
Percentage Overcrowded Houses 5.70 4.80 6.90
Significant specifics of low rates of dengue areas were have high percentages of
overcrowded and poor conditions houses; but seasonal temperatures were the lowest of
the zones selected; less precipitation patterns; and lowest percentages of urban
population.
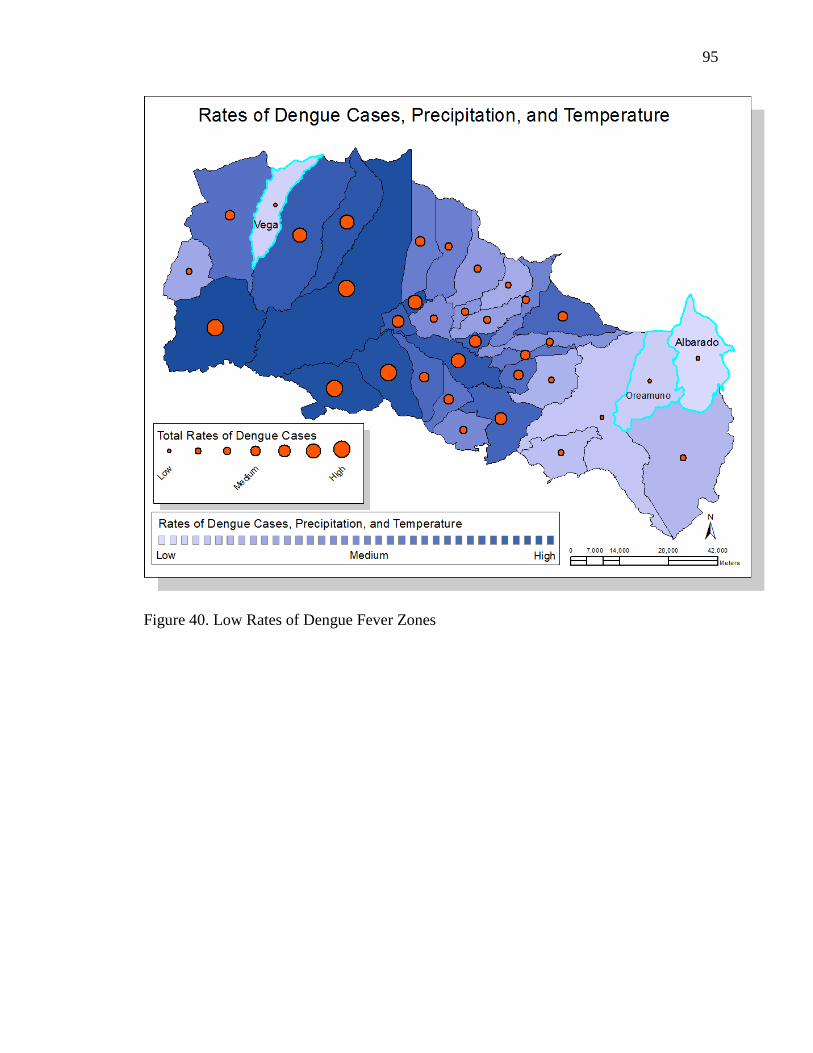
95
Figure 40. Low Rates of Dengue Fever Zones

96
Table 7. Selected Zones: High, Medium, and Low Rates of Dengue Fever
Independent Variables (predictor) High Rates of DF Medium Rates of DF Low Rates of DF
Atenas Barva Alvarado
COD_CANTON 205 402 306
CANTON Atenas Barva Alvarado
Summer Precipitation 2647 4152 11342
Winter Precipitation 28952 36777 27553
Annual Precipitation 31598 40930 38895
Summer Average Low Temperature 19.90 14.57 13.21
Winter Average Low Temperature 19.77 15.34 12.90
Summer Average High Temperature 32.14 25.39 20.25
Winter Average High Temperature 29.02 25.25 20.61
Average Low Temperature 19.8 15.0 13.0
Average High Temperature 30.3 25.3 20.5
Average Temperature 25.1 20.2 16.7
Total Population 22479 32440 12290
Percentage Males 50.52 49.41 50.87
Summer Number Dengue Cases 62 33 0
Winter Number Dengue Cases 1072 114 0
Summer Rates Dengue Cases 27.58 10.17 0.00
Winter Rates Dengue Cases 476.89 35.14 0.00
Total Number Dengue Cases 1134 147 0
Total Rates Dengue Cases 504.47 45.31 0.00
Percentage Age 0 To 9 18.12 19.01 22.10
Percentage Age 65 and More 7.47 5.13 4.89
Percentage Urban Population 27.6 53.2 18.5
Percentage High School and More 43.9 58.9 23.7
Percentage Workers and Students 48.77 51.82 43.49
Total Housing 5720 7765 2700
Average Occupants 4 4 5
Percentage Poor Conditions Houses 6.48 5.79 5.74
Percentage Overcrowded Houses 3.20 4.10 5.70
The chosen areas with the high, medium, and low rates of dengue fever presented in
Table 7 depicts the differences between temperature, precipitation, socio-economics and
demographic predictor influencing the dependent variable, annual rates of dengue fever.
As indicated, temperature is one of the main factors that may responsible for the reported

97
cases of dengue fever. Finally, according to the maps and Tables analysis, percentages of
poor conditions houses, and percentages of urban population may affect the rates of
dengue fever.
Figure 41. Selected Zones: High, Medium, and Low Rates of Dengue Fever
The development of the DFABM (Dengue Fever Agent-Based Model) simulation
The development of the simulation follows the waterfall model software
engineering technique to implement a design as humble as possible using open source
code, MASON toolkit, yet robust-complex and capable of extracting useful data from the
manipulation of the different scenarios, which may occur from changes in the input

98
parameters and/or by assigning different properties and probabilities rules to the various
factors affected, or based on the characteristics of the disease. The GUI presented to the
user is displayed below. All figures presented in this part of the document correspond to
the actual running of the simulation.
Figure 42. Graphical User Interface (GUI)
The simulation represented the daily movements and interactions of people, the
environment, and the vector (mosquitoes) in a community, simulating the spread of
dengue disease. The simulation provided detailed real time information about each
simulated scenario and the significant events that may happen during an outbreak
simulation—including the number of susceptible, exposed, infected, and recovered
people—along with a time stamp and current location were the dengue cases are
happening, longitude-latitude. Likewise, the model keeps track of all the others factors,
including precipitation, temperature, and the most important demographic and socio-
economics characteristics of the population.
Furthermore, the system creates a folder where several files are saved for further
analysis. A data excel file that contains the cases of dengue fever simulated, which are
displayed in rows, and the variables affecting the cases displayed in columns.

99
Table 8. Excel Table Created by Simulation
GIS_FID Cod_Area Month Year Precip Temp Sex Age Economically Education %_urban pop
House Cond
House Occupants X Y
4 205 1 2000 400 25 1 1 0 2 27.6 2 7 456703.725 1105123.953
4 205 1 2000 400 25 0 1 0 3 27.6 2 2 458796.412 1098721.843
4 205 1 2000 400 25 0 1 0 3 27.6 1 5 455412.9686 1108734.18
4 205 1 2000 400 25 0 2 0 6 27.6 2 2 458205.8536 1103315.037
4 205 1 2000 400 25 0 1 0 6 27.6 2 2 456644.005 1102210.9
4 205 1 2000 400 25 0 1 0 3 27.6 2 2 459159.0837 1105186.44
4 205 1 2000 400 25 1 0 1 2 27.6 2 4 449986.2996 1099722.551
4 205 1 2000 400 25 1 1 1 2 27.6 2 1 454598.1303 1108903.131
4 205 1 2000 400 25 0 1 0 6 27.6 2 0 454598.1303 1108903.131
4 205 1 2000 400 25 0 1 0 3 27.6 2 2 455180.108 1107037.036
4 205 1 2000 400 25 0 1 0 6 27.6 2 1 456703.725 1105123.953
4 205 1 2000 400 25 1 1 0 2 27.6 1 1 457709.842 1105447.597
4 205 1 2000 400 25 0 1 0 3 27.6 1 1 457709.842 1105447.597
4 205 1 2000 400 25 0 1 0 3 27.6 2 1 454777.8604 1099226.109
4 205 1 2000 400 25 0 1 0 2 27.6 1 2 449940.1569 1099790.649
4 205 1 2000 400 25 0 1 0 6 27.6 2 0 449940.1569 1099790.649
4 205 1 2000 400 25 1 0 1 0 27.6 2 2 454646.0704 1104825.355
4 205 1 2000 400 25 1 1 1 2 27.6 1 2 454646.0704 1104825.355
4 205 1 2000 400 25 1 1 1 2 27.6 2 3 453971.7029 1104779.047
The Table above shows the Excel tracking data of the simulation. Sex, age, economically
active, and house conditions were saved as categories. The reason for saved categories
(number) instead of name categories is in case the researcher wanted to perform SPSS
analysis on the data; it would be ready for the analysis. Also, using the column GIS_FID,
if the researcher wanted to combine the data with the GIS layer for the respective area,
he/she could combine the data and explore it in map format.
The other files created by the simulator are point GIS information data containing
actual location (longitude-latitude) of where an agent (human) got infected with dengue
fever for the geographic area simulated. These files were used to create three maps with
high, medium, and low number of dengue cases (see example below).

100
Figure 43. High Rates Map of Dengue Fever Cases, Atenas
The DFABM model was developed in the MASON simulator, an open source
multithreaded agent based simulation platform. The simulation was performed in discrete
time and two dimensional space using GIS layers for the three zones identified in the GIS
analysis. However, the simulator could be used for any of the 35 zones. The main actors
(agents) in the simulation were humans. Other simulated elements were temperature and
precipitation. Agents are discrete and independent decision-making entities, which have
socio-economic and demographic characteristics. When prompted to act, each agent
analyzes its current situation and/or location, e.g. with what resources are available, what
other agents are in the area, and acts accordingly, based on a set of rules and probabilities
implemented.
The system gives the user the option to enter data or read data from files. The
three zones selected to run the model were the cantons with the highest, medium, and
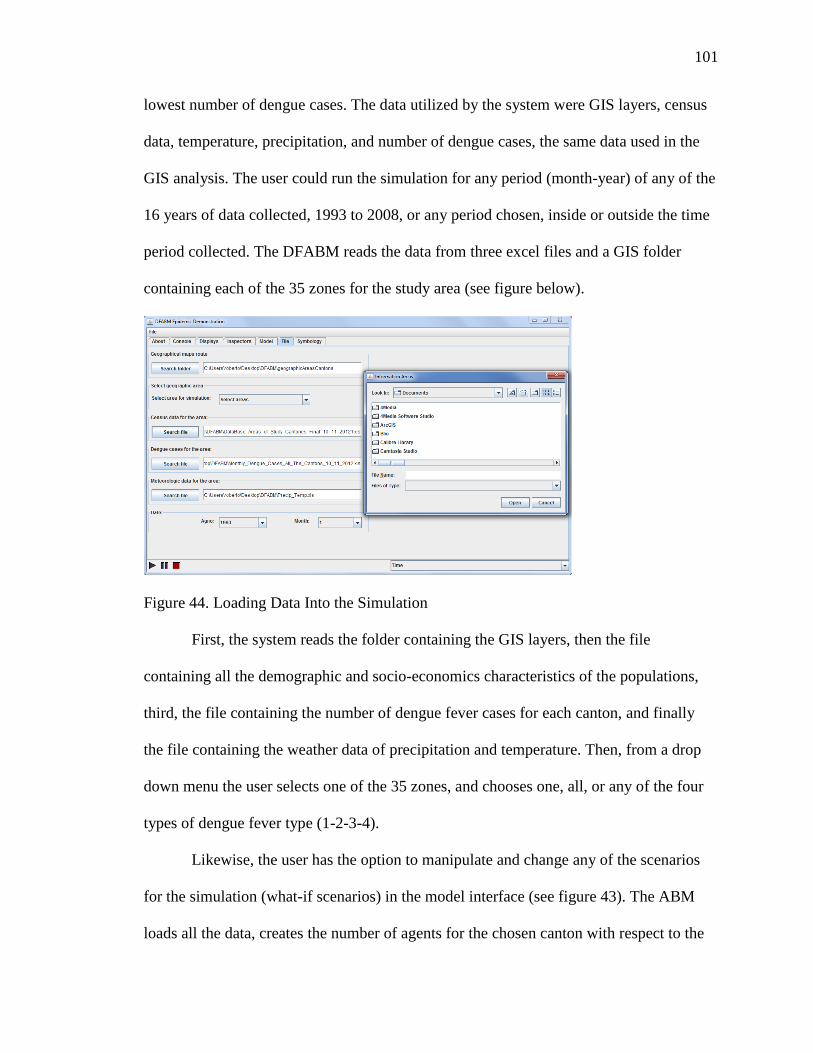
101
lowest number of dengue cases. The data utilized by the system were GIS layers, census
data, temperature, precipitation, and number of dengue cases, the same data used in the
GIS analysis. The user could run the simulation for any period (month-year) of any of the
16 years of data collected, 1993 to 2008, or any period chosen, inside or outside the time
period collected. The DFABM reads the data from three excel files and a GIS folder
containing each of the 35 zones for the study area (see figure below).
Figure 44. Loading Data Into the Simulation
First, the system reads the folder containing the GIS layers, then the file
containing all the demographic and socio-economics characteristics of the populations,
third, the file containing the number of dengue fever cases for each canton, and finally
the file containing the weather data of precipitation and temperature. Then, from a drop
down menu the user selects one of the 35 zones, and chooses one, all, or any of the four
types of dengue fever type (1-2-3-4).
Likewise, the user has the option to manipulate and change any of the scenarios
for the simulation (what-if scenarios) in the model interface (see figure 43). The ABM
loads all the data, creates the number of agents for the chosen canton with respect to the
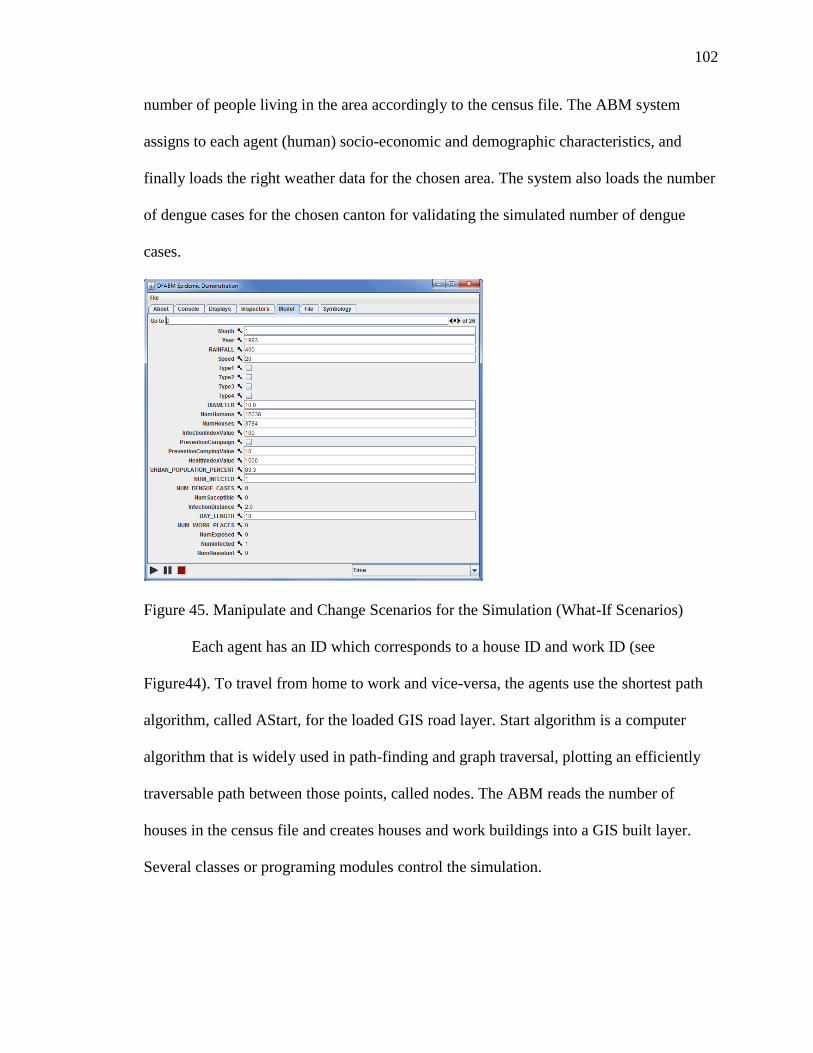
102
number of people living in the area accordingly to the census file. The ABM system
assigns to each agent (human) socio-economic and demographic characteristics, and
finally loads the right weather data for the chosen area. The system also loads the number
of dengue cases for the chosen canton for validating the simulated number of dengue
cases.
Figure 45. Manipulate and Change Scenarios for the Simulation (What-If Scenarios)
Each agent has an ID which corresponds to a house ID and work ID (see
Figure44). To travel from home to work and vice-versa, the agents use the shortest path
algorithm, called AStart, for the loaded GIS road layer. Start algorithm is a computer
algorithm that is widely used in path-finding and graph traversal, plotting an efficiently
traversable path between those points, called nodes. The ABM reads the number of
houses in the census file and creates houses and work buildings into a GIS built layer.
Several classes or programing modules control the simulation.

103
Figure 46. Agents (Humans) Socio-economics and Demographics Characteristics
The DFABM simulation is composed of four packages, the dfabm, GUI,
exceptions, and File package. The GUI package is composed of three classes. These three
classes handled the visualization of the Graphical User Interface (GUI). The exception
package handles any input/output error messages that may occur. The File package
handles the reads and the writes of any data used by the simulation. Finally, the core
dfabm package contains the main classes that control the simulation. The agents (Humans
class) have a home and work places (Building class). To travel from home to work and
vice-versa, the agents use a shortest path algorithm (AStart class). The DFABM is the
main class that oversees the others ones.
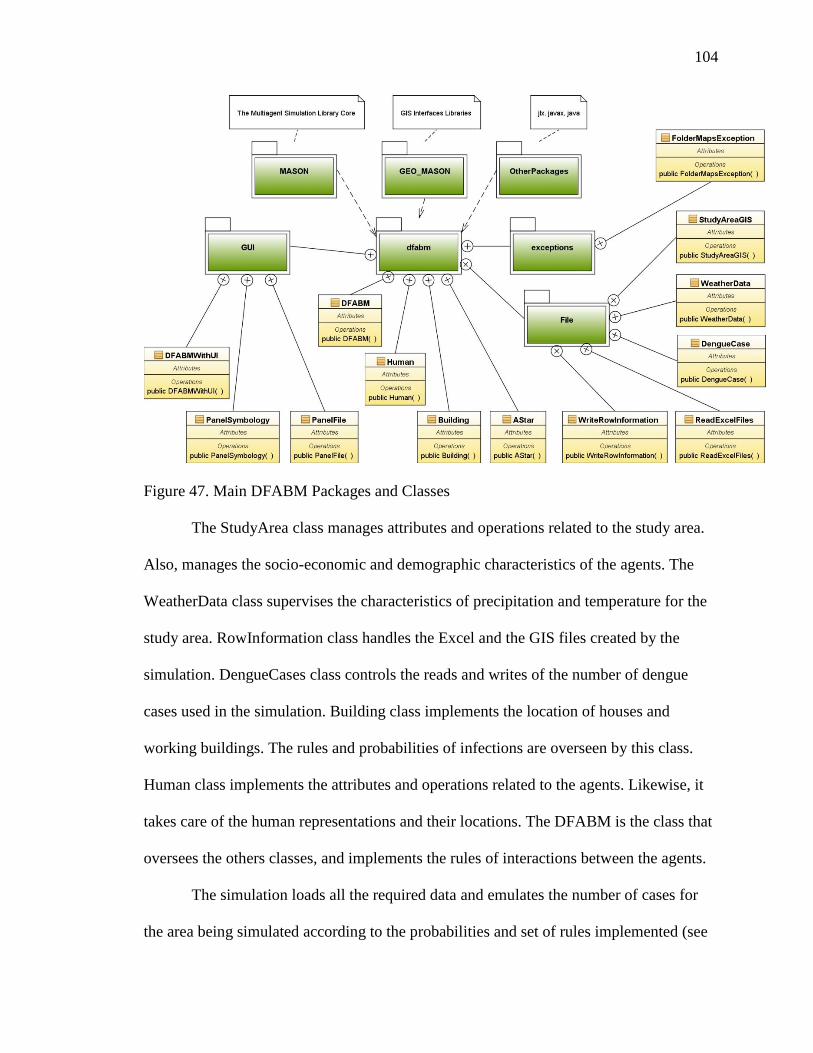
104
Figure 47. Main DFABM Packages and Classes
The StudyArea class manages attributes and operations related to the study area.
Also, manages the socio-economic and demographic characteristics of the agents. The
WeatherData class supervises the characteristics of precipitation and temperature for the
study area. RowInformation class handles the Excel and the GIS files created by the
simulation. DengueCases class controls the reads and writes of the number of dengue
cases used in the simulation. Building class implements the location of houses and
working buildings. The rules and probabilities of infections are overseen by this class.
Human class implements the attributes and operations related to the agents. Likewise, it
takes care of the human representations and their locations. The DFABM is the class that
oversees the others classes, and implements the rules of interactions between the agents.
The simulation loads all the required data and emulates the number of cases for
the area being simulated according to the probabilities and set of rules implemented (see
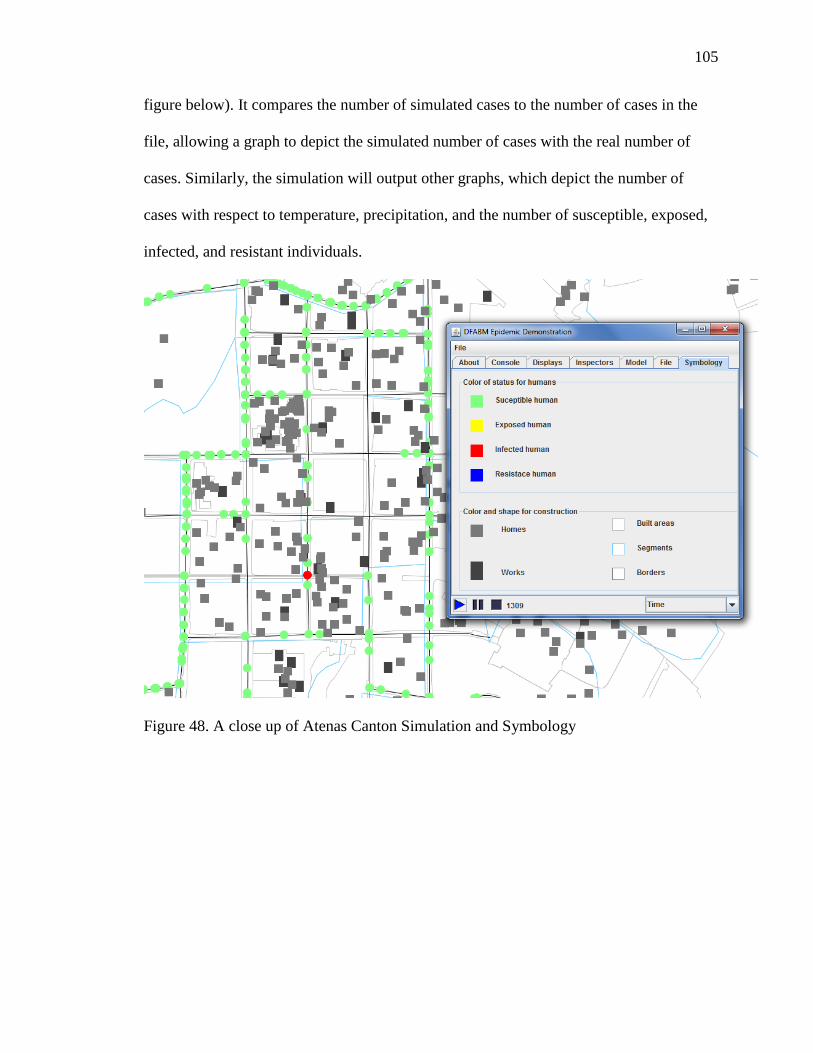
105
figure below). It compares the number of simulated cases to the number of cases in the
file, allowing a graph to depict the simulated number of cases with the real number of
cases. Similarly, the simulation will output other graphs, which depict the number of
cases with respect to temperature, precipitation, and the number of susceptible, exposed,
infected, and resistant individuals.
Figure 48. A close up of Atenas Canton Simulation and Symbology

106
Figure 49. Number of Simulated Cases and Temperature, Canton of Atenas
By examining the graph, created by the simulation, high temperatures in the canton of
Atenas corresponded to greatest number of dengue cases, which agree with the findings
of the GIS analysis. The figure below shows the number of exposed, infected and
resistance individuals in the simulation. As is shown, there is zero individual’s resistance
to the virus.
Figure 50. Simulated Cases, (Susceptible→Exposed→Infected→Resistance)
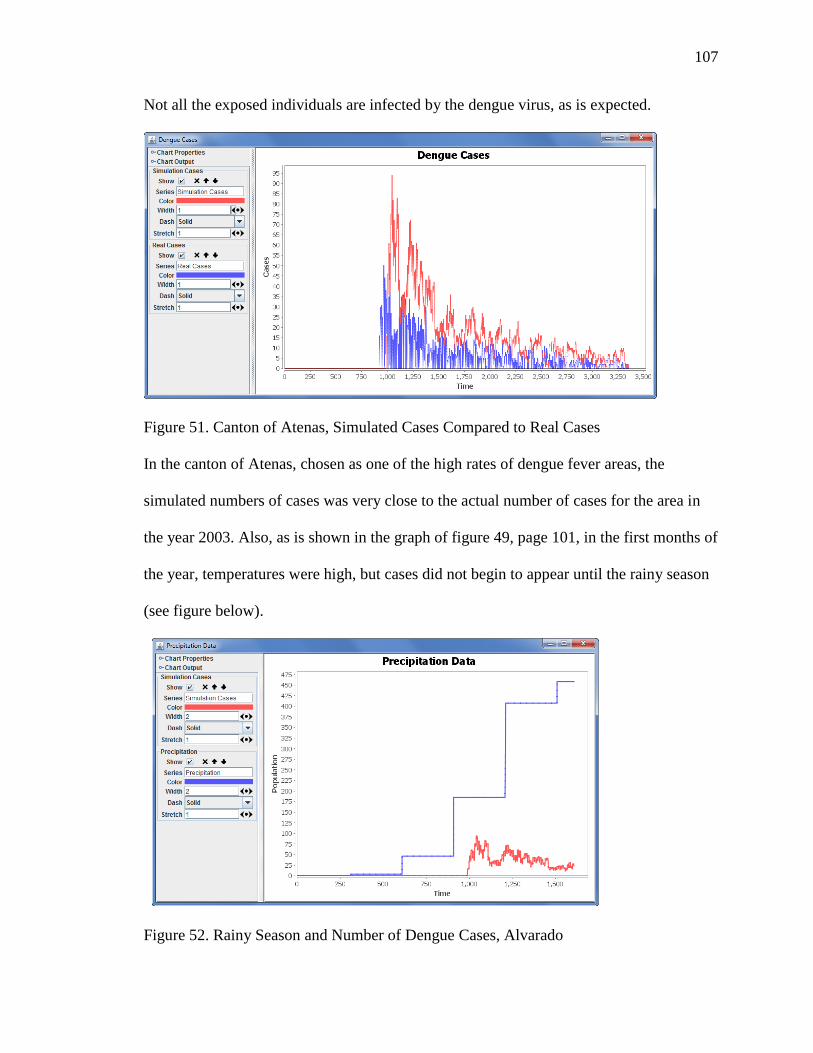
107
Not all the exposed individuals are infected by the dengue virus, as is expected.
Figure 51. Canton of Atenas, Simulated Cases Compared to Real Cases
In the canton of Atenas, chosen as one of the high rates of dengue fever areas, the
simulated numbers of cases was very close to the actual number of cases for the area in
the year 2003. Also, as is shown in the graph of figure 49, page 101, in the first months of
the year, temperatures were high, but cases did not begin to appear until the rainy season
(see figure below).
Figure 52. Rainy Season and Number of Dengue Cases, Alvarado

108
Again, the simulation agreed with the findings of the macro analysis. The simulation was
run for the year to 2000 for the canton of Alvarado. This canton was the one selected for
the low rates of dengue fever. The simulation agreed with the total number of cases for
this year in this canton. The total number of cases for this year, 2000, for Alvarado was
zero dengue cases, which agreed with the zero cases simulated by the DFABM. This area
of low rates of dengue had very low seasonal temperatures, less precipitation patterns,
and a low percentage of urban population.
The expected findings were the analysis of the emergence data of the DFABM
(micro analysis), would agree with GIS analysis (macro analysis). The hypothesis was
tested using the validation process for the DFABM and the simulation running of several
(what-if) scenarios for the occurrences of dengue cases on the selected three cantons
(Table 7, page 91). Then, results were compared to the results of the macro level (GIS)
and with the results of the micro level of the DFABM. The real time results of the
DFABM agreed with the GIS technique, and the review of the literature. Thus, the null
hypothesis was rejected and it was concluded that the DFABM did agree with traditional
forms of analysis.
Finally, to examine or answer Question II: Does an agent-based model of dengue
fever enhance traditional methods of GIS? The hypothesis of this research question
specified the DFABM would enhance traditional GIS methods of analysis. Conversely,
the null hypothesis indicated the DFABM would not enhance traditional methods GIS of
analysis.
The expected findings were an agent-based model of dengue fever enhances
traditional methods of analysis using GIS and further the understanding and possible

109
prediction of dengue outbreaks. The hypothesis was testing using what-if scenarios where
the researcher using the DFABM could analyzed in real time what could happen if the
variables influencing the number of cases may change, which cannot be done with
traditional forms of GIS analysis. Also, maps of point data (longitude-latitude) were
created by the DFABM of the actual location and time of where the cases were occurring.
Excel files were created by the DFABM with the socio-economics and
demographic characteristics of each individual (agent) performing in the simulation. The
Table created by the simulation, which contains the infected cases in the study area,
allowed the researcher to perform any SPSS analysis on the data. Also, using the same
table, if the researcher wanted to combine the data with the respective GIS layer for the
area, he/she could combine the data and analyze the data in map format. Real time graph
and depicted maps of simulated cases were also created and analyzed. Real time
conception of place, time, and scenarios happening during the outbreaks of dengue fever
were visualized. The visualization of agents (people), road, houses, temperature,
precipitation, and others characteristics of the environment were done with the computer
simulation. What if? What is it? and What could happen? Then, certain geographic areas
were viewed and analyzed. This technique cannot be done by GIS alone. The
combination (coupling) of GIS and the DFABM analysis was therefore a better
framework for the study of dengue fever.

110
Figure 53. Visualization Output of the Simulation
Therefore, the null hypothesis was rejected and it was concluded the DFABM
enhanced traditional analysis for the study of dengue fever and was also concluded that
the framework could be used for estimating and/or possibly predicting new cases of
dengue fever in the study area.

111
CHAPTER V
FINDINGS, CONCLUSIONS, AND IMPLICATIONS
This study emphasized how traditional macro level Geographic Information
System (GIS) and the implementation of a micro level agent based model can be merged
into a novel framework for the study of dengue fever. One of the main objectives was to
develop a community level dengue fever agent based model (DFABM), which integrated
GIS to simulate the spread of dengue fever disease in an urban environment, as a result of
agents (humans) interactions in a geospatial context. It is a framework for modeling the
spatial and temporal progression of dengue fever affecting multiple populations in a
geographically distributed location.
DFABM and GIS analysis were used as a methodology approach for the study of
dengue fever in the Central Valley of Costa Rica. Precipitation, temperature, socio-
economic and demographics variables were analyzed using these technologies to possibly
identify factors affecting the rates of dengue fever cases in the study area. GIS was used
to generate a risk map of dengue incidences, as well as to map the spatial distribution and
vulnerability of dengue risk surfaces in the study area using weighted regression. Finally,
an ABM was implemented, which incorporated the GIS findings to supplement the data
analysis. The ABM was validated using cross-validation or model alignment, which
required running a validated model for some scenarios where the results are known.

112
5.1 Findings
The development of the multi-scale analysis framework, which applied GIS and
ABM methods to identify and analyze the variables affecting the rates of dengue fever in
the Central Valley of Costa Rica, is a fairly new way of doing epidemiological studies of
dengue. GIS is well known in research epidemiological studies but agent-based dengue
fever modeling had not been applied for the prediction, studying, and management of the
disease (Bhandari, Raju, and Sokhi 2008; Bohra and Andrianasolo 2001; Khun and
Manderson 2008; Lian, Seng, and Chai 2006; Mahilum et al. 2005; Phuanukoonnon,
Brough, and Bryan 2006; Suarez et al. 2005).
The Findings of the Study
Changes on the rates of dengue fever can follow the movements of population,
changing land use, human population density, weather variability, and socio-economics
and demographic characteristics of the inhabitants. However, it is difficult to identify and
separate the relations of these predictors on the rates of dengue fever, since variations of
these predictors may not be the same from one community to the next. The number of
factors that sometimes converge in the appearance of new dengue cases in one
community may not be the same for another community.
In this study, the variables analyzed included precipitation, temperature, socio-
economic and demographics characteristics of the population (see Table 2). According to
the records of the Epidemiological Surveillance Unit of the Ministry of Health
(Ministerio-de-Salud 2008) the most vulnerable people are the economically active
population, as well as people at school, ages 5 to 45.
When analyzing the data, in the greatest metropolitan area, the rate of dengue

113
cases increased in the winter seasonal months of May to November. The fluctuation rate
is retreated in the summer season months of December to April. This season effect can be
explained by the high average temperatures of the rainy seasons of the cantons of the
study area. This pattern of behavior can be seen on the years 1994, 1997 and 2002-2003,
and 2005. However, the year 2005 was a record high in incidence of rates of dengue
cases. This year was one period with similar precipitation and temperatures than the
others ones. In addition, an interesting fact emerged: 2005 was a record year in high
temperatures worldwide (WMO 2007). Thus, high temperatures with high precipitation
patterns affect in highest proportion of reported dengue fever cases. This may also
suggest that there are optimal high temperatures that affect the outbreak of mosquitoes.
Therefore, accordingly to the analysis, high temperatures, poor housing conditions, and
percentages of males, with warm seasonal rainy periods create the optimal conditions for
the outbreaks of mosquitoes and therefore, occurrences and rates of dengue cases.
The findings using Geographic Information Science and Systems
The maps served as a depiction of the level of variability the different predictors
had on the dependent variable, the rates dengue fever. The analyzed maps indicated the
majority of cantons with the highest rates of dengue fever also have the highest average
temperatures, more precipitation, and highest percentages of houses in poor condition.
Also, the maps appeared to depict some combination of variable to be related to the rates
of dengue cases, and some others suggested a certain combination of variable were not.
The majority of maps with a combination of variables depicted including summer
average high temperatures indicated high temperatures were an important variable related
to the reported cases of dengue fever. Geographical weighted regression on the study area

114
indicated poor conditions houses had the highest percentage of variation on the rates of
dengue fever. This predictor was followed by overcrowded houses. Others predictors
which were not as important to the percentages of variation on the dependent variable
were age, sex, occupation, and percentage of house’s occupants.
The identified high rates zones of dengue fever were: Atenas, Alajuela, Mora, and
Santa Ana. Specific cantons with medium rates of dengue fever were: Moravia, Barva,
and Santa Barbara. Finally, those cantons documented with low rates of dengue fever
were Alvarado, Valverde Vega, and Oreamuno. Important results emerging from the data
and map analysis for the high rates of dengue were: highest percentages of overcrowded
and poor conditions houses; seasonal temperatures are always high, winter (low and high)
average temperatures were high; high precipitation patterns with warm winters; and high
percentages of males.
Some significant details of medium rates of dengue cantons were they had fewer
percentages of overcrowded and poor conditions houses, seasonal temperatures fluctuated
between high and low; and high precipitation patterns. Some characteristics of low rates
of dengue were high percentages of overcrowded and poor conditions houses, but
seasonal temperatures were the lowest of the zones selected with fewer precipitation
patterns and lowest percentages of urban population.
The chosen areas with the high (Atenas), medium (Barva), and low (Alvarado)
rates of dengue fever indicated temperature is one of the main factors that may be
responsible for the reported cases of dengue fever. Also, percentages of poor conditions
houses, and percentages of urban population showed to affect the rates of dengue fever.

115
The findings of the implementation of the Agent-based Model
An agent based model was implemented and validated using the data of the macro
analysis of GIS. The ABM’s real time capability of data analysis and visualization are
important when monitoring and predicting possible outbreaks of dengue fever. It provides
communities the opportunity for interventions as an essential tool for the identification of
possible outbreaks of dengue fever locations. Subsequently, the ABM enhanced GIS
analysis by providing real time depiction of outbreaks of dengue fever. It kept track of all
factors affecting dengue fever spread, including precipitation, temperature and the most
important demographic and socio-economic characteristics of the population for the area
under study.
The ability to visualize data (numbers) in real time is a feature than enhances
methods of analysis. In others words, the Dengue Fever ABM (DFABM) ability to
represent the daily movements and interactions of people, the environment, and the
vector (mosquitoes) in a community, simulating the spread of dengue fever, is what made
it an improved tool for analysis. Furthermore, this feature could allow for the assessment
of disease prevention, intervention, understanding, and eventually response strategies.
Similarly, it can be implemented into an important experimental test tool for analyzing
the parameters affecting the rates of dengue fever within an urban area.
The ability to extract and see information in real time, graph, maps, agents, (real
time/space scenario) made the DFABM simulation an interesting and important tool for
the analysis of dengue fever. The agent-based model ability to create maps of the actual
longitude-latitude of the infected cases is an important feature of the simulation. This
map could be used to identify zones of high risk in a community. Likewise, the capability

116
of the system to kept track of the predictors influencing the dengue cases, including
precipitation, temperature, and the socio-economics and demographic characteristics of
the individual being infected made the DFABM and enhancement tool for the traditional
techniques of analysis, GIS. The similarity in results of the DFABM with GIS suggested
the agent-based model could possibly be used for predicting purposes.
5.2 Conclusions
In Costa Rica, one of the main limitations for doing epidemiological studies on
dengue fever is data availability. With the current data available, and at its resolution, a
macro study using GIS revealed the relationships, which exist between rates of dengue
fever outbreaks and precipitation, temperature, socio-economic and demographic
characteristics of the population of the study area. The data obtained from the macro level
modeling (GIS) can be used as input to the ABM (micro level), thus enhancing the
macro-level analysis. One of the requirements for a multi-scale dengue fever analysis
framework is to simplify the complexity of the system while maintaining robustness. This
community level dengue fever agent based model will accomplish this objective while
furthering the understanding of dengue and subsequently assisting in projecting possible
patterns of the spread of dengue fever.
Therefore, the coupling of GIS, and ABM was the optimal research design for the
study of dengue fever in the Central Valley of Costa Rica, but the computational
complexity of the ABM may remain a problem when it comes to simulating the
interactions of such a large system. However, the outcomes of a dengue fever ABM may
be used for prevention and ultimately for possibly prediction purposes if the model is
calibrated and validated with mathematical equations and/or real field data. A dengue

117
fever ABM is an attractive method because the technology, cost, and time limitations,
which may otherwise prohibit or make impossible extensive field testing for the study of
dengue fever’s complex system and/or when enhanced results are necessary.
This framework could assist researchers and/or public health officials when data
collection is not an option and/or partial datasets are available for the understanding,
identification, and possible prevention of dengue outbreaks of the study area and other
tropical countries. Furthermore, coupling computational simulation models with other
technologies, which include, GIS analysis may enrich traditional methods of analysis
(Aschorn 2004; Skvortsov et al. 2007). On the other hand, traditional analytical modeling
in the social sciences follows or relies on a very well established methodological protocol
(Leombruni et al. 2005). Nonetheless, the steps of the framework will assist as either a
starting point or support methodological procedures for epidemiological studies using
agent-based models. ABMs capability to produce emergent macro-phenomena from
micro-rules and probabilities may also provide a foundation for the development of
different methodological frameworks in epidemiology (Patlolla et al. 2006).
ABMs should be viewed as models included with quantitative, qualitative,
experimental, and participatory methodology (Boero and Squazzoni 2005). This research
facilitates complex system explorations that are difficult to accomplish with analytical
and GIS models alone and/or impossible to study in reality for the study area. ABMs are
ideal for studying and comprehending the complex spatial behavior of dengue fever
through the study of actors (humans and mosquitoes) and environmental, demographic
and behavioral rules. The ability to predict and understand how a disease might manifest
in a population is essential for disease monitoring, intervention, and control strategies.

118
Furthermore, because of the value placed on spatial science and behavioral geography in
ABM work, ABM could bridge geographical perspectives and spatial thinking into an
interdisciplinary approach of research (Torrens 2010).
5.3 Implications and Limitations
The advantages of computer technology have made possible the study of complex
systems using computational simulations (Axtell 2000; Herbert 1996; Isidoro et al. 2009).
Agent-based models offers an accepted way to exemplify the diversity of intervening
components, such as environmental factors, disease vectors and disease hosts, and the
possibility to determine spatial behavior distribution, rapid insertion of new components
and the natural consideration of non-linear interactions between agents (Isidoro et al.
2009). The ABM flexibility in representing dynamic processes and highly adaptive
physical or human phenomena, facilitates the exploration of ideas about the numerous
ways geographical systems develop, behave, interact and evolve, and often support
experimentation within geographical systems in ways that would not be possible in the
real world (Castle and Crooks 2006; Osgood 2007; Torrens 2010). Thus, ABM is an
appropriate analysis technique for developing or implementing geospatial simulations
such as dengue fever (Castle and Crooks 2006; Torrens 2010).
However, one significant risk or limitation when developing an ABM is the time
it takes to develop the necessarily robust and detailed models necessary for a study
(Osgood 2007). For example, model researchers may include problem-irrelevant details
that may or may-not add any value to the models, while increasing its complexity.
Models grow exponentially as more variables are added. Determining what is relevant
and what is not relevant to the model requires a thorough understanding of the variables
119
affecting the study problem. Thus, the model has to be built at the right level of
description, with just the right amount of detail and robustness to serve its purpose
(Bonabeau 2002).
Additionally, the application programming interface (API) or tool used to develop
the model may add both flexibility and /or limitations when implementing the model. For
example, using an open source framework could allow the researcher to explorer the
source code framework and understand why his or her model is behaving in one way or
another. However, understanding the framework used for the model may require a greater
amount of time and effort than the researcher may have scheduled. Agent-based
modeling toolkits are subtle and sophisticated, and the open source involves a reasonably
amount of time of setup, fine-tuning, and tinkering before even a single line of code is
implemented (Getchell 2008). Still, implementing a ABM could be a very complex task
and understanding the model in a reasonable amount of time and detail is not a
straightforward exercise (Galan et al. 2009). A necessary prerequisite to understanding a
simulation is to ensure there is no significant disparity between what the researcher thinks
the computer code is doing and what it is actually doing (Galan et al. 2009).
On the other hand, there are little or no standard procedures for how to implement
ABMs. Standards frameworks are needed for research fields using ABM. Finally, ABMs
are a replication of reality but can be designed with enough robustness (simple complex)
that they serve their intended purpose. However, researchers must remember when
analyzing the results of the ABM that they are a partial (miniature and incomplete)
representation of the real problem and the outputs of these models must be considered
with diligence and care (Sullivan and Mordechai 2000).

120
Interdisciplinary Approach Needed
Therefore, computational models can play a critical role in epidemiology and
other diseases studies. The rapid evolution of many diseases, such as dengue, leads to
increasing complexity in mathematical and computer models, which as a result often
require large computers resources for implementation and analysis of those complex
subjects. When these computational based mathematical models are combined with GIS
and statistical tools they can further assist in locating and monitoring such disease, as
well as facilitate preparation of response plans and intervention strategies.
Clearly, steps are needed to introduce geographers, as well as computer and
mathematical scientists, to a host of relevant epidemiological and biological topics. Steps
should also be taken to introduce epidemiologists and biologists to relevant methods of
computer science, geography and mathematics. An interdisciplinary approach will be
needed. Computer science students need to cooperate with mathematicians to create
computational models, and, in turn, cooperate with geographers to take advantages of
spatial tools such as GIS. A knowledge base built on such interdisciplinary cooperation
would produce new results and constitute a different approach in improving and solving
the complex problems in epidemiology.

121
Figure 54. Interdisciplinary Approach
Applications to tracking and predicting the spread of specific diseases, such as dengue, is
an important example of areas where computer science, mathematics, and scientific
geographical tools can combine together to solve problems.
5.4 Future Research
Moreover, because of the value placed on spatial science and behavioral
geography in ABM work, ABM could further infuse geographical perspectives into an
interdisciplinary approach with computer science (Torrens 2010). ABM will augment
traditional analytical modeling in the social sciences, which follows or relies on a well-
established methodological protocol both with respect to the way models are presented
and to the kinds of analysis that are performed (Leombruni et al. 2005). The increasing
availability of ABMs of complex systems on global, national and community levels could
be used to actually enhance traditional methods of analysis (Aschorn 2004; Skvortsov et
al. 2007). Thus, ABMs should be viewed as models included with quantitative,
qualitative, experimental, and participatory methodology (Boero and Squazzoni 2005).

122
Further research is needed to advance this theory.
Future researchers should continue to explore new lines of inquiries that aim to
connect information obtained at the host level and use it to predict both prevalence and
incidence of disease at the population level. The use of GIS to locate and monitor the
spread of infectious diseases should be further developed to help create public health
policies and rapid response plans to contain emerging outbreaks with the assistant of
computational models. Computational models that use spatial and temporal data with
epidemiologic data could enable analysis of many variables that play significant roles in
disease transmission, and this integration of data is essential for social health policies,
planning, decision making, and ongoing surveillance efforts of emerging or re-emerging
infectious diseases.
Finally, for many diseases in many countries only partial dataset are available.
When the partial datasets are insufficient, but data collection is not an option, it is
possible to supplement the data by exploiting the causal relations between the various
variables that describe a disease process (Kaja et al. 2004). One of the challenges that
face geographers, epidemiologists and computer scientists working in the field of spatial-
temporal modeling, is trying to comprehend the complexity of the spread of diseases
(Perez and Dragicevic 2009). The use of computational models may provide a novel
technique to understand complexity in a simple manner. Even though field testing is the
most accepted practice, new techniques such as ABMs are attractive alternative methods
because the technology, cost, and time limitations prohibit or make impossible extensive
field testing for the studying of complex systems (Sanchez 2002). Computational models
are going to perform as a virtual laboratory where spatial-temporal complex social and
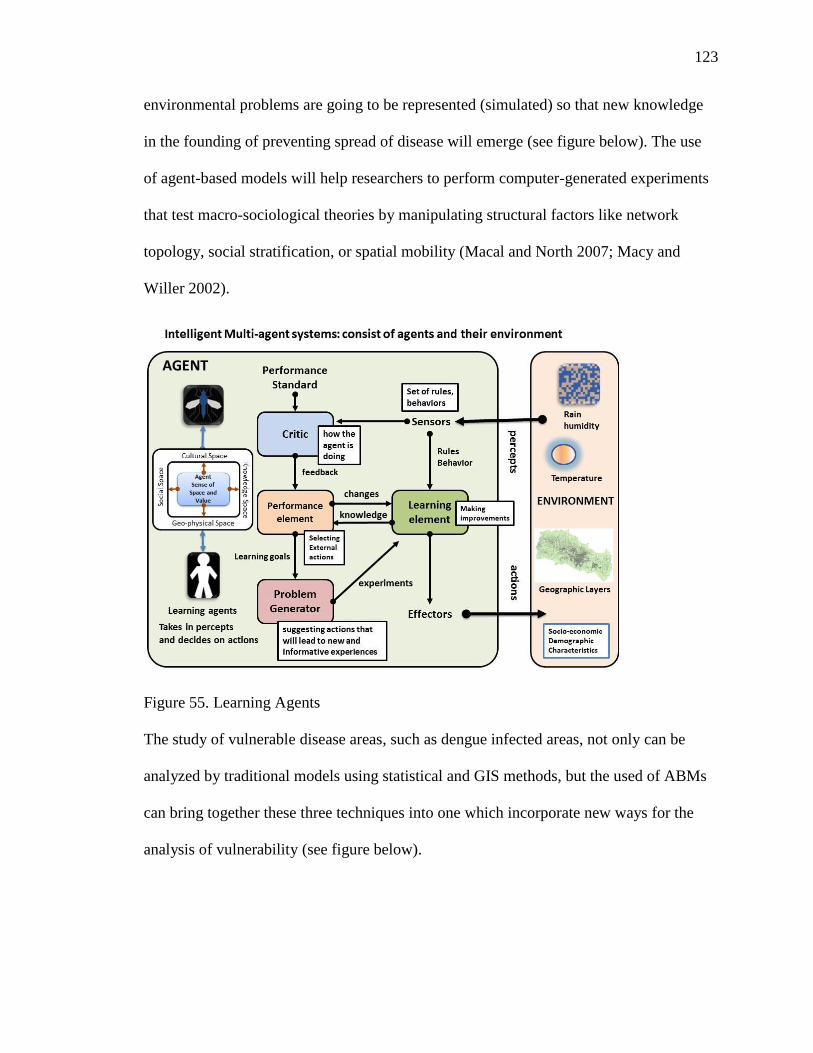
123
environmental problems are going to be represented (simulated) so that new knowledge
in the founding of preventing spread of disease will emerge (see figure below). The use
of agent-based models will help researchers to perform computer-generated experiments
that test macro-sociological theories by manipulating structural factors like network
topology, social stratification, or spatial mobility (Macal and North 2007; Macy and
Willer 2002).
Figure 55. Learning Agents
The study of vulnerable disease areas, such as dengue infected areas, not only can be
analyzed by traditional models using statistical and GIS methods, but the used of ABMs
can bring together these three techniques into one which incorporate new ways for the
analysis of vulnerability (see figure below).

124
Figure 56. The Study of Vulnerability
5.5 Summary of the Study
Dengue fever is the second most widespread tropical disease after malaria
(Derouich and Boutayeb 2006). It is considered one of the most severe viral diseases in
terms of morbidity and mortality (Guzmán and Kourí 2004). Besides, it affects the
populations of more than 100 countries (Derouich and Boutayeb 2006). Several studies
have shown weather variability, socioeconomic and demographic characteristics
influence the disease patterns (Aiken and Leigh 1978; Campbell-Lendrum and Woodruff
2006; Caprara et al. 2009; Goldstein 1990; Mondini and Chiaravalloti-Neto 2008; Suarez
et al. 2005; Weinhold 2004).
Over the last decade, dengue fever has become the most wide-spread vector-borne
disease in Costa Rica (CCSS 2008). However, only a few research studies have been
conducted in Costa Rica to investigate the factors influencing the rates dengue fever.
125
Data accessibility, data quality, financial constraints, and human resources might have
contributed to the small number of studies in Costa Rica (Troyo et al. 2009). While GIS
has been used in research studies (Bhandari, Raju, and Sokhi 2008; Bohra and
Andrianasolo 2001; Khun and Manderson 2008; Lian, Seng, and Chai 2006; Mahilum et
al. 2005; Phuanukoonnon, Brough, and Bryan 2006; Suarez et al. 2005), agent-based
modeling has not been applied to the study of dengue. Nevertheless, in Costa Rica, no
known studies have been done using ABMs and/or a coupling of GIS and ABM methods.
This study analyzed the relationships between the rates of dengue fever and
precipitation, temperature, socio-economic, and demographic characteristics of the
population in the Central Valley region of Costa Rica from 1993 to 2008. The
demographic and socio-economics characteristics of the population included: education;
occupation; household density; age differences; sex; housing condition, and land cover
(urbanization). The research assessed the spatial and temporal distribution of dengue
fever cases in the Central Valley of Costa Rica relative to those predictors.
The purpose of this research was to develop a multi-scale analysis framework that
applies geographic information systems, and agent-based modeling methods to identify
and analyze the variables affecting the rates of dengue fever in the Central Valley of
Costa Rica. Geographic Information System (GIS) were used to analyze the available
data, collected from government agencies, at the macro level. Then a DFABM was
implemented for the micro-level analysis of the same variables used at the macro level.
The framework integrated time/space GIS layers and data collection/analysis in a
DBABM and observed and analyzed the emerging data from the agent’s interactions

126
(computer simulation of human’s environment) and compared them to the macro
methods of analysis-the emergent behavior from micro to macro.
This study focused on two research questions: Does a community-level dengue
fever agent-based model (DFABM) produce results comparable (agree) to those produced
by traditional macro-level GIS analysis? And, how does a community-based dengue fever
agent-based model (DFABM) enhance traditional geographic information system
analysis and could it aid in predicting future dengue fever outbreaks?
Regression analyses were used in GIS to identify the significant relationships of
the variable and to map the spatial variability of the factors that contribute to the annual
rates of dengue. GIS was used to map the spatial distribution of dengue in the study area
using geographically weighted regression and to generate risk maps of dengue incidents
with high, medium and low risks. Finally, a DFABM were implemented. The agent-based
model included the most important variables identified through a review of the literature
and GIS analysis.
The agent-based model represented daily movements, interactions of humans, the
environment, and the vector relative to dengue cases. The simulation examined detailed
data about each scenario and strived to identify the significant events occurring during
outbreaks. The data employed included the number of susceptible, exposed, and infected
people. The locations (longitude, latitude) and temporal data describing infected
individuals were also collected for further analysis. Additionally, the agent-based model
kept track of the factors affecting dengue fever, including precipitation, temperature, and
the most important demographic and socio-economic characteristics of the population for
the area under study. The DFABM was developed on the Java programming language,

127
using the open source MASON simulator, a multithreaded agent based simulation
platform.
The framework used in this research study was a novel approach for investigating,
analyzing, and experimenting with a fairly new technique, the coupling of GIS and agent-
based models, for the study of dengue fever in the central valley of Costa Rica.
Computational models supports the identification of factors and mechanisms of epidemic
spread during the descriptive phase and allows the examination of different scenarios in
determining sensitivities to changes in parameter values, and estimation key parameters
from data in a reasonably rapid way (Bagni, Berchi, and Cariello 2002).
The DFABM may be especially helpful to assist the researcher when data
collection is not an option and/or only partial datasets are available by supplementing the
existing datasets and/or exploiting the causal relations between the various variables that
describe the disease process. The DFABM provided options to determine spatial
behaviors, spatial distributions through rapid insertion of new components and natural
consideration of non-linear interactions between agents (Isidoro et al. 2009). Although, a
DFABM is a replication of reality, it was designed and implemented with enough
robustness to serve it intended purpose. Yet, the researcher must remember when
analyzing DFABM results, their findings are partial representations of a complex
problem. Therefore, overall, ABM results must be considered with diligence and care
(Sullivan and Mordechai 2000).
This research facilitated the study of complex system explorations, which are
difficult to accomplish with analytical and GIS models alone and/or impossible to study
in reality. Furthermore, the multi-scale framework used in this research developed a

128
starting point of understanding of the modeling process of coupling geographic
information systems, and agent-base modeling. ABM supports experimentation in ways
that would not be possible in the real world (Castle and Crooks 2006; Osgood 2007;
Torrens 2010). Thus, the implemented DFABM was an appropriate analysis technique
for implementing a geospatial dengue fever simulation.

129
WORKS CITED
Acharya, A., K. Goswami, S. Srinath, and A. Goswami. 2005. Awareness about dengue
syndrome and related preventive practices amongst residents of an urban
resettlement colony of south delhi. Journal of Vector Borne Diseases 42, no. 3:
122-127.
Agarwal, R, S Kapoor, R Nagar, A Misra, R Tandon, A Mathur, A K Misra, K L
Srivastava, and U C Chaturvedi. 1999. A clinical study of the patients with
dengue hemorrhagic fever during the epidemic of 1996 at lucknow, india. The
Southeast Asian Journal of Tropical Medicine and Public Health. 30, no. 4: 735-
740.
Ai-leen, G. T. and R. J. Song. 2000. The use of gis in ovitrap monitoring for dengue
control in singapore. Dengue Bulletin 24, no. Journal Article: 110-116.
Aiken, S. Robert and Colin H. Leigh. 1975. Malaysia's emerging conurbation. Annals of
the Association of American Geographers 65, no. 4: 546-563.
________. 1978. Dengue haemorrhagic fever in south-east asia. Transactions of the
Institute of British Geographers 3, no. 4: 476-497.
Alderson, Laura. 2004. The big picture: Mapping sars in hong kong. Environmental
health perspectives 112, no. 15: A896.
Ali, M., Y. Wagatsuma, M. Emch, and R. F. Breiman. 2003. Use of a geographic
information system for defining spatial risk for dengue transmission in
bangladesh: Role for aedes albopictus in an urban outbreak. American Journal of
Tropical Medicine and Hygiene 69, no. 6: 634-640.
Allan, R. J. 2009. Survey of agent based modelling and simulation tools.
Almeida, Andréa Sobral de, Roberto de Andrade Medronho, and Luís Iván Ortiz
Valencia. 2009. Análise espacial da dengue e o contexto socioeconômico no
município do rio de janeiro, rj. Revista de Saúde Pública 43: 666-673.
Almeida, Maria de Mattos, Caiaffa Waleska, Assunção Renato, and Proietti Fernando.
2007. Spatial vulnerability to dengue in a brazilian urban area during a 7-year
surveillance. Journal of Urban Health 84, no. 3: 334-345.

130
Aschorn, E. 2004. Integrating agent-based models with quantitative and qualitative
research methods. Paper presented at AARE 2004 International Education
Research Conference, Melbourne, Novmber 2004.
Auchincloss, Amy H. and Ana V. Diez Roux. 2008. A new tool for epidemiology: The
usefulness of dynamic-agent models in understanding place effects on health.
American Journal of Epidemiology 168, no. 1: 1-8.
Axtell, Robert. 2000. Why agents? On the varied motivations for agent computing in the
social sciences.
Ayyub, Muhammad, Adel M Khazindar, Eman H Lubbad, Shahid Barlas, Adnaan Y Alfi,
and Sawsan Al Ukayli. 2006. Characteristics of dengue fever in a large public
hospital, jeddah, saudi arabia. Journal of Ayub Medical College 18, no. 2: 9-13.
Bagni, Raul, Roberto Berchi, and Pasquale Cariello. 2002. A comparison of simulation
models applied to epidemics. Journal of Artificial Societies and Social Simulation
5, no. 3.
Barendregt, Jan, Gerrit van Oortmarssen, Theo Vos, and Christopher Murray. 2003. A
generic model for the assessment of disease epidemiology: The computational
basis of dismod ii. Population Health Metrics 1, no. 1: 4.
Barrera, R., J. Avila, and S. Gonzalez-Tellez. 1993. Unreliable supply of potable water
and elevated aedes aegypti larval indices : A causal relationship ? American
Mosquito Control Association 9, no. 2.
Bartley, L. M., H. Carabin, N. Vinh Chau, V. Ho, C. Luxemburger, T. T. Hien, G. P.
Garnett, and J. Farrar. 2002. Assessment of the factors associated with flavivirus
seroprevalence in a population in southern vietnam. Epidemiology and Infection
128, no. 2: 213-220.
Bellifemine, Fabio, Agostino Poggi, and Giovanni Rimassa. 2001. Developing multi-
agent systems with jade. In Intelligent agents vii agent theories architectures and
languages, ed. Cristiano Castelfranchi and Yves Lespérance, 1986:42-47:
Springer Berlin / Heidelberg.
Benthem, B. H. B. van, N. Khantikul, K. Panart, P. J. Kessels, P. Somboon, and L.
Oskam. 2002. Knowledge and use of prevention measures related to dengue in
northern thailand. Tropical Medicine & International Health 7, no. 11: 993-1000.
Betts, Kellyn S. 1997. Mapping the environment. Environmental health perspectives 105,
no. 6: 594-596.

131
Beyea, Jan and Maureen Hatch. 1999. Geographic exposure modeling: A valuable
extension of geographic information systems for use in environmental
epidemiology. Environmental health perspectives 107, no. Supplement 1:
Reviews in Environmental Health, 1999: 181-190.
Bhandari, Krishna Prasad , PLN Raju, and B. S. Sokhi. 2008. Application of gis
modeling for dengue fever prone area based on socio-cultural and environmental
factors - a case study of delhi cityi zone. The International Archives of the
Photogrammetry, Remote Sensing and Spatial Information Sciences. 37, no. B8:
165-170.
Blanton, Ronald E., Luciano K. Silva, Vanessa G. Morato, Antonio R. Parrado, Juarez P.
Dias, Paulo R. S. Melo, Eliana A. G. Reis, Katrina A. B. Goddard, Marcio R. T.
Nunes, Sueli G. Rodrigues, Pedro F. C. Vasconcelos, Jesuina M. Castro,
Mitermayer G. Reis, Mauricio L. Barreto, and M. Gloria Teixeira. 2008. Genetic
ancestry and income are associated with dengue hemorrhagic fever in a highly
admixed population. European Journal of Human Genetics 16, no. 6: 762-765.
Bobashev, Georgiy V., D. Michael Goedecke, Feng Yu, and Joshua M. Epstein. 2007. A
hybrid epidemic model: Combining the advantages of agent-based and equation-
based approaches. Paper presented at Proceedings of the 39th conference on
Winter simulation: 40 years! The best is yet to come, Washington D.C.
Boero, Riccardo and Flaminio Squazzoni. 2005. Does empirical embeddedness matter?
Methodological issues on agent-based models for analytical social science.
Journal of Artificial Societies and Social Simulation 8, no. 4: 1-31.
Bohra, Alpana and Haja Andrianasolo. 2001. Application of gis in modeling of dengue
risk based on sociocultural data: Case of jalore, rajasthan, india. Dengue Bulletin
25: 92-102.
Bonabeau, Eric. 2002. Agent-based modeling: Methods and techniques for simulating
human systems. Proceedings of the National Academy of Sciences of the United
States of America 99, no. Suppl 3: 7280-7287.
Bongsebandhu-phubhakdi, Chansuda, Marisa Hemungkorn, Usa Thisyakorn, and Chule
Thisyakorn. 2008. Risk factors influencing severity in pediatric dengue infection.
Asian Biomedicine (Research Reviews and News) 2, no. 5: 409-413.
Borshchev, Andrei and Alexei Filippov. 2004. From system dynamics and discrete event
to practical agent based modeling: Reasons, techniques, tools. In The 22nd
International Conference of the System Dynamics Society. Oxford, England.

132
Braga, Cynthia, Carlos Feitosa Luna, Celina MariaTurchi Martelli, Wayner Vieira de
Souza, Marli Tenório Cordeiro, Neal Alexander, Maria de Fátima Pessoa Militão
de Albuquerque, José Constantino Silveira Júnior, and Ernesto T. Marques. 2010.
Seroprevalence and risk factors for dengue infection in socio-economically
distinct areas of recife, brazil. Acta Tropica 113, no. 3: 234-240.
Bravo, J. R., M. G. Guzmán, and G. P. Kouri. 1987. Why dengue haemorrhagic fever in
cuba? I. Individual risk factors for dengue haemorrhagic fever/dengue shock
syndrome (dhf/dss). Transactions of the Royal Society of Tropical Medicine and
Hygiene 81, no. 5: 816-820.
Brightmer, M. I. and M. G. Fantato. 1998. Human and environmental factors in the
increasing incidence of dengue fever: A case study from venezuela. GeoJournal
44, no. 2: 103-109.
Britton, T. O. M., Theodore Kypraios, and Philip D. O'Neill. 2011. Inference for
epidemics with three levels of mixing: Methodology and application to a measles
outbreak. Scandinavian Journal of Statistics: no-no.
Brown, Daniel G., Rick Riolo, Derek T. Robinson, Michael North, and William Rand.
2005. Spatial process and data models: Toward integration of agent-based models
and gis. Journal of Geographical Systems 7, no. 1: 25-47.
Brown, Daniel G. and Derek T. Robinson. 2006. Effects of heterogeneity in residential
preferences on an agent-based model of urban sprawl. Resilience Alliance.
Brunsdon, Chris, A. Stewart Fotheringham, and Martin E. Charlton. 1996.
Geographically weighted regression: A method for exploring spatial
nonstationarity. Geographical Analysis 28, no. 4: 281-298.
Bulto, Paulo Lazaro Ortiz, Antonio Perez Rodriguez, Alina Rivero Valencia, Nicolas
Leon Vega, Manuel Diaz Gonzalez, and Alina Perez Carrera. 2006. Assessment
of human health vulnerability to climate variability and change in cuba.
Environmental health perspectives 114, no. 12: 1942-1949.
Bulugahapitiya, Uditha, Sajith Siyambalapitiya, Suranjith L. Seneviratne, and Devaka J.
S. Fernando. 2007. Dengue fever in travellers: A challenge for european
physicians. European Journal of Internal Medicine 18, no. 3: 185-192.
Campbell-Lendrum, Diarmid and Rosalie Woodruff. 2006. Comparative risk assessment
of the burden of disease from climate change. Environmental health perspectives
114, no. 12: 1935-1941.

133
Caprara, Andrea, José Wellington de Oliveira Lima, Alice Correia Pequeno Marinho,
Paola Gondim Calvasina, Lucyla Paes Landim, and Johannes Sommerfeld. 2009.
Irregular water supply, household usage and dengue: A bio-social study in the
brazilian northeast. Cadernos de Saúde Pública 25: S125-S136.
Castle, Christian and Andrew Crooks. 2006. Principles and concepts of agent-based
modelling for developing geospatial simulations. CASA Working Paper 110.
CCSS. Costa rican department of health (caja costarricense de seguro social).
http://www.ministeriodesalud.go.cr/index.php/ (accessed August 29, 2008).
CDC. Center for disease control and prevention. http://www.cdc.gov/dengue/ (accessed
August 29, 2010).
Chantha, N., P. Guyant, and S. Hoyer. 1998. Control of dhf outbreak in cambodia, 1998.
Dengue Bulletin 22, no. Journal Article.
Chengbin, Deng, Tao Haiyan, and Ye Zhiwei. 2008. Agent-based modeling to simulate
the dengue spread. ed. Lin Liu, Xia Li, Kai Liu, Xinchang Zhang and Aijun Chen,
7143:71431O-10: SPIE.
Chepesiuk, Ron. 2003. Policy. Mosquito mismanagement? Environmental health
perspectives 111, no. 12: A636.
Clarke, K., S. McLafferty, and N. Tempalski. 1996. On epidemiology and geographic
information systems: A review and discussion of future directions. Emerging
Infectious Diseases 2, no. 2: 85-92.
Costa, Antonio Ismael Paulino da and Delsio Natal. 1998. Distribuição espacial da
dengue e determinantes socioeconômicos em localidade urbana no sudeste do
brasil. Revista de Saúde Pública 32: 232-236.
Cummings, Derek A. T., Sopon Iamsirithaworn, Justin T. Lessler, Aidan McDermott,
Rungnapa Prasanthong, Ananda Nisalak, Richard G. Jarman, Donald S. Burke,
and Robert V. Gibbons. 2009. The impact of the demographic transition on
dengue in thailand: Insights from a statistical analysis and mathematical
modeling. PLoS Medicine 6, no. 9: 1-10.
David, Nuno, Jaime Simão-Sichman, and Helder Coelho. 2005. The logic of the method
of agent-based simulation in the social sciences: Empirical and intentional
adequacy of computer programs. Journal of Artificial Societies and Social
Simulation 8: 1-23.
Davidsson, Paul. 2001. Multi agent based simulation: Beyond social simulation. In Multi-
agent-based simulation, ed. Scott Moss and Paul Davidsson, 1979:141-155:
Springer Berlin / Heidelberg.

134
Derouich, M. and A. Boutayeb. 2006. Dengue fever: Mathematical modelling and
computer simulation. Applied Mathematics and Computation 177, no. 2: 528-544.
Dunham, Jill Bigley. 2005. An agent-based spatially explicit epidemiological model in
mason. Journal of Artificial Societies and Social Simulation 9, no. 1.
Durlauf, Steven N. 1997. Growing artificial societies. Complexity 2, no. 3: 47-49.
Ebi, Kristie L., David M. Mills, Joel B. Smith, and Anne Grambsch. 2006. Climate
change and human health impacts in the united states: An update on the results of
the u.S. National assessment. Environmental health perspectives 114, no. 9: 1318-
1324.
Eisen, Lars and Saul Lozano-Fuentes. 2009. Use of mapping and spatial and space-time
modeling approaches in operational control of aedes aegypti and dengue. PLoS
Neglected Tropical Diseases 3, no. 4: 1-7.
Elliott, Paul and Daniel Wartenberg. 2004. Spatial epidemiology: Current approaches and
future challenges. Environmental health perspectives 112, no. 9, 2004 Annual
Review: 998-1006.
Epstein, Joshua M. 2008. Why model? Journal of Artificial Societies and Social
Simulation 11, no. 4.
Epstein, Joshua M., Jon Parker, Derek Cummings, and Ross A. Hammond. 2008.
Coupled contagion dynamics of fear and disease: Mathematical and
computational explorations. PLoS ONE 3, no. 12: e3955.
Epstein, Paul R. 2002. Climate change and infectious disease: Stormy weather ahead?
Epidemiology 13, no. 4: 373-375.
Espinoza-Gómez, Francisco, Carlos Moisés Hernández-Suárez, Ruth Rendón-Ramírez,
Mayra Lizet Carrillo-Alvarez, and Juan Carlos Flores-González. 2003.
Transmisión interepidémica del dengue en la ciudad de colima, méxico. Salud
Pública de México 45: 365-370.
Ford, Daniel, James Kaufman, and Iris Eiron. 2006. An extensible spatial and temporal
epidemiological modelling system. International Journal Of Health Geographics
5, no. 1: 4.
Gage, Kenneth L., Thomas R. Burkot, Rebecca J. Eisen, and Edward B. Hayes. 2008.
Climate and vectorborne diseases. American journal of preventive medicine 35,
no. 5: 436-450.

135
Galan, Jose Manuel, Luis Izquierdo, R., Segismundo Izquierdo, S., Jose Ignacio Santos,
Ricardo del Olmo, Adolfo Lopez-Paredes, and Bruce Edmonds. 2009. Errors and
artefacts in agent-based modelling. Journal of Artificial Societies and Social
Simulation 12.
Getchell, Adam 2008. Agent-based modeling.
http://www2.econ.iastate.edu/tesfatsi/AgentBasedModeling.AdamGetchell.phy25
0.Report.pdf (accessed 1/3/2011).
Gilbert, Nigel and Pietro Terna. 2000. How to build and use agent-based models in social
science. Mind & amp; Society 1, no. 1: 57-72.
Glass, G. E. 2000. Spatial aspects of epidemiology : The interface with medical
geography. Epidemiologic Reviews 22, no. 1: 136-139.
Goh, K. T. 1997. Dengue--a re-emerging infectious disease in singapore. Annals Of The
Academy Of Medicine 26, no. 5: 664-670.
Goh, KT, Ng SK, Chan YC, Lim SJ, and Chua EC. 1987. Epidemiological aspects of an
outbreak of dengue fever/dengue haemorrhagic fever in singapore. Southeast
Asian Journal of Tropical Medicene and Public Health 18, no. 3: 295-302.
Goldstein, G. 1990. Urbanization, health and well-being: A global perspective. Journal of
the Royal Statistical Society. Series D (The Statistician) 39, no. 2: 121-133.
Goldstone, Robert L. and Todd M. Gureckis. 2009. Collective behavior. Topics in
Cognitive Science 1, no. 3: 412-438.
Gordon, Theodore J. 2003. A simple agent model of an epidemic. Technological
Forecasting and Social Change 70, no. 5: 397-417.
Gore, R. and P. F. Reynolds. 2010. Insight: Understanding unexpected behaviours in
agent-based simulations. Journal of Simulation 4, no. 3: 170-180.
Grimm, Volker, Eloy Revilla, Uta Berger, Florian Jeltsch, Wolf M. Mooij, Steven F.
Railsback, Hans-Hermann Thulke, Jacob Weiner, Thorsten Wiegand, and Donald
L. DeAngelis. 2005. Pattern-oriented modeling of agent-based complex systems:
Lessons from ecology. Science 310, no. 5750: 987-991.
Gubler, D. J. 1998. Dengue and dengue hemorrhagic fever. Clinical Microbiology Review
11, no. 3: 480-496.
Gubler, D.J. and D.W. Trent. 1993. Emergence of epidemic dengue/dengue hemorrhagic
fever as a public health problem in the americas. Infectious Agents and Disease 2,
no. 6: 383-393.
136
Gubler, Duane J. 2002. Epidemic dengue/dengue hemorrhagic fever as a public health,
social and economic problem in the 21st century. Trends in Microbiology 10, no.
2: 100-103.
Gubler, Duane J. and Martin Meltzer. 1999. Impact of dengue/dengue hemorrhagic fever
on the developing world. In Advances in virus research, ed. Frederick A. Murphy
Karl Margniorosch and J. Shatkin Aaron, Volume 53:35-70: Academic Press.
Gubler, Duane J., Paul Reiter, Kristie L. Ebi, Wendy Yap, Roger Nasci, and Jonathan A.
Patz. 2001. Climate variability and change in the united states: Potential impacts
on vector- and rodent-borne diseases. Environmental health perspectives 109, no.
Supplement 2: 223-233.
Guha-Sapir, Debarati and Barbara Schimmer. 2005. Dengue fever: New paradigms for a
changing epidemiology. Emerging Themes in Epidemiology 2, no. 1: 1.
Guzmán, Maria G. and Gustavo Kouri. 2002. Dengue: An update. The Lancet Infectious
Diseases 2, no. 1: 33-42.
Guzmán, María G. and Gustavo Kourí. 2004. Dengue diagnosis, advances and
challenges. International Journal of Infectious Diseases 8, no. 2: 69-80.
Guzmán, Maria G., Gustavo Kouri, Luis Valdes, Jose Bravo, Mayling Alvarez, Susana
Vazques, Iselys Delgado, and Scott B. Halstead. 2000. Epidemiologic studies on
dengue in santiago de cuba, 1997. American Journal of Epidemiology 152, no. 9:
793-799.
Harn, MR, Chiang YL, Tian MJ, Chang YH, and Ko YC. 1993. The 1991 dengue
epidemic in kaohsiung city. Journal of the Formosan Medical Association 92, no.
1: S39-S43.
Harris, Paul, Chris Brunsdon, and A. Fotheringham. 2011. Links, comparisons and
extensions of the geographically weighted regression model when used as a
spatial predictor. Stochastic Environmental Research and Risk Assessment 25, no.
2: 123-138.
Haynes, Steven R., Mark A. Cohen, and Frank E. Ritter. 2009. Designs for explaining
intelligent agents. International Journal of Human-Computer Studies 67, no. 1:
90-110.
Herbert, A. Simon. 1996. The sciences of the artificial, 3rd edition. Mit press books: The
MIT Press.

137
Heukelbach, Jörg, Fabíola Araújo Sales de Oliveira, Lígia Regina Sansigolo Kerr-Pontes,
and Hermann Feldmeier. 2001. Risk factors associated with an outbreak of
dengue fever in a favela in fortaleza, north-east brazil. Tropical Medicine &
International Health 6, no. 8: 635-642.
Honório, Nildimar Alves, Wellington da Costa Silva, Paulo José Leite, Jaylei Monteiro
Gonçalves, Leon Philip Lounibos, and Ricardo Lourenço-de-Oliveira. 2003.
Dispersal of aedes aegypti and aedes albopictus (diptera: Culicidae) in an urban
endemic dengue area in the state of rio de janeiro, brazil. Memórias do Instituto
Oswaldo Cruz 98: 191-198.
IMN. Costa rican national meteorological institute (instituto meteorológico nacional de
costa rica). http://www.imn.ac.cr/ (accessed August 29, 2008).
INEC. Instituto nacional de estadística y censos de costa rica.
http://www.inec.go.cr/Web/Home/pagPrincipal.aspx (accessed April 4, 2011).
Isidoro, Carlos, Nuno Fachada, Fábio Barata, and Agostinho Rosa. 2009. Agent-based
model of aedes aegypti population dynamics In Progress in artificial intelligence,
ed. Luís Lopes, Nuno Lau, Pedro Mariano and Luís Rocha, 5816:53-64: Springer
Berlin / Heidelberg.
Itrat, A., A. Khan, S. Javaid, M. Kamal, H. Khan, S. Javed, S. Kalia, A. H. Khan, M. I.
Sethi, and I. Jehan. 2008. Knowledge, awareness and practices regarding dengue
fever among the adult population of dengue hit cosmopolitan. PLoS ONE 3, no. 7:
1-6.
Jacintho, Luis F. O., Andre F. M. Batista, Terry L. Ruas, Maria G. B. Marietto, and Fabio
A. Silva. 2010. An agent-based model for the spread of the dengue fever: A
swarm platform simulation approach. Paper presented at Proceedings of the 2010
Spring Simulation Multiconference, Orlando, Florida.
Jankowski, Piotr and Timothy Nyerges. 2001. Gis-supported collaborative decision
making: Results of an experiment. Annals of the Association of American
Geographers 91, no. 1: 48-70.
Jarup, Lars. 2004. Health and environment information systems for exposure and disease
mapping, and risk assessment. Environmental health perspectives 112, no. 9,
2004 Annual Review: 995-997.
Jelinek, Tomas. 2000. Dengue fever in international travelers. Clinical Infectious
Diseases 31, no. 1: 144-147.
Kaja, Abbas, Armin Mikler, Amir Ramezani, and Sheena Menezes. 2004. Computational
epidemiology: Bayesian disease surveillance. Mathemathical Biology and
Medicine 11: 1-12.

138
Kapella, Bryan K. 2006. Dengue strikes united states. Science News 170, no. 18: 286.
Kay, Brian and Vu Sinh Nam. 2005. New strategy against aedes aegypti in vietnam. The
Lancet 365, no. 9459: 613-617.
Khun, Sokrin and Lenore Manderson. 2008. Poverty, user fees and ability to pay for
health care for children with suspected dengue in rural cambodia. International
Journal for Equity in Health 7, no. 1: 10.
Khun, Sokrin and Lenore H. Manderson. 2007. Abate distribution and dengue control in
rural cambodia. Acta Tropica 101, no. 2: 139-146.
Kim, Yushim. 2007. Enriching policy analysis: The role of agent-based models.
http://www2.ku.edu/~pmranet/conferences/AZU2007/ArizonaPapers/Kim_Y_200
7.pdf (accessed 1/3/2011).
Kirkby, M. J., P. S. Naden, T. P. Burt, and D. P. Butcher. 1993. Computer simulation in
physical geography Chichester, U.K.: Wiley.
Kitron, U. 2000. Risk maps:: Transmission and burden of vector-borne diseases.
Parasitology Today 16, no. 8: 324-325.
Kittayapong, P., U. Chansang, C. Chansang, and A. Bhumiratana. 2006. Community
participation and appropriate technologies for dengue vector control at
transmission foci in thailand. Journal of the American Mosquito Control
Association 22, no. 3: 538-546.
ko, Ying-Chin, Mei-Ju Chen, and Shu-Mei Yeh. 1992. The predisposing and protective
factors against dengue virus transmission by mosquito vector. American Journal
of Epidemiology 136, no. 2: 214-220.
Kolivras, Korine N. 2006. Mosquito habitat and dengue risk potential in hawaii: A
conceptual framework and gis application*. The Professional Geographer 58, no.
2: 139-154.
Kolivras, Korine N. and Andrew C. Comrie. 2004. Climate and infectious disease in the
southwestern united states. Progress in Physical Geography 28, no. 3: 387-398.
Kouri, G. P., M. G. Guzmán, J. R. Bravo, and C. Triana. 1989. Dengue haemorrhagic
fever/dengue shock syndrome: Lessons from the cuban epidemic, 1981. Bulletin
of the World Health Organization 67, no. 4: 375-380.
Kovats, R. S., D. H. Campbell-Lendrum, A. J. McMichael, A. Woodward, and J. St H.
Cox. 2001. Early effects of climate change: Do they include changes in vector-
borne disease? Philosophical Transactions: Biological Sciences 356, no. 1411,
Population Biology of Emerging and Re-emerging Pathogens: 1057-1068.

139
Kuno, Goro. 1995. Review of the factors modulating dengue transmission. Epidemiology
Review 17, no. 2: 321-335.
Küppers, Günter and Johannes Lenhard. 2005. Validation of simulation: Patterns in the
social and natural sciences. Journal of Artificial Societies and Social Simulation
8, no. 4: 1-13.
Lawson, Alex B. and Frank L. Williams. 2001. An introductory guide to disease mapping
Wiley.
Leombruni, Roberto, Matteo Richiardi, Nicole Saam, and Michele Sonnessa. 2005. A
common protocol for agent-based social simulation. LABORatorio R. Revelli,
Centre for Employment Studies.
Lian, Cheah Whye, Chang Moh Seng, and Wang Yin Chai. 2006. Spatial, environmental
and entomological risk factors analysis on a rural dengue outbreak in lundu
district in sarawak, malaysia. Tropical Biomedicine 23, no. 1: 85-96.
Linard, C., Nicolas Ponçon, Didier Fontenille, and E. F. Lambin. 2009. A multi-agent
simulation to assess the risk of malaria re-emergence in southern france.
Ecological Modelling 220, no. 2: 160-174.
Lindbäck, Heidi, Johan Lindbäck, Anders Tegnell, Ragnhild Janzon, Sirkka Vene, and
Karl Ekdahl. 2003. Dengue fever in travelers to the tropics, 1998 and 1999
Emerging Infectious Diseases 9, no. 4: 438-442.
Lloyd King, Joshua Michael. 2009. Malaria in the amazon: An agent-based approach to
epidemiological modeling of coupled systems. Master of Science Malaria in the
Amazon: An Agent-Based Approach to Epidemiological Modeling of Coupled
Systems, University of Waterloo.
Luke, Sean, Claudio Cioffi-Revilla, Liviu Panait, and Keith Sullivan. 2004. Mason: A
new multi-agent simulation toolkit. In Proceedings of the 2004 Swarmfest
Workshop.
Lytle, Tim. The real costa rica.
http://www.therealcostarica.com/costa_rica/costaricans.html (accessed 5/12,
2011).
Ma, Lixin, Christopher T. Jones, Teresa D. Groesch, Richard J. Kuhn, Carol Beth Post,
and Peter Palese. 2004. Solution structure of dengue virus capsid protein reveals
another fold. Proceedings of the National Academy of Sciences of the United
States of America 101, no. 10: 3414-3419.
140
Maantay, Juliana. 2002. Mapping environmental injustices: Pitfalls and potential of
geographic information systems in assessing environmental health and equity.
Environmental health perspectives 110, no. Supplement 2: Community, Research,
and Environmental Justice: 161-171.
Macal, C. M. and M. J. North. 2007. Agent-based modeling and simulation: Desktop
abms. In Simulation Conference, 2007 Winter:95-106.
________. 2010. Tutorial on agent-based modelling and simulation. J of Sim 4, no. 3:
151-162.
Macal, Charles M. and Michael J. North. 2005. Tutorial on agent-based modeling and
simulation. Paper presented at Proceedings of the 37th conference on Winter
simulation, Orlando, Florida.
Macy, Michael and Robert Willer. 2002. From factors to actors: Computational
sociology and agent-based modeling. Palo Alto, CA, ETATS-UNIS: Annual
reviews.
Mahilum, M. M., M. Ludwig, M. B. Madon, and N. Becker. 2005. Evaluation of the
present dengue situation and control strategies against aedes aegypti in cebu city,
philippines. Journal of Vector Ecology 30, no. 2: 277-283.
Malleson, N., Brantingham, P. 2009. Prototype burglary simulations for crime reduction
and forecasting. Crime Patterns And Anslysis:The Journal of the International
Symposium on Environmental Criminology and Crime Analysis 2, no. 1: 47-65.
Malleson, Nick, Alison Heppenstall, and Linda See. 2010. Crime reduction through
simulation: An agent-based model of burglary. Computers, Environment and
Urban Systems 34, no. 3: 236-250.
McBride, William John Hannan, Helen Mullner, Reinhold Muller, Justin Labrooy, and
Ian Wronski. 1998. Determinants of dengue 2 infection among residents of
charters towers, queensland, australia. Am. J. Epidemiol. 148, no. 11: 1111-1116.
McMichael, A. J. 2004. Environmental and social influences on emerging infectious
diseases: Past, present and future. Philosophical Transactions: Biological
Sciences 359, no. 1447, Emerging Infections: What Have We Learnt from
SARS?: 1049-1058.
McMichael, Anthony J., Rosalie E. Woodruff, and Simon Hales. 2006. Climate change
and human health: Present and future risks. The Lancet 367, no. 9513: 859-869.

141
Mennecke, Brian E., Martin D. Crossland, and Brenda L. Killingsworth. 2000. Is a map
more than a picture? The role of sdss technology, subject characteristics, and
problem complexity on map reading and problem solving. MIS Quarterly 24, no.
4: 601-629.
Ministerio-de-Salud. Costa rican department of health (ministerio de salud)
http://www.ministeriodesalud.go.cr/index.php/inicio-menu-principal-centro-de-
informacion-ms (accessed December 15, 2008).
Mondini, Adriano and Francisco Chiaravalloti-Neto. 2008. Spatial correlation of
incidence of dengue with socioeconomic, demographic and environmental
variables in a brazilian city. Science of The Total Environment 393, no. 2-3: 241-
248.
Montello, Daniel and Paul Sutton. 2006. An introduction to scientific research methods in
geography: SAGE Publications, Inc
Moreno-Sanchez, Rafael, Mary Hayden, Craig Janes, and Geoffrey Anderson. 2006. A
web-based multimedia spatial information system to document aedes aegypti
breeding sites and dengue fever risk along the us–mexico border. Health & Place
12, no. 4: 715-727.
Morrison, A. C., A. Getis, M. Santiago, J. G. Rigau-Perez, and P. Reiter. 1998.
Exploratory space-time analysis of reported dengue cases during an outbreak in
florida, puerto rico, 1991-1992. American Journal of Tropical Medicine and
Hygiene 58, no. 3: 287-298.
Muin, J. and L Khoury. 1997. Genetic epidemiology and the future of disease prevention
and public health. Epidemiologic Reviews 19, no. 1: 175-180.
Nam, Vu Sinh, Brian Kay, Nguyen Thi Yen, Peter Ryan, and Ahmet Bektas. 2004.
Community mobilization, behaviour change and biological control in the
prevention and control of dengue fever in viet nam. Dengue Bulletin 28, no.
Supplement Case Study 12: 57-61.
Nogueira, Rita Maria R, Marize P Miagostovich, Hermann G Schatzmayr, Flávia B dos
Santos, Eliane S M de Araújo, Ana Maria B de Filippis, Rogério V de Souza,
Sonia Maris O Zagne, Cecília Nicolai, Mary Baran, and Gualberto Teixeira Filho.
1999. Dengue in the state of rio de janeiro, brazil, 1986-1998. Memórias do
Instituto Oswaldo Cruz 94: 297-304.
Nuckols, John R., Mary H. Ward, and Lars Jarup. 2004. Using geographic information
systems for exposure assessment in environmental epidemiology studies.
Environmental health perspectives 112, no. 9, 2004 Annual Review: 1007-1015.

142
O'Neill, Philip D. 2002. A tutorial introduction to bayesian inference for stochastic
epidemic models using markov chain monte carlo methods. Mathematical
Biosciences 180, no. 1-2: 103-114.
Ormerod, Paul and Bridget Rosewell. 2009. Validation and verification of agent-based
models in the social sciences. In Epistemological aspects of computer simulation
in the social sciences, ed. Flaminio Squazzoni, 5466:130-140: Springer Berlin /
Heidelberg.
Osgood, Nathaniel. 2007. Using traditional and agent based toolsets for system dynamics:
Present tradeoffs and future evolution. In The 2007 International Conference of
the System Dynamics Society.
Ostfeld, Richard S., Gregory E. Glass, and Felicia Keesing. 2005. Spatial epidemiology:
An emerging (or re-emerging) discipline. Trends in Ecology & Evolution 20, no.
6: 328-336.
Page, Ernest H. and Richard E. Nance. 1994. Parallel discrete event simulation: A
modeling methodological perspective. SIGSIM Simul. Dig. 24, no. 1: 88-93.
Pathirana, S, M Kawabata, and R Goonetilake. 2009. Study of potential risk of dengue
disease outbreak in sri lanka using gis and statistical modelling. Journal of Rural
and Tropical Public Health 8: 8-17.
Patlolla, Padmavathi, Vandana Gunupudi, Armin Mikler, and Roy Jacob. 2006. Agent-
based simulation tools in computational epidemiology. In Innovative internet
community systems, ed. Thomas Böhme, Victor Larios Rosillo, Helena Unger and
Herwig Unger, 3473:212-223: Springer Berlin / Heidelberg.
Patz, Jonathan A. 2002. A human disease indicator for the effects of recent global climate
change. Proceedings of the National Academy of Sciences of the United States of
America 99, no. 20: 12506-12508.
Patz, Jonathan A., Willem J. M. Martens, Dana A. Focks, and Theo H. Jetten. 1998.
Dengue fever epidemic potential as projected by general circulation models of
global climate change. Environmental health perspectives 106, no. 3: 147-153.
Penna, Maria Lucia F. 2004. Ecological study of rio de janeiro city den-3 epidemic,
2001-2002. Dengue Bulletin 28: 20-27.
Perez, Liliana and Suzana Dragicevic. 2009. An agent-based approach for modeling
dynamics of contagious disease spread. International Journal Of Health
Geographics 8, no. 1: 50.

143
Phuanukoonnon, Suparat, Mark Brough, and Joan H. Bryan. 2006. Folk knowledge about
dengue mosquitoes and contributions of health belief model in dengue control
promotion in northeast thailand. Acta Tropica 99, no. 1: 6-14.
Qiu, F., D. Gubler, J. Liu, and Q Chen. 1993. Dengue in china: A clinical review. Bulletin
World Health Organization 71, no. 3-4: 349-359.
Reiter, Paul. 2001. Climate change and mosquito-borne disease. Environmental health
perspectives 109, no. Supplement 1: Reviews in Environmental Health, 2001:
141-161.
Reiter, Paul, Sarah Lathrop, and Michel Bunning. 2003. Texas lifestyle limits
transmission of dengue virus. Emerging Infectious Diseases 9, no. 1: 86-89.
Rigau-Perez, JG, A Aayala-Lopez, AV Vorndam, and GG Clark. 2001. Dengue activity
in puerto rico during an interepidemic period (1995-1997). Am J Trop Med Hyg
64, no. 1: 75-83.
Rigau-Pérez, José G., Gary G. Clark, Duane J. Gubler, Paul Reiter, Eduard J. Sanders,
and A. Vance Vorndam. 1998. Dengue and dengue haemorrhagic fever. The
Lancet 352, no. 9132: 971-977.
Roberts, Leslie. 2002. Mosquitoes and disease. Science 298, no. 5591, The Mosquito
Genome: Anopheles gambiae: 82-83.
Rodriguez-Figueroa, Linnette, Jose G. Rigau-Perez, Erick L. Suarez, and Paul Reiter.
1995. Risk factors for dengue infection during an outbreak in yanes, puerto rico in
1991. The American Society of Tropical Medicine and Hygiene 52, no. 6: 496-
502.
Rosenbaum, Julia, Michael B. Nathan, Rhea Ragoonanansingh, Samuel Rawlins, Carol
Gayle, Dave D. Chadee, and Linda S. Lloyd. 1995. Community participation in
dengue prevention and control: A survey of knowledge, attitudes, and practice in
trinidad and tobago. The American Journal of Tropical Medicine and Hygiene 53,
no. 2: 111-117.
Sanchez, S. M. 2002. Exploring the world of agent-based simulations: Simple models,
complex analyses. ed. T. W. Lucas, 1:116-126.
Sargent, Robert G. 2008. Verification and validation of simulation models. Paper
presented at Proceedings of the 40th Conference on Winter Simulation, Miami,
Florida.
Satterthwaite, David. 2003. The links between poverty and the environment in urban
areas of africa, asia, and latin america. Annals of the American Academy of
Political and Social Science 590, no. 1: 73-92.

144
Schmidt, Charles W. 2006. Monitoring environmental exposures: Now it's personal.
Environmental health perspectives 114, no. 9: A528-A534.
Shalizi, Cosma Rohilla. 2006. Methods and techniques of complex systems science: An
overview. In Complex systems science in biomedicine, ed. Thomas S. Deisboeck
and J. Yasha Kresh:33-114: Springer US.
Shekhar, KC and Huat. 1992. Epidemiology of dengue/dengue hemorrhagic fever in
malaysia--a retrospective epidemiological study 1973-1987. Part i: Dengue
hemorrhagic fever (dhf). Asia Pacific Journal of Public Health 6, no. 2: 15-25.
Siqueira-Junior, Joao, Ivan Maciel, Christovam Barcellos, Wayner Souza, Marilia
Carvalho, Nazareth Nascimento, Renato Oliveira, Otaliba Morais-Neto, and
Celina Martelli. 2008. Spatial point analysis based on dengue surveys at
household level in central brazil. BMC Public Health 8, no. 361: 1-9.
Skvortsov, A., R. Connell, P. Dawson, and R. Gailis. 2007. Epidemic modelling:
Validation of agent-based simulation by using simple mathematical models.
International Congress on Modelling and Simulation. Modelling and Simulation
Society of Australia and New Zealand, no. 12.
Spiegel, Jerry, Shannon Bennett, Libby Hattersley, Mary H. Hayden, Pattamaporn
Kittayapong, Sustriayu Nalim, Daniel Nan Chee Wang, Emily Zielinski-
Gutiérrez, and Duane Gubler. 2005. Barriers and bridges to prevention and
control of dengue: The need for a social–ecological approach. EcoHealth 2, no. 4:
273-290.
Spiegel, Jerry M., Mariano Bonet, Ana-Maria Ibarra, Nino Pagliccia, Veronic Ouellette,
and Annalee Yassi. 2007. Social and environmental determinants of aedes aegypti
infestation in central havana: Results of a case-control study nested in an
integrated dengue surveillance programme in cuba. Tropical Medicine &
International Health 12, no. 4: 503-510.
Suarez, Roberto M., S. Maria Fernanda Olarte, M. F. A. Ana, and U. Catalina González.
2005. Is what i have just a cold or is it dengue? Addressing the gap between the
politics of dengue control and daily life in villavicencio-colombia. Social Science
& Medicine 61, no. 2: 495-502.
Sujariyakul, Anupong, Sa-wang Prateepko, Virasakdi Chongsuvivatwong, and
SuwichThammapalo. 2005. Transmission of dengue haemorrhagic fever: At home
or school? Dengue Bulletin 29: 32-40.
Sullivan, David and Haklay Mordechai. 2000. Agent-based models and individualism: Is
the world agent-based? Environment and Planning A 32, no. 8: 1409-1425.

145
Syed, M, Saleem T, Syeda UR, Habib M, Zahid R, Bashir A, Rabbani M, Khalid M,
Iqbal A, Rao EZ, Shujja-ur-Rehman, and Saleem S. 2010. Knowledge, attitudes
and practices regarding dengue fever among adults of high and low
socioeconomic groups. Journal of Pakistan Medical Association 60, no. 3: 243-
247.
Tan, Gary S. H. and R. Lau. 2007. Crisis management simulation: Spread of diseases in
national university of singapore. In Asiasim 2007, ed. Jin-Woo Park, Tag-Gon
Kim and Yun-Bae Kim, 5:75-84: Springer Berlin Heidelberg.
Tapia-Conyer, Roberto, Jorge F. Méndez-Galván, and Héctor Gallardo-Rincón. 2009.
The growing burden of dengue in latin america. Journal of Clinical Virology 46,
no. Supplement 2: S3-S6.
Teixeira, Maria da Glória, Maurício L. Barreto, Maria da Conceição N. Costa, Leila
Denize A. Ferreira, Pedro F. C. Vasconcelos, and Sandy Cairncross. 2002.
Dynamics of dengue virus circulation: A silent epidemic in a complex urban area.
Tropical Medicine & International Health 7, no. 9: 757-762.
Thammapalo, S., V. Chongsuvivatwong, A. Geater, and M. Dueravee. 2008.
Environmental factors and incidence of dengue fever and dengue haemorrhagic
fever in an urban area, southern thailand. Epidemiology and Infection 136, no. 01:
135-143.
Thavara, U., A. Tawatsin, W. Kong-ngamsuk, and M. S. Mulla. 2004. Efficacy and
longevity of a new formulation of temephos larvicide tested in villagescale trials
against aedes aegypti larvae in water-storage containers. Journal of the American
Mosquito Control Association, no. Journal Article.
Thummadi, B., Omri Shiv, Nicholas Berente, and Kalle Lyytinen. 2011. Enacted
software development routines based on waterfall and agile software methods:
Socio-technical event sequence study. In Service-oriented perspectives in design
science research, ed. Hemant Jain, Atish Sinha and Padmal Vitharana, 6629:207-
222: Springer Berlin / Heidelberg.
Tibbetts, John. 2007. Driven to extremes: Health effects of climate change.
Environmental health perspectives 115, no. 4: A196-A203.
Tol, Richard and Hadi Dowlatabadi. 2001. Vector-borne diseases, development &
climate change. Integrated Assessment 2, no. 4: 173-181.
Toledo Romani, Maria E., Veerle Vanlerberghe, Dennis Perez, Pierre Lefevre, Enrique
Ceballos, Digna Bandera, Alberto Baly Gil, and Patrick Van der Stuyft. 2007.
Achieving sustainability of community-based dengue control in santiago de cuba.
Social Science & Medicine 64, no. 4: 976-988.

146
Torrens, Paul M. 2006. Simulating sprawl. Annals of the Association of American
Geographers 96, no. 2: 248 - 275.
________. 2010. Agent-based models and the spatial sciences. Geography Compass 4,
no. 5: 428-448.
Torres, M. Idali. 1997. Impact of an outbreak of dengue fever : A case study from rural
puerto rico. Human Organization 56, no. 1: 19-27.
Troyo, A., S. L. Porcelain, O. Calderon-Arguedas, D. D. Chadee, and J. C. Beier. 2006.
Dengue in costa rica: The gap in local scientific research. Pan American Journal
of Public Health 20, no. 5: 350-360.
Troyo, Adriana., Douglas O. Fuller, Olger Calderón-Arguedas, Mayra E. Solano, and
John C. Beier. 2009. Urban structure and dengue fever in puntarenas, costa rica.
Singapore Journal Of Tropical Geography 30, no. 2: 265-282.
Tun-Lin, W., T. R. Burkot, and B. H. Kay. 2000. Effects of temperature and larval diet on
development rates and survival of the dengue vector aedes aegypti in north
queensland, australia. Medical and veterinary entomology 14, no. 1: 31-37.
Valanides, N. and C. Angeli. 2008. Learning and teaching about scientific models with a
computer-modeling tool. Computers in Human Behavior 24, no. Copyright 2008,
The Institution of Engineering and Technology: 220-33.
Van-Benthem, BH, Vanwambeke SO, Khantikul N, Burghoorn-Maas C, Panart K,
Oskam L, Lambin EF, and Somboon P. 2005. Spatial patterns of and risk factors
for seropositivity for dengue infection. The American Journal of Tropical
Medicine and Hygiene 72, no. 2: 201-208.
Vanwambeke, Sophie, Birgit van Benthem, Nardlada Khantikul, Chantal Burghoorn-
Maas, Kamolwan Panart, Linda Oskam, Eric Lambin, and Pradya Somboon.
2006. Multi-level analyses of spatial and temporal determinants for dengue
infection. International Journal Of Health Geographics 5, no. 1: 5.
Vasconcelos, Pedro F. C., José Wellington O. Lima, Amélia P. A. Travassos da Rosa,
Maria J. Timbó, Elizabeth S. Travassos da Rosa, Hascalon R. Lima, Sueli G.
Rodrigues, and Jorge F. S. Travassos da Rosa. 1998. Epidemia de dengue em
fortaleza, ceará: Inquérito soro-epidemiológico aleatório. Revista de Saúde
Pública 32: 447-454.
Vine, Marilyn F., Darrah Degnan, and Carol Hanchette. 1997. Geographic information
systems: Their use in environmental epidemiologic research. Environmental
health perspectives 105, no. 6: 598-605.

147
Vogel, Gretchen. 2002. In pursuit of a killer. Science 298, no. 5591, The Mosquito
Genome: Anopheles gambiae: 87-89.
Wali, JP, Biswas A, Handa R, Aggarwal P, Wig N, and Dwivedi SN. 1999. Dengue
haemorrhagic fever in adults: A prospective study of 110 cases. Tropical Doctor
29, no. 1: 27-30.
Waterman, S. H., R. J. Novak, G. E. Sather, R. E. Bailey, I. Rios, and D. J. Gubler. 1985.
Dengue transmission in two puerto rican communities in 1982. The American
Journal of Tropical Medicine and Hygiene 34, no. 3: 625-632.
Weinhold, Bob. 2004. Infectious disease: The human costs of our environmental errors.
Environmental health perspectives 112, no. 1: A32-A39.
Wen, Tzai-Hung, Neal H. Lin, Chun-Hung Lin, Chwan-Chuen King, and Ming-Daw Su.
2006. Spatial mapping of temporal risk characteristics to improve environmental
health risk identification: A case study of a dengue epidemic in taiwan. Science of
The Total Environment 367, no. 2-3: 631-640.
Wheeler, David C. and Antonio Páez. 2010. Geographically weighted regression. In
Handbook of applied spatial analysis, ed. Manfred M. Fischer and Arthur
Getis:461-486: Springer Berlin Heidelberg.
Wichmann, Ole, Suchat Hongsiriwon, Chureeratana Bowonwatanuwong, Kesinee
Chotivanich, Yoawalark Sukthana, and Sasithon Pukrittayakamee. 2004. Risk
factors and clinical features associated with severe dengue infection in adults and
children during the 2001 epidemic in chonburi, thailand. Tropical Medicine &
International Health 9, no. 9: 1022-1029.
Wilensky, Uri and William Rand. 2007. Making models match: Replicating an agent-
based model. Journal of Artificial Societies and Social Simulation 10.
Wolstenholme, J. 1993. Ross river virus disease- the first recorded outbreak? Internal
Medicine Journal 23, no. 4: 417-418.
Wu, Pei-Chih, Jinn-Guey Lay, How-Ran Guo, Chuan-Yao Lin, Shih-Chun Lung, and
Huey-Jen Su. 2009. Higher temperature and urbanization affect the spatial
patterns of dengue fever transmission in subtropical taiwan. Science of The Total
Environment 407, no. 7: 2224-2233.
Yilmaz, Levent. 2006. Validation and verification of social processes within agent-based
computational organization models. Computational & Mathematical
Organization Theory 12, no. 4: 283-312.

148
Yinyu, Ye. The markov decision process.
https://www.ipam.ucla.edu/publications/sm2011/sm2011_9641.pdf (accessed
May, 10, 2011).
Zhang, Ying, Peng Bi, and Janet Esther Hiller. 2008. Climate change and the
transmission of vector-borne diseases: A review. Asia-Pacific Journal of Public
Health 20, no. 1: 64-76

VITA
Robinson Roberto Campos Rodríguez was born in San José, Costa Rica. After
graduating from High School, he attended The University of Costa Rica. In 1997, he
applied to The University of Texas at Austin and was accepted into the Computer Science
Department where he earned his Bachelor of Arts degree in Computer Science. During
the following year he was accepted into the graduate college at Texas State University-
San Marcos where he earned a Master of Science degree in Software Engineering and in
August 2013 a Ph.D. in Geographic Information Systems.
Permanent email address: [email protected]
This dissertation was typed by Robinson Roberto Campos Rodríguez.