enhanced post-elastic behaviour of geopolymer concrete ... shafiq - enhance… · innovations in...
TRANSCRIPT

Enhanced post-elastic behaviour of geopolymerconcrete using chopped PVA fibres and Nano SilicaGel from Sugarcane BagasseByProf. Dr Nasir ShafiqDirector Sustainable Resources Mission Oriented Research
© 2013 INSTITUTE OF TECHNOLOGY PETRONAS SDN BHDAll rights reserved. No part of this document may be reproduced, stored in a retrieval system or transmitted in any form or by any means (electronic, otherwise) without the permission ofhecopyright owner.

HighlightsofPresentation
Background and Introduction
Typical Urban Infrastructure
Challenges and Issues
Self Sensing or Piezo-resistive materials
Material Properties
Concluding remarks

Background and Introduction

Climate Change Effects and ChallengesIncreasing Carbon Footprint§ Increasing urban sprawl – increased volume of built environment
(infrastructure demand)
§ Highly resource based – Concrete the second largest consumable
material§ Planet under intense pressure (1.57 planets needed)
What is the challenge?§ Managing a city’s development that:
§ Maximizes low-carbon energy sources
§ Enhances efficiency in delivering urban services (disciplined resource
consumption)
§ Moves towards carbon neutral intensity for a given unit of GDP

§ The increased concentrations of key greenhouse gases are a direct consequence of human activities.
Bio-capacity potential = 1.7 gha
Actual production = 2.7 ghaWHAT DOES IT MEAN?
Open

Future Urban Setting: Self-Sustaining and Carbon Neutral

Self-sensing nano-cementitious composite have been developed for traffic monitoring by using
piezo-resistive multi-walled carbon nanotubes (CNTs) as an admixture.
Response of the piezo-resistive properties of composite to compressive stress and due to vehicular
loading was made using self-sensing CNT/cement composite for traffic monitoring.


Innovations in Geopolymer Concrete for Self-Sustainable Building and
Infrastructure

This Study
§ Material Properties


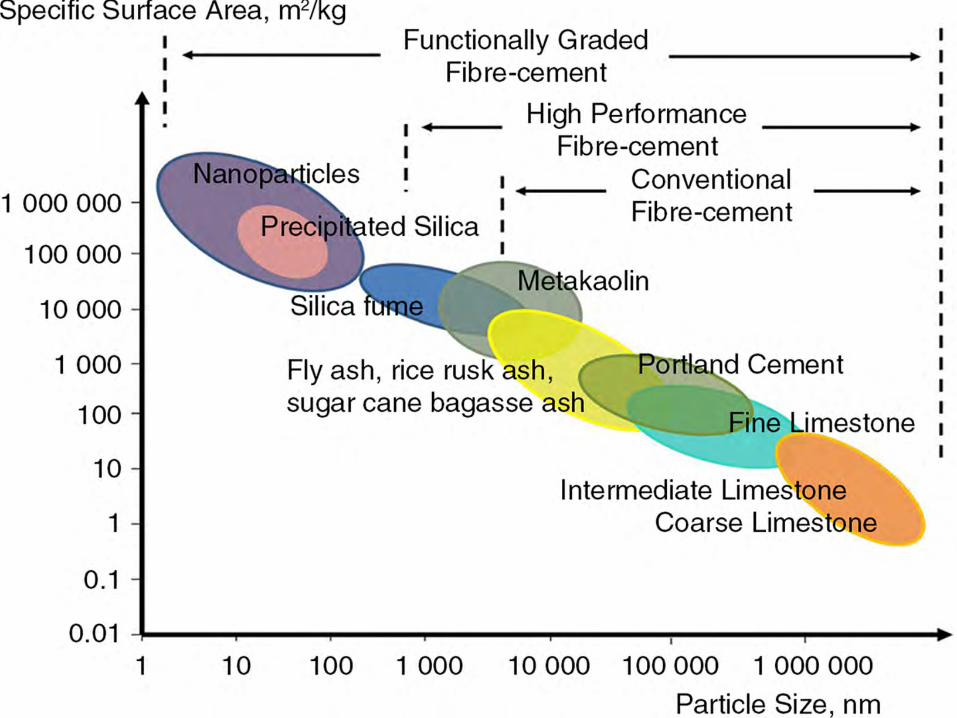
PRODUCTION OF SILICA GEL FROM SUGARCANE BAGASSE
Samantha [22]The researcher claims the pozzolanicactivity of the silica gel is similar to the silicafume and nano-silica activities produced byanother amorphous pozzolana.
Sugarcane Bagasse Silica Gel Sodium Silicate
Extraction : Clean SCB + NaOH
Heating, agitation, cooling and filtering
Gelification: Sodium silicate solution + acid
Drying with ethyl alcohol at 110ºC

X-RAY DIFFRACTION (XRD)
0
10
20
30
40
50
60
70
80
90
100
3 7 11 15 19 23 27 31 35 39 43 47 51 55 59 63 67 71 75 79
Rel
ativ
e in
tens
ity: c
ps
Diffraction angle 2θ: deg
SB-600-1H-BURNSB-600-2H-BURNSB-600-3H-BURN
5(a)
C1
C1 : Crystobalite (SiO2) C2 : Calcite (CaCO3) G : Graphite (Carbon) Q : Quartz (SiO2)
C1
Q
G
C2
0
10
20
30
40
50
60
70
80
90
100
3 7 11 15 19 23 27 31 35 39 43 47 51 55 59 63 67 71 75 79
Rel
ativ
e in
tens
ity: c
ps
Diffraction angle 2θ : deg
SB-700-1H-BURNSB-700-2H-BURNSB-700-3H-BURN
C1 : Crystobalite (SiO2) C3 : Ca3 (PO4)2 Q : Quartz (SiO2) E : Epsomite (MgSO4 (H2O)7
E
C3
C2
C1
C2
C1
C2Q
C2C3
C2
C3
C2
5(b)
C3
0
10
20
30
40
50
60
70
80
90
100
3 7 11 15 19 23 27 31 35 39 43 47 51 55 59 63 67 71 75 79
Rel
ativ
e in
tens
ity: c
ps
Diffraction angle 2θ: deg
SB-800-1H-BURNSB-800-2H-BURNSB-800-3H-BURN
C1 : Crystobalite (SiO2) C3 : Ca3 (PO4)2 C4 : Coesite (SiO2) Al : AlPO4
C4
C4 C1
C1
C3
Al
5(c)
Sugarcane bagasse for this incineration process was pre-treated using
optimum pre-treatment parameters, which was a combination of 0.1 M HCl
solution and 1 h soaking period. Figure above shows XRD profiles of ashes
obtained after various incineration temperatures (600, 700, and 800 °C) and
durations (1 h, 2 h, and 3 h). It is apparent in this figure that incinerated ash
has reached the transition line of amorphous-crystalline phase after 3 h
burning in 800 °C.

EFFECT OF TEMPERATURE AND TIME
Temperature(°C)
Durations(h)
Chemical Composition (%)
SiO2 P2O5 CaO K2O Al2O3 SO3 MgO Fe2O3 Na2O LOI
6001 64.9 4.7 1.9 1.9 0.5 0.6 0.7 1.5 0.1 1.82 74.8 6.2 2.1 2.6 2.2 0.7 1.2 0.4 0.3 0.53 71.5 8.3 3.0 3.4 0.6 0.8 1.4 1.4 0.5 0.2
7001 65.9 7.4 2.6 2.7 1.4 0.7 1.0 1.8 0.3 0.22 72.0 5.9 2.2 2.5 1.0 1.0 1.2 1.4 0.2 0.23 84.8 6.0 2.2 2.6 1.2 1.0 1.2 0.4 0.3 0.2
8001 84.1 7.3 2.5 2.5 0.9 0.5 1.2 0.4 0.3 0.22 84.3 5.6 1.9 2.9 1.1 0.5 1.4 1.7 0.3 0.13 82.9 5.1 2.0 2.3 1.6 0.3 1.2 3.4 0.2 0.1
• Extending burning duration from 1 h to 3 h in 600 °C was able to generate 10% increment to the extracted SiO2 content. The increment
rate was intensified in 700 °C where the extension of burning duration was able to generate 29% increment to the SiO2 proportion.
• In 800 °C, the SiO2 content insignificantly shifted even after the extension of burning duration. However, as indicated in XRD result, the
amorphousness phase has rapidly shifted towards crystalline phase after 3 h burning at 800 °C. For the subsequent analysis, 800 °C and 1
h burning duration was adopted as the optimum burning variable due to its amorphous and high silica content.
• Consideration to discard 700 °C – 3 h, 800 °C – 2 h, and 800 °C – 3 h pairs were due to the extensive energy consumption in these longer
burning duration.

BET SURFACE AREA & BJH VOLUME OF PORES
SampleBall Mill Grinding
(min)
Particle Size (µm)BET
Surface Area
(m2/g)
BJH Volume of Pores (cm3/g)D(0.1) D(0.5) D(0.9)
Cement Type I n/a 2.8 18.3 49.5 1.9 0.00571
SCBA Non-Treated
n/a 2.0 30.7 155.4 8.2 0.02157
SCBA Treated n/a 2.4 18.2 77.0 45.1 0.13643
SCBA Treated 15 15 1.5 17.4 117.7 41.8 0.14737
SCBA Treated 30 30 1.4 17.3 112.2 40.3 0.12567
SCBA Treated 45 45 1.0 8.6 36.7 44.1 0.14324
SCBA Treated 60 60 1.0 10.5 52.0 49.5 0.14383
• Pre-treatment process remarkablyincreased the surface area of SCBAup to 5 times higher than untreatedSCBA. It is supported by immenseescalation of BJH pores volume fromuntreated to pre-treated SCBA.
• Additional effort to increase thesurface area by grinding the ashes upto 60 min provided inconsiderableimprovement to the surface areaproperties. Reduction on the surfacearea was even detected in thegrinding time of 15 – 45 min.
• Cellular structure of sugarcane bagasse ash appeared to be ruptured by grinding process, which may reduce itspozzolanic reactivity feature. This reduction can also be explained as the effect of coalescing of fine particles.
• Immediate transition to finer particle after short grinding process resulted in coarser particles due to coalescingfine ash. It could be prevented by increasing the grinding duration; however the impact energy will beunnecessarily used to refine the coalesced particle.

PARTICLE SIZE ANALYSIS
0.0
1.0
2.0
3.0
4.0
5.0
6.0
0.10 1.00 10.00 100.00 1000.00
Vol
ume
(%)
Particle Size (µm)
OPC UnG-UnT UnG-T
0.0
1.0
2.0
3.0
4.0
5.0
6.0
0.10 1.00 10.00 100.00 1000.00V
olum
e (%
)
Particle Size (µm)
UnG-T 15 Mins G 30 Mins G45 Mins G 60 Mins G
• Based on this figures, particles of OPC accumulated at certain size, while SCBA has wider particle size range.Additional grinding process did not contribute significantly to the improvement of particle size’s range of thetreated SCBA.
• However, regardless of coarser particle, treated SCBA has higher surface area than OPC and untreated SCBA,which was contributed by fine particles and porous structure of larger particles. The trend is also displayed byFESEM images where the large particles are scarcely detected and replaced with finer particles

MICROSTRUCTURE ANALYSIS : FESEM
Figure 7. Microstructure images of SCBA particles (a) before pre-treatment (b) after pre-
treatment
(a)
(b)
• It appears that HCl acid has rupturedlarge fraction of solid cellulose andtransform it to fine silica during thecombustion process.
• Figure (a) illustrates thetransformation of outer fibre intoash, yet leave the inner fibre in anon-fully decomposed state. It isentirely different with pre-treatedspecimen where the internallyporous particle would provide alarge surface area to assist thepozzolanic reactivity.
(a)Before pre-treatment
(b) After pre-treatment


PVA Fibres
Properties
Length (mm) 10 20 18
Diameter (μm) 200 200 200
Aspect Ratio (l/d) 50 100 90
Density (g/cm3) 1.3 1.3 1.3
Tensile strength (MPa) 1000 1000 1000
Results Summary
§ Compressive Strength = 60 Mpa
§ Maximum Deflection = 3.1 cm
