enhanced long-term nitrogen removal by organotrophic ... › docs › 2016-10 › ... ·...
TRANSCRIPT

RSC Advances
PAPER
Publ
ishe
d on
09
Sept
embe
r 20
16. D
ownl
oade
d by
Nor
thw
est A
gric
ultu
re a
nd F
ores
try
Uni
vers
ity o
n 12
/10/
2016
01:
55:4
0.
View Article OnlineView Journal | View Issue
Enhanced long-t
aState Key Laboratory of Crop Stress Biolog
Northwest A&F University, Yangling, ShaanbCenter for Mitochondrial Biology and Med
Information Engineering of the Ministry o
Technology, Xi'an Jiaotong University, ShaacSchool of Human Settlements & Civil Engin
710049, China. E-mail: [email protected]
83395128dState Key Laboratory of Crop Stress Biolog
Yangling Branch of China Wheat Improve
Yangling, Shaanxi 712100, ChinaeSchool of Chemical Engineering & Techno
710049, ChinafSchool of Energy and Power Engineering, Xi
China
† Electronic supplementary informa10.1039/c6ra04114k
‡ These authors contributed equally to th
Cite this: RSC Adv., 2016, 6, 87593
Received 15th February 2016Accepted 5th September 2016
DOI: 10.1039/c6ra04114k
www.rsc.org/advances
This journal is © The Royal Society of C
erm nitrogen removal byorganotrophic anammox bacteria under differentC/N ratio constraints: quantitative molecularmechanism and microbial community dynamics†
Duntao Shu,‡ab Yanling He,*c Hong Yue,‡d Junling Gao,e Qingyi Wange
and Shucheng Yangf
The anaerobic ammonium oxidation (anammox) process has mainly been applied to NH4+–N-rich wastewater
with very low levels of organic carbon (<0.5 g COD per g N). Some anammox bacteria species have the capacity
to oxidize organic carbonwith nitrate as the electron acceptor. However, little is known about the organotrophic
anammox nature of “Ca. Brocadia sinica”. To elucidate themetabolic versatility andmicrobial succession of “Ca.
Brocadia sinica” under TOC/TN stress conditions, the influence of TOC/TN ratios on the nitrogen transformation
pathway and the dynamics of microbial communities were investigated. It was found that an appropriate TOC/
TN ratio (<0.2) could promote the anammox activity over the short-term. Meanwhile, “Ca. Brocadia sinica” had
higher tolerance to higher TOC/TN (>0.4) abiotic stresses. Mass balance indicated that organotrophic anammox
could outcompete denitrifiers under a TOC/TN ratio of 0.1–0.2. Quantitative response relationships and
pathway analysis revealed that (AOA amoA + AOB amoA + anammox + nrfA)/bacteria, nrfA/(narG + napA),
and nrfA were the key functional gene groups determining the organotrophic anammox contribution.
Additionally, MiSeq sequencing showed that Planctomycetes, Proteobacteria, Chloroflexi, and Chlorobi were
the most abundant phyla in the organotrophic anammox system. Furthermore, higher TOC/TN ratios (>0.40)
could result in the community succession of anammox species, in which “Ca. Jettenia caeni” and “Ca.
Kuenenia stuttgartiensis” were the dominant organotrophic anammox bacteria species. Overall, combined
analyses revealed that the coupling of anammox, DNRA (organotrophic anammox), and denitrification
comprised the primary pathway that accounted for TOC and nitrogen removal.
1. Introduction
Anaerobic ammonium-oxidizing (anammox) bacteria, whichwere discovered in a denitrifying bioreactor and mediated by
y in Arid Areas, College of Life Sciences,
xi 712100, China
icine, The Key Laboratory of Biomedical
f Education, School of Life Science and
nxi 710049, China
eering, Xi'an Jiaotong University, Shaanxi
.cn; Fax: +86 029 83395128; Tel: +86 029
y in Arid Areas, College of Agronomy and
ment Center, Northwest A&F University,
logy, Xi'an Jiaotong University, Shaanxi
'an Jiaotong University, Shaanxi 710049,
tion (ESI) available. See DOI:
is work.
hemistry 2016
Plantomycete bacteria,1,2 have the unique ability to combineammonium and nitrite to form N2. Understanding of themicrobial nitrogen cycle has therefore been fundamentallyaltered by the discovery of anammox bacteria.3 The anammox-related process, which is a lithoautotrophic nitrogen removalprocess, has been successfully applied in the treatment ofammonia-rich wastewater with low COD (chemical oxygendemand) : N (nitrogen) ratios due to its cost-effective andenergy-efficient qualities.4,5
Nevertheless, the slow growth rate, low cell yield, andsensitivity to environmental conditions which characterizeanammox bacteria have presented major obstacles to thebroader application of anammox-related processes. Forinstance, in a mainstream and side-stream nitrogen removalprocess, anammox bacteria were unable to avoid the inuencesof volatile fatty acids (VFA) (expressed as total organic carbon),which existed in large volume in municipal and industrialWWTPs.6 Although the addition of organic matter had signi-cant effects on anammox bacteria in many studies, there hasbeen no consensus on which TOC (total organic carbon) to TN(total nitrogen) ratios inhibit/or affect the anammox bacteria.7–9
RSC Adv., 2016, 6, 87593–87606 | 87593

RSC Advances Paper
Publ
ishe
d on
09
Sept
embe
r 20
16. D
ownl
oade
d by
Nor
thw
est A
gric
ultu
re a
nd F
ores
try
Uni
vers
ity o
n 12
/10/
2016
01:
55:4
0.
View Article Online
In addition, investigations have reported that the most criticalpoint in the competition between autotrophic anammox, orga-notrophic anammox, and heterotrophic denitrication for TOCis the C : N ratio in the inuent.10,11 Moreover, detailed evidencedescribing the contribution of organotrophic or mixotrophicanammox processes to nitrogen removal in the presence of TOChas yet to be presented.
To date, six anammox bacteria genera have been detected andproposed using 16S and 23S rRNA gene sequencing: “Ca. Broca-dia sinca”, “Ca. Anammoxoglobus propionicus”, “Ca. Jettenia caeni”,“Ca. Kuenenia stuttgartiensis”, “Ca. Scalindua sp.”, and “Ca. Bro-cadia anammoxidans”.12,13 A few recent studies10,14,15 have reportedthat some anammox bacteria species, including Ca. Jettenia asi-atica, Ca. Ananimoxoglobus propionicus, Ca. Brocadia fulgida, andCa. Kuenenia stuttgartiensis have the capacity to oxidize acetateand propionate. In addition, phylogenetic classication ofanammox 16S rRNA12 revealed that “Ca. Brocadia sinica” wasclosely related to the group “Ca. Brocadia Scalindua sp.” and “Ca.Brocaida anammoxidans”, which were organotrophic. Thus, itcould be speculated that TOC might have been utilized as elec-tron donors by “Ca. Brocadia sinica” and this phylum couldsuccess to other organotrophic anammox species. However,whether the organotrophic nature of “Ca. Brocadia sinica”participated in TOC oxidation remains unveried. This inspiredus to explore the adaptability and organotrophic nature of “Ca.Brocadia sinica” in the presence of TOC.
In addition, anammox sludge in wastewater treatment plantsis a highly complex system of eukaryotes (protozoa, fungi, andmicroalgae),16–19 bacteria, archaea, and viruses, in whichbacteria are dominant. Molecular biological methods whichhave been applied to explore the microbial structures inanammox-related system include clone library of 16S rRNAgenes, denaturing gradient gel electrophoreses (DGGE) analysisand uorescence in situ hybridization (FISH). With the recentrapid development of the next-generation sequencing, high-throughput sequencing has been received more attention. 454pyrosequencing20 and Illumina high-throughput sequencing21
have been applied to the investigation of microbial communi-ties in lab-scale and pilot-scale anammox-related systems.However, little is known about the dynamics of microbialcommunities and functional genes under TOC/TN constraints.Knowledge of microbial community structures and the links todifferent TOC stresses is therefore essential for understandingthe prole of the organotrophic anammox process.
Furthermore, nitrication, denitrication, and anammoxcould co-exist in anammox-related systems when the TOC waspresent.22 These nitrogen removal processes involve several func-tional genes which have played key roles in microbial nitrogencycling, including anammox 16S rRNA, archaea ammonia mon-oooxygenase (AOA-amoA), ammonia monoooxygenase (AOB-amoA), nitrite oxidoreductase (nxrA), periplasmic nitrate reductase(napA), membrane-bound nitrate reductase (narG), dissimilatorynitrate reductase (nrfA), copper-containing nitrite reductase (nirK),nitrite reductase (nirS), and nitrous oxide reductase (nosZ).23,24
Nevertheless, the quantitative response relationship betweennitrogen transformation rates and functional genes are unknownin the anammox system. Furthermore, the corresponding
87594 | RSC Adv., 2016, 6, 87593–87606
dynamics of microbial community structures and functional genegroups on the quantitative molecular level in the organotrophicanammox process are still unclear.
The present study is the rst to systematically investigate themicrobial community structure dynamics and quantitativemolecular mechanisms of nitrogen transformation in anam-mox systems under different TOC stress constraints. Based onthese arguments, this study was performed for the followingpurposes: (1) to assess the impacts of different TOC/TN ratioson organotrophic anammox growth rates and activity usingbatch experiments; (2) to evaluate the long-term adaptation of“Ca. Brocadia sinica” and contribution of organotrophic anam-mox bacteria species under different TOC/TN constraints; (3) toexplore the quantitative response relationships betweennitrogen transformation rates and functional gene groups, and(4) to investigate the dynamics of nitrogen-related microbialcommunities under TOC/TN stress conditions.
2. Methods2.1. Kinetic evaluation and treatment performance of ananammox bioreactor under different TOC/TN ratioconstraints
The anammox biomass used in this study was taken froma laboratory-scale sequencing batch reactor (SBR) witha working volume of 2.6 L. The anammox–SBR system has beenoperated for over 18 months under mesophilic conditions (35�2 �C) with hydraulic residence time (HRT), inuent NH4
+–N,and NO2
�–N concentrations of 4 h, 200 mg L�1 and 220 mg L�1,respectively. According to Shu et al.,21 the “Ca. Brocadia sinica”phylum comprised the dominant anammox bacteria in this SBRsystem. Prior to the addition of TOC, the stock solution oforganic carbon sources was prepared by mixing it with acetateand propionate at a volume ratio of 1 : 1. In the case of batchexperiments, 10 mL of anammox biomass were dispensed into60 mL of liquid in 100 mL serum vials with different TOC/TNratios of 0, 0.05, 0.10, 0.20, 0.41, 0.61, and 0.82 (Table 1).Finally, the concentration values of mixed liquor volatile sus-pended solids (MLVSS), NH4
+–N and NO2�–N in each vial were
2850 mg L�1, 80 mg L�1, and 96 mg L�1, respectively. The aboveexperimental procedures were performed in an anaerobic glovebox. All the experimental vials were thereaer incubated at32 �C and shaken at a speed of 120 rpm in the dark. The watersamples for further kinetic analysis were taken from the vialshourly over 8 hours.
To investigate the effects of different TOC/TN ratios on “Ca.Brocadia sinica”, the specic anammox activity (SAA) andspecic anammox growth rates (mAN) were measured accordingto the following models.25
SAA ¼ SAAmax
1þ KS
Sþ S
KI
and mAN ¼ mAN max
1þ KS
Sþ S
KI
(1)
where KS is the half saturation constant; S is the TOC concen-tration; KI is the inhibition constant; and SAAmax and mAN max arethe maximum specic anammox activity and specic anammoxgrowth rates, respectively.
This journal is © The Royal Society of Chemistry 2016

Table 1 Short- and long-term experiment conditions
NH4+–N
(mg L�1)NO2
�–N(mg L�1)
TOC(mg L�1) TOC : TN
Batch experimentsBatch test 1 80 96 — —Batch test 2 80 96 8.99 0.05Batch test 3 80 96 17.98 0.10Batch test 4 80 96 35.96 0.20Batch test 5 80 96 71.91 0.41Batch test 6 80 96 107.87 0.61Batch test 7 80 96 143.82 0.82
Long-term experimentsPhase I (1–62 days) 190 220 — —Phase II (63–79 days) 190 220 41.20 0.10Phase III (80–95 days) 190 220 82.40 0.20Phase IV (96–106 days) 190 220 164.79 0.40Phase V (107–120 days) 190 220 329.59 0.80Recovery (121–140 days) 70 84 — —
Paper RSC Advances
Publ
ishe
d on
09
Sept
embe
r 20
16. D
ownl
oade
d by
Nor
thw
est A
gric
ultu
re a
nd F
ores
try
Uni
vers
ity o
n 12
/10/
2016
01:
55:4
0.
View Article Online
For long-term experiments, �900 mL of seeding sludge werederived from the initial SBR system and then cultivated in a newSBR system with a working volume of 2.6 L. The new SBR systemwas operated under the samemesophilic conditions withmineralmedium and trace element solution.1 The new anammox–SBRsystem was run in a 12 hour-cycle and fed with 190 mg L�1 NH4
+–
N and 220 mg L�1 NO2�–N. Because the anammox bacteria
tolerate to lower DO concentrations (<0.5 mg L�1) well and thedissolved oxygen (DO) in anammox–SBR system was consumedby some of the aerobic bacteria, the dissolved oxygen (DO) wasnot controlled in the anammox–SBR system. More specically,the dissolved oxygen (DO) was not controlled in any of the phases,and it measured 1.0–1.3 mg L�1 in the inuent and 0.08–0.3 mgL�1 in the effluent. Aer the adaptation stage, the experimentalbatches with different ratios of TOC/TN had values of 7.2mL, 14.4mL, 28.8 mL, and 57.6 mL (7.24 g TOC per L) mixed solution ofsodium acetate and propionate. These were added into thereactor automatically at the end of each feeding period to main-tain inuent TOC/TN ratios of 0.10, 0.20, 0.40, and 0.80 (Table 1).
2.2. DNA extraction, PCR amplication and Illumina MiSeqsequencing
Aer a start-up period, �0.5 g of anammox biomass wascollected from the SBR system at the end of each phase. Thengenomic DNA was extracted by using the FastDNA® SPIN Kit forSoil (Mp Biomedicals, Illkirch, France) according to the manu-facturer's protocols. DNA purity was checked in agarose gel(1.2%) and its concentration was determined with NanodropSpectrophotometer ND-1000 (Thermo Fisher Scientic, USA).
Before sequencing, genomic DNA was amplied by PCRusing primer sets 338F (50-barcode-ACTCCTACGGGAGGCAG-CAG-30) and 806R (50-barcode-GGACTACHVGGGTWTCTAAT-30)for the V3–V4 regions of the bacterial 16S rRNA. The ampli-cation reactions were performed in triplicate using the previ-ously described primers and protocols.26 Aer amplication,the PCR products were puried with the AxyPrep DNA
This journal is © The Royal Society of Chemistry 2016
Gel Extraction Kit (Axgen, USA) and quantied witha QuantiFluor™-ST (Promega, USA) according to the instruc-tions. Then the three individual PCR products were pooled inequimolar ratios and amplicon libraries were constructedbefore sequencing. Finally, the amplicon libraries wereprepared and then run on the MiSeq Illumina platform(Shanghai Personal Biotechnology Co., Ltd, Shanghai, China).All the raw sequences have been deposited into the NationalCenter for Biotechnology Information (NCBI) Sequence ReadArchive (SRA) database (Accession number: SRR2962328).
2.3. Sequence processing and bioinformatics analysis
Following sequencing, all the raw reads were initially mergedusing FLASH (Version 1.2.11, http://ccb.jhu.edu/soware/FLASH/) soware, and then Trimmomatic (Version 0.33,http://www.usadellab.org/cms/?page¼trimmomatic) was usedto remove barcodes, primers, and low quality reads. Aerltration, the remaining set of effective sequences were clus-tered into operational taxonomic units (OTUs) using Usearch(Version 8.1, http://drive5.com/uparse/) at a 97% similaritysetting. Then, the taxonomy was assigned using an RDP clas-sier (Version 2.2, http://sourceforge.net/projects/rdp-classier/) via Silva SSU database (Release 119, http://www.arb-silva.de)with a set condence threshold of 70%. Furthermore, appro-priate subsample depth analyzing was conducted to avoidunequal sampling depth biases during comparison of microbialdiversity and to ensure adequate sample depth while retainingthe lowest sequences.27 Subsequently, alpha diversity statisticsincluding Chao 1 estimator, ACE estimator, Shannon index,Simpson index, Good's coverage, and rarefaction curves ata distance of 0.03 (equivalent to 97% similarity), were calculatedfor ve samples using the Mothur program (Version 1.30.1,http://www.mothur.org/wiki/Main_Page).28 On the basis of theUniFrac metric, beta diversity statistics including cluster anal-ysis (CA), (un)weighted UniFrac distance metrics, and principalco-ordinates analysis (PCoA) were also conducted to evaluatethe similarities and differences of ve samples.
2.4. Quantitative real-time PCR
Compared with RNA-based techniques, DNA-basedmethods aremore robust alternative for measuring the total microbialgrowth rates and activity for the given environmental conditionsbecause they account for all active, dormant, and deceasedcells.29 Thus, quantitative real-time PCR, a DNA-based tech-nology, was used to explore the “key players” in the nitrogenremoval process and its quantitative molecular mechanism.The absolute abundance of bacteria 16S rRNA, anammox 16SrRNA, AOB amoA, AOA amoA, nosZ, nirS, nirK, narG, napA, andnrfA were quantied in triplicate by Mastercycler ep realplex(Eppendorf, Hamburg, Germany) based on the SYBR Green IImethod using the described primers and protocols.26 Theplasmids containing bacteria 16S rRNAs, anammox bacteria 16SrRNAs, Nitrobacter 16S rRNAs, Nitrospira 16S rRNAs and otherfunctional genes (i.e. amoA, nosZ, nirS, nirK, narG, napA, nrfA,mcrA, dsrA) were manufactured by Sangon Biological Tech-nology Company (Sangon Biological Engineering Co., China).
RSC Adv., 2016, 6, 87593–87606 | 87595

RSC Advances Paper
Publ
ishe
d on
09
Sept
embe
r 20
16. D
ownl
oade
d by
Nor
thw
est A
gric
ultu
re a
nd F
ores
try
Uni
vers
ity o
n 12
/10/
2016
01:
55:4
0.
View Article Online
To generate the standard curve, plasmid DNAs were dilutedto yield a series of concentrations, each with a 10-fold differ-ence. The efficiencies of the qPCR assays ranged from 102% to110%, and the R2 value for each standard curve line exceeded0.98. The Ct value (threshold cycle) was determined to quantifythe copy number of all of the above mentioned genes. The qPCRamplication was conducted in 10 mL reaction mixtures, con-sisting of 5 mL SYBR® Premix Ex Taq™ II (Takara, Japan), 0.25mL of each primer, 1 mL of genomic DNA and 3.5 mL dd H2O. Theprimers and qPCR protocols followed Shu et al.21 Each qPCRreaction was run in triplicate.
2.5. Statistical analysis
Analytical measurements of NH4+–N, NO2
�–N, NO3�–N, TN,
and TOC in inuent and effluent wastewater in the anammoxbioreactor were performed according to the standardmethods.30 The specic anammox activity and growth rates weremeasured, and the kinetic parameters were tted using thesecant method embedded in AQUASIM 2.1d.31
The ecological association between rates of nitrogen trans-formation and functional gene groups were evaluated via step-wise regression analyses (SPSS 20, USA). Furthermore, the directand indirect contribution of different functional gene groups onnitrogen transformation rates were determined using pathanalysis according to the methods described by Pang et al.32
Values of direct effects (path coefficients)33 were derived by thesimultaneous solution of the normal equations for multiplelinear regression using SPSS Statistics 20 (IBM, USA). Indirecteffects were obtained from simple correlation coefficientsbetween functional genes using SPSS Statistics 20 (IBM, USA)(http://www-01.ibm.com/soware/analytics/spss/).32
3. Results and discussion3.1. Short-term experiments and kinetics evaluation
To explore the specic anammox growth activity (SAA) andanammox growth rates (mAN) in eight batch tests at differentTOC/TN ratios, the rates of NH4
+–N consumption weremeasured and the kinetics were tted according to the AQUA-SIM 2.1d.31 As shown in Fig. 1, the kinetics matched well withthe corresponding experimental measurements. Generallyspeaking, with increased ratios of TOC/TN from 0.05 to 0.20, theevaluated mAN increased from 0.1093 d�1 to 0.1236 d�1 (Fig. 1a–c). The results revealed that appropriate TOC/TN ratios couldimprove the anammox activity. However, the mAN declined from0.1183 d�1 to 0.0926 d �1 when the TOC/TN ratios wereincreased from 0.41 to 0.82 (Fig. 1d–f). Compared with batchtest 1 (0.1102 d�1), the results indicated that the maximum mAN
(mAN max) was 0.1236 d�1 in the presence of a TOC/TN ratio of0.20, which was 10.8% higher than that observed in batch test 1.In addition, the mAN in batch test 5 and batch test 6 were alsohigher than batch test 1. Therefore, these results indicated that“Ca. Brocadia sinica” have tolerance to higher TOC stressconditions (TOC/TN > 0.20).
Additionally, the dependence of SAA and mAN on the differentTOC/TN stresses were well described by the substrate inhibition
87596 | RSC Adv., 2016, 6, 87593–87606
kinetics model. The results from Fig. 1g–h showed that 0.0524kg N per kg VSS per d and 0.1356 d�1 were the maximum SAA(SAAmax) and mAN max, respectively. The inhibition constants ofnitrite and TOC were 4.8651 mmol L�1 (122 mg N per L) and2.4762 mmol L�1 (196 mg L�1 TOC), respectively. Meanwhile,the 95% condence interval showed in Fig. 1g and h furtherindicate that the specic anammox growth rate under TOC/TNabiotic stresses could be described by eqn (1).
Kartal et al. found “Ca. Kuenenia stuttgartiensis” have theunique ability to use TOC as electron donors to reduce thenitrate and nitrite to ammonium.34 Winkler et al. also foundthat both “Ca. Brocadia fulgida” and “Ca. Anammoxoglobuspropionicus” were capable of oxidizing VFAs.10 Moreover, it wasfound that the appropriate inuent C/N ratio for this process is0.5 g COD per g NH4
+–N. Huang et al. found that “Ca. Jetteniaasiatica” have an organotrophic anammox nature and that theycould obtain high rates of NH4
+–N conversion at low COD : Nratios (<1.5).14 In addition, Du et al. found that anammoxbacteria could outcompete heterotrophic denitriers. In thisstudy, “Ca. Brocadia sinica” have higher rates of specicanammox growth and activity at TOC/TN ratios ranging from0.05 to 0.61. There are two possible explanations for this result.One is that “Ca. Brocadia sinica” oxidized the TOC to CO2 withnitrate and/or nitrite as the electron acceptor; the other is thatthe surplus TOC were consumed by heterotrophic microor-ganisms. These two possible explanations demanded explora-tion and either rejection or conrmation based on detailedevidence from long-term treatment performance and massbalance.
3.2. Treatment performance of organotrophic anammox andmass balance at different TOC/TN ratios
In order to evaluate the treatment proles of the organotrophicanammox process for nitrogen and TOC removal, a long-termexperiment was carried out over 140 days. As shown in Fig. 2,experiment was performed without the addition of TOC inphase I (1–62 days). During the phase I, the respective NH4
+–N,NO2
�–N, and total nitrogen removal (TN) efficiencies were 96.19� 2.52%, 99.85 � 0.46%, and 89.62 � 1.94%, respectively.Correspondingly, NH4
+–N, NO2�–N, and TN nitrogen trans-
formation rates reached at 0.36 � 0.01, 0.45 � 0.01, and 0.74 �0.02 kg N per m3 per d. The stoichiometric ratio of NH4
+–N,NO2
�–N, and NO3�–N were 1 : (1.24 � 0.04) : (0.20 � 0.03),
which was accordant with the theoretical values for the anam-mox process.1 During phase II (63–79 days), the NH4
+–Nremoval efficiencies slightly declined to 93.28 � 3.17% (Fig. 2).However, NO2
�–N and TN efficiencies increased to 100% and92.01 � 2.81%. The NH4
+–N, NO2�–N, and TN transformation
rates were 0.35 � 0.01, 0.45 � 0.02, and 0.76 � 0.03 kg N per m3
per d, respectively (Fig. 2). Nevertheless, the stoichiometricratios of NH4
+–N, NO2�–N, and NO3
�–N were changed to1 : (1.31 � 0.07) : (0.12 � 0.05). During phase III (80–95 days),the NO2
�–N and TN removal efficiencies did not vary signi-cantly. However, the NH4
+–N removal efficiency decreased to88.17 � 2.78%. In addition, the NH4
+–N transformation ratesdecreased to 0.33� 0.01 kg N perm3 per d. During phase IV (96–
This journal is © The Royal Society of Chemistry 2016

Fig. 1 (a)–(f) The kinetic fitted and measured NH4+–N consumption profiles in six 8 h batch tests under different TOC/TN ratios; (g) the actually
observed and model-fitted relationships between TOC/TN ratios and specific anammox activity using substrate inhibition kinetics; (h) rela-tionships between TOC/TN ratios and specific anammox growth rates.
Paper RSC Advances
Publ
ishe
d on
09
Sept
embe
r 20
16. D
ownl
oade
d by
Nor
thw
est A
gric
ultu
re a
nd F
ores
try
Uni
vers
ity o
n 12
/10/
2016
01:
55:4
0.
View Article Online
106 days), the NH4+–N and TN removal efficiencies dropped to
70.75 � 10.98% and 86.85 � 5.02%, respectively. The NH4+–N
transformation rates further decreased to (0.26 � 0.04) kg N perm3 per d. During phase V (96–106 days), the effluent NH4
+–Nlevels increased remarkably and the NH4
+–N and TN removalefficiencies decreased sharply to 10.23 � 6.74% and 60.23 �3.34%, respectively. In the recovery phase (120–140 days), theoperational strategy without TOC was performed. Because theanammox was seriously suppressed under high TOC/TN stress,the inuent NH4
+–N and NO2�–N levels were set at 70 and 84
mg L�1, respectively. Meanwhile, 10 mL high-loaded anammoxsludge from another anammox reactor was added at thebeginning of day 125.35 The results from Fig. 2a indicate thatthis type of high-loaded sludge could be benecial for the rapidrecovery of anammox activity.
In general, the results from the long-term treatmentperformance of assessment of the organotrophic anammoxsystem under different TOC/TN ratio conditions indicated that
This journal is © The Royal Society of Chemistry 2016
the autotrophic anammox process was the primary processaccounting for nitrogen removal in phases I–III, which wasconsistent with the results from the short-term experiment inthis study as well as the work of Tang et al.9 In addition, due tothe weakening of the anammox process in phase IV, thedecreased production of NO3
�–N indicated that organotrophicanammox and heterotrophic denitriers could coexist forpurposes of nitrogen removal. There are two reasons whichmay explain these results: (1) organotrophic anammoxbacteria could consume the acetate and propionate to reducethe nitrate and nitrite to ammonia;11,34 (2) heterotrophicdenitrication and denitritation could contribute to the TNremoval.
The severely inhibited anammox in phase V along withincreased NH4
+–N concentration and further decreased NO3�–
N effluent production indicate that autotrophic anammox couldnot outcompete heterotrophic microorganisms under highTOC/TN ratios. Moreover, it was found that lower ratios of TOC/
RSC Adv., 2016, 6, 87593–87606 | 87597
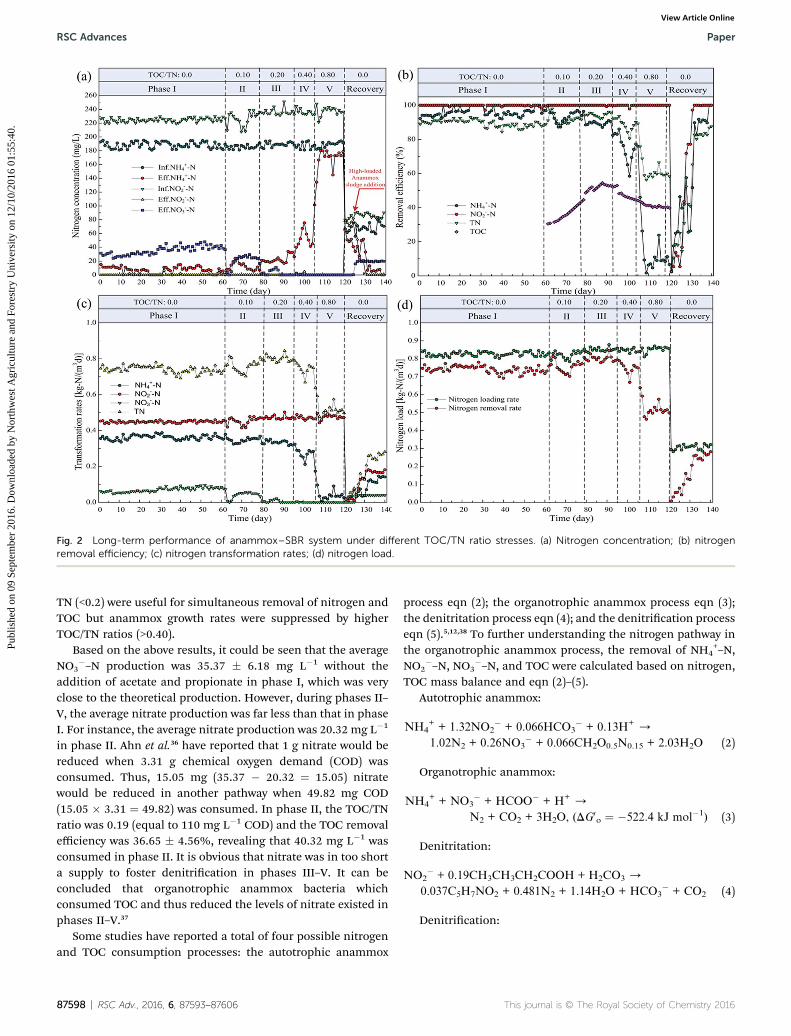
Fig. 2 Long-term performance of anammox–SBR system under different TOC/TN ratio stresses. (a) Nitrogen concentration; (b) nitrogenremoval efficiency; (c) nitrogen transformation rates; (d) nitrogen load.
RSC Advances Paper
Publ
ishe
d on
09
Sept
embe
r 20
16. D
ownl
oade
d by
Nor
thw
est A
gric
ultu
re a
nd F
ores
try
Uni
vers
ity o
n 12
/10/
2016
01:
55:4
0.
View Article Online
TN (<0.2) were useful for simultaneous removal of nitrogen andTOC but anammox growth rates were suppressed by higherTOC/TN ratios (>0.40).
Based on the above results, it could be seen that the averageNO3
�–N production was 35.37 � 6.18 mg L�1 without theaddition of acetate and propionate in phase I, which was veryclose to the theoretical production. However, during phases II–V, the average nitrate production was far less than that in phaseI. For instance, the average nitrate production was 20.32 mg L�1
in phase II. Ahn et al.36 have reported that 1 g nitrate would bereduced when 3.31 g chemical oxygen demand (COD) wasconsumed. Thus, 15.05 mg (35.37 � 20.32 ¼ 15.05) nitratewould be reduced in another pathway when 49.82 mg COD(15.05 � 3.31 ¼ 49.82) was consumed. In phase II, the TOC/TNratio was 0.19 (equal to 110 mg L�1 COD) and the TOC removalefficiency was 36.65 � 4.56%, revealing that 40.32 mg L�1 wasconsumed in phase II. It is obvious that nitrate was in too shorta supply to foster denitrication in phases III–V. It can beconcluded that organotrophic anammox bacteria whichconsumed TOC and thus reduced the levels of nitrate existed inphases II–V.37
Some studies have reported a total of four possible nitrogenand TOC consumption processes: the autotrophic anammox
87598 | RSC Adv., 2016, 6, 87593–87606
process eqn (2); the organotrophic anammox process eqn (3);the denitritation process eqn (4); and the denitrication processeqn (5).5,12,38 To further understanding the nitrogen pathway inthe organotrophic anammox process, the removal of NH4
+–N,NO2
�–N, NO3�–N, and TOC were calculated based on nitrogen,
TOC mass balance and eqn (2)–(5).Autotrophic anammox:
NH4+ + 1.32NO2
� + 0.066HCO3� + 0.13H+ /
1.02N2 + 0.26NO3� + 0.066CH2O0.5N0.15 + 2.03H2O (2)
Organotrophic anammox:
NH4+ + NO3
� + HCOO� + H+ /
N2 + CO2 + 3H2O, (DG0o ¼ �522.4 kJ mol�1) (3)
Denitritation:
NO2� + 0.19CH3CH3CH2COOH + H2CO3 /
0.037C5H7NO2 + 0.481N2 + 1.14H2O + HCO3� + CO2 (4)
Denitrication:
This journal is © The Royal Society of Chemistry 2016

Table 2 Contribution of different pathways to nitrogen removal on the basis of COD (Chemical oxygen demand) and nitrogen mass balance atdifferent TOC/TN ratios
Consumption Removal route Phase II Phase III Phase IV Phase V
NH4+–N removal (mg L�1) Anammox (autotrophic) 150.19 135.96 116.91 7.84
Anammox (organotrophic) 22.87 30.04 15.53 11.46NO2
�–N removal (mg L�1) Anammox (autotrophic) 198.25 179.47 154.32 10.35Denitritation 27.73 46.51 71.66 215.63
NO3�–N removal (mg L�1) Anammox (organotrophic) 22.87 30.04 15.53 11.46
Denitrication — — — —Biomass increased (mg N) Anammox (autotrophic) 9.91 8.97 7.72 0.52
Anammox (organotrophic) 0.75 0.99 0.51 0.38Denitritation 1.03 1.72 2.65 7.98
Total biomass increased (mg N) — 11.69 11.69 10.88 8.87Total nitrogen removal (mg L�1) — 378.72 400.27 367.5 256.95Average percentage of nitrogen removalroutes (%)
Anammox (autotrophic) 76.03 69.06 67.48 2.42Anammox (organotrophic) 11.88 14.76 8.31 8.77Denitritation 7.05 11.19 18.78 80.81Denitrication — — — —Other pathways 5.04 4.99 5.43 7.99
Paper RSC Advances
Publ
ishe
d on
09
Sept
embe
r 20
16. D
ownl
oade
d by
Nor
thw
est A
gric
ultu
re a
nd F
ores
try
Uni
vers
ity o
n 12
/10/
2016
01:
55:4
0.
View Article Online
NO3� + 0.29CH3CH3CH2COOH + H2CO3 /
0.034C5H7NO2 + 0.483N2 + 1.54H2O + HCO3� + 0.986CO2 (5)
As shown in Table 2, during phases II–V of the organotrophicanammox, only a small contribution to the overall nitrogenremoval was made. In general, as the TOC/TN ratio increasedfrom 0.10 to 0.80, the average nitrogen removal pathwaypercentage observed in the autotrophic anammox processdecreased from 76.03% (phase II) to 2.42% (phase V). Corre-spondingly, the heterotrophic denitritation contributionincreased from 7.05% (phase II) to 80.81% (phase V). Theseresults indicate that autotrophic anammox and organotrophicanammox could not outcompete heterotrophic denitricationat high TOC/TN ratios. This was because the growth rate of theheterotrophic denitrication process enjoys have much shorterdoubling times (2–16 hours), which renders the overall growthrate higher than that of anammox bacteria (8–12 days).12
Although the TOC/TN ratios were further increased, theorganotrophic anammox contribution rates of 11.88%, 14.76%,8.31%, and 8.77%, respectively, did not vary signicantly. Inter-estingly, the maximum organotrophic anammox contributionwas achieved at the TOC/TN ratio of 0.20. These results indicatedthat the organotrophic anammox activity had beenmaximized inthis TOC/TN ratio. Meanwhile, the organotrophic anammoxcould outcompete heterotrophic denitrication in phases II–III.The reason for these favorable results is that organotrophicanammox could utilize nitrate and nitrite as electron acceptors tooxidized acetate and propionate under these conditions. Othernitrogen pathways such as fermentation and sulfur-based auto-trophic denitrication varied from 5.04% to 7.99%.7
3.3. Quantication of nitrogen-related 16S rRNA andfunctional genes
In order to gain insight into the variation of nitrogen-relatedfunctional genes under TOC/TN stress conditions, samples ofanammox biomass were taken from the end of each phase and
This journal is © The Royal Society of Chemistry 2016
the copy numbers of all above mentioned 16S rRNA and func-tional genes were quantied. As shown in Fig. 3a–f, the genecopy numbers of bacterial 16S rRNAs were in the same order ofmagnitude in phases I–V. The gene copy numbers of anammox16S rRNAs were also in the same order of magnitude rangingfrom 2.50 � 108 to 4.07 � 108 copies per g wet sludge eventhough the anammox were severely suppressed, indicating thatthe abundance of anammox had no remarkable reduction in thesystem, which was consistent with the nding of Du et al.23 Itwas evident that higher TOC/TN ratios (>0.40) could result inthe community succession of anammox species in this study.
The copy numbers of three nitrication groups, including AOAamoA, AOB amoA and nxrA genes, were summarized in Fig. 3b.With the increase in TOC/TN ratios from 0–0.40 during phases I–IV, the absolute abundance of AOB amoA and nxrA graduallyincreased from 1.66 � 106 to 1.18 � 107 copies per g wet sludge,4.87 � 104 to 1.04 � 105 copies per g wet sludge, respectively.However, higher TOC/TN ratios in phase V had adverse effects onthese two genes, suggesting that the activity of AOB and NOB(nitrite oxidizing bacteria) have tolerate to TOC/TN ratios of 0.1–0.4 well. In addition, the absolute abundance of AOA amoAincreased from 1.11� 102 to 1.21� 102 copies per g wet sludge inphases III–V, suggesting that AOA had positive relationship withTOC. The results indicated that AOAmight have an organotrophicnature, which was consistent with the work of Mußmann et al.39
As illustrated in Fig. 3c, the dissimilatory nitrogen reductiongene nrfA increased from 2.02 � 104 to 6.95 � 105 copies per gwet sludge during phases I–V as the TOC/TN ratios increased.Kartal et al. found that some anammox bacteria species couldengage in “disguised denitrication” in the form of the reduc-tion of nitrate and nitrite (termed DNRA).34 As depicted inFig. 3f, the variation of nrfA/anammox and anammox/bacteriahad a high degree of consistency, indicating that DNRA ororganotrophic anammox had greatly contributed to nitrogenremoval in the organotrophic anammox process. In addition,Fig. 3c indicated that the absolute gene abundance of napAincreased in phases I–IV, while it decreased in phase V. As
RSC Adv., 2016, 6, 87593–87606 | 87599

Fig. 3 Absolute abundance of microbial communities and functional genes in the anammox–SBR system. (a) Total bacterial and anammoxbacterial 16S rRNA; (b) AOA amoA, AOB amoA, and nxrA; (c) napA, narG, and nrfA; (d) nirK, nirS, and nosZ; (e)mcrA and dsrA; (f) ratios of differentfunctional gene groups. Error bars represent standard deviation calculated from three independent experiments.
RSC Advances Paper
Publ
ishe
d on
09
Sept
embe
r 20
16. D
ownl
oade
d by
Nor
thw
est A
gric
ultu
re a
nd F
ores
try
Uni
vers
ity o
n 12
/10/
2016
01:
55:4
0.
View Article Online
compared to the napA gene, the absolute gene abundance of thenarG gene in phases I–III was nearly one to two orders ofmagnitude higher than in phases IV–V. The conversion of NO3
�
/NO2� is catalyzed by the napA and narG genes. Therefore, the
results indicated that high TOC/TN ratios in phase IV–V had nosignicant inuence on the rates of NO3
�–N reduction.As shown in Fig. 3d, the absolute abundance of nirS in phase IV
was nearly one order of magnitude greater than other four phases.The absolute abundance of the nirK gene in phases I–IV was nearlythe same order of magnitude, while it slightly decreased in phaseV. The absolute abundance of the nosZ gene increased from 2.28�104 to 6.59� 105 copies per g wet sludge during phases I–V as theTOC/TN ratios increased. These results showed that the absoluteabundance of denitrication genes did not vary dramatically,suggesting that denitrication was not dominant processaccounting for nitrogen removal under the different TOC/TNstress conditions; this was accordant with the results of Table 2.
Furthermore, as shown in Fig. 3e, the absolute abundance ofthe mcrA gene increased gradually during phases I–IV, while itdecreased in phase V. In terms of the dsrA gene, copy numbersincreased from 4.14 � 103 to 2.98 � 105 copies per g wet sludge.Notably, as illustrated in phases IV–V, methanogens couldcompete with sulfate reduction bacteria for the TOC.
Taken together, it is plausible that the co-existence of auto-trophic anammox, organotrophic anammox (or DNRA), anddenitritation were the primary pathway that accounted fornitrogen removal under TOC/TN stress conditions.
3.4. Functional gene groups determining nitrogentransformation rates
In this study, single functional genes and functional gene groupratios were used as input variables and introduced into stepwise
87600 | RSC Adv., 2016, 6, 87593–87606
regression analyses. Results showed nitrogen transformation inphases I–II differed from that in phases III–V. Therefore, the keyfunctional groups in phases I–II and in phases III–V wereseparately investigated to characterize the nitrogen trans-formation pathway under different TOC/TN stress conditions.
As shown in Table 3, (AOA amoA + AOB amoA + anammox + nrfA)/bacteria, nrfA/(narG + napA), and nrfAwere the key factors for NH4
+–
N transformation in phases I–V. The variable, (AOA amoA + AOBamoA + anammox + nrfA)/bacteria showed a positive relationshipwith NH4
+–N transformation in phases I–II. The AOA amoA andAOB amoA genes are oen regarded as NH4
+–N to NO2�–N oxida-
tion markers, and nrfA is oen regarded as a NO3�–N to NH4
+–Nreduction makers.24 Thus, results showed that the coupling ofpartial nitrication, anammox, and DNRA was involved in NH4
+–Nconversion. The nrfA/(narG + napA) group was the key functionalgroup for NO3
�–N consumption in phases III–V. Both narG andnapA were regarded as marker genes for NO3
�–N to NO2�–N in the
rst denitrication step. Hence, nrfA/(narG + napA) and nrfAdenoted NO3
�–N reduction, showing a positive relationship anda negative relationship with NH4
+–N conversion, respectively. Thisresult suggested that dissimilatory nitrate reduction to ammoniumaffected NH4
+–N conversion in phases III–V.The NO2
�–N transformation rates were jointly determinedby anammox/bacteria, nirK, and AOB amoA/(nxrA + anammox +nirK + nirS) in phases I–V. The variable anammox/bacteria in theNO2
�–N equation which was denoted NO2�–N consumption
showed a positive relationship with NO2�–N transformation in
phases I–II. The results suggested that anammox were theprimary NO2
�–N removal pathway under low TOC/TN ratios(#0.10). The variable nirK genes were regarded as marker genesfor NO2
�–N to NO in the denitritation step, showing a positivecorrelation with NO2
�–N conversion. The variable AOB amoA/
This journal is © The Royal Society of Chemistry 2016
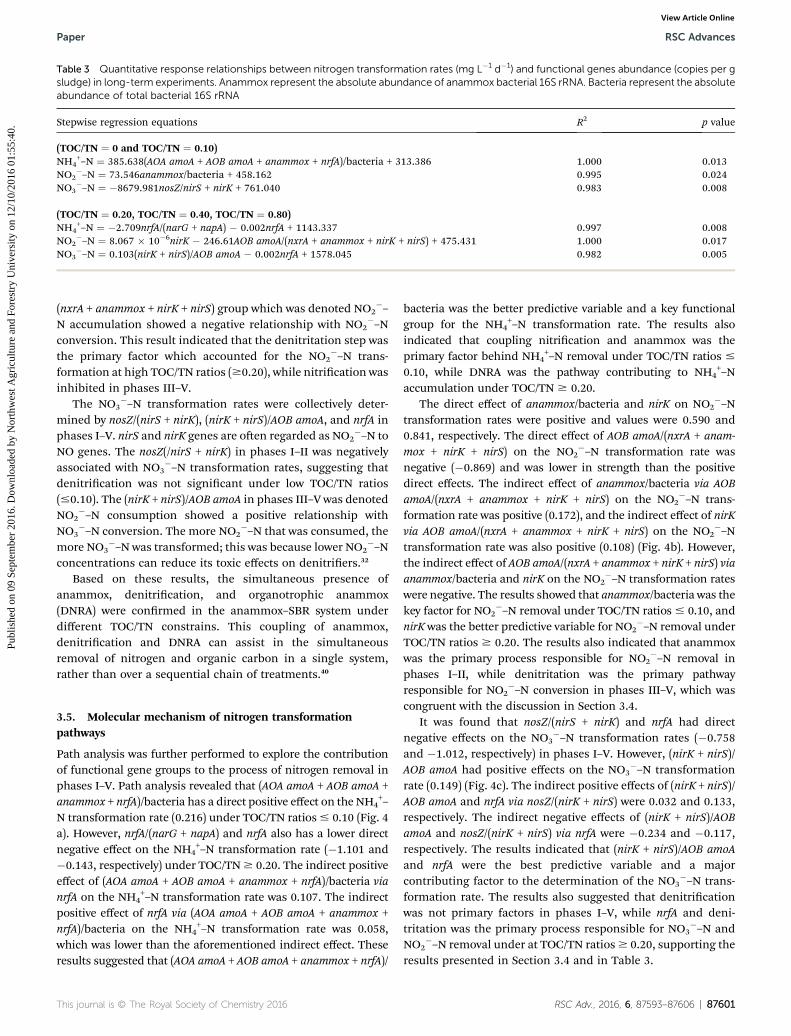
Table 3 Quantitative response relationships between nitrogen transformation rates (mg L�1 d�1) and functional genes abundance (copies per gsludge) in long-term experiments. Anammox represent the absolute abundance of anammox bacterial 16S rRNA. Bacteria represent the absoluteabundance of total bacterial 16S rRNA
Stepwise regression equations R2 p value
(TOC/TN ¼ 0 and TOC/TN ¼ 0.10)NH4
+–N ¼ 385.638(AOA amoA + AOB amoA + anammox + nrfA)/bacteria + 313.386 1.000 0.013NO2
�–N ¼ 73.546anammox/bacteria + 458.162 0.995 0.024NO3
�–N ¼ �8679.981nosZ/nirS + nirK + 761.040 0.983 0.008
(TOC/TN ¼ 0.20, TOC/TN ¼ 0.40, TOC/TN ¼ 0.80)NH4
+–N ¼ �2.709nrfA/(narG + napA) � 0.002nrfA + 1143.337 0.997 0.008NO2
�–N ¼ 8.067 � 10�6nirK � 246.61AOB amoA/(nxrA + anammox + nirK + nirS) + 475.431 1.000 0.017NO3
�–N ¼ 0.103(nirK + nirS)/AOB amoA � 0.002nrfA + 1578.045 0.982 0.005
Paper RSC Advances
Publ
ishe
d on
09
Sept
embe
r 20
16. D
ownl
oade
d by
Nor
thw
est A
gric
ultu
re a
nd F
ores
try
Uni
vers
ity o
n 12
/10/
2016
01:
55:4
0.
View Article Online
(nxrA + anammox + nirK + nirS) group which was denoted NO2�–
N accumulation showed a negative relationship with NO2�–N
conversion. This result indicated that the denitritation step wasthe primary factor which accounted for the NO2
�–N trans-formation at high TOC/TN ratios ($0.20), while nitrication wasinhibited in phases III–V.
The NO3�–N transformation rates were collectively deter-
mined by nosZ/(nirS + nirK), (nirK + nirS)/AOB amoA, and nrfA inphases I–V. nirS and nirK genes are oen regarded as NO2
�–N toNO genes. The nosZ(/nirS + nirK) in phases I–II was negativelyassociated with NO3
�–N transformation rates, suggesting thatdenitrication was not signicant under low TOC/TN ratios(#0.10). The (nirK + nirS)/AOB amoA in phases III–V was denotedNO2
�–N consumption showed a positive relationship withNO3
�–N conversion. The more NO2�–N that was consumed, the
more NO3�–N was transformed; this was because lower NO2
�–Nconcentrations can reduce its toxic effects on denitriers.32
Based on these results, the simultaneous presence ofanammox, denitrication, and organotrophic anammox(DNRA) were conrmed in the anammox–SBR system underdifferent TOC/TN constrains. This coupling of anammox,denitrication and DNRA can assist in the simultaneousremoval of nitrogen and organic carbon in a single system,rather than over a sequential chain of treatments.40
3.5. Molecular mechanism of nitrogen transformationpathways
Path analysis was further performed to explore the contributionof functional gene groups to the process of nitrogen removal inphases I–V. Path analysis revealed that (AOA amoA + AOB amoA +anammox + nrfA)/bacteria has a direct positive effect on the NH4
+–
N transformation rate (0.216) under TOC/TN ratios# 0.10 (Fig. 4a). However, nrfA/(narG + napA) and nrfA also has a lower directnegative effect on the NH4
+–N transformation rate (�1.101 and�0.143, respectively) under TOC/TN$ 0.20. The indirect positiveeffect of (AOA amoA + AOB amoA + anammox + nrfA)/bacteria vianrfA on the NH4
+–N transformation rate was 0.107. The indirectpositive effect of nrfA via (AOA amoA + AOB amoA + anammox +nrfA)/bacteria on the NH4
+–N transformation rate was 0.058,which was lower than the aforementioned indirect effect. Theseresults suggested that (AOA amoA + AOB amoA + anammox + nrfA)/
This journal is © The Royal Society of Chemistry 2016
bacteria was the better predictive variable and a key functionalgroup for the NH4
+–N transformation rate. The results alsoindicated that coupling nitrication and anammox was theprimary factor behind NH4
+–N removal under TOC/TN ratios #0.10, while DNRA was the pathway contributing to NH4
+–Naccumulation under TOC/TN $ 0.20.
The direct effect of anammox/bacteria and nirK on NO2�–N
transformation rates were positive and values were 0.590 and0.841, respectively. The direct effect of AOB amoA/(nxrA + anam-mox + nirK + nirS) on the NO2
�–N transformation rate wasnegative (�0.869) and was lower in strength than the positivedirect effects. The indirect effect of anammox/bacteria via AOBamoA/(nxrA + anammox + nirK + nirS) on the NO2
�–N trans-formation rate was positive (0.172), and the indirect effect of nirKvia AOB amoA/(nxrA + anammox + nirK + nirS) on the NO2
�–Ntransformation rate was also positive (0.108) (Fig. 4b). However,the indirect effect of AOB amoA/(nxrA + anammox + nirK + nirS) viaanammox/bacteria and nirK on the NO2
�–N transformation rateswere negative. The results showed that anammox/bacteria was thekey factor for NO2
�–N removal under TOC/TN ratios # 0.10, andnirK was the better predictive variable for NO2
�–N removal underTOC/TN ratios $ 0.20. The results also indicated that anammoxwas the primary process responsible for NO2
�–N removal inphases I–II, while denitritation was the primary pathwayresponsible for NO2
�–N conversion in phases III–V, which wascongruent with the discussion in Section 3.4.
It was found that nosZ/(nirS + nirK) and nrfA had directnegative effects on the NO3
�–N transformation rates (�0.758and �1.012, respectively) in phases I–V. However, (nirK + nirS)/AOB amoA had positive effects on the NO3
�–N transformationrate (0.149) (Fig. 4c). The indirect positive effects of (nirK + nirS)/AOB amoA and nrfA via nosZ/(nirK + nirS) were 0.032 and 0.133,respectively. The indirect negative effects of (nirK + nirS)/AOBamoA and nosZ/(nirK + nirS) via nrfA were �0.234 and �0.117,respectively. The results indicated that (nirK + nirS)/AOB amoAand nrfA were the best predictive variable and a majorcontributing factor to the determination of the NO3
�–N trans-formation rate. The results also suggested that denitricationwas not primary factors in phases I–V, while nrfA and deni-tritation was the primary process responsible for NO3
�–N andNO2
�–N removal under at TOC/TN ratios$ 0.20, supporting theresults presented in Section 3.4 and in Table 3.
RSC Adv., 2016, 6, 87593–87606 | 87601
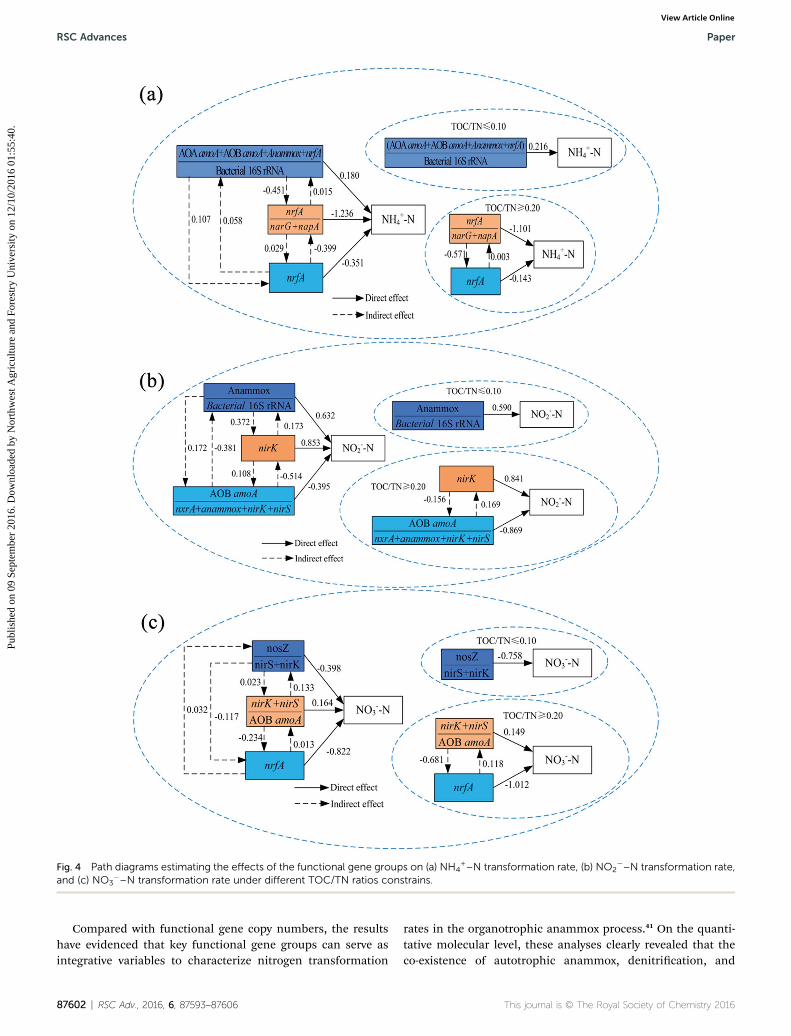
Fig. 4 Path diagrams estimating the effects of the functional gene groups on (a) NH4+–N transformation rate, (b) NO2
�–N transformation rate,and (c) NO3
�–N transformation rate under different TOC/TN ratios constrains.
RSC Advances Paper
Publ
ishe
d on
09
Sept
embe
r 20
16. D
ownl
oade
d by
Nor
thw
est A
gric
ultu
re a
nd F
ores
try
Uni
vers
ity o
n 12
/10/
2016
01:
55:4
0.
View Article Online
Compared with functional gene copy numbers, the resultshave evidenced that key functional gene groups can serve asintegrative variables to characterize nitrogen transformation
87602 | RSC Adv., 2016, 6, 87593–87606
rates in the organotrophic anammox process.41 On the quanti-tative molecular level, these analyses clearly revealed that theco-existence of autotrophic anammox, denitrication, and
This journal is © The Royal Society of Chemistry 2016

Paper RSC Advances
Publ
ishe
d on
09
Sept
embe
r 20
16. D
ownl
oade
d by
Nor
thw
est A
gric
ultu
re a
nd F
ores
try
Uni
vers
ity o
n 12
/10/
2016
01:
55:4
0.
View Article Online
DNRA (organotrophic anammox) could useful for simultaneousnitrogen and TOC removal within the organotrophic niche.
3.6. Dynamics of bacterial communities and functionalgeneralists
In this study, MiSeq sequencing was applied to investigate thedynamics of microbial communities and functional generalistsin the organotrophic anammox process. Aer the ltration ofraw sequences, 14 505–21 586 effective reads were obtained
Fig. 5 Distribution of phyla in the different phase based on the taxonomyof each ribbon represents the abundance of each taxon. The absolute tistand for the reads abundances and relative abundance of each taxon,visualized using Circos (Version 0.67, http://circos.ca/).
This journal is © The Royal Society of Chemistry 2016
from ve samples. As shown in Table S2,† OTUs were in therange of 1112–1750, and increased in phases II–V as the TOC/TN ratio increased. Two estimators, which were Good'scoverage and Simpson, showed unremarkable variation.However, Shannon, Chao 1, and ACE estimators varied signi-cantly. These results indicated that TOC/TN stresses did notsignicantly effect the richness of the bacteria in the system,while they could signicantly promote the diversity of relatedbacteria in the organotrophic anammox process. The
annotation from SILVA SSU database using RDP classifier. The thicknessck above the inner segment and relative tick above the outer segmentrespectively. Others refer to those unclassified reads. The data were
RSC Adv., 2016, 6, 87593–87606 | 87603

RSC Advances Paper
Publ
ishe
d on
09
Sept
embe
r 20
16. D
ownl
oade
d by
Nor
thw
est A
gric
ultu
re a
nd F
ores
try
Uni
vers
ity o
n 12
/10/
2016
01:
55:4
0.
View Article Online
rarefaction curves of ve samples were also drawn in Fig. S1.†Results showed that the rarefaction curves did not reacha plateau in all phases, indicating that rare species couldcontinue to emerge when the sequence depth exceed 14 000. Asdisplayed in Fig. S2,† ve samples belonged to four groups,indicating that lower TOC/TN ratios (<0.2) did not signicantlyinuence microbial diversity.
In this study, effective sequences were assigned to phyla,class, order, family, and genera using RDP classier via SilvaSSU database. As shown in Fig. 5, a total of 15 bacterial phylawere identied. Planctomycetes was the most dominant phylumin all phases, accounting for 23.40–37.83% (averaging 31.25%).The other dominant phyla were Proteobacteria (11.45–36.92%,averaging 22.22%), Chloroexi (1.95–28.91%, averaging17.93%), and Chlorobi (3.54–14.01%, averaging 11.78%).Previous studies have reported that Proteobacteria, Chloroexiand Planctomycetes were the signicant phyla in the nitritation–anammox system.42 Fig. 5 clearly showed that Planctomyceteswas more abundant than Proteobacteria, Chloroexi, andChlorobi, suggesting that Planctomycetes played the dominantrole for nitrogen removal. In addition, as TOC/TN ratiosincreased from 0 to 0.20, the percentage of Planctomycetesincreased from 28.48% to 37.83%. Then, it decreased to 29.59%as the TOC/TN ratio increased to 1.5%. The results indicatedthat Planctomycetes had higher tolerance for TOC/TN stresses,and that the appropriate addition of acetate and propionate wasmore favorable to enriching organotrophic anammox bacteriaspecies in the phyla of Planctomycetes; these ndings wereconsistent with the results reported in Section 3.1.
Fig. 6 The relative abundance of total 9 functional genera in five sampl
87604 | RSC Adv., 2016, 6, 87593–87606
Notably, among Proteobacteria, b-Proteobacteria was the mostdominant in all phases, followed by a-Proteobacteria, g-Proteo-bacteria, d-Proteobacteria, and 3-Proteobacteria (Fig. S3a†).Beside the class, the results from Fig. S3b and c† showed thatthe following major orders, namely Ignavibacteriales, Clos-tridiales, Phycisphaerales, Brocadiales, Rhodobacterales, andRhodocyclales, and their corresponding families were shared byve phases, suggesting that these dominant populations playedpivotal roles for nitrogen removal in the system.
As shown in Fig. S3d,† a total of 144 genera were assignedand 27 of themwere dominant genera. Meanwhile, these generawere identied as belonging to 8 functional groups (Fig. 6).Among them, the anammox group involved “Ca. Brocadia sin-ica”, “Ca. Jettenia asiatica”, and “Ca. Kuenenia stuttgartiensis”.The relative abundance of “Ca. Brocadia sinica” were 4.32%,4.43%, 4.73%, 5.3%, and 3.44%, respectively. Compared with“Ca. Brocadia sinica”, the relative abundance of “Ca. Jetteniaasiatica” and “Ca. Kuenenia stuttgartiensis” were not detected inthe phase I. These results indicated that “Ca. Brocadia sinica”was the dominant anammox bacteria species in the autotrophicsystem. With the addition of volatile fatty acids, the quantity of“Ca. Brocadia sinica” decreased. This was due to the ability of“Ca. Brocadia sinica” to oxidize volatile fatty acids.34 Duringphases II–III, the percentage of “Ca. Jettenia asiatica” increasedfrom 4.02% to 4.12%, while it decreased signicantly in phaseV. “Ca. Kuenenia stuttgartiensis” was detected at the lower TOC/TN ratio and decreased remarkably in phases IV and V.However, the quantity of “Ca. Kuenenia stuttgartiensis”increased from 3.01% to 3.67% with the further increased in the
es.
This journal is © The Royal Society of Chemistry 2016

Paper RSC Advances
Publ
ishe
d on
09
Sept
embe
r 20
16. D
ownl
oade
d by
Nor
thw
est A
gric
ultu
re a
nd F
ores
try
Uni
vers
ity o
n 12
/10/
2016
01:
55:4
0.
View Article Online
TOC/TN ratio from 0.4 to 0.8. This was due to the K-strategysurvival ability of “Ca. Kuenenia stuttgartiensis”,43 whichprefers this strategy to low TOC conditions. However, “Ca.Kuenenia stuttgartiensis”was able to adapt to a higher TOC nicheduring the long-term acclimation. The appearance of “Ca. Jet-tenia asiatica” and “Ca. Kuenenia stuttgartiensis” in phases II–Vresulted in a lack of signicant variation in the anammox copynumbers despite suppression of the nitrogen removal activity inphase V.
Based on the results from the nitrogen treatment perfor-mance and MiSeq sequencing, it can be concluded that orga-notrophic anammox bacteria species have the capacity tooxidize acetate and propionate. In addition, “Ca. Brocadia sin-ica”, “Ca. Jettenia asiatica”, and “Ca. Kuenenia stuttgartiensis”have an organotrophic nature under the appropriate TOC/TNstress conditions. Furthermore, it was evident that higherTOC/TN ratios (>0.40) could result in the community successionof anammox species and alter the character of the microbialcommunities observed in this study.
4. Conclusion
Short- and long-term experiments revealed that the appropriateTOC/TN ratios enabled the maximum growth rate of theanammox to increase to 0.1356 d�1. TOC biomass balancerevealed that organotrophic anammox accounted for 14.76% ofthe nitrogen loss at a TOC/TN ratio of 0.20. Quantitativemolecular analyses and pathway results conrmed that thecoupling of anammox, DNRA, and denitrication was pivotal tothe nitrogen transformation pathway in the organotrophicanammox process. MiSeq sequencing indicated that Plancto-mycetes, Proteobacteria, Chloroexi, and Chlorobi were the mostabundant phyla in the system. Furthermore, “Ca. Brocadia sin-ica” had tolerance to higher TOC stress conditions, and singleenvironmental factors such as TOC/TN ratios could lead tomicrobial succession between “Ca. Brocadia sinica”, “Ca. Jet-tenia asiatica”, and “Ca. Kuenenia stuttgartiensis”. However, thequantitative molecular mechanism of the organotrophicanammox process in the anammox–SBR system needs furtherstudy using 13C-labeled DNA/RNA-SIP techniques. Moreover,the molecular mechanism for microbial succession between“Ca. Kuenenia stuttgartiensis”, “Ca. Jettenia asiatica”, and “Ca.Kuenenia stuttgartiensis” should also be further explored usingmetagenomic and metatranscriptomic approaches.
Acknowledgements
This study was nancially supported by the National NaturalScience Foundation of China (51308453) and the Science &Technology Innovation Program of Shaanxi Province(2011KTZB03-03-01).
References
1 A. A. Van de Graaf, P. de Bruijn, L. A. Robertson, M. S. Jettenand J. G. Kuenen, Microbiology, 1996, 142, 2187–2196.
This journal is © The Royal Society of Chemistry 2016
2 M. Strous, J. G. Kuenen and M. S. Jetten, Appl. Environ.Microbiol., 1999, 65, 3248–3250.
3 J. Guo, Y. Peng, L. Fan, L. Zhang, B. J. Ni, B. Kartal, X. Feng,M. S. Jetten and Z. Yuan, Environ. Microbiol., 2015, 16, 1–15.
4 T. Lotti, R. Kleerebezem, C. van Erp Taalman Kip,T. L. Hendrickx, J. Kruit, M. Hoekstra and M. C. vanLoosdrecht, Environ. Sci. Technol., 2014, 48, 7874–7880.
5 B. Kartal, N. M. Almeida, W. J. Maalcke, H. J. Camp,M. S. Jetten and J. T. Keltjens, FEMS Microbiol. Rev., 2013,1–34.
6 S. Jenni, S. E. Vlaeminck, E. Morgenroth and K. M. Udert,Water Res., 2014, 49, 316–326.
7 C. Chen, X. Huang, C. Lei, T. C. Zhang and W. Wu, Bioresour.Technol., 2013, 148, 172–179.
8 S.-Q. Ni, J.-Y. Ni, D.-L. Hu and S. Sung, Bioresour. Technol.,2012, 110, 701–705.
9 C.-j. Tang, P. Zheng, C.-h. Wang and Q. Mahmood, Bioresour.Technol., 2010, 101, 1762–1768.
10 M. K. H. Winkler, J. Yang, R. Kleerebezem, E. Plaza, J. Trela,B. Hultman and M. C. M. van Loosdrecht, Bioresour.Technol., 2012, 114, 217–223.
11 B. Kartal, J. Rattray, L. A. van Nirik, J. van de Vossenberg,M. C. Schmid, R. I. Webb, S. Schouten, J. A. Fuerst,J. S. Damste and M. S. Jetten, Syst. Appl. Microbiol., 2007,30, 39–49.
12 J. G. Kuenen, Nat. Rev. Microbiol., 2008, 6, 320–326.13 B. Kartal, L. van Nirik, J. T. Keltjens, H. J. Op den Camp and
M. S. Jetten, Adv. Microb. Physiol., 2012, 60, 212.14 X.-L. Huang, D.-W. Gao, Y. Tao and X.-L. Wang, Chem. Eng. J.,
2014, 253, 402–407.15 B. Kartal, L. Van Nirik, J. Rattray, J. L. Van De Vossenberg,
M. C. Schmid, J. S. Damste, M. S. Jetten and M. Strous, FEMSMicrobiol. Ecol., 2008, 63, 46–55.
16 H. Kamyab, M. F. M. Din, S. K. Ghoshal, C. T. Lee,A. Keyvanfar, A. A. Bavafa, S. Rezania and J. S. Lim, WasteBiomass Valorization, 2016, 1–10.
17 H. Kamyab, M. F. M. Din, S. E. Hosseini, S. K. Ghoshal,V. Ashokkumar, A. Keyvanfar, A. Shafaghat, C. T. Lee,A. Asghar Bavafa and M. Z. A. Majid, Clean Technol.Environ. Policy, 2016, 1–11.
18 H. Kamyab, M. F. M. Din, A. Keyvanfar, M. Z. A. Majid,A. Talaiekhozani, A. Shafaghat, C. T. Lee, L. J. Shiun andH. H. Ismail, Energy Procedia, 2015, 75, 2400–2408.
19 T. Zhang, M.-F. Shao and L. Ye, ISME J., 2011, 6, 1137–1147.20 E. Isanta, T. Bezerra, I. Fernandez, M. E. Suarez-Ojeda,
J. Perez and J. Carrera, Bioresour. Technol., 2015, 181, 207–213.
21 D. Shu, Y. He, H. Yue, L. Zhu and Q. Wang, Bioresour.Technol., 2015, 196, 621–633.
22 T. Lotti, R. Kleerebezem, Z. Hu, B. Kartal, M. Jetten andM. van Loosdrecht, Water Res., 2014, 66, 111–121.
23 R. Du, Y. Peng, S. Cao, C. Wu, D. Weng, S. Wang and J. He,Bioresour. Technol., 2014, 162, 316–322.
24 W. Zhi, L. Yuan, G. Ji and C. He, Environ. Sci. Technol., 2015,49, 4575–4583.
25 C.-J. Tang, P. Zheng, L.-Y. Chai and X.-B. Min, Chem. Eng. J.,2013, 230, 149–157.
RSC Adv., 2016, 6, 87593–87606 | 87605

RSC Advances Paper
Publ
ishe
d on
09
Sept
embe
r 20
16. D
ownl
oade
d by
Nor
thw
est A
gric
ultu
re a
nd F
ores
try
Uni
vers
ity o
n 12
/10/
2016
01:
55:4
0.
View Article Online
26 D. Shu, Y. He, H. Yue and Q. Wang, Chem. Eng. J., 2016, 290,21–30.
27 C. K. Lee, C. W. Herbold, S. W. Polson, K. E. Wommack,S. J. Williamson, I. R. McDonald and S. C. Cary, PLoS One,2012, 7, e44244.
28 P. D. Schloss, S. L. Westcott, T. Ryabin, J. R. Hall,M. Hartmann, E. B. Hollister, R. A. Lesniewski,B. B. Oakley, D. H. Parks and C. J. Robinson, Appl. Environ.Microbiol., 2009, 75, 7537–7541.
29 S. J. Blazewicz, R. L. Barnard, R. A. Daly and M. K. Firestone,ISME J., 2013, 7, 2061–2068.
30 E. W. Rice, L. Bridgewater and A. P. H. Association, Standardmethods for the examination of water and wastewater,American Public Health Association, Washington, DC, 2012.
31 P. Reichert, Aquasim 2.0-user manual, computer program forthe identication and simulation of aquatic systems, SwissFederal Institute for Environmental Science andTechnology (EAWAG), 1998, p. 219.
32 Y. Pang, Y. Zhang, X. Yan and G. Ji, Environ. Sci. Technol.,2015, 49, 13550–13557.
33 D. F. Alwin and R. M. Hauser, Am. Sociol. Rev., 1975, 37–47.
87606 | RSC Adv., 2016, 6, 87593–87606
34 B. Kartal, M. M. Kuypers, G. Lavik, J. Schalk, H. J. Op denCamp, M. S. Jetten and M. Strous, Environ. Microbiol.,2007, 9, 635–642.
35 C.-J. Tang, P. Zheng, T.-T. Chen, J.-Q. Zhang, Q. Mahmood,S. Ding, X.-G. Chen, J.-W. Chen and D.-T. Wu, Water Res.,2011, 45, 201–210.
36 Y. Ahn, I. Hwang and K. Min, Water Sci. Technol., 2004, 49,145–153.
37 Y. Liang, D. Li, X. Zhang, H. Zeng, Y. Yang and J. Zhang,Bioresour. Technol., 2015, 193, 408–414.
38 Y.-H. Ahn, Process Biochem., 2006, 41, 1709–1721.39 M. Mußmann, I. Brito, A. Pitcher, J. S. S. Damste,
R. Hatzenpichler, A. Richter, J. L. Nielsen, P. H. Nielsen,A. Muller and H. Daims, Proc. Natl. Acad. Sci. U. S. A., 2011,108, 16771–16776.
40 G. D. Song, S. M. Liu, H. Marchant, M. M. M. Kuypers andG. Lavik, Biogeosciences, 2013, 10, 6851–6864.
41 G. Ji, C. He and Y. Tan, Ecol. Eng., 2013, 55, 35–42.42 Z.-r. Chu, K. Wang, X.-k. Li, M.-t. Zhu, L. Yang and J. Zhang,
Chem. Eng. J., 2015, 262, 41–48.43 W. R. Van der Star, W. R. Abma, D. Blommers, J.-W. Mulder,
T. Tokutomi, M. Strous, C. Picioreanu and M. VanLoosdrecht, Water Res., 2007, 41, 4149–4163.
This journal is © The Royal Society of Chemistry 2016