enhanced ion chromatographic speciation of water-soluble ... · enhanced ion chromatographic...
TRANSCRIPT
ORIGINAL PAPER
Enhanced Ion Chromatographic Speciation of Water-SolublePM2:5 to Improve Aerosol Source Apportionment
Judith C. Chow1,2• John G. Watson1,2
Received: 21 December 2016 / Revised: 10 February 2017 / Accepted: 21 February 2017 / Published online: 3 April 2017
� Institute of Earth Environment, Chinese Academy Sciences 2017
Abstract Ion chromatography (IC) is widely used to
quantify sulfate, nitrate, ammonium, sodium, chloride, and
potassium from PM2:5 water extracts. IC hardware and
software have progressed to allow a broader range of
water-soluble compounds to be determined for the existing
anion and cation programs and on the same solutions using
analytical column, eluent, and detector modifications.
Alkylamine, organic acid, and carbohydrate quantification
by IC expands the number of source markers, especially for
different types of biomass burning and secondary organic
aerosols. Although modern systems are highly automated,
internal quality control (QC) and external quality assurance
(QA) programs are essential. QC includes detailed standard
operating procedures, calibration over the range of expec-
ted concentrations, performance tests with independent
standards, inspection of filters and chromatograms, and
anion/cation balances. QA consists of independent system
and performance audits, analysis of externally prepared
performance samples, and interlaboratory comparisons.
The additional water-soluble species provide compounds
for speciated emission inventories, source markers to refine
aerosol source apportionment, and increased understanding
of global carbon, sulfur, and nitrogen cycles.
Keywords Ion � Ion exchange chromatography � Anions �Cations � Organic acids � Carbohydrates � Source markers �Receptor model � Source apportionment.
Introduction
Measurements of PM2:5 (particulate matter with aerody-
namic diameter less than 2.5 micrometers) elements, ions,
and carbon fractions in chemical speciation networks are
necessary, but not sufficient, for identifying and quantify-
ing modern source contributions (Chow and Watson 2013;
Watson and Chow 2013, 2015; Watson et al. 2016). Many
elemental source markers are being eliminated from
emission streams owing to their toxicity. As these primary
PM emissions decrease, secondary organic aerosols
(SOAs) are increasing in importance (Donahue 2013).
Many of the SOA compounds absorb light at shorter (\600
nm) wavelengths, thereby affecting the Earth’s radiation
balance as Brown Carbon (BrC) (Laskin et al. 2015). The
broad diversity of biomass fuels and burning conditions
(Chakrabarty 2016), especially in countries outside of
North America and Europe, require more specific markers
to better determine control strategies. Peat burning, a
common Asian combustion source (Wang et al. 2004), is
poorly studied, even though it may have an important
effect on the global carbon (Turetsky et al. 2015) and
nitrogen (Galloway et al. 2004) cycles.
Watson et al. (2016) identify several proven analytical
methods that can be applied to samples already acquired in
PM speciation networks (Dabek-Zlotorzynska 2011;
IMPROVE 2016; U.S.EPA 20016a; Zhang et al. 2012) as
illustrated in Fig. 1. Watson et al. (2016) also associate the
measured species with potential sources. This article
elaborates on further analysis of the water-extracted com-
pounds using ion chromatography (IC). IC with conduc-
tivity detection was developed in the mid-1970s (Small
et al. 1975) to obtain multipollutant measurements with a
single analysis for water-soluble ions. Analytes include
fluoride (F�Þ, chloride (Cl�Þ, nitrite (NO�2 Þ, bromide
& Judith C. Chow
1 Division of Atmospheric Sciences, Desert Research Institute,
Reno, NV 89512, USA
2 Institute of Earth Environment, Chinese Academy of
Sciences, Xi’an 710061, Shaanxi, China
123
Aerosol Sci Eng (2017) 1:7–24
DOI 10.1007/s41810-017-0002-4

(Br�Þ, iodide (I�Þ, nitrate (NO�3 Þ, sulfate (SO2�
4 Þ, and
phosphate (PO3�4 Þ for anions; and sodium (NaþÞ, ammo-
nium (NHþ4 Þ, magnesium (Mg2þÞ, potassium (KþÞ, and
calcium (Ca2þÞ for cations. For PM2:5 deposits on filters,
samples are first extracted in distilled-deionized water
(DDW). IC separates the water-extracted solutes with an
ion exchange resin that delays their passage owing to dif-
ferent ion sizes and charges relative to the ionic eluent.
This results in different retention times for individual ion
quantification with a detector, typically a conductivity
detector that measures the electrical current traversing the
eluted solution. Prior to detection, the ion exchange column
effluent enters a suppressor (membrane or column) where
the eluent is neutralized, reducing its conductivity while
retaining that of the ions of interest. Ionic compounds are
identified by their elution/retention times and quantified by
the conductivity peak area. Peak areas are related to con-
centrations from standard solutions for quantification.
Although IC instruments can be set up to calculate con-
centrations by either peak area or peak height, laboratory
tests show that peak area provides better accuracy and
precision than those for peak height. Peak area is not
affected by baseline shifts which commonly occur in IC
analysis.
While most applications involve sampling onto filters
with extraction and analysis in the laboratory, a growing
number of in situ IC-based instruments are being used to
obtain real-time concentrations with high time resolution
(ten Brink et al. 2007; URG 2016; Weber et al. 2001). Sub-
diurnal time resolution can also be obtained using the
recently developed Sequential Spot Sampler (Hecobian
et al. 2016) that impacts PM2:5 into small wells on a car-
ousel that can be subsequently extracted and analyzed with
an automated laboratory IC.
Newer instrumentation and software have expanded the
capability of IC to quantify selected organic compounds,
several of which appear in the same spectra produced for
inorganic ions and others that are detected using different
columns, eluents, and detectors. This presentation updates
a prior evaluation (Chow and Watson 1999) of IC methods
applied to PM2:5 filter samples that are acquired in
1. Teflon-membrane filter(25 mm to 47 mm, 5 to 24 L min-1)
2. Quartz-fiber filter(25 mm to 47 mm, 5 to 24 L min-1)
3. Quartz-fiber or Nylon-membrane filter(25 mm to 47 mm, 5 to 24 L min-1)
= Level I (destructive) = Level II complexity = Level III complexity= Level I (non-destructive)
0.5 cm2
a Chloride, nitrate, and sulfate are measured in U.S. non-urban IMPROVE (Interagency Monitoring of Protected Visual Environments) and urban CSN (Chemical Speciation Network)
b Water-soluble sodium, ammonium, and potassium ions are measured in CSNc Including alkanes, alkenes, polycyclic aromatic hydrocarbons (PAHs), hopanes, and
steranesd Including levoglucosan, other carbohydrates, intermediate and long-chain carboxylic acids
(including diacids and multi-functional acids), phenolic compounds, and sterols
Mass (Gravimetry)
1 cm21 cm2 1 cm2
Organic markers
(TOR with PI-TOF/MS)
Remaining filter
(~10 cm2)
Archived for future analysis
~80 Polar organic compoundsd
(ID-TD-GC/MS)
~110 Non-polar organic compoundsc
(TD-GC/MS)
Methods:ELSD: Evaporative light
scattering detectionFTIR: Fourier Transform
Infrared spectroscopyIC-CD: Ion chromatography
with conductivity detectionIC-PAD: IC with pulsed
amperometric detectionICP-MS: Inductively coupled
plasma-mass spectrometryID-TD-GC/MS: In-situ-
derivatization-thermal desorption-gas chromatography/mass spectrometry
HPLC: High performance liquid chromatography
HULIS: Humic-like substances
PI-TOF/MS: Photo-ionization -time-of-flight/mass spectrometry
SPI: Single photon ionizationTD-GC/MS: Thermal
desorption-gas chromatography/mass spectrometry
TOC: Total organic carbon analysis
TOR/TOT: Thermal-optical reflectance and transmittance
UV-VIS: Ultraviolet-visible light spectroscopy (200-1100 nm)
XRF: X-ray fluorescence spectroscopy
WSOC: Water-soluble organic carbon
WSON: Water-soluble organic nitrogen
Anionsc
and cationsb
(IC-CD)
2 mL 1 mL 1 mL4 mL
WSOC, WSON(TOC)
1 mL
Carbohydrates(IC-PAD)
Water Extraction 15 mL
1 mL
HULIS(HPLC-ELSD-
UV-VIS)
Phenolic compounds
(HPLC-UV-VIS)
Functional groups (FTIR)
Filter attenuation (UV-VIS)
Elements -51 elements
from Na to U(XRF)
Multi-λ light absorption(UV-VIS)
Functional groups (FTIR)
Mono- and dicarboxylic
acid(IC-CD)
OC/EC(Multiwavelength
TOR/TOT)
Acid Digestion 10 mL
Rare earths and isotopes
(ICP-MS)
Fig. 1 Filter samples are commonly acquired in PM compliance and
speciation networks (IMPROVE 2016; U.S.EPA 20016a). In these
networks the Nylon-membrane filter is preceded by anodized
aluminum denuder tubes (Chow 1993) that remove gaseous nitric
acid so only PM nitrate is collected. Shading indicates the analyses
and outputs that are currently obtained from these samples. Figure is
adapted from Watson et al. 2016
8 Aerosol Sci Eng (2017) 1:7–24
123
compliance and speciation networks. It provides a brief
summary of recent reviews on liquid chromatography (LC)
applications to environmental samples, then defines the key
terms used in IC analyses. This work summarizes tests on
water-soluble extraction efficiencies for particles collected
on different filter media and describes procedures for cal-
ibration, standardization, and quality control/quality
assurance (QC/QA). It compares chromatograms from
different systems, demonstrating the progress of improved
hardware and software to better resolve water-soluble
components. It proposes instrumental configurations that
can obtain more information from the sample extracts than
is currently achieved by simple inorganic anion and cation
analyses.
Table 1 lists the analytes that can be obtained from the
IC methods described here and associates them with
potential pollution sources. The major ionic components of
Cl�, NO�3 , SO
�24 , Naþ, and NHþ
4 are essential for recon-
structing PM mass (Chow et al. 2015) and estimating
chemical light extinction to improve visibility (Cheng
2015; Pitchford et al. 2007; Watson 2002). Other ions,
such as F�, Br�, I�, PO3�4 , Mg2þ, Kþ, and Ca2þ which
often go unreported, also have value as source markers.
Water-soluble Kþ is a common biomass burning marker
(Calloway et al. 1989), while water-soluble Ca2þ is found
in transported Asian dust (Duvall et al. 2006). The addition
of alkylamines, organic acids, and carbohydrates quantifi-
cation by IC expands the number of source markers for
biomass burning; fuel combustion; biodiesel, diesel, and
gasoline engine exhaust; meat cooking; marine aerosol;
and bioaerosol. Although several sources are potential
contributors, these can be narrowed down by the study
context and network design (Chow et al. 2002). Agricul-
tural sources such as fertilizer and animal husbandry con-
tributions would not be expected at urban sites, and
biomass burning would favor SOA formation during cold
winter periods.
Recent Reviews of Liquid Chromatography (LC)Methods
Liquid chromatography (LC) includes both IC and high
performance liquid chromatography (HPLC) that have
wide application to analyses of compounds dissolved in
water. IC is used for most inorganic constituents, whereas
HPLC speciates organic molecular constituents (Michal-
ski 2016). HP uses a high-pressure pump [� 3000 to
� 6000 psi (pounds per square inch) or � 21,000 to
� 41,000 kilopascals (kPa)] (Hartwell et al. 2013) to push
the sample and eluent through the separating columns
while lower pressures (\2,000 psi or � 14,000 kPa) are
applied in IC. The types of stationary phase matrices,
column packing methods, eluent compositions, and
detection modes vary between IC and HPLC. IC variants,
such as ion-exclusion chromatography (IEC), ion-pair
chromatography (IPC), and reversed-phase liquid chro-
matography (RPLC), have also been used to separate
hydrophilic molecules, biomolecules, and metal com-
plexes (Fritz 1991; Gama et al. 2012; Gennaro and
Angelino 1997; Michalski 2014; Nakatani et al. 2012). In
tandem with mass spectrometric (MS) detection, as
implemented in HPLC–MS, LC–MS, and LC–MS/MS,
more complex water-soluble organic compositions,
molecular structures, molar weights, and functional
groups (Fenn 2002, 2003; Michalski 2014) can be quan-
tified at ultra-low detection limits.
Recent reviews (Butt and Riaz 2009; Hartwell et al.
2013; Karu et al. 2012; Lucy and Wahab 2013; Michalski
2013, 2014; Nakatani et al. 2012; Olariu et al. 2015; Pohl
2013; Zhang et al. 2015) highlight the technological
advances in IC systems and applications for environmental,
pharmaceutical, clinical, and food chemistry samples. The
sensitivity, selectivity, and linearity of IC systems can be
modulated based on the selection of stationary phase
properties and eluent compositions. Although IC methods
began with conductivity detection (Small et al. 1975),
other advanced detection techniques such as UV–VIS or
diode array absorbance, amperometry, and potentiometry
have been used to quantify additional water-soluble com-
pounds (Buchberger 2001).
There are several suppliers of IC hardware (Lachat
2016; Metrohm 2016; Thermo-Dionex 2016; Waters
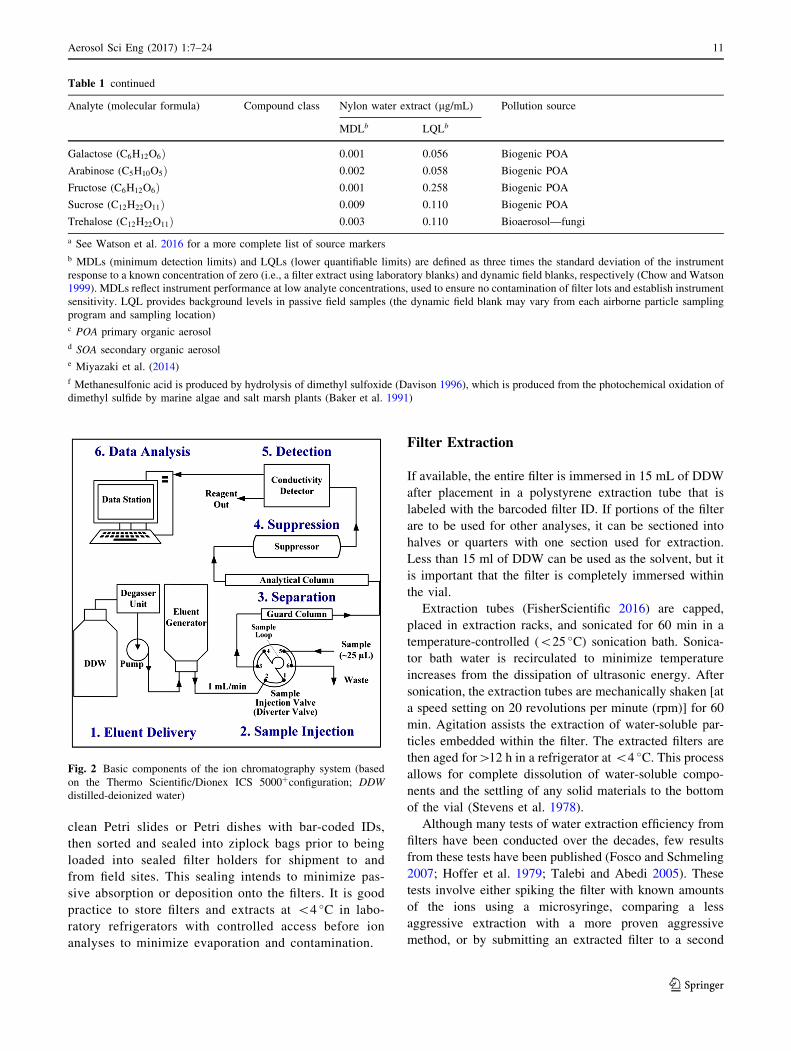
2016), with Thermo/Dionex being the major one. Figure 2
illustrates a generic IC set-up, but there are countless
combinations of columns, eluents, and detectors that can be
selected from the vendors’ websites. The configurations
described here are specified in Table 2. Basic components
and terminology used in IC systems are documented in
Table 3.
Filter Preparation, Receipt, Acceptance Testing,and Storage
Each batch of unexposed filters should be acceptance-
tested with a visual inspection of every filter over a
light table, with rejection of blank filters showing visual
flaws, pinholes, or discoloration. One filter from each
batch of 100 is extracted and analyzed for the intended
species and the batch is rejected if excessive blank
levels exceeding 0.5 lg per filter are detected. Nylon-
membrane filter (Pall 2016) acceptance testing is
especially important as it passively absorbs nitric acid
vapors when exposed to the atmosphere (Bytnerowicz
et al. 2005). Acceptance-tested filters are then placed in
Aerosol Sci Eng (2017) 1:7–24 9
123
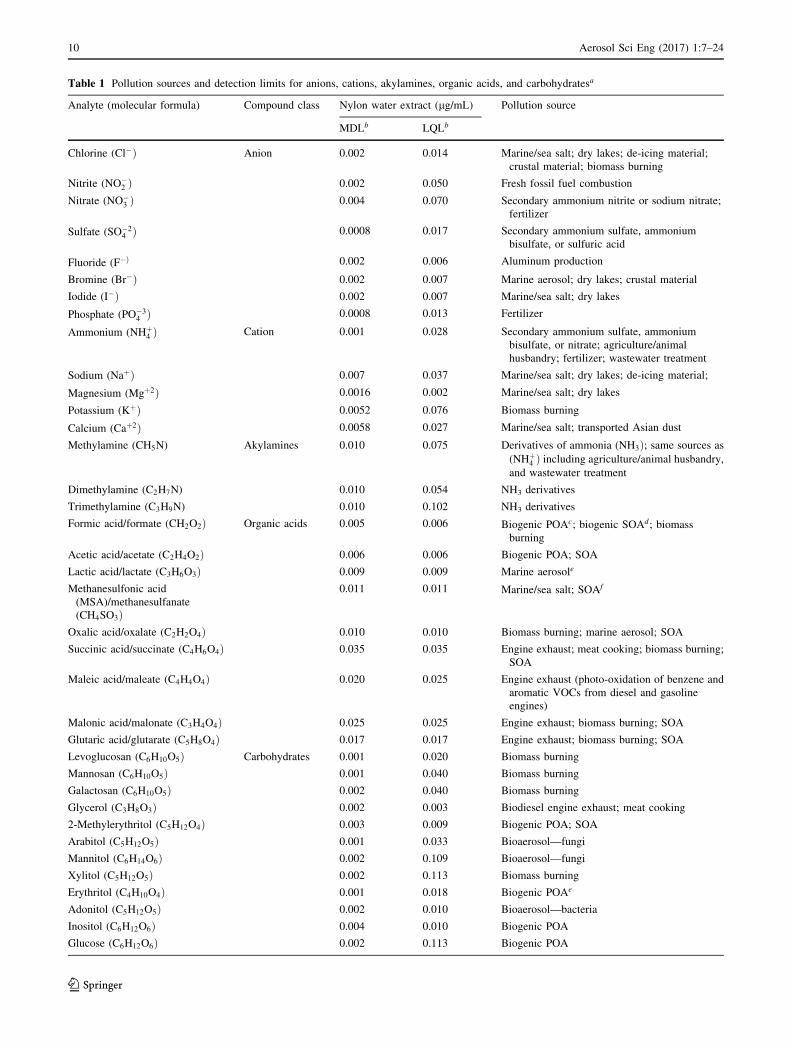
Table 1 Pollution sources and detection limits for anions, cations, akylamines, organic acids, and carbohydratesa
Analyte (molecular formula) Compound class Nylon water extract (lg/mL) Pollution source
MDLb LQLb
Chlorine (Cl�Þ Anion 0.002 0.014 Marine/sea salt; dry lakes; de-icing material;
crustal material; biomass burning
Nitrite (NO�2 Þ 0.002 0.050 Fresh fossil fuel combustion
Nitrate (NO�3 Þ 0.004 0.070 Secondary ammonium nitrite or sodium nitrate;
fertilizer
Sulfate (SO�24 Þ 0.0008 0.017 Secondary ammonium sulfate, ammonium
bisulfate, or sulfuric acid
Fluoride (F�Þ 0.002 0.006 Aluminum production
Bromine (Br�Þ 0.002 0.007 Marine aerosol; dry lakes; crustal material
Iodide (I�Þ 0.002 0.007 Marine/sea salt; dry lakes
Phosphate (PO�34 Þ 0.0008 0.013 Fertilizer
Ammonium (NHþ4 Þ Cation 0.001 0.028 Secondary ammonium sulfate, ammonium
bisulfate, or nitrate; agriculture/animal
husbandry; fertilizer; wastewater treatment
Sodium (NaþÞ 0.007 0.037 Marine/sea salt; dry lakes; de-icing material;
Magnesium (Mgþ2Þ 0.0016 0.002 Marine/sea salt; dry lakes
Potassium (KþÞ 0.0052 0.076 Biomass burning
Calcium (Caþ2Þ 0.0058 0.027 Marine/sea salt; transported Asian dust
Methylamine (CH5N) Akylamines 0.010 0.075 Derivatives of ammonia (NH3Þ; same sources as
(NHþ4 Þ including agriculture/animal husbandry,
and wastewater treatment
Dimethylamine (C2H7N) 0.010 0.054 NH3 derivatives
Trimethylamine (C3H9N) 0.010 0.102 NH3 derivatives
Formic acid/formate (CH2O2Þ Organic acids 0.005 0.006 Biogenic POAc; biogenic SOAd; biomass
burning
Acetic acid/acetate (C2H4O2Þ 0.006 0.006 Biogenic POA; SOA
Lactic acid/lactate (C3H6O3Þ 0.009 0.009 Marine aerosole
Methanesulfonic acid
(MSA)/methanesulfanate
(CH4SO3Þ
0.011 0.011 Marine/sea salt; SOAf
Oxalic acid/oxalate (C2H2O4Þ 0.010 0.010 Biomass burning; marine aerosol; SOA
Succinic acid/succinate (C4H6O4Þ 0.035 0.035 Engine exhaust; meat cooking; biomass burning;
SOA
Maleic acid/maleate (C4H4O4Þ 0.020 0.025 Engine exhaust (photo-oxidation of benzene and
aromatic VOCs from diesel and gasoline
engines)
Malonic acid/malonate (C3H4O4Þ 0.025 0.025 Engine exhaust; biomass burning; SOA
Glutaric acid/glutarate (C5H8O4Þ 0.017 0.017 Engine exhaust; biomass burning; SOA
Levoglucosan (C6H10O5Þ Carbohydrates 0.001 0.020 Biomass burning
Mannosan (C6H10O5Þ 0.001 0.040 Biomass burning
Galactosan (C6H10O5Þ 0.002 0.040 Biomass burning
Glycerol (C3H8O3Þ 0.002 0.003 Biodiesel engine exhaust; meat cooking
2-Methylerythritol (C5H12O4Þ 0.003 0.009 Biogenic POA; SOA
Arabitol (C5H12O5Þ 0.001 0.033 Bioaerosol—fungi
Mannitol (C6H14O6Þ 0.002 0.109 Bioaerosol—fungi
Xylitol (C5H12O5Þ 0.002 0.113 Biomass burning
Erythritol (C4H10O4Þ 0.001 0.018 Biogenic POAe
Adonitol (C5H12O5Þ 0.002 0.010 Bioaerosol—bacteria
Inositol (C6H12O6Þ 0.004 0.010 Biogenic POA
Glucose (C6H12O6Þ 0.002 0.113 Biogenic POA
10 Aerosol Sci Eng (2017) 1:7–24
123
clean Petri slides or Petri dishes with bar-coded IDs,
then sorted and sealed into ziplock bags prior to being
loaded into sealed filter holders for shipment to and
from field sites. This sealing intends to minimize pas-
sive absorption or deposition onto the filters. It is good
practice to store filters and extracts at \4 �C in labo-
ratory refrigerators with controlled access before ion
analyses to minimize evaporation and contamination.
Filter Extraction
If available, the entire filter is immersed in 15 mL of DDW
after placement in a polystyrene extraction tube that is
labeled with the barcoded filter ID. If portions of the filter
are to be used for other analyses, it can be sectioned into
halves or quarters with one section used for extraction.
Less than 15 ml of DDW can be used as the solvent, but it
is important that the filter is completely immersed within
the vial.
Extraction tubes (FisherScientific 2016) are capped,
placed in extraction racks, and sonicated for 60 min in a
temperature-controlled (\25 �C) sonication bath. Sonica-
tor bath water is recirculated to minimize temperature
increases from the dissipation of ultrasonic energy. After
sonication, the extraction tubes are mechanically shaken [at
a speed setting on 20 revolutions per minute (rpm)] for 60
min. Agitation assists the extraction of water-soluble par-
ticles embedded within the filter. The extracted filters are
then aged for[12 h in a refrigerator at\4 �C. This processallows for complete dissolution of water-soluble compo-
nents and the settling of any solid materials to the bottom
of the vial (Stevens et al. 1978).
Although many tests of water extraction efficiency from
filters have been conducted over the decades, few results
from these tests have been published (Fosco and Schmeling
2007; Hoffer et al. 1979; Talebi and Abedi 2005). These
tests involve either spiking the filter with known amounts
of the ions using a microsyringe, comparing a less
aggressive extraction with a more proven aggressive
method, or by submitting an extracted filter to a second
Table 1 continued
Analyte (molecular formula) Compound class Nylon water extract (lg/mL) Pollution source
MDLb LQLb
Galactose (C6H12O6Þ 0.001 0.056 Biogenic POA
Arabinose (C5H10O5Þ 0.002 0.058 Biogenic POA
Fructose (C6H12O6Þ 0.001 0.258 Biogenic POA
Sucrose (C12H22O11Þ 0.009 0.110 Biogenic POA
Trehalose (C12H22O11Þ 0.003 0.110 Bioaerosol—fungi
a See Watson et al. 2016 for a more complete list of source markers
b MDLs (minimum detection limits) and LQLs (lower quantifiable limits) are defined as three times the standard deviation of the instrument
response to a known concentration of zero (i.e., a filter extract using laboratory blanks) and dynamic field blanks, respectively (Chow and Watson
1999). MDLs reflect instrument performance at low analyte concentrations, used to ensure no contamination of filter lots and establish instrument
sensitivity. LQL provides background levels in passive field samples (the dynamic field blank may vary from each airborne particle sampling
program and sampling location)c POA primary organic aerosol
d SOA secondary organic aerosole Miyazaki et al. (2014)
f Methanesulfonic acid is produced by hydrolysis of dimethyl sulfoxide (Davison 1996), which is produced from the photochemical oxidation of
dimethyl sulfide by marine algae and salt marsh plants (Baker et al. 1991)
Fig. 2 Basic components of the ion chromatography system (based
on the Thermo Scientific/Dionex ICS 5000þconfiguration; DDW
distilled-deionized water)
Aerosol Sci Eng (2017) 1:7–24 11
123

Table
2Exam
plesofIC
configurationsforanion,cation,organic
acid,andcarbohydrate
analyses
Analyte
Anions
Cations
Organic
acids
Carbohydrates
ICinstrument
ThermoScientific/Dionex
ICS-5000þ
ThermoScientific/Dionex
ICS-5000þ
ThermoScientific/Dionex
ICS-2100
orICS-5000þ
ThermoScientific/Dionex
ICS-3000
Sam
ple
loop
25lL
25lL
30lL
30lL
Guardcolumn
IonPac
AG20(4
�50mm)
IonPac
CG16(5�50mm)
IonPac
AG11(4�50mm)
CarboPac
MA1(4�50mm)
Analyticalcolumn
IonPac
AS20(4�250mm)
IonPac
CS16(5�250mm)
IonPac
AS11(4�250mm)
CarboPac
MA1(4�250mm)
Micro-m
embrane
suppressor
Anionelectrolyticallyregenerated
suppressor(A
ERS)500
Cationelectrolyticallyregenerated
suppressor(CERS)-500
Anionself-regeneratingsuppressor
(ASRS)300orAERS500
AERS500
Detector
ICS-5000þtemperature
controlled
(30� C
)conductivitycell
ICS-5000þtemperature
controlled
(30� C
)conductivitycell
Detectionstability(D
S6)heated
conductivitycell(ICS-2100)or
temperature
controlled
(30� C
)
conductivitycell(ICS-5000þÞ
Electrochem
ical
detectoroptimized
in
pulsed
amperometricmode,
using
gold
(Au)as
theworkingelectrode
andsilver/silver
chloride(A
g/AgCl)
asthereference
electrode
Eluentpreparation
Eluentgenerator(EG)
Eluentgenerator
Eluentgenerator
Manual
mixing
Eluentcomposition
Potassium
hydroxide(K
OH)gradient
from
10to
50mM
over
�17min
Methanesulfonic
acid
(MSA)
(40mM)
Potassium
hydroxide(K
OH)
(0.5–60mM)
Sodium
hydroxide(N
aOH)
(48–65mM)
Flow
rate
1.0
mL/m
in1.0
mL/m
in1.5
mL/m
in(ICS-2100)or1.0
mL/
min
(ICS-5000þÞ
0.4
mL/m
in
Pump
ICS-5000dual
pump(D
P)
ICS-5000þdual
pump
ICS-2100single
pumporICS-5000þ
dual
pump
ICS-3000dual
pump
12 Aerosol Sci Eng (2017) 1:7–24
123

Table
3Descriptionsofbasic
components
commonly
applied
inionchromatography
ICsystem
component/term
inology
Description
Distilled-deionized
water
(DDW)
Feedsnanopure
system
Degasserunit
Rem
oves
dissolved
gases
andairbubblesfrom
theeluentto
ensure
constantpressure
andchromatographic
resolution
Eluent
Theliquid
mobilephasethat
transportsthesample
solutionthroughtheionexchangecolumnsto
thedetectorandfacilitates
separationbycompetingforionic
bindingsites
Eluentgenerator
Apairofelectrodes
isseparated
byan
ionexchangemem
brane.
When
acurrentisapplied
totheelectrodes,water
electrolysis
generates
hydronium
orhydroxideions(H
3O?orOH-)attheanodeorcathode,respectively,andcounter-ionsmigratefrom
an
eluentgenerationcartridgeacross
amem
braneto
form
theeluent.Bycontrollingthecurrent,accurate
concentrationsare
generated
(e.g.,potassium
hydroxideormethylsulfonic
acid)
Ionexchangeresinorpolymer
Themedium
(i.e.,stationaryphase)
containingcharged
anionic
orcationic
exchangesitesforionexchange.
Itconsistsofhigh-
molecular-weightinsoluble
functional
groupsthat
allow
fortheseparationofionic
speciesfrom
sample
solutionsbased
onion
chargeandmolecule
size
Guardcolumn(alsoterm
edas
pre-column)
Asm
allcolumnplacedupstream
topreventcontaminationorpoisoningoftheanalyticalcolumnbyremovingparticles
and
extraneousorganic
compounds
Analyticalcolumn(alsoterm
edas
separationcolumn,
capillary
column,orionexchangecolumn)
Separates
thetarget
ionsin
timebefore
presentationto
thedetector.Containstheionexchangeresinandfunctional
groups
correspondingto
theaffinitiesofthetarget
analytesandthemobilephase
Suppressor(alsoterm
edas
microsuppressor,
electrolyticallyregenerated
suppressor,orself-
regeneratingsuppressor)
Rem
oves
andreplaceseluentcounterionswithregenerantions(either
H3O
þorOH
�Þ.Itconvertstheeluentto
water
oraweakly
dissociated
statepriorto
detection.Thesuppressoralso
lowersthebackgroundlevelsandmaxim
izes
signal-to-noiseratios
Suppressorregeneration
Convertsandmaintainsan
activeform
ofsuppression.Suppressormem
branes
arereplenished
bythesamplestream
afteritleaves
theconductivitydetectorandgoes
towaste.In
combinationwithelectrolyticalregeneration,thisallowsforcontinuousoperation
forthousandsofsamples
Conductivitydetector
Quantifies
changes
inelectriccurrentdueto
thepresence
ofanalyteionsandrecordsthedifference
involtagebetweenelectrodes
Pulsed
amperometricdetector(PAD)
Based
onelectrochem
icaldetectionusinggold
(Au)andsilver/silver
chloride(A
g/AgCl)as
theworkingandreference
electrodes,
respectively
Ultraviolet–visible
ordiodearraydetector(U
V–VIS
or
DAD)
Based
onspectroscopic
detection,itmeasuresabsorbance
ofsingle
wavelengths(i.e.,UV–VIS)ormultiple
wavelengths(i.e.,
DAD)
Gradientelution
Usedto
separateionsthat
may
co-elute
usinglower
eluentconcentrations,andgradually
shiftto
more
concentrated
eluentto
reduce
runtimeandseparateionsthat
otherwisewould
takeextended
periodsoftime.
Alsousedto
elute
multiple
ionswith
widelydifferentretentiontimes,thusreducingtotalruntime.Theconcentrationorcompositionoftheeluentcanbealteredin
a
single
runto
facilitate
theionseparationandto
increase
theresolutionofthetarget
analytes(dueto
highbackground
conductance,sodium
carbonate/bicarbonateeluentsarenotappropriateforgradientelution)
Isocratic
elution
Employsafixed
concentrationlevel
andpresetflow
rate.This
modemaintainsaconstantbaselineduringanalysis.This
isthe
most
commonmodeapplied
toPM
2:5filter
extracts
Retentiontime
Thetimefrom
sample
injectionto
thetimethedetectorsignal
reaches
itsmaxim
um
value.
This
delay
isusedto
associatethe
desired
analyteswiththedetectorresponses
Resolution
Ameasure
ofcolumnefficiency
andcapacitybyquantitativelydifferentiatingtwoelutedpeaks.Narrower
peakwidthsim
ply
higher
resolution
Distilled-deionized
water
(DDW)dip
Anegativepeakoccurs
onthechromatogram
(usually
withthesodium
carbonate/bicarbonateeluent)uponinjectionofanalyte,
correspondingto
theDDW
inthesample
extract.Astheconductance
ofDDW
isoften
less
than
that
ofthesuppressed
eluent,
ionselutingneartheDDW
dip
areco-elutedorsuppressed
(e.g.,fluorideandchloride)
Aerosol Sci Eng (2017) 1:7–24 13
123

extraction (Mouli et al. 2003). Derrick and Moyers 1981
examined extraction methods for Teflon-membrane and
quartz-fiber filters. Teflon is hydrophobic, and DDW does
not wet the surface or penetrate within the membrane
(Wolfson 1980). Pure DDW, sodium carbonate/bicarbonate
eluent, and perchloric acid by themselves yielded \80%
efficiencies after 15 min of sonication and\2 h of aging for
nitrate, sulfate, and ammonium. However, the DDW
extraction yielded[95% efficiencies for these ions when
analyzed after 24 h of aging following sonication. Chow
and Watson (1999) noted the hydrophobic nature of Teflon-
membrane filters that require applications of a wetting
solution (e.g., 200 lL ethanol or methanol) onto the filter
deposit surface to ensure complete dissolution of the ana-
lyte ions.
Nylon-membrane filters are hydrophilic, as evidenced
by their soaking up of a water droplet, in contrast to the
Teflon-membrane on which the droplet remains on the
surface. Yu et al. (2005) found equivalent nitrate and
sulfate concentrations on Nylon-membrane filters extrac-
ted in DDW and IC eluent, both with 30–45 min of
sonication. They did not report the aging time prior to
analysis, but it is evident that the eluent extraction is
unnecessary. This is a useful result, as the sodium car-
bonate/bicarbonate IC eluent for anions would interfere
with possible cation analysis on the extracts. A pure
DDW extraction is preferable
Extraction efficiencies determined from two sets of 20
Nylon-membrane filters spiked with known concentrations
of mixed anion standards are compared in Fig. 3. Recovery
rates range from 100–103.9% and 92–96% for Laboratories
A and B, with averages and standard deviations of 100:2�0:8% and 94� 2:1%, respectively.
IC for Anions, Cations, Organic Acids,and Carbohydrates
Thermo/Dionex ICs are most commonly used, although
alternatives are also available. The older models (e.g.,
DX-500, DX-600, and ICS-2000) have been used in the
past (Chow et al. 1990; Watson 1991) and are adequate
for inorganic anion and cation analyses. These instru-
ments are still available on the used-instrument market,
along with replacement parts and supplies. They have
been largely superseded by later model hardware and
software.
Anions
Anion columns use carbonate or hydroxide-selective anion
exchange resins that can accommodate a reasonable
(� 2000) sample throughput. An anion electrolytically
regenerated suppresser (AERS) is used to reduce back-
ground conductivity by exchanging the Kþ with hydrogen
ion (HþÞ to produce water in the case of hydroxide (or
similarly convert carbonate to bicarbonate and/or carbonic
acid). An eluent generator is used to produce a 15 mil-
limole (mM) potassium hydroxide solution for isocratic
elution followed by conductivity detection.
Anion chromatograms from two systems are compared
in Fig. 4. The ICS-5000þ configuration (Fig. 4b) has
higher sensitivity with improved chromatographic resolu-
tion. This is partially due to the carbonate/bicarbonate
buffer system used by the ICS-3000, which does not
completely eliminate background conductivity. This is
most evident for the fluoride or chloride peak, which often
interferes with the DDW dip. As the conductance of DDW
is often less than that of the suppressed eluent, fluoride or
chloride eluting near the DDW dip is co-eluted or sup-
pressed. Background subtraction and manual adjustments
are required for the older IC systems to quantify potential
co-eluted species and peak overlaps. This is labor-intensive
and results in large uncertainties in ion concentrations
(Chow and Watson 1999). Nitrite was also found in this
sample, though it was below ICS-3000 minimum detection
limits (MDLs) (Fig. 4a).
The carbonate peaks in Fig. 4b are dominated by arti-
facts rather than components of the aerosol deposit. Despite
de-gassing of the water by helium sparging, this interfer-
ence results from carbon dioxide (CO2Þ dissolved in the
DDW or eluent. The carbonate peak is separable from the
other anions and causes no bias to their quantification. It
may be reduced by purging the sample chamber with an
inert gas and minimizing the time between extraction and
analysis.
Fig. 3 Extraction efficiencies of two sets of standard spiked (2 lg/mL
mixed anion standards) Nylon-membrane filters following two
laboratory procedures (Lab A uses 15 mL extraction volume,
followed by 60 min each of sonication and mechanical shaking with
� 12 h of refrigeration aging; Lab B uses 20 mL extraction volume,
followed by 30 min of sonication, then left at room temperature for 24
h before refrigeration overnight)
14 Aerosol Sci Eng (2017) 1:7–24
123
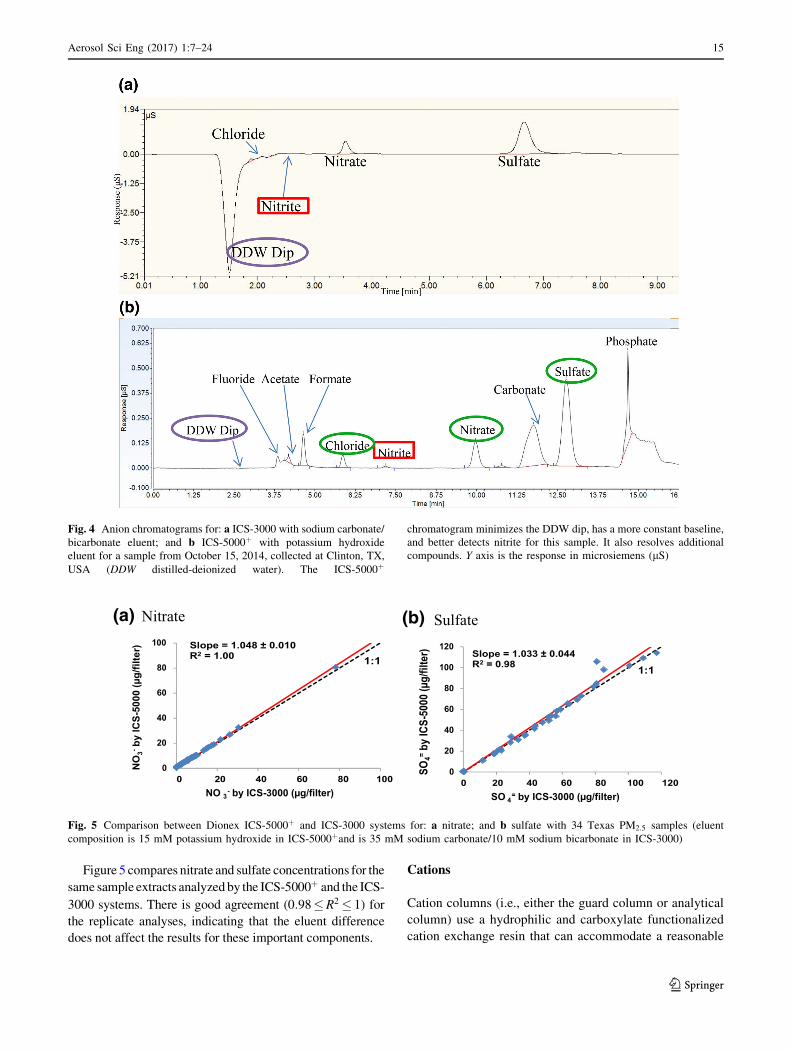
Figure 5 compares nitrate and sulfate concentrations for the
same sample extracts analyzedby the ICS-5000þ and the ICS-
3000 systems. There is good agreement (0:98�R2 � 1) for
the replicate analyses, indicating that the eluent difference
does not affect the results for these important components.
Cations
Cation columns (i.e., either the guard column or analytical
column) use a hydrophilic and carboxylate functionalized
cation exchange resin that can accommodate a reasonable
Fig. 4 Anion chromatograms for: a ICS-3000 with sodium carbonate/
bicarbonate eluent; and b ICS-5000þ with potassium hydroxide
eluent for a sample from October 15, 2014, collected at Clinton, TX,
USA (DDW distilled-deionized water). The ICS-5000þ
chromatogram minimizes the DDW dip, has a more constant baseline,
and better detects nitrite for this sample. It also resolves additional
compounds. Y axis is the response in microsiemens (lS)
etartiN Sulfate
0
20
40
60
80
100
0 20 40 60 80 100
NO
3-by
ICS-
5000
(µg/
filte
r)
NO 3- by ICS-3000 (µg/filter)
1:1Slope = 1.048 ± 0.010R2 = 1.00
0
20
40
60
80
100
120
0 20 40 60 80 100 120
SO4=
by IC
S-50
00 (µ
g/fil
ter)
SO 4= by ICS-3000 (µg/filter)
1:1Slope = 1.033 ± 0.044R2 = 0.98
(a) (b)
Fig. 5 Comparison between Dionex ICS-5000þ and ICS-3000 systems for: a nitrate; and b sulfate with 34 Texas PM2:5 samples (eluent
composition is 15 mM potassium hydroxide in ICS-5000þand is 35 mM sodium carbonate/10 mM sodium bicarbonate in ICS-3000)
Aerosol Sci Eng (2017) 1:7–24 15
123

(� 2500) sample throughput. A cation electrolytically
regenerated suppressor (CERS) is used to reduce back-
ground conductivity by exchanging the buffer anion (e.g.,
methane sulfonate or sulfate) with hydroxide ion (OH�Þ,and an eluent generator is used to produce 40 mM
methanesulfonic acid (MSA) solution for isocratic elution
followed by conductivity detection. Figure 6 shows an
example of the cation chromatogram with � 20-min
analysis time per sample.
Both gaseous ammonia (NH3Þ and particle ammonium
are important atmospheric constituents that contribute to
the global nitrogen cycle (Fowler 2015), elevated PM2:5
(Wang et al. 2013), and ecosystem deposition (Granath
et al. 2014). If ammonium is the major cation of interest, a
fast run cation column (e.g., 4� 250 mm CS12A) can be
used with a 33 mM MSA eluent composition for a 3-min
analysis time. Although there are potential savings on
analysis time (i.e., from 20 to 3 min per run), these are not
necessarily achieved when other cations are present, as
additional rinsing time is needed to elute the remaining
cations (e.g., water-soluble magnesium, potassium, and
calcium); sample carry-over may cause cross-contamina-
tion. The � 20-min analysis time ensures clean separation.
The only cost savings would be the time reduction in
system calibration and chromatogram validation, as fewer
ion species are needed to prepare calibration standards and
only a single peak is subject to verification.
The conductivity/concentration relationship is non-lin-
ear for ammonium at high concentrations and a quadratic
curve is needed to fit the calibration standards. Figure 7a
shows an upper limit of 10 lg/mL standard may underes-
timate the ammonium concentration. The linear curve is
improved with a calibration curve from 0.005 to 2 lg/mL
(Fig. 7b), with best linearity found with an upper limit of 1
lg/mL (Fig. 7c). For cation analyses, the upper limit can be
set at 10 lg/mL for water-soluble sodium, magnesium,
potassium, and calcium ions and at 1 lg/mL for ammo-
nium. Values above these require dilution and re-analysis.
Alkylamines
Alkylamines, derivatives of ammonia, can serve as
markers for agricultural sources (Ge et al. 2011) and are
determined following the cation procedure. Dimethy-
lamine may co-elute with the magnesium ion and
trimethylamine may co-elute with the calcium ion; how-
ever, their concentrations are usually small compared to
the inorganic ions. Using gradient eluent mode, Fig. 8
shows that the three alkylamines can be quantified along
with ammonium and four other inorganic cations within a
single � 30-min run.
Organic Acids
Organic acids derive from a mixture of anthropogenic
sources, including biomass burning; biodiesel, diesel, and
gasoline engine exhaust; marine aerosols; meat cooking;
biogenic; as well as primary organic aerosols (POAs) and
SOAs (Hawkins et al. 2010; Kundu et al. 2010; Millet
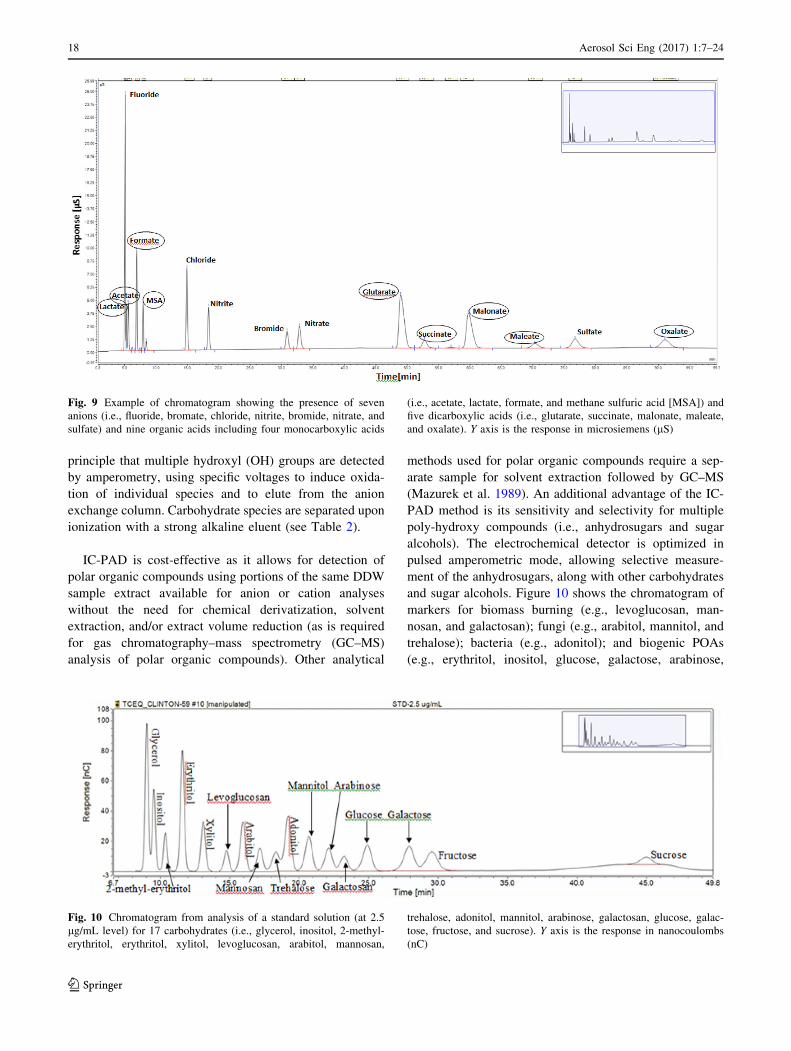
2015). Figure 9 shows the extension of anion analysis with
nine organic acids in a single run. The organic acids most
commonly found in ambient samples includes four mono-
carboxylic acids (i.e., lactate, acetate, formate, and MSA)
and five di-carboxylic acids (i.e., glutarate, succinate,
malonate, maleate, and oxalate) (Brent et al. 2014; Kar-
thikeyan et al. 2007) that can be speciated along with
commonly measured anions as specified in Table 2.
Some of these organic acids could possibly interfere
with inorganic anion peaks if present in sufficient quanti-
ties. With proper gradient elution, Fig. 9 shows that early
eluting mono-carboxylic acids (e.g., acetate, formate, or
MSA) do not interfere with the chloride peak and
Fig. 6 Chromatogram for cation analysis of ambient filter sample collected in November 20, 2015, at Reno, NV, USA. Y axis is the response in
microsiemens (lS)
16 Aerosol Sci Eng (2017) 1:7–24
123

dicarboxylic acids (e.g., maleate or oxalate) do not inter-
fere with the sulfate peak.
Carbohydrates
Carbohydrates are markers for biomass burning, bioaer-
osols, biogenic POAs, and SOAs. The commonly used
biomass burning marker, levoglucosan, as well as its
isomers mannosan and galactosan, can be quantified by IC
using a pulsed amperometric detection (PAD) (Engling
2006; Garcia et al. 2005; Iinuma et al. 2009; Zhang 2013),
with applications in several field studies (Caseiro et al.
2007; Ho 2015; Iinuma et al. 2009; Sullivan et al. 2011;
VandenBoer et al. 2012; Yttri 2015; Zhang 2013). IC-PAD
integrates HPLC and IC techniques by combining anion
exchange with electrochemical detection. It is based on the
NH4+ (0.005-10 μg/mL) NH4
+ (0.005-2 μg/mL)
NH4+ (0.005-1 μg/mL)
0.0
0.5
1.0
1.5
2.0
2.5
3.0
0 2 4 6 8 10
ICS-
5000
Pea
k A
rea
(µS·
min
)Standard Concentration (µg/mL)
NH4+:
Quadratic fit:y = -0.0072x2 + 0.2642x + 0.0099R² = 1.00
Linear fit:y = 0.197x + 0.040R² = 0.99
0.0
0.1
0.2
0.3
0.4
0.5
0.6
0 0.5 1 1.5 2
ICS-
5000
Pea
k A
rea
(µS·
min
)
Standard Concentration (µg/mL)
NH4+:
Quadratic fit:y = -0.0177x2 + 0.313x - 0.0015R² = 1.00
Linear fit:y = 0.280x + 0.002R² = 1.00
0.0
0.1
0.2
0.3
0 0.2 0.4 0.6 0.8 1
ICS-
5000
Pea
k A
rea
(µS·
min
)
Standard Concentration (µg/mL)
NH4+:
Quadratic fit:y = -0.0052x2 + 0.3016x - 0.0008R² = 1.00
Linear fit:y = 0.297x -0.001
(a)
(c)
(b)Fig. 7 Example of ammonium
(NHþ4 Þ calibration curves of a
Thermo Scientific/Dionex ICS-
5000þ with upper limits of: a 10lg/mL, b 2 lg/mL, and c 1 lg/mL. The linear response is
found with 0.05–1 lg/mL range
Fig. 8 Example chromatogram for the separation of the three
alkylamines (i.e., methylamine, dimethylamine, and trimethylamine)
from ammonium and other cations (i.e., water-soluble sodium,
magnesium, potassium, and calcium ions). Based on a standard
solution of 0.1 lg/mL using a Thermo Scientific/Dionex ICS-5000þ
system. The di- and trimethylamine are separated using gradient
elution mode starting with a 25 mM concentration for 12 min,
increasing to 55 mM concentration for 13 min and followed by a 25
mM concentration for 5 min. This allows the three alkylamines to be
quantified along with ammonium and four other inorganic cations
within a single � 30 min run. Y axis is the response in microsiemens
(lS)
Aerosol Sci Eng (2017) 1:7–24 17
123
principle that multiple hydroxyl (OH) groups are detected
by amperometry, using specific voltages to induce oxida-
tion of individual species and to elute from the anion
exchange column. Carbohydrate species are separated upon
ionization with a strong alkaline eluent (see Table 2).
IC-PAD is cost-effective as it allows for detection of
polar organic compounds using portions of the same DDW
sample extract available for anion or cation analyses
without the need for chemical derivatization, solvent
extraction, and/or extract volume reduction (as is required
for gas chromatography–mass spectrometry (GC–MS)
analysis of polar organic compounds). Other analytical
methods used for polar organic compounds require a sep-
arate sample for solvent extraction followed by GC–MS
(Mazurek et al. 1989). An additional advantage of the IC-
PAD method is its sensitivity and selectivity for multiple
poly-hydroxy compounds (i.e., anhydrosugars and sugar
alcohols). The electrochemical detector is optimized in
pulsed amperometric mode, allowing selective measure-
ment of the anhydrosugars, along with other carbohydrates
and sugar alcohols. Figure 10 shows the chromatogram of
markers for biomass burning (e.g., levoglucosan, man-
nosan, and galactosan); fungi (e.g., arabitol, mannitol, and
trehalose); bacteria (e.g., adonitol); and biogenic POAs
(e.g., erythritol, inositol, glucose, galactose, arabinose,
Fig. 10 Chromatogram from analysis of a standard solution (at 2.5
lg/mL level) for 17 carbohydrates (i.e., glycerol, inositol, 2-methyl-
erythritol, erythritol, xylitol, levoglucosan, arabitol, mannosan,
trehalose, adonitol, mannitol, arabinose, galactosan, glucose, galac-
tose, fructose, and sucrose). Y axis is the response in nanocoulombs
(nC)
Fig. 9 Example of chromatogram showing the presence of seven
anions (i.e., fluoride, bromate, chloride, nitrite, bromide, nitrate, and
sulfate) and nine organic acids including four monocarboxylic acids
(i.e., acetate, lactate, formate, and methane sulfuric acid [MSA]) and
five dicarboxylic acids (i.e., glutarate, succinate, malonate, maleate,
and oxalate). Y axis is the response in microsiemens (lS)
18 Aerosol Sci Eng (2017) 1:7–24
123

Table
4Qualitycontrol(Q
C)activitiesforionchromatographyanalyses
QCactivity
Purpose
Frequency
Standard
Acceptance
criteria
Response/action
Multipointcalibrations(at10
concentrationlevelsfrom
0.005to
10
lg/m
L)
Establish
instrumentresponse
curves
to
knownconcentrations
Everybatch
of�120
samples
NISTb-
Certified
standards
±5%
Recalibrate
Minim
um
detectionlimit(M
DL)
Ensure
nocontaminationoffilter
lotsand
establish
instrumentsensitivity
Initially,then
quarterlyor
aftermajorinstrument
change
Lab
blanks
Within
±10%
of
previouslimits
Troubleshootinstrumentand
checkfilter
lots
Lower
quantifiable
limit(LQL)
Providebackgroundlevelsin
passivefield
samples
Quarterly
Field
blanks
Within
±10%
of
previouslimits
Troubleshootinstrumentand
checkfilters
Distilled-deionized
water
(DDW)
Establish
chromatogram
backgroundof
filter
batch
andcleancolumn
Thrice
everybatch
of�120
samples
DDW
Within
threestandard
deviationsofMDLs
Verifyinstrumentresponse
to
DDW
withoutextraction
Methodblank
cVerifychromatogram
baselineaftersample
extraction
Thrice
everybatch
of�120
samples
DDW
Within
threestandard
deviationsofMDLs
Checkinstrumentresponse
for
DDW
withextraction
QCstandards(N
IST-certified
standard
from
ThermoScientific)
Ensure
instrumentaccuracy
with
independentstandards
Every20th
sample
Multi-
component
solution
±10%
Sam
plesbefore
QC
standard
andpreviousstandards
reanalyzed
QC
perform
ance
(NIST-certified)
standardfrom
ERA
WasteWatRTM
Ensure
instrumentaccuracy
with
independentstandards
Every20th
sample
Multi-
component
solution
±10%
Sam
plesbefore
QC
standard
andpreviousstandards
reanalyzed
Replicates
Ensure
sample
precisionam
ongtheIC
system
sandbetweendifferentanalysis
dates
10%
ofsamples
NA
±10%
when
value
[10�
MDL
Reanalysisofprevioussamples
Level
1DataValidation
Inspectchromatogramsforabnorm
alities
orpotential
interferences
Everysample
NA
Per
SOPd
Sam
ple
reanalysisorflagging
per
SOP
aNA
notapplicable
bNIST
National
Institute
ofStandardsandTechnology(G
aithersburg,Maryland,USA)
cMethodBlank
15mLDDW
solutionthat
followsthesameextractionprocedure
asthat
forsamples
dSOP
standardoperatingprocedure
Aerosol Sci Eng (2017) 1:7–24 19
123

Table
5Qualityassurance
(QA)activitiesforionchromatographyanalyses
QA
activity
Purpose
Frequency
Auditora
Acceptance
criteria
Response
action
Internal
system
and
perform
ance
audits
Ensure
compliance
with
operational
andquality
system
procedures
Everyyear
Perform
edbyinternal
QA
manager
Conform
ance
withlab
SOPsb,QAPPsc,quality
manual,and2009TNId
standard
Preparepreventiveor
correctiveactionsbased
onauditfindingsand
follow
upto
ensure
completionofspecified
actions
Technical
system
audits
Assessadequacyofand
conform
ance
withgood
laboratory
practices
and
QA/QC
procedures
Every3years
Perform
edbyexternal
auditor
Conform
ance
withgood
laboratory
practices
and
adherence
tolabSOPs
Prepareandim
plement
preventiveandcorrective
actionsas
needed
based
onauditfindings
Qualitysystem
audit
Assessadequacyofand
conform
ance
withquality
system
Every3years
Perform
edbyexternal
auditor
Conform
ance
withgood
laboratory
practices
and
adherence
tolabSOPs
Prepareandim
plement
preventiveandcorrective
actionsas
needed
based
onauditfindings
Perform
ance
evaluationsand
laboratory
inter-comparisons
Assesscomparabilityof
analyticalresultswith
standardsandother
laboratories
Everyyear
Perform
edbyexternal
auditteam
Within
specified
limitsand
agreem
entwithother
labs
usingdifferentcriteria
for
ICionse
Prepareandim
plement
preventiveandcorrective
actionsas
needed
based
onfindings
aForUSspeciationnetworks,
external
auditors
includetheUSEnvironmentalProtectionAgency
(U.S.EPA
2016b)andtheNational
EnvironmentalLaboratory
AccreditationProgram
(NELAP)(TNI2016)
bSOP
standardoperatingprocedure
cQAPP
QualityAssurance
Project
Plan
dTNINELAC
(National
EnvironmentalLaboratory
AccreditationConference)Institute
eIncludes
NO
� 3,SO
2�4,Naþ
,NH
þ 4,andK
þ
20 Aerosol Sci Eng (2017) 1:7–24
123
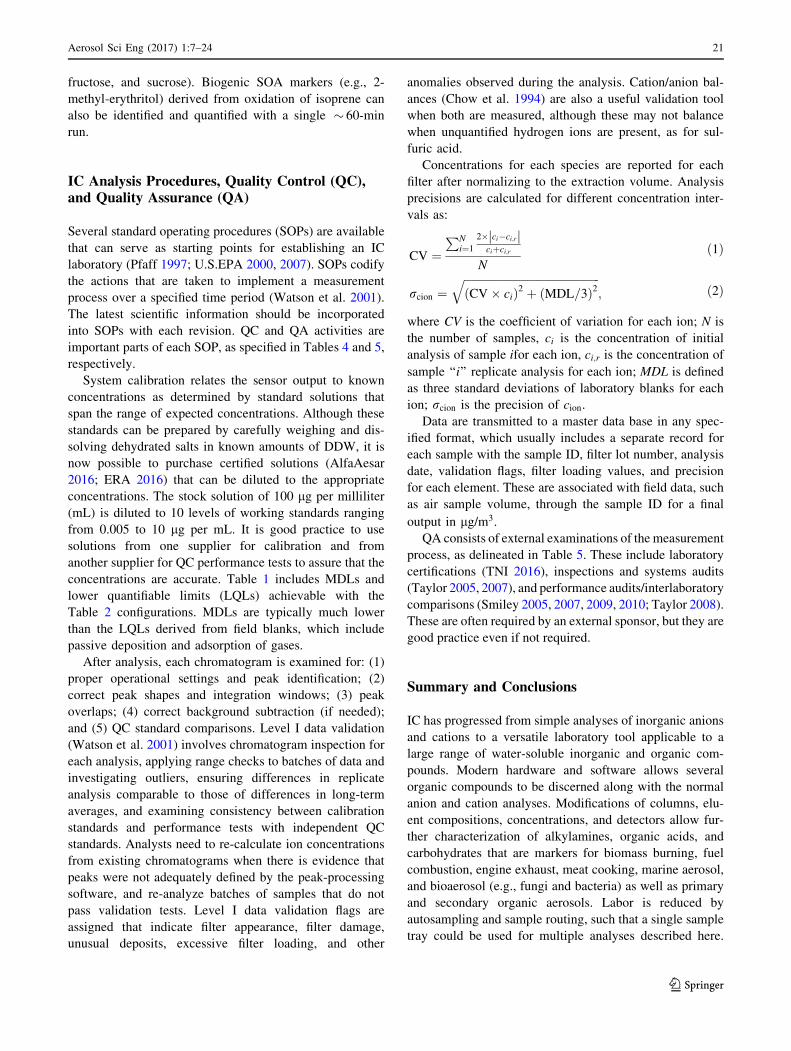
fructose, and sucrose). Biogenic SOA markers (e.g., 2-
methyl-erythritol) derived from oxidation of isoprene can
also be identified and quantified with a single � 60-min
run.
IC Analysis Procedures, Quality Control (QC),and Quality Assurance (QA)
Several standard operating procedures (SOPs) are available
that can serve as starting points for establishing an IC
laboratory (Pfaff 1997; U.S.EPA 2000, 2007). SOPs codify
the actions that are taken to implement a measurement
process over a specified time period (Watson et al. 2001).
The latest scientific information should be incorporated
into SOPs with each revision. QC and QA activities are
important parts of each SOP, as specified in Tables 4 and 5,
respectively.
System calibration relates the sensor output to known
concentrations as determined by standard solutions that
span the range of expected concentrations. Although these
standards can be prepared by carefully weighing and dis-
solving dehydrated salts in known amounts of DDW, it is
now possible to purchase certified solutions (AlfaAesar
2016; ERA 2016) that can be diluted to the appropriate
concentrations. The stock solution of 100 lg per milliliter
(mL) is diluted to 10 levels of working standards ranging
from 0.005 to 10 lg per mL. It is good practice to use
solutions from one supplier for calibration and from
another supplier for QC performance tests to assure that the
concentrations are accurate. Table 1 includes MDLs and
lower quantifiable limits (LQLs) achievable with the
Table 2 configurations. MDLs are typically much lower
than the LQLs derived from field blanks, which include
passive deposition and adsorption of gases.
After analysis, each chromatogram is examined for: (1)
proper operational settings and peak identification; (2)
correct peak shapes and integration windows; (3) peak
overlaps; (4) correct background subtraction (if needed);
and (5) QC standard comparisons. Level I data validation
(Watson et al. 2001) involves chromatogram inspection for
each analysis, applying range checks to batches of data and
investigating outliers, ensuring differences in replicate
analysis comparable to those of differences in long-term
averages, and examining consistency between calibration
standards and performance tests with independent QC
standards. Analysts need to re-calculate ion concentrations
from existing chromatograms when there is evidence that
peaks were not adequately defined by the peak-processing
software, and re-analyze batches of samples that do not
pass validation tests. Level I data validation flags are
assigned that indicate filter appearance, filter damage,
unusual deposits, excessive filter loading, and other
anomalies observed during the analysis. Cation/anion bal-
ances (Chow et al. 1994) are also a useful validation tool
when both are measured, although these may not balance
when unquantified hydrogen ions are present, as for sul-
furic acid.
Concentrations for each species are reported for each
filter after normalizing to the extraction volume. Analysis
precisions are calculated for different concentration inter-
vals as:
CV ¼PN
i¼1
2� ci�ci;rj jciþci;r
N
ð1Þ
rcion ¼ffiffiffiffiffiffiffiffiffiffiffiffiffiffiffiffiffiffiffiffiffiffiffiffiffiffiffiffiffiffiffiffiffiffiffiffiffiffiffiffiffiffiffiffiffiffiffiffiffi
ðCV� ciÞ2 þ ðMDL=3Þ2q
; ð2Þ
where CV is the coefficient of variation for each ion; N is
the number of samples, ci is the concentration of initial
analysis of sample ifor each ion, ci;r is the concentration of
sample ‘‘i’’ replicate analysis for each ion; MDL is defined
as three standard deviations of laboratory blanks for each
ion; rcion is the precision of cion.
Data are transmitted to a master data base in any spec-
ified format, which usually includes a separate record for
each sample with the sample ID, filter lot number, analysis
date, validation flags, filter loading values, and precision
for each element. These are associated with field data, such
as air sample volume, through the sample ID for a final
output in lg/m3.
QA consists of external examinations of the measurement
process, as delineated in Table 5. These include laboratory
certifications (TNI 2016), inspections and systems audits
(Taylor 2005, 2007), and performance audits/interlaboratory
comparisons (Smiley 2005, 2007, 2009, 2010; Taylor 2008).
These are often required by an external sponsor, but they are
good practice even if not required.
Summary and Conclusions
IC has progressed from simple analyses of inorganic anions
and cations to a versatile laboratory tool applicable to a
large range of water-soluble inorganic and organic com-
pounds. Modern hardware and software allows several
organic compounds to be discerned along with the normal
anion and cation analyses. Modifications of columns, elu-
ent compositions, concentrations, and detectors allow fur-
ther characterization of alkylamines, organic acids, and
carbohydrates that are markers for biomass burning, fuel
combustion, engine exhaust, meat cooking, marine aerosol,
and bioaerosol (e.g., fungi and bacteria) as well as primary
and secondary organic aerosols. Labor is reduced by
autosampling and sample routing, such that a single sample
tray could be used for multiple analyses described here.
Aerosol Sci Eng (2017) 1:7–24 21
123

These additional water-soluble species are useful to better
understand their abundances and variations in source pro-
filing and to refine aerosol source apportionment.
Acknowledgements This research is funded in part by the US
National Science Foundation (CHE-1214163 and CHE-1464501) and
the US EPA PM2:5 Chemical Speciation Network (CSN) Laboratory
Analysis Program (EP-D-15-0250). The authors would like to thank
Mr. Patrick Hurbain, Dr. Guenter Engling (now with California Air
Resources Board), Dr. Paul Cropper, and Mr. Steve Kohl for technical
input and laboratory analyses and Ms. Katherine Greenblatt of the
Desert Research Institute (DRI) for assembling and editing the
manuscript.
Compliance with ethical standards
Conflicts of interest On behalf of all authors, the corresponding
author states that there is no conflict of interest.
References
AlfaAesar (2016) Ion chromatography standards. AlfaAesar,
Tewksbury
Baker SC, Kelly DP, Murrell JC (1991) Microbial degradation of
methanesulfonic acid: a missing link in the biogeochemical
sulfur cycle. Nature 350:627–628. doi:10.1038/350627a0
Brent LC, Reiner JL, Dickerson RR, Sander LC (2014) Method for
characterization of low molecular weight organic acids in
atmospheric aerosols using ion chromatography mass spectrom-
etry. Anal Chem 86:7328–7336
Buchberger WW (2001) Detection techniques in ion chromatography
of inorganic ions Trac-Trends. Anal Chem 20:296–303. doi:10.
1016/s0165-9936(01)00068-1
Butt SB, Riaz M (2009) Determination of cations and anions in
environmental samples by HPLC: review. J Liq Chromatogr
Relat Technol 32:1045–1064. doi:10.1080/10826070902841299
Bytnerowicz A, Sanz MJ, Arbaugh MJ, Padgett PE, Jones DP, Davila
A (2005) Passive sampler for monitoring ambient nitric acid
(HNO3) and nitrous acid (HNO2) concentrations. Atmos Environ
39:2655–2660
Calloway CP, Li SM, Buchanan JW, Stevens RK (1989) A refinement
of the potassium tracer method for residential wood smoke.
Atmos Environ 23:67–69
Caseiro A, Marr IL, Claeys M, Kasper-Giebl A, Puxbaum H, Pio CA
(2007) Determination of saccharides in atmospheric aerosol
using anion-exchange high-performance liquid chromatography
and pulsed-amperometric detection. J Chromatogr A 1171:37–45
Chakrabarty RK et al (2016) Brown carbon aerosols from burning of
boreal peatlands: microphysical properties, emission factors, and
implications for direct radiative forcing Atmos. Chem Phys
16:3033–3040. doi:10.5194/acp-16-3033-2016
Cheng Z et al (2015) Estimation of aerosol mass scattering
efficiencies under high mass loading: case study for the megacity
of Shanghai. China Environ Sci Technol 49:831–838
Chow JC, Engelbrecht JP, Watson JG, Wilson WE, Frank NH, Zhu T
(2002) Designing monitoring networks to represent outdoor
human exposure. Chemosphere 49:961–978
Chow JC, Fujita EM, Watson JG, Lu Z, Lawson DR, Ashbaugh LL
(1994) Evaluation of filter-based aerosol measurements during
the. South Calif Air Qual Study Environ Mon Assess 30:49–80
Chow JC, Lowenthal DH, Chen L-WA, Wang XL, Watson JG (2015)
Mass reconstruction methods for PM2:5: a review. Air Qual
Atmos Health 8:243–263
Chow JC, Watson JG (1999) Ion chromatography in elemental
analysis of airborne particles. In: Landsberger S, Creatchman M
(eds) Elemental analysis of airborne particles, vol 1., Advances
in environmental industrial and process control technologies.
Gordon and Breach Science, Amsterdam, pp 97–137
Chow JC, Watson JG (2013) Chemical analyses of particle filter
deposits. In: Ruzer L, Harley NH (eds) Aerosols handbook :
measurement, dosimetry, and health effects, 2nd edn. CRC
Press/Taylor & Francis, New York, pp 179–204
Chow JC et al (1993) A sampling system for reactive species in the
western United States. In: Winegar ED, Keith LH (eds)
Sampling and analysis of airborne pollutants. Lewis Publishers,
Ann Arbor, MI, pp 209–228
Chow JC, Watson JG, Bowen JL, Frazier CA, Gertler AW, Hinsvark
BA, Fung KK (1990) Laboratory operations manual for the
California Acid Deposition Monitoring Program: Sample pre-
treatment, sample preparation, and chemical analysis, Final
report. Desert Research Institute, Reno, NV
Dabek-Zlotorzynska E et al (2011) Canadian National Air Pollution
Surveillance (NAPS) PM2:5 speciation program: methodology
and PM2:5 chemical composition for the years 2003–2008.
Atmos Environ 45:673–686
Davison B et al (1996) Dimethyl sulfide, methane sulfonic acid and
physicochemical aerosol properties in Atlantic air from the
United Kingdom to Halley Bay. J Geophys Res
101:22855–22868
Derrick M, Moyers J (1981) Precise and sensitive water-soluble ion
extraction method for aerosol samples collected on polytetraflu-
oroethylene filters. Anal Lett Part A Chem Anal 14:1637–1652
Donahue NM et al (2013) Why do organic aerosols exist?
Understanding aerosol lifetimes using the two-dimensional
volatility basis set. Environ Chem 10:151–157
Duvall RM, Majestic BJ, Shafer MM, Chuang PY, Simoneit BRT,
Schauer JJ (2008) The water-soluble fraction of carbon, sulfur,
and crustal elements in Asian aerosols and Asian soils. Atmos
Environ 42:5872–5884
Engling G et al (2006) Determination of levoglucosan in biomass
combustion aerosol by high-performance anion-exchange chro-
matography with pulsed amperometric detection. Atmos Environ
40:S299–S311
ERA (2016) Custom standards simplified. ERA: A Waters Company,
Golden, CO
Fenn JB (2002) Electrospray ionization mass spectrometry: how it all
began. J Biomol Tech 13:101–118
Fenn JB (2003) Electrospray wings for molecular elephants (Nobel
lecture). Angewandte Chem Int Edition 42:3871-3894. doi:10.
1002/anie.200300605
FisherScientific (2016) FalconTM 15mL Conical Centrifuge Tubes.
Thermo Fisher Inc, Waltham, MA
Fosco T, Schmeling M (2007) Determination of water-soluble
atmospheric aerosols using ion chromatography. Environ Mon
Assess 130:187–199
Fowler D et al (2015) Effects of global change during the 21st century
on the nitrogen cycle Atmos. Chem Phys 15:13849–13893.
doi:10.5194/acp-15-13849-2015
Fritz JS (1991) Principles and applications of ion-exclusion. chro-
matogr J Chromatogr A 546:111–118
Galloway JN, Dentener FJ, Capone DG, Boyer EW, Howarth RW,
Seitzinger SP, Asner GP, Cleveland CC, Green PA, Holland EA,
Karl DM, Michaels AF, Porter JH, Townsend AR, Vorosmarty
CJ (2004) Nitrogen cycles: past, present, and future. Biogeo-
chemistry 70:153–226
Gama MR, Silva RGD, Collins CH, Bottoli CBG (2012) Trac Trends
Anal Chem. Hydrophilic interaction chromatography 37:48–60.
doi:10.1016/j.trac.2012.03.009
22 Aerosol Sci Eng (2017) 1:7–24
123

Garcia CD, Engling G, Herckes P, Collett JL Jr, Henry CS (2005)
Determination of levoglucosan from smoke samples using
microchip capillary electrophoresis with pulsed amperometric
detection. Environ Sci Technol 39:618–623
Ge XL, Wexler AS, Clegg SL (2011) Atmospheric amines - Part I. A
review. Atmos Environ 45:524–546
Gennaro MC, Angelino S (1997) Separation and determination of
inorganic anions by reversed-phase high-performance liquid
chromatography. J Chromatogr A 789:181–194. doi:10.1016/
s0021-9673(97)00971-0
Granath G, Limpens J, Posch M, Mucher S, De Vries W (2014)
Spatio-temporal trends of nitrogen deposition and climate effects
on Sphagnum productivity in European peatlands. Environ
Pollut 187:73–80
Hartwell SK, Kehling A, Lapanantnoppakhun S, Grudpan K (2013)
Flow injection/sequential injection chromatography: a review of
recent developments in low pressure with high performance
chemical separation. Anal Lett 46:1640–1671
Hawkins LN, Russell LM, Covert DS, Quinn PK, Bates TS (2010)
Carboxylic acids, sulfates, and organosulfates in processed
continental organic aerosol over the southeast Pacific Ocean
during VOCALS-REx 2008. J Geophys Res-Atmos 115
Hecobian A, Evanoski-Cole A, Eiguren-Fernandez A, Sullivan AP,
Lewis GS, Hering SV, Collett JL (2016) Evaluation of the
Sequential Spot Sampler (S3) for time-resolved measurement of
PM2:5 sulfate and nitrate through lab and field measurements
Atmospheric. Meas Tech 9:525–533. doi:10.5194/amt-9-525-
2016
Ho KF et al (2015) Characteristics of water-soluble organic nitrogen
in fine particulate matter in the continental area of China. Atmos
Environ 106:252–261
Hoffer EM, Kothny EL, Appel BR (1979) Simple method for
microgram amounts of sulfate in atmospheric particles. Atmos
Environ 13:303–306. doi:10.1016/0004-6981(79)90173-2
Iinuma Y, Engling G, Puxbaum H, Herrmann H (2009) A highly
resolved anion-exchange chromatographic method for determi-
nation of saccharidic tracers for biomass combustion and
primary bio-particles in atmospheric aerosol. Atmos Environ
43:1367–1371
IMPROVE (2016) Interagency Monitoring of Protected Visual
Environments. National Park Service, Ft., Collins, CO
Karthikeyan S, See SW, Balasubramanian R (2007) Simultaneous
determination of inorganic anions and selected organic acids in
airborne particulate matter by ion chromatography. Anal Lett
40:793–804
Karu N, Dicinoski GW, Haddad PR (2012) Use of suppressors for
signal enhancement of weakly-acidic analytes in ion chromatog-
raphy with universal detection methods. Trac Trends Anal Chem
40:119–132
Kundu S, Kawamura K, Andreae TW, Hoffer A, Andreae MO (2010)
Molecular distributions of dicarboxylic acids, ketocarboxylic
acids and alpha-dicarbonyls in biomass burning aerosols:
implications for photochemical production and degradation in
smoke layers Atmos. Chem Phys 10:2209–2225
Lachat (2016) QuikChem with ion chromatography option. Lachat
Instruments, Loveland, CO
Laskin A, Laskin J, Nizkorodov SA (2015) Chemistry of atmospheric
brown carbon. Chem Rev 115:4335–4382
Lucy CA, Wahab MF (2013) Advances in high-speed and high-
resolution ion chromatography. LC GC Eur 31:38-42
Mazurek MA, Cass GR, Simoneit BRT (1989) Interpretation of high-
resolution gas chromatography and high-resolution gas chro-
matography/mass spectrometry data acquired from atmospheric
organic aerosol samples. Aerosol Sci Technol 10:408–420
Metrohm (2016) Ion chromatography. Metrohm AG, Herisau,
Switzerland
Michalski R (2014) Application of ion chromatography in clinical
studies and pharmaceutical industry. Mini Rev Med Chem
14:862–872
Michalski R (2016) Application of IC-MS and IC-ICP-MS in
environmental research. Wiley, New York, NY
Millet DB et al (2015) A large and ubiquitous source of atmospheric
formic acid. Atmos Chem Phys 15:6283–6304
Miyazaki Y, Fu PQ, Ono K, Tachibana E, Kawamura K (2014)
Seasonal cycles of water-soluble organic nitrogen aerosols in a
deciduous broadleaf forest in northern Japan. J Geophys Res
Atmos 119:1440–1454
Mouli PC, Mohan SV, Reddy SJ (2003) A study on major inorganic
ion composition of atmospheric aerosols at Tirupati. J Hazard
Mater 96:217–228
Nakatani N, Kozaki D, Mori M, Tanaka K (2012) Recent progress
and applications of ion-exclusion/ion-exchange chromatography
for simultaneous determination of inorganic anions and cations.
Anal Sci 28:845–852
Olariu RI, Vione D, Grinberg N, Arsene C (2015) Applications of
liquid chromatographic techniques in the chemical characteriza-
tion of atmospheric aerosols. J Liq Chromatogr Relat Technol
38:322–348
Pall (2016) NylasorbTM nylon membrane disc filters. Pall Corpora-
tion, East Hills, NY
Pfaff JD, Hautman DP, Munch DJ (1997) Methd 300.1: Determina-
tion of inorganic anions by ion chromatography. US Environ-
mental Protection Agency, Research Triangle Park, NC
Pitchford ML, Malm WC, Schichtel BA, Kumar NK, Lowenthal DH,
Hand JL (2007) Revised algorithm for estimating light extinction
from IMPROVE particle speciation data. JAWMA
57:1326–1336
Pohl C (2013) Recent developments in ion exchange columns for ion
chromatography. LC GC Eur 31:16–22
Small H, Stevens TS, Bauman WC (1975) Novel ion exchange
chromatographic method using conductimetric detection. Anal
Chem 47:1801–1809
Smiley J (2005) Technical memorandum: experimental intercompar-
ison of speciation laboratories. US Environmental Protection
Agency, Montgomery, AL
Smiley J (2007) Technical memorandum: experimental intercompar-
ison of speciation laboratories. US Environmental Protection
Agency, Montgomery, AL
Smiley J (2009) Technical memorandum: experimental intercompar-
ison of speciation laboratories. US Environmental Protection
Agency, Montgomery, AL
Smiley J (2010) Technical memorandum: experimental intercompar-
ison of speciation laboratories. US Environmental Protection
Agency, Montgomery, AL
Stevens RK, Dzubay TG, Russwurm GA, Rickel DE (1978) Sampling
and analysis of atmospheric sulfates and related species. Atmos
Environ 12:55–68
Sullivan AP, Frank N, Onstad G, Simpson CD, Collett JL Jr (2011)
Application of high-performance anion-exchange chromatogra-
phy-pulsed amperometric detection for measuring carbohydrates
in routine daily filter samples collected by a national network: 1.
Determination of the impact of biomass burning in the upper
Midwest. J Geophys Res-Atmos 116:D8. doi:10.1029/
2010JD014166
Talebi SM, Abedi M (2005) Determination of atmospheric concen-
trations of inorganic anions by ion chromatography following
ultrasonic extraction. J Chromatogr A 1094:118–121. doi:10.
1016/j.chroma.2005.07.118
Taylor S (2005) Technical memorandum: DRI laboratory audit. US
Environmental Protection Agency, Montgomery, AL
Taylor S (2007) Technical memorandum: DRI laboratory audit. US
Environmental Protection Agency, Montgomery, AL
Aerosol Sci Eng (2017) 1:7–24 23
123

Taylor S (2008) Technical memorandum: experimental intercompar-
ison of speciation laboratories. US Environmental Protection
Agency, Montgomery, AL
ten Brink HM, Otjes R, Jongejan P, Slanina S (2007) An instrument
for semi-continuous monitoring of the size-distribution of
nitrate, ammonium, sulphate and chloride in aerosol. Atmos
Environ 41:2768–2779
Thermo-Dionex (2016) Ion chromatography. Thermo Scientific Inc,
Waltham, MA
TNI (2016) National Environmental Laboratory Accreditation Pro-
gram (NELAP). The NELAC Institute (TNI), Weatherford, TX
Turetsky MR, Benscoter B, Page S, Rein G, van der Werf GR, Watts
A (2015) Global vulnerability of peatlands to fire and carbon
loss. Nature Geosci 8:11–14
U.S.EPA (2000) NAREL standard operating procedure—Cation
analysis for the PM2:5 chemical speciation QA program. U.S.
Environmental Protection Agency, Las Vegas, NV
U.S.EPA (2007) Method 9056A: Determination of inorganic anions
by ion chromatography. Environmental Protection Agency, USA
U.S.EPA (2016a) Chemical speciation. US Environmental Protection
Agency, Research Triangle Park, NC
U.S.EPA (2016b) PM2:5 speciation lab audit reports and assessments.
US Environmental Protection Agency, Research Triangle Park,
NC
URG (2016) Ambient nitrate and sulfate monitor. URG Corporation,
Chapel Hill, NC
VandenBoer TC, Markovic MZ, Petroff A, Czar MF, Borduas N,
Murphy JG (2012) Ion chromatographic separation and quanti-
tation of alkyl methylamines and ethylamines in atmospheric gas
and particulate matter using preconcentration and suppressed
conductivity detection. J Chromatogr A 1252:74–83
Wang Y, Zhang QQ, He K, Zhang Q, Chai L (2013) Sulfate-nitrate-
ammonium aerosols over China: response to 2000–2015 emis-
sion changes of sulfur dioxide, nitrogen oxides, and ammonia
Atmos. Chem Phys 13:2635–2652
Wang YH, Field RD, Roswintiarti O (2004) Trends in atmospheric
haze induced by peat fires in Sumatra Island, Indonesia and El
Nino phenomenon from 1973 to 2003. Geophys Res Lett 31
Waters (2016) Acquity UPC2 system. Waters Corporation, Milford,
MA
Watson JG (2002) Visibility: science and regulation—critical review.
JAWMA 52:628-713
Watson JG, Chow JC (2013) Source apportionment. In: El-Shaarwi
AH, Piegorsch WW (eds) Encyclopedia of environmetrics.
Wiley, Chichester, pp 1–8
Watson JG, Chow JC (2015) Receptor models and measurements for
identifying and quantifying air pollution sources. In: Murphy
BL, Morrison RD (eds) Introduction to Environmental Forensics,
3rd edn. Elsevier, Amsterdam, pp 677–706
Watson JG et al (1991) Measurements of dry deposition parameters
for the California Acid Deposition Monitoring Program. Desert
Research Institute, Reno, NV
Watson JG, Chow JC, Engling G, Chen L-WA, Wang XL (2016)
Source apportionment: principles and methods. In: Harrison RM
(ed) Airborne particulate matter: sources, atmospheric processes
and health. Royal Society of Chemistry, London, pp 72–125
Watson JG, Turpin BJ, Chow JC (2001) The measurement process:
precision, accuracy, and validity. In: Cohen BS, McCammon CS
Jr (eds) Air sampling Instruments for Evaluation of Atmospheric
Contaminants, 9th edn. American Conference of Governmental
Industrial Hygienists, Cincinnati, OH, pp 201-216
Weber RJ, Orsini D, Daun Y, Lee YN, Klotz PJ, Brechtel F (2001) A
particle-into-liquid collector for rapid measurement of aerosol
bulk chemical composition. Aerosol Sci Technol 35:718–727
Wolfson JM (1980) Determination of microgram quantities of
inorganic sulfate in atmospheric particulates. JAPCA
30:688–690
Yttri KE et al (2015) An intercomparison study of analytical methods
used for quantification of levoglucosan in ambient aerosol filter
samples. Atmos Measurement Tech 8:125–147
Yu XY, Lee T, Ayres B, Kreidenweis SM, Collett JL Jr, Malm WC
(2005) Particulate nitrate measurement using nylon filters.
JAWMA 55:1100–1110
Zhang FF, Shen GB, Ji SL, Yang BC (2015) Recent advances of
stationary phases for hydrophilic interaction liquid chromatog-
raphy and ion chromatography. J Liq Chromatogr Relat Tech
38:349–352. doi:10.1080/10826076.2014.941258
Zhang XY, Wang YQ, Niu T, Zhang XC, Gong SL, Zhang YM, Sun
JY (2012) Atmospheric aerosol compositions in China: spatial/
temporal variability, chemical signature, regional haze distribu-
tion and comparisons with global aerosols Atmos. Chem Phys
12:779–799
Zhang ZS et al (2013) Determination of isoprene-derived secondary
organic aerosol tracers (2-methyltetrols) by HPAEC-PAD:
Results from size-resolved aerosols in a tropical rainforest.
Atmos Environ 70:468–476
24 Aerosol Sci Eng (2017) 1:7–24
123