enhanced infrastructure financing districts - slo evc - a mechanism for eco-rapid transit... ·...
TRANSCRIPT

Enhanced Infrastructure Financing Districts A Mechanism to Finance Eco-Rapid Transit
University of Southern California, Sol Price School of Public Policy
Master of Planning Course: Planning Studio
December 2014

DEC 2014 ENHANCED INFRASTRUCTURE FINANCING DISTRICTS A MECHANISM TO FINANCE ECO-RAPID TRANSIT
II | P a g e
ACKNOWLEDGEMENT The team is proud to present this report Enhanced Infrastructure Financing District: A Mechanism to Finance Eco-
Rapid Transit for our University of Southern California (USC) graduate planning studio project. This report is
based on the planning and analysis work of our core team comprising of:
• Rebecca Chung
• Qianyao Duan
• Adam Montgomery
• Kristine Rose
• Rui Tu
• Sasha Ussef
• Siyuan Yin
The study works were completed under the guidance and supervision of Mark Pisano, a professor of the
Practice of Public Administration at the USC Sol Price School of Public Policy. Serving as the executive director of
the Southern California Association of Governments (SGAG) for the past 31 years, his experience and
knowledge contributed greatly to the success of this project.
The team would also like to thank the contribution of those who ably prepared the necessary background
material and data required for the analysis of this report as well as providing our team with constructive
feedback regarding our work. These individuals are hereby gratefully acknowledged:
• Walter Beaumont
• Greg Devereaux
• Norman Emerson
• Gail Goldberg
• Michael Kodama
• Allyn Rifkin
• Fred Silva
• Lillian Burkenheim Silver
• Ping Wang
• Eco-Rapid Transit Staff

DEC 2014 ENHANCED INFRASTRUCTURE FINANCING DISTRICTS A MECHANISM TO FINANCE ECO-RAPID TRANSIT
III | P a g e
Table of Contents
1 OVERVIEW: ECO-RAPID TODAY AND VISION FOR TOMORROW ................................................................... 1 1.1 The Corridor Today ....................................................................................................................................... 1 1.2 Eco-Rapid’s Vision ......................................................................................................................................... 2 1.3 Implementation of a Public Dialogue ......................................................................................................... 2
2 BACKGROUND: STATE OF ECO-RAPID TRANSIT ............................................................................................. 3 3 BRINGING THE VISION: LITERATURE REVIEW OF LONDON CASE STUDY ................................................... 4 4 ENHANCED INFRASTRUCTURE FINANCING DISTRICTS (EIFD) ...................................................................... 6
4.1 Overview ........................................................................................................................................................ 7 4.2 Funding Strategies ........................................................................................................................................ 7 4.3 Facilities Financed by an EIFD ...................................................................................................................... 8 4.4 Differences between RDA, IFD, and EIFD ................................................................................................... 8 4.5 Benefits and Barriers of EIFD .................................................................................................................... 11 4.6 Multiple Funding Streams Available to use in EIFDs ............................................................................... 12
5 PROPOSED EIFD IMPLEMENTATION FOR ECO-RAPID ................................................................................. 13 5.1 Specific Steps for Eco-Rapid to Create and use EIFDs ............................................................................ 14
6 CASE STUDY: DOWNEY STATION ................................................................................................................... 15 6.1 Station Overview ......................................................................................................................................... 16 6.2 Opportunities for Value Capture ............................................................................................................... 19 6.3 Financial Strategy & Modeling Results ..................................................................................................... 21
6.3.1 Tax Increment Financing and Developer Fees ............................................................................... 21 6.3.2 Motor Vehicle-in-Lieu Fees (VLF) ...................................................................................................... 25 6.3.3 Parking Management Fees ............................................................................................................... 26
6.4 Summary of Value Capture ........................................................................................................................ 29 7 TOOLS FOR SUCCESSFUL ANALYSIS .............................................................................................................. 30 8 CONCLUSION ................................................................................................................................................... 31 REFERENCES ................................................................................................................................................................ 32 Appendix A: Key Terms and Explainer Overview
Appendix B: Visual Structure of EIFD JPA
Appendix C: Assumptions for Tax Increment Financing
Appendix D: Assumptions for VLF Backfill
Appendix E: Assumptions for Parking Management In-Lieu Fee

DEC 2014 ENHANCED INFRASTRUCTURE FINANCING DISTRICTS A MECHANISM TO FINANCE ECO-RAPID TRANSIT
1 | P a g e
By embodying the vision of the public, the planning process reframes cities and has the ability to use many
mechanisms to create infrastructure, opportunities, and spaces for the people. Financial tools primarily
drive these changes and developments that ultimately create wealth for a region. Through a regional
collaborative and systematic effort, cities can create and capture more of this wealth. To erect this vision of
city advancement requires the engagement of all stakeholders to strategically invest and regenerate a
fiscally stressed city through competitive, attractive economic development.
1 OVERVIEW: ECO-RAPID TODAY AND VISION FOR TOMORROW Eco-Rapid Transit’s rail initiative will transform the Los Angeles and Orange County region if the
organization continues to collaborate. To expedite implementation of the rail corridor by providing access
to multiple funding streams, Eco-Rapid can use an Enhanced Infrastructure Financing District (EIFD), signed
into legislation under the purview of Senate Bill 628, to capture the inherent wealth created increased
socio-economic opportunities of the corridor. EIFD will not be a platform for negotiation, deliberation, or
even consensus, but rather a mode that promotes the process of thinking together in order to build
various forms of necessary infrastructure while using financial tools efficiently to address the pressing
needs of a place and a people. A common
understanding will provide the basis for a clear
analysis and deeper exploration of the varied
narratives and perspectives of multiple
constituents.
1.1 The Corridor Today The project’s focus area, a 34-mile corridor that
extends north and south of downtown Los Angeles,
has an elaborate history that has shaped the places’
current state of organization and infrastructure.
The needs of these cities vary, but the Eco-Rapid
project can positively influence each place if the
process remains flexible and open to the current
conditions of these places.
Figure 1: Project Location

DEC 2014 ENHANCED INFRASTRUCTURE FINANCING DISTRICTS A MECHANISM TO FINANCE ECO-RAPID TRANSIT
2 | P a g e
The scope of the project requires the participation of many cities. The magnitude and significance of the
project will attract further engagement if the dialogue revolves around the specific public needs of each
jurisdiction. Therefore, understanding the initial point of public dialogue will occur through defining the
scale and underlying needs and urgencies for the project. Currently, the existing JPA (Joint Powers
Authority) has acquired some funding and produced studies and plans about the corridor. The jurisdictions
participating in the JPA have specific demands addressed in the plans, however, under the uniformly
prescribe to an overarching mission of increased opportunities.
By focusing on the rail project through an economic development plan that integrates mixed-use
infrastructure, the public can reconsider the potential socio-economic opportunities for the area. Through
the 3-D process - decentralized, diversified, and distributed- communities can create a platform to seek
further opportunities to thrive and develop long term (Pisano, 2013). Due to the current fiscal stress of the
state, financing projects has become more difficult because of the dependence on stressed public funds
and individual income levels (Pisano, 2013). Creating partnerships across sectors in order to improve
resource management and implement an outward procurement process will promote the decentralization
of networks and information and encourage user based systems (Pisano, 2013). The Eco-Rapid Transit rail
projects can inspire increased transparency amongst stakeholders, a platform for social and economic user
benefits, an occasion to preserve and progress the identity of residents in the jurisdictions, and will provide
fiscal, environmental, and innovation transformations for the community.
1.2 Eco-Rapid’s Vision In hopes of creating better communities adjacent to the project, the rail line will not only improve
accessibility and mobility, but will enhance the quality of quotidian life in these cities. The goals and
objectives of the project include economic stimulus, environmental justice, and creating public spaces
through the greening of the area. Each of these objectives will create wealth in the region that can and
should be captured. Enhanced Infrastructure Financing Districts serves as a mechanism to capture this
wealth by transforming land use and engineering plans into business plans.
1.3 Implementation of a Public Dialogue Prior to attempting to fulfill the need of a place, an extensive consideration of the current infrastructure is
necessary. How do we support a community plan for each of the participating members while keeping the
overarching ideas of the Eco-Rapid project in mind? How can we create a business plan that includes and
provides for the interests of all constituents? Transparency is key in order to understand the connections
between development and infrastructure.

DEC 2014 ENHANCED INFRASTRUCTURE FINANCING DISTRICTS A MECHANISM TO FINANCE ECO-RAPID TRANSIT
3 | P a g e
When reconsidering the built environment of a place, it is important to be cautious about meeting specific
demands of the public while understanding the changes that will occur in the long run. A flexible structure
that allows for site-specific growth defined through the applied financial tools will support strategic growth
of a city. This is further supported by a collaborative, corridor approach. The implementation of an EIFD
will catalyze significant public dialogue that will support not only the growth of infrastructure, but most
importantly the dialogue of the people and place. Interaction with stakeholders should be similar to the
process described in the London case below.
2 BACKGROUND: STATE OF ECO-RAPID TRANSIT Composed of 13 members and several supporting agencies, Eco-Rapid Transit, formerly known as the
Orangeline Development Authority (OLDA) is a joint powers authority (JPA) established for the purpose of
pursuing the development of a transit system. The system plans to be environmentally friendly and energy
efficient, while also providing improved transportation options to expand economic growth in the region.
The 13 members of the agency have proposed stations that will be located along a former Pacific Electric
Right-of-Way south of downtown Los Angeles (the West Santa Ana Branch) and a remaining rail corridor
north of downtown Los Angeles (the Antelope Valley Line). The current project scope proposes the
northernmost station be located at the Bob Hope Airport in the City of Burbank and the southernmost
station be located in the city of Artesia.
Formed in 2003, the Orangeline Development Authority was established to support mobility across the
Southern California region, with the specific objective of developing additional travel options in the
corridor. During its initial years, the agency strongly advocated for a transit line using Maglev technology to
connect the two counties; however, as alternatives have been analyzed, the agency has switched its focus
to a rail transit line. Over the course of its 11-year existence, city membership in the agency has fluctuated
resulting in changes in the scale of the project. As the years have progressed, the agency has generally
experienced a decreasing scale in the magnitude of the project. At its most extensive, the transit project’s
concept stretched from Palmdale in northern Los Angeles County to Santa Ana in Orange County. In the
last year alone, the agency has lost several city members including Palmdale, Cerritos, and Santa Ana.
Departures have placed constraints on the budget as membership dues have decreased to reflect the
fewer track miles of the future transit line. The project scope has contracted as city membership has
decreased, with the scope now extending from Bob Hope Airport to Artesia and focused on the following
13 members:

DEC 2014 ENHANCED INFRASTRUCTURE FINANCING DISTRICTS A MECHANISM TO FINANCE ECO-RAPID TRANSIT
4 | P a g e
Table 1: Members of Eco-Rapid Transit
* City of Artesia * City of Huntington Park * City of Bell * City of Maywood * City of Bellflower * City of Paramount * City of Bell Gardens * City of South Gate * City of Cudahy * City of Vernon * City of Downey * Burbank/Glendale/Pasadena Airport Authority * City of Glendale
Total development costs for the Southern portion of the transit line extending from Downtown Los Angeles
to Artesia are estimated to be up to $3 billion (Ikhrata, 2013). Currently, the agency has secured $240
million in funding, which will be available in 2015, from the Los Angeles County voter approved Measure R
program. Further funding has been received for station, land use, and alternatives studies and analysis. In
2005, the agency was allocated $280,000 in Safe, Accountable, Flexible, Efficient Transportation Equity Act:
A Legacy for Users (SAFETEA-LU) federal funding to conduct preliminary station and land use analysis. In
2012, the Los Angeles County Metropolitan Transportation Authority (MTA), the Southern California
Association of Governments (SCAG), and the Orange County Transportation Act (OCTA) conducted a $1.8
million alternatives analysis, specifically for the Pacific Electric Right-of-Way stretching from Paramount to
Santa Ana (Ikhrata, 2013).
3 BRINGING THE VISION: LITERATURE REVIEW OF LONDON CASE STUDY The fundamental role of government is creating the formal and informal incentives for all the organizations
in society to operate in a way, through systematic innovation, that achieves desired goals (Pisano, n.d.).
The vision to implement infrastructure at the scale presented by Eco-Rapid Transit, begins at the
framework of the 3-D approach: decentralized, diversified, and distributed (Pisano, n.d.). Ken Livingstone,
the first Mayor of the Greater London Authority, initiated the regeneration of the city during a moment of
fiscal stress by focusing on two features of the city: transportation and land use planning. The former
mayor used his authority to exercise effective socio-economic change through focusing solely on land use
and transportation issues. Livingstone creatively took advantage of a systematic approach to collaborative
thinking in order to allow the public to have oversight over the process of developing the built
environment. He did not issue concessions, and instead reconfigured the system through evaluating
performance and providing opportunities for public oversight.
London’s rail network includes a high speed international rail, central underground tube system, and an
extensive bus system. The tube and bus systems have been governed by the national government and

DEC 2014 ENHANCED INFRASTRUCTURE FINANCING DISTRICTS A MECHANISM TO FINANCE ECO-RAPID TRANSIT
5 | P a g e
depended on the private sector for development (Pisano, n.d.). Along with these systems the radial city was
experiencing increased congestion from the highway and road network (Pisano, n.d.). Livingstone
appointed Bob Kiley as the transportation commissioner of the Transportation for London (TFL), and
together worked to shift the framework. Conventionally, the P3 approach allowed for the public sector to
contract with the private. This procurement instrument privatized operation and left the fiscal
responsibility and risk with the public sector (Pisano, n.d.).
Both opposed this system, Livingstone and Kiley gained public support by making the consumer appreciate
the value of transit and emphasize the consumer’s role as primary decision maker (Pisano, n.d.). The
development strategy shifted the procurement process and enabled the ties to be formed between the TFL
and other entities in order to create more funding streams to support the transit improvements in the
system and the adjacent areas. He pushed cars out of the central portion of the city by implementing a
congestion pricing fee. This not only decreased CO2 emissions, but also reduced the amount of vehicles
coming into the city and encouraged public transit (Pisano, n.d.). The tube was refurbished and upgraded,
to support sustainable systems, increased ridership, and improved information systems. The introduction
of the information chip, the Oyster Card, improved the collection of revenues and operational facilities
(Pisano, n.d.). These changes affected the travel behavior of individuals in the city, and were able to
complement these social changes with economic decisions. He also increased the pricing of the
underground system, assuming that the better designed, more flexible and accessible system increased
customer satisfaction and the demand for service (Pisano, n.d.).
Further, the public sector and the private sector used their capacity as partners to work on a transparent
level and within a specific legal framework in order to fund the acquisition of land, the development of
infrastructure, and the production of long-term investment strategies (Pisano, n.d.). The highly organized
TFL examined and understood the linkages of the national and international rails lines to the underground
system. With this, two upgrades to the system were introduced - the Crossrail and the London Overground.
These lines created more connectivity, increased the rail capacity, reduced travel time, increased ridership,
and affected the adjacent land uses especially in high-growth areas. Due to these changes the income
stream also increased (Pisano, n.d.). The $21 billion Crossrail project, which included 42 stations over 25
miles, was the largest capital structure project made in western countries. The funding strategy pulled from
three different sources - national funds, a beneficial use stream, and the increased productivity of
investments affected by the farebox recovery. Businesses were encouraged to support the underground
and overground systems. This allowed the for local authorities to implement community impact levies
(CILs) over the 50-year time period of the program, which are fees that are placed on business properties
that are put towards the cost of funding infrastructure (Pisano, n.d.).

DEC 2014 ENHANCED INFRASTRUCTURE FINANCING DISTRICTS A MECHANISM TO FINANCE ECO-RAPID TRANSIT
6 | P a g e
The success factors in the case of London can be applied to elements of the US system. It is important to
keep in mind the following key elements of integrated problem solving and funding strategies (Pisano, n.d.):
Policy and staff leadership must transcend political cycles and parties long-term. They must
identify the scale of the project, the correct spatial linkages, and a structure to capture benefits.
Any strategic plan that includes a series of programming, projects, or investments tended toward a
specific outcome must have quantified benefits that can be used as a mechanism to motivate
users, consumers, and voters to pay the necessary fees.
Collaboration on levels - public, private, and community - in order to identify which tradeoffs will
lead to a desirable outcome is necessary.
Create accountability for the service through a marketing approach led by an executive that
brands the service with a great level of transparency and communication in order to build trust
with the existing and potential consumers and users.
Mega-regional decision making framework that provides a nexus between decisions and actions
through the lens of finance. During fiscal stress, this will create more beneficial use funding
strategies to accompany the conventional tools. Create a team of staff that works together and
understands the significance of enterprise funding that accompanies the development of the
system.
Overall, these strategies changed the demographic composition, therefore, increasing the economic
competitiveness of London. With a clear organization structure and a focus on financing specific
infrastructure projects, it is possible to create beneficial change in your city.
4 ENHANCED INFRASTRUCTURE FINANCING DISTRICTS (EIFD) Similar to London, Eco-Rapid Transit has taken a revolutionary approach to transit finance by taking a
transportation project and transforming it into one focused on economic development. Eco-Rapid member
cities have realized that collaboration is the key. In order to capture the most wealth for the region, this
cannot just be a project that uses Right-of-Way (ROW) and bids for the most attractive Transit Oriented
Development, but must in fact be a system wide regeneration effort. As Eco-Rapid Transit already foresees
the rail projects as economic and environmental justice projects, the project was inherently designed to
create wealth around newly developed transit stations, providing access to employment centers, and
improving the quality of life through new, affordable housing. With access to Enhanced Infrastructure
Financing Districts (EIFDs), Eco-Rapid is poised to develop a business plan that captures the wealth created

DEC 2014 ENHANCED INFRASTRUCTURE FINANCING DISTRICTS A MECHANISM TO FINANCE ECO-RAPID TRANSIT
7 | P a g e
by the transit line to fund environmentally efficient rail that creates competitive, attractive economic
development and improved quality of life for area residents.
4.1 Overview Introduced first in February of 2013 by Senators Beall and Wolk, EIFD Senate Bill No. 628 was signed into
law by Governor Jerry Brown on September 26, 2014 as a mechanism to fund construction and
rehabilitation of public infrastructure projects in California. EIFDs are independent government entities that
“drive sustainable growth by connecting a vast number of infrastructure projects with a new array of
funding streams” and by placing financing decisions at the front of the planning stage, rather than after
(California Economic Summit, 2014). While dramatically and influentially different, EIFDs will likely have the
impacts on local agency planning and development similar to the Redevelopment Agencies of past. A brief
set of key terms and an explainer document can be found in Appendix A.
4.2 Funding Strategies EIFD’s may fund infrastructure using the following mechanisms (Enhanced Infrastructure Financing
Districts, 2014):
1. Property tax increment of consenting taxing agencies (cities, counties, special districts but not
schools).
2. Revenues from property tax corresponding to the increase in assessed valuation of taxable
property attributed to those property shares received by a city or county pursuant to in lieu of VLF
and dedicated to a city or county to the EIFD.
3. Property tax revenue distributed to a city, county or special district after payment of a successor
agency debts.
4. Fees or assessment revenues derived from one of 10 specified existing sources, including
assessments for benefits and developer fees.
5. Loans from a city, county or special district, that must be repaid at no more than the Local Agency
Investment Fund (LAIF) interest rate that is in effect on the date the loan is approved by the
governing board of the city, county or special district making the loan.
6. User Fees and Partnerships derived from the use of the Infrastructure Finance and Investment
Act, which the EIFD can use as it is established as an separate government entity.
7. Availability Payments, annual payments to a third party, which sit as line item entries city or
county budgets and are amortized over a specified period.
DEC 2014 ENHANCED INFRASTRUCTURE FINANCING DISTRICTS A MECHANISM TO FINANCE ECO-RAPID TRANSIT
8 | P a g e
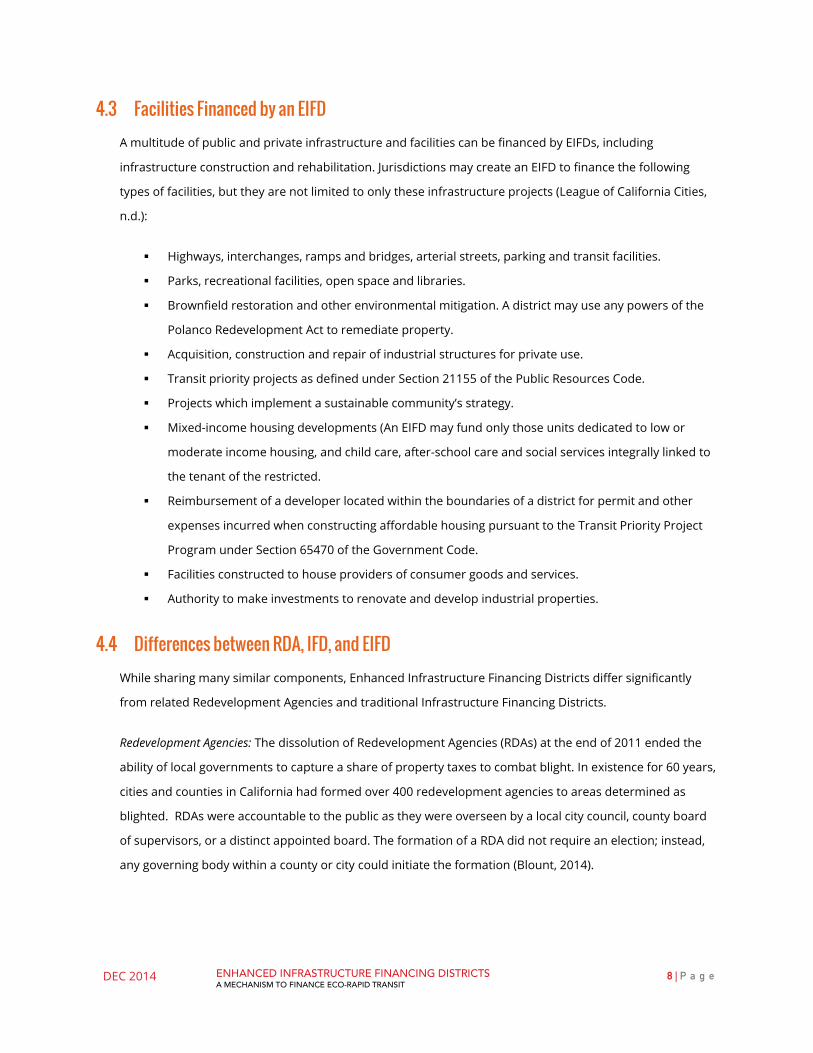
4.3 Facilities Financed by an EIFD A multitude of public and private infrastructure and facilities can be financed by EIFDs, including
infrastructure construction and rehabilitation. Jurisdictions may create an EIFD to finance the following
types of facilities, but they are not limited to only these infrastructure projects (League of California Cities,
n.d.):
Highways, interchanges, ramps and bridges, arterial streets, parking and transit facilities.
Parks, recreational facilities, open space and libraries.
Brownfield restoration and other environmental mitigation. A district may use any powers of the
Polanco Redevelopment Act to remediate property.
Acquisition, construction and repair of industrial structures for private use.
Transit priority projects as defined under Section 21155 of the Public Resources Code.
Projects which implement a sustainable community’s strategy.
Mixed-income housing developments (An EIFD may fund only those units dedicated to low or
moderate income housing, and child care, after-school care and social services integrally linked to
the tenant of the restricted.
Reimbursement of a developer located within the boundaries of a district for permit and other
expenses incurred when constructing affordable housing pursuant to the Transit Priority Project
Program under Section 65470 of the Government Code.
Facilities constructed to house providers of consumer goods and services.
Authority to make investments to renovate and develop industrial properties.
4.4 Differences between RDA, IFD, and EIFD While sharing many similar components, Enhanced Infrastructure Financing Districts differ significantly
from related Redevelopment Agencies and traditional Infrastructure Financing Districts.
Redevelopment Agencies: The dissolution of Redevelopment Agencies (RDAs) at the end of 2011 ended the
ability of local governments to capture a share of property taxes to combat blight. In existence for 60 years,
cities and counties in California had formed over 400 redevelopment agencies to areas determined as
blighted. RDAs were accountable to the public as they were overseen by a local city council, county board
of supervisors, or a distinct appointed board. The formation of a RDA did not require an election; instead,
any governing body within a county or city could initiate the formation (Blount, 2014).

DEC 2014 ENHANCED INFRASTRUCTURE FINANCING DISTRICTS A MECHANISM TO FINANCE ECO-RAPID TRANSIT
9 | P a g e
Through public investment and the use of eminent domain, RDAs would stimulate private sector
investment on a variety of projects. Common project types include (California redevelopment agencies, the
sequel, 2013):
Public and private capital improvements
Public works projects
Housing
The agencies were funded by the use of tax increment financing, which allowed for the entities to receive a
share of the increased property values generated by new investment and development. RDAs pledged the
tax increment to repay bonds and other debt initially used to finance the development. No voter approval
was required to issue bonds and 20 percent of the tax increment revenues were deposited into a “Low-and
Moderate-Income Housing Fund,” used to increase, improve, and preserve affordable housing in the
community (Greenhut, 2011).
Infrastructure Financing Districts: With RDAs dissolved, communities were forced to explore other financing
mechanism to stimulate economic development. One such mechanism is an Infrastructure Financing
District (IFD), which can help fund regional scale public works. The IFD, created by the 1990 California
statute, “The Infrastructure Financing District Act”, allows cities and counties to use a portion of the
property tax increment to finance defined public improvements for a period up to 30 years. The property
tax increment includes all collected property tax within the district, except for taxes allocated to school
districts, community college districts, county boards of education, and other taxing entities that did not
consent to the IFD formation (Reynolds & Thimmig, 2011). The tax increment is typically used for the
payment of IFD Revenue Bonds.
Unlike a RDA, an IFD must receive two-thirds voter approval by qualified electors in the district for both
bond issuance and for the initial formation. Further, the formation of an IFD also requires that an
infrastructure plan is developed, sent to every landowner within the district, and a public hearing be held.
The plan must be approved by all taxing entity within the district that will be contributing its property tax
increment.
Provisions within the Act detail the types of projects that IFDs can pursue. An IFD can finance the purchase,
construction, expansion, rehabilitation, and retrofit of public capital facilities, such as highways, water
systems, flood control, parks, solid waste facilities, ramps and bridges, transit, sewer projects, child care
facilities, libraries, parking facilities, and residential units (Infrastructure Financing Districts, n.d.).

DEC 2014 ENHANCED INFRASTRUCTURE FINANCING DISTRICTS A MECHANISM TO FINANCE ECO-RAPID TRANSIT
10 | P a g e
Other provisions state that the IFD is unable to pay for maintenance, repairs, services, and operating costs
related to the project and the useful life of projects must be at least 15 years. While the projects do not
have to in areas determined as blighted, the must provide benefits to an area larger than the district.
Additionally, the district must not overlap an existing RDA.
Enhanced Infrastructure Financing Districts: The newest tool, an Enhanced Infrastructure Financing District
(EIFD), looks to fill the void left by RDAs by loosening the provisions of an IFD. An EIFD can be formed by a
city, county, or special district through the development of an infrastructure financing plan, instead of a
two-third voter approval. The district may also be governed by multiple taxing entities, including
municipalities, counties, and special districts, but the entities must consent to the allocation of their portion
of property tax increment to the district. Moreover, bonds supported by tax increment financing can be
issued with 55 percent of the electorate, not the two-thirds required by the IFD. The bond period has also
been extended to 45 years from the date of bond approval.
Further advancements include a broader range of projects that could be served by an EIFD. The EIFD can
also serve projects such as transit priority projects, low- and moderate-income housing, projects under
sustainable communities strategies, and environmental remediation. EIFDs also allow for tax increment
financing to be combined with other revenue streams, such as assessment and fee revenues, parking
districts, availability payments, and private investment.
To summarize, the EIFD allows for greater flexibility by offering a wider array of funding sources and
investment projects than the IFD. Furthermore, the 55 percent voter approval provides the district with a
more streamlined procedure for investment.
Table 2: Comparison of RDA, IFD and EIFD
RDA IFD EIFD
Forming Process No election required ⅔ Voter Approval No election required
Project Types Blighted Areas Public Capital Facilities Public Capital Facilities (+)
Community Significance
Financing Tools/Resources
Tax Increment Financing Tax Increment Financing Multiple Funding Streams: Tax Increment Financing, Development Impact fee, Special Assessment District, Developer Agreement, User Fees
Issues Bonds No voter approval required
⅔ Voter Approval 55% voter approval
Longevity ~ 40 years 30 years 45 years

DEC 2014 ENHANCED INFRASTRUCTURE FINANCING DISTRICTS A MECHANISM TO FINANCE ECO-RAPID TRANSIT
11 | P a g e
4.5 Benefits and Barriers of EIFD Benefits: The EIFD provides cities and counties with several major benefits, including:
1. Greater financing authority: More revenue streams can be dedicated to funding a project under
an EIFD structure. Operating as a separate governmental entity, the district has the authority to
earn a portion of revenue from property tax increment, user, benefit fees and assessments,
among other revenue sources.
2. More infrastructure investments: EIFDs may fund other projects beyond “public capital
facilities”, including projects of “community wide significance”. Examples of such projects include
brownfield restoration, transit priority projects, projects relating to a sustainable communities
strategy, and the acquisition, construction, or rehabilitation of industrial facilities and low- and
moderate-income housing.
3. Longevity: From the date bonds have been issued or loans approved, the EIFD has 45 years to
receive funding support for their projects. This is 15 years longer than the 30 years allotted for
IFDs.
4. Increased collaboration among agencies: Different taxing entities that provide tax increment to
the EIFD and members of the public may / are required to sit on the district’s governing board.
Barriers: Despite its increased flexibility and streamlined approach, SB 628 does place some limits on the
formation and authority of EIFDs. Those limits include:
1. RDA Dissolution: If a local government previously created a RDA, the agency must have fully
completed the process of concluding its actions before the local government may proceed with
EIFD formation.
2. Tax-Increment Consent and Limits: A taxing entity within the district must approve and opt into
contributing its tax increment to an EIFD. Schools and other non-consenting tax entities cannot
divert their increment to the district.
3. Voter approval still required: An EIFD does not require voter approval in order to be formed;
local governments can form an EIFD without holding an election. However, issuing tax-increment
bonds does require a 55 percent vote, decreased from two-thirds vote required by an IFD.

DEC 2014 ENHANCED INFRASTRUCTURE FINANCING DISTRICTS A MECHANISM TO FINANCE ECO-RAPID TRANSIT
12 | P a g e
4.6 Multiple Funding Streams Available to use in EIFDs A leading benefit of the EIFD is multiple funding streams can be used in the same district. The following is
an overview of some types of funding streams but it does not represent the only options available:
1. Tax Increment Financing: Public taxing entities use the tax increment financing to capture
incremental property tax revenues from designated areas as compared to the base year. Prior to
dissolution in 2012, tax increments used to be a common financing tool for Community
Redevelopment Agencies in California. Now, SB 628 entitles cities to use tax increment financing to
finance infrastructure by creating EIFDs. Under the new law, only 55% vote is needed to issue debt
backed by AB8 Tax Increment as compared to previous legislations requiring a threshold of two
thirds vote. The tax revenue is divided into different pools, which go to cities, counties, school
districts and other taxing entities. Under SB 628, cities are able to divert property tax revenues
from school or community college districts. In the case of Eco-Rapid Transit line, cities in the OLDA
can capture the wealth by AB8 Tax Increment and VLF Backfill to finance the capital improvement.
2. Development Impact Fee: Under the Mitigation Fee Act, cities are allowed to charge developers
one-time development impact fees to mitigate the negative impacts associated with new
developments. The development impact fee should be charged based on reasonable findings of a
relation between new development and paying the fees. As it does not require voter approval, it
has been widely used to financing transportation and other infrastructure. The fees cannot be
used to fund existing deficiencies and cities must fund other sources to cover the cost of existing
uses. However, new infrastructure financed by the development impacts fee as a result of new
development, can benefit existing communities and future infrastructure users as well. In the case
of Eco-Rapid Transit Line, it will benefit the current communities by improving mobility and
enticing economic development opportunities.
3. Special Assessment District: Under a special assessment district, property owners agree to pay
additional assessment annually to fund special improvements within that district. The special
assessment should be directly proportional to the benefits the property owners will get prior to
payment. A simple majority is required to create a special assessments district. California Law
allows cities to create different type of special assessment districts to finance different types of
infrastructures. In the case of Eco-Rapid Transit line, special assessments can be charged, due to
improving mobility and economic development, as a result of the transit line.
4. Development Agreement: California law authorizes cities to negotiate with developer in order to
get desired development and new infrastructure in exchange of development rights. The public
improvement is based on project size, parking ratios and construction cost and other factors,

DEC 2014 ENHANCED INFRASTRUCTURE FINANCING DISTRICTS A MECHANISM TO FINANCE ECO-RAPID TRANSIT
13 | P a g e
affecting anticipated cost and revenues. No voter approval is required. In the case of Eco-Rapid
Transit Corridor, new developers are attracted and the development agreement can be made by
negotiation to put new infrastructure.
5. Parking Management (or Other User Fees): A parking management district, which combines
several tools, can be created to finance the infrastructure and ensure efficient utilization of the
infrastructure. No vote approval is needed. In the case of Eco-Rapid Corridor, parking fees can be
charged for retail and residential uses and incentives can be provided to park-and-ride users to
utilize the transit line.
5 PROPOSED EIFD IMPLEMENTATION FOR ECO-RAPID Establishing the structure for the Eco-Rapid EIFD is critical to financing success yet there are several
ways to use an EIFD. In the instance of Eco-Rapid, member cities should take full advantage of the already
established Joint Powers Authority (JPA) and use a three phased set up approach (see Appendix B). This
structure will allow each jurisdiction to manage their own land-use plans while working in concert with the
line to streamline planning and administration. As Eco-Rapid staff recognize, the line will be most
successful if the stations are planned through a collaborative effort. Therefore, it is recommended that the
existing Eco-Rapid JPA enter into a cooperative agreement with each member city to participate in an EIFD
as the primary mechanism of funding for the line. Once cities have finalized their land use plans and
established an EIFD, the JPA can then serve as the management and administration for the cities’ EIFDs
through capacities established under California’s Joint Powers Authority statute.
Phase 1 - Mobilize JPA: Use current JPA to research, discuss, and propose EIFDs as the mechanism to fund
Eco-Rapid Transit.
Phase 2 - Individual Jurisdictions Create EIFD: It is imperative jurisdictions develop and adopt a strong
General Plan or Specific Plan around the planned stations that support the business plan appropriate for
an EIFD. The need to fund plan development is being communicated to State’s Strategic Growth Council
discussions on Cap and Trade monies, (Bridegam, 2014). For stations that touch multiple jurisdictions, city
staff should coordinate Planning efforts. In order to capture future value of development, the land will be
entitled through a planning process streamlined through collaboration with the JPA.
After this is complete, each city will create an EIFD in the surrounding station area within their jurisdiction.
To establish an EIFD, no vote is required. In order to pursue financing activity, the establishing city council
of the EIFD will need to ensure the EIFD also serves as a Public Financing Authority (PFA) with a governing
board. The board will include three members of the legislative body of participating entity (the City) plus

DEC 2014 ENHANCED INFRASTRUCTURE FINANCING DISTRICTS A MECHANISM TO FINANCE ECO-RAPID TRANSIT
14 | P a g e
two members appointed from the public. With the powers provided to EIFD acting as a PFA, the EIFD will
create a financing strategy based on the cities’ General and Specific Plans and manage any voting for bond
issuance.
Phase 3 - JPA Manages and Administers EIFDs: After all JPA members establish individual EIFDs, the JPA can
amend their agreement to be responsible for Eco-Rapid member’s EIFD’s financing management and
administration. Through this mechanism, multiple EIFDs may collaborate on strategy, share the burden of
administrative costs, and share revenues to cover these administrative costs - all while maintaining the
jurisdictional land use decisions (California State Legislature Senate Local Government Committee, 2007,
pg. 27). The JPA should continue to consulate parties such as the Metropolitan Transit Authority (MTA), Los
Angeles County, Southern California Association of Government (SCAG), and Gateway Cities Council of
Governments - all with vested interested in the successful execution of the EIFD.
5.1 Specific Steps for Eco-Rapid to Create and use EIFDs The following steps are the proposed plan of action for Eco-Rapid to take as they look to implement EIFDs.
Note: some steps may run in parallel while others must be sequential.
1. Prior to establishing an EIFD, jurisdiction must dissolve remnants of redevelopment agency and
adhere to these guidelines (Enhanced Infrastructure Financing Districts, Provision 53398.54):
a. Within 10 days of a city or county’s legislative body’s action to participate in an IFD, the city
or county certifies to the Department of Finance and to the public financing authority that
no former redevelopment agency assets are the subject of litigation involving the state.
b. An EIFD may finance only the facilities authorized to the extent that the facilities are in
addition to those provided in the territory of the district before the district was created.
c. EIFD debt is subordinate to obligations of former Redevelopment Agency.
d. Available Tax Revenue does not include any pre-existing commitments to the
Redevelopment Property Tax Trust Fund.
2. Create funding mechanism to invest in General Plan Update. This need is being communicated to
the Cap and Trade monies of the State’s Strategic Growth Council (M. Pisano, Personal
Communication, November 2014).
3. Complete Station Area Land Use Plans, Specific Plan or General Plan updates for highest and best
uses (ex: adopt AECOM study). Planning for highest and best can be done through changes to
zoning and real estate improvements. Zoning changes involve changing land uses from residential
to commercial or light industrial. Real estate improvements include implementing Floor-to-Air ratio
(FAR) minimums and/or density requirements.

DEC 2014 ENHANCED INFRASTRUCTURE FINANCING DISTRICTS A MECHANISM TO FINANCE ECO-RAPID TRANSIT
15 | P a g e
4. The existing EPA coordinates individual jurisdictions to establish an EIFD around the proposed
station. Each jurisdiction will take the following steps:
a. Define the EIFD project scope. Recommend a 2-3 mile radius from Eco-Rapid Station to
capture the full breadth of investments and regeneration related to the station.
b. Create EIFD financing capacities by developing a Public Financing Authority with three
members of the jurisdiction’s legislative body plus two publicly appointed members.
Recommend including additional board members from MTA and County.
c. Board members will not receive compensation but are eligible for reimbursement of
expenses incurred during official duties.
5. Amend existing Joint Powers Authority (JPA) to coordinate financing activities, administration and
management of affiliated resources.
6. Through the JPA and using revenues contributed from jurisdictions EIFDs, hire staff specifically
dedicated to EIFDs for management of financial reporting required by EIFDs as well as
coordination with different agencies.
7. EIFDs develop and execute a package of financing tools. Based on the planning and entitlements in
each jurisdiction, the financing tools do not have to be the same across the line. However,
consistency will benefit the administrative duties of the JPA and encourage development by
mitigating the uncertainties and risk for the private sector. The package may, but is not limited to,
a combination of Tax Increment Financing, Development Impact Fee, Special Assessment Districts,
Development Agreement, and Parking Management (or Other User Fees).
8. If required, Issue Public Debt once funding sources has been decided.
a. The district requires only a 55% vote by constituents to approve public debt issuance for
AB8. The annual revenue stream of an EIFD that is used as an availability payment to
retire the obligation of a private investor does not need a vote.
b. An EIFD can be in place for up to 45 years.
9. Transition into day-to-day management and operations.
6 CASE STUDY: DOWNEY STATION In order to understand the financial opportunities of an EIFD, our team evaluated a singular station to
demonstrate how the individual jurisdictions may individually and collaboratively use EIFDs for Eco-Rapid
Funding. The proposed Downey Station serves as a strong example of the value capture possible using the
combined revenue streams provisioned for in an EIFD due to its complexity with three jurisdictions in the
regeneration catchment area (Downey, South Gate, and Cudahy), large swatch of County land in the station
area, and data available for analysis.

DEC 2014 ENHANCED INFRASTRUCTURE FINANCING DISTRICTS A MECHANISM TO FINANCE ECO-RAPID TRANSIT
16 | P a g e
Figure 2: Intersection of Gardendale Street and Garfield Avenue
6.1 Station Overview Known as the Downey-Gardendale Station, the station is located in a dynamic area of the City of Downey
where redevelopment and revitalization plans are creating a visionary mixed-use regional employment and
destination center. The predominant land uses surrounding the station area are single institutional to the
north and northeast and single-family residential south and southwest. Industrial uses dominate the main
north-south corridor. Two Specific Plans currently are in place:
1. Rancho Los Amigos Specific Plan: The business center, located in the southwest corner of the
city, is a public/private joint venture between the County and Fremont Properties on County-
owned Rancho Los Amigos Medical Center land. The concept involves phasing out the existing
medical center and replacing it with commercial manufacturing, including professional offices,
research and development activities, light manufacturing, financial institutions, and restaurants.
Retail uses would also be of convenience to employees and visitors of the other uses in the area
(AECOM, 2013).
2. Redevelopment Plan for the Downey Redevelopment Project: The proposed station is located
within Gardendale/Downey Area (see Figure 3). The Plan includes the City’s desire to improve,
upgrade, and revitalize all areas of the city, which have become blighted because of deterioration,
disuse and unproductive conditions. Objectives include providing construction and employment
opportunities in the new industrial/commercial establishments as well as encouraging existing,
surrounding owners, businesses, and tenants to participate in the redevelopment activities, thus
sustaining the existing economic base of the community (AECOM, 2013)

DEC 2014 ENHANCED INFRASTRUCTURE FINANCING DISTRICTS A MECHANISM TO FINANCE ECO-RAPID TRANSIT
17 | P a g e
In addition, there are several General Plan Policies consistent with the station development project which
includes: Land Use Policy 1.2.1-Program 1.2.1.2, Economic Development Policy 9.1.2-Program 9.1.2.2, and
Circulation Element Policy 2.4.1-Program 2.4.1.1(AECOM, 2013).
Data Source: U.S Census Bureau, Southern California Association of Governments, Los Angeles County GIS Data Portal
Figure 4: Percentage of Non-white Population
Figure 3: Median Household Income

DEC 2014 ENHANCED INFRASTRUCTURE FINANCING DISTRICTS A MECHANISM TO FINANCE ECO-RAPID TRANSIT
18 | P a g e
Figure 5: Existing Land Use Map
Data Source: Southern California Association of Governments
DEC 2014 ENHANCED INFRASTRUCTURE FINANCING DISTRICTS A MECHANISM TO FINANCE ECO-RAPID TRANSIT
19 | P a g e
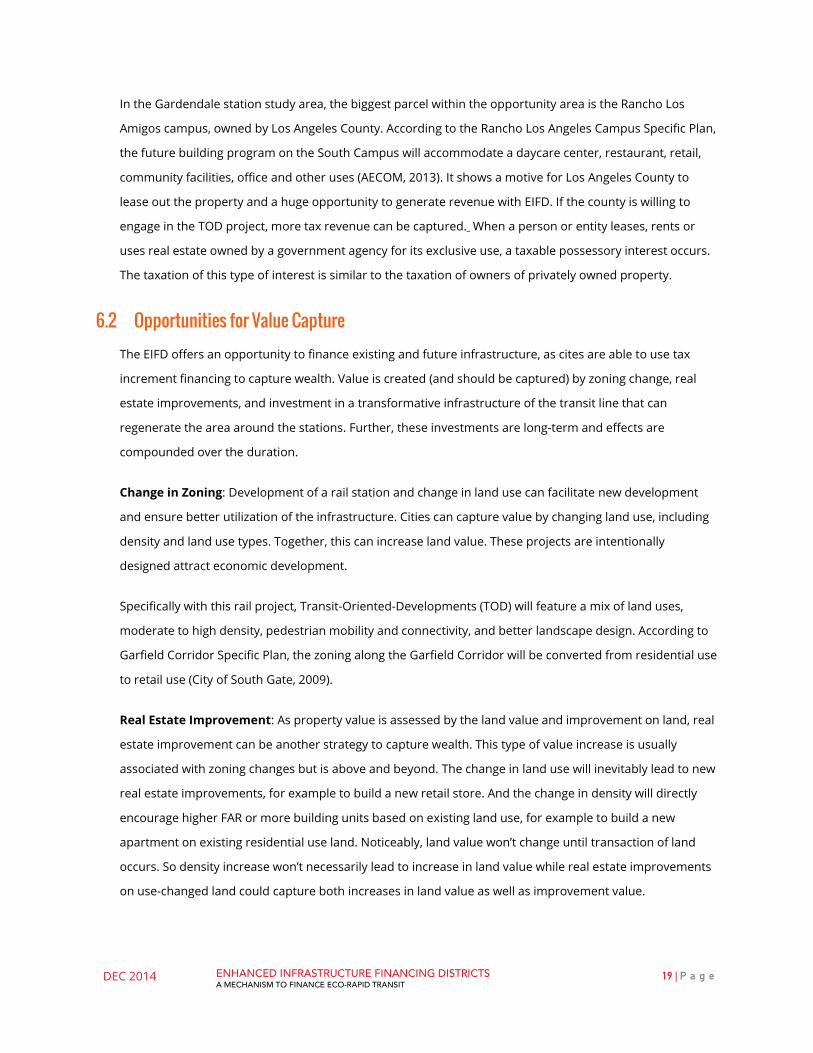
In the Gardendale station study area, the biggest parcel within the opportunity area is the Rancho Los
Amigos campus, owned by Los Angeles County. According to the Rancho Los Angeles Campus Specific Plan,
the future building program on the South Campus will accommodate a daycare center, restaurant, retail,
community facilities, office and other uses (AECOM, 2013). It shows a motive for Los Angeles County to
lease out the property and a huge opportunity to generate revenue with EIFD. If the county is willing to
engage in the TOD project, more tax revenue can be captured. When a person or entity leases, rents or
uses real estate owned by a government agency for its exclusive use, a taxable possessory interest occurs.
The taxation of this type of interest is similar to the taxation of owners of privately owned property.
6.2 Opportunities for Value Capture The EIFD offers an opportunity to finance existing and future infrastructure, as cites are able to use tax
increment financing to capture wealth. Value is created (and should be captured) by zoning change, real
estate improvements, and investment in a transformative infrastructure of the transit line that can
regenerate the area around the stations. Further, these investments are long-term and effects are
compounded over the duration.
Change in Zoning: Development of a rail station and change in land use can facilitate new development
and ensure better utilization of the infrastructure. Cities can capture value by changing land use, including
density and land use types. Together, this can increase land value. These projects are intentionally
designed attract economic development.
Specifically with this rail project, Transit-Oriented-Developments (TOD) will feature a mix of land uses,
moderate to high density, pedestrian mobility and connectivity, and better landscape design. According to
Garfield Corridor Specific Plan, the zoning along the Garfield Corridor will be converted from residential use
to retail use (City of South Gate, 2009).
Real Estate Improvement: As property value is assessed by the land value and improvement on land, real
estate improvement can be another strategy to capture wealth. This type of value increase is usually
associated with zoning changes but is above and beyond. The change in land use will inevitably lead to new
real estate improvements, for example to build a new retail store. And the change in density will directly
encourage higher FAR or more building units based on existing land use, for example to build a new
apartment on existing residential use land. Noticeably, land value won’t change until transaction of land
occurs. So density increase won’t necessarily lead to increase in land value while real estate improvements
on use-changed land could capture both increases in land value as well as improvement value.

DEC 2014 ENHANCED INFRASTRUCTURE FINANCING DISTRICTS A MECHANISM TO FINANCE ECO-RAPID TRANSIT
20 | P a g e
In the Gardendale / Downey station case; there are two types of real estate improvement generating
revenues. First, retail and commercial improvement will occur after a zoning change along Garfield
Corridor. For instance, the retail office and industrial development along with zoning change of the Rancho
Los Amigos Plan will generate nearly one million tax increment revenues (AECOM, 2013). Second, value will
increase as a result of residential or commercial improvements encouraged by density increase from the
new transit village near the Firestone & Atlantic Intersection as detailed in the Redevelopment Specific Plan
for Downey Redevelopment Project. A second transit village on Garfield Avenue with plans for high density
housing, retail and office use, as detailed in the City of Southgate General Plan 2035, will further perpetuate
real estate improvement in the area (Community Design + Architecture). As the rail project will improve
mobility and accessibility, new construction will be likely take place within the opportunity areas around the
stations. The introduction of Eco-Rapid Transit will create a huge opportunity to capture real estate
improvement wealth.
Investment and Regeneration around the Station: Studies demonstrate transit lines have a positive
effect on property value in the station vicinities 11. However, the “transit premium”, or the value added to
property by locating proximity to public transit, may vary depending on distance and property type. This
impact of transit on property value is scaled, as seen in Table 1. Even with no change in zoning or real
estate improvements, cities recognize value by investing in transit development project.
In terms of Gardendale Station, by creating an EIFD the City of Downey and the City of Southgate can use
tax increment financing along with other financing tool to fund the eco-rapid transit project and in turns
capture a long term “transit premium” (Nelson-Nygaard Consulting Associates Inc., 2012).
Table 3: Summary of Estimated Property Value Premium (Nelson-Nygaard Consulting Associates Inc, 2012)
Long-Term Impacts of These Investments: Public transit investment can have significantly positive
impact on economy both in short-term and long-term. well-known long-term impacts like cost saving, social
justice benefits, and environmental benefits, cities also recognize compounding values of the revenues

DEC 2014 ENHANCED INFRASTRUCTURE FINANCING DISTRICTS A MECHANISM TO FINANCE ECO-RAPID TRANSIT
21 | P a g e
streams created by transit projects. Gains captured by zoning change, real estate improvement, transit
premium and possessory interests can be compounded over a 45-year time frame in an EIFD.
6.3 Financial Strategy & Modeling Results Analysis demonstrates that the best opportunities to capture the wealth created by the proposed
Gardendale/Downey Station will be through (A) property tax increment and developer fees, (B) revenues
from property tax corresponding to the increase in assessed valuation of taxable property attributed to
those property shares received by a city or county pursuant to in lieu of Vehicle License Fees, and ‘(C)
parking management user fees. The revenue streams recognized here are based on a best estimate for
future land use plans. (Note: it is strongly advised that prior to establishing an EIFD, the jurisdictions
surrounding the station make a coordinated approach to develop land use plans that yield the highest and
best land uses for value capture).
6.3.1 Tax Increment Financing and Developer Fees
Tax Increment Financing (TIF) is a funding tool available for use by the EIFD, which allows the district to
capture a portion of the increased property tax values resulting from a development project. To determine
the growth, the current-assessed value of all parcels within a boundary (the base value) and the resulting
property tax value must first be determined. Once the base value has been established, the increased
property assessed value, resulting from the new development, will be calculated in order to determine the
incremental property tax value that can be allocated to the district.
For the Gardendale/ Downey Station Case, we propose a time two-phase business plan in order to capture
potential value. The first phase captures increases in value from 2014-2019, while the second phases
focuses on increases expected from 2020-2025. This two-phase business plan will incorporate gains
recognized from rezoning, real estate improvement, transit premium generated from the station, taxable
possessory interest as well as integrate all four financing tools identified above. Figure 6 illustrates the
proposed future land uses within the ½ mile catchment basin. Detailed of assumptions and analysis can be
found in the Appendix C.

DEC 2014 ENHANCED INFRASTRUCTURE FINANCING DISTRICTS A MECHANISM TO FINANCE ECO-RAPID TRANSIT
22 | P a g e
Figure 6: Future Land Use of Gardendale/Downey Station Based on Highest and Best Use

DEC 2014 ENHANCED INFRASTRUCTURE FINANCING DISTRICTS A MECHANISM TO FINANCE ECO-RAPID TRANSIT
23 | P a g e
Phase 1: A high density, mix-used Garfield corridor with commercial vitality and a more attractive
employment center in Hollydale Industrial District.
According to Garfield Corridor Specific Plan, Garfield Corridor is designed to evolve into a corridor
resembling a revitalized main street with a variety of residential uses, high-end retail, improved landscaping
and building improvement that promote a pedestrian-oriented corridor. In the General Plan 2035, it
designates to improve density along the Garfield Corridor on FAR and units/acre (City of South Gate, 2009).
Following the Specific Plan and General Plan, the team identified the following value capture opportunities:
1) Rezoning along Garfield Corridor by converting 50% of the residential use land to commercial and retail
use; 2) Increasing commercial and retail land use density up to FAR 3.0 as shown in other LA Metro TOD
projects and the residential land use density to 30 units/ acre; 3) Facilitate real estate improvement on both
re-zoned parcels and existing residential and commercial uses by allowing three-story commercial building
residential buildings corresponding to the density increase (improvement costs are $211/SF for commercial
and $191,000/ D.U for residential uses respectively); 4) Instituting a developer Fee in both Garfield Corridor.
Developer fee is charged at $28/SF on commercial and retail development while a $26,000/D.U. fee for
residential projects (Economic & Planning Systems Inc., 2014).
In addition to the Garfield Corridor, rezoning in the Hollydale Industrial District constitutes value capture
opportunities, where the Specific Plan encourages transition from manufacturing/distribution to highly
desired light industrial/flex to make this district more attractive. This includes converting heavy
manufacturing parcels into retail and light industrial uses and increase the density in the whole district up
to FAR 2.0 (City of South Gate, 2009). Consistent with the Garfield Corridor, real estate improvement and
developer fee were also identified as value capture opportunities (Economic & Planning Systems Inc., 2014).
Improvement costs are $104/SF for light industrial development and 10% of the construction cost can be
attributed to developer fee.
Using these assumptions and recommendations, future property values along Garfield Corridor increased
from $21,856,754 to $418,819,387 yielding, $4,680,983 in available tax increment per annum and
$46,937,379 developer fees available in 2025. The Hollydale Industrial District yields a tax increment of
$909,372 per annum and $6,746,562 in developer fees available in 2025.
Phase Two: An economically robust transit-oriented district within a ½ catchment basin from the
Gardendale/Downey Station.
Introducing public transit station will create a positive transit premium on nearby property values,
commercial activities and urban growth (Nelson-Nygaard Consulting Associates Inc., 2012). With the
DEC 2014 ENHANCED INFRASTRUCTURE FINANCING DISTRICTS A MECHANISM TO FINANCE ECO-RAPID TRANSIT
24 | P a g e
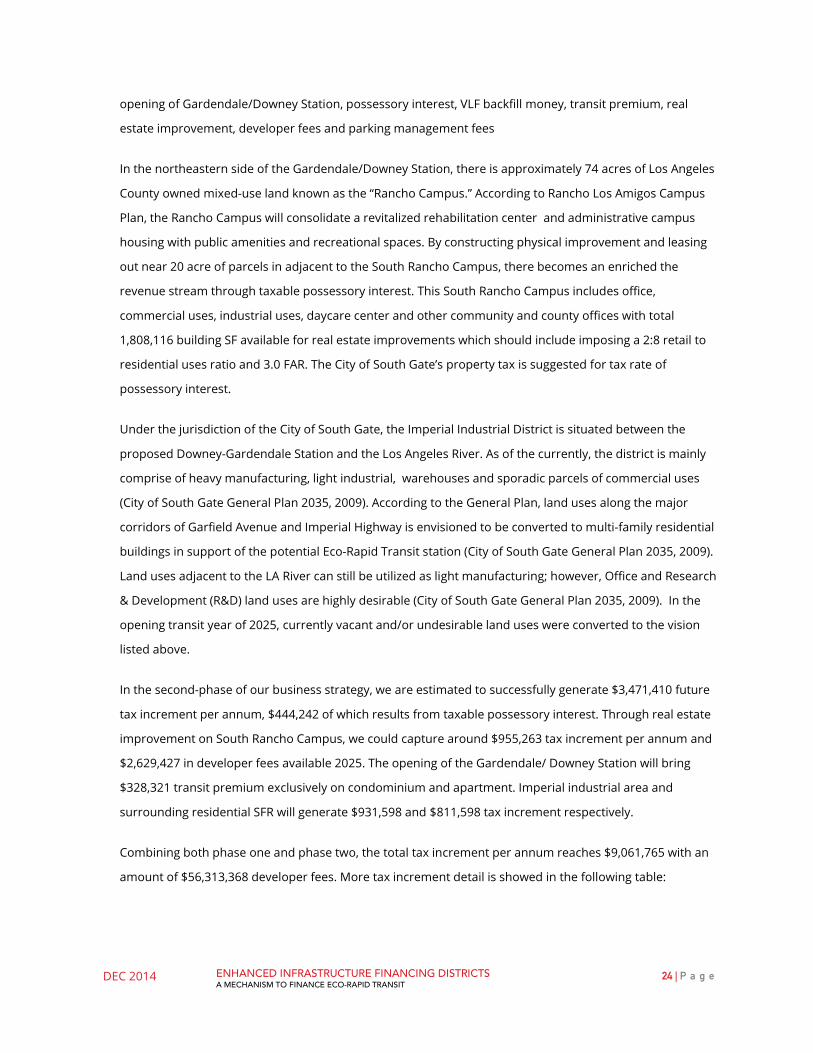
opening of Gardendale/Downey Station, possessory interest, VLF backfill money, transit premium, real
estate improvement, developer fees and parking management fees
In the northeastern side of the Gardendale/Downey Station, there is approximately 74 acres of Los Angeles
County owned mixed-use land known as the “Rancho Campus.” According to Rancho Los Amigos Campus
Plan, the Rancho Campus will consolidate a revitalized rehabilitation center and administrative campus
housing with public amenities and recreational spaces. By constructing physical improvement and leasing
out near 20 acre of parcels in adjacent to the South Rancho Campus, there becomes an enriched the
revenue stream through taxable possessory interest. This South Rancho Campus includes office,
commercial uses, industrial uses, daycare center and other community and county offices with total
1,808,116 building SF available for real estate improvements which should include imposing a 2:8 retail to
residential uses ratio and 3.0 FAR. The City of South Gate’s property tax is suggested for tax rate of
possessory interest.
Under the jurisdiction of the City of South Gate, the Imperial Industrial District is situated between the
proposed Downey-Gardendale Station and the Los Angeles River. As of the currently, the district is mainly
comprise of heavy manufacturing, light industrial, warehouses and sporadic parcels of commercial uses
(City of South Gate General Plan 2035, 2009). According to the General Plan, land uses along the major
corridors of Garfield Avenue and Imperial Highway is envisioned to be converted to multi-family residential
buildings in support of the potential Eco-Rapid Transit station (City of South Gate General Plan 2035, 2009).
Land uses adjacent to the LA River can still be utilized as light manufacturing; however, Office and Research
& Development (R&D) land uses are highly desirable (City of South Gate General Plan 2035, 2009). In the
opening transit year of 2025, currently vacant and/or undesirable land uses were converted to the vision
listed above.
In the second-phase of our business strategy, we are estimated to successfully generate $3,471,410 future
tax increment per annum, $444,242 of which results from taxable possessory interest. Through real estate
improvement on South Rancho Campus, we could capture around $955,263 tax increment per annum and
$2,629,427 in developer fees available 2025. The opening of the Gardendale/ Downey Station will bring
$328,321 transit premium exclusively on condominium and apartment. Imperial industrial area and
surrounding residential SFR will generate $931,598 and $811,598 tax increment respectively.
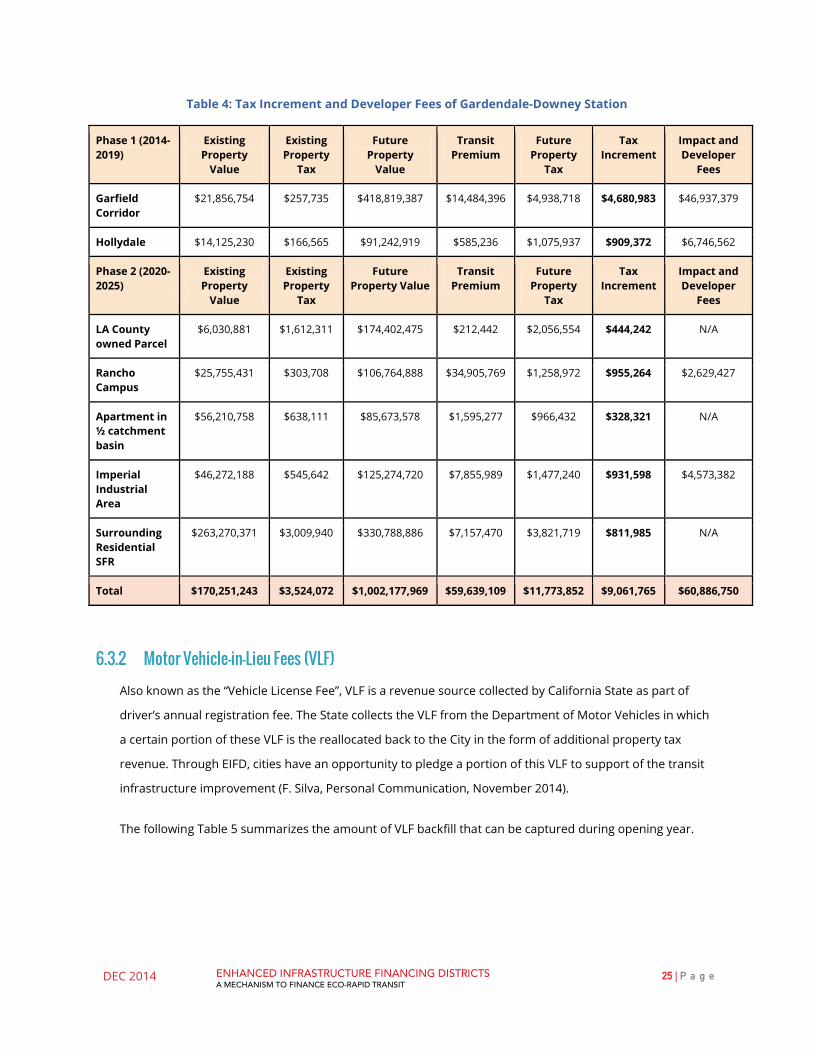
Combining both phase one and phase two, the total tax increment per annum reaches $9,061,765 with an
amount of $56,313,368 developer fees. More tax increment detail is showed in the following table:
DEC 2014 ENHANCED INFRASTRUCTURE FINANCING DISTRICTS A MECHANISM TO FINANCE ECO-RAPID TRANSIT
25 | P a g e
Table 4: Tax Increment and Developer Fees of Gardendale-Downey Station
Phase 1 (2014-2019)
Existing Property
Value
Existing Property
Tax
Future Property
Value
Transit Premium
Future Property
Tax
Tax Increment
Impact and Developer
Fees
Garfield Corridor
$21,856,754 $257,735 $418,819,387 $14,484,396 $4,938,718 $4,680,983 $46,937,379
Hollydale $14,125,230 $166,565 $91,242,919 $585,236 $1,075,937 $909,372 $6,746,562
Phase 2 (2020-2025)
Existing Property
Value
Existing Property
Tax
Future Property Value
Transit Premium
Future Property
Tax
Tax Increment
Impact and Developer
Fees
LA County owned Parcel
$6,030,881 $1,612,311 $174,402,475 $212,442 $2,056,554 $444,242 N/A
Rancho Campus
$25,755,431 $303,708 $106,764,888 $34,905,769 $1,258,972 $955,264 $2,629,427
Apartment in ½ catchment basin
$56,210,758 $638,111 $85,673,578 $1,595,277 $966,432 $328,321 N/A
Imperial Industrial Area
$46,272,188 $545,642 $125,274,720 $7,855,989 $1,477,240 $931,598 $4,573,382
Surrounding Residential SFR
$263,270,371 $3,009,940 $330,788,886 $7,157,470 $3,821,719 $811,985 N/A
Total $170,251,243 $3,524,072 $1,002,177,969 $59,639,109 $11,773,852 $9,061,765 $60,886,750
6.3.2 Motor Vehicle-in-Lieu Fees (VLF)
Also known as the “Vehicle License Fee”, VLF is a revenue source collected by California State as part of
driver’s annual registration fee. The State collects the VLF from the Department of Motor Vehicles in which
a certain portion of these VLF is the reallocated back to the City in the form of additional property tax
revenue. Through EIFD, cities have an opportunity to pledge a portion of this VLF to support of the transit
infrastructure improvement (F. Silva, Personal Communication, November 2014).
The following Table 5 summarizes the amount of VLF backfill that can be captured during opening year.
DEC 2014 ENHANCED INFRASTRUCTURE FINANCING DISTRICTS A MECHANISM TO FINANCE ECO-RAPID TRANSIT
26 | P a g e
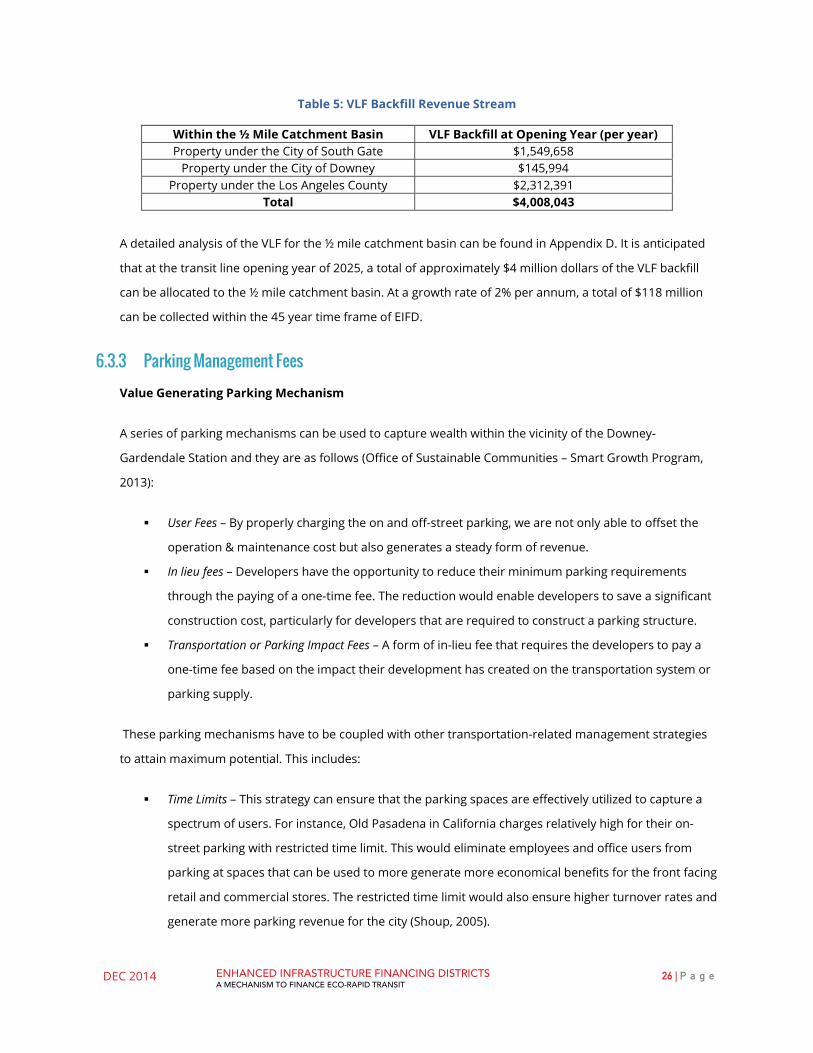
Table 5: VLF Backfill Revenue Stream
Within the ½ Mile Catchment Basin VLF Backfill at Opening Year (per year) Property under the City of South Gate $1,549,658
Property under the City of Downey $145,994 Property under the Los Angeles County $2,312,391
Total $4,008,043
A detailed analysis of the VLF for the ½ mile catchment basin can be found in Appendix D. It is anticipated
that at the transit line opening year of 2025, a total of approximately $4 million dollars of the VLF backfill
can be allocated to the ½ mile catchment basin. At a growth rate of 2% per annum, a total of $118 million
can be collected within the 45 year time frame of EIFD.
6.3.3 Parking Management Fees
Value Generating Parking Mechanism
A series of parking mechanisms can be used to capture wealth within the vicinity of the Downey-
Gardendale Station and they are as follows (Office of Sustainable Communities – Smart Growth Program,
2013):
User Fees – By properly charging the on and off-street parking, we are not only able to offset the
operation & maintenance cost but also generates a steady form of revenue.
In lieu fees – Developers have the opportunity to reduce their minimum parking requirements
through the paying of a one-time fee. The reduction would enable developers to save a significant
construction cost, particularly for developers that are required to construct a parking structure.
Transportation or Parking Impact Fees – A form of in-lieu fee that requires the developers to pay a
one-time fee based on the impact their development has created on the transportation system or
parking supply.
These parking mechanisms have to be coupled with other transportation-related management strategies
to attain maximum potential. This includes:
Time Limits – This strategy can ensure that the parking spaces are effectively utilized to capture a
spectrum of users. For instance, Old Pasadena in California charges relatively high for their on-
street parking with restricted time limit. This would eliminate employees and office users from
parking at spaces that can be used to more generate more economical benefits for the front facing
retail and commercial stores. The restricted time limit would also ensure higher turnover rates and
generate more parking revenue for the city (Shoup, 2005).

DEC 2014 ENHANCED INFRASTRUCTURE FINANCING DISTRICTS A MECHANISM TO FINANCE ECO-RAPID TRANSIT
27 | P a g e
Shared Parking – Allowing various land uses to share the same parking facility instead of
constructing parking facilities separately (Office of Sustainable Communities – Smart Growth
Program, 2013). Having one parking facility can also enable motorist to visit multiple destinations
without having drive. In addition, developers are also able to reduce their parking requirements
when parking facilities are shared. For instance, the peak parking demand for restaurants are at
weekend nights while another land use like office has peak parking demand during weekday
(Litman, 2013).
Reducing Parking Requirements – The introduction of transit corridor encourages the surrounding
community’s reliance on automobiles as their primary form of transportation. Hence, conventional
parking requirements can be significantly reduced to accommodate the lower automobile trips
(Shoup, 2005).
There are opportunities to utilize all the parking management strategies to capture revenue. However, for
the purpose of the study, emphases have been made on in-lieu fees, and reduce parking requirements.
User fees was not take into consideration as it would require a detailed understanding of the potential
market condition of the area as well as the forecasted transit ridership that the station.
Parking Analysis In-Lieu Fees
As mentioned previously, the purpose of the in-lieu fee is to enable developers to reduce their parking
requirements in replacement of a one-time development fee. This parking mechanism is favourable
towards developers as they can significantly reduce their burden in attempts to meet the conventional
parking requirements. In-Lieu fee is also valuable to the City as revenue can be obtained from reducing
parking requirement which then can be used for facilitate other transportation improvements.
In order to determine the in-lieu fee generated by the half-mile catchment basin, the following approach
was utilized:
1. Identify the required parking spaces for every proposed development based on the existing
standards.
2. Generate the construction cost associated with the required parking spaces.
3. Reduce the parking requirement and identified the reduced parking spaces required for every
proposed development.
4. Generate a construction cost associated with the reduced parking spaces.
5. It is then assumed that 20% (aggressive approach) of the different between cost of required
and reduce parking spaces would be the in-lieu fee paid by the developer as form of
DEC 2014 ENHANCED INFRASTRUCTURE FINANCING DISTRICTS A MECHANISM TO FINANCE ECO-RAPID TRANSIT
28 | P a g e
development fee. A conservative approach of 10% was also taken into consideration (see
Appendix E).
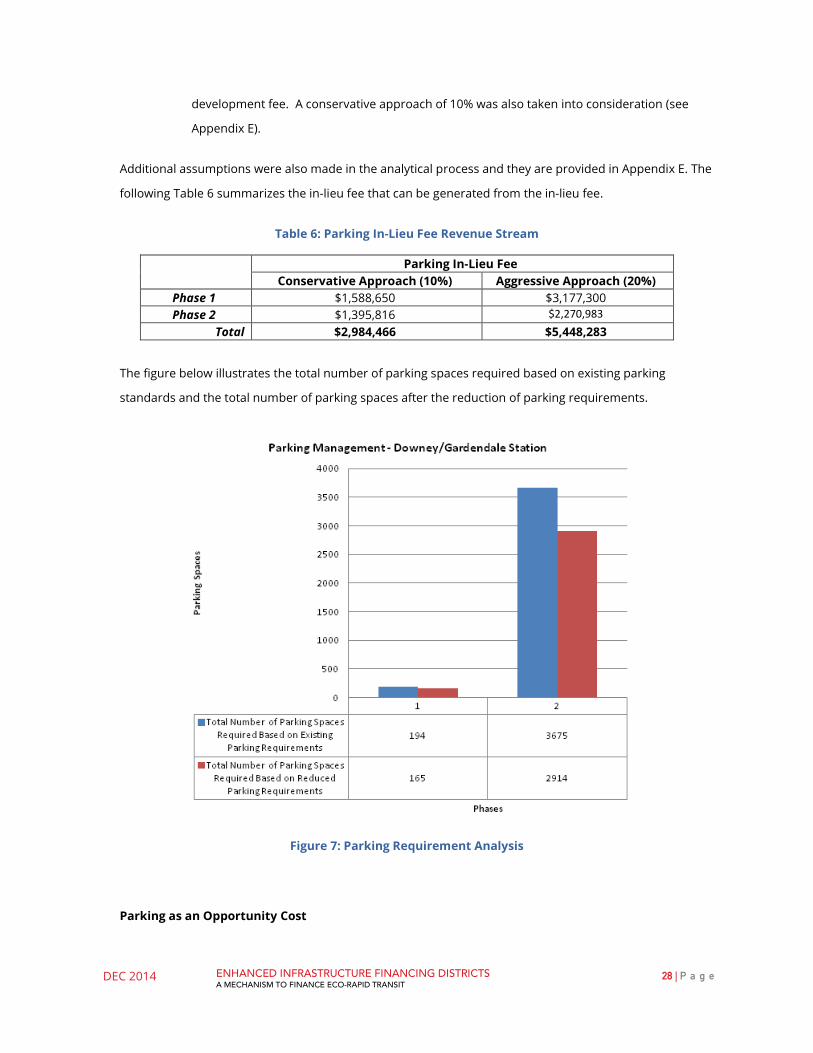
Additional assumptions were also made in the analytical process and they are provided in Appendix E. The
following Table 6 summarizes the in-lieu fee that can be generated from the in-lieu fee.
Table 6: Parking In-Lieu Fee Revenue Stream
Parking In-Lieu Fee Conservative Approach (10%) Aggressive Approach (20%)
Phase 1 $1,588,650 $3,177,300 Phase 2 $1,395,816 $2,270,983
Total $2,984,466 $5,448,283
The figure below illustrates the total number of parking spaces required based on existing parking
standards and the total number of parking spaces after the reduction of parking requirements.
Figure 7: Parking Requirement Analysis
Parking as an Opportunity Cost

DEC 2014 ENHANCED INFRASTRUCTURE FINANCING DISTRICTS A MECHANISM TO FINANCE ECO-RAPID TRANSIT
29 | P a g e
For the past couple of decades, parking planning have been perceived as a public good in which there
should be (1) abundant supply of parking and; (2) free at majority of the traveller’s destination. This
perception of urban planning have resulted in the constructed of underutilized parking facilities that has
left local government to face budget shortfalls. In addition, conventional parking standards take on a
conservative approach in which further exacerbating the parking supply required (Shoup, 2005).
By reducing the parking requirement and applying in-lieu fee, we are able to capture the correct value of
parking. The reduction of parking supply enables developer to free up their land and utilized those
additional spaces for better community improvements (City of South Gate, 2009). As indicated previously,
the value of land within the vicinity of the Transit station increase with respect to time. The opportunity
cost of those parking spaces within the area would also increase proportionally. Through the identification
of various supportive parking policies and parking management strategies, we would be able to facilitate
developers in meeting the anticipated parking demands while being fiscally sustainable.
6.4 Summary of Value Capture The following Table 7 summarizes the value captured using various financials tools.
Table 7: Summary of Value Capture for Downey-Gardendale Station
Downey-Gardendale Station Tax Increment Financing (per year) $9,061,765 Developer Impact Fee (one-time fee) $60,886,750
VLF Backfill (per year) $4,008,043 Parking In-Lieu Fee (one-time fee) $5,448,283
Total Capture at Opening Year, 2025 $79,404,841 Total Net Value Capture (45 Year Time Frame) $464,835,576
Approximately $79 million dollars can be captured at the 2025 opening year of the transit station. Long-
term, the investments result in total value capture of $464 million for a 45 year time frame as per the
structure of the EIFD. By implementing the right investment strategies with the introduction of the Eco-
Rapid Transit, the total assessed value of the ½ mile catchment basin around the Gardendale / Downey
Station alone increased from $301 million in 2014 to $2.44 billion, 45 years later. This is approximately 7
times the original assessed value of property that once was considered to be a rust belt.

DEC 2014 ENHANCED INFRASTRUCTURE FINANCING DISTRICTS A MECHANISM TO FINANCE ECO-RAPID TRANSIT
30 | P a g e
7 TOOLS FOR SUCCESSFUL ANALYSIS The example analysis was a simplistic and rudimentary approach to gain understanding of an EIFD’s
magnitude; however, there are many products available to calculate the exact value capture for which
jurisdictions may issue debt.
Envision Tomorrow Plus (ET+) is a suite of urban and regional planning tools that support planning for the
future of cities and regions. The ET+ can be used to model development feasibility on a site-by-site basis as
well as create and evaluate multiple land use scenarios. In addition to the modeling and evaluating
functions, The ET+ can also test and refine transportation plans, produce small area concept plans, and
model complex regional issue. In this project, the ET + is applied to model the land use changes around the
Eco-Rapid Transit stations by evaluating different land use scenarios.
Scenario planning is mainly composed of the following steps:
1. Create a framework for the scenario planning process
To get started, we identified our key planning issue—using transportation as an investment to
regenerate the southeast of Los Angeles County where the Eco-Rapid Transit passes through. The
investment strategies are expected to facilitate economic development in the community with the
consideration of environmental justice and urban greening. To simplify the planning process, we
only focus on the Downey station and define the study area as 0.5 mile-radius buffer around the
station.
2. Select evaluation criteria
This step involves making decisions about outcomes you want to measures to objectively
compare a range of possible futures. The evaluation criteria should reflect adopted community
goals, and may also address new or emerging community goals or issues. The evaluation criteria
are used to communicate the benefits, impacts, and tradeoffs of different policy choices and
investments within each alternative scenario.
3. Set up for scenario planning
The basis of scenario planning and evaluating is data collection and building blocks development.
Building blocks, the basis for scenario development of the ET +, describe the different types of
land uses that exist, or are planned for the future within the planning area. Each building block
includes a mix of different types of buildings along with development character assumptions such
as the amount of land devoted to streets, parks, and civic areas. We got block-level shapefiles of
both current land use and future land use from Southern California Association of Governments
(SCAG).

DEC 2014 ENHANCED INFRASTRUCTURE FINANCING DISTRICTS A MECHANISM TO FINANCE ECO-RAPID TRANSIT
31 | P a g e
As for GIS data, we created a buildable lands layer that can be used for scenario painting. With
land use layer added and Envision Tomorrow Plus installed, we selected several building types
from the building library according to the existing building types and the possible building types
that may occur in the future. To get the specific information, such as land price and improvement
price of each parcel, we referred to the website of Los Angeles County Office of the Assessor and
created a spreadsheet containing Residential units, Residential Square foot, land value,
improvement value, total value, and year built.
4. Create a current condition base case and a reference case
This step aims to make people understand where they currently are and where they are headed
in the future. Using the ET + to document existing conditions, we were able to estimate the likely
outcomes from existing plans and recent development trends. The results of these analyses help
the community identify the building types that are feasible to the study area, determine whether
or not the current plans will meet important community goals, and evaluate the future scenarios
given the current development trends continue.
5. Scenario experimentation and evaluation
The ET + is used to estimate outcomes of the scenarios that involves with different combinations
of changes to land use and the transportation system. Experiments of exploring both building-
level scenario options and land use scenario options are needed to evaluate alternative scenarios
and finally create a final scenario that captures the vision of the community.
8 CONCLUSION The Eco-Rapid Corridor is primed to use transit to regenerate communities through competitive,
attractive economic development. Members of the Eco-Rapid Joint Powers Authority have already
recognized that gains from of working together as a corridor translate into revitalized communities. By
continuing to work in collaboration through the JPA, jurisdictions can implement Eco-Rapid’s vision through
the formation of Enhanced Infrastructure Financing Districts to more quickly deliver this transit line to the
region. To move forward and recognize these benefits, Eco-Rapid members must continue to think and
work together. With a heavy focus on developing strong land use plans to serve as the Corridor’s Enhanced
Infrastructure Financing District business plan, competitive and attractive economic development along the
Eco-Rapid line can begin now.

DEC 2014 ENHANCED INFRASTRUCTURE FINANCING DISTRICTS A MECHANISM TO FINANCE ECO-RAPID TRANSIT
32 | P a g e
REFERENCES AECOM. (2013). “Gardendale Station – City of Downey.” Retrieved on 7 December 2014 from http://www.eco-
rapid.org/Project/studies_reports/Downey%20Station%20Area_AECOM.pdf
Blount et al. (2014). “Redevelopment Agencies in California: History, Benefits, Excesses, and Closure.” U.S. Department of Housing and Urban Development. Retrieved on 7 December 2014 from http://www.huduser.org/portal/publications/Redevelopment_WhitePaper.pdf
Bridegam, M. (2014, September 24). SGC proposes 40% of cap-and-trade funds for transit-oriented development. California Planning & Development Report. Retrieved on December 9th, 2014 from http://www.cp-dr.com/node/3578
California Economic Summit. (2014, September 3). FUNDING SUSTAINABLE COMMUNITIES: A HOW-TO GUIDE FOR USING
ENHANCED INFRASTRUCTURE FINANCING DISTRICTS IN SB 628 (BEALL)
California Legislature Senate Local Government Committee. (2007, August). Governments Working Together: A Citizens Guide to Joint Powers Agreements. Retreieved on December 7, 2014 from http://www.calafco.org/docs/Senate_LG_JPA_Report.pdf
“California redevelopment agencies, the sequel.” Editorial. Los Angeles Times. 22 September 2013. Online. Retrieved on 7 December 2014 from http://articles.latimes.com/2013/sep/22/opinion/la-ed-redevelopment-20130922
City of South Gate. (2009, December). South Gate General Plan 2035. Retrieved on 7 December 2014 from http://engage-public.s3.amazonaws.com/newsouthgate/South%20Gate%20General%20Plan.pdf
Community Design + Architecture. (2013, March 1). “City of South Gate – Firestone and Atlantic Station Area Plan.” Retrieved on 7 December, 2014 from http://www.elpadvisors.com/wp-content/uploads/2013/05/7-SCAG-South-Gate-Firestone-Atlantic-Station-Area-Plan.pdf
Eco-Rapid Transit Blog. (n.d.). Retrieved December 3, 2014, from http://orangelinedevelopmentauthority.wordpress.com/
Economic & Planning Systems Inc. (2014, September 9). “California Infill finance Options Analysis.” Report prepared for The Strategic Growth Council. Retrieved on 7 December, 2014 on http://sgc.ca.gov/docs/SGC_FINAL_REPORT_9.9.14.pdf
Enhanced Infrastructure Financing Districts, SB 628. (2014).
Envision Tomorrow - Welcome to Envision Tomorrow. (n.d.). Retrieved December 10, 2014, from http://www.envisiontomorrow.org/
Greenhut, S. (2011). “California’s Secret Government: Redevelopment agencies blight the Golden State”. City
Journal. Retrieved on 7 December 2014 from http://www.city-journal.org/2011/21_2_california-redevelopment-agencies.html
Ikhrata, H. (2013, February 7). Pacific Electric Right-of-Way (PE ROW)/West Santa Ana Branch Corridor
Alternatives Analysis (AA) – Study Recommendations. Memorandum from Southern California Association of Government to the Regional Council.
“Infrastructure Financing Districts.” Retrieved on 7 December 2014 from

DEC 2014 ENHANCED INFRASTRUCTURE FINANCING DISTRICTS A MECHANISM TO FINANCE ECO-RAPID TRANSIT
33 | P a g e
http://senweb03.senate.ca.gov/committee/standing/GOVERNANCE/IFDINFORMATION.HTM League of California Cities. (n.d.) SB 628 (Beall) Enhanced Infrastructure Financing District. Retrieved on
November 15, 2014 from http://www.cacities.org/CMSPages/GetFile.aspx?nodeguid=d8e42eca-7647-4f12-98d4-e93383abc48c&lang=en-US
Litman, T. (2013, 5 November). “Parking Management: Strategies, Evalaution and Planning.” Victoria Transport
Policy Institute. Retrieved on 7 December 2014 from http://www.vtpi.org/park_man.pdf
Nelson-Nygaard Consulting Associates Inc. (2012, June). “Parking Structure Technical Report: Challenges, Opportunities and Best Practices.” MTC Smart Growth Technical Assistance: Parking Reform Campaign. Retrieved on 7 December, 2014 from http://www.mtc.ca.gov/planning/smart_growth/parking/6-12/MTC_Parking_Structure.pdf
Office of Assessor, County of Los Angeles. (2014). “Guide to Taxable Possessory Interest.” Online. Retrieved on 7 December 2014 from http://assessor.lacounty.gov/extranet/overview/possint.aspx
Office of Sustainable Communities – Smart Growth Program. (2013, January). “Infrastructure Financing Options for Transit-Oriented Development.” United States Environmental Protection Agency. Retrieved on 7 December 2014 from http://www.epa.gov/dced/pdf/2013-0122-TOD-infrastructure-financing-report.pdf
Orangeline Development Authority. (n.d.). Retrieved December 3, 2014, from http://www.eco-rapid.org/
Pisano, M. (2013, December 1). “3-D Infrastructure: Building the Next California.” America 2050.
Pisano, M. (n.d). “Innovations in Funding the Built and Natural Environment: The London Experiment.”
Reynolds, W. & Thimmig, P. (2011). “Creating Infrastructure Financing Districts to Stimulate Economic Development”. Presentation. Retrieved on 7 December 2014 from http://www.edacademy.org/wp-content/uploads/2011/AC11PPT/IFD%20Conference.pdf
Shoup, D. (2005). The High Cost of Free Parking. Planners Press.
Targ, N. & Golub, D. (2014). “Enhanced Infrastructure Financing Districts: A New Power Tool for Growth in California.” Legal Brief prepared for Mondaq. Retrieved on 7 December 2014 from http://www.mondaq.com/unitedstates/x/353726/Environmental+Law/Enhanced+Infrastructure+Financing+Districts+SB+628+Beall

APPENDICES

Appendix A: Key Terms and Explainer Overview
The following terms are essential to understanding the SB 628 (League of California Cities, 2014, Enhanced Infrastructure Financing Districts, 2014): “Affected taxing entity” means any governmental taxing agency which levied or had levied on its behalf a property tax on all or a portion of the property located in the proposed district in the fiscal year prior to the designation of the district, but not 8 including any county office of education, school district, or community college district. “Enhanced infrastructure financing district” (EIFD) means a legally constituted governmental entity separate and distinct from the city or county that established it pursuant to this chapter for the sole purpose of financing public facilities or other projects as authorized by this chapter. “Infrastructure Financing Plan” means the EIFD, governed by the Public Financing Authority, implements an Infrastructure Financing Plan adopted by the city or county that describes the type of public facilities and development that will be financed by the EIFD. “Public financing authority” means the governing board of the district established pursuant to this chapter.

WWW.CAECONOMY.ORG
HOW NEW EIFDS CAN IMPROVE LOCAL INFRASTRUCTURE DEVELOPMENT
• Reduce vote requirement: While current law requires a two-thirds vote to form an Infrastructure Financing District, the new EIFDs could be formed—and could use a range of existing financial tools—without a vote. Only issuing tax increment bonds would require a vote, with a vote threshold of 55 percent.
• Expand financing authority: The new EIFDs would allow local leaders to support infrastructure projects through multiple funding streams, including a full complement of existing public mechanisms (tax increment authority, benefit assessments, and fees), as well as private investment.
• Increase investment in different types of infrastructure: The enhanced districts would be able to build every type of infrastructure: transportation, water, flood control and storm water quality management, transportation, energy, public facilities, energy, and environmental mitigation—so long as a direct connection can be established between the needed infrastructure and its users.
• Allow more flexible institutional collaborations: The proposal also would give communities more flexibility to accommodate regional growth by making infrastructure investments across jurisdictions through Joint Power Authorities.
FUNDING SUSTAINABLE COMMUNITIES: A HOW-TO GUIDE FOR USING ENHANCED INFRASTRUCTURE FINANCING DISTRICTS IN SB 628 (BEALL)
While California’s economic outlook is beginning to brighten, the state still must grapple with some imposing fiscal challenges in the years to come—especially in finding ways to meet the infrastructure needs of its growing population. By some estimates, the state will need to invest $765 billion in the next 10 years on everything from transportation and energy to water and school facilities, but the state and local governments only have the resources to pay for about half of this amount. This is why the California Economic Summit’s Infrastructure Action Team spent the last year urging state leaders to provide communities with new financing tools they need to take on these challenges themselves—and to begin to invest in everything from long-neglected sidewalks and roads to the mass-transit, affordable housing, and sustainable communities that California’s long-term prosperity depends on. With inadequate state funding for these projects—and with no sign of increased federal support—the Summit Action Team concluded that existing public resources must be complemented by a new working relationship among the public, private, and non-profit sectors. SB 628 (Beall) identifies this same problem and offers a potential solution—proposing to expand an existing local financing authority that will allow cities and other local agencies to invest in infrastructure projects from affordable housing and transit facilities to sewage treatment, stormwater management, and water reclamation. If structured correctly, the Summit believes these new “Enhanced Infrastructure Financing Districts” (EIFDs) could play an important role in driving sustainable growth by connecting a vast number of infrastructure projects with a new array of funding streams. On the pages that follow, the Summit provides a guide for how these districts can be established and how they can operate.

CASE STUDY: WATER AND OTHER INFRASTRUCTURE GOAL: A public agency wants to upgrade sidewalks and streets, while modifying runoff systems to capture stormwater, reduce pollutants, and improve urban vegetation. HOW AN EIFD COULD HELP: While existing, single-purpose funding makes it difficult to achieve all of these outcomes, they could be accomplished using the full range of tools provided by an EIFD—especially with the newly-expanded definition of water services signed into law in July after the passage of AB 2403 (Rendon). ESTABLISHING THE EIFD: A city or county would take the lead due to the comprehensive nature of the general purpose authorities included. If multiple cities or counties were involved, a Joint Powers Authority could be formed. The district boundaries could be a tributary to a water body or even an entire watershed. A workplan would be developed and presented to the district properties. CREATING INVESTMENT PROGRAM: An investment program would then be developed, identifying a range of physical improvements and their costs—sidewalks, streets, redesigned runoff, use of landscaping as water storage, and other property improvements. Localized stormwater storage, infiltration, and treatment facilities could be included. The plan would also include operations and maintenance schedules to reduce life-cycle costs. CRAFTING A FINANCING PACKAGE: At the same time, a financing package would be developed using a “tipping point” analysis to calculate how much property values will be increased by improvements to sidewalks, streets, urban vegetation, water supply, and flood control. Assessments per parcel would be conducted and revenue streams forecast. The jurisdictions could amortize their current budgets for single-purpose investments and create availability payment schedules for assessment proceedings. Groundwater infiltration volumes could also be calculated this way to determine a revenue stream. State grants could also be leveraged for water treatment. COMBINING INTO A STRATEGIC PLAN: Together, these assessments, water revenues, availability payments, tax increments, and state grants would support a final strategic plan directly linking infrastructure beneficiaries and payers. The EIFD would provide the authority, leadership, and institutional framework to implement it.
CREATING A SUCCESSFUL EIFD: A HOW-TO GUIDE SB 628’s proposed EIFDs would give communities more authority to build the infrastructure California needs to achieve its growth and sustainability goals. These financing districts would not only be able to build all public infrastructure, they could also serve as a platform for multiple funding streams—including private financing. The districts could also encourage the types of policy integration necessary to successfully implement regional sustainable communities strategies. Cities and counties, in conjunction with special districts, can successfully use this new authority by following these three steps: STEP 1: IDENTIFY WHAT NEEDS TO BE DONE To create an EIFD, a city or county—or a group of cities, counties, or other local agencies—need to identify what it is trying to accomplish (a range of desired outcomes) and then outline an investment program with the types of projects necessary to accomplish these objectives. Case studies are provided in sidebars exploring how water infrastructure and infill development projects, for example, could be supported through an EIFD.
STEP 2: LOCATE AVAILABLE FUNDING STREAMS At the same time, the public agency must determine how to fund these investments using the wide variety of funding streams available to EIFDs. These could include state and federal funds, as well as a number of other options that make EIFDs a more robust investment mechanism than local governments currently have at their disposal. These include:
• Assessment revenues: The new EIFD authority would allow local agencies to conduct benefit assessments of each property—determining how much property owners would directly benefit from the infrastructure investment—and then access these resources using existing Integrating Investment Act (IIA) authority. This would require only a simple majority vote of the properties within the district.
• Fee revenues: The EIFD would also be able to fund investments by levying user fees under the Infrastructure Financing Authority Act (IFAA). These fees, in turn, could leverage further private investment. The IFAA is governed by Proposition 26’s vote requirements.

CASE STUDY: INFILL DEVELOPMENT GOAL: Many cities are eager to make investments in projects like expanded transit stations, affordable housing, and mixed-use development that support the state’s sustainable communities policy framework. They will also help cities meet mobility, air quality, and energy reduction targets in Regional Transportation Plans. HOW AN EIFD COULD HELP: While long-term funding for sustainable communities is still uncertain, EIFDs provide a complementary set of financing tools for supporting this type of growth. They can also serve as a platform for the types of policy integration necessary to successfully develop interconnected transportation, housing, and land-use projects. ESTABLISHING THE EIFD: A city or county would take the lead due to the comprehensive nature of the general purpose authorities included. A JPA would once again be an option. The district boundaries could be a larger transit station development zone, for example, that includes collector systems. CREATING INVESTMENT PROGRAM: An investment program would target a range of interactive physical improvements—sidewalks, streets, redesigned traffic patterns, and the use of parking structures to create more space for walking and bicycles. The EIFD investment program would also include operations and maintenance schedules to reduce life-cycle costs. CRAFTING A FINANCING PACKAGE: A business plan would be created using a “tipping point” analysis calculating how much property values are increased by these investments. In many cases, investments like parking districts and circulation systems could generate fees that could be captured using the fee authority of the EIFD. Tax increment could also be used to leverage these assessment and fee funding streams. To encourage affordable housing development, the Strategic Growth Council could also use new cap & trade funds to further leverage this system. COMBINING INTO A STRATEGIC PLAN: Once again, all of these new EIFD authorities would be combined in a strategic plan—one that provides cities with a unique instrument that can integrate all of the different types of projects encouraged by SB 375.
• Public debt: If the investment program requires public indebtedness, the agency could also use the authority of the EIFD to tap two public revenue sources: (1) A percentage of the growth of the non-school share of the property tax base that results from the investment (an approach similar to the one used by redevelopment agencies); or (2) An amortized portion of local budgets known as an “availability payment” that can serve as a reliable method of compensating infrastructure vendors working for a specific period of time.
STEP 3: ESTABLISH LINK BETWEEN PAYER AND BENEFICIARY While all of these funding streams can be used in conjunction with each other, a final strategic plan combining these resources must include one last consideration: For each project and property involved, a link must be established between the payer and the beneficiary. This is a potentially complex task, of course—one that has caused local governments for years to turn instead to sales tax measures and state bonds to support infrastructure projects. But innovations in the planning profession are making this approach much more feasible. In the “Blueprint” growth-visioning process used by the Southern California Association of Governments, for example, planners relied on geographic informational systems analysis and modeling to identify when specific land parcels experienced a “tipping point” in value as a result of public infrastructure and land-use investments. A modification of this “tipping point” analysis is under development that will allow the same approach to be used for water infrastructure—giving planners a way to determine how geomorphology within an EIFD, for example, determines how water runoff impacts individual land parcels. By using these tools, the proportionality analysis needed to satisfy Proposition 218 and Proposition 26 can be established—and an EIFD can successfully tap into a wealth of new revenue streams directly linking infrastructure beneficiaries with taxpayers. This will empower local leaders to address local infrastructure issues—and provide California with a way to take on one of its preeminent fiscal challenges.
Special thanks to the Southwest Megaregion Alliance for its contributions to developing this guidebook.

SUMMIT STEERING COMMITTEE Bill Allen Los Angeles County Economic Development Corp.
Lenny Mendonca McKinsey & Company (ret.)
Lucy Dunn Orange County Business Council
Bill Mueller Valley Vision (Sacramento)
Steve Frisch Sierra Business Council
Eloy Oakley – Co-Chair Long Beach City College
Paul Granillo – Co-Chair Inland Empire Economic Partnership
Carl Guardino Silicon Valley Leadership Group
Glenda Humiston USDA Rural Development
Joanne Kozberg California Strategies
Sean Randolph Bay Area Council Economic Institute
Lauree Sahba San Diego Regional Economic Development Corp.
Ben Stone Sonoma County Economic Development Board
2013 SUMMIT UNDERWRITERS AND SPONSORS Summit Underwriters Forum Underwriters
AT&T Automobile Club of Southern California California Airports Council Chevron Edison International Metabolic Studio Sempra Energy Utilities
Morgan Family Foundation Wells Fargo
Sponsoring Organizations Applied Materials Bridgepoint Education Half Moon Bay Brewing Co.
Non-Profit Sponsors California Emerging Technology Fund Long Beach City College The Nature Conservancy
SUMMIT CO-CHAIRS Gavin Newsom Lieutenant Governor of California
Michael Rossi Senior Advisor - Office of the Governor
Laura Tyson University of California, Berkeley
Ashley Boren Sustainable Conservation
José Cisneros League of California Cities
Jim Earp California Alliance for Jobs
John Gioia California State Association of Counties
Antonia Hernandez California Community Foundation
Jessie Knight Sempra Energy
Sunne Wright McPeak California Emerging Technology Fund
Dave Regan SEIU-United Healthcare Workers West
Maria Salinas ProAmérica Bank
Ashley Swearengin Mayor of Fresno
2014 SUMMIT LEADERSHIP AND PARTNERS
HONORARY CHAIRS George Shultz Hoover Institution, Stanford University
Leon Panetta The Panetta Institute for Public Policy
SUMMIT PARTNERS
The California Economic Summit is a partnership of California Forward, an organization that works with Californians to stimulate the economy, make government more effective, and promote accountability and transparency, and the California Stewardship Network, a civic effort to develop regional solutions to the state’s most pressing economic, environmental, and community challenges.

Appendix B: Visual Structure of EIFD JPA

Appendix C: Assumptions for Tax Increment Financing
Phase one (2014-2019)
Land Use Real Estate Improvement Transit Premium
Developer Fees Property Tax Rate
Garfield Corridor
FAR 3.0 30 Units/D.U
Retail $211/SF Residential $191,000/Unit
Retail 5% Residential 2%
Retail $28/SF Residential $26,000/Unit
City of South Gate 1.1792%
Hollydale FAR 3.0 Retail $211/SF Light Industrial $104/SF
Retail 5%
Retail $28/SF City of South Gate 1.1792%
Phase two (2020-2025)
Land Use Real Estate Improvement Transit Premium
Developer Fees Property Tax Rate
LA County owned parcel
FAR 3.0 30 Units/D.U
Retail $211/SF Residential $191,000/Unit
Retail 5% Residential 2%
Retail $28/SF Residential $26,000/Unit
City of South Gate 1.1792%
Rancho Campus
FAR 1.51 Retail $211/SF2 Office $197/SF3 Restaurant $201/SF4 Industrial $162/SF5 Daycare Center $196/SF6
Retail/Restaurant, Office/Daycare Center 9%7
Retail/Office/Restaurant, Industrial 10% of improvement cost 8
City of South Gate 1.1792%9
Apartments in ½ catchment basin
Apartment/Condominium 4%
City of South Gate 1.1792% City of Downey 1.0879%
Imperial FAR 3.0 Residential $191,000/Unit Office/Daycare Residential City of South Gate
1 Los Angeles County Department Regional Planning Mix Use Land Use and Zoning,, Retrieved from http://planning.lacounty.gov/tod/mixed 2 Economic & Planning Systems, Inc. (Sep 9, 2014, P46) Retrieved from http://sgc.ca.gov/docs/SGC_FINAL_REPORT_9.9.14.pdf, http://sgc.ca.gov/docs/SGC_FINAL_REPORT_9.9.14.pdf 3 Economic & Planning Systems, Inc. (Sep 9, 2014, P47) Retrieved from http://sgc.ca.gov/docs/SGC_FINAL_REPORT_9.9.14.pdf, http://sgc.ca.gov/docs/SGC_FINAL_REPORT_9.9.14.pdf 4 Economic & Planning Systems, Inc. (Sep 9, 2014, P46) Retrieved from http://sgc.ca.gov/docs/SGC_FINAL_REPORT_9.9.14.pdf, http://sgc.ca.gov/docs/SGC_FINAL_REPORT_9.9.14.pdf 5 the BCD Industrail Building Cost Per Square Foot Analysis http://www.dcd.com/pdf_files/1107analysis.pdf 6 Construction Cost Estimates for Day Care Center in National, US http://learn.rsmeans.com/rsmeans/models/daycare-center/ 7Nelson\Nygaard Consulting Associates Inc.(June 12, 2012, 4-3), Parking Structure Technical Report, Page4-3,http://www.mtc.ca.gov/planning/smart_growth/parking/6-12/MTC_Parking_Structure.pdf 8 Economic & Planning Systems, Inc. (Sep 9, 2014, P46) Retrieved from http://sgc.ca.gov/docs/SGC_FINAL_REPORT_9.9.14.pdf, http://sgc.ca.gov/docs/SGC_FINAL_REPORT_9.9.14.pdf 9 http://www.latimes.com/local/la-me-city-property-tax-table-htmlstory.html

Industrial Area 30 Units/D.U Office $197/SF10 Office $197/SF11
Center 9%12 $26,000/Unit Industrial 10% of improvement cost 13
1.1792%
Surrounding residential SFR
Residential 2% City of South Gate 1.1792% City of Downey 1.0879%
10 Economic & Planning Systems, Inc. (Sep 9, 2014, P47) Retrieved from http://sgc.ca.gov/docs/SGC_FINAL_REPORT_9.9.14.pdf, http://sgc.ca.gov/docs/SGC_FINAL_REPORT_9.9.14.pdf 11 Economic & Planning Systems, Inc. (Sep 9, 2014, P47) Retrieved from http://sgc.ca.gov/docs/SGC_FINAL_REPORT_9.9.14.pdf, http://sgc.ca.gov/docs/SGC_FINAL_REPORT_9.9.14.pdf 12Nelson\Nygaard Consulting Associates Inc.(June 12, 2012, 4-3), Parking Structure Technical Report, Page4-3,http://www.mtc.ca.gov/planning/smart_growth/parking/6-12/MTC_Parking_Structure.pdf 13 Economic & Planning Systems, Inc. (Sep 9, 2014, P46) Retrieved from http://sgc.ca.gov/docs/SGC_FINAL_REPORT_9.9.14.pdf, http://sgc.ca.gov/docs/SGC_FINAL_REPORT_9.9.14.pdf

Phaseo one 2015-2019
1)Increase density to FAR 3.0 and 30 Units/ acre along Carfiel Corridor, Hollydale District and Imperial Industial Area
2)Rezoning along Garfiel Corridor from residentail to commerical; along Hollydale from heavy industrial to light industrial
Hollydale Industrial District
AIN Land Use Change Land Use - According to City of South Gate Res_Units Res_SF Building SF ACRES Density Increase Construction SF Land Value Improvement Value Total Value Existing Tax
6243022019 Retail Stores and Commercial ServicesM3 - Heavy Manufacturing Zone 0 0 9200 0.33976 29599.8912 20399.8912 227399 368761 596160 7029.91872
6243022005 Light Industrial - Manufacturing, Assembly and Industrial Services M3 - Heavy Manufacturing Zone 0 0 11642 0.33989 29611.2168 17969.2168 173671 445416 619087 7300.273904
6243026001 Public Facilities M3 - Heavy Manufacturing Zone 0 0 1668 0.19156 16688.7072 15020.7072 165749 40181 205930 2428.32656
6243026900 Local Parks and Recreations M3 - Heavy Manufacturing Zone 0 0 0 1.53871 134052.4152 134052.4152 0 0 0 0
6243021012 Light Industrial - Manufacturing, Assembly and Industrial Services M3 - Heavy Manufacturing Zone 0 0 7500 0.5591 48708.792 41208.792 81574 21578 103152 1216.368384
6243021013 Light Industrial - Manufacturing, Assembly and Industrial Services M3 - Heavy Manufacturing Zone 0 0 0 0.36719 31989.5928 31989.5928 0 0 0 0
6243021011 Light Industrial - Manufacturing, Assembly and Industrial Services M3 - Heavy Manufacturing Zone 0 0 77185 2.07754 180995.2848 103810.2848 2612808 1567685 4180493 49296.37346
6243021016 Retail Stores and Commercial ServicesM3 - Heavy Manufacturing Zone 0 0 2550 0.22398 19513.1376 16963.1376 351589 198898 550487 6491.342704
6243022020 Light Industrial - Manufacturing, Assembly and Industrial Services M3 - Heavy Manufacturing Zone 0 0 5756 0.17061 14863.5432 9107.5432 132556 12045 144601 1705.134992
6243022017 Public Facilities M3 - Heavy Manufacturing Zone 0 0 22181 0.99622 86790.6864 64609.6864 868927 482179 1351106 15932.24195
6243022018 Light Industrial - Manufacturing, Assembly and Industrial Services M3 - Heavy Manufacturing Zone 0 0 7520 0.33986 29608.6032 22088.6032 168712 75917 244629 2884.665168
6243022001 Light Industrial - Manufacturing, Assembly and Industrial Services M3 - Heavy Manufacturing Zone 0 0 41916 2.22694 194011.0128 152095.0128 1175128 1573917 2749045 32416.73864
6243025019 Light Industrial - Manufacturing, Assembly and Industrial Services M3 - Heavy Manufacturing Zone 0 0 5000 0.42854 37334.4048 32334.4048 225859 26564 252423 2976.572016
6243022002 Light Industrial - Manufacturing, Assembly and Industrial Services M3 - Heavy Manufacturing Zone N/A N/A 0 0.17006 14815.6272 14815.6272 90955 0 90955 1072.54136
6243022006 Light Industrial - Manufacturing, Assembly and Industrial Services M3 - Heavy Manufacturing Zone 0 0 9237 0.33992 29613.8304 20376.8304 168712 92790 261502 3083.631584
6243026003 Commercial and Services M3 - Heavy Manufacturing Zone 0 0 2400 0.17347 15112.7064 12712.7064 22773 21975 44748 527.668416
6243025013 Vacant M3 - Heavy Manufacturing Zone N/A N/A 0 0.22964 20006.2368 20006.2368 0 0 0 0
6243022021 Light Industrial - Manufacturing, Assembly and Industrial Services M3 - Heavy Manufacturing Zone 0 0 5696 0.1693 14749.416 9053.416 132556 12045 144601 1705.134992
6243025024 Light Industrial - Manufacturing, Assembly and Industrial Services M3 - Heavy Manufacturing Zone N/A N/A 0 1.8671 162661.752 162661.752 0 0 0 0
6243025014 Vacant M3 - Heavy Manufacturing Zone N/A N/A 0 0.22749 19818.9288 19818.9288 0 0 0 0
6243025018 Light Industrial - Manufacturing, Assembly and Industrial Services M3 - Heavy Manufacturing Zone N/A N/A 0 0.45912 39998.5344 39998.5344 0 0 0 0
6243021017 Light Industrial - Manufacturing, Assembly and Industrial Services M3 - Heavy Manufacturing Zone 0 0 10000 0.53986 47032.6032 37032.6032 124975 144903 269878 3182.401376
6243022009 Light Industrial - Manufacturing, Assembly and Industrial Services M3 - Heavy Manufacturing Zone 0 0 2400 0.17016 14824.3392 12424.3392 114479 24096 138575 1634.0764
6243026005 Vacant M3 - Heavy Manufacturing Zone 0 0 4000 0.5166 45006.192 41006.192 825058 30701 855759 10091.11013
6243021010 Light Industrial - Manufacturing, Assembly and Industrial Services M3 - Heavy Manufacturing Zone 0 0 3456 0.18576 16183.4112 12727.4112 27376 9175 36551 431.009392
6243021018 Light Industrial - Manufacturing, Assembly and Industrial Services M3 - Heavy Manufacturing Zone N/A N/A 0 1.11381 97035.1272 97035.1272 0 0 0 0
6243021007 Heavy Industrial - Manufacturing M3 - Heavy Manufacturing Zone 0 0 45731 1.30523 113711.6376 67980.6376 757509 528039 1285548 15159.18202
14125230 166564.7122
Assumptions

Value Change Value add up Transit Premium(2025)Total Futre Value Future Value Futrue Tax Impact and Developer Fee Tax incerement
4304377.043 4900537.043 245026.8522 5655615.727 5410588.875 66691.02065 430437.7043 59661.10193
1114091.442 1733178.442 0 1913569.046 1913569.046 22564.80619 111409.1442 15264.53229
0 205930 0 227363.3598 227363.3598 2681.068739 0 252.7421788
0 0 0 0 0 0 0 0
2554945.104 2658097.104 0 2934753.986 2934753.986 34606.619 255494.5104 33390.25061
1983354.754 1983354.754 0 2189783.909 2189783.909 25821.93186 198335.4754 25821.93186
6436237.658 10616730.66 0 11721728.51 11721728.51 138222.6226 643623.7658 88926.24916
3760514.357 3959412.357 197970.6179 4569481.794 4371511.176 53883.32931 474967.8528 47391.98661
564667.6784 709268.6784 0 783089.9321 783089.9321 9234.19648 56466.76784 7529.061488
0 0 0 0 0 0 -15932.24195
1369493.398 1614122.398 0 1782121.554 1782121.554 21014.77737 136949.3398 18130.1122
9429890.794 12178935.79 0 13446529.21 13446529.21 158561.4725 942989.0794 126144.7338
2004733.098 2257156.098 0 2492082.717 2492082.717 29386.6394 200473.3098 26410.06739
918568.8864 1009523.886 0 1114595.943 1114595.943 13143.31536 91856.88864 12070.774
1263363.485 1524865.485 0 1683574.709 1683574.709 19852.71297 126336.3485 16769.08139
2822789.924 2844764.924 142238.2462 3283088.588 3140850.342 38714.18063 355955.7792 38186.51221
2225484.872 2225484.872 0 2457115.125 2457115.125 28974.30155 28974.30155
561311.792 705912.792 0 779384.7624 779384.7624 9190.505118 56131.1792 7485.370126
10085028.62 10085028.62 0 11134686.5 11134686.5 131300.2232 1008502.862 131300.2232
2204648.813 2204648.813 0 2434110.432 2434110.432 28703.03022 28703.03022
2479909.133 2479909.133 0 2738020.067 2738020.067 32286.73263 247990.9133 32286.73263
2296021.398 2565899.398 0 2832960.269 2832960.269 33406.26749 229602.1398 30223.86611
770309.0304 908884.0304 0 1003481.41 1003481.41 11833.05279 77030.90304 10198.97639
4590468.754 4621169.754 0 5102144.814 5102144.814 60164.49164 50073.38152
789099.4944 825650.4944 0 911584.861 911584.861 10749.40868 78909.94944 10318.39929
6016177.886 6016177.886 0 6642346.513 6642346.513 78326.55008 601617.7886 78326.55008
4214799.531 5500347.531 0 6072828.12 6072828.12 71610.78919 421479.9531 56451.60718
74760286.95 86334990.95 585235.7162 95906041.87 95320806.15 1130924.046 6746561.655 964359.3335

Phaseo one 2015-2019
1)Increase density to FAR 3.0 and 30 Units/ acre along Carfiel Corridor, Hollydale District and Imperial Industial Area
2)Rezoning along Garfiel Corridor from residentail to commerical; along Hollydale from heavy industrial to light industrial
Garfield Corridor
AINLand Use - According
to SGAGLand us change Res_Units
Units increaseRes_SF Building SF ACRES Density Increase Construction SF Land Value Improvement Value Total Value Existing tax
6243007025 Single Family ResidentialRetail 1 0 1102 0 0.15553 20324.6604 19222.6604 224000 102000 326000 3844.192
6243007026 Single Family ResidentialRetail 1 0 1266 0 0.13092 17108.6256 15842.6256 195081 136416 331497 3909.012624
6243007027 Single Family ResidentialRetail 1 0 1339 0 0.12929 16895.6172 15556.6172 97813 71502 169315 1996.56248
6243007028 Single Family ResidentialRetail 1 0 1712 0 0.12742 16651.2456 14939.2456 200000 137000 337000 3973.904
6243007029 Single Family ResidentialRetail 1 0 1265 0 0.1425 18621.9 17356.9 30576 31789 62365 735.40808
6243008019 Single Family ResidentialRetail 1 0 1665 0 0.12776 16695.6768 15030.6768 127054 110201 237255 2797.71096
6243008020 Single Family ResidentialRetail 1 0 1220 0 0.1401 18308.268 17088.268 179008 70549 249557 2942.776144
6243008021 Single Family ResidentialRetail 1 0 1334 0 0.12507 16344.1476 15010.1476 266000 66000 332000 3914.944
6243008022 Single Family ResidentialRetail 1 0 1043 0 0.13724 17934.5232 16891.5232 177323 96451 273774 3228.343008
6243008023 Single Family ResidentialRetail 1 0 1442 0 0.12572 16429.0896 14987.0896 142363 152472 294835 3476.69432
6243008024 Single Family ResidentialRetail 1 0 1151 0 0.12742 16651.2456 15500.2456 245822 84238 330060 3892.06752
6243008025 Single Family ResidentialRetail 1 0 1225 0 0.12542 16389.8856 15164.8856 227956 97693 325649 3840.053008
6243008026 Single Family ResidentialRetail 1 0 1826 0 0.13161 17198.7948 15372.7948 217400 136600 354000 4174.368
6243008027 Single Family ResidentialRetail 1 0 944 0 0.13367 17467.9956 16523.9956 227000 56000 283000 3337.136
6243008028 Single Family ResidentialRetail 1 0 948 0 0.1381 18046.908 17098.908 210000 52000 262000 3089.504
6243008029 Single Family ResidentialRetail 1 0 1358 0 0.12527 16370.2836 15012.2836 124435 121333 245768 2898.096256
6243008030 Single Family ResidentialRetail 1 0 1089 0 0.12555 16406.874 15317.874 52039 78071 130110 1534.25712
6243008031 Single Family ResidentialRetail 1 0 1258 0 0.13698 17900.5464 16642.5464 76350 94868 171218 2019.002656
6243008032 Single Family ResidentialRetail 1 0 1368 0 0.13304 17385.6672 16017.6672 29377 34983 64360 758.93312
6243008033 Single Family ResidentialRetail 1 0 1349 0 0.13092 17108.6256 15759.6256 154699 125567 280266 3304.896672
6243008034 Single Family ResidentialRetail 1 0 1232 0 0.12998 16985.7864 15753.7864 127976 156870 284846 3358.904032
6243008035 Single Family ResidentialRetail 1 0 1318 0 0.13423 17541.1764 16223.1764 106281 83696 189977 2240.208784
6243008036 Single Family ResidentialRetail 1 0 1390 0 0.13973 18259.9164 16869.9164 140720 76002 216722 2555.585824
6243009019 Single Family ResidentialRetail 1 0 1258 0 0.13309 17392.2012 16134.2012 125102 89395 214497 2529.348624
6243009020 Single Family ResidentialRetail 1 0 1370 0 0.12967 16945.2756 15575.2756 137230 128209 265439 3130.056688
6243009021 Single Family ResidentialRetail 1 0 803 0 0.13594 17764.6392 16961.6392 150000 93000 243000 2865.456
6243009022 Single Family ResidentialRetail 1 0 845 0 0.13823 18063.8964 17218.8964 29377 20972 50349 593.715408
6243009023 Single Family ResidentialRetail 1 0 1468 0 0.12618 16489.2024 15021.2024 127834 93415 221249 2608.968208
6243009024 Single Family ResidentialRetail 1 0 888 0 0.12369 16163.8092 15275.8092 145111 76067 221178 2608.130976
6243009025 Single Family ResidentialRetail 1 0 1225 0 0.13276 17349.0768 16124.0768 269000 67000 336000 3962.112
6243009026 Single Family ResidentialRetail 1 0 2628 0 0.13292 17369.9856 14741.9856 168264 157813 326077 3845.099984
6243009033 General Office Use 0 0 0 5140 0.12305 16080.174 10940.174 232975 357028 590003 6957.315376
6243009034 Public Facilities 0 0 0 5928 0.13773 17998.5564 12070.5564 30778 123026 153804 1813.656768
6243009035 Retail Stores and Commercial Services 0 0 5244 0.12684 16575.4512 11331.4512 187361 122729 310090 3656.58128
6243009037 Retail Stores and Commercial Services 0 0 1344 0.25461 33272.4348 31928.4348 61576 34983 96559 1138.623728
6243009038 Single Family Residential 4 30 2560 0 0.13417 17533.3356 200125 402527 602652 7106.472384
6243009039 Retail Stores and Commercial Services 0 0 9952 0.51883 67800.7044 57848.7044 127846 190926 318772 3758.959424
6243010016 Retail Stores and Commercial Services 1 30 1750 0 0.06714 8773.8552 106044 120508 226552 2671.501184
6243010018 Commercial and Services 0 0 2150 0.06397 8359.5996 6209.5996 79710 132855 212565 2506.56648
6243010021 Retail Stores and Commercial Services 0 0 14360 0.1313 17158.284 2798.284 334027 162373 496400 5853.5488
6243010030 Retail Stores and Commercial Services 0 0 6164 0.25841 33769.0188 27605.0188 209683 408529 618212 7289.955904
6243010031 Retail Stores and Commercial Services 0 0 2120 0.19327 25256.5236 23136.5236 144609 4816 149425 1762.0196
6243010034 Single Family Residential 1 30 1204 0 0.12661 16545.3948 186000 124000 310000 3655.52
6243010036 General Office Use 0 0 3500 0.12382 16180.7976 12680.7976 135208 147501 282709 3333.704528
6243010037 Retail Stores and Commercial Services 0 0 2454 0.06507 8503.3476 6049.3476 86039 184378 270417 3188.757264
6243010040 Retail Stores and Commercial Services 0 0 9618 0.50806 66393.2808 56775.2808 424274 141416 565690 6670.61648
6243013052 #N/A #N/A #N/A 0 0 0 #N/A 0 0 0 0
6243014004 Retail Stores and Commercial Services 2 1829 0 0.13911 18178.8948 16349.8948 275000 140000 415000 4893.68
6243014038 Light Industrial - Manufacturing, Assembly and Industrial Services0 0 1120 0.06362 8313.8616 7193.8616 44755 159855 204610 2412.76112

6243014039 Retail Stores and Commercial Services 0 0 2580 0.12789 16712.6652 14132.6652 428600 187511 616111 7265.180912
6243014041 Retail Stores and Commercial Services 0 0 5668 0.32535 42516.738 36848.738 134157 382158 516315 6088.38648
6243015003 Retail Stores and Commercial Services 0 0 9900 0.23083 30164.8644 20264.8644 69974 143439 213413 2516.566096
6243015004 Retail Stores and Commercial Services 0 0 5500 0.1259 16452.612 10952.612 40150 71183 111333 1312.838736
6243015005 Retail Stores and Commercial Services 0 0 5428 0.12337 16121.9916 10693.9916 40150 138932 179082 2111.734944
6243015039 Public Facilities 0 0 4820 0.2022 26423.496 21603.496 62907 146176 209083 2465.506736
6243016001 Single Family Residential 1 30 1656 0 0.20215 26416.962 119104 87761 206865 2439.35208
6243016002 Single Family Residential 4 30 2931 0 0.12856 16800.2208 68930 160699 229629 2707.785168
6243016004 Retail Stores and Commercial Services 0 0 1125 0.06478 8465.4504 7340.4504 120053 52517 172570 2034.94544
6243016005 Retail Stores and Commercial Services 0 0 2139 0.06056 7913.9808 5774.9808 204674 227413 432087 5095.169904
6243016038 General Office Use 0 0 875 0.06471 8456.3028 7581.3028 64906 108179 173085 2041.01832
6243016039 Retail Stores and Commercial Services 0 0 1461 0.13936 18211.5648 16750.5648 35706 24978 60684 715.585728
6243017001 Single Family Residential 1 30 1069 0 0.20221 26424.8028 64611 84497 149108 1758.281536
6243017004 Single Family Residential 1 30 910 0 0.13327 17415.7236 33751 30723 64474 760.277408
6243017005 Single Family Residential 1 30 1105 0 0.11163 14587.8084 213000 31000 244000 2877.248
6243017006 Single Family Residential 1 30 1271 0 0.11094 14497.6392 113324 127464 240788 2839.372096
6243017035 Single Family Residential 1 30 915 0 0.13286 17362.1448 142867 81832 224699 2649.650608
6243018001 Single Family Residential 1 30 1060 0 0.13365 17465.382 101900 68151 170051 2005.241392
6243018002 Single Family Residential 1 30 955 0 0.12304 16078.8672 206000 51000 257000 3030.544
6243018003 Single Family Residential 1 30 1602 0 0.12999 16987.0932 149428 127736 277164 3268.317888
6243018004 Single Family Residential 1 30 861 0 0.13037 17036.7516 61794 63882 125676 1481.971392
6243018005 Single Family Residential 1 30 976 0 0.13002 16991.0136 122879 83605 206484 2434.859328
6243019001 Single Family Residential 1 30 1278 0 0.14008 18305.6544 147118 107998 255116 3008.327872
6243019002 Single Family Residential 1 30 1280 0 0.12717 16618.5756 167108 163528 330636 3898.859712
6243019003 Single Family Residential 1 30 976 0 0.1281 16740.108 54910 127595 182505 2152.09896
6243019004 Single Family Residential 1 30 1184 0 0.0672 8781.696 139000 192000 331000 3903.152
6243019005 Single Family Residential 1 30 1373 0 0.12714 16614.6552 29175 32777 61952 730.537984
6243019006 Single Family Residential 1 30 884 0 0.08183 10693.5444 105311 44686 149997 1768.764624
6243020004 Single Family Residential 1 30 903 0 0.13277 17350.3836 151882 67308 219190 2584.68848
6243020005 Single Family Residential 1 30 1062 0 0.12192 15932.5056 160519 88860 249379 2940.677168
6243020006 Single Family Residential 1 30 1674 0 0.14124 18457.2432 163000 175000 338000 3985.696
6243020007 Single Family Residential 1 30 1058 0 0.12288 16057.9584 59454 68937 128391 1513.986672
6243020008 Single Family Residential 1 30 1175 0 0.12472 16298.4096 47099 56701 103800 1224.0096
6243020009 Single Family Residential 1 30 1069 0 0.12719 16621.1892 262000 59000 321000 3785.232
6243020010 Single Family Residential 1 30 880 0 0.08354 10917.0072 51148 122766 173914 2050.793888
6243020026 Single Family Residential 1 30 1237 0 0.09963 13019.6484 100410 87940 188350 2221.0232
6243020027 Single Family Residential 1 30 980 0 0.12971 16950.5028 209000 82000 291000 3431.472
21856754 257734.8432

Value change Future Value Transit Premium(2025) Total Futrue Value Future Tax Tax increment Impact and developer fee
4181869.348 4729737.911 236486.8955 4966224.806 58561.72292 54717.53092 538234.4912
3448762.352 3958326.594 197916.3297 4156242.924 49010.41656 45101.40393 443593.5168
3387095.236 3818570.814 190928.5407 4009499.355 47280.01639 45283.45391 435585.2816
3255316.226 3745391.224 187269.5612 3932660.785 46373.93597 42400.03197 418298.8768
3777647.253 4205925.437 210296.2719 4416221.709 52076.0864 51340.67832 485993.2
3274883.41 3737406.714 186870.3357 3924277.05 46275.07497 43477.36401 420858.9504
3719023.309 4183994.039 209199.702 4393193.741 51804.54059 48861.76445 478471.504
3268374.428 3681418.796 184070.9398 3865489.736 45581.85497 41666.91097 420284.1328
3675195.235 4164202.205 208210.1102 4372412.315 51559.48602 48331.14301 472962.6496
3264035.308 3772100.133 188605.0066 3960705.139 46704.635 43227.94068 419638.5088
3373687.226 3817828.861 190891.443 4008720.304 47270.82983 43378.76231 434006.8768
3301307.44 3752771.136 187638.5568 3940409.693 46465.3111 42625.25809 424616.7968
3350186.548 3849694.092 192484.7046 4042178.797 47665.37237 43491.00437 430438.2544
3594757.307 4030731.06 201536.553 4232267.613 49906.89969 46569.76369 462671.8768
3719649.523 4164205.835 208210.2918 4372416.127 51559.53097 48470.02697 478769.424
3268987.006 3743187.235 187159.3618 3930346.597 46346.64707 43448.55082 420343.9408
3333693.216 3766863.376 188343.1688 3955206.545 46639.79558 45105.53846 428900.472
3622450.683 4104220.197 205211.0099 4309431.207 50816.8128 48797.81014 465991.2992
3487412.085 3889008.794 194450.4397 4083459.234 48152.15129 47393.21817 448494.6816
3431249.352 3927012.654 196350.6327 4123363.287 48622.69988 45317.80321 441269.5168
3429256.432 3959373.352 197968.6676 4157342.019 49023.37709 45664.47306 441106.0192
3531737.727 3991730.974 199586.5487 4191317.522 49424.01622 47183.80744 454248.9392
3672651.639 4138816.521 206940.826 4345757.347 51245.17063 48689.58481 472357.6592
3512041.229 3976276.605 198813.8302 4175090.435 49232.66641 46703.31779 451757.6336
3391339.735 3885866.195 194293.3097 4080159.504 48113.24087 44983.18419 436107.7168
3688937.474 4175564.564 208778.2282 4384342.793 51700.17021 48834.71421 474925.8976
3745072.299 4158017.215 207900.8607 4365918.076 51482.90595 50889.19054 482129.0992
3271605.439 3715254.469 185762.7234 3901017.192 46000.79473 43391.82652 420593.6672
3323312.035 3753189.136 187659.4568 3940848.592 46470.4866 43862.35562 427722.6576
3509637.875 3948897.217 197444.8609 4146342.078 48893.66579 44931.55379 451474.1504
3218146.138 3727331.676 186366.5838 3913698.26 46150.32988 42305.2299 412775.5968
2155214.278 3030941.697 0 3030941.697 35740.86449 28783.54912 0
153804 339624.0877 0 339624.0877 4004.847242 2191.190474 0
2390936.203 2982151.18 149107.559 3131258.739 36923.80305 33267.22177 317280.6336
6736899.743 7544690.617 377234.5309 7921925.148 93415.34135 92276.71762 893996.1744
4966000 6148241.773 122964.8355 6271206.608 73950.06833 66843.59594 676000
12206076.63 13828444.93 691422.2467 14519867.18 171218.2738 167459.3144 1619763.723
1851283.447 2294098.229 114704.9115 2408803.141 28404.60664 25733.10545 245667.9456
1310225.516 1681283.776 84064.18878 1765347.964 20816.9832 18310.41672 173868.7888
590437.924 1199956.888 59997.8444 1259954.732 14857.38621 9003.837405 78351.952
5824658.967 7113450.152 355672.5076 7469122.66 88075.8944 80785.9385 772940.5264
4881806.48 5554886.093 277744.3047 5832630.398 68778.37765 67016.35805 647822.6608
5539000 6457768.618 129155.3724 6586923.99 77673.00769 74017.48769 754000
282709 624267.1596 0 624267.1596 7361.358346 4027.653818 0
1276412.344 1707824.584 85391.2292 1793215.813 21145.60087 17956.84361 169381.7328
11979584.25 13850996.47 692549.8234 14543546.29 171497.4979 164826.8814 1589707.862
0 0 0 0 0 0
3449827.803 4267082.185 213354.1092 4480436.294 52833.30478 47939.62478 457797.0544
204610 451811.9463 0 451811.9463 5327.766471 2915.005351 0

2981992.357 3972596.845 198629.8422 4171226.687 49187.10509 41921.92418 537041.2776
7775083.718 9154374.156 457718.7078 9612092.864 113345.7991 107257.4126 1400252.044
4275886.388 4956549.275 247827.4637 5204376.738 61370.0105 58853.4444 770064.8472
2311001.132 2674452.614 133722.6307 2808175.245 33114.00249 31801.16375 416199.256
2256432.228 2689004.505 134450.2252 2823454.73 33294.17817 31182.44323 406371.6808
209083 461689.0532 0 461689.0532 5444.237315 2978.730579 0
5539000 6343899.244 126877.9849 6470777.229 76303.40509 73864.05301 754000
4966000 5736394.239 114727.8848 5851122.124 68996.43209 66288.64692 676000
1548835.034 1900570.253 95028.51265 1995598.766 23532.10064 21497.1552 205532.6112
1218520.949 1822404.55 91120.22749 1913524.777 22564.28417 17469.11427 161699.4624
173085 382199.6516 34397.96865 416597.6203 4912.519138 2871.500818 0
3534369.173 3969229.195 198461.4597 4167690.654 49145.4082 48429.82247 469015.8144
5539000 6280130.849 125602.617 6405733.466 75536.40903 73778.1275 754000
5539000 6186688.075 123733.7615 6310421.836 74412.49429 73652.21688 754000
5539000 6384899.285 127697.9857 6512597.271 76796.54701 73919.29901 754000
5539000 6381352.977 127627.0595 6508980.037 76753.8926 73914.5205 754000
5539000 6363589.421 127271.7884 6490861.21 76540.23539 73890.58478 754000
5539000 6303253.614 126065.0723 6429318.686 75814.52594 73809.28455 754000
5539000 6399252.335 127985.0467 6527237.382 76969.18321 73938.63921 754000
5539000 6421515.021 128430.3004 6549945.321 77236.95523 73968.63734 754000
5539000 6254260.028 125085.2006 6379345.229 75225.23893 73743.26754 754000
5539000 6343478.589 126869.5718 6470348.161 76298.34552 73863.48619 754000
5539000 6397172.247 127943.4449 6525115.692 76944.16424 73935.83637 754000
5539000 6480552.429 129611.0486 6610163.478 77947.04773 74048.18802 754000
5539000 6317003.836 126340.0767 6443343.913 75979.91142 73827.81246 754000
5539000 6480954.315 129619.0863 6610573.401 77951.88155 74048.72955 754000
5539000 6183903.583 123678.0717 6307581.655 74379.00287 73648.46489 754000
5539000 6281112.377 125622.2475 6406734.625 75548.21469 73779.45007 754000
5539000 6357507.04 127150.1408 6484657.181 76467.07748 73882.389 754000
5539000 6390838.136 127816.7627 6518654.898 76867.97856 73927.30139 754000
5539000 6488682.88 129773.6576 6618456.538 78044.8395 74059.1435 754000
5539000 6257257.607 125145.1521 6382402.759 75261.29334 73747.30667 754000
5539000 6230107.156 124602.1431 6354709.299 74934.73206 73710.72246 754000
5539000 6469913.507 129398.2701 6599311.777 77819.08447 74033.85247 754000
5539000 6307518.678 126150.3736 6433669.051 75865.82545 73815.03156 754000
5539000 6323457.188 126469.1438 6449926.332 76057.53131 73836.50811 754000
5539000 6436791.083 128735.8217 6565526.904 77420.69326 73989.22126 754000
349093096.1 404334991.3 14484395.97 418819387.2 4938718.214 4680983.371 46937379.34
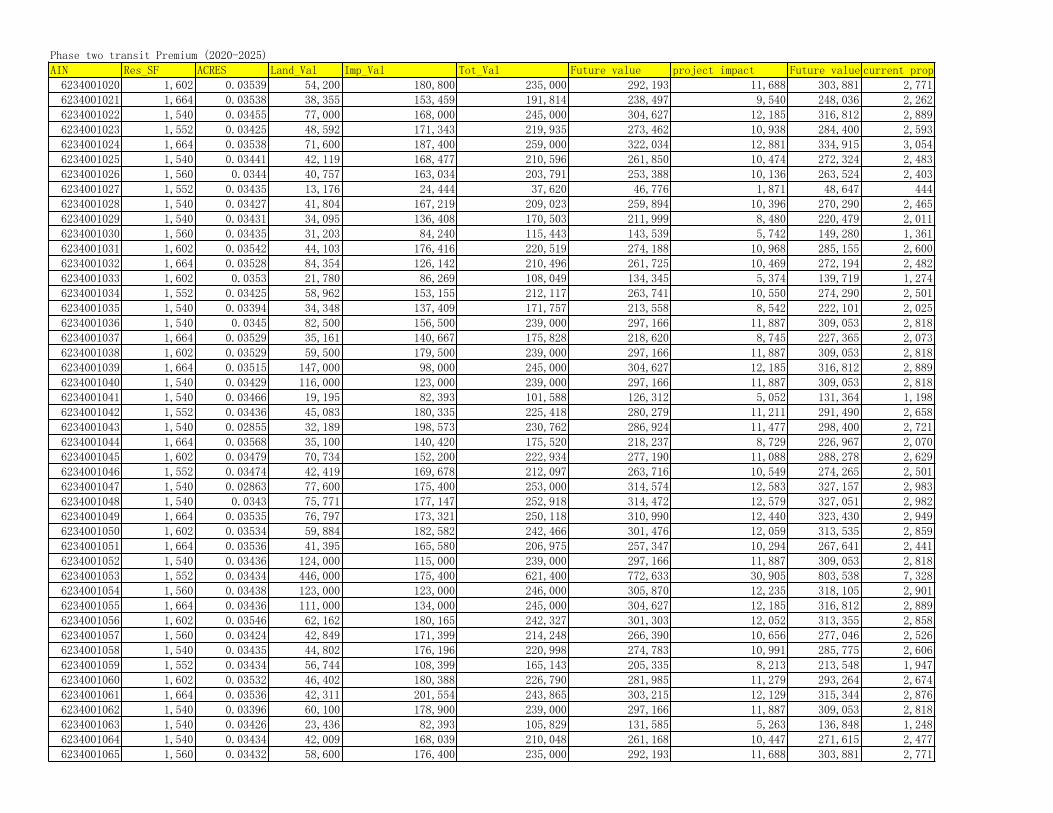
Phase two transit Premium (2020-2025)
AIN Res_SF ACRES Land_Val Imp_Val Tot_Val Future value project impact Future value+project impactcurrent property tax revenue
6234001020 1,602 0.03539 54,200 180,800 235,000 292,193 11,688 303,881 2,771
6234001021 1,664 0.03538 38,355 153,459 191,814 238,497 9,540 248,036 2,262
6234001022 1,540 0.03455 77,000 168,000 245,000 304,627 12,185 316,812 2,889
6234001023 1,552 0.03425 48,592 171,343 219,935 273,462 10,938 284,400 2,593
6234001024 1,664 0.03538 71,600 187,400 259,000 322,034 12,881 334,915 3,054
6234001025 1,540 0.03441 42,119 168,477 210,596 261,850 10,474 272,324 2,483
6234001026 1,560 0.0344 40,757 163,034 203,791 253,388 10,136 263,524 2,403
6234001027 1,552 0.03435 13,176 24,444 37,620 46,776 1,871 48,647 444
6234001028 1,540 0.03427 41,804 167,219 209,023 259,894 10,396 270,290 2,465
6234001029 1,540 0.03431 34,095 136,408 170,503 211,999 8,480 220,479 2,011
6234001030 1,560 0.03435 31,203 84,240 115,443 143,539 5,742 149,280 1,361
6234001031 1,602 0.03542 44,103 176,416 220,519 274,188 10,968 285,155 2,600
6234001032 1,664 0.03528 84,354 126,142 210,496 261,725 10,469 272,194 2,482
6234001033 1,602 0.0353 21,780 86,269 108,049 134,345 5,374 139,719 1,274
6234001034 1,552 0.03425 58,962 153,155 212,117 263,741 10,550 274,290 2,501
6234001035 1,540 0.03394 34,348 137,409 171,757 213,558 8,542 222,101 2,025
6234001036 1,540 0.0345 82,500 156,500 239,000 297,166 11,887 309,053 2,818
6234001037 1,664 0.03529 35,161 140,667 175,828 218,620 8,745 227,365 2,073
6234001038 1,602 0.03529 59,500 179,500 239,000 297,166 11,887 309,053 2,818
6234001039 1,664 0.03515 147,000 98,000 245,000 304,627 12,185 316,812 2,889
6234001040 1,540 0.03429 116,000 123,000 239,000 297,166 11,887 309,053 2,818
6234001041 1,540 0.03466 19,195 82,393 101,588 126,312 5,052 131,364 1,198
6234001042 1,552 0.03436 45,083 180,335 225,418 280,279 11,211 291,490 2,658
6234001043 1,540 0.02855 32,189 198,573 230,762 286,924 11,477 298,400 2,721
6234001044 1,664 0.03568 35,100 140,420 175,520 218,237 8,729 226,967 2,070
6234001045 1,602 0.03479 70,734 152,200 222,934 277,190 11,088 288,278 2,629
6234001046 1,552 0.03474 42,419 169,678 212,097 263,716 10,549 274,265 2,501
6234001047 1,540 0.02863 77,600 175,400 253,000 314,574 12,583 327,157 2,983
6234001048 1,540 0.0343 75,771 177,147 252,918 314,472 12,579 327,051 2,982
6234001049 1,664 0.03535 76,797 173,321 250,118 310,990 12,440 323,430 2,949
6234001050 1,602 0.03534 59,884 182,582 242,466 301,476 12,059 313,535 2,859
6234001051 1,664 0.03536 41,395 165,580 206,975 257,347 10,294 267,641 2,441
6234001052 1,540 0.03436 124,000 115,000 239,000 297,166 11,887 309,053 2,818
6234001053 1,552 0.03434 446,000 175,400 621,400 772,633 30,905 803,538 7,328
6234001054 1,560 0.03438 123,000 123,000 246,000 305,870 12,235 318,105 2,901
6234001055 1,664 0.03436 111,000 134,000 245,000 304,627 12,185 316,812 2,889
6234001056 1,602 0.03546 62,162 180,165 242,327 301,303 12,052 313,355 2,858
6234001057 1,560 0.03424 42,849 171,399 214,248 266,390 10,656 277,046 2,526
6234001058 1,540 0.03435 44,802 176,196 220,998 274,783 10,991 285,775 2,606
6234001059 1,552 0.03434 56,744 108,399 165,143 205,335 8,213 213,548 1,947
6234001060 1,602 0.03532 46,402 180,388 226,790 281,985 11,279 293,264 2,674
6234001061 1,664 0.03536 42,311 201,554 243,865 303,215 12,129 315,344 2,876
6234001062 1,540 0.03396 60,100 178,900 239,000 297,166 11,887 309,053 2,818
6234001063 1,540 0.03426 23,436 82,393 105,829 131,585 5,263 136,848 1,248
6234001064 1,540 0.03434 42,009 168,039 210,048 261,168 10,447 271,615 2,477
6234001065 1,560 0.03432 58,600 176,400 235,000 292,193 11,688 303,881 2,771

6234001066 1,664 0.03535 121,000 124,000 245,000 304,627 12,185 316,812 2,889
6234001067 1,602 0.03535 123,000 116,000 239,000 297,166 11,887 309,053 2,818
6234001068 1,540 0.03438 44,059 176,236 220,295 273,909 10,956 284,866 2,598
6234001069 1,552 0.03435 47,800 191,200 239,000 297,166 11,887 309,053 2,818
6234001070 1,602 0.03515 58,134 149,589 207,723 258,277 10,331 268,609 2,449
6234001071 1,664 0.03556 131,000 114,000 245,000 304,627 12,185 316,812 2,889
6234001072 1,540 0.03436 102,000 137,000 239,000 297,166 11,887 309,053 2,818
6234001073 1,540 0.03434 32,127 82,393 114,520 142,391 5,696 148,087 1,350
6234001074 1,664 0.03523 125,000 120,000 245,000 304,627 12,185 316,812 2,889
6234001075 1,552 0.03435 149,000 97,000 246,000 305,870 12,235 318,105 2,901
6234001076 1,560 0.03446 25,660 84,240 109,900 136,647 5,466 142,113 1,296
6234001077 1,540 0.03435 34,222 136,910 171,132 212,781 8,511 221,292 2,018
6234001078 1,602 0.04126 50,505 150,012 200,517 249,318 9,973 259,290 2,364
6234001079 1,664 0.04051 58,115 128,195 186,310 231,653 9,266 240,919 2,197
6234001080 1,552 0.03955 80,773 133,426 214,199 266,330 10,653 276,983 2,526
6234001081 1,540 0.03929 32,513 130,090 162,603 202,176 8,087 210,263 1,917
6234001082 1,540 0.04139 69,100 175,900 245,000 304,627 12,185 316,812 2,889
6234001083 1,560 0.04139 46,167 92,813 138,980 172,804 6,912 179,716 1,639
6234001084 1,552 0.04046 45,170 180,683 225,853 280,820 11,233 292,053 2,663
6234001085 1,664 0.04225 46,000 184,000 230,000 285,976 11,439 297,415 2,712
6234001086 1,602 0.04061 42,240 127,578 169,818 211,147 8,446 219,593 2,002
6234001087 1,602 0.04225 63,506 152,200 215,706 268,203 10,728 278,931 2,544
6234001088 1,540 0.0404 101,000 144,000 245,000 304,627 12,185 316,812 2,889
6234001089 1,552 0.04139 114,000 132,000 246,000 305,870 12,235 318,105 2,901
6234001090 0 2.75713 9 9 0 0 0 0 0
6234001093 1,540 0.03971 40,740 128,212 168,952 210,071 8,403 218,473 1,992
6234001094 1,540 0.04048 50,459 164,016 214,475 266,673 10,667 277,340 2,529
6234001095 1,664 0.04171 123,000 123,000 246,000 305,870 12,235 318,105 2,901
6234001096 1,560 0.04021 35,379 141,521 176,900 219,953 8,798 228,751 2,086
6234001097 1,602 0.04163 26,621 125,525 152,146 189,174 7,567 196,741 1,794
6234001104 1,602 0.03547 36,869 147,501 184,370 229,241 9,170 238,411 2,174
6234001105 1,540 0.03465 67,870 155,560 223,430 277,807 11,112 288,919 2,635
6234001106 1,560 0.03425 86,500 187,500 274,000 340,685 13,627 354,312 3,231
6234001107 1,540 0.03421 146,000 100,000 246,000 305,870 12,235 318,105 2,901
6234001108 1,540 0.03436 68,100 177,900 246,000 305,870 12,235 318,105 2,901
6234001109 1,602 0.03548 110,000 139,000 249,000 309,600 12,384 321,984 2,936
6234001110 1,560 0.02846 45,405 181,620 227,025 282,277 11,291 293,568 2,677
6234001111 1,540 0.03435 35,349 141,423 176,772 219,794 8,792 228,586 2,084
6234001112 1,664 0.03511 34,121 136,500 170,621 212,146 8,486 220,632 2,012
6234001113 1,560 0.03436 32,891 135,797 168,688 209,742 8,390 218,132 1,989
6234001114 1,602 0.03535 73,676 185,944 259,620 322,805 12,912 335,717 3,061
6234001115 1,540 0.03436 40,583 162,333 202,916 252,301 10,092 262,393 2,393
6234001116 1,540 0.03431 52,647 187,431 240,078 298,507 11,940 310,447 2,831
6234001117 1,602 0.03529 117,000 123,000 240,000 298,410 11,936 310,346 2,830
6234001118 1,540 0.03435 62,601 188,226 250,827 311,872 12,475 324,347 2,958
6234001119 1,664 0.03543 65,900 180,100 246,000 305,870 12,235 318,105 2,901
6234001120 1,560 0.03421 78,000 182,000 260,000 323,277 12,931 336,208 3,066
6234001121 1,540 0.03447 101,000 138,000 239,000 297,166 11,887 309,053 2,818

6234001122 0 0.8721 0 0 0 0 0 0 0
6234001124 1,664 0.04112 40,559 159,793 200,352 249,113 9,965 259,077 2,363
6234001125 1,540 0.0406 23,437 101,229 124,666 155,007 6,200 161,207 1,470
6234001126 1,560 0.04033 151,000 96,000 247,000 307,113 12,285 319,398 2,913
6234003017 2,371 0.21058 102,303 153,459 255,762 318,008 12,720 330,728 3,016
6234003018 1,600 0.13237 38,378 22,976 61,354 76,286 3,051 79,337 723
6234003019 1,651 0.13444 169,396 113,853 283,249 352,185 14,087 366,272 3,340
6234003020 1,651 0.13743 219,800 78,200 298,000 370,526 14,821 385,347 3,514
6234003021 1,736 0.13707 200,000 126,000 326,000 405,340 16,214 421,554 3,844
6234003022 1,544 0.13919 192,579 114,599 307,178 381,937 15,277 397,215 3,622
6234003023 1,637 0.1362 127,604 109,186 236,790 294,419 11,777 306,195 2,792
6234003024 1,283 0.14206 130,090 77,236 207,326 257,784 10,311 268,095 2,445
6234003025 1,283 0.14187 37,977 19,578 57,555 71,562 2,862 74,425 679
6234003026 1,630 0.13345 93,674 137,397 231,071 287,308 11,492 298,800 2,725
6234003027 1,653 0.13529 132,760 161,630 294,390 366,037 14,641 380,678 3,471
6234003028 1,653 0.15203 37,977 25,775 63,752 79,268 3,171 82,438 752
6234003030 4,097 0.13043 43,775 100,311 144,086 179,153 7,166 186,319 1,699
6234004001 1,232 0.08283 124,659 157,968 282,627 351,411 14,056 365,468 3,333
6234004003 2,174 0.13314 136,646 144,652 281,298 349,759 13,990 363,749 3,317
6234004004 2,493 0.13293 138,112 265,424 403,536 501,746 20,070 521,816 4,758
6234004005 1,893 0.12917 158,817 204,926 363,743 452,269 18,091 470,359 4,289
6234004006 1,854 0.13054 69,724 69,724 139,448 173,386 6,935 180,322 1,644
6234004007 1,854 0.1303 35,777 35,777 71,554 88,968 3,559 92,527 844
6234004008 1,625 0.12927 100,178 157,728 257,906 320,674 12,827 333,501 3,041
6234004009 1,540 0.12657 193,347 104,512 297,859 370,350 14,814 385,164 3,512
6234004010 1,880 0.12845 153,694 147,546 301,240 374,554 14,982 389,536 3,552
6234004011 1,852 0.1268 169,998 221,958 391,956 487,348 19,494 506,842 4,622
6234004012 3,312 0.12668 118,144 271,738 389,882 484,769 19,391 504,160 4,597
6234004013 3,312 0.1269 118,144 277,644 395,788 492,113 19,685 511,797 4,667
6234004014 1,966 0.16601 181,627 87,898 269,525 335,120 13,405 348,525 3,178
6234004018 1,232 0.09571 21,595 30,281 51,876 64,501 2,580 67,081 612
6234004019 1,232 0.09925 20,376 28,579 48,955 60,869 2,435 63,304 577
6234008052 39,512 1.563 89,516 1,099,828 1,189,344 1,478,800 59,152 1,537,952 14,025
6234008065 2,880 0.96004 161,376 163,778 325,154 404,288 16,172 420,460 3,834
6234008073 2,799 0.24946 180,763 96,403 277,166 344,621 13,785 358,406 3,268
6245021026 1,648 0.17715 34,771 53,178 87,949 175,474 1,648 177,122 957
6245021027 1,596 0.27309 319,000 144,000 463,000 754,728 1,596 756,324 5,037
6245021028 1,278 0.2008 223,439 75,457 298,896 465,461 1,278 466,739 3,252
6245021037 1,278 0.13561 33,975 39,177 73,152 139,667 1,278 140,945 796
6245021038 1,484 0.11729 135,427 119,058 254,485 464,454 1,484 465,938 2,769
6245021039 1,516 0.1576 223,369 122,955 346,324 583,489 1,516 585,005 3,768
6245021040 1,837 0.20153 162,634 96,463 259,097 442,094 1,837 443,931 2,819
6245022001 2,230 0.2001 159,256 203,203 362,459 703,330 2,230 705,560 3,943
6245022002 1,598 0.16304 33,975 82,638 116,613 247,744 1,598 249,342 1,269
6245022003 1,568 0.1189 142,387 134,896 277,283 512,493 1,568 514,061 3,017
6245022004 1,369 0.13602 33,975 48,160 82,135 162,005 1,369 163,374 894
6245022005 1,702 0.12759 171,540 84,419 255,959 423,217 1,702 424,919 2,785

6245022006 1,216 0.1237 33,975 37,777 71,752 136,186 1,216 137,402 781
6245022010 1,618 0.12083 33,975 44,379 78,354 152,603 1,618 154,221 852
6245022011 1,222 0.12025 33,975 37,777 71,752 136,186 1,222 137,408 781
6245022012 1,278 0.12246 250,000 151,000 401,000 686,343 1,278 687,621 4,362
6245022013 1,203 0.13206 108,607 106,377 214,984 399,572 1,203 400,775 2,339
6245022014 1,641 0.11509 189,054 134,407 323,461 569,301 1,641 570,942 3,519
6245022015 1,934 0.15722 112,414 157,800 270,214 532,182 1,934 534,116 2,940
6245022016 2,296 0.20372 36,371 62,173 98,544 199,831 2,296 202,127 1,072
6245022017 1,598 0.20033 245,566 113,434 359,000 587,412 1,598 589,010 3,906
6245022018 1,222 0.15734 142,286 81,302 223,588 379,092 1,222 380,314 2,432
6245022019 1,216 0.11904 155,005 87,619 242,624 410,616 1,216 411,832 2,640
6245022020 1,600 0.13487 54,632 67,831 122,463 236,607 1,600 238,207 1,332
6245022021 1,461 0.12738 109,086 118,038 227,124 429,166 1,461 430,627 2,471
6245022022 1,222 0.12265 76,791 59,937 136,728 244,528 1,222 245,750 1,487
6245022023 1,278 0.12426 33,975 40,572 74,547 143,136 1,278 144,414 811
6245022024 1,595 0.12282 48,505 55,999 104,504 199,565 1,595 201,160 1,137
6245022025 1,222 0.12506 317,000 80,000 397,000 593,090 1,222 594,312 4,319
6245022026 1,278 0.12315 124,125 97,294 221,419 396,280 1,278 397,558 2,409
6245022027 1,404 0.12164 121,997 108,183 230,180 420,712 1,404 422,116 2,504
6245022028 1,216 0.12468 80,415 109,880 190,295 373,230 1,216 374,446 2,070
6245022029 1,650 0.13508 254,600 190,400 445,000 790,040 1,650 791,690 4,841
6245022030 1,567 0.11906 192,118 151,133 343,251 614,704 1,567 616,271 3,734
6245022031 1,774 0.16352 167,659 126,728 294,387 523,604 1,774 525,378 3,203
6245022032 1,278 0.20481 270,268 132,103 402,371 664,551 1,278 665,829 4,377
6245023001 1,631 0.20611 316,000 174,000 490,000 825,601 1,631 827,232 5,331
6245023002 1,890 0.15506 33,975 59,280 93,255 189,658 1,890 191,548 1,015
6245023003 1,531 0.11874 110,835 131,672 242,507 465,245 1,531 466,776 2,638
6245023004 1,222 0.13283 33,975 39,577 73,552 140,662 1,222 141,884 800
6245023005 1,278 0.12671 72,433 78,461 150,894 285,174 1,278 286,452 1,642
6245023006 1,516 0.12715 194,579 146,964 341,543 607,397 1,516 608,913 3,716
6245023007 1,276 0.12631 33,975 46,780 80,755 158,574 1,276 159,850 879
6245023008 1,679 0.12531 238,914 116,370 355,284 586,442 1,679 588,121 3,865
6245023009 1,911 0.12887 38,620 89,336 127,956 270,175 1,911 272,086 1,392
6245023010 1,388 0.12931 78,613 121,404 200,017 399,647 1,388 401,035 2,176
6245023011 1,537 0.12907 203,620 87,696 291,316 471,254 1,537 472,791 3,169
6245023012 1,216 0.12921 117,707 94,855 212,562 382,234 1,216 383,450 2,312
6245023013 1,278 0.13411 186,895 84,893 271,788 443,488 1,278 444,766 2,957
6245023014 1,216 0.12075 169,140 71,266 240,406 387,525 1,216 388,741 2,615
6245023015 1,788 0.15773 218,678 128,924 347,602 592,500 1,788 594,288 3,782
6245023016 1,898 0.2126 265,667 165,031 430,698 740,714 1,898 742,612 4,686
6245023017 1,222 0.20911 230,240 136,416 366,656 625,507 1,222 626,729 3,989
6245023018 1,503 0.16408 292,000 143,000 435,000 718,670 1,503 720,173 4,732
6245023019 1,589 0.11487 253,200 156,800 410,000 704,745 1,589 706,334 4,460
6245023020 1,222 0.13311 136,075 95,196 231,271 405,921 1,222 407,143 2,516
6245023021 1,385 0.12619 256,473 160,530 417,003 718,090 1,385 719,475 4,537
6245023022 1,216 0.12621 33,975 47,974 81,949 161,543 1,216 162,759 892
6245023023 1,342 0.12622 337,000 84,000 421,000 627,904 1,342 629,246 4,580
6245023024 1,222 0.1252 188,234 75,677 263,911 422,235 1,222 423,457 2,871

6245023025 1,656 0.1253 252,927 156,684 409,611 704,117 1,656 705,773 4,456
6245023026 1,635 0.12621 33,975 60,143 94,118 191,804 1,635 193,439 1,024
6245023027 1,278 0.12624 215,697 111,670 327,367 545,887 1,278 547,165 3,561
6245023028 1,222 0.12619 79,869 68,639 148,508 269,995 1,222 271,217 1,616
6245023029 1,278 0.1321 134,019 107,187 241,206 433,183 1,278 434,461 2,624
6245023030 1,216 0.11475 211,741 86,117 297,858 477,425 1,216 478,641 3,240
6245023031 1,753 0.16414 179,705 121,442 301,147 525,436 1,753 527,189 3,276
6245023032 2,403 0.20909 129,820 201,430 331,250 662,321 2,403 664,724 3,604
6245025001 1,544 0.13397 205,248 124,845 330,093 565,658 1,544 567,202 3,591
6245025002 1,751 0.13326 211,905 130,241 342,146 587,354 1,751 589,105 3,722
6245025003 1,203 0.13202 34,378 37,777 72,155 136,687 1,203 137,890 785
6245025004 1,278 0.13123 167,659 78,174 245,833 402,862 1,278 404,140 2,674
6245025005 1,222 0.13202 219,257 58,369 277,626 417,768 1,222 418,990 3,020
6245025006 1,216 0.13171 175,156 112,469 287,625 497,467 1,216 498,683 3,129
6245025007 1,276 0.1318 242,000 161,000 403,000 701,263 1,276 702,539 4,384
6245025008 1,278 0.13191 162,005 103,493 265,498 458,794 1,278 460,072 2,888
6245025009 1,438 0.13157 526,180 185,571 711,751 1,115,707 1,438 1,117,145 7,743
6245025010 1,664 0.13216 208,409 129,718 338,127 581,706 1,664 583,370 3,678
6245025011 1,664 0.13158 82,024 116,954 198,978 392,822 1,664 394,486 2,165
6245025012 1,410 0.13173 226,392 152,682 379,074 661,172 1,410 662,582 4,124
6245025013 1,216 0.13156 218,569 118,144 336,713 565,558 1,216 566,774 3,663
6245025014 1,278 0.13223 79,624 1,178,440 1,258,064 3,029,486 1,278 3,030,764 13,686
6245025015 1,600 0.13143 255,244 165,950 421,194 730,040 1,600 731,640 4,582
6245025016 1,278 0.13201 125,376 94,027 219,403 389,711 1,278 390,989 2,387
6245028001 1,766 0.21078 376,000 94,000 470,000 701,263 1,766 703,029 5,113
6245028002 1,222 0.18208 74,839 145,287 220,126 454,345 1,222 455,567 2,395
6245028003 1,216 0.12974 33,975 38,176 72,151 137,178 1,216 138,394 785
6245028004 1,523 0.14017 343,000 86,000 429,000 640,338 1,523 641,861 4,667
6245028005 1,222 0.13233 79,014 63,028 142,042 254,979 1,222 256,201 1,545
6245028006 1,203 0.13167 329,000 82,000 411,000 612,984 1,203 614,187 4,471
6245028007 1,222 0.13203 196,588 114,818 311,406 529,956 1,222 531,178 3,388
6245028008 2,252 0.1314 34,378 168,157 202,535 460,909 2,252 463,161 2,203
6245028009 1,572 0.12784 36,249 68,125 104,374 214,481 1,572 216,053 1,135
6245028010 1,399 0.12575 33,975 55,288 89,263 179,731 1,399 181,130 971
6245028011 1,222 0.12468 248,294 104,454 352,748 568,473 1,222 569,695 3,838
6245028012 1,216 0.12569 164,584 98,453 263,037 449,467 1,216 450,683 2,862
6245028013 1,222 0.12468 67,421 101,056 168,477 335,130 1,222 336,352 1,833
6245028014 1,209 0.12509 70,653 101,517 172,170 340,295 1,209 341,504 1,873
6245029001 1,216 0.12506 126,296 102,715 229,011 412,460 1,216 413,676 2,491
6245035011 24 1.83601 161,184 2,372 163,556 206,311 24 206,335 1,779
6245035017 2,048 0.14494 12,148 31,851 43,999 94,310 2,048 96,358 479
56,210,758 84,078,301 1,595,277 85,673,578 638,111

future property tax revenueTax increment CITY
3,583 812 South Gate
2,925 663 South Gate
3,736 847 South Gate
3,354 760 South Gate
3,949 895 South Gate
3,211 728 South Gate
3,107 704 South Gate
574 130 South Gate
3,187 722 South Gate
2,600 589 South Gate
1,760 399 South Gate
3,363 762 South Gate
3,210 728 South Gate
1,648 373 South Gate
3,234 733 South Gate
2,619 594 South Gate
3,644 826 South Gate
2,681 608 South Gate
3,644 826 South Gate
3,736 847 South Gate
3,644 826 South Gate
1,549 351 South Gate
3,437 779 South Gate
3,519 798 South Gate
2,676 607 South Gate
3,399 771 South Gate
3,234 733 South Gate
3,858 874 South Gate
3,857 874 South Gate
3,814 864 South Gate
3,697 838 South Gate
3,156 715 South Gate
3,644 826 South Gate
9,475 2,148 South Gate
3,751 850 South Gate
3,736 847 South Gate
3,695 838 South Gate
3,267 741 South Gate
3,370 764 South Gate
2,518 571 South Gate
3,458 784 South Gate
3,719 843 South Gate
3,644 826 South Gate
1,614 366 South Gate
3,203 726 South Gate
3,583 812 South Gate

3,736 847 South Gate
3,644 826 South Gate
3,359 761 South Gate
3,644 826 South Gate
3,167 718 South Gate
3,736 847 South Gate
3,644 826 South Gate
1,746 396 South Gate
3,736 847 South Gate
3,751 850 South Gate
1,676 380 South Gate
2,609 591 South Gate
3,058 693 South Gate
2,841 644 South Gate
3,266 740 South Gate
2,479 562 South Gate
3,736 847 South Gate
2,119 480 South Gate
3,444 781 South Gate
3,507 795 South Gate
2,589 587 South Gate
3,289 746 South Gate
3,736 847 South Gate
3,751 850 South Gate
0 0 South Gate
2,576 584 South Gate
3,270 741 South Gate
3,751 850 South Gate
2,697 611 South Gate
2,320 526 South Gate
2,811 637 South Gate
3,407 772 South Gate
4,178 947 South Gate
3,751 850 South Gate
3,751 850 South Gate
3,797 861 South Gate
3,462 785 South Gate
2,695 611 South Gate
2,602 590 South Gate
2,572 583 South Gate
3,959 897 South Gate
3,094 701 South Gate
3,661 830 South Gate
3,660 830 South Gate
3,825 867 South Gate
3,751 850 South Gate
3,965 899 South Gate
3,644 826 South Gate

0 0 South Gate
3,055 692 South Gate
1,901 431 South Gate
3,766 854 South Gate
3,900 884 South Gate
936 212 South Gate
4,319 979 South Gate
4,544 1,030 South Gate
4,971 1,127 South Gate
4,684 1,062 South Gate
3,611 818 South Gate
3,161 717 South Gate
878 199 South Gate
3,523 799 South Gate
4,489 1,018 South Gate
972 220 South Gate
2,197 498 South Gate
4,310 977 South Gate
4,289 972 South Gate
6,153 1,395 South Gate
5,546 1,257 South Gate
2,126 482 South Gate
1,091 247 South Gate
3,933 891 South Gate
4,542 1,030 South Gate
4,593 1,041 South Gate
5,977 1,355 South Gate
5,945 1,348 South Gate
6,035 1,368 South Gate
4,110 932 South Gate
791 179 South Gate
746 169 South Gate
18,136 4,111 South Gate
4,958 1,124 South Gate
4,226 958 South Gate
100,679
1,927 970 Downey
8,228 3,191 Downey
5,078 1,826 Downey
1,533 738 Downey
5,069 2,300 Downey
6,364 2,597 Downey
4,830 2,011 Downey
7,676 3,733 Downey
2,713 1,444 Downey
5,592 2,576 Downey
1,777 884 Downey
4,623 1,838 Downey

1,495 714 Downey
1,678 825 Downey
1,495 714 Downey
7,481 3,118 Downey
4,360 2,021 Downey
6,211 2,692 Downey
5,811 2,871 Downey
2,199 1,127 Downey
6,408 2,502 Downey
4,137 1,705 Downey
4,480 1,841 Downey
2,591 1,259 Downey
4,685 2,214 Downey
2,674 1,186 Downey
1,571 760 Downey
2,188 1,052 Downey
6,466 2,147 Downey
4,325 1,916 Downey
4,592 2,088 Downey
4,074 2,003 Downey
8,613 3,772 Downey
6,704 2,970 Downey
5,716 2,513 Downey
7,244 2,866 Downey
8,999 3,669 Downey
2,084 1,069 Downey
5,078 2,440 Downey
1,544 743 Downey
3,116 1,475 Downey
6,624 2,909 Downey
1,739 860 Downey
6,398 2,533 Downey
2,960 1,568 Downey
4,363 2,187 Downey
5,143 1,974 Downey
4,172 1,859 Downey
4,839 1,882 Downey
4,229 1,614 Downey
6,465 2,684 Downey
8,079 3,393 Downey
6,818 2,829 Downey
7,835 3,102 Downey
7,684 3,224 Downey
4,429 1,913 Downey
7,827 3,291 Downey
1,771 879 Downey
6,846 2,266 Downey
4,607 1,736 Downey

7,678 3,222 Downey
2,104 1,081 Downey
5,953 2,391 Downey
2,951 1,335 Downey
4,727 2,102 Downey
5,207 1,967 Downey
5,735 2,459 Downey
7,232 3,628 Downey
6,171 2,580 Downey
6,409 2,687 Downey
1,500 715 Downey
4,397 1,722 Downey
4,558 1,538 Downey
5,425 2,296 Downey
7,643 3,259 Downey
5,005 2,117 Downey
12,153 4,410 Downey
6,346 2,668 Downey
4,292 2,127 Downey
7,208 3,084 Downey
6,166 2,503 Downey
32,972 19,285 Downey
7,960 3,377 Downey
4,254 1,867 Downey
7,648 2,535 Downey
4,956 2,561 Downey
1,506 721 Downey
6,983 2,316 Downey
2,787 1,242 Downey
6,682 2,210 Downey
5,779 2,391 Downey
5,039 2,835 Downey
2,350 1,215 Downey
1,971 999 Downey
6,198 2,360 Downey
4,903 2,041 Downey
3,659 1,826 Downey
3,715 1,842 Downey
4,500 2,009 Downey
2,245 465 Downey
1,048 570 Downey
966,432 227,642
Total 328,321
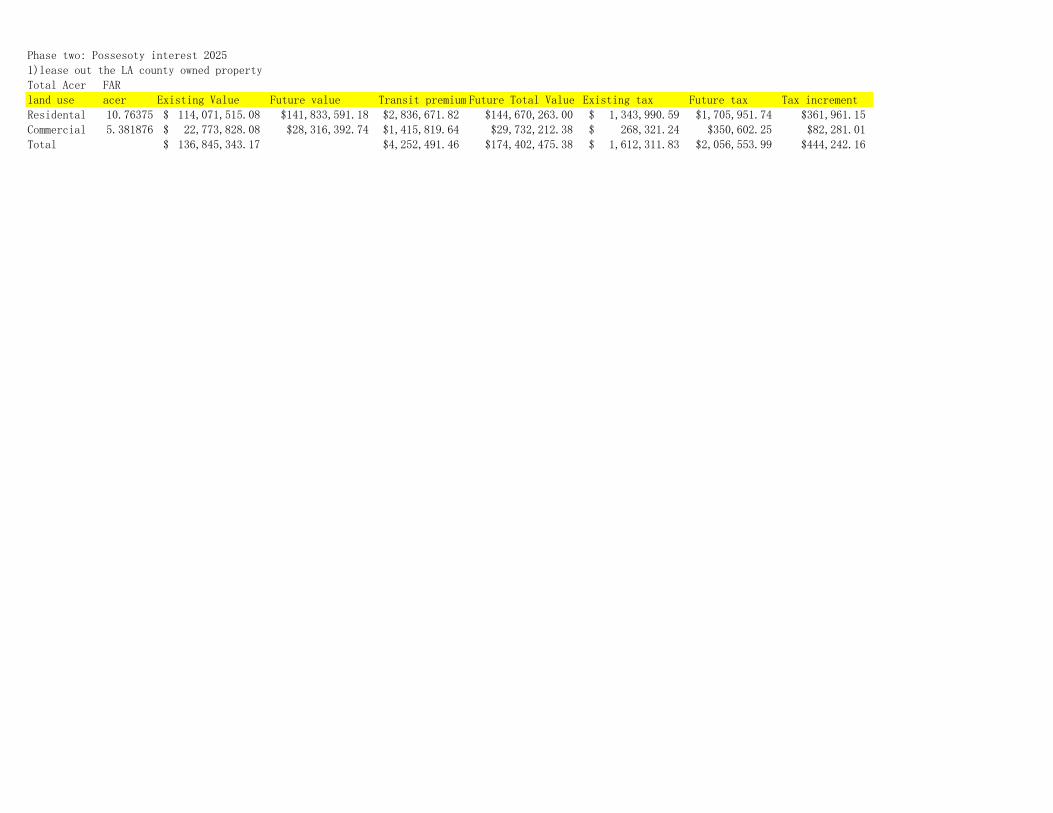
Phase two: Possesoty interest 2025
1)lease out the LA county owned property
Total Acer FAR
land use acer Existing Value Future value Transit premium Future Total Value Existing tax Future tax Tax increment
Residental 10.76375 114,071,515.08$ $141,833,591.18 $2,836,671.82 $144,670,263.00 1,343,990.59$ $1,705,951.74 $361,961.15
Commercial 5.381876 22,773,828.08$ $28,316,392.74 $1,415,819.64 $29,732,212.38 268,321.24$ $350,602.25 $82,281.01
Total 136,845,343.17$ $4,252,491.46 $174,402,475.38 1,612,311.83$ $2,056,553.99 $444,242.16

Imperial ‐ SubArea 3Inputs Market Land Value Office / Acre 720,062
Maximum FAR ‐ Office 3 Construction Cost ‐ $ / Sqft 197
Current Year 2,014 Opening Year 2025Market Appreciation 2%Office / RD ‐ Transit Impact 9%Property Tax 1.1792%Developer Fee 10.0000%
FID OBJECTID_1 AIN Property Typ Res_Units Buidling_SF Land_Val Imp_Val Tot_Val Conversion LU
3898 3899 6234009024 0 17947 904086 538433 14425193899 3900 6234005010 0 18332 1446137 1234964 26811013902 3903 6234007008 1 5280 325376 56636 3820123911 3912 6234007038 0 8152 54777 50376 1051533923 3924 6234007014 1 800 320000 50000 3700003930 3931 6234006004 0 6400 45976 31571 775473936 3937 6234007025 0 7875 655759 507119 11628783966 3967 6234009039 0 0 57809 0 578093973 3974 6234008070 0 13049 347964 432668 7806323992 3993 6234009018 0 24000 904800 904800 18096003995 3996 6234008068 Vacant N/A N/A 4190 0 4190 Office / RD4010 4011 6234007023 Vacant N/A N/A 293282 0 293282 Office / RD4028 4029 6234007042 0 6600 400811 313416 7142274034 4035 6234007036 0 22082 747168 216916 9640844040 4041 6234009031 0 21355 165376 439671 6050474058 4059 6234009034 0 9600 649854 264134 9139884070 4071 6234007041 0 36460 414251 364534 7787854073 4074 6234008055 0 10720 522360 401816 9241764080 4081 6234007037 0 11739 553501 558524 11120254087 4088 6234006005 0 5349 70977 66176 1371534095 4096 6234007022 0 2056 24978 56921 818994099 4100 6234008032 0 5472 128780 66866 1956464105 4106 6234008062 0 4715 622814 100454 7232684114 4115 6234009035 0 23800 1024630 717241 17418714115 4116 6234008051 0 3000 387197 227399 6145964123 4124 6234008007 0 9670 118078 185561 3036394142 4143 6234009026 0 28040 902733 509812 14125454143 4144 6234008076 0 12720 80981 131891 2128724147 4148 6234007043 0 25192 804306 743777 15480834152 4153 6234007040 Vacant N/A N/A 49696 0 49696 Office / RD4153 4154 6234008067 0 18412 489762 405743 8955054159 4160 6234008066 0 10065 904667 173972 10786394163 4164 6234008033 0 6000 161456 181257 3427134173 4174 6234007049 0 38192 2254187 1567685 38218724175 4176 6234007034 0 7500 495200 304800 8000004205 4206 6234008048 0 53358 795960 341124 11370844218 4219 6234006006 0 4905 309438 141399 4508374233 4234 6234009029 0 12000 1071504 278590 13500944242 4243 6234006009 0 8292 502270 80363 5826334970 4971 6234007021 0 2036 131543 57966 1895095012 5013 6234007048 0 56200 1916041 1615644 35316855033 5034 6234008026 0 720 23579 176 23755

Tax Increment $382,848.06
New Building SF Future Land Value Construction Cost Inflated Total Value Transit Impact Future Value Current Property Tax
RevenueFuture Property Tax
Revenue Tax Increment
$1,793,591.06 $161,423.20 $1,955,014.26 $17,010.18 $23,053.53 $6,043.34$3,333,612.10 $300,025.09 $3,633,637.19 $31,615.54 $42,847.85 $11,232.31$474,983.91 $42,748.55 $517,732.46 $4,504.69 $6,105.10 $1,600.42$130,744.54 $11,767.01 $142,511.55 $1,239.96 $1,680.50 $440.53$460,048.49 $41,404.36 $501,452.86 $4,363.04 $5,913.13 $1,550.09$96,419.95 $8,677.80 $105,097.74 $914.43 $1,239.31 $324.88
$1,445,892.63 $130,130.34 $1,576,022.97 $13,712.66 $18,584.46 $4,871.81$71,878.23 $6,469.04 $78,347.27 $681.68 $923.87 $242.19
$970,617.77 $87,355.60 $1,057,973.37 $9,205.21 $12,475.62 $3,270.41$2,250,010.15 $202,500.91 $2,452,511.06 $21,338.80 $28,920.01 $7,581.21
7,322.00 $40,345.05 $1,442,434.08 $1,843,649.48 $165,928.45 $2,009,577.93 $49.41 $23,696.94 $23,647.5344,835.00 $293,282.00 $8,832,495.24 $11,346,756.96 $1,021,208.13 $12,367,965.09 $3,458.38 $145,843.04 $142,384.66
$888,051.50 $79,924.64 $967,976.14 $8,422.16 $11,414.37 $2,992.21$1,198,717.28 $107,884.55 $1,306,601.83 $11,368.48 $15,407.45 $4,038.97$752,299.90 $67,706.99 $820,006.89 $7,134.71 $9,669.52 $2,534.81
$1,136,429.20 $102,278.63 $1,238,707.83 $10,777.75 $14,606.84 $3,829.10$968,321.26 $87,148.91 $1,055,470.17 $9,183.43 $12,446.10 $3,262.67
$1,149,096.69 $103,418.70 $1,252,515.40 $10,897.88 $14,769.66 $3,871.78$1,382,663.32 $124,439.70 $1,507,103.01 $13,113.00 $17,771.76 $4,658.76$170,532.52 $15,347.93 $185,880.44 $1,617.31 $2,191.90 $574.59$101,831.11 $9,164.80 $110,995.91 $965.75 $1,308.86 $343.11$243,261.21 $21,893.51 $265,154.72 $2,307.06 $3,126.70 $819.65$899,292.85 $80,936.36 $980,229.21 $8,528.78 $11,558.86 $3,030.09
$2,165,797.65 $194,921.79 $2,360,719.44 $20,540.14 $27,837.60 $7,297.46$764,172.88 $68,775.56 $832,948.44 $7,247.32 $9,822.13 $2,574.81$377,536.93 $33,978.32 $411,515.26 $3,580.51 $4,852.59 $1,272.08
$1,756,322.16 $158,068.99 $1,914,391.16 $16,656.73 $22,574.50 $5,917.77$264,679.58 $23,821.16 $288,500.74 $2,510.19 $3,402.00 $891.81
$1,924,846.63 $173,236.20 $2,098,082.83 $18,254.99 $24,740.59 $6,485.6020,498.46 112,948.87 $4,038,197.57 $5,161,428.83 $464,528.59 $5,625,957.43 $586.02 $66,341.29 $65,755.27
$1,113,447.91 $100,210.31 $1,213,658.22 $10,559.79 $14,311.46 $3,751.66$1,341,152.02 $120,703.68 $1,461,855.70 $12,719.31 $17,238.20 $4,518.89$426,120.54 $38,350.85 $464,471.39 $4,041.27 $5,477.05 $1,435.77
$4,752,017.45 $427,681.57 $5,179,699.03 $45,067.51 $61,079.01 $16,011.50$994,699.45 $89,522.95 $1,084,222.40 $9,433.60 $12,785.15 $3,351.55
$1,413,821.03 $127,243.89 $1,541,064.92 $13,408.49 $18,172.24 $4,763.74$560,559.14 $50,450.32 $611,009.47 $5,316.27 $7,205.02 $1,888.75
$1,678,672.19 $151,080.50 $1,829,752.69 $15,920.31 $21,576.44 $5,656.14$724,430.90 $65,198.78 $789,629.68 $6,870.41 $9,311.31 $2,440.90$235,630.62 $21,206.76 $256,837.38 $2,234.69 $3,028.63 $793.94
$4,391,206.39 $395,208.58 $4,786,414.97 $41,645.63 $56,441.41 $14,795.78$29,536.36 $2,658.27 $32,194.63 $280.12 $379.64 $99.52

Developer Fee $2,000,350
Developer Fee ACRES0.902981.30774
0.4090.347490.215060.251470.408370.372650.798350.99067
$200,957.79 0.05603$1,236,796.51 0.34309
0.363221.155940.933480.741821.173950.483370.509540.4457
0.185881.2464
0.727111.124150.480440.326441.374970.5938
1.77002$562,595.74 0.15686
0.962611.146110.611612.324080.366681.245880.348620.695390.2341
0.097193.091960.11034

Imperial Industrial District ‐ Sub Area 2 Inputs Market Land Value MF / Acre 809,413
Maximum FAR ‐ MF 3
Construction Cost ‐ MF / DU 191,000
Number of Units / Acre 41
Current Year 2014Opening Year 2025Market Appreciation 2%Multi‐Family Residential ‐ Transit Impact 4%Retail and Commercial ‐ Transit Impact 1%Property Tax 1.1792%
FID OBJECTID_1 OBJECTID AIN Property TypRes_Units Buidling_SF
3533 3534 1008309 6245016927 N/A N/A3899 3900 1002266 6234005010 0 183323928 3929 1002269 6234004020 1 17763930 3931 1002337 6234006004 0 64003944 3945 1002282 6234004021 0 64003953 3954 1002361 6234004040 Vacant 0 03967 3968 1002693 6234005014 1 902384037 4038 1002313 6234004022 1 32004087 4088 1002367 6234006005 0 53494090 4091 1002501 6234006008 0 334184199 4200 1002442 6234006007 0 04218 4219 1002383 6234006006 0 49054242 4243 1002304 6234006009 0 82925030 5031 1002437 6234004036 0 49005058 5059 0 6234005901 Vacant 0 0

Land_Val Imp_Val Tot_Val Conversion LU Units Future Land Value Construction Cost Inflated Total Value
0 0 0 $0.001446137 1234964 2681101 $3,333,612.10187986 118927 306913 $381,607.7445976 31571 77547 $96,419.95188063 196840 384903 $478,578.50
0 0 0 $0.002664040 1024630 3688670 $4,586,397.5197791 115342 213133 MF 7.00 $143,144.73 $1,384,912.35 $2,352,373.6670977 66176 137153 MF 18.00 $360,755.47 $3,490,276.70 $5,928,487.09271972 777075 1049047 MF 109.00 $2,155,588.79 $20,855,127.65 $35,423,940.76201977 3469 205446 $255,446.28309438 141399 450837 $560,559.14502270 80363 582633 $724,430.9028607 61549 90156 $112,097.65
0 0 0 $0.00

Total Increment Developer Fee
$548,749.80 $2,573,032
Transit Impact Future Value Current Property Tax
RevenueFuture Property Tax
Revenue Tax Increment Yr_Blt
ACRES$0.00 $0.00 $0.00 $0.00 $0.00 0 0.31045
$133,344.48 $3,466,956.59 $31,615.54 $40,882.35 $9,266.81 0 1.30774$15,264.31 $396,872.05 $3,619.12 $4,679.92 $1,060.80 0 0.40074$3,856.80 $100,276.75 $914.43 $1,182.46 $268.03 0 0.25147$19,143.14 $497,721.64 $4,538.78 $5,869.13 $1,330.36 0 0.36238
$0.00 $0.00 $0.00 $0.00 $0.00 0 1.10215$183,455.90 $4,769,853.41 $43,496.80 $56,246.11 $12,749.31 0 4.40661$94,094.95 $2,446,468.61 $2,513.26 $28,848.76 $26,335.49 0 0.17685$237,139.48 $6,165,626.57 $1,617.31 $72,705.07 $71,087.76 0 0.4457
$1,416,957.63 $36,840,898.39 $12,370.36 $434,427.87 $422,057.51 0 2.66315$10,217.85 $265,664.13 $2,422.62 $3,132.71 $710.09 0 1.61124$22,422.37 $582,981.51 $5,316.27 $6,874.52 $1,558.25 0 0.34862$28,977.24 $753,408.14 $6,870.41 $8,884.19 $2,013.78 0 0.2341$4,483.91 $116,581.56 $1,063.12 $1,374.73 $311.61 0 0.23066
$0.00 $0.00 $0.00 $0.00 $0.00 0 2.45097
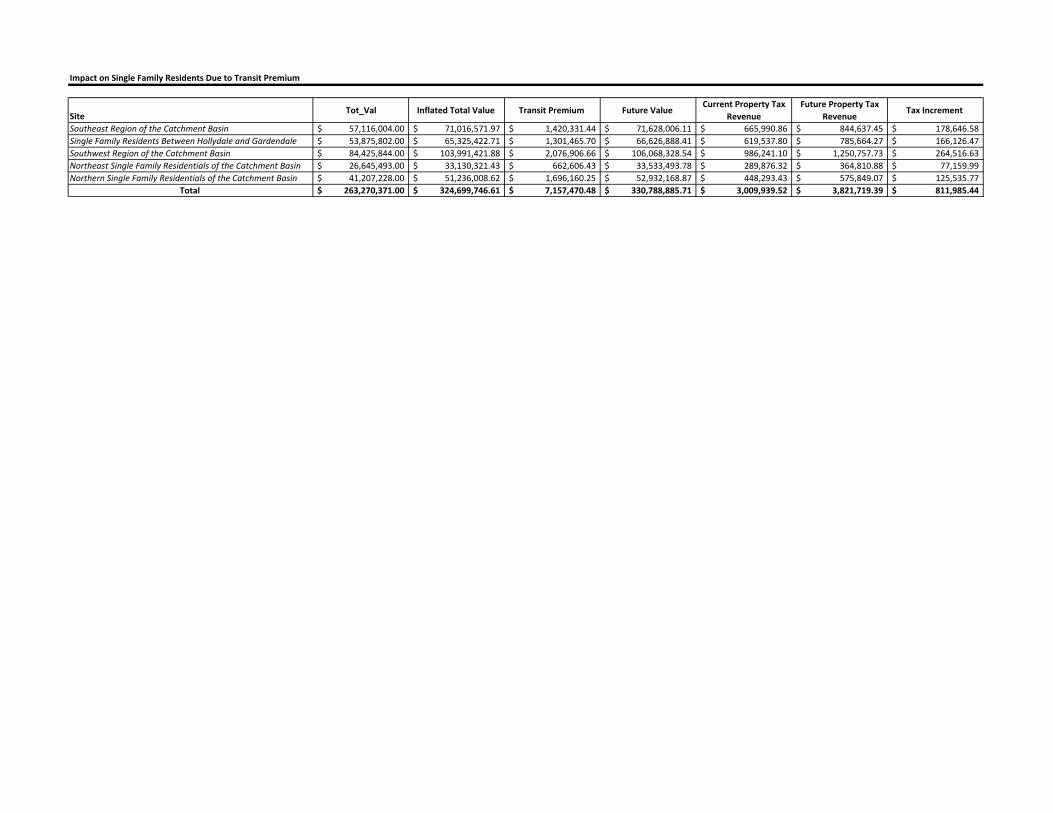
Impact on Single Family Residents Due to Transit Premium
Site Tot_Val Inflated Total Value Transit Premium Future Value
Current Property Tax Revenue
Future Property Tax Revenue
Tax Increment
Southeast Region of the Catchment Basin 57,116,004.00$ 71,016,571.97$ 1,420,331.44$ 71,628,006.11$ 665,990.86$ 844,637.45$ 178,646.58$ Single Family Residents Between Hollydale and Gardendale 53,875,802.00$ 65,325,422.71$ 1,301,465.70$ 66,626,888.41$ 619,537.80$ 785,664.27$ 166,126.47$ Southwest Region of the Catchment Basin 84,425,844.00$ 103,991,421.88$ 2,076,906.66$ 106,068,328.54$ 986,241.10$ 1,250,757.73$ 264,516.63$ Northeast Single Family Residentials of the Catchment Basin 26,645,493.00$ 33,130,321.43$ 662,606.43$ 33,533,493.78$ 289,876.32$ 364,810.88$ 77,159.99$ Northern Single Family Residentials of the Catchment Basin 41,207,228.00$ 51,236,008.62$ 1,696,160.25$ 52,932,168.87$ 448,293.43$ 575,849.07$ 125,535.77$
Total 263,270,371.00$ 324,699,746.61$ 7,157,470.48$ 330,788,885.71$ 3,009,939.52$ 3,821,719.39$ 811,985.44$

Appendix D: Assumptions for VLF Backfill
Variable Assumed Value Comments and/or Reference City of South Gate Total Assessed Value $4,559,456,000 (City of South Gate, 2012, p. 132) City of South Gate Vehicle In-Lieu $7,807,982 (City of South Gate, 2014, p. 30) Site Total Assessed Value $243,894,229 – City of South Gate
$31,546,954 – City of Downey $14,621,671 – County of LA
(County of Los Angeles Office of the Assessor, 2014)
VLF Backfill Allocated to Site Proportional Analysis based on the following formula:
𝑉𝐿𝐹 𝐵𝑎𝑐𝑘𝑓𝑖𝑙𝑙 =𝑆𝑖𝑡𝑒 𝑇𝑜𝑡𝑎𝑙 𝐴𝑠𝑠𝑒𝑠𝑠𝑒𝑑 𝑉𝑎𝑙𝑢𝑒𝐶𝑖𝑡𝑦′𝑠 𝑇𝑜𝑡𝑎𝑙 𝐴𝑠𝑠𝑒𝑠𝑠𝑒𝑑 𝑉𝑎𝑙𝑢𝑒 × 𝑉𝐿𝐹 𝐼𝑛 𝐼𝑖𝑒𝑢
City of Downey Total Assessed Value $8,820,354,264 (City of Downey, 2012). City of Downey VLF in-Lieu $15,104,690 VLF In-Lieu was not provided to public. Therefore, proportional
Analysis based on the following formula:
𝑉𝐿𝐹 𝐵𝑎𝑐𝑘𝑓𝑖𝑙𝑙 =𝐶𝑖𝑡𝑦 𝑜𝑓 𝐷𝑜𝑤𝑛𝑒𝑦 𝑇𝑜𝑡𝑎𝑙 𝐴𝑠𝑠𝑒𝑠𝑠𝑒𝑑 𝑉𝑎𝑙𝑢𝑒
𝐶𝑖𝑡𝑦 𝑜𝑓 𝑆𝑜𝑢𝑡ℎ 𝐺𝑎𝑡𝑒 𝑇𝑜𝑡𝑎𝑙 𝐴𝑠𝑠𝑒𝑠𝑠𝑒𝑑 𝑣𝐴𝑙𝑢𝑒
× 𝑉𝐿𝐹 𝐼𝑛 𝐼𝑖𝑒𝑢 𝑜𝑓 𝑆𝑜𝑢𝑡ℎ 𝐺𝑎𝑡𝑒
County of Los Angeles Total Assessed Value $333,185,983 (County of Los Angeles, 2014, p. 20) County of Los Angeles VLF In-Lieu $4,503,261 (County of Los Angeles, 2014, p. 239) City’s Assessed Value Increase (per annum) 2% per annum (Community Design + Architecture, 2013, p. 44) Real market
appreciation was assumed to be 1.9% per annum. For simplification purposes, 2% per annum was used.
Reference
City of Downey. (2012, June 30). Comprehensive Annual Financial Report. City of Downey. Retrieved on 30 November 2014 from
http://www.downeyca.org/_blobcache/0000/0005/5316.pdf. City of South Gate. (2012, June 30). Comprehensive Annual Financial Report. Retrieved on 30 November 2014 from
http://gfoa.net/cafr/COA2012/SouthGateCA.pdf. p. 132.

City of South Gate. (2014, June 10). South Gate City Council Regular Meeting Agenda, Revenue Detail. Retrieved on 30 November 2014 from
http://www.cityofsouthgate.org/2014-06-10%20Regular%20City%20Council.PDF. p. 30.
County of Los Angeles Office of the Assessor. (2014). Property Assessment Information System. Retrieved on 12 November 2014 from
http://assessor.lacounty.gov/extranet/DataMaps/Pais.aspx.
County of Los Angeles. (2014). County of Los Angeles 2013 – 14 Final Budget. Retrieved on 30 November 2014 from
http://www.lacountyannualreport.com/2013/files/Budget/2013-14%20Final%20Budget%20112713.pdf.

VLF Backfill Financial Analysis
Input Data
City Assessed Value Increase per annum 2%
Analysis
Phase 1 Phase 2 End of 45 Term Period
Year 2014 2019 2025 2070City of South Gate Total Assessed Value $4,559,456,000 $5,506,111,981 $6,455,692,829VLF In Lieu (Backfill) $7,807,982 $8,620,643 $9,708,244Site Total Assessed Value $243,894,229 $715,998,367 $1,030,476,607VLF Backfill Allocated to Site $417,664 $1,121,003 $1,549,658 $45,699,674
City of Downey Total Assessed Value $8,820,354,264 $9,741,667,253 $11,021,128,507VLF in Lieu (Backfill) $15,104,690 $16,676,798 $18,780,783Site Total Assessed Value (Downey) $31 546 954 $34 830 386 $85 673 578Site Total Assessed Value (Downey) $31,546,954 $34,830,386 $85,673,578VLF Backfill Allocated to Site $54,024 $59,626 $145,994 $4,305,382
County of LA Total Assessed Value $333,185,983 $369,386,083 $680,820,584VLF in Lieu (Backfill) $4,503,261 $4,971,964 $5,599,239Site Total Assessed Value $14,621,671 $16,143,506 $281,167,364VLF Backfill Allocated to Site $197,623 $217,293 $2,312,391 $68,192,775
Total VLF Backfill for Site $4,008,043 $118,197,831

Appendix E: Assumptions for Parking Management In-Lieu Fee
Variable Assumed Value Comments and/or Reference Parking Requirements Multi-family Residential 2 per Multi-family Unit (City of South Gate Municipal Code, 2013)
(City of Downey Municipal Code, 2013) Office 1 parking space per 300 gross floor area (City of South Gate Municipal Code, 2013)
(City of Downey Municipal Code, 2013) Retail / Restaurant 1 parking space per 250 gross floor area (City of South Gate Municipal Code, 2013)
(City of Downey Municipal Code, 2013) Manufacturing 1 parking space per 500 gross floor area (City of South Gate Municipal Code, 2013)
(City of Downey Municipal Code, 2013) Daycare 1 parking space per 500 gross floor area The value is assumed as both City of South Gate and
Downey’s parking requirements are based on the number of potential kids at the day care center. Since this number was not provided, an assumed value was utilized.
Finance Analysis – Parking Calculated were based off spreadsheet found on the Victoria Transport Policy Institute (Litman, 2012).
Cost of Surface Parking $14,833.33 per space It is assumed that all newly constructed parking spaces would be surface parking. Although it is indicated in the City of South Gate that there would other forms of parking (structure, underground parking), it was more feasible to assume surface parking. Spreadsheet of calculating this cost of surface parking is provided in the following pages.
Land Costs (per acre) $1,000,000 (County of Los Angeles Office of the Assessor, 2014) An approximate value of land cost per acre was calculated based on an average of the total value of each parcel within the ½ mile catchment basin.
Surface Space Acres 120 parking spaces per acre (Litman, 2012) Hard Markup Cost for Construction Cost $5,000 per parking space (Litman, 2012) Soft Markup Cost for Construction $1,500 per parking space (Litman, 2012) Future Parking Reductions Future parking adjustment is based on a reduced
percentage of the proposed parking requirements (using existing parking standards from the City of South Gate

Variable Assumed Value Comments and/or Reference and Downey)
Multi-Family Residential Parking Requirement Reduction
30% (Litman, 2013)
Office Parking Requirement Reduction 20% (Litman, 2013) Retail / Restaurant Parking Requirement Reduction
20% (Litman, 2013)
Manufacturing Parking Requirement Reduction 15% (Litman, 2013) Daycare Parking Requirement Reduction 15% (Litman, 2013) Parking In-Lieu Fee These values are expressed as a percentage of the
incremental difference Developers save when reducing the parking requirement.
Conservative 10% (Nelson Nygaard Consulting Associates Inc, 2012) Detailed analysis was conducted by Nelson Nygaard Consulting Associated with regards to the feasibility of the Downtown Parking In-Lieu Fee for City of Santa Monica. The report indicates that the strongest return for developments (mixed use office, residential) is when Parking In-Lieu fees are $20,000 per parking space that is being reduced. This methodology was initially taken into consideration. However, since parking in-lieu fees are based on the negotiation between the developer and the city, conducting analysis based on a conservative and aggressive approach would be a more accurate representation. Furthermore, using $20,000 per parking space that is being reduced also fall within the threshold range of 10%- 20%.
Aggressive 20%
Reference
City of Downey Municipal Code. (2014). art. IX, §9708. Retrieved on 12 November 2014 from http://qcode.us/codes/downey/.
County of Los Angeles Office of the Assessor. (2014). Property Assessment Information System. Retrieved on 12 November 2014 from
http://assessor.lacounty.gov/extranet/DataMaps/Pais.aspx.

City of South Gate Municipal Code. (2013). Number of parking spaces required. art. XI, §11.34.030. Retrieved on 12 November 2014 from
http://codepublishing.com/CA/southgate/.
Litman, T. (2012). Parking Costs, Pricing and Revenue Calculator Spreadsheet. Victoria Transport Policy Institute. Retrieved on 12 November 2014 from
http://www.vtpi.org/parking.xls.
Nelson Nygaard Consulting Associates Inc. (2012, August). Downtown Parking In-Lieu Fee, Draft Report. City of Santa Monica. Retrieved on
http://www.smgov.net/departments/council/agendas/2012/20120911/s2012091104-A-1.pdf.

Parking Financial Report - Cost Station: Gardendale Station Source: Parking Costs, Pricing and Revenue Calculator Spreadsheet - Victoria Transport Policy Institute - 16Jan2012
Parking Structure Technical Report: Challenges, Opportunities - Metropolitan Transportation Commission - EcoRapid Website
Inputs
Input Data Urban
Land Cost (per acre) $1,000,000Surface Space Acres 120
Facility Costs
Hard markup Soft Markup Total
Urban, Surface $1,000,000 $8,333 #REF! $5,000 $1,500 $6,500 $14,833
Construction Costs Per SpaceTotal Capital
Costs per SpaceTypes of Facility Land Costs, Per Acre
Land Costs, Per Space
Annualized Land Cost Per
Space
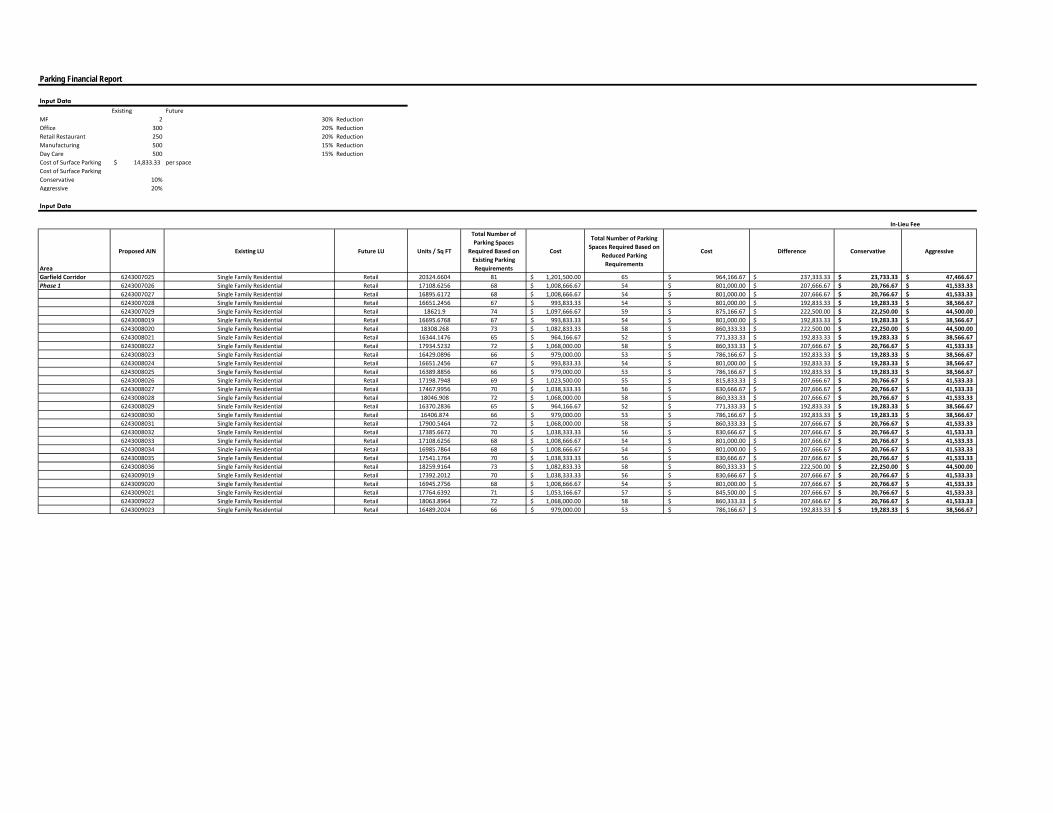
Parking Financial Report
Input Data Existing Future
MF 2 30% Reduction Office 300 20% Reduction Retail Restaurant 250 20% Reduction Manufacturing 500 15% Reduction Day Care 500 15% Reduction Cost of Surface Parking 14,833.33$ per space Cost of Surface Parking Conservative 10%Aggressive 20%
Input Data
Area
Proposed AIN Existing LU Future LU Units / Sq FT
Total Number of Parking Spaces
Required Based on Existing Parking Requirements
Cost
Total Number of Parking Spaces Required Based on
Reduced Parking Requirements
Cost Difference Conservative Aggressive
Garfield Corridor 6243007025 Single Family Residential Retail 20324.6604 81 1,201,500.00$ 65 964,166.67$ 237,333.33$ 23,733.33$ 47,466.67$ Phase 1 6243007026 Single Family Residential Retail 17108.6256 68 1,008,666.67$ 54 801,000.00$ 207,666.67$ 20,766.67$ 41,533.33$
6243007027 Single Family Residential Retail 16895.6172 68 1,008,666.67$ 54 801,000.00$ 207,666.67$ 20,766.67$ 41,533.33$ 6243007028 Single Family Residential Retail 16651.2456 67 993,833.33$ 54 801,000.00$ 192,833.33$ 19,283.33$ 38,566.67$ 6243007029 Single Family Residential Retail 18621.9 74 1,097,666.67$ 59 875,166.67$ 222,500.00$ 22,250.00$ 44,500.00$ 6243008019 Single Family Residential Retail 16695.6768 67 993,833.33$ 54 801,000.00$ 192,833.33$ 19,283.33$ 38,566.67$ 6243008020 Single Family Residential Retail 18308.268 73 1,082,833.33$ 58 860,333.33$ 222,500.00$ 22,250.00$ 44,500.00$ 6243008021 Single Family Residential Retail 16344.1476 65 964,166.67$ 52 771,333.33$ 192,833.33$ 19,283.33$ 38,566.67$ 6243008022 Single Family Residential Retail 17934.5232 72 1,068,000.00$ 58 860,333.33$ 207,666.67$ 20,766.67$ 41,533.33$ 6243008023 Single Family Residential Retail 16429.0896 66 979,000.00$ 53 786,166.67$ 192,833.33$ 19,283.33$ 38,566.67$ 6243008024 Single Family Residential Retail 16651.2456 67 993,833.33$ 54 801,000.00$ 192,833.33$ 19,283.33$ 38,566.67$ 6243008025 Single Family Residential Retail 16389.8856 66 979,000.00$ 53 786,166.67$ 192,833.33$ 19,283.33$ 38,566.67$ 6243008026 Single Family Residential Retail 17198.7948 69 1,023,500.00$ 55 815,833.33$ 207,666.67$ 20,766.67$ 41,533.33$ 6243008027 Single Family Residential Retail 17467.9956 70 1,038,333.33$ 56 830,666.67$ 207,666.67$ 20,766.67$ 41,533.33$ 6243008028 Single Family Residential Retail 18046.908 72 1,068,000.00$ 58 860,333.33$ 207,666.67$ 20,766.67$ 41,533.33$ 6243008029 Single Family Residential Retail 16370.2836 65 964,166.67$ 52 771,333.33$ 192,833.33$ 19,283.33$ 38,566.67$ 6243008030 Single Family Residential Retail 16406.874 66 979,000.00$ 53 786,166.67$ 192,833.33$ 19,283.33$ 38,566.67$ 6243008031 Single Family Residential Retail 17900.5464 72 1,068,000.00$ 58 860,333.33$ 207,666.67$ 20,766.67$ 41,533.33$ 6243008032 Single Family Residential Retail 17385.6672 70 1,038,333.33$ 56 830,666.67$ 207,666.67$ 20,766.67$ 41,533.33$ 6243008033 Single Family Residential Retail 17108.6256 68 1,008,666.67$ 54 801,000.00$ 207,666.67$ 20,766.67$ 41,533.33$ 6243008034 Single Family Residential Retail 16985.7864 68 1,008,666.67$ 54 801,000.00$ 207,666.67$ 20,766.67$ 41,533.33$ 6243008035 Single Family Residential Retail 17541.1764 70 1,038,333.33$ 56 830,666.67$ 207,666.67$ 20,766.67$ 41,533.33$ 6243008036 Single Family Residential Retail 18259.9164 73 1,082,833.33$ 58 860,333.33$ 222,500.00$ 22,250.00$ 44,500.00$ 6243009019 Single Family Residential Retail 17392.2012 70 1,038,333.33$ 56 830,666.67$ 207,666.67$ 20,766.67$ 41,533.33$ 6243009020 Single Family Residential Retail 16945.2756 68 1,008,666.67$ 54 801,000.00$ 207,666.67$ 20,766.67$ 41,533.33$ 6243009021 Single Family Residential Retail 17764.6392 71 1,053,166.67$ 57 845,500.00$ 207,666.67$ 20,766.67$ 41,533.33$ 6243009022 Single Family Residential Retail 18063.8964 72 1,068,000.00$ 58 860,333.33$ 207,666.67$ 20,766.67$ 41,533.33$ 6243009023 Single Family Residential Retail 16489.2024 66 979,000.00$ 53 786,166.67$ 192,833.33$ 19,283.33$ 38,566.67$
In-Lieu Fee

6243009024 Single Family Residential Retail 16163.8092 65 964,166.67$ 52 771,333.33$ 192,833.33$ 19,283.33$ 38,566.67$ 6243009025 Single Family Residential Retail 17349.0768 69 1,023,500.00$ 55 815,833.33$ 207,666.67$ 20,766.67$ 41,533.33$ 6243009026 Single Family Residential Retail 17369.9856 69 1,023,500.00$ 55 815,833.33$ 207,666.67$ 20,766.67$ 41,533.33$ 6243009033 General Office Use Increase Density 10940.174 36 534,000.00$ 29 430,166.67$ 103,833.33$ 10,383.33$ 20,766.67$ 6243009035 Retail Stores and Commercial Services Increase Density 11331.4512 45 667,500.00$ 36 534,000.00$ 133,500.00$ 13,350.00$ 26,700.00$ 6243009037 Retail Stores and Commercial Services Increase Density 31928.4348 128 1,898,666.67$ 102 1,513,000.00$ 385,666.67$ 38,566.67$ 77,133.33$ 6243009039 Retail Stores and Commercial Services Increase Density 57848.7044 231 3,426,500.00$ 185 2,744,166.67$ 682,333.33$ 68,233.33$ 136,466.67$ 6243010018 Commercial and Services Increase Density 6209.5996 25 370,833.33$ 20 296,666.67$ 74,166.67$ 7,416.67$ 14,833.33$ 6243010021 Retail Stores and Commercial Services Increase Density 2798.284 11 163,166.67$ 9 133,500.00$ 29,666.67$ 2,966.67$ 5,933.33$ 6243010030 Retail Stores and Commercial Services Increase Density 27605.0188 110 1,631,666.67$ 88 1,305,333.33$ 326,333.33$ 32,633.33$ 65,266.67$ 6243010031 Retail Stores and Commercial Services Increase Density 23136.5236 93 1,379,500.00$ 74 1,097,666.67$ 281,833.33$ 28,183.33$ 56,366.67$ 6243010036 General Office Use Increase Density 12680.7976 42 623,000.00$ 34 504,333.33$ 118,666.67$ 11,866.67$ 23,733.33$ 6243010037 Retail Stores and Commercial Services Increase Density 6049.3476 24 356,000.00$ 19 281,833.33$ 74,166.67$ 7,416.67$ 14,833.33$ 6243010040 Retail Stores and Commercial Services Increase Density 56775.2808 227 3,367,166.67$ 182 2,699,666.67$ 667,500.00$ 66,750.00$ 133,500.00$ 6243014004 Retail Stores and Commercial Services Increase Density 16349.8948 65 964,166.67$ 52 771,333.33$ 192,833.33$ 19,283.33$ 38,566.67$ 6243014038 Light Industrial - Manufacturing, Assembly and Industrial Service Increase Density 7193.8616 14 207,666.67$ 12 178,000.00$ 29,666.67$ 2,966.67$ 5,933.33$ 6243014039 Retail Stores and Commercial Services Increase Density 14132.6652 57 845,500.00$ 46 682,333.33$ 163,166.67$ 16,316.67$ 32,633.33$ 6243014041 Retail Stores and Commercial Services Increase Density 36848.738 147 2,180,500.00$ 118 1,750,333.33$ 430,166.67$ 43,016.67$ 86,033.33$ 6243015003 Retail Stores and Commercial Services Increase Density 20264.8644 81 1,201,500.00$ 65 964,166.67$ 237,333.33$ 23,733.33$ 47,466.67$ 6243015004 Retail Stores and Commercial Services Increase Density 10952.612 44 652,666.67$ 35 519,166.67$ 133,500.00$ 13,350.00$ 26,700.00$ 6243015005 Retail Stores and Commercial Services Increase Density 10693.9916 43 637,833.33$ 34 504,333.33$ 133,500.00$ 13,350.00$ 26,700.00$ 6243016004 Retail Stores and Commercial Services Increase Density 7340.4504 29 430,166.67$ 23 341,166.67$ 89,000.00$ 8,900.00$ 17,800.00$ 6243016005 Retail Stores and Commercial Services Increase Density 5774.9808 23 341,166.67$ 18 267,000.00$ 74,166.67$ 7,416.67$ 14,833.33$ 6243016038 General Office Use Increase Density 7581.3028 25 370,833.33$ 20 296,666.67$ 74,166.67$ 7,416.67$ 14,833.33$ 6243016039 Retail Stores and Commercial Services Increase Density 16750.5648 67 993,833.33$ 54 801,000.00$ 192,833.33$ 19,283.33$ 38,566.67$ 6243022019 Retail Stores and Commercial Services Increase Density 20399.8912 82 1,216,333.33$ 66 979,000.00$ 237,333.33$ 23,733.33$ 47,466.67$ 6243022005 Light Industrial - Manufacturing, Assembly and Industrial Services Light Industrial 17969.2168 36 534,000.00$ 31 459,833.33$ 74,166.67$ 7,416.67$ 14,833.33$ 6243021012 Light Industrial - Manufacturing, Assembly and Industrial Services Light Industrial 41208.792 82 1,216,333.33$ 70 1,038,333.33$ 178,000.00$ 17,800.00$ 35,600.00$ 6243021013 Light Industrial - Manufacturing, Assembly and Industrial Services Light Industrial 31989.5928 64 949,333.33$ 54 801,000.00$ 148,333.33$ 14,833.33$ 29,666.67$ 6243021011 Light Industrial - Manufacturing, Assembly and Industrial Services Light Industrial 103810.2848 208 3,085,333.33$ 177 2,625,500.00$ 459,833.33$ 45,983.33$ 91,966.67$ 6243021016 Retail Stores and Commercial Services Increase Density 16963.1376 68 1,008,666.67$ 54 801,000.00$ 207,666.67$ 20,766.67$ 41,533.33$ 6243022020 Light Industrial - Manufacturing, Assembly and Industrial Services Light Industrial 9107.5432 18 267,000.00$ 15 222,500.00$ 44,500.00$ 4,450.00$ 8,900.00$

6243022018 Light Industrial - Manufacturing, Assembly and Industrial Services Light Industrial 22088.6032 44 652,666.67$ 37 548,833.33$ 103,833.33$ 10,383.33$ 20,766.67$ 6243022001 Light Industrial - Manufacturing, Assembly and Industrial Services Light Industrial 152095.0128 304 4,509,333.33$ 258 3,827,000.00$ 682,333.33$ 68,233.33$ 136,466.67$ 6243025019 Light Industrial - Manufacturing, Assembly and Industrial Services Light Industrial 32334.4048 65 964,166.67$ 55 815,833.33$ 148,333.33$ 14,833.33$ 29,666.67$ 6243022002 Light Industrial - Manufacturing, Assembly and Industrial Services Light Industrial 14815.6272 30 445,000.00$ 26 385,666.67$ 59,333.33$ 5,933.33$ 11,866.67$ 6243022006 Light Industrial - Manufacturing, Assembly and Industrial Services Light Industrial 20376.8304 41 608,166.67$ 35 519,166.67$ 89,000.00$ 8,900.00$ 17,800.00$ 6243026003 Commercial and Services Increase Density 12712.7064 51 756,500.00$ 41 608,166.67$ 148,333.33$ 14,833.33$ 29,666.67$ 6243025013 Vacant Light Industrial 20006.2368 40 593,333.33$ 34 504,333.33$ 89,000.00$ 8,900.00$ 17,800.00$ 6243022021 Light Industrial - Manufacturing, Assembly and Industrial Services Light Industrial 9053.416 18 267,000.00$ 15 222,500.00$ 44,500.00$ 4,450.00$ 8,900.00$ 6243025024 Light Industrial - Manufacturing, Assembly and Industrial Services Light Industrial 162661.752 325 4,820,833.33$ 276 4,094,000.00$ 726,833.33$ 72,683.33$ 145,366.67$ 6243025014 Vacant Light Industrial 19818.9288 40 593,333.33$ 34 504,333.33$ 89,000.00$ 8,900.00$ 17,800.00$ 6243025018 Light Industrial - Manufacturing, Assembly and Industrial Services Light Industrial 39998.5344 80 1,186,666.67$ 68 1,008,666.67$ 178,000.00$ 17,800.00$ 35,600.00$ 6243021017 Light Industrial - Manufacturing, Assembly and Industrial Services Light Industrial 37032.6032 74 1,097,666.67$ 63 934,500.00$ 163,166.67$ 16,316.67$ 32,633.33$ 6243022009 Light Industrial - Manufacturing, Assembly and Industrial Services Light Industrial 12424.3392 25 370,833.33$ 21 311,500.00$ 59,333.33$ 5,933.33$ 11,866.67$ 6243026005 Vacant Light Industrial 41006.192 82 1,216,333.33$ 70 1,038,333.33$ 178,000.00$ 17,800.00$ 35,600.00$ 6243021010 Light Industrial - Manufacturing, Assembly and Industrial Services Light Industrial 12727.4112 25 370,833.33$ 21 311,500.00$ 59,333.33$ 5,933.33$ 11,866.67$ 6243021018 Light Industrial - Manufacturing, Assembly and Industrial Services Light Industrial 97035.1272 194 2,877,666.67$ 165 2,447,500.00$ 430,166.67$ 43,016.67$ 86,033.33$ 6243021007 Heavy Industrial - Manufacturing Light Industrial 67980.6376 136 2,017,333.33$ 116 1,720,666.67$ 296,666.67$ 29,666.67$ 59,333.33$
LA Parcel Residential 300.00 600 8,900,000.00$ 420 6,230,000.00$ 2,670,000.00$ 267,000.00$ 53,400.00$ Phase 2 Commercial 703,303.56 2813 41,726,166.67$ 2250 33,375,000.00$ 8,351,166.67$ 835,116.67$ 1,670,233.33$
Office / RD 42,568 142 2,106,333.33$ 114 1,691,000.00$ 415,333.33$ 41,533.33$ 83,066.67$ Retail 16,000 64 949,333.33$ 51 756,500.00$ 192,833.33$ 19,283.33$ 38,566.67$ Restaurant 7,924 32 474,666.67$ 26 385,666.67$ 89,000.00$ 8,900.00$ 17,800.00$ Flex Tech 29,738 99 1,468,500.00$ 79 1,171,833.33$ 296,666.67$ 29,666.67$ 59,333.33$ Daycare 8,000 16 237,333.33$ 14 207,666.67$ 29,666.67$ 2,966.67$ 5,933.33$
Imperial Industrial 3 1002313 Manufacturing - Heavy Industrial MF 7 14 207,666.67$ 10 148,333.33$ 59,333.33$ 5,933.33$ 1,186.67$ 1002367 Heavy Industrial MF 18 36 534,000.00$ 25 370,833.33$ 163,166.67$ 16,316.67$ 3,263.33$ 1002501 Heavy Industrial MF 109 218 3,233,666.67$ 153 2,269,500.00$ 964,166.67$ 96,416.67$ 192,833.33$
Imperial Industrial 2 4190 Manufacturing, Assembly, Industrial Services Office / RD 7322.0004 24 356,000.00$ 19 281,833.33$ 74,166.67$ 7,416.67$ 14,833.33$ 293282 Industrial Office / RD 44835.0012 149 2,210,166.67$ 119 1,765,166.67$ 445,000.00$ 44,500.00$ 89,000.00$
49696 Manufacturing, Assembly, Industrial Services Office / RD 20498.4648 68 1,008,666.67$ 54 801,000.00$ 207,666.67$ 20,766.67$ 41,533.33$
Total 2,984,466.67$ 5,448,283.33$