enhanced component performance study: …...enhanced component performance study iii 2016 update...
TRANSCRIPT
The INL is a U.S. Department of Energy National Laboratory operated by Battelle Energy Alliance
INL/LTD-17-44204
Enhanced Component Performance Study: Emergency Diesel Generators 1998–2016
John A. Schroeder
April 2018

NOTICE
This information was prepared as an account of work sponsored by an agency of the U.S. Government. Neither the U.S. Government nor any agency thereof, nor any of their employees, makes any warranty, express or implied, or assumes any legal liability or responsibility for any third party’s use, or the results of such use, of any information, apparatus, product, or process disclosed herein, or represents that its use by such third party would not infringe privately owned rights. The views expressed herein are not necessarily those of the U.S. Nuclear Regulatory Commission.

INL/LTD-17-44204
Enhanced Component Performance Study: Emergency Diesel Generators
1998–2016
John A. Schroeder
Update Completed April 2018
Idaho National Laboratory Risk Assessment and Management Services Department
Idaho Falls, Idaho 83415
http://www.inl.gov
Prepared for the Division of Risk Assessment
Office of Nuclear Regulatory Research U.S. Nuclear Regulatory Commission
NRC Agreement Number NRC-HQ-14-D-0018

Enhanced Component Performance Study iii 2016 Update
Emergency Diesel Generators April 2018
ABSTRACT
This report presents an enhanced performance evaluation of emergency
diesel generators (EDGs) at U.S. commercial nuclear power plants. This report
evaluates component performance over time using (1) Institute of Nuclear Power
Operations (INPO) Consolidated Events Database (ICES) data from 1998
through 2016 and (2) maintenance unavailability (UA) performance data from
Mitigating Systems Performance Index (MSPI) Basis Document data from 2002
through 2016. The objective is to show estimates of current failure probabilities
and rates related to EDGs, trend these data on an annual basis, determine if the
current data are consistent with the probability distributions currently
recommended for use in NRC probabilistic risk assessments, show how the
reliability data differ for different EDG manufacturers and for EDGs with
different ratings; and summarize the subcomponents, causes, detection methods,
and recovery associated with each EDG failure mode. Engineering analyses
were performed with respect to time period and failure mode without regard to
the actual number of EDGs at each plant. The factors analyzed are: sub-
component, failure cause, detection method, recovery, manufacturer, and EDG
rating. Four trends with varying degrees of statistical significance were
identified in the data.

Enhanced Component Performance Study iv 2016 Update
Emergency Diesel Generators April 2018

Enhanced Component Performance Study v 2016 Update
Emergency Diesel Generators April 2018
CONTENTS
ABSTRACT ................................................................................................................................................. iii
ACRONYMS ............................................................................................................................................... ix
1. INTRODUCTION ................................................................................................................................ 1
2. SUMMARY OF FINDINGS ................................................................................................................ 3 2.1 Increasing Trends ...................................................................................................................... 3
2.1.1 Extremely Statistically Significant ..................................................................................... 3 2.1.2 Highly Statistically Significant ........................................................................................... 3 2.1.3 Statistically Significant ....................................................................................................... 3
2.2 Decreasing Trends ..................................................................................................................... 3 2.2.1 Extremely Statistically Significant ..................................................................................... 3 2.2.2 Highly Statistically Significant ........................................................................................... 3 2.2.3 Statistically Significant ....................................................................................................... 3
2.3 Consistency Check Results ....................................................................................................... 3
3. FAILURE PROBABILITIES AND FAILURE RATES ...................................................................... 5 3.1 Overview ................................................................................................................................... 5 3.2 EDG Failure Probability and Failure Rate Trends .................................................................... 6
4. UNAVAILABILITY........................................................................................................................... 11 4.1 Overview ................................................................................................................................. 11 4.2 EDG Unavailability Trends ..................................................................................................... 11 4.3 Emergency Diesel Generator Repair Times ............................................................................ 13
5. EDG UNRELIABILITY TRENDS .................................................................................................... 15
6. ENGINEERING ANALYSIS ............................................................................................................. 17 6.1 Engineering Trends ................................................................................................................. 17 6.2 Comparison of ICES EPS EDG Unplanned Demand ............................................................. 21 Results with Industry Results .............................................................................................................. 21 6.3 EPS EDG Performance by Manufacturer ................................................................................ 22 6.4 EPS EDG Performance by Rating ........................................................................................... 23 6.5 EPS EDG Engineering Analysis by Failure Modes ................................................................ 23
7. EPS EDG ASSEMBLY DESCRIPTION ........................................................................................... 31
8. DATA TABLES ................................................................................................................................. 33
9. REFERENCES .................................................................................................................................... 49
Enhanced Component Performance Study vi 2016 Update
Emergency Diesel Generators April 2018
FIGURES
Figure 1. Failure probability estimate trend for EPS EDG FTS. ................................................................. 7
Figure 2. Failure probability estimate trend for EPS EDG FTLR. .............................................................. 7
Figure 3. Failure rate estimate trend for EPS EDG FTR>1H. ..................................................................... 8
Figure 4. Failure probability estimate trend for HPCS EDG FTS. .............................................................. 8
Figure 5. Failure probability estimate trend for HPCS EDG FTLR. ........................................................... 9
Figure 6. Failure rate estimate trend for HPCS EDG FTR>1H. .................................................................. 9
Figure 7. EPS EDG UA trend. ................................................................................................................... 12
Figure 8. HPCS EDG UA trend. ................................................................................................................ 12
Figure 9. EPS EDG unreliability trend (8-hour mission). .......................................................................... 15
Figure 10. HPCS EDG unreliability trend (8-hour mission). ..................................................................... 16
Figure 11. Frequency (events per reactor year) of start demands, EPS and HPCS EDGs. ........................ 18
Figure 12. Frequency (events per reactor year) of load and run ≤ 1 hour demands, EPS and HPCS
EDGs. ............................................................................................................................................... 18
Figure 13. EPS and HPCS EDG run hours per reactor year. ..................................................................... 19
Figure 14. Frequency (events per reactor year) of FTS events, EPS and HPCS EDGs. ............................ 19
Figure 15. Frequency (events per reactor year) of FTLR events, EPS and HPCS EDGs. ......................... 20
Figure 16. Frequency (events per reactor year) of FTR>1H events, EPS and HPCS EDGs. .................... 20
Figure 17. EPS EDG failure breakdown by sub component and failure mode .......................................... 24
Figure 18. EPS EDG breakdown by cause group and failure mode .......................................................... 25
Figure 19. EPS EDG component failure distribution failure mode and method of detection .................... 27
Figure 20. EPS EDG component failure distribution by failure mode and recovery determination ......... 28
Figure 21. EPS EDG failure distribution by manufacturer ........................................................................ 29
Figure 22. EPS EDG component failure modes by EPS EDG rating ........................................................ 30

Enhanced Component Performance Study vii 2016 Update
Emergency Diesel Generators April 2018
TABLES
Table 1. EDG systems. ................................................................................................................................. 5
Table 2. Industry-wide distributions of p (failure probability) and λ (hourly rate) for EPS EDGs,
from the 2015 Update. ........................................................................................................................ 5
Table 3. Industry-wide distributions of p (failure probability) and λ (hourly rate) for HPCS
EDGs. ................................................................................................................................................. 5
Table 4. Industry-average unavailability estimates for EPS EDGs. .......................................................... 11
Table 5. Weibull curve fit parameters. ....................................................................................................... 13
Table 6. Probability of exceeding selected EDG repair times (2007 – 2016). ........................................... 14
Table 7. Summary of EDG failure counts for the FTS failure mode over time by system. ....................... 21
Table 8. Summary of EDG failure counts for the FTLR failure mode over time by system. .................... 21
Table 9. Summary of EDG failure counts for the FTR > 1H failure mode over time by system. ............. 21
Table 10. EPS EDG unplanned demand performance comparison with industry-average
performance from ICES data. ........................................................................................................... 22
Table 11. EPS EDG manufacturer performance compared with industry-average performance—
FTS, FTLR, and FTR>1H combined................................................................................................ 22
Table 12. EPS EDG rating performance compared with industry-average performance—FTS,
FTLR, and FTR>1H combined. ....................................................................................................... 23
Table 13. Component failure cause groups. ............................................................................................... 26
Table 14. EPS EDG manufacturer population and total failure count. ...................................................... 29
Table 15. EPS EDG population by rating. ................................................................................................. 30
Table 16. Plot data for Figure 1, EPS EDG FTS industry trend ................................................................ 33
Table 17. Plot data for Figure 2, EPS EDG FTLR industry trend ............................................................. 34
Table 18. Plot data for Figure 3, EPS EDG FTR>1H industry trend ......................................................... 35
Table 19. Plot data for Figure 4, HPCS EDG FTS industry trend ............................................................. 36
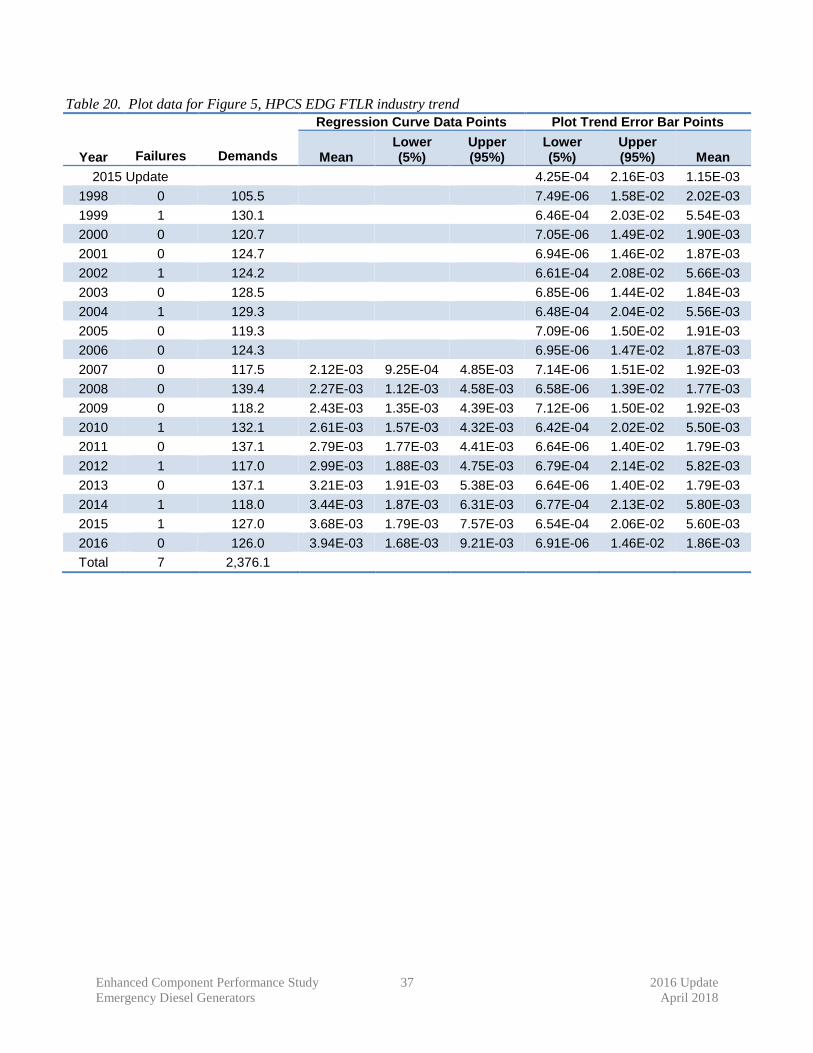
Table 20. Plot data for Figure 5, HPCS EDG FTLR industry trend .......................................................... 37
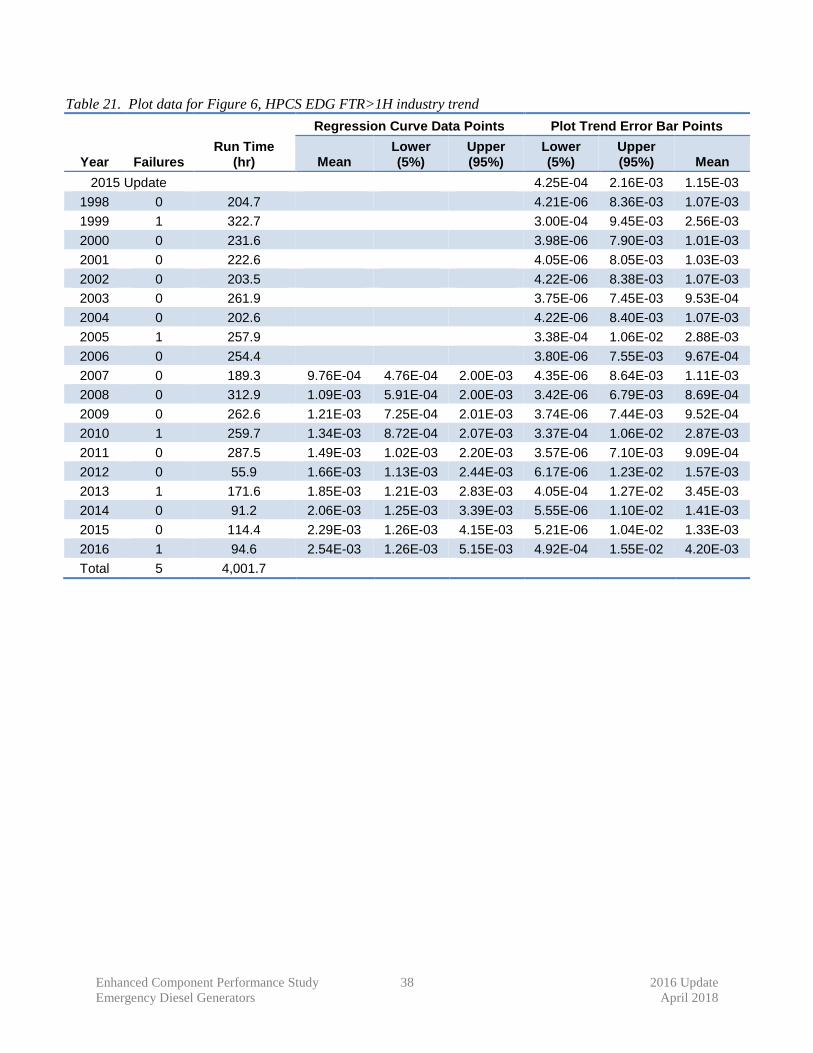
Table 21. Plot data for Figure 6, HPCS EDG FTR>1H industry trend ..................................................... 38

Enhanced Component Performance Study viii 2016 Update
Emergency Diesel Generators April 2018
Table 22. Plot data for Figure 7, EPS EDG UA trend ............................................................................... 39
Table 23. Plot data for Figure 8, HPCS EDG UA trend ............................................................................ 40
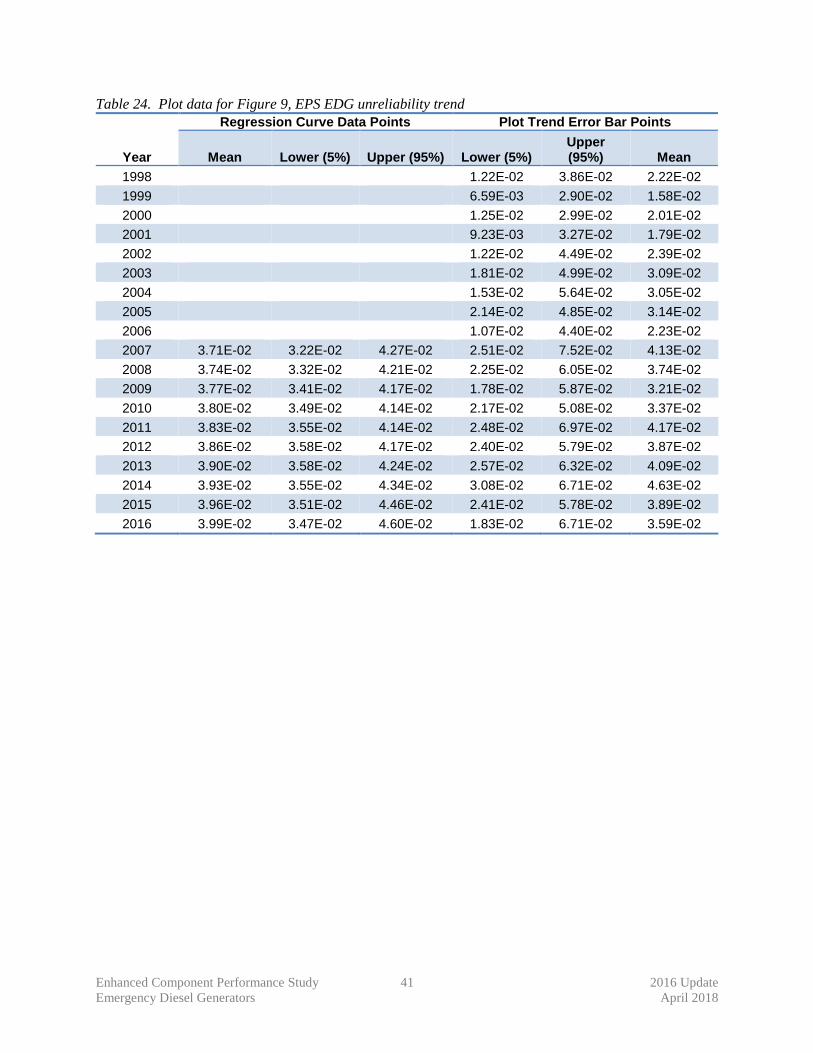
Table 24. Plot data for Figure 9, EPS EDG unreliability trend .................................................................. 41
Table 25. Plot data for Figure 10, HPCS EDG unreliability trend ............................................................ 42
Table 26. Plot data for Figure 11, EPS and HPCS EDG start demands trend ........................................... 43
Table 27. Plot data for Figure 12, EPS and HPCS EDG load and run ≤1-hour demands trend ................ 44
Table 28. Plot data for Figure 13, EPS and HPCS EDG run hours (greater than 1H) trend ...................... 45
Table 29. Plot data for Figure 14, EPS and HPCS EDG FTS events trend ............................................... 46
Table 30. Plot data for Figure 15, EPS EDG FTLR events trend .............................................................. 47
Table 31. Plot data for Figure 16, EPS EDG FTR>1H events trend ......................................................... 48
Enhanced Component Performance Study ix 2016 Update
Emergency Diesel Generators April 2018
ACRONYMS
CNID constrained non-informative prior distribution
CY calendar year
EDG emergency diesel generator
EPIX Equipment Performance and Information Exchange
EPS emergency power supply
ESF engineered safety feature
FTLR failure to load and run
FTR>1H failure to run > 1 hour
FTS failure to start
FY fiscal year
HPCS high-pressure core spray
ICES INPO Consolidated Events Database
INL Idaho National laboratory
INPO Institute of Nuclear Power Operations
MSPI Mitigating Systems Performance Index
NPRDS Nuclear Plant Reliability Data System
OLS ordinary least squares
PRA probabilistic risk assessment
UA unavailability

Enhanced Component Performance Study x 2016 Update
Emergency Diesel Generators April 2018
Enhanced Component Performance Study 1 2016 Update
Emergency Diesel Generators April 2018
Enhanced Component Performance Study: Emergency Diesel Generators
1998–2016
1. INTRODUCTION
This report presents a performance evaluation of emergency diesel generators (EDGs) at U.S.
commercial nuclear power plants from 1998 through 2016. The objective is to show estimates of current
failure probabilities and rates related to EDGs, trend these data on an annual basis, determine if the
current data are consistent with the probability distributions currently recommended for use in NRC
probabilistic risk assessments, show how the reliability data differ for different EDG manufacturers and
for EDGs with different ratings; and summarize the subcomponents, causes, detection methods, and
recovery associated with each EDG failure mode. This year’s update has three changes from previous
year’s updates: 1) this year’s results are based on calendar year (CY) instead of fiscal year (FY); 2) the
failure events included in this update are now all considered “hard” failures, which is to say the p-values
indicating the likelihood the component would have failed during a 24-hour mission are now all 1.0.
Previous updates include lesser p-values indicating a degraded condition that probably would have caused
failure during a 24-hour mission. 3) The discussion of EDG repair times, which was previously included
in the annual LOOP updates (see http://nrcoe.inl.gov/resultsdb/LOSP), is added to this report.
The data used in this study were based on the operating experience failure reports from the Institute of
Nuclear Power Operations’ (INPO) and Consolidated Events Database (ICES) Database [1]; formerly the
Equipment Performance and Information Exchange Database (EPIX). Maintenance unavailability (UA)
performance data comes from Mitigating Systems Performance Index (MSPI) data from 2002 through
2016 [2]. The EDG failure modes considered are failure to start (FTS), failure to load and run (FTLR),
and failure to run greater than hour (FTR>1H). Annual failure probabilities (failures per demand) are
provided for FTS and FTLR events and annual failure rates (failures per run hour) are provided for FTR >
1H events. EDG train maintenance unavailability probabilities are also considered. In addition to the
presentation of the component failure mode data and the UA data, an 8-hour component total unreliability
is calculated and trended. The results are reported separately for emergency power system (EPS) and
high pressure core spray (HPCS) EDGs.
Each of the estimates is trended for the most recent 10-year period. Yearly estimates have been
provided for the entire study period.
This study is modeled on the web page updates associated with the NUREG-1715 series of reports
[3], which were published around 2000. Those studies relied on operating experience obtained from
licensee event reports, the Nuclear Plant Reliability Data System (NPRDS), and ICES. The ICES
database, which includes the MSPI as a subset, has matured to the point where component availability and
reliability can be estimated with a higher degree of accuracy. In addition, the population of data in ICES
has been growing and is much larger than the population used in the previous studies.
While this report provides an overview of operational data and evaluate component performance over
time, it makes no attempt to estimate values for use in probabilistic risk assessments (PRAs). The 2015
Component Reliability Update [4], is an update to the report: Industry-Average Performance for
Components and Initiating Events at U.S Commercial Nuclear Power Plants [5] and reports the EDG
unreliability estimates for probabilistic risk assessments. Estimates from that report are included herein,
for comparison. These estimates are labelled “2015 Update” (or “Update 2015”) in the associated tables
and figures.

Enhanced Component Performance Study 2 2016 Update
Emergency Diesel Generators April 2018
Engineering analyses were also performed with respect to time period and failure modes. In Section
6.1, the same failures used in Section 3 are used to compute estimates of overall failure frequencies per
plant reactor year (with EPS and HPCS EDG failures combined). Frequencies of demands per plant
reactor year are also provided for each year, for each of the possible failure modes. As in Section 3, each
of the estimates is trended for the most recent 10-year period. The frequencies show general industry
performances and are not based on the number of EDGs at each plant.
In Sections 6.2 through 6.4, various subsets of the EDG data are compared with the distributions
currently recommended for PRA use in the “2015 Update.” First, the subset of failure events and
demands from this report that occurred on unplanned demands (engineered safety feature actuations) is
compared for consistency with the 2015 Update data. This evaluation provided a check on the ongoing
use of the 2015 Update EDG data (which includes failures from possibly incomplete testing demands). In
Section 6.3, data from each EDG manufacturer is compared. Finally, in Section 6.4, EDG failure
groupings based on EDG ratings are compared.
Section 6.5 provides breakdowns of the failures for each failure mode for the two plant systems with
EDGs. The analyses are based on the following factors: sub-component, failure cause, detection method,
and recovery.
Finally, Section 7 provides additional information on the EDG assembly component boundaries and
failure modes.
An overview of the trending methods, glossary of terms, and abbreviations can be found in the
Overview and Reference document [6] on the Reactor Operational Experience Results and Databases web
page (http://nrcoe.inl.gov/resultsdb).

Enhanced Component Performance Study 3 2016 Update
Emergency Diesel Generators April 2018
2. SUMMARY OF FINDINGS
The results of this study are summarized in this section. Of particular interest is the existence of any
statistically significanta increasing trends.
2.1 Increasing Trends
2.1.1 Extremely Statistically Significant
None.
2.1.2 Highly Statistically Significant
None.
2.1.3 Statistically Significant
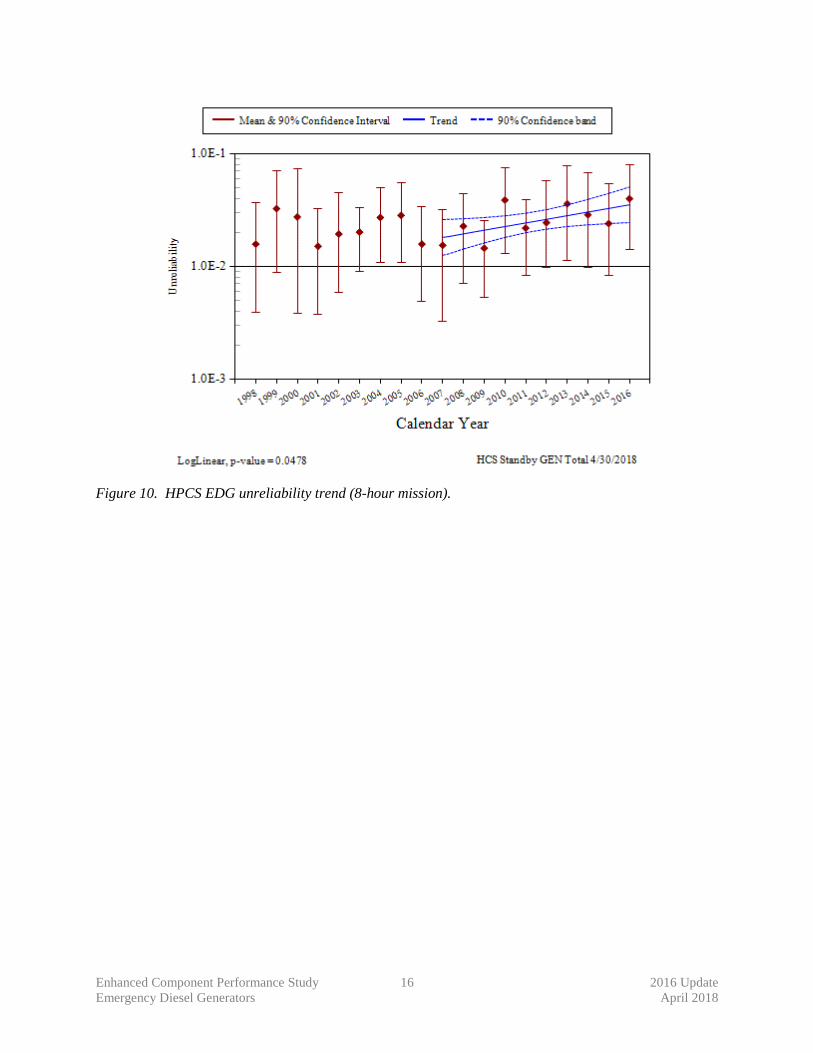
A statistically significant increasing trend was identified in the EDG data for HPCS EDG
unreliability (8-hour mission) (see Figure 10).
2.2 Decreasing Trends
2.2.1 Extremely Statistically Significant
None
2.2.2 Highly Statistically Significant
EPS and HPCS EDG run hours per reactor year (see Figure 13).
2.2.3 Statistically Significant
Failure probability estimate trend for EPS EDG fail to load and run (see Figure 2).
Frequency, events per year, of fail to load-run for EPS and HPCS EDGs (see Figure 15).
2.3 Consistency Check Results
An ongoing concern in the nuclear risk assessment field is whether industry failure rate estimates that
are largely derived from test data adequately predict component performance during unplanned (ESF)
demands. Section 6.2 shows the results of a consistency check between industry failure rate estimates and
failure counts collected from EDG performance on ESF demands. The consistency checks using ESF
demand data indicate that the FTS, FTLR and FTR failure counts are consistent with predictions made
using the industry-average estimates from the 2015 Update (Table 2).
Section 6.3 provides the results of consistency checks by EDG manufacturer. Two manufacturer’s
ESF EPS EDG failure counts lie in the upper 95% of the uncertainty range of the industry-average
estimate. However, these manufacturers have very few EPS EDGs, and so the data are limited. The rest
a. Statistically significant is defined in terms of the ‘p-value.’ A p-value is a probability indicating whether to accept
or reject the null hypothesis that there is no trend in the data. P-values of less than or equal to 0.05 indicate that we
are 95% confident that there is a trend in the data (reject the null hypothesis of no trend.) By convention, we use the
"Michelin Guide" scale: p-value < 0.05 (statistically significant), p-value < 0.01 (highly statistically significant); p-
value < 0.001 (extremely statistically significant).

Enhanced Component Performance Study 4 2016 Update
Emergency Diesel Generators April 2018
of the manufacturer’s failure counts lie within the 5% to 95% interval of the industry-average estimate
uncertainty band.
Section 6.4 shows the results of the consistency check by EDG load rating. The failure counts by
rating all lie within the 5% to 95% interval of the industry-average estimate uncertainty band.
Enhanced Component Performance Study 5 2016 Update
Emergency Diesel Generators April 2018
3. FAILURE PROBABILITIES AND FAILURE RATES
3.1 Overview
The failure probabilities and failure rates of EDGs have been calculated from the operating
experience for FTS, FTLR, and FTR>1H. The EDG data set obtained from ICES includes EDGs in the
systems listed in Table 1. Table 2 shows failure probability and failure rate estimates for the EPS EDG
from Reference [4], or the 2015 Update. Table 3 shows the failure probability and failure rate estimates
for the HPCS EDG. The HPCS EDG failure probability was not fully analyzed in [4] and is presented
here based on the current ICES data that has been reviewed at Idaho National Laboratory (INL).
Table 1. EDG systems.
System Description EDG Count
EPS Emergency power supply 232 HPCS High pressure core spray 8 Total 240
The EDGs do not operate all the time. They are standby-components required to operate when called
upon, when the reactor is critical, and during shutdown periods. The demands and run hours are reported
on a quarterly or semi-annual basis through the MSPI program. All demand types are considered—
testing, non-testing, and those ESF demands that require the EDG to mitigate a bus under-voltage
condition.
Table 2. Industry-wide distributions of p (failure probability) and λ (hourly rate) for EPS EDGs, from the
2015 Update.
Failure Mode 5% Median Mean 95%
Distribution
Type
FTS 1.45E-3 2.73E-3 2.83E-3 4.59E-3 Beta 8.59 3.02E+03 FTLR 1.18E-3 3.38E-3 3.73E-3 7.42E-3 Gamma 3.61 9.70E+02 FTR>1H 3.78E-4 1.35E-3 1.54E-3 3.34E-3 Gamma 2.68 1.74E+03
Table 3. Industry-wide distributions of p (failure probability) and λ (hourly rate) for HPCS EDGs.
Failure Mode 5% Median Mean 95%
Distribution
Type
FTS 2.19E-4 8.33E-4 9.56E-4 2.12E-3 Beta 2.50 2.61E+03 FTR 4.25E-4 1.07E-3 1.15E-3 2.16E-3 Gamma 4.50 3.91E+03

Enhanced Component Performance Study 6 2016 Update
Emergency Diesel Generators April 2018
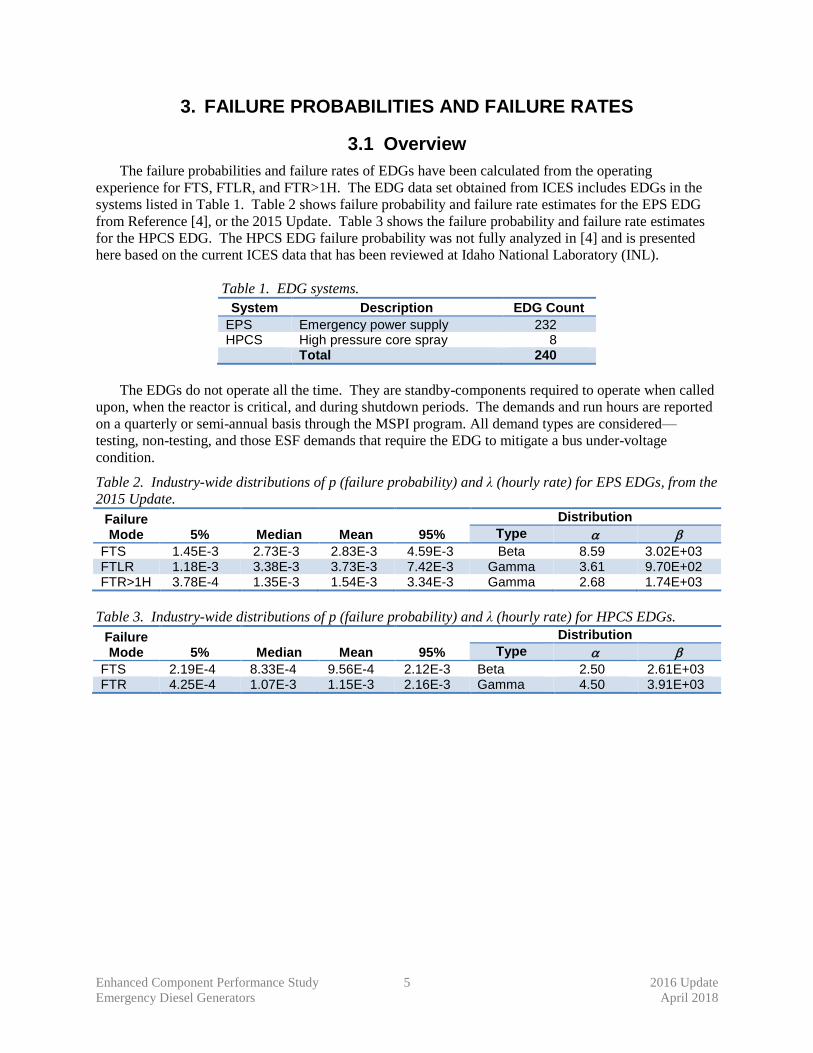
3.2 EDG Failure Probability and Failure Rate Trends
Trends in failure probabilities and failure rates are shown in Figures 1–6. The data for the trend plots
are contained in Tables 16–21, respectively.
The failure probability and failure rate estimates in the plots were obtained from a Bayesian update
process. The means from the posterior distributions were plotted for each year. The 5th and 95th
percentiles from the posterior distributions are also provided and give an indication of the relative
uncertainty in the estimated parameters from year to year. When there are no failures, the interval tends
to be larger than the interval for years when there are one or more failures. The larger interval reflects the
uncertainty that comes from having little information in that year’s data. Such uncertainty intervals are
determined by the prior distribution. In each plot, a relatively “flat” constrained non-informed prior
distribution (CNID) is used, which has large bounds. For failure probabilities, the posterior means for
each year are calculated from
𝑚𝑒𝑎𝑛 =𝑓𝑎𝑖𝑙𝑢𝑟𝑒𝑠 + 0.5
𝑑𝑒𝑚𝑎𝑛𝑑𝑠 + 1
(1)
For failure rates, the posterior means for each year are calculated from
𝑚𝑒𝑎𝑛 =𝑓𝑎𝑖𝑙𝑢𝑟𝑒𝑠 + 0.5
𝑜𝑝𝑒𝑟𝑡𝑖𝑛𝑔 ℎ𝑜𝑢𝑟𝑠
(2)
The horizontal curves plotted around the regression lines in the graphs show 90 percent simultaneous
confidence bands for the fitted lines. The simultaneous confidence band bounds are larger than ordinary
confidence bands for the trended values because they form a band that has a 90% probability of
containing the entire line. In the lower left hand corner of the trend figures, the regression p-values are
reported. They come from a statistical test on whether the slope of the regression line might be zero.
Low p-values indicate that the slopes are not likely to be zero, and that trends exist. P-values of less than
or equal to 0.05 indicate that we are 95% confident that there is a trend in the data (reject the null
hypothesis of no trend.) By convention, this study uses the "Michelin Guide" scale: p-value < 0.05
(statistically significant), p-value < 0.01 (highly statistically significant); p-value < 0.001 (extremely
statistically significant).
The regression methods are all based on “ordinary least squares” (OLS); which minimizes the square
of the vertical distance between the annual data points and the regression line. The p-values assume
normal distributions for the data in each year, with a constant variance across the years. In the case where
the data involve failure counts, the method of iterative reweighing accounts for the fact that count data are
not expected to have a constant variance (for example, the variance for Poisson-distributed counts is equal
to the expected number of counts). Further information on the trending methods is provided in Section 2
of the Overview and Reference document [6].
A final feature of the trend graphs is that the 2015 Update baseline industry values from Table 2 are
shown for comparison.

Enhanced Component Performance Study 7 2016 Update
Emergency Diesel Generators April 2018
Figure 1. Failure probability estimate trend for EPS EDG FTS.
Figure 2. Failure probability estimate trend for EPS EDG FTLR.
Enhanced Component Performance Study 8 2016 Update
Emergency Diesel Generators April 2018
Figure 3. Failure rate estimate trend for EPS EDG FTR>1H.
Figure 4. Failure probability estimate trend for HPCS EDG FTS.

Enhanced Component Performance Study 9 2016 Update
Emergency Diesel Generators April 2018
Figure 5. Failure probability estimate trend for HPCS EDG FTLR.
Figure 6. Failure rate estimate trend for HPCS EDG FTR>1H.

Enhanced Component Performance Study 10 2016 Update
Emergency Diesel Generators April 2018

Enhanced Component Performance Study 11 2016 Update
Emergency Diesel Generators April 2018
4. UNAVAILABILITY
4.1 Overview
The industry-wide test or maintenance UA of EDG trains has been calculated from the operating
experience. UA data are for EDG trains, which can include more than just the EDG. However, in most
cases the EDG contributes the majority of the UA reported. Table 4 shows overall results for the EDG
from [4] based on UA data from MSPI Basis Documents, covering 2002 to 2015. In the calculations,
planned and unplanned unavailable hours for a train are combined.
Table 4. Industry-average unavailability estimates for EPS EDGs.
Description Distribution Mean
Emergency diesel generator test or maintenance unavailability (EPS)
Normal 1.48E-2 0.0148 0.0063
Emergency diesel generator test or maintenance unavailability (HPCS)
Normal 1.17E-2 0.0117 0.0025
4.2 EDG Unavailability Trends
The graphs that follow provide overall maintenance unavailability data for the 1998–2016 period.
Note that these data do not supersede the data in Table 4 for use in risk assessments.
Trends in EDG train unavailability are shown in Figure 7 and Figure 8. Data tables for these figures
are Table 22 and Table 23, respectively. The EDGs in systems EPS and HPCS are trended. The yearly
unavailability and reactor critical hour data were obtained from the Reactor Oversight Program (1998 to
2001) and MSPI EPS indicator (2002 to 2016). The total EDG downtimes during operation for each plant
and year were summed and divided by the corresponding number of EDG-reactor critical hours.
Unavailability data for plant shutdown periods are not reported.
A change in reporting requirements for UA occurred in 2002. The Reactor Oversight Program data
(1998–2001) did not include EDG overhaul outages while plants were in critical operation, while the
MSPI (2002–2016) requires plants to report such outages. The difference in the annual means of these
two groups is not statistically significant.
The mean and variance for each year is the sample mean and variance calculated from the plant-level
unavailability’s for that year. The vertical bar spans the calculated 5th to 95th percentiles of the beta
distribution with matching means.
Further information on the trending methods is provided in Section 3 of the Overview and Reference
document [6]. In the lower left hand corner of each trend figure, the p-value is reported.

Enhanced Component Performance Study 12 2016 Update
Emergency Diesel Generators April 2018
Figure 7. EPS EDG UA trend.
Figure 8. HPCS EDG UA trend.

Enhanced Component Performance Study 13 2016 Update
Emergency Diesel Generators April 2018
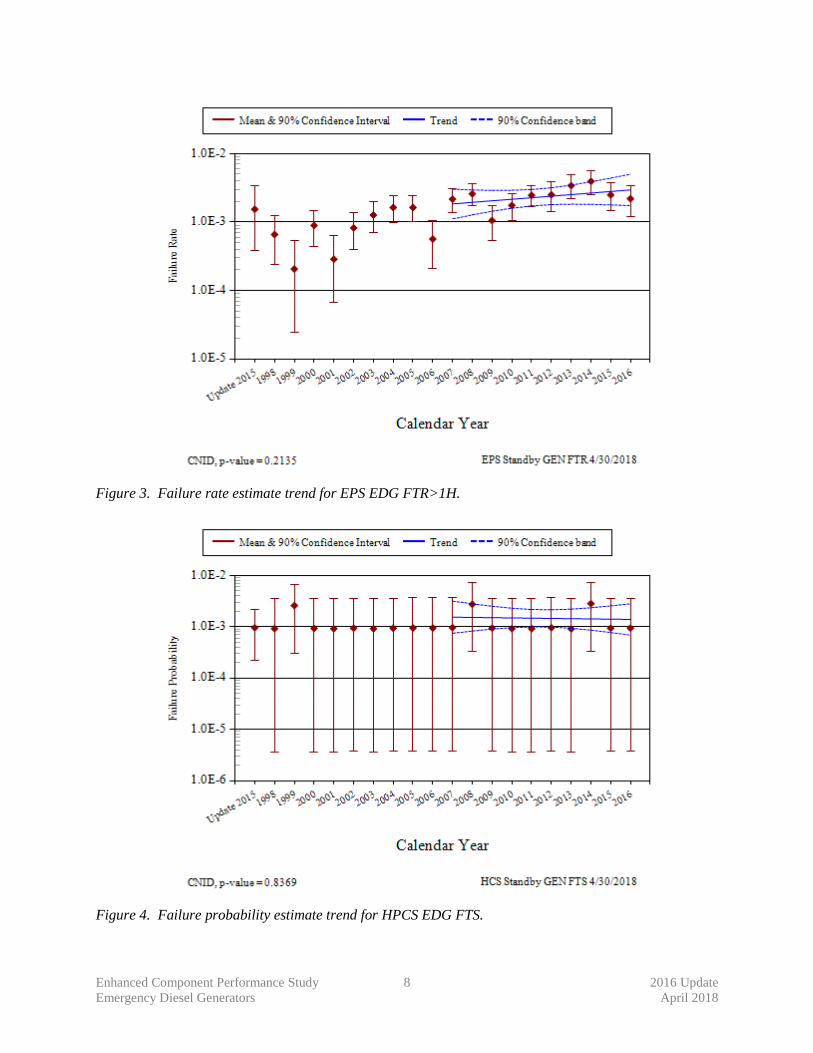
4.3 Emergency Diesel Generator Repair Times
The data for repair times performed under actual emergency conditions are not available so repair
durations were based how many hours of unplanned unavailability have been reported for each EDG from
2007 to 2016. The hourly unplanned unavailability is reported to the U.S. Nuclear Regulatory
Commission (NRC) in the Mitigating Systems Performance Index (MSPI) data. The MSPI data were not
reported prior to 2006.
A Weibull distribution was fit to the unplanned unavailability durations. The Weibull fit parameters
are provided in Table 5. The probability an EDG outage duration exceeds a given time (t) is listed in
Table 6. The correspondence between fitted and observed distributions is very good at short to moderate
times but not as good at very long repair times (well beyond typical PRA missions), such as where the
outage spans hundreds of hours. The long right tail of the repair time distribution is fit better by a
lognormal distribution than a Weibull.
Table 5. Weibull curve fit parameters.
Parameter Value
Mean 30.3
Median 13.5
Weibull(α) 0.679
Weibull(β) 23.3
Enhanced Component Performance Study 14 2016 Update
Emergency Diesel Generators April 2018
Table 6. Probability of exceeding selected EDG repair times (2007 – 2016).
Recovery Time (hr)
Weibull Model
Probability
0.5 0.929
1 0.889
1.5 0.856
2 0.828
3 0.780
4 0.739
5 0.703
6 0.671
7 0.643
8 0.616
9 0.592
10 0.569
11 0.548
12 0.528
13 0.510
14 0.492
15 0.476
16 0.460
17 0.446
18 0.432
19 0.418
20 0.406
21 0.393
22 0.382
23 0.371
24 0.360

Enhanced Component Performance Study 15 2016 Update
Emergency Diesel Generators April 2018
5. EDG UNRELIABILITY TRENDS
Trends in total component unreliability are shown in Figure 9 and Figure 10. Plot data for these
figures are in Table 24 and Table 25, respectively. Total unreliability is defined as the union of UA, FTS,
FTLR, FTR>1H. The probability of FTR>1H is calculated for 7 hours to provide the results for an 8-hour
mission. The trends are shown at the system-specific level across the industry. The trending method is
described in more detail in Section 4 of the Overview and Reference document [6]. In the lower left hand
corner of the trend figures, the regression method is reported.
No “2015 Update” data for use in risk assessments are cited for EDG unreliability because these data
are not published. The risk assessment models compute unreliability as an output rather than an input.
Figure 9. EPS EDG unreliability trend (8-hour mission).
Enhanced Component Performance Study 16 2016 Update
Emergency Diesel Generators April 2018
Figure 10. HPCS EDG unreliability trend (8-hour mission).
Enhanced Component Performance Study 17 2016 Update
Emergency Diesel Generators April 2018
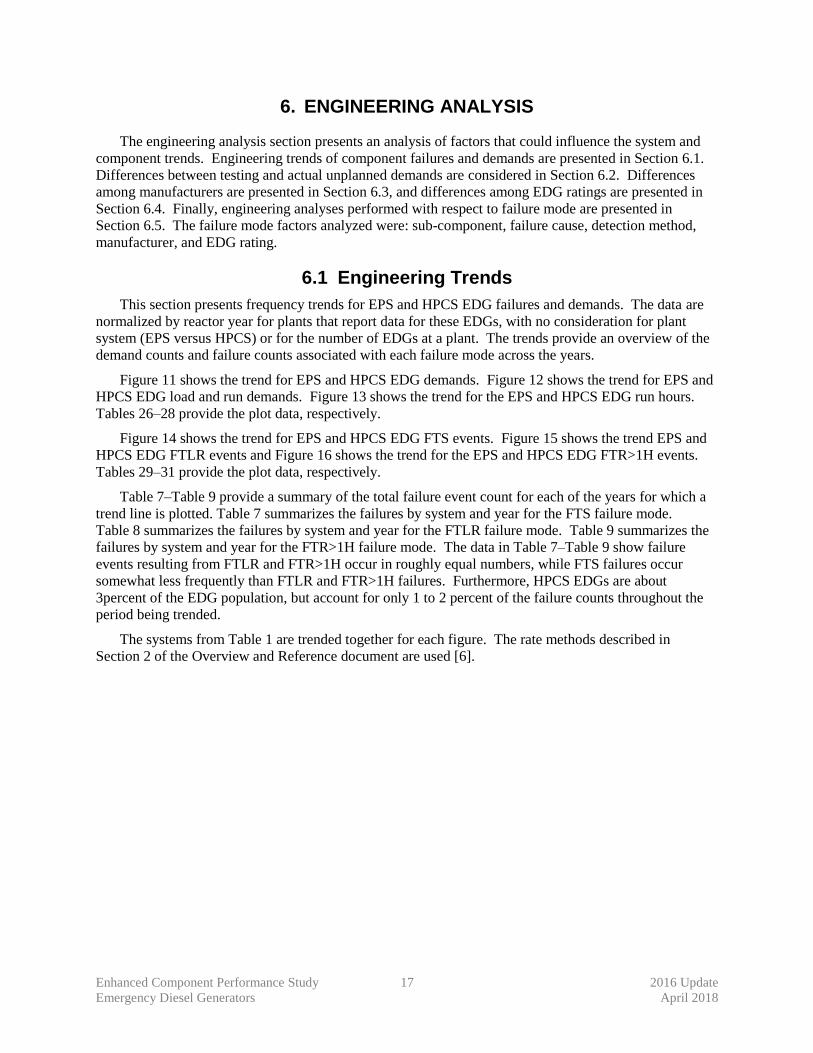
6. ENGINEERING ANALYSIS
The engineering analysis section presents an analysis of factors that could influence the system and
component trends. Engineering trends of component failures and demands are presented in Section 6.1.
Differences between testing and actual unplanned demands are considered in Section 6.2. Differences
among manufacturers are presented in Section 6.3, and differences among EDG ratings are presented in
Section 6.4. Finally, engineering analyses performed with respect to failure mode are presented in
Section 6.5. The failure mode factors analyzed were: sub-component, failure cause, detection method,
manufacturer, and EDG rating.
6.1 Engineering Trends
This section presents frequency trends for EPS and HPCS EDG failures and demands. The data are
normalized by reactor year for plants that report data for these EDGs, with no consideration for plant
system (EPS versus HPCS) or for the number of EDGs at a plant. The trends provide an overview of the
demand counts and failure counts associated with each failure mode across the years.
Figure 11 shows the trend for EPS and HPCS EDG demands. Figure 12 shows the trend for EPS and
HPCS EDG load and run demands. Figure 13 shows the trend for the EPS and HPCS EDG run hours.
Tables 26–28 provide the plot data, respectively.
Figure 14 shows the trend for EPS and HPCS EDG FTS events. Figure 15 shows the trend EPS and
HPCS EDG FTLR events and Figure 16 shows the trend for the EPS and HPCS EDG FTR>1H events.
Tables 29–31 provide the plot data, respectively.
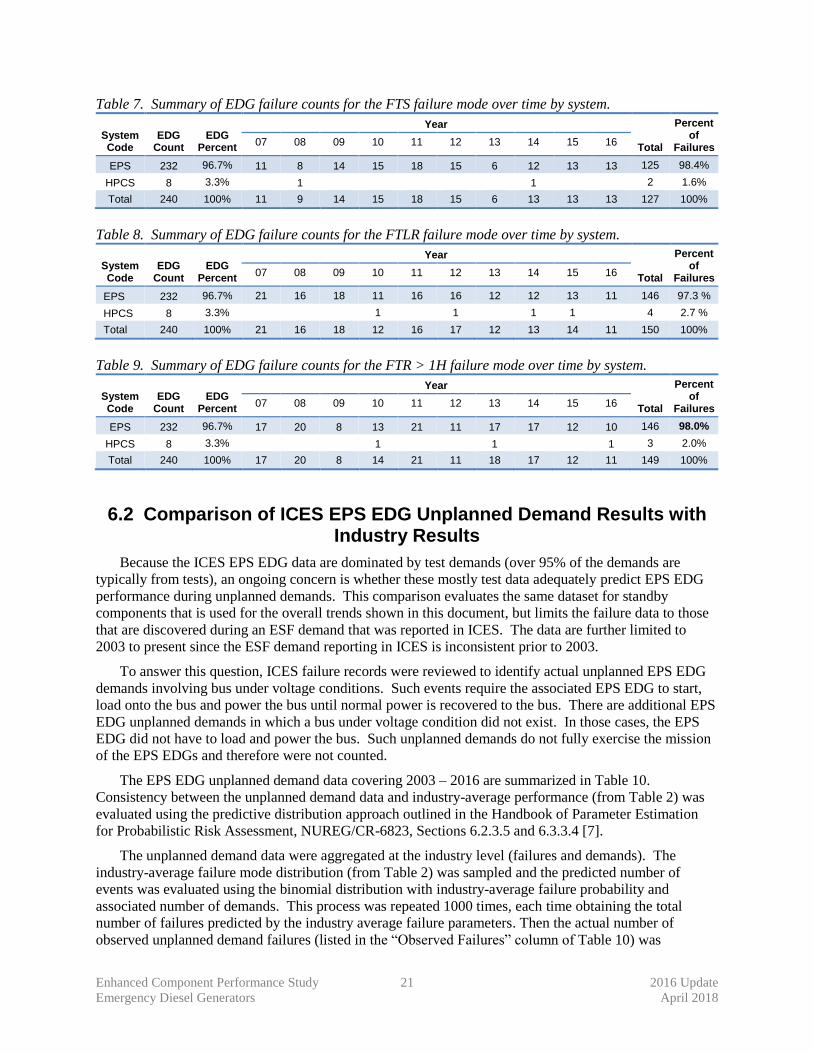
Table 7–Table 9 provide a summary of the total failure event count for each of the years for which a
trend line is plotted. Table 7 summarizes the failures by system and year for the FTS failure mode.
Table 8 summarizes the failures by system and year for the FTLR failure mode. Table 9 summarizes the
failures by system and year for the FTR>1H failure mode. The data in Table 7–Table 9 show failure
events resulting from FTLR and FTR>1H occur in roughly equal numbers, while FTS failures occur
somewhat less frequently than FTLR and FTR>1H failures. Furthermore, HPCS EDGs are about
3percent of the EDG population, but account for only 1 to 2 percent of the failure counts throughout the
period being trended.
The systems from Table 1 are trended together for each figure. The rate methods described in
Section 2 of the Overview and Reference document are used [6].

Enhanced Component Performance Study 18 2016 Update
Emergency Diesel Generators April 2018
Figure 11. Frequency (events per reactor year) of start demands, EPS and HPCS EDGs.
Figure 12. Frequency (events per reactor year) of load and run ≤ 1 hour demands, EPS and HPCS
EDGs.

Enhanced Component Performance Study 19 2016 Update
Emergency Diesel Generators April 2018
Figure 13. EPS and HPCS EDG run hours per reactor year.
Figure 14. Frequency (events per reactor year) of FTS events, EPS and HPCS EDGs.

Enhanced Component Performance Study 20 2016 Update
Emergency Diesel Generators April 2018
Figure 15. Frequency (events per reactor year) of FTLR events, EPS and HPCS EDGs.
Figure 16. Frequency (events per reactor year) of FTR>1H events, EPS and HPCS EDGs.
Enhanced Component Performance Study 21 2016 Update
Emergency Diesel Generators April 2018
Table 7. Summary of EDG failure counts for the FTS failure mode over time by system.
System Code
EDG Count
EDG Percent
Year
Total
Percent of
Failures 07 08 09 10 11 12 13 14 15 16
EPS 232 96.7% 11 8 14 15 18 15 6 12 13 13 125 98.4%
HPCS 8 3.3% 1 1 2 1.6%
Total 240 100% 11 9 14 15 18 15 6 13 13 13 127 100%
Table 8. Summary of EDG failure counts for the FTLR failure mode over time by system.
System Code
EDG Count
EDG Percent
Year
Total
Percent of
Failures 07 08 09 10 11 12 13 14 15 16
EPS 232 96.7% 21 16 18 11 16 16 12 12 13 11 146 97.3 %
HPCS 8 3.3% 1 1 1 1 4 2.7 %
Total 240 100% 21 16 18 12 16 17 12 13 14 11 150 100%
Table 9. Summary of EDG failure counts for the FTR > 1H failure mode over time by system.
System Code
EDG Count
EDG Percent
Year
Total
Percent of
Failures 07 08 09 10 11 12 13 14 15 16
EPS 232 96.7% 17 20 8 13 21 11 17 17 12 10 146 98.0%
HPCS 8 3.3% 1 1 1 3 2.0%
Total 240 100% 17 20 8 14 21 11 18 17 12 11 149 100%
6.2 Comparison of ICES EPS EDG Unplanned Demand Results with Industry Results
Because the ICES EPS EDG data are dominated by test demands (over 95% of the demands are
typically from tests), an ongoing concern is whether these mostly test data adequately predict EPS EDG
performance during unplanned demands. This comparison evaluates the same dataset for standby
components that is used for the overall trends shown in this document, but limits the failure data to those
that are discovered during an ESF demand that was reported in ICES. The data are further limited to
2003 to present since the ESF demand reporting in ICES is inconsistent prior to 2003.
To answer this question, ICES failure records were reviewed to identify actual unplanned EPS EDG
demands involving bus under voltage conditions. Such events require the associated EPS EDG to start,
load onto the bus and power the bus until normal power is recovered to the bus. There are additional EPS
EDG unplanned demands in which a bus under voltage condition did not exist. In those cases, the EPS
EDG did not have to load and power the bus. Such unplanned demands do not fully exercise the mission
of the EPS EDGs and therefore were not counted.
The EPS EDG unplanned demand data covering 2003 – 2016 are summarized in Table 10.
Consistency between the unplanned demand data and industry-average performance (from Table 2) was
evaluated using the predictive distribution approach outlined in the Handbook of Parameter Estimation
for Probabilistic Risk Assessment, NUREG/CR-6823, Sections 6.2.3.5 and 6.3.3.4 [7].
The unplanned demand data were aggregated at the industry level (failures and demands). The
industry-average failure mode distribution (from Table 2) was sampled and the predicted number of
events was evaluated using the binomial distribution with industry-average failure probability and
associated number of demands. This process was repeated 1000 times, each time obtaining the total
number of failures predicted by the industry average failure parameters. Then the actual number of
observed unplanned demand failures (listed in the “Observed Failures” column of Table 10) was
Enhanced Component Performance Study 22 2016 Update
Emergency Diesel Generators April 2018
compared with this sample to determine the probability of observing this number of failures or greater. If
the probability was greater than 0.05 and less than 0.95, then the Table 2 industry-average distribution
obtained from the ICES data analysis is considered to be consistent with the observed unplanned demand
performance.
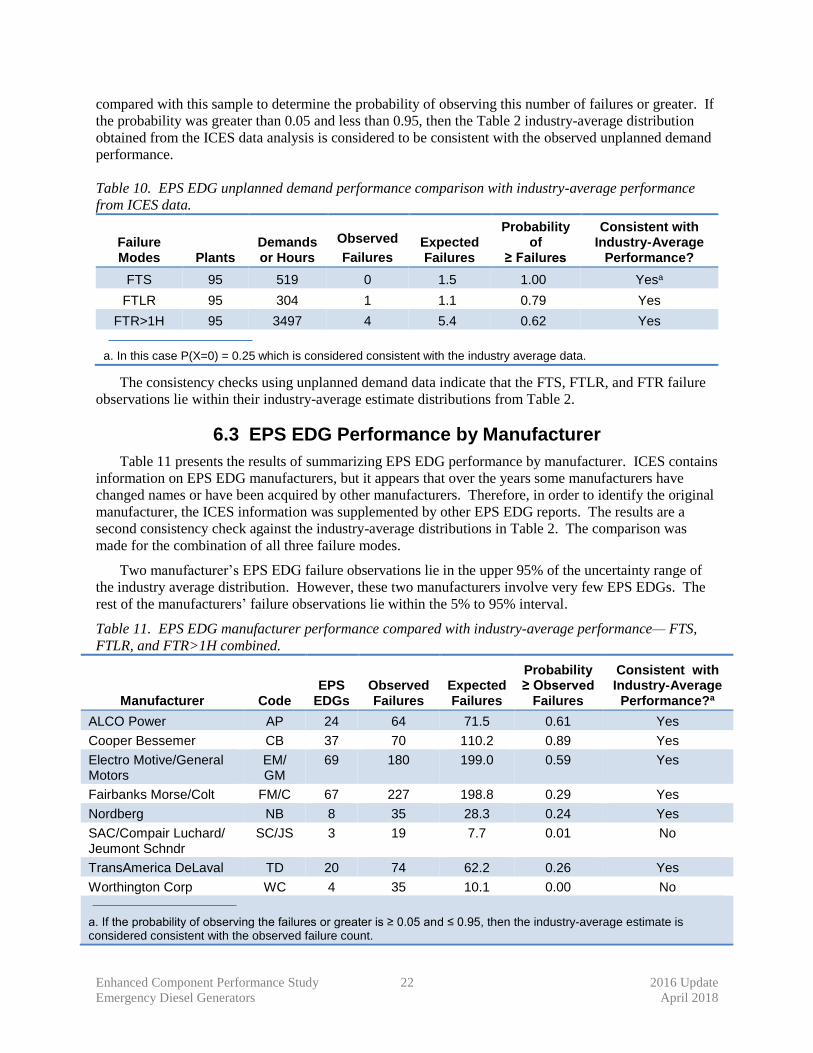
Table 10. EPS EDG unplanned demand performance comparison with industry-average performance
from ICES data.
Failure Modes Plants
Demands or Hours
Observed
Failures Expected Failures
Probability of
≥ Failures
Consistent with Industry-Average
Performance?
FTS 95 519 0 1.5 1.00 Yesa
FTLR 95 304 1 1.1 0.79 Yes
FTR>1H 95 3497 4 5.4 0.62 Yes
a. In this case P(X=0) = 0.25 which is considered consistent with the industry average data.
The consistency checks using unplanned demand data indicate that the FTS, FTLR, and FTR failure
observations lie within their industry-average estimate distributions from Table 2.
6.3 EPS EDG Performance by Manufacturer
Table 11 presents the results of summarizing EPS EDG performance by manufacturer. ICES contains
information on EPS EDG manufacturers, but it appears that over the years some manufacturers have
changed names or have been acquired by other manufacturers. Therefore, in order to identify the original
manufacturer, the ICES information was supplemented by other EPS EDG reports. The results are a
second consistency check against the industry-average distributions in Table 2. The comparison was
made for the combination of all three failure modes.
Two manufacturer’s EPS EDG failure observations lie in the upper 95% of the uncertainty range of
the industry average distribution. However, these two manufacturers involve very few EPS EDGs. The
rest of the manufacturers’ failure observations lie within the 5% to 95% interval.
Table 11. EPS EDG manufacturer performance compared with industry-average performance— FTS,
FTLR, and FTR>1H combined.
Manufacturer Code EPS
EDGs Observed Failures
Expected Failures
Probability ≥ Observed
Failures
Consistent with Industry-Average
Performance?a
ALCO Power AP 24 64 71.5 0.61 Yes
Cooper Bessemer CB 37 70 110.2 0.89 Yes
Electro Motive/General Motors
EM/ GM
69 180 199.0 0.59 Yes
Fairbanks Morse/Colt FM/C 67 227 198.8 0.29 Yes
Nordberg NB 8 35 28.3 0.24 Yes
SAC/Compair Luchard/ Jeumont Schndr
SC/JS 3 19 7.7 0.01 No
TransAmerica DeLaval TD 20 74 62.2 0.26 Yes
Worthington Corp WC 4 35 10.1 0.00 No
a. If the probability of observing the failures or greater is ≥ 0.05 and ≤ 0.95, then the industry-average estimate is considered consistent with the observed failure count.
Enhanced Component Performance Study 23 2016 Update
Emergency Diesel Generators April 2018
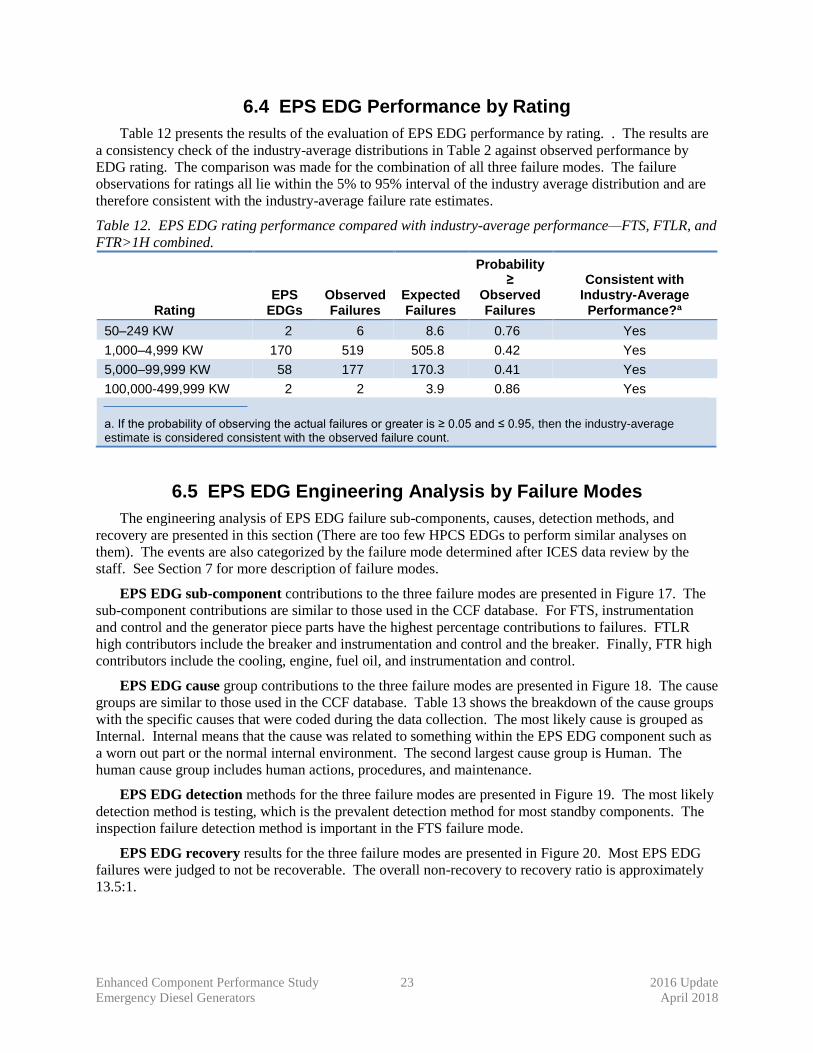
6.4 EPS EDG Performance by Rating
Table 12 presents the results of the evaluation of EPS EDG performance by rating. . The results are
a consistency check of the industry-average distributions in Table 2 against observed performance by
EDG rating. The comparison was made for the combination of all three failure modes. The failure
observations for ratings all lie within the 5% to 95% interval of the industry average distribution and are
therefore consistent with the industry-average failure rate estimates.
Table 12. EPS EDG rating performance compared with industry-average performance—FTS, FTLR, and
FTR>1H combined.
Rating EPS
EDGs Observed Failures
Expected Failures
Probability ≥
Observed Failures
Consistent with Industry-Average
Performance?a
50–249 KW 2 6 8.6 0.76 Yes
1,000–4,999 KW 170 519 505.8 0.42 Yes
5,000–99,999 KW 58 177 170.3 0.41 Yes
100,000-499,999 KW 2 2 3.9 0.86 Yes
a. If the probability of observing the actual failures or greater is ≥ 0.05 and ≤ 0.95, then the industry-average estimate is considered consistent with the observed failure count.
6.5 EPS EDG Engineering Analysis by Failure Modes
The engineering analysis of EPS EDG failure sub-components, causes, detection methods, and
recovery are presented in this section (There are too few HPCS EDGs to perform similar analyses on
them). The events are also categorized by the failure mode determined after ICES data review by the
staff. See Section 7 for more description of failure modes.
EPS EDG sub-component contributions to the three failure modes are presented in Figure 17. The
sub-component contributions are similar to those used in the CCF database. For FTS, instrumentation
and control and the generator piece parts have the highest percentage contributions to failures. FTLR
high contributors include the breaker and instrumentation and control and the breaker. Finally, FTR high
contributors include the cooling, engine, fuel oil, and instrumentation and control.
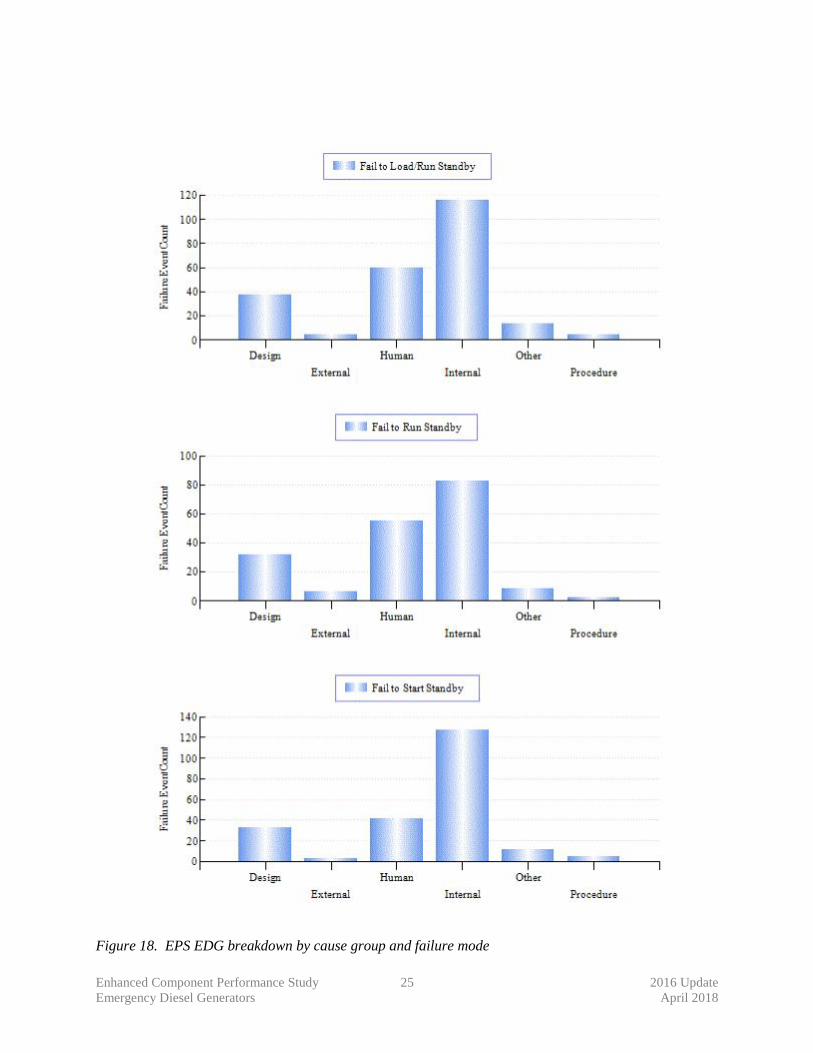
EPS EDG cause group contributions to the three failure modes are presented in Figure 18. The cause
groups are similar to those used in the CCF database. Table 13 shows the breakdown of the cause groups
with the specific causes that were coded during the data collection. The most likely cause is grouped as
Internal. Internal means that the cause was related to something within the EPS EDG component such as
a worn out part or the normal internal environment. The second largest cause group is Human. The
human cause group includes human actions, procedures, and maintenance.
EPS EDG detection methods for the three failure modes are presented in Figure 19. The most likely
detection method is testing, which is the prevalent detection method for most standby components. The
inspection failure detection method is important in the FTS failure mode.
EPS EDG recovery results for the three failure modes are presented in Figure 20. Most EPS EDG
failures were judged to not be recoverable. The overall non-recovery to recovery ratio is approximately
13.5:1.

Enhanced Component Performance Study 24 2016 Update
Emergency Diesel Generators April 2018
Figure 17. EPS EDG failure breakdown by sub component and failure mode
Enhanced Component Performance Study 25 2016 Update
Emergency Diesel Generators April 2018
Figure 18. EPS EDG breakdown by cause group and failure mode

Enhanced Component Performance Study 26 2016 Update
Emergency Diesel Generators April 2018
Table 13. Component failure cause groups.
Group Specific Cause Description
Design Construction/installation error or inadequacy
Used when a construction or installation error is made during the original or modification installation. This includes specification of incorrect component or material.
Design error or inadequacy
Used when a design error is made.
Manufacturing error or inadequacy
Used when a manufacturing error is made during component manufacture.
External State of other component Used when the cause of a failure is the result of a component state that is not associated with the component that failed. An example would be the diesel failed due to no fuel in the fuel storage tanks.
Ambient environmental stress
Used when the cause of a failure is the result of an environmental condition from the location of the component.
Human Accidental action (unintentional or undesired human errors)
Used when a human error (during the performance of an activity) results in an unintentional or undesired action.
Human action procedure Used when the correct procedure is not followed or the wrong procedure is followed. For example: when a missed step or incorrect step in a surveillance procedure results in a component failure.
Inadequate maintenance Used when a human error (during the performance of maintenance) results in an unintentional or undesired action.
Internal Internal to component, piece-part
Used when the cause of a failure is a non-specific result of a failure internal to the component that failed other than aging or wear.
Internal environment The internal environment led to the failure. Debris/Foreign material as well as an operating medium chemistry issue.
Setpoint drift Used when the cause of a failure is the result of setpoint drift or adjustment.
Age/Wear Used when the cause of the failure is a non-specific aging or wear issue.
Other Unknown Used when the cause of the failure is not known.
Other (stated cause does not fit other categories)
Used when the cause of a failure is provided but it does not meet any one of the descriptions.
Procedure Inadequate procedure Used when the cause of a failure is the result of an inadequate procedure operating or maintenance.

Enhanced Component Performance Study 27 2016 Update
Emergency Diesel Generators April 2018
Figure 19. EPS EDG component failure distribution failure mode and method of detection

Enhanced Component Performance Study 28 2016 Update
Emergency Diesel Generators April 2018
Figure 20. EPS EDG component failure distribution by failure mode and recovery determination
Enhanced Component Performance Study 29 2016 Update
Emergency Diesel Generators April 2018
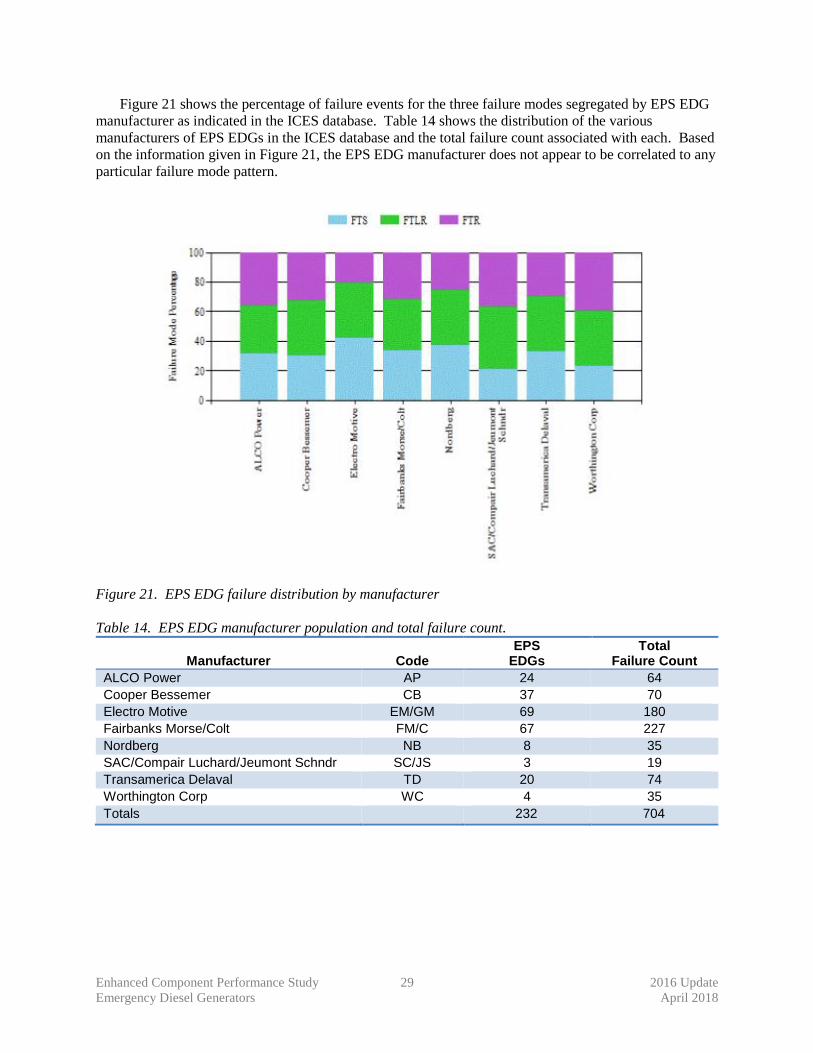
Figure 21 shows the percentage of failure events for the three failure modes segregated by EPS EDG
manufacturer as indicated in the ICES database. Table 14 shows the distribution of the various
manufacturers of EPS EDGs in the ICES database and the total failure count associated with each. Based
on the information given in Figure 21, the EPS EDG manufacturer does not appear to be correlated to any
particular failure mode pattern.
Figure 21. EPS EDG failure distribution by manufacturer
Table 14. EPS EDG manufacturer population and total failure count.
Manufacturer Code EPS
EDGs Total
Failure Count
ALCO Power AP 24 64
Cooper Bessemer CB 37 70
Electro Motive EM/GM 69 180
Fairbanks Morse/Colt FM/C 67 227
Nordberg NB 8 35
SAC/Compair Luchard/Jeumont Schndr SC/JS 3 19
Transamerica Delaval TD 20 74
Worthington Corp WC 4 35
Totals 232 704

Enhanced Component Performance Study 30 2016 Update
Emergency Diesel Generators April 2018
Figure 22 shows the percentage of failure events for the three failure modes segregated by EPS EDG
rating as indicated in the ICES database. Table 15 shows the distribution of the various rated EPS EDGs
in the ICES database used in this study. The larger EDG differs from the others in not yet having any
FTS events, but the operational experience for this EDG is much shorter than for other EDGs.
Figure 22. EPS EDG component failure modes by EPS EDG rating
Table 15. EPS EDG population by rating.
EPS EDG Rating Device Count
Total Failure Count
50-249 KW 2 6
1,000-4,999 KW 170 519
5,000-99,999 KW 58 177
100,000-499,999 KW 2 2
Total 232 704
Enhanced Component Performance Study 31 2016 Update
Emergency Diesel Generators April 2018
7. EPS EDG ASSEMBLY DESCRIPTION
The EDGs are those within the Class 1E ac electrical power system at U.S. commercial nuclear power
plants and those in the HPCS systems. Station blackout EDGs are not included.
The EDG includes the diesel engine with all components in the exhaust path, electrical generator,
generator exciter, output breaker, combustion air, lube oil systems, fuel oil system, and starting
compressed air system, and local instrumentation and control circuitry. The sequencer is excluded from
the EDG component. For the service water system providing cooling to the EDGs, only the devices
providing control of cooling flow to the EDG heat exchangers are included. Room heating and
ventilating is not included.
The EDG failure modes include FTS, FTLR, and FTR>1H. These failure modes were used in
NUREG/CR-6928 and are similar to those used in the MSPI Program. There is some uncertainty
concerning when the run hours should start to be counted; should they start as soon as the EDG starts or
should they start only after the output circuit breaker has closed? For this study, the run hours start as
soon as the EDG is started, which is the way data have been reported in ICES. The total run hours are
partitioned by failure mode, with the first hour being used for FTLR, and the remaining hours assigned to
FTR>1H.
Guidelines for determining whether a component failure event reported in ICES is to be included in
FTS, FTLR, or FTR>1H are similar to those used in the MSPI Program. In general, any circumstance in
which the component is not able to meet the performance requirements defined in the PRA is counted.
This includes conditions revealed through testing, operational demands, unplanned demands, or
discovery. Also, run failures that occur beyond the typical 24-hour mission time in PRAs are included.
However, certain events are excluded: slow engine starting times that do not exceed the PRA success
criteria, conditions that are annunciated immediately in the control room without a demand, and run
events representing degraded conditions that are shown to not have caused an actual run failure within 24
hours. Also, events occurring during maintenance or post-maintenance testing that are related to the
actual maintenance activities are excluded. Finally, in contrast to the MSPI Program, a general guideline
on slow starting times is to include only those slow starts requiring more than 20 seconds as FTS events,
similar to what was done for the CCF database and the EDG system study. (In the MSPI Program, most
licensees chose to use technical specification requirements for fast starts as their success criteria –
typically less than 10 seconds to start.) All of the EDG events within ICES were reviewed to ensure that
they were binned to the correct failure mode—FTS, FTLR, FTR>1H, or no failure. However, even given
detailed descriptions of failure events, this binning still required some judgment and involves some
uncertainty.
Guidelines for counting demands and run hours are similar to those in the MSPI Program. Start and
load/run demands include those resulting from tests, operational demands, and unplanned demands.
Demands during maintenance and post-maintenance testing are excluded. Similarly, run hours include
those from tests, operational demands, and unplanned demands. Note that the test demands and run hours
dominate the totals, compared with operational and unplanned demands and run hours.

Enhanced Component Performance Study 32 2016 Update
Emergency Diesel Generators April 2018

Enhanced Component Performance Study 33 2016 Update
Emergency Diesel Generators April 2018
8. DATA TABLES
Table 16. Plot data for Figure 1, EPS EDG FTS industry trend
Year Failures Demands
Regression Curve Data Points Plot Trend Error Bar Points
Mean Lower (5%)
Upper (95%)
Lower (5%)
Upper (95%) Mean
2015 Update 1.45E-03 4.59E-03 2.83E-03
1998 18 4,200.5 2.76E-03 6.25E-03 4.24E-03
1999 8 4,131.9 1.01E-03 3.51E-03 1.98E-03
2000 12 3,948.5 1.78E-03 4.87E-03 3.04E-03
2001 12 4,095.4 1.72E-03 4.70E-03 2.93E-03
2002 10 4,341.8 1.29E-03 3.90E-03 2.33E-03
2003 17 4,333.2 2.50E-03 5.80E-03 3.89E-03
2004 14 4,335.8 1.97E-03 4.99E-03 3.22E-03
2005 17 4,382.2 2.47E-03 5.73E-03 3.85E-03
2006 9 4,371.0 1.12E-03 3.60E-03 2.09E-03
2007 11 4,286.0 2.72E-03 1.66E-03 4.47E-03 1.47E-03 4.23E-03 2.58E-03
2008 8 4,328.7 2.76E-03 1.81E-03 4.20E-03 9.65E-04 3.35E-03 1.89E-03
2009 14 4,224.4 2.80E-03 1.97E-03 3.99E-03 2.02E-03 5.12E-03 3.30E-03
2010 15 4,099.0 2.84E-03 2.10E-03 3.84E-03 2.26E-03 5.55E-03 3.64E-03
2011 18 4,134.1 2.88E-03 2.20E-03 3.77E-03 2.80E-03 6.34E-03 4.30E-03
2012 15 4,032.8 2.92E-03 2.24E-03 3.82E-03 2.30E-03 5.64E-03 3.69E-03
2013 6 4,100.2 2.97E-03 2.21E-03 3.99E-03 6.90E-04 2.93E-03 1.52E-03
2014 12 4,080.7 3.01E-03 2.13E-03 4.25E-03 1.72E-03 4.72E-03 2.94E-03
2015 13 4,029.1 3.05E-03 2.02E-03 4.60E-03 1.93E-03 5.07E-03 3.22E-03
2016 13 4,039.3 3.09E-03 1.90E-03 5.03E-03 1.92E-03 5.06E-03 3.21E-03
Total 242 79,494.3

Enhanced Component Performance Study 34 2016 Update
Emergency Diesel Generators April 2018
Table 17. Plot data for Figure 2, EPS EDG FTLR industry trend
Year Failures Demands
Regression Curve Data Points Plot Trend Error Bar Points
Mean Lower (5%)
Upper (95%)
Lower (5%)
Upper (95%) Mean
2015 Update 1.18E-03 7.42E-03 3.73E-03
1998 14 3,802.4 2.26E-03 5.72E-03 3.69E-03
1999 5 3,750.6 5.90E-04 2.88E-03 1.42E-03
2000 8 3,688.1 1.14E-03 3.95E-03 2.23E-03
2001 13 3,779.2 2.07E-03 5.45E-03 3.46E-03
2002 14 3,638.1 2.36E-03 5.97E-03 3.86E-03
2003 15 3,790.2 2.46E-03 6.05E-03 3.96E-03
2004 10 3,821.6 1.47E-03 4.45E-03 2.66E-03
2005 14 3,784.4 2.27E-03 5.75E-03 3.71E-03
2006 15 3,757.2 2.49E-03 6.10E-03 3.99E-03
2007 21 3,644.0 4.97E-03 4.01E-03 6.15E-03 3.85E-03 8.18E-03 5.71E-03
2008 16 3,725.2 4.72E-03 3.94E-03 5.66E-03 2.71E-03 6.46E-03 4.29E-03
2009 18 3,666.5 4.49E-03 3.86E-03 5.23E-03 3.18E-03 7.19E-03 4.88E-03
2010 11 3,576.6 4.28E-03 3.75E-03 4.88E-03 1.77E-03 5.08E-03 3.11E-03
2011 16 3,610.2 4.07E-03 3.60E-03 4.60E-03 2.80E-03 6.66E-03 4.42E-03
2012 16 3,566.7 3.87E-03 3.40E-03 4.40E-03 2.83E-03 6.74E-03 4.47E-03
2013 12 3,575.0 3.68E-03 3.18E-03 4.27E-03 1.98E-03 5.42E-03 3.38E-03
2014 12 3,601.2 3.50E-03 2.94E-03 4.17E-03 1.96E-03 5.38E-03 3.36E-03
2015 13 3,531.7 3.33E-03 2.70E-03 4.10E-03 2.21E-03 5.82E-03 3.69E-03
2016 11 3,526.7 3.17E-03 2.48E-03 4.05E-03 1.79E-03 5.15E-03 3.15E-03
Total 254 69,835.4

Enhanced Component Performance Study 35 2016 Update
Emergency Diesel Generators April 2018
Table 18. Plot data for Figure 3, EPS EDG FTR>1H industry trend
Year Failures Run Time
(hr)
Regression Curve Data Points Plot Trend Error Bar Points
Mean Lower (5%)
Upper (95%)
Lower (5%)
Upper (95%) Mean
2015 Update 3.78E-04 3.34E-03 1.54E-03
1998 4 6,539.3 2.46E-04 1.46E-03 6.67E-04
1999 1 6,959.7 2.45E-05 7.72E-04 2.09E-04
2000 7 8,088.9 4.38E-04 1.66E-03 9.04E-04
2001 2 8,401.1 6.65E-05 8.17E-04 2.90E-04
2002 7 8,829.1 4.02E-04 1.53E-03 8.30E-04
2003 10 7,972.8 7.08E-04 2.15E-03 1.28E-03
2004 13 7,971.7 9.87E-04 2.60E-03 1.65E-03
2005 14 8,559.1 1.01E-03 2.57E-03 1.65E-03
2006 4 7,653.2 2.11E-04 1.25E-03 5.72E-04
2007 17 7,768.9 1.84E-03 1.12E-03 3.02E-03 1.41E-03 3.27E-03 2.19E-03
2008 20 7,632.7 1.94E-03 1.28E-03 2.95E-03 1.74E-03 3.78E-03 2.61E-03
2009 8 7,736.6 2.05E-03 1.44E-03 2.91E-03 5.46E-04 1.90E-03 1.07E-03
2010 13 7,382.8 2.15E-03 1.60E-03 2.91E-03 1.06E-03 2.80E-03 1.78E-03
2011 21 8,403.5 2.27E-03 1.72E-03 2.99E-03 1.68E-03 3.58E-03 2.50E-03
2012 11 4,270.7 2.39E-03 1.80E-03 3.17E-03 1.46E-03 4.20E-03 2.57E-03
2013 17 4,821.4 2.52E-03 1.83E-03 3.47E-03 2.23E-03 5.19E-03 3.48E-03
2014 17 4,121.4 2.65E-03 1.82E-03 3.88E-03 2.59E-03 6.03E-03 4.04E-03
2015 12 4,700.9 2.80E-03 1.78E-03 4.39E-03 1.49E-03 4.08E-03 2.55E-03
2016 10 4,468.0 2.95E-03 1.73E-03 5.01E-03 1.24E-03 3.76E-03 2.24E-03
Total 208 132,281.8
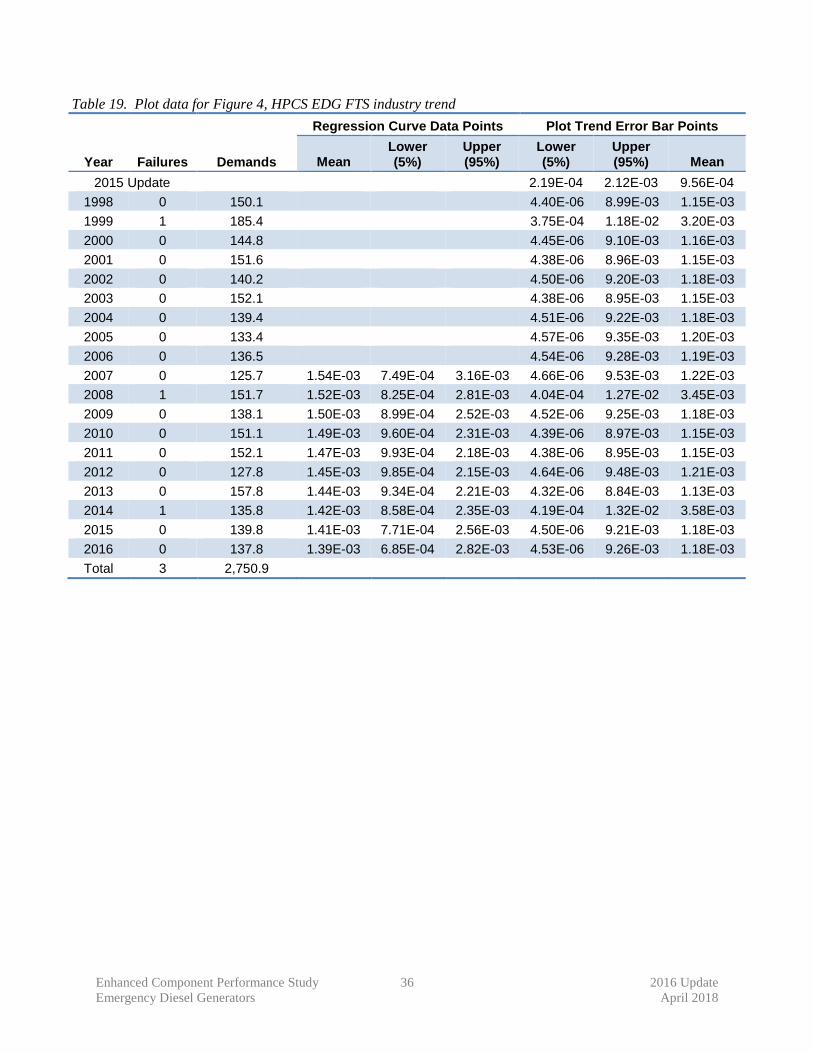
Enhanced Component Performance Study 36 2016 Update
Emergency Diesel Generators April 2018
Table 19. Plot data for Figure 4, HPCS EDG FTS industry trend
Year Failures Demands
Regression Curve Data Points Plot Trend Error Bar Points
Mean Lower (5%)
Upper (95%)
Lower (5%)
Upper (95%) Mean
2015 Update 2.19E-04 2.12E-03 9.56E-04
1998 0 150.1 4.40E-06 8.99E-03 1.15E-03
1999 1 185.4 3.75E-04 1.18E-02 3.20E-03
2000 0 144.8 4.45E-06 9.10E-03 1.16E-03
2001 0 151.6 4.38E-06 8.96E-03 1.15E-03
2002 0 140.2 4.50E-06 9.20E-03 1.18E-03
2003 0 152.1 4.38E-06 8.95E-03 1.15E-03
2004 0 139.4 4.51E-06 9.22E-03 1.18E-03
2005 0 133.4 4.57E-06 9.35E-03 1.20E-03
2006 0 136.5 4.54E-06 9.28E-03 1.19E-03
2007 0 125.7 1.54E-03 7.49E-04 3.16E-03 4.66E-06 9.53E-03 1.22E-03
2008 1 151.7 1.52E-03 8.25E-04 2.81E-03 4.04E-04 1.27E-02 3.45E-03
2009 0 138.1 1.50E-03 8.99E-04 2.52E-03 4.52E-06 9.25E-03 1.18E-03
2010 0 151.1 1.49E-03 9.60E-04 2.31E-03 4.39E-06 8.97E-03 1.15E-03
2011 0 152.1 1.47E-03 9.93E-04 2.18E-03 4.38E-06 8.95E-03 1.15E-03
2012 0 127.8 1.45E-03 9.85E-04 2.15E-03 4.64E-06 9.48E-03 1.21E-03
2013 0 157.8 1.44E-03 9.34E-04 2.21E-03 4.32E-06 8.84E-03 1.13E-03
2014 1 135.8 1.42E-03 8.58E-04 2.35E-03 4.19E-04 1.32E-02 3.58E-03
2015 0 139.8 1.41E-03 7.71E-04 2.56E-03 4.50E-06 9.21E-03 1.18E-03
2016 0 137.8 1.39E-03 6.85E-04 2.82E-03 4.53E-06 9.26E-03 1.18E-03
Total 3 2,750.9
Enhanced Component Performance Study 37 2016 Update
Emergency Diesel Generators April 2018
Table 20. Plot data for Figure 5, HPCS EDG FTLR industry trend
Year Failures Demands
Regression Curve Data Points Plot Trend Error Bar Points
Mean Lower (5%)
Upper (95%)
Lower (5%)
Upper (95%) Mean
2015 Update 4.25E-04 2.16E-03 1.15E-03
1998 0 105.5 7.49E-06 1.58E-02 2.02E-03
1999 1 130.1 6.46E-04 2.03E-02 5.54E-03
2000 0 120.7 7.05E-06 1.49E-02 1.90E-03
2001 0 124.7 6.94E-06 1.46E-02 1.87E-03
2002 1 124.2 6.61E-04 2.08E-02 5.66E-03
2003 0 128.5 6.85E-06 1.44E-02 1.84E-03
2004 1 129.3 6.48E-04 2.04E-02 5.56E-03
2005 0 119.3 7.09E-06 1.50E-02 1.91E-03
2006 0 124.3 6.95E-06 1.47E-02 1.87E-03
2007 0 117.5 2.12E-03 9.25E-04 4.85E-03 7.14E-06 1.51E-02 1.92E-03
2008 0 139.4 2.27E-03 1.12E-03 4.58E-03 6.58E-06 1.39E-02 1.77E-03
2009 0 118.2 2.43E-03 1.35E-03 4.39E-03 7.12E-06 1.50E-02 1.92E-03
2010 1 132.1 2.61E-03 1.57E-03 4.32E-03 6.42E-04 2.02E-02 5.50E-03
2011 0 137.1 2.79E-03 1.77E-03 4.41E-03 6.64E-06 1.40E-02 1.79E-03
2012 1 117.0 2.99E-03 1.88E-03 4.75E-03 6.79E-04 2.14E-02 5.82E-03
2013 0 137.1 3.21E-03 1.91E-03 5.38E-03 6.64E-06 1.40E-02 1.79E-03
2014 1 118.0 3.44E-03 1.87E-03 6.31E-03 6.77E-04 2.13E-02 5.80E-03
2015 1 127.0 3.68E-03 1.79E-03 7.57E-03 6.54E-04 2.06E-02 5.60E-03
2016 0 126.0 3.94E-03 1.68E-03 9.21E-03 6.91E-06 1.46E-02 1.86E-03
Total 7 2,376.1
Enhanced Component Performance Study 38 2016 Update
Emergency Diesel Generators April 2018
Table 21. Plot data for Figure 6, HPCS EDG FTR>1H industry trend
Year Failures Run Time
(hr)
Regression Curve Data Points Plot Trend Error Bar Points
Mean Lower (5%)
Upper (95%)
Lower (5%)
Upper (95%) Mean
2015 Update 4.25E-04 2.16E-03 1.15E-03
1998 0 204.7 4.21E-06 8.36E-03 1.07E-03
1999 1 322.7 3.00E-04 9.45E-03 2.56E-03
2000 0 231.6 3.98E-06 7.90E-03 1.01E-03
2001 0 222.6 4.05E-06 8.05E-03 1.03E-03
2002 0 203.5 4.22E-06 8.38E-03 1.07E-03
2003 0 261.9 3.75E-06 7.45E-03 9.53E-04
2004 0 202.6 4.22E-06 8.40E-03 1.07E-03
2005 1 257.9 3.38E-04 1.06E-02 2.88E-03
2006 0 254.4 3.80E-06 7.55E-03 9.67E-04
2007 0 189.3 9.76E-04 4.76E-04 2.00E-03 4.35E-06 8.64E-03 1.11E-03
2008 0 312.9 1.09E-03 5.91E-04 2.00E-03 3.42E-06 6.79E-03 8.69E-04
2009 0 262.6 1.21E-03 7.25E-04 2.01E-03 3.74E-06 7.44E-03 9.52E-04
2010 1 259.7 1.34E-03 8.72E-04 2.07E-03 3.37E-04 1.06E-02 2.87E-03
2011 0 287.5 1.49E-03 1.02E-03 2.20E-03 3.57E-06 7.10E-03 9.09E-04
2012 0 55.9 1.66E-03 1.13E-03 2.44E-03 6.17E-06 1.23E-02 1.57E-03
2013 1 171.6 1.85E-03 1.21E-03 2.83E-03 4.05E-04 1.27E-02 3.45E-03
2014 0 91.2 2.06E-03 1.25E-03 3.39E-03 5.55E-06 1.10E-02 1.41E-03
2015 0 114.4 2.29E-03 1.26E-03 4.15E-03 5.21E-06 1.04E-02 1.33E-03
2016 1 94.6 2.54E-03 1.26E-03 5.15E-03 4.92E-04 1.55E-02 4.20E-03
Total 5 4,001.7

Enhanced Component Performance Study 39 2016 Update
Emergency Diesel Generators April 2018
Table 22. Plot data for Figure 7, EPS EDG UA trend
Year UA Hours Critical Hours
Regression Curve Data Points Plot Trend Error Bar Points
Mean Lower (5%)
Upper (95%)
Lower (5%)
Upper (95%) Mean
2015 Update 4.44E-03 2.52E-02 1.48E-02
1998 21,235 1,874,166 2.21E-03 2.42E-02 1.07E-02
1999 22,769 2,005,223 2.67E-03 2.42E-02 1.11E-02
2000 18,409 2,042,467 2.27E-03 2.08E-02 9.53E-03
2001 19,233 2,075,373 1.54E-03 2.36E-02 9.72E-03
2002 24,631 2,093,196 2.31E-03 2.78E-02 1.20E-02
2003 28,961 2,047,203 1.91E-03 3.49E-02 1.39E-02
2004 29,617 2,099,392 1.24E-03 3.71E-02 1.36E-02
2005 26,350 2,070,016 2.81E-03 2.90E-02 1.29E-02
2006 28,713 2,083,212 1.73E-03 3.36E-02 1.33E-02
2007 34,106 2,104,023 1.59E-02 1.44E-02 1.75E-02 2.41E-03 3.99E-02 1.62E-02
2008 31,755 2,089,978 1.58E-02 1.45E-02 1.72E-02 2.87E-03 3.53E-02 1.52E-02
2009 33,204 2,059,429 1.57E-02 1.46E-02 1.68E-02 2.86E-03 3.79E-02 1.61E-02
2010 30,037 2,081,690 1.56E-02 1.47E-02 1.65E-02 3.32E-03 3.16E-02 1.44E-02
2011 36,401 2,023,478 1.55E-02 1.47E-02 1.63E-02 2.95E-03 4.18E-02 1.75E-02
2012 32,470 1,977,596 1.53E-02 1.46E-02 1.62E-02 3.17E-03 3.68E-02 1.60E-02
2013 30,642 2,007,371 1.52E-02 1.44E-02 1.62E-02 2.53E-03 3.34E-02 1.42E-02
2014 28,297 2,027,147 1.51E-02 1.41E-02 1.62E-02 3.15E-03 3.19E-02 1.43E-02
2015 30,721 2,008,809 1.50E-02 1.38E-02 1.63E-02 3.66E-03 3.36E-02 1.54E-02
2016 30,011 2,025,233 1.49E-02 1.35E-02 1.64E-02 3.07E-04 5.06E-02 1.52E-02
Total 537,562 38,795,002

Enhanced Component Performance Study 40 2016 Update
Emergency Diesel Generators April 2018
Table 23. Plot data for Figure 8, HPCS EDG UA trend
Year UA Hours Critical Hours
Regression Curve Data Points Plot Trend Error Bar Points
Mean Lower (5%)
Upper (95%)
Lower (5%)
Upper (95%) Mean
2015 Update 7.59E-03 1.58E-02 1.17E-02
1998 255 42,029 8.49E-04 1.16E-02 4.88E-03
1999 760 55,565 7.09E-04 3.99E-02 1.35E-02
2000 959 65,705 8.40E-04 4.33E-02 1.48E-02
2001 474 65,093 1.27E-03 1.69E-02 7.13E-03
2002 431 65,329 1.14E-03 1.59E-02 6.66E-03
2003 825 65,040 6.07E-03 2.11E-02 1.26E-02
2004 855 65,589 4.00E-03 2.63E-02 1.31E-02
2005 610 64,383 3.59E-03 1.75E-02 9.42E-03
2006 453 66,949 1.85E-03 1.40E-02 6.71E-03
2007 592 64,512 1.12E-02 7.84E-03 1.60E-02 1.92E-03 2.07E-02 9.14E-03
2008 861 65,262 1.15E-02 8.47E-03 1.55E-02 2.31E-03 3.24E-02 1.36E-02
2009 519 63,966 1.17E-02 9.10E-03 1.51E-02 2.54E-03 1.63E-02 8.13E-03
2010 1,050 67,158 1.20E-02 9.67E-03 1.49E-02 2.34E-03 3.80E-02 1.55E-02
2011 991 62,329 1.23E-02 1.01E-02 1.49E-02 4.37E-03 3.29E-02 1.58E-02
2012 815 64,557 1.26E-02 1.03E-02 1.52E-02 2.20E-03 2.92E-02 1.24E-02
2013 952 64,142 1.29E-02 1.04E-02 1.59E-02 2.33E-03 3.51E-02 1.45E-02
2014 1,012 66,677 1.32E-02 1.02E-02 1.69E-02 2.39E-03 3.66E-02 1.51E-02
2015 627 65,277 1.35E-02 9.96E-03 1.82E-02 1.40E-03 2.37E-02 9.56E-03
2016 884 62,704 1.38E-02 9.66E-03 1.96E-02 3.09E-03 3.03E-02 1.37E-02
Total 13,924 1,202,267
Enhanced Component Performance Study 41 2016 Update
Emergency Diesel Generators April 2018
Table 24. Plot data for Figure 9, EPS EDG unreliability trend
Year
Regression Curve Data Points Plot Trend Error Bar Points
Mean Lower (5%) Upper (95%) Lower (5%) Upper (95%) Mean
1998 1.22E-02 3.86E-02 2.22E-02
1999 6.59E-03 2.90E-02 1.58E-02
2000 1.25E-02 2.99E-02 2.01E-02
2001 9.23E-03 3.27E-02 1.79E-02
2002 1.22E-02 4.49E-02 2.39E-02
2003 1.81E-02 4.99E-02 3.09E-02
2004 1.53E-02 5.64E-02 3.05E-02
2005 2.14E-02 4.85E-02 3.14E-02
2006 1.07E-02 4.40E-02 2.23E-02
2007 3.71E-02 3.22E-02 4.27E-02 2.51E-02 7.52E-02 4.13E-02
2008 3.74E-02 3.32E-02 4.21E-02 2.25E-02 6.05E-02 3.74E-02
2009 3.77E-02 3.41E-02 4.17E-02 1.78E-02 5.87E-02 3.21E-02
2010 3.80E-02 3.49E-02 4.14E-02 2.17E-02 5.08E-02 3.37E-02
2011 3.83E-02 3.55E-02 4.14E-02 2.48E-02 6.97E-02 4.17E-02
2012 3.86E-02 3.58E-02 4.17E-02 2.40E-02 5.79E-02 3.87E-02
2013 3.90E-02 3.58E-02 4.24E-02 2.57E-02 6.32E-02 4.09E-02
2014 3.93E-02 3.55E-02 4.34E-02 3.08E-02 6.71E-02 4.63E-02
2015 3.96E-02 3.51E-02 4.46E-02 2.41E-02 5.78E-02 3.89E-02
2016 3.99E-02 3.47E-02 4.60E-02 1.83E-02 6.71E-02 3.59E-02

Enhanced Component Performance Study 42 2016 Update
Emergency Diesel Generators April 2018
Table 25. Plot data for Figure 10, HPCS EDG unreliability trend
Year
Regression Curve Data Points Plot Trend Error Bar Points
Mean Lower (5%) Upper (95%) Lower (5%) Upper (95%) Mean
1998 3.92E-03 3.65E-02 1.58E-02
1999 8.75E-03 7.09E-02 3.25E-02
2000 3.84E-03 7.28E-02 2.75E-02
2001 3.74E-03 3.25E-02 1.51E-02
2002 5.89E-03 4.46E-02 1.94E-02
2003 9.02E-03 3.34E-02 2.01E-02
2004 1.08E-02 4.96E-02 2.72E-02
2005 1.08E-02 5.55E-02 2.83E-02
2006 4.90E-03 3.40E-02 1.58E-02
2007 1.81E-02 1.26E-02 2.60E-02 3.29E-03 3.20E-02 1.54E-02
2008 1.95E-02 1.43E-02 2.65E-02 7.03E-03 4.38E-02 2.27E-02
2009 2.10E-02 1.62E-02 2.72E-02 5.29E-03 2.56E-02 1.45E-02
2010 2.26E-02 1.81E-02 2.81E-02 1.30E-02 7.44E-02 3.87E-02
2011 2.43E-02 1.99E-02 2.96E-02 8.24E-03 3.90E-02 2.19E-02
2012 2.62E-02 2.15E-02 3.19E-02 9.80E-03 5.79E-02 2.44E-02
2013 2.82E-02 2.26E-02 3.51E-02 1.14E-02 7.75E-02 3.59E-02
2014 3.03E-02 2.34E-02 3.93E-02 9.68E-03 6.75E-02 2.87E-02
2015 3.27E-02 2.40E-02 4.45E-02 8.32E-03 5.43E-02 2.40E-02
2016 3.52E-02 2.45E-02 5.06E-02 1.42E-02 8.03E-02 3.98E-02

Enhanced Component Performance Study 43 2016 Update
Emergency Diesel Generators April 2018
Table 26. Plot data for Figure 11, EPS and HPCS EDG start demands trend
Year Demands Reactor Years
Regression Curve Data Points Plot Trend Error Bar Points
Mean Lower (5%)
Upper (95%)
Lower (5%)
Upper (95%) Mean
1998 4,351 95.0 4.47E+01 4.70E+01 4.58E+01
1999 4,317 95.0 4.43E+01 4.66E+01 4.54E+01
2000 4,093 95.3 4.19E+01 4.41E+01 4.30E+01
2001 4,247 95.0 4.36E+01 4.59E+01 4.47E+01
2002 4,482 95.0 4.60E+01 4.84E+01 4.72E+01
2003 4,485 95.0 4.61E+01 4.84E+01 4.72E+01
2004 4,475 95.3 4.58E+01 4.81E+01 4.70E+01
2005 4,516 95.0 4.64E+01 4.87E+01 4.75E+01
2006 4,507 95.0 4.63E+01 4.86E+01 4.74E+01
2007 4,412 95.0 4.58E+01 4.43E+01 4.74E+01 4.53E+01 4.76E+01 4.64E+01
2008 4,480 95.3 4.58E+01 4.45E+01 4.72E+01 4.59E+01 4.82E+01 4.70E+01
2009 4,362 95.0 4.58E+01 4.47E+01 4.69E+01 4.48E+01 4.71E+01 4.59E+01
2010 4,250 95.0 4.58E+01 4.48E+01 4.68E+01 4.36E+01 4.59E+01 4.47E+01
2011 4,286 95.0 4.58E+01 4.49E+01 4.67E+01 4.40E+01 4.63E+01 4.51E+01
2012 4,161 95.3 4.58E+01 4.49E+01 4.67E+01 4.26E+01 4.48E+01 4.37E+01
2013 4,258 92.6 4.58E+01 4.48E+01 4.67E+01 4.48E+01 4.72E+01 4.60E+01
2014 4,216 91.0 4.58E+01 4.46E+01 4.69E+01 4.52E+01 4.75E+01 4.63E+01
2015 4,169 90.0 4.57E+01 4.44E+01 4.71E+01 4.51E+01 4.75E+01 4.63E+01
2016 4,177 90.0 4.57E+01 4.42E+01 4.74E+01 4.52E+01 4.76E+01 4.64E+01
Total 82,245 1,789.6

Enhanced Component Performance Study 44 2016 Update
Emergency Diesel Generators April 2018
Table 27. Plot data for Figure 12, EPS and HPCS EDG load and run ≤1-hour demands trend
Year Demands Reactor Years
Regression Curve Data Points Plot Trend Error Bar Points
Mean Lower (5%)
Upper (95%)
Lower (5%)
Upper (95%) Mean
1998 3,908 95.0 4.01E+01 4.22E+01 4.11E+01
1999 3,881 95.0 3.98E+01 4.19E+01 4.08E+01
2000 3,809 95.3 3.89E+01 4.11E+01 4.00E+01
2001 3,904 95.0 4.00E+01 4.22E+01 4.11E+01
2002 3,762 95.0 3.85E+01 4.07E+01 3.96E+01
2003 3,919 95.0 4.02E+01 4.23E+01 4.12E+01
2004 3,951 95.3 4.04E+01 4.26E+01 4.15E+01
2005 3,904 95.0 4.00E+01 4.22E+01 4.11E+01
2006 3,882 95.0 3.98E+01 4.20E+01 4.09E+01
2007 3,761 95.0 3.95E+01 3.84E+01 4.05E+01 3.85E+01 4.07E+01 3.96E+01
2008 3,865 95.3 3.96E+01 3.87E+01 4.05E+01 3.95E+01 4.17E+01 4.06E+01
2009 3,785 95.0 3.97E+01 3.89E+01 4.04E+01 3.88E+01 4.09E+01 3.98E+01
2010 3,709 95.0 3.98E+01 3.91E+01 4.04E+01 3.80E+01 4.01E+01 3.90E+01
2011 3,747 95.0 3.99E+01 3.93E+01 4.05E+01 3.84E+01 4.05E+01 3.94E+01
2012 3,684 95.3 4.00E+01 3.94E+01 4.06E+01 3.76E+01 3.97E+01 3.87E+01
2013 3,712 92.6 4.01E+01 3.94E+01 4.07E+01 3.90E+01 4.12E+01 4.01E+01
2014 3,719 91.0 4.02E+01 3.94E+01 4.10E+01 3.98E+01 4.20E+01 4.09E+01
2015 3,659 90.0 4.03E+01 3.94E+01 4.12E+01 3.96E+01 4.18E+01 4.07E+01
2016 3,653 90.0 4.04E+01 3.93E+01 4.15E+01 3.95E+01 4.17E+01 4.06E+01
Total 72,212 1,789.6

Enhanced Component Performance Study 45 2016 Update
Emergency Diesel Generators April 2018
Table 28. Plot data for Figure 13, EPS and HPCS EDG run hours (greater than 1H) trend
Year Run
Hours Reactor Years
Regression Curve Data Points Plot Trend Error Bar Points
Mean Lower (5%)
Upper (95%)
Lower (5%)
Upper (95%) Mean
1998 6,744 95.0 6.96E+01 7.24E+01 7.10E+01
1999 7,282 95.0 7.52E+01 7.82E+01 7.67E+01
2000 8,321 95.3 8.58E+01 8.89E+01 8.73E+01
2001 8,624 95.0 8.92E+01 9.24E+01 9.08E+01
2002 9,033 95.0 9.34E+01 9.67E+01 9.51E+01
2003 8,235 95.0 8.51E+01 8.83E+01 8.67E+01
2004 8,174 95.3 8.43E+01 8.74E+01 8.58E+01
2005 8,817 95.0 9.12E+01 9.45E+01 9.28E+01
2006 7,908 95.0 8.17E+01 8.48E+01 8.32E+01
2007 7,958 95.0 9.13E+01 7.21E+01 1.16E+02 8.22E+01 8.53E+01 8.38E+01
2008 7,946 95.3 8.47E+01 6.94E+01 1.03E+02 8.19E+01 8.50E+01 8.34E+01
2009 7,999 95.0 7.85E+01 6.64E+01 9.28E+01 8.27E+01 8.58E+01 8.42E+01
2010 7,643 95.0 7.28E+01 6.29E+01 8.42E+01 7.89E+01 8.20E+01 8.04E+01
2011 8,691 95.0 6.74E+01 5.86E+01 7.76E+01 8.99E+01 9.31E+01 9.15E+01
2012 4,327 95.3 6.25E+01 5.37E+01 7.28E+01 4.43E+01 4.66E+01 4.54E+01
2013 4,993 92.6 5.79E+01 4.86E+01 6.92E+01 5.27E+01 5.52E+01 5.39E+01
2014 4,213 91.0 5.37E+01 4.35E+01 6.63E+01 4.51E+01 4.75E+01 4.63E+01
2015 4,815 90.0 4.98E+01 3.88E+01 6.40E+01 5.22E+01 5.48E+01 5.35E+01
2016 4,563 90.0 4.62E+01 3.44E+01 6.19E+01 4.95E+01 5.20E+01 5.07E+01
Total 136,283 1,789.6

Enhanced Component Performance Study 46 2016 Update
Emergency Diesel Generators April 2018
Table 29. Plot data for Figure 14, EPS and HPCS EDG FTS events trend
Year Failures Reactor Years
Regression Curve Data Points Plot Trend Error Bar Points
Mean Lower (5%)
Upper (95%)
Lower (5%)
Upper (95%) Mean
1998 18 95.0 1.22E-01 2.77E-01 1.88E-01
1999 9 95.0 5.13E-02 1.66E-01 9.63E-02
2000 12 95.3 7.39E-02 2.03E-01 1.26E-01
2001 12 95.0 7.40E-02 2.03E-01 1.27E-01
2002 10 95.0 5.87E-02 1.78E-01 1.06E-01
2003 17 95.0 1.14E-01 2.64E-01 1.77E-01
2004 14 95.3 8.95E-02 2.27E-01 1.47E-01
2005 17 95.0 1.14E-01 2.64E-01 1.77E-01
2006 9 95.0 5.13E-02 1.66E-01 9.63E-02
2007 11 95.0 1.25E-01 7.89E-02 1.98E-01 6.63E-02 1.91E-01 1.17E-01
2008 9 95.3 1.26E-01 8.56E-02 1.87E-01 5.11E-02 1.65E-01 9.60E-02
2009 14 95.0 1.28E-01 9.21E-02 1.77E-01 8.97E-02 2.28E-01 1.47E-01
2010 15 95.0 1.29E-01 9.78E-02 1.71E-01 9.77E-02 2.40E-01 1.57E-01
2011 18 95.0 1.31E-01 1.02E-01 1.68E-01 1.22E-01 2.77E-01 1.88E-01
2012 15 95.3 1.32E-01 1.03E-01 1.69E-01 9.74E-02 2.40E-01 1.57E-01
2013 6 92.6 1.34E-01 1.01E-01 1.76E-01 3.06E-02 1.30E-01 6.75E-02
2014 13 91.0 1.35E-01 9.77E-02 1.87E-01 8.53E-02 2.25E-01 1.43E-01
2015 13 90.0 1.37E-01 9.29E-02 2.01E-01 8.62E-02 2.27E-01 1.44E-01
2016 13 90.0 1.38E-01 8.76E-02 2.18E-01 8.62E-02 2.27E-01 1.44E-01
Total 245 1,789.6

Enhanced Component Performance Study 47 2016 Update
Emergency Diesel Generators April 2018
Table 30. Plot data for Figure 15, EPS EDG FTLR events trend
Year Failures Reactor Years
Regression Curve Data Points Plot Trend Error Bar Points
Mean Lower (5%)
Upper (95%)
Lower (5%)
Upper (95%) Mean
1998 14 95.0 9.02E-02 2.29E-01 1.48E-01
1999 5 95.0 2.33E-02 1.14E-01 5.60E-02
2000 8 95.3 4.40E-02 1.53E-01 8.63E-02
2001 13 95.0 8.22E-02 2.17E-01 1.37E-01
2002 14 95.0 9.02E-02 2.29E-01 1.48E-01
2003 15 95.0 9.82E-02 2.41E-01 1.58E-01
2004 10 95.3 5.89E-02 1.79E-01 1.07E-01
2005 14 95.0 9.02E-02 2.29E-01 1.48E-01
2006 15 95.0 9.82E-02 2.41E-01 1.58E-01
2007 21 95.0 1.90E-01 1.53E-01 2.36E-01 1.47E-01 3.14E-01 2.19E-01
2008 16 95.3 1.81E-01 1.51E-01 2.17E-01 1.06E-01 2.53E-01 1.68E-01
2009 18 95.0 1.72E-01 1.48E-01 2.01E-01 1.23E-01 2.78E-01 1.88E-01
2010 11 95.0 1.64E-01 1.44E-01 1.88E-01 6.67E-02 1.92E-01 1.17E-01
2011 16 95.0 1.57E-01 1.38E-01 1.78E-01 1.06E-01 2.54E-01 1.68E-01
2012 16 95.3 1.49E-01 1.31E-01 1.70E-01 1.06E-01 2.53E-01 1.68E-01
2013 12 92.6 1.42E-01 1.22E-01 1.66E-01 7.63E-02 2.09E-01 1.31E-01
2014 12 91.0 1.36E-01 1.14E-01 1.62E-01 7.76E-02 2.13E-01 1.33E-01
2015 13 90.0 1.29E-01 1.05E-01 1.60E-01 8.67E-02 2.28E-01 1.45E-01
2016 11 90.0 1.23E-01 9.61E-02 1.58E-01 7.02E-02 2.02E-01 1.23E-01
Total 254 1,789.6
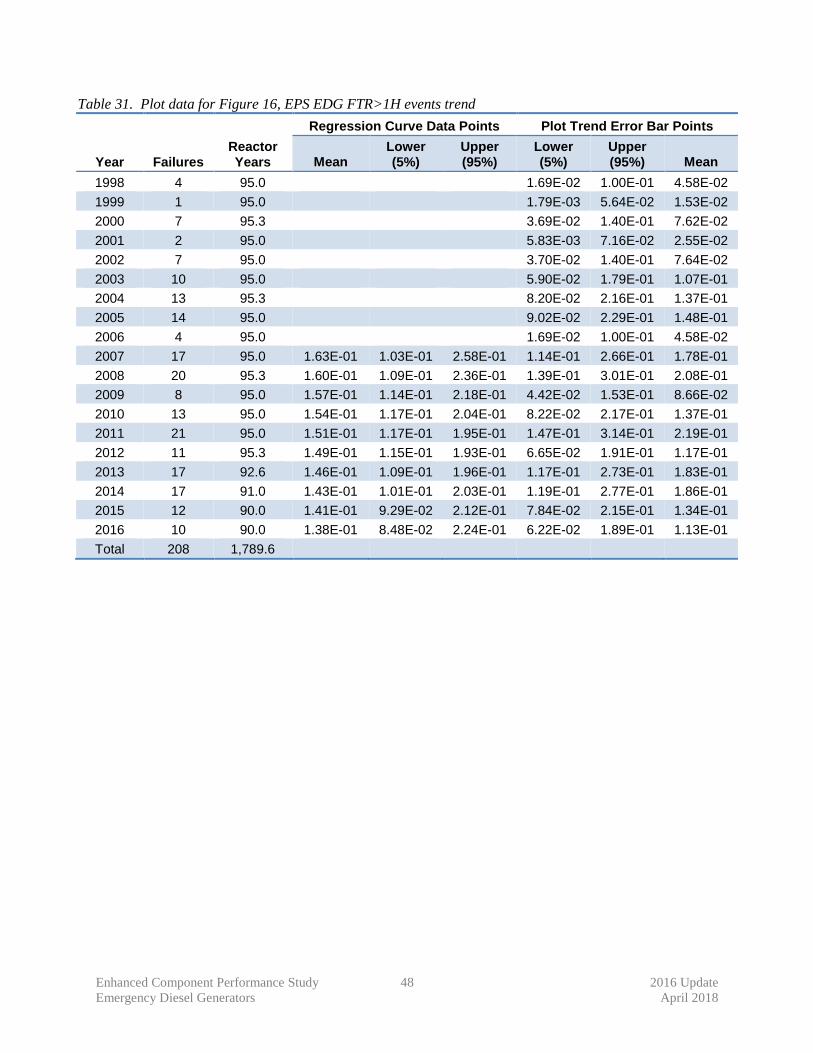
Enhanced Component Performance Study 48 2016 Update
Emergency Diesel Generators April 2018
Table 31. Plot data for Figure 16, EPS EDG FTR>1H events trend
Year Failures Reactor Years
Regression Curve Data Points Plot Trend Error Bar Points
Mean Lower (5%)
Upper (95%)
Lower (5%)
Upper (95%) Mean
1998 4 95.0 1.69E-02 1.00E-01 4.58E-02
1999 1 95.0 1.79E-03 5.64E-02 1.53E-02
2000 7 95.3 3.69E-02 1.40E-01 7.62E-02
2001 2 95.0 5.83E-03 7.16E-02 2.55E-02
2002 7 95.0 3.70E-02 1.40E-01 7.64E-02
2003 10 95.0 5.90E-02 1.79E-01 1.07E-01
2004 13 95.3 8.20E-02 2.16E-01 1.37E-01
2005 14 95.0 9.02E-02 2.29E-01 1.48E-01
2006 4 95.0 1.69E-02 1.00E-01 4.58E-02
2007 17 95.0 1.63E-01 1.03E-01 2.58E-01 1.14E-01 2.66E-01 1.78E-01
2008 20 95.3 1.60E-01 1.09E-01 2.36E-01 1.39E-01 3.01E-01 2.08E-01
2009 8 95.0 1.57E-01 1.14E-01 2.18E-01 4.42E-02 1.53E-01 8.66E-02
2010 13 95.0 1.54E-01 1.17E-01 2.04E-01 8.22E-02 2.17E-01 1.37E-01
2011 21 95.0 1.51E-01 1.17E-01 1.95E-01 1.47E-01 3.14E-01 2.19E-01
2012 11 95.3 1.49E-01 1.15E-01 1.93E-01 6.65E-02 1.91E-01 1.17E-01
2013 17 92.6 1.46E-01 1.09E-01 1.96E-01 1.17E-01 2.73E-01 1.83E-01
2014 17 91.0 1.43E-01 1.01E-01 2.03E-01 1.19E-01 2.77E-01 1.86E-01
2015 12 90.0 1.41E-01 9.29E-02 2.12E-01 7.84E-02 2.15E-01 1.34E-01
2016 10 90.0 1.38E-01 8.48E-02 2.24E-01 6.22E-02 1.89E-01 1.13E-01
Total 208 1,789.6

Enhanced Component Performance Study 49 2016 Update
Emergency Diesel Generators April 2018
9. REFERENCES
[1] J. C. Lane, "NRC Operating Experience (OpE) Programs," Office of Nuclear Regulatory Research,
15 July 2015. [Online]. Available: http://pbadupws.nrc.gov/docs/ML1518/ML15189A345.pdf.
[Accessed 2015].
[2] United States Nuclear Regulatory Comission, "Regulatory Assessment Performance Indicator
Guideline," 31 August 2013. [Online]. Available:
pbadupws.nrc.gov/docs/ML1326/ML13261A116.pdf.
[3] J. R. Houghton, H. G. Hamzehee, "Component Performance Study, 1987-1998," NUREG-1715, U.S.
Nuclear Regulatory Commission, 2000.
[4] United States Nuclear Regulatory Commission, "Component Reliability Data Sheets Update 2015,"
February 2017. [Online]. Available:
http://nrcoe.inl.gov/resultsdb/publicdocs/AvgPerf/ComponentReliabilityDataSheets2015.pdf.
[5] S. A. Eide, T. E. Wierman, C. D. Gentillon, D. M. Rasmuson and C. L. Atwood, "Industry-Average
Performance for Components and Initiating Events at U.S. Commercial Nuclear Power Plants,"
NUREG/CR-6928, 2007.
[6] C. D. Gentillion, "Overview and Reference Document for Operational Experience Results and
Databases Trending," February 2012. [Online]. Available:
https://nrcoe.inel.gov/resultsdb/publicdocs/Overview-and-Reference.pdf.
[7] C. L. Atwood, J. L. LaChance, H. F. Martz, D. J. Anderson, M. Englehardt, D. Whitehead and T.
Wheeler, "Handbook of Parameter Estimation for Probabilistic Risk Assessment," NUREG/CR-6823,
SAND2003-3348P, 2003.