englishtranslation amultivariablepulpbrightnesscontrolof
TRANSCRIPT
English Translation
A Multivariable Pulp Brightness Control ofECF Bleaching Process by Model Predic-tive Control*1
Yoshitatsu Mori*3
Takahiro Yamamoto
Pulp and Paper Innovation Center, Oji Holdings Corporation.*2
Masahiro WatanabeAdvanced Process Control Section, Vigilant Plant Services Center,Yokogawa Electric Corporation.
Takahiro YamamotoTechnical Solution Dept.4, Technical Solution & Engineering Division,Yokogawa Solution Service Corporation.
AbstractIn the pulp and paper processes, to improve more cost reduction and more quality stability have been re-
quired at any time. However the pulp process response has long delay time and many mutual interference ele-
ments that affect each other between control variables’ responses;therefore it is well known that Kraft pulp
bleaching process is one of the most difficult processes to control automatically.
In the meanwhile,“Model Predictive Control(MPC)”has been developed as a new control function to oper-
ate complex multivariable processes systematically in good conditions from days of1980s, and is called and
known as“Advanced Process Control(APC)”, too. And, this new control system is reported a lot, it brought
fruitful economical outcome by optimizing its process conditions and by controlling multiple points reasonably as
observing whole process conditions.
In this paper, we show an example to apply MPC system to the hardwood pulp(LBKP)brightness control
for ECF(Elementary Chlorine Free)bleaching process of Kraft pulp and, at the same time, new“K value control”
utilized for to prevent serious“discoloration trouble”of paper sheet which has been recognized recently. The
trouble is, to break out strong“yellowing trouble(color reversion)”when paper rolls are exposed in the heat
and high moisture environment during long period for example in warehouses etc. after paper making.
Furthermore, in addition to use many special sensors in this control system, they are“hard sensors”, such as
pulp brightness sensor, residual chlorine consistency sensor and pulp Kappa number sensor etc.,“Soft sensor”
functions are also used together with MPC at the same time.
In this system, eight“soft sensors”which utilized multiple linear regression equation models for pulp
brightness and residual chlorine consistency etc. are installed in the points where sensors are not equipped or
where measurement is done by hand analysis, at fixed intervals, for the reasons of the requirement of more high
―precision measurement values and so on.
*1This article was presented“The56th―2013JAPAN TAPPI Annual Meeting”(9―11October,2013)*21―10―6Shinonome, Koto―ku, Tokyo135―8558, Japan*3E―mail:morq1yoshitatsu@oji―gr.com
Yoshitatsu Mori Masahiro Watanabe
1184
― 88 ― JAPAN TAPPI JOURNAL Vol.68, No.10
1. Introduction
In the pulp and paper process operations, it is usually re-
quired to improve the stability of pulp stocks’ quality and
to reduce the production costs further. In this paper, we
show a multivariable pulp brightness control system that
we developed utilizing the“Model predictive control
(MPC)”and about the result of the control effects. Inciden-
tally, in this system, we targeted a Kraft pulp’s hardwood
ECF(Elementary Chlorine Free)pulp bleaching process
(LBKP).
Although this MPC control system mainly consist of the
conventional pulp quality functions of pulp brightness, re-
sidual chlorine consistency and pH controls functions etc.
that have been known from long before, in addition to
those we introduced new function utilizing“K value con-trol”to prevent serious discoloration trouble(color rever-
sion trouble)of paper sheet that has been recognized re-
cently, after the bleach method had been converted to
“ECF”from conventional“Chlorine bleaching”.1),2) The
trouble breaks out strong“yellowing trouble”of the paper
products when paper rolls had been exposed in heat and
high moisture environment during long periods after pa-
per making, for example, in warehouses of the summer.
2. Kraft pulp bleaching process
Kraft pulp stocks have dark brown colors. To attain
higher brightness of pulp stocks, they are bleached in oxy-
gen delignification stage first and next in the multi―se-
quential bleach processes using several bleach chemicals.
Recently, as the multi―sequential bleach process, ECF
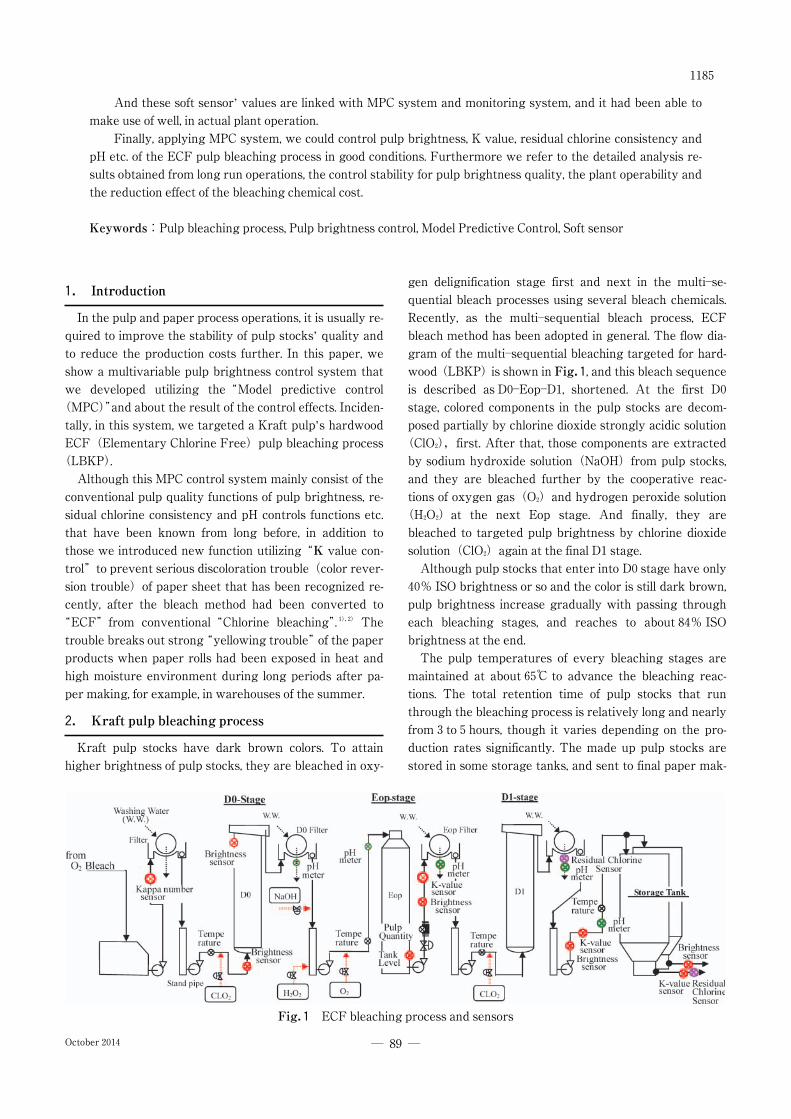
bleach method has been adopted in general. The flow dia-
gram of the multi―sequential bleaching targeted for hard-
wood(LBKP)is shown in Fig.1, and this bleach sequenceis described as D0―Eop―D1, shortened. At the first D0
stage, colored components in the pulp stocks are decom-
posed partially by chlorine dioxide strongly acidic solution
(ClO2),first. After that, those components are extracted
by sodium hydroxide solution(NaOH)from pulp stocks,
and they are bleached further by the cooperative reac-
tions of oxygen gas(O2)and hydrogen peroxide solution
(H2O2)at the next Eop stage. And finally, they are
bleached to targeted pulp brightness by chlorine dioxide
solution(ClO2)again at the final D1stage.
Although pulp stocks that enter into D0stage have only
40% ISO brightness or so and the color is still dark brown,pulp brightness increase gradually with passing through
each bleaching stages, and reaches to about84% ISObrightness at the end.
The pulp temperatures of every bleaching stages are
maintained at about65℃ to advance the bleaching reac-
tions. The total retention time of pulp stocks that run
through the bleaching process is relatively long and nearly
from3to5hours, though it varies depending on the pro-
duction rates significantly. The made up pulp stocks are
stored in some storage tanks, and sent to final paper mak-
And these soft sensor’ values are linked with MPC system and monitoring system, and it had been able to
make use of well, in actual plant operation.
Finally, applying MPC system, we could control pulp brightness, K value, residual chlorine consistency and
pH etc. of the ECF pulp bleaching process in good conditions. Furthermore we refer to the detailed analysis re-
sults obtained from long run operations, the control stability for pulp brightness quality, the plant operability and
the reduction effect of the bleaching chemical cost.
Keywords:Pulp bleaching process, Pulp brightness control, Model Predictive Control, Soft sensor
Fig.1 ECF bleaching process and sensors
1185
― 89 ―October2014
ing processes according to demands, afterward. In pulp
bleaching process we are required to stabilize pulp quali-
ties, and lots of efforts are paid to reduce chemical costs as
much as possible, at the same time.
3. Model predictive control
We applied“Model predictive control(MPC)”method
to this pulp bleaching control.
MPC has been developed as a new control function from
days of1980s by Dr. C.R. Cutler who had an engineer
working in Shell Oil co. of U. S. A. et al. to control and opti-
mize targeted complex processes in good conditions. MPC
is a multivariable control system that aimed to stabilize
multi―input and multi―output complex process, controlling
multiple operation points at the same time considering the
whole process states. And this control method is known as
“Advanced Process Control(APC)”system, too.
This MPC system has been widely introduced in the
chemical industry in Japan from about20years before,
and it had been known well that this new control system
brought fruitful economical effects by optimizing the proc-
ess conditions. However, the introduction of MPC to the
domestic pulp & paper industry has scarcely proceeded.
The variables of pulp bleaching process have long delay
times and many mutual interference elements that inter-
act each other with the plural control responses. However,
even though the bleach processes have such many difficult
problems, it was expected by introducing new MPC
method will bring lots of merits.
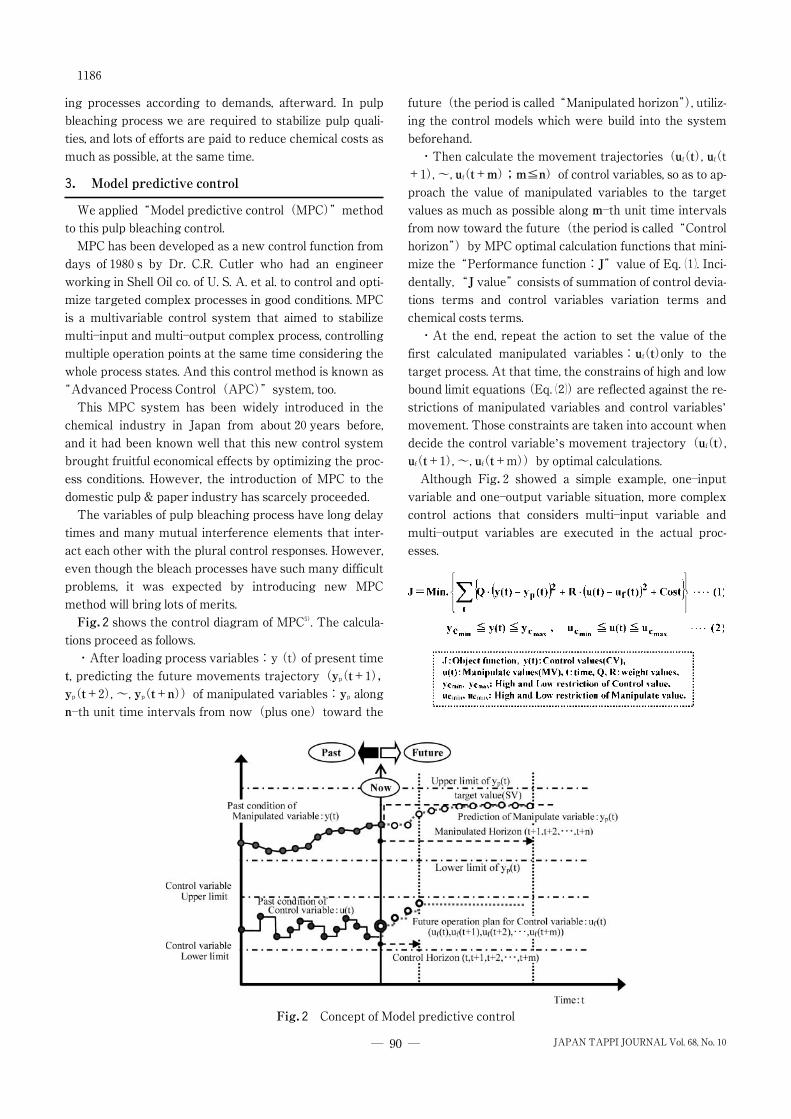
Fig.2shows the control diagram of MPC5). The calcula-tions proceed as follows.
・After loading process variables:y(t)of present time
t, predicting the future movements trajectory(yp(t+1),yp(t+2), ~, yp(t+n))of manipulated variables:yp alongn―th unit time intervals from now(plus one)toward the
future(the period is called“Manipulated horizon”), utiliz-
ing the control models which were build into the system
beforehand.
・Then calculate the movement trajectories(uf(t), uf(t+1), ~, uf(t+m);m≦n)of control variables, so as to ap-proach the value of manipulated variables to the target
values as much as possible along m―th unit time intervalsfrom now toward the future(the period is called“Control
horizon”)by MPC optimal calculation functions that mini-
mize the“Performance function:J”value of Eq. �. Inci-dentally,“J value”consists of summation of control devia-tions terms and control variables variation terms and
chemical costs terms.
・At the end, repeat the action to set the value of the
first calculated manipulated variables:uf(t)only to thetarget process. At that time, the constrains of high and low
bound limit equations(Eq.�)are reflected against the re-strictions of manipulated variables and control variables’
movement. Those constraints are taken into account when
decide the control variable’s movement trajectory(uf(t),uf(t+1), ~, uf(t+m))by optimal calculations.Although Fig.2 showed a simple example, one―input
variable and one―output variable situation, more complex
control actions that considers multi―input variable and
multi―output variables are executed in the actual proc-
esses.
Fig.2 Concept of Model predictive control
1186
― 90 ― JAPAN TAPPI JOURNAL Vol.68, No.10
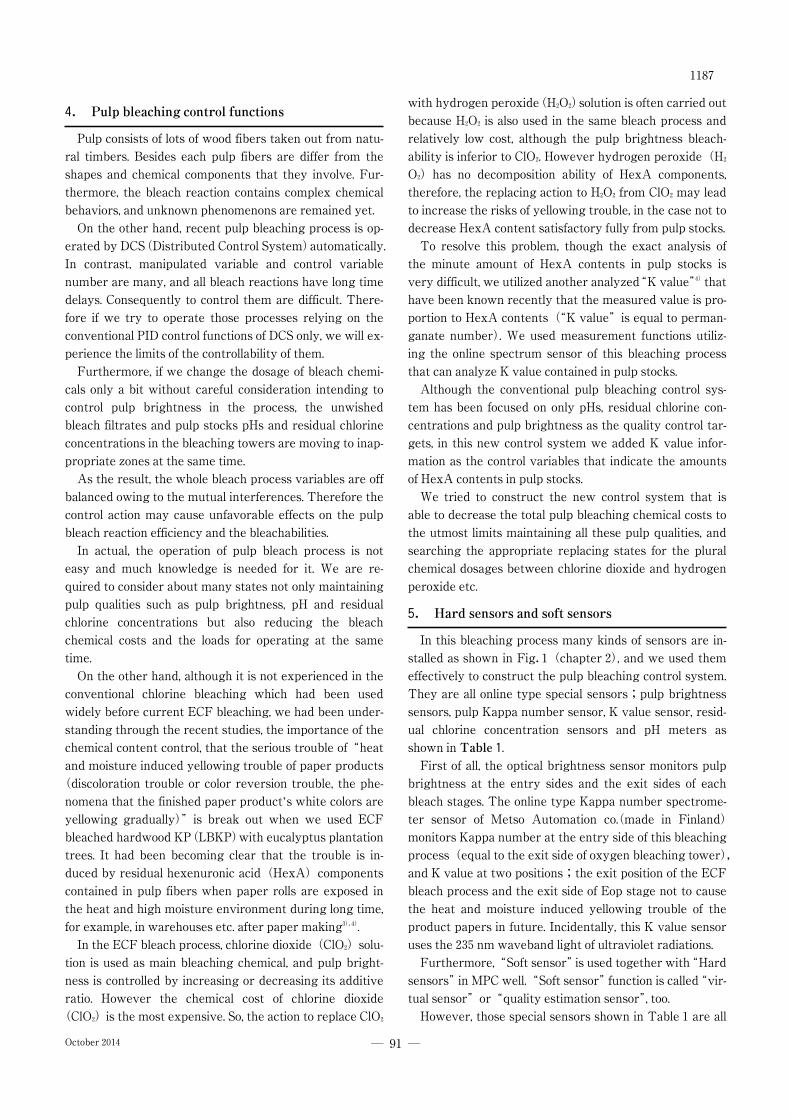
4. Pulp bleaching control functions
Pulp consists of lots of wood fibers taken out from natu-
ral timbers. Besides each pulp fibers are differ from the
shapes and chemical components that they involve. Fur-
thermore, the bleach reaction contains complex chemical
behaviors, and unknown phenomenons are remained yet.
On the other hand, recent pulp bleaching process is op-
erated by DCS(Distributed Control System)automatically.
In contrast, manipulated variable and control variable
number are many, and all bleach reactions have long time
delays. Consequently to control them are difficult. There-
fore if we try to operate those processes relying on the
conventional PID control functions of DCS only, we will ex-
perience the limits of the controllability of them.
Furthermore, if we change the dosage of bleach chemi-
cals only a bit without careful consideration intending to
control pulp brightness in the process, the unwished
bleach filtrates and pulp stocks pHs and residual chlorine
concentrations in the bleaching towers are moving to inap-
propriate zones at the same time.
As the result, the whole bleach process variables are off
balanced owing to the mutual interferences. Therefore the
control action may cause unfavorable effects on the pulp
bleach reaction efficiency and the bleachabilities.
In actual, the operation of pulp bleach process is not
easy and much knowledge is needed for it. We are re-
quired to consider about many states not only maintaining
pulp qualities such as pulp brightness, pH and residual
chlorine concentrations but also reducing the bleach
chemical costs and the loads for operating at the same
time.
On the other hand, although it is not experienced in the
conventional chlorine bleaching which had been used
widely before current ECF bleaching, we had been under-
standing through the recent studies, the importance of the
chemical content control, that the serious trouble of“heat
and moisture induced yellowing trouble of paper products
(discoloration trouble or color reversion trouble, the phe-
nomena that the finished paper product’s white colors are
yellowing gradually)”is break out when we used ECF
bleached hardwood KP(LBKP)with eucalyptus plantation
trees. It had been becoming clear that the trouble is in-
duced by residual hexenuronic acid(HexA)components
contained in pulp fibers when paper rolls are exposed in
the heat and high moisture environment during long time,
for example, in warehouses etc. after paper making3),4).
In the ECF bleach process, chlorine dioxide(ClO2)solu-
tion is used as main bleaching chemical, and pulp bright-
ness is controlled by increasing or decreasing its additive
ratio. However the chemical cost of chlorine dioxide
(ClO2)is the most expensive. So, the action to replace ClO2
with hydrogen peroxide(H2O2)solution is often carried out
because H2O2 is also used in the same bleach process and
relatively low cost, although the pulp brightness bleach-
ability is inferior to ClO2. However hydrogen peroxide(H2O2)has no decomposition ability of HexA components,
therefore, the replacing action to H2O2 from ClO2may lead
to increase the risks of yellowing trouble, in the case not to
decrease HexA content satisfactory fully from pulp stocks.
To resolve this problem, though the exact analysis of
the minute amount of HexA contents in pulp stocks is
very difficult, we utilized another analyzed“K value”4)that
have been known recently that the measured value is pro-
portion to HexA contents(“K value”is equal to perman-
ganate number). We used measurement functions utiliz-
ing the online spectrum sensor of this bleaching process
that can analyze K value contained in pulp stocks.
Although the conventional pulp bleaching control sys-
tem has been focused on only pHs, residual chlorine con-
centrations and pulp brightness as the quality control tar-
gets, in this new control system we added K value infor-
mation as the control variables that indicate the amounts
of HexA contents in pulp stocks.
We tried to construct the new control system that is
able to decrease the total pulp bleaching chemical costs to
the utmost limits maintaining all these pulp qualities, and
searching the appropriate replacing states for the plural
chemical dosages between chlorine dioxide and hydrogen
peroxide etc.
5. Hard sensors and soft sensors
In this bleaching process many kinds of sensors are in-
stalled as shown in Fig.1(chapter2), and we used them
effectively to construct the pulp bleaching control system.
They are all online type special sensors;pulp brightness
sensors, pulp Kappa number sensor, K value sensor, resid-
ual chlorine concentration sensors and pH meters as
shown in Table1.First of all, the optical brightness sensor monitors pulp
brightness at the entry sides and the exit sides of each
bleach stages. The online type Kappa number spectrome-
ter sensor of Metso Automation co.(made in Finland)
monitors Kappa number at the entry side of this bleaching
process(equal to the exit side of oxygen bleaching tower),
and K value at two positions;the exit position of the ECF
bleach process and the exit side of Eop stage not to cause
the heat and moisture induced yellowing trouble of the
product papers in future. Incidentally, this K value sensor
uses the235nm waveband light of ultraviolet radiations.
Furthermore,“Soft sensor”is used together with“Hard
sensors”in MPC well.“Soft sensor”function is called“vir-
tual sensor”or“quality estimation sensor”, too.
However, those special sensors shown in Table1are all
1187
― 91 ―October2014
very expensive ones, therefore the numbers of hard sen-
sors installed in the process are limited by themselves.
Therefore, we introduced“Soft sensor”that utilized mul-
tiple linear regression model for the points that had not in-
stalled any hard sensors, or the hand analysis measure-
ment works are needed during periodic intervals for the
higher accuracy measurement value requirements.
At first, adopt the hand analysis measurements data as
the object variable values. Then decide the explanatory
variables. Find out some adequate variables that reveal
strong correlations among the whole process variables,
and at the same time, decide proper regression models
that the structure is as simple as possible, based on the sta-
tistics analysis, taken into account the characteristics of
physically and chemically properties of the process re-
sponses. Finally decide all explanatory variable coeffi-
cients of the regression models.
In this system, we had made eight points’ soft sensor
functions. Among them, six are no information points
where hard sensors are not installed and the hand analysis
works are necessary during periodic intervals, and the
rest two are the important points where more reliable and
more accurate measurement values are required from
process operation although hard sensors are installed as
the monitor sensor in actual(Table2).For example, the first item of Table2is the multiple re-
gression model for“Eop stage exit side pulp brightness”.
This model used four explanatory variables, and considers
data time delays L1,2,3,4(min.)as shown in Eq.�. The pa-rameter t is time, and a1,2,3,4 are regression model coeffi-cients and b is constant term.
Eop stage exit side pulp brightness(t)=a1・(D0stage entry side pulp brightness(t-L1))+a2・(D0stage ClO2 additive ratio(t-L2))+a3・(Eop stageNaOH additive ratio(t-L3))+a4・(Eop stage H2O2 addi-tive ratio(t-L4))+b ……�
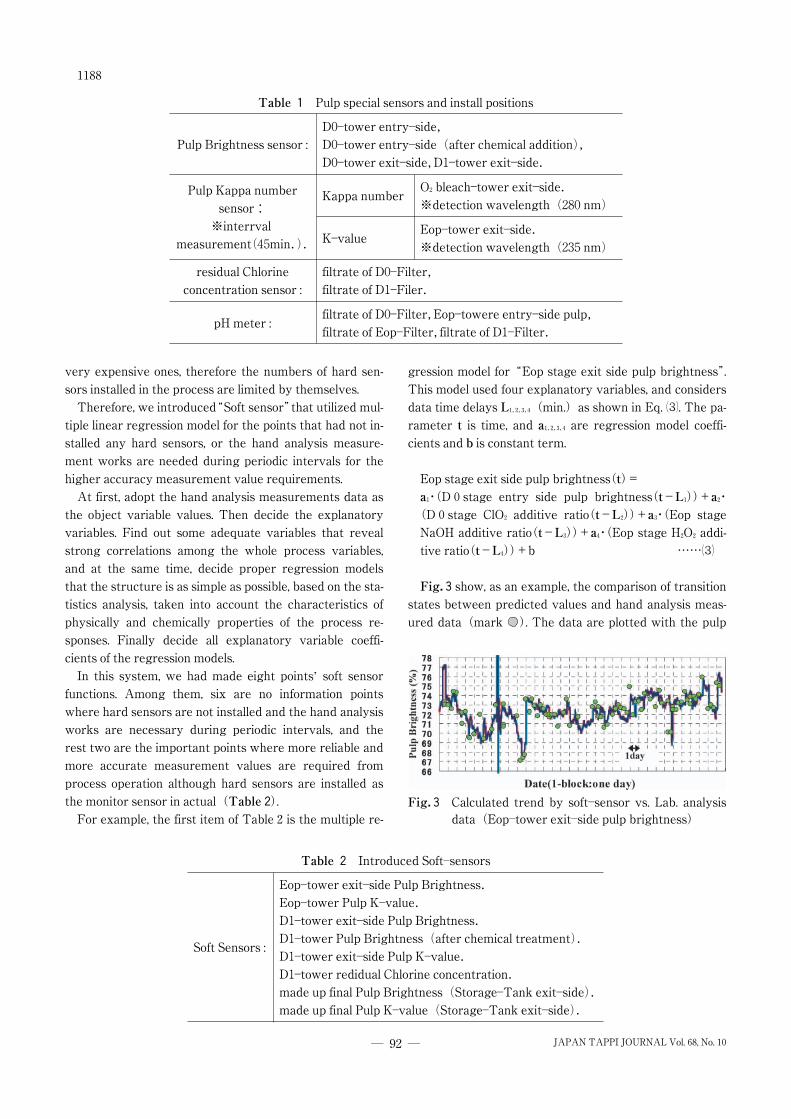
Fig.3show, as an example, the comparison of transitionstates between predicted values and hand analysis meas-
ured data(mark ). The data are plotted with the pulp
Table1 Pulp special sensors and install positions
Pulp Brightness sensor :
D0―tower entry―side,D0―tower entry―side(after chemical addition),D0―tower exit―side,D1―tower exit―side.
Pulp Kappa number
sensor:※interrval
measurement(45min.).
Kappa numberO2bleach―tower exit―side.※detection wavelength(280nm)
K―valueEop―tower exit―side.※detection wavelength(235nm)
residual Chlorine
concentration sensor :
filtrate of D0―Filter,filtrate of D1―Filer.
pH meter :filtrate of D0―Filter,Eop―towere entry―side pulp,filtrate of Eop―Filter,filtrate of D1―Filter.
Table2 Introduced Soft―sensors
Soft Sensors :
Eop―tower exit―side Pulp Brightness.Eop―tower Pulp K―value.D1―tower exit―side Pulp Brightness.D1―tower Pulp Brightness(after chemical treatment).D1―tower exit―side Pulp K―value.D1―tower redidual Chlorine concentration.made up final Pulp Brightness(Storage―Tank exit―side).made up final Pulp K―value(Storage―Tank exit―side).
Fig.3 Calculated trend by soft―sensor vs. Lab. analysisdata(Eop―tower exit―side pulp brightness)
1188
― 92 ― JAPAN TAPPI JOURNAL Vol.68, No.10
brightness as ordinate axis and the date as abscissa axis
(one division is one day). The predicted conditions calcu-
lated by the regression model are satisfactory.
However, the predicting accuracies that calculated by
the original regression models are gradually deteriorating
with time.
To prevent this problem, we integrated a correction
function for updating, to input hand analysis data with the
sampling time information to the soft sensor model from
DCS, which are measured during periodic intervals, for ex-
ample every few hours or every few days, in some cases
depending on the measuring species. And correcting the
regression model’s constant term value:b sequentially.Through this correction functions, we had been able to
maintain the accuracy of the regression model’s prediction
values in good condition always7),8).
These calculated predict values by soft sensors are im-
ported to MPC system as control variables either to utilize
not only for monitoring system but for control MPC effec-
tively. By making use of soft sensor functions fully with
MPC, we were able to achieve this system as the usable
ones that were similar to the real process operation condi-
tions by operators from the aspects of both control and
monitoring functions.
6. System configurations of pulp bleaching control
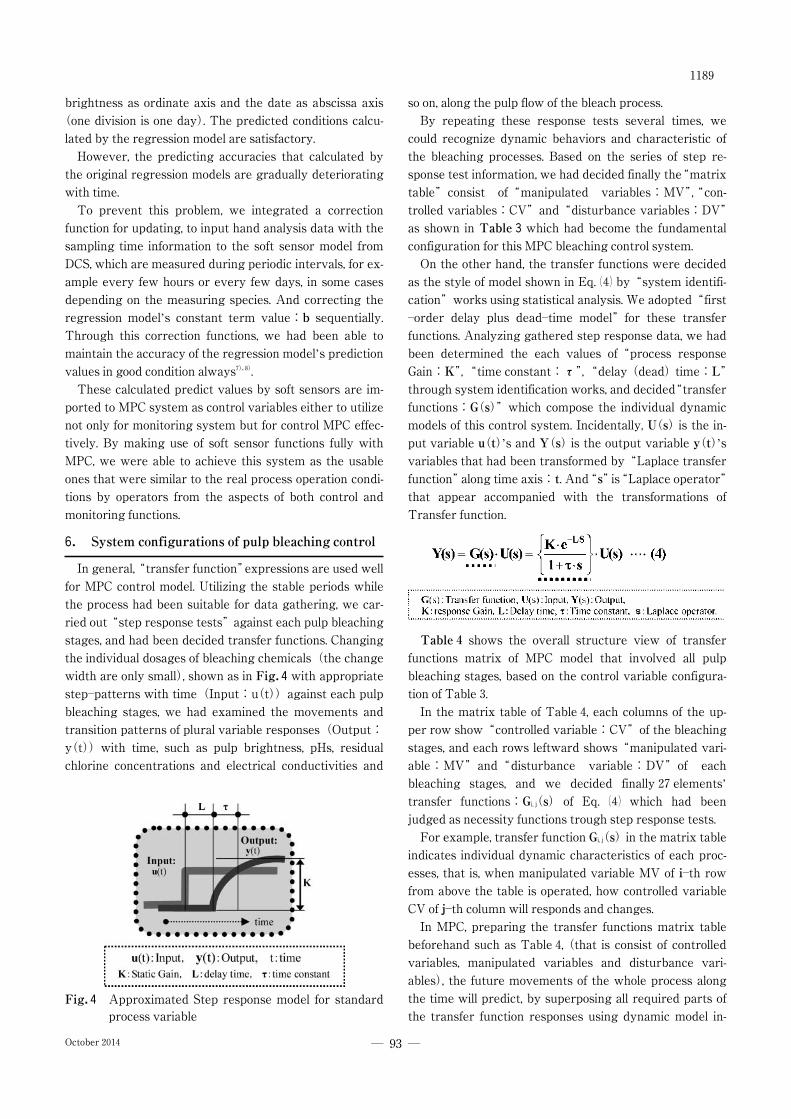
In general,“transfer function”expressions are used well
for MPC control model. Utilizing the stable periods while
the process had been suitable for data gathering, we car-
ried out“step response tests”against each pulp bleaching
stages, and had been decided transfer functions. Changing
the individual dosages of bleaching chemicals(the change
width are only small), shown as in Fig.4with appropriatestep―patterns with time(Input:u(t))against each pulp
bleaching stages, we had examined the movements and
transition patterns of plural variable responses(Output:
y(t))with time, such as pulp brightness, pHs, residual
chlorine concentrations and electrical conductivities and
so on, along the pulp flow of the bleach process.
By repeating these response tests several times, we
could recognize dynamic behaviors and characteristic of
the bleaching processes. Based on the series of step re-
sponse test information, we had decided finally the“matrix
table”consist of“manipulated variables:MV”,“con-
trolled variables:CV”and“disturbance variables:DV”
as shown in Table3which had become the fundamentalconfiguration for this MPC bleaching control system.
On the other hand, the transfer functions were decided
as the style of model shown in Eq. � by“system identifi-cation”works using statistical analysis. We adopted“first
―order delay plus dead―time model”for these transfer
functions. Analyzing gathered step response data, we had
been determined the each values of“process response
Gain:K”,“time constant:τ”,“delay(dead)time:L”through system identification works, and decided“transfer
functions:G(s)”which compose the individual dynamicmodels of this control system. Incidentally, U(s)is the in-put variable u(t)’s and Y(s)is the output variable y(t)’svariables that had been transformed by“Laplace transfer
function”along time axis:t. And“s”is“Laplace operator”that appear accompanied with the transformations of
Transfer function.
Table4 shows the overall structure view of transferfunctions matrix of MPC model that involved all pulp
bleaching stages, based on the control variable configura-
tion of Table3.
In the matrix table of Table4, each columns of the up-
per row show“controlled variable:CV”of the bleaching
stages, and each rows leftward shows“manipulated vari-
able:MV”and“disturbance variable:DV”of each
bleaching stages, and we decided finally27elements’
transfer functions:Gi, j(s)of Eq. � which had been
judged as necessity functions trough step response tests.
For example, transfer function Gi, j(s)in the matrix tableindicates individual dynamic characteristics of each proc-
esses, that is, when manipulated variable MV of i―th rowfrom above the table is operated, how controlled variable
CV of j―th column will responds and changes.In MPC, preparing the transfer functions matrix table
beforehand such as Table4,(that is consist of controlled
variables, manipulated variables and disturbance vari-
ables), the future movements of the whole process along
the time will predict, by superposing all required parts of
the transfer function responses using dynamic model in-Fig.4 Approximated Step response model for standard
process variable
1189
― 93 ―October2014
formation.
At the end, we have been deciding five control actions of
the manipulated variables:MV by the optimal calcula-
tions, those are four bleaching chemical dosages and one
pulp stock flow rate, in this MPC pulp bleaching control
system.
And“Cost―term”of Performance function:J(Eq.�),which is used in this optimal calculations, involves total
summation of control value deviation terms and manipu-
late value deviation terms plus cost term that consist of
three main bleaching chemical costs;ClO2, H2O2, NaOH in
the bleaching process.
By the optimal function, the total bleaching chemical
costs are calculated by the unit price of each bleaching
chemicals(yens/kg)which were input to the system be-forehand, and then control system will calculate and decid-
ing the optimal control actions to minimize them automati-
cally.
List other characteristic points about this MPC pulp
bleaching control system, next.
① While an unique values are set as the target values
(SV)in DCS operations, in MPC system, the opera-
tively band width with higher limit and lower limits
have to be set against all controlled variables and ma-
nipulated variables by operators. Taking into account
all the restriction settings, MPC system searches opti-
mal points to minimize the Performance function
value:J within the movable areas, and approachingclosely to the optimal points little by little automati-
cally.
② We made“ON/OFF”switches against all controlledvariables:CV, manipulated variables:MV and dis-
turbance variables:DV shown in Table4that opera-
tors can set from DCS monitor windows.
By preparing these switch functions, operators
were available to use MPC as long as possible shut-
ting off only the relevant area function among the
whole control functions, avoiding complete control
shut downs, while even if unstable period, or partial
accident timing of hard sensors or inspection period of
the instruments and so on.
③ In pulp bleaching process, the pulp retention time
required to pass through each bleaching tower varies
considerably accompanied by the change of pulp pro-
duction amounts. However the values of time con-
stants:τ and delay times:L cannot edit directlywith the MPC tool. Therefore, we prepared two mod-
els, “high production mode”and“low production
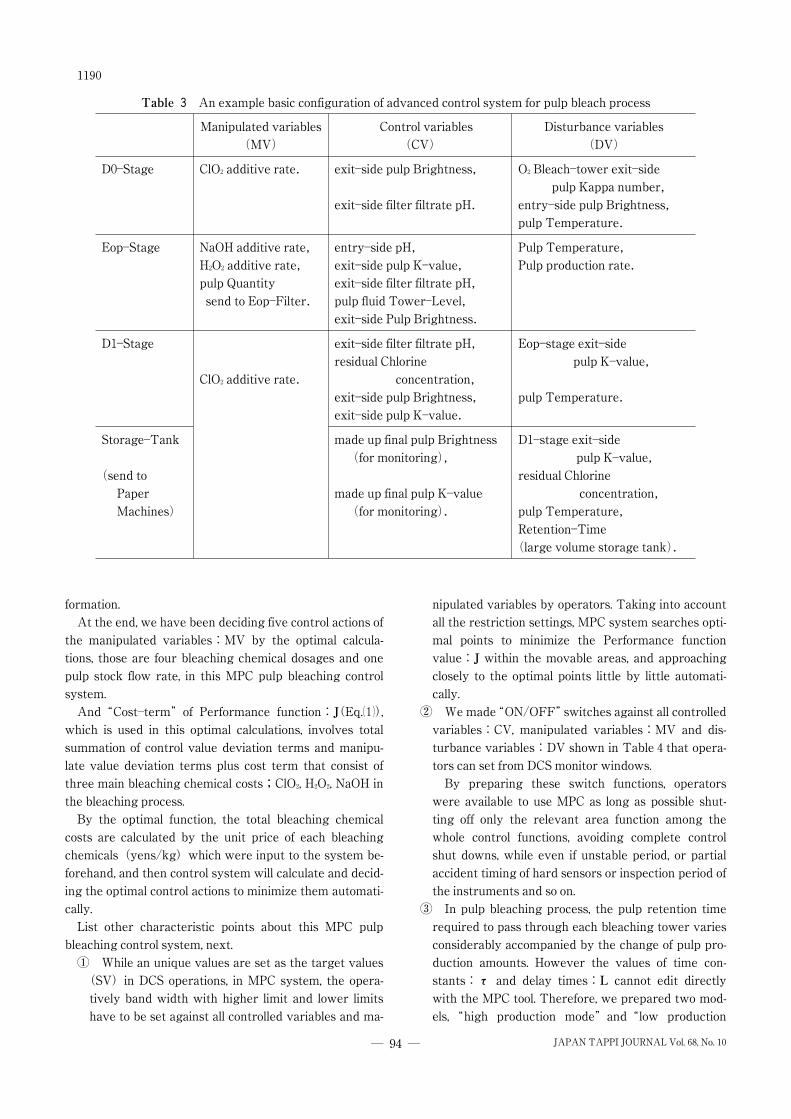
Table3 An example basic configuration of advanced control system for pulp bleach process
Manipulated variables
(MV)Control variables
(CV)Disturbance variables
(DV)
D0―Stage ClO2additive rate. exit―side pulp Brightness,
exit―side filter filtrate pH.
O2Bleach―tower exit―sidepulp Kappa number,
entry―side pulp Brightness,pulp Temperature.
Eop―Stage NaOH additive rate,H2O2additive rate,pulp Quantity
send to Eop―Filter.
entry―side pH,exit―side pulp K―value,exit―side filter filtrate pH,pulp fluid Tower―Level,exit―side Pulp Brightness.
Pulp Temperature,Pulp production rate.
D1―Stage
ClO2additive rate.
exit―side filter filtrate pH,residual Chlorine
concentration,exit―side pulp Brightness,exit―side pulp K―value.
Eop―stage exit―sidepulp K―value,
pulp Temperature.
Storage―Tank
(send toPaper
Machines)
made up final pulp Brightness
(for monitoring),
made up final pulp K―value(for monitoring).
D1―stage exit―sidepulp K―value,
residual Chlorine
concentration,pulp Temperature,Retention―Time(large volume storage tank).
1190
― 94 ― JAPAN TAPPI JOURNAL Vol.68, No.10
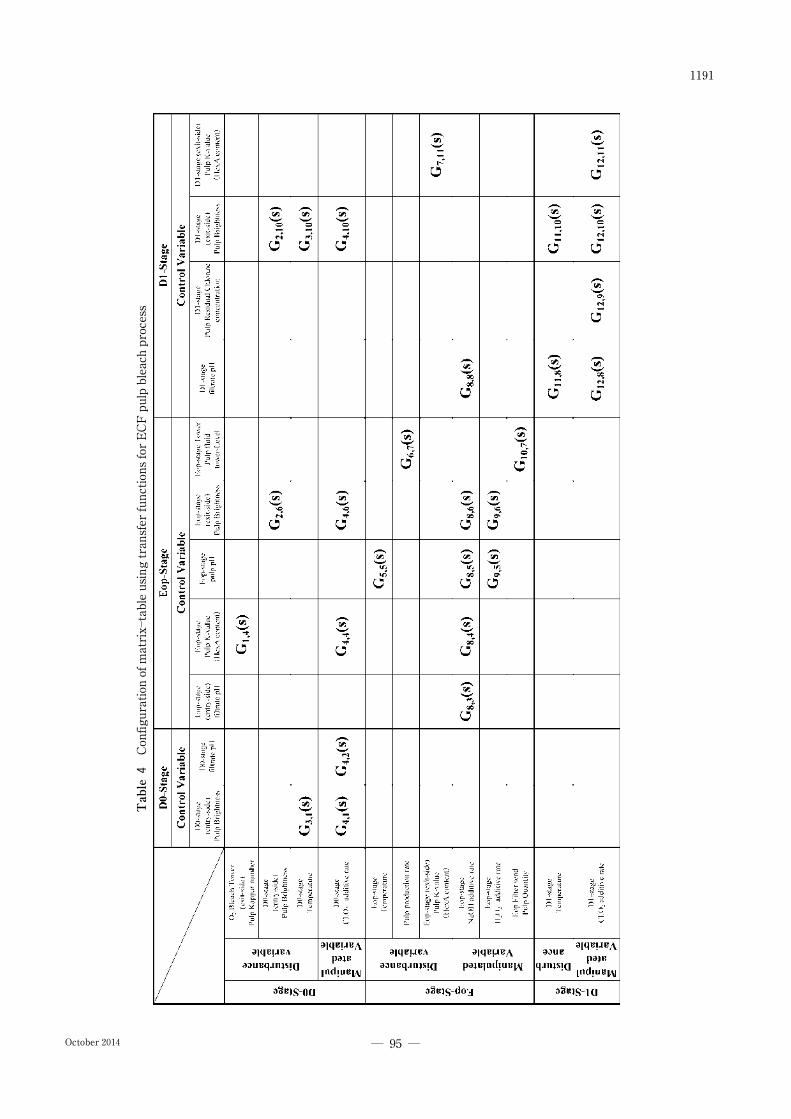
Table4Configurationofmatrix―tableusingtransferfunctionsforECFpulpbleachprocess
1191
― 95 ―October2014
mode”into this system, so we were able to switch the
transfer function groups automatically, accompanied
by the operation conditions.
④ As the hardware for this control system, we intro-
duced“Windows―PC”that connected with DCS.
Installed MPC software tools that will show at next
⑤, we had integrated the control application system
in it. We had prepared MPC control and monitor win-
dows among DCS operation windows, so, operators
had been able to execute MPC functions as if they are
operating it from DCS directly.
Windows―PC is loading the process data from DCS,
and executing MPC control calculations. Setting the
plural optimal control output values(manipulated
variables:MV)as the SV―values to the PID control-
lers of DCS with set point control mode, and proceed
pulp bleaching control. In this MPC system, we
adopted every one minutes for the control intervals.
And the predictive control calculations are executed
as follows.
The prediction time length as the“control horizon”
that correspond to the dynamic trajectory of the”con-
trol amount uf(t), uf(t+1), ~, uf(t+m)”are calcu-lated3.7hours(m=220steps)from now toward the
future, and as the”manipulate horizon”correspond to
the dynamic trajectory of the”manipulate amount:
yp(t+1), yp(t+2), ~, yp(t+n)”are calculated about15hours(m=879steps)from now(plus one)toward
the future, as shown in Fig.2. However, notice that
the first calculated value of”control amount:uf(t)”only is output to the actual process as the exactly con-
trol value at the end, as shown in Fig.2with the dou-
ble circle. By repeating these MPC operations every
one minutes, the optimality of the control conditions
are renewed and maintained continually.
⑤ The packaged software tools for MPC functions are
provided by several venders. In this system, we used
MPC and Soft―sensor tools provided by Yokogawa
Electric Corporation and Shell Oil Company(Table5)9).
7. Control effects and control conditions
We have been continuing to examine this pulp bleaching
control states by MPC through the daily reports data and
process trends. We summarize about the analyzed control
effects, the variances of pulp bleaching chemical costs and
about the stabilities of pulp qualities and control states.
7.1 Bleaching chemical costThe pulp bleaching chemical cost data that calculated
every day are checked as one of the important data that
are reported as the daily operational results, and they are
regarded as the most reliable master data in the mill. How-
ever, the simple arithmetic comparison of these data con-
tains serious problems in actual, because the pulp produc-
tion amount, the pulp brightness that enters to the bleach-
ing process and the target value of the final pulp bright-
ness etc. are varies frequently according to the daily plant
operations.
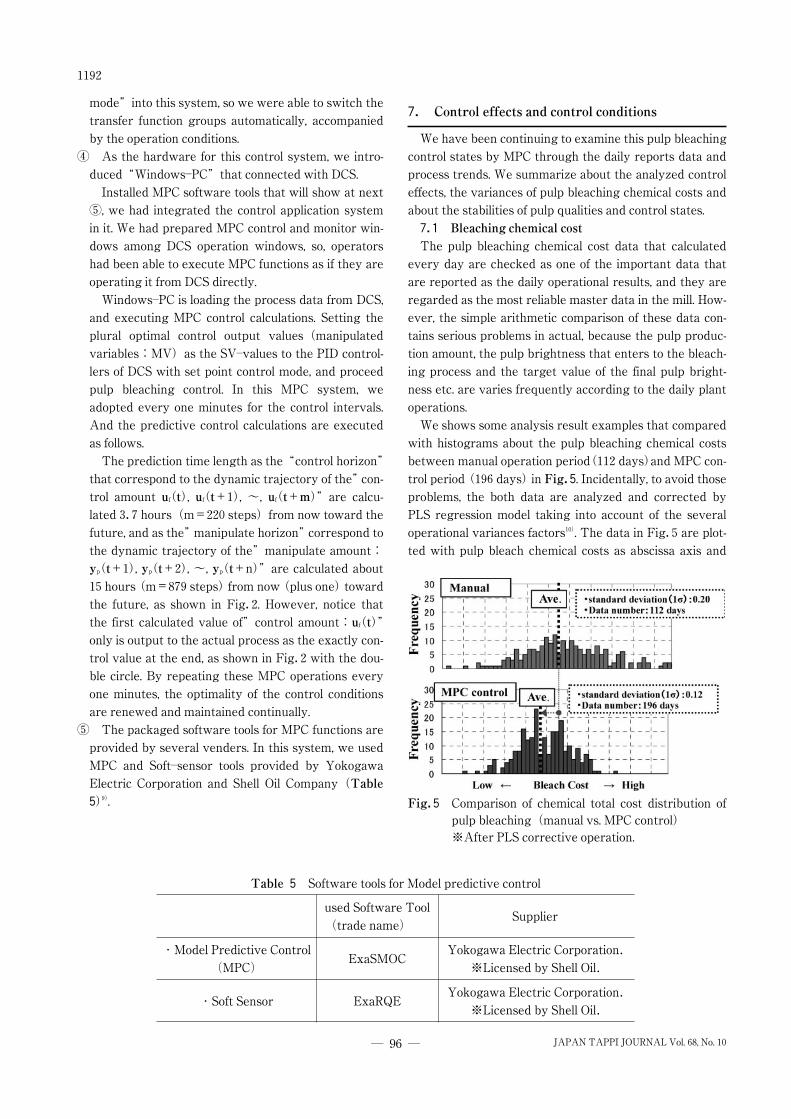
We shows some analysis result examples that compared
with histograms about the pulp bleaching chemical costs
between manual operation period(112days)and MPC con-
trol period(196days)in Fig.5. Incidentally, to avoid thoseproblems, the both data are analyzed and corrected by
PLS regression model taking into account of the several
operational variances factors10). The data in Fig.5are plot-
ted with pulp bleach chemical costs as abscissa axis and
Table5 Software tools for Model predictive control
used Software Tool
(trade name)Supplier
・Model Predictive Control(MPC)
ExaSMOCYokogawa Electric Corporation.※Licensed by Shell Oil.
・Soft Sensor ExaRQEYokogawa Electric Corporation.※Licensed by Shell Oil.
Fig.5 Comparison of chemical total cost distribution ofpulp bleaching(manual vs. MPC control)※After PLS corrective operation.
1192
― 96 ― JAPAN TAPPI JOURNAL Vol.68, No.10
the value of frequencies as ordinate axis. Additionally the
both display scales are all same.
In Fig.5 of the upper histogram of manual operation
modes, pulp bleach chemical cost data are distributed and
stretched wide around right side directions where costs
are expensive regions. On the other hand, for the lower
histogram of auto controlled by MPC, many data are dis-
tributed around from midst to left side areas, where costs
are lower regions. And the lower histogram’s cost reduc-
tion is recognized clearly. At the end, from0.009to0.11
yens/pulp―kg costs deduction of pulp bleach chemicalsduring auto―controlled by MPC had been analyzed
through the long―term investigations compared with man-
ual operation period, although the value fluctuates slightly
according to periods.
This reduction width is corresponding to about3.5% ofpulp bleaching chemical costs, and the values agreed with
the investigated values of the other industries’ applica-
tions6).
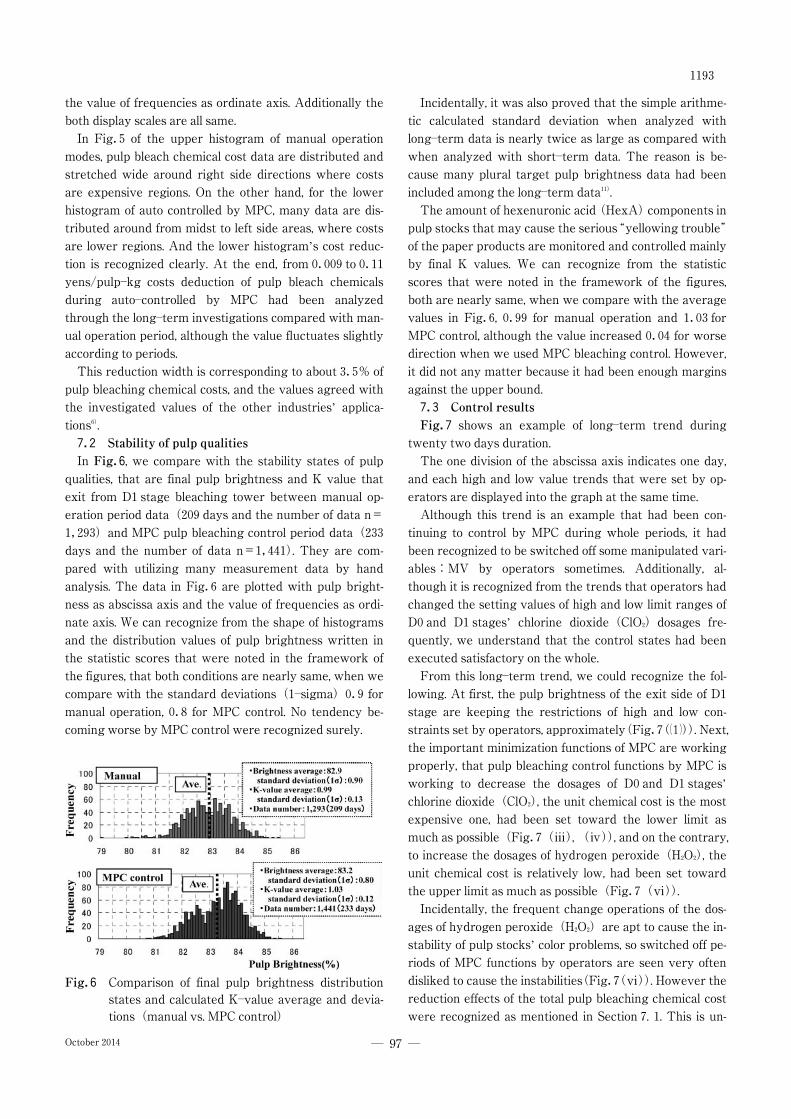
7.2 Stability of pulp qualitiesIn Fig.6, we compare with the stability states of pulp
qualities, that are final pulp brightness and K value that
exit from D1stage bleaching tower between manual op-
eration period data(209days and the number of data n=
1,293)and MPC pulp bleaching control period data(233
days and the number of data n=1,441). They are com-
pared with utilizing many measurement data by hand
analysis. The data in Fig.6are plotted with pulp bright-
ness as abscissa axis and the value of frequencies as ordi-
nate axis. We can recognize from the shape of histograms
and the distribution values of pulp brightness written in
the statistic scores that were noted in the framework of
the figures, that both conditions are nearly same, when we
compare with the standard deviations(1―sigma)0.9for
manual operation,0.8for MPC control. No tendency be-
coming worse by MPC control were recognized surely.
Incidentally, it was also proved that the simple arithme-
tic calculated standard deviation when analyzed with
long―term data is nearly twice as large as compared with
when analyzed with short―term data. The reason is be-
cause many plural target pulp brightness data had been
included among the long―term data11).
The amount of hexenuronic acid(HexA)components in
pulp stocks that may cause the serious“yellowing trouble”
of the paper products are monitored and controlled mainly
by final K values. We can recognize from the statistic
scores that were noted in the framework of the figures,
both are nearly same, when we compare with the average
values in Fig.6,0.99 for manual operation and1.03for
MPC control, although the value increased0.04for worse
direction when we used MPC bleaching control. However,
it did not any matter because it had been enough margins
against the upper bound.
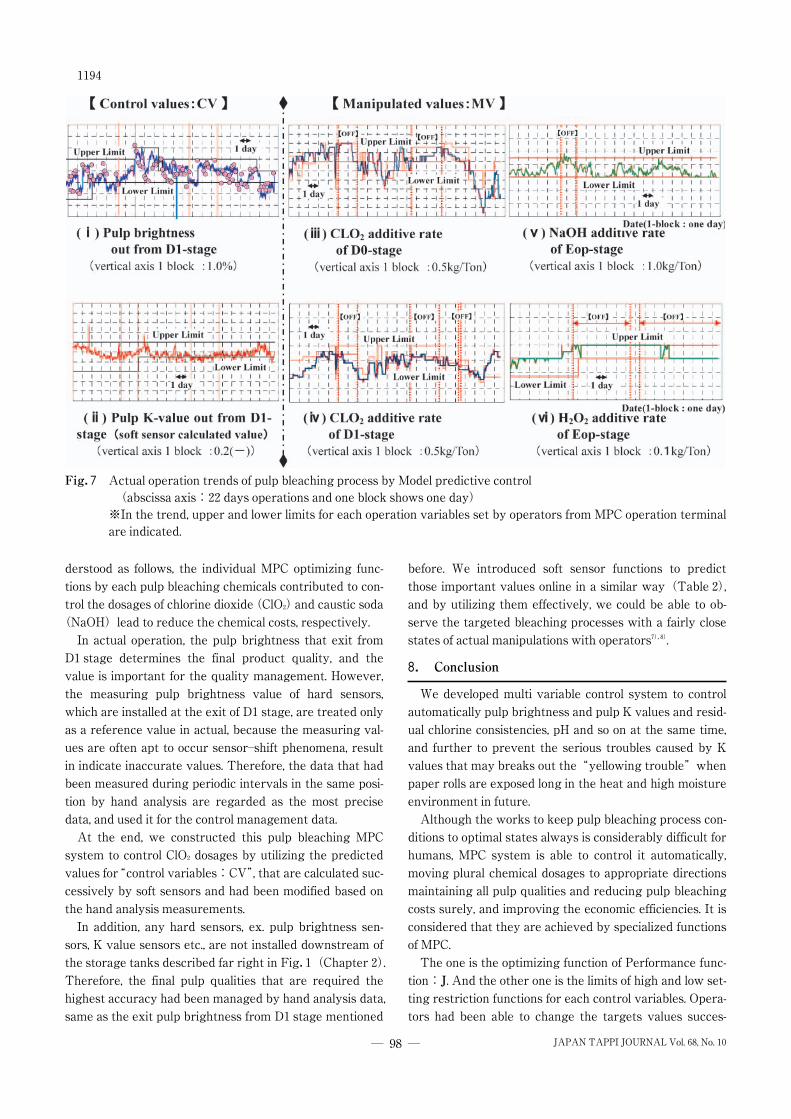
7.3 Control resultsFig.7 shows an example of long―term trend during
twenty two days duration.
The one division of the abscissa axis indicates one day,
and each high and low value trends that were set by op-
erators are displayed into the graph at the same time.
Although this trend is an example that had been con-
tinuing to control by MPC during whole periods, it had
been recognized to be switched off some manipulated vari-
ables:MV by operators sometimes. Additionally, al-
though it is recognized from the trends that operators had
changed the setting values of high and low limit ranges of
D0and D1stages’ chlorine dioxide(ClO2)dosages fre-
quently, we understand that the control states had been
executed satisfactory on the whole.
From this long―term trend, we could recognize the fol-
lowing. At first, the pulp brightness of the exit side of D1
stage are keeping the restrictions of high and low con-
straints set by operators, approximately(Fig.7(�)). Next,the important minimization functions of MPC are working
properly, that pulp bleaching control functions by MPC is
working to decrease the dosages of D0and D1stages’
chlorine dioxide(ClO2), the unit chemical cost is the most
expensive one, had been set toward the lower limit as
much as possible(Fig.7(�),(�)), and on the contrary,to increase the dosages of hydrogen peroxide(H2O2), the
unit chemical cost is relatively low, had been set toward
the upper limit as much as possible(Fig.7(�)).Incidentally, the frequent change operations of the dos-
ages of hydrogen peroxide(H2O2)are apt to cause the in-
stability of pulp stocks’ color problems, so switched off pe-
riods of MPC functions by operators are seen very often
disliked to cause the instabilities(Fig.7(�)). However thereduction effects of the total pulp bleaching chemical cost
were recognized as mentioned in Section7.1. This is un-
Fig.6 Comparison of final pulp brightness distributionstates and calculated K―value average and devia-tions(manual vs. MPC control)
1193
― 97 ―October2014
derstood as follows, the individual MPC optimizing func-
tions by each pulp bleaching chemicals contributed to con-
trol the dosages of chlorine dioxide(ClO2)and caustic soda
(NaOH)lead to reduce the chemical costs, respectively.
In actual operation, the pulp brightness that exit from
D1stage determines the final product quality, and the
value is important for the quality management. However,
the measuring pulp brightness value of hard sensors,
which are installed at the exit of D1stage, are treated only
as a reference value in actual, because the measuring val-
ues are often apt to occur sensor―shift phenomena, result
in indicate inaccurate values. Therefore, the data that had
been measured during periodic intervals in the same posi-
tion by hand analysis are regarded as the most precise
data, and used it for the control management data.
At the end, we constructed this pulp bleaching MPC
system to control ClO2 dosages by utilizing the predicted
values for“control variables:CV”, that are calculated suc-
cessively by soft sensors and had been modified based on
the hand analysis measurements.
In addition, any hard sensors, ex. pulp brightness sen-
sors, K value sensors etc., are not installed downstream of
the storage tanks described far right in Fig.1(Chapter2).
Therefore, the final pulp qualities that are required the
highest accuracy had been managed by hand analysis data,
same as the exit pulp brightness from D1stage mentioned
before. We introduced soft sensor functions to predict
those important values online in a similar way(Table2),
and by utilizing them effectively, we could be able to ob-
serve the targeted bleaching processes with a fairly close
states of actual manipulations with operators7),8).
8. Conclusion
We developed multi variable control system to control
automatically pulp brightness and pulp K values and resid-
ual chlorine consistencies, pH and so on at the same time,
and further to prevent the serious troubles caused by K
values that may breaks out the“yellowing trouble”when
paper rolls are exposed long in the heat and high moisture
environment in future.
Although the works to keep pulp bleaching process con-
ditions to optimal states always is considerably difficult for
humans, MPC system is able to control it automatically,
moving plural chemical dosages to appropriate directions
maintaining all pulp qualities and reducing pulp bleaching
costs surely, and improving the economic efficiencies. It is
considered that they are achieved by specialized functions
of MPC.
The one is the optimizing function of Performance func-
tion:J. And the other one is the limits of high and low set-ting restriction functions for each control variables. Opera-
tors had been able to change the targets values succes-
Fig.7 Actual operation trends of pulp bleaching process by Model predictive control(abscissa axis:22days operations and one block shows one day)※In the trend, upper and lower limits for each operation variables set by operators from MPC operation terminalare indicated.
1194
― 98 ― JAPAN TAPPI JOURNAL Vol.68, No.10
sively avoiding the break out of qualitative dangers with
evaluating the movable margins of lower and upper
bounds of chemical dosages properly. As the result, opera-
tors had been able to devote themselves with comfort to
other many important works to be done.
The cost reduction by conventional DCS control meth-
ods is approaching already close to the limits. MPC is a
method to have the possibility breaking through the cur-
rent situations in process control area. We are expecting
to be utilized this new control method effectively to some
appropriate applications in the domestic pulp & paper in-
dustries by all means.
In closing, the development of this MPC system was
done as joint research with Oji Holdings Corporation and
Yokogawa Electric Corporation. We should like to ac-
knowledge the invaluable assistance of the mill operation
staffs of Oji Holdings, and Mr. Jun Nishimura of former
Technical Division of Yokogawa & Co., Ltd.
References1)Y. Mori, M. Watanabe:A multivariable pulp bright-
ness control of ECF bleaching process by model pre-
dictive control,56th Pulp and Paper Annual Confer-
ence,2013.
2)Y. Mori et al.:Japanese Unexamined Patent Applica-
tion Publication No.2013―007135,2013.
3)A. Kawae, Y. Uchida:Inhibition of yellowing of ECF
bleached hardwood Kraft pulp, Japan TAPPI Journal,
Vol.61(1),2007.4)I. Tomoda, Y. Uchida, K. Katayama, Y. Mori, Metso
Automation Inc.:Japanese Patent No.4750068,2011.
5)for example , M. Ohshima:Process Control System, Co-
rona Publishing Co., Ltd., 2003., I. Hashimoto, S.
Hasebe, M. Kano:Process Control Engineering,
Asakura Publishing Co., Ltd.,2002, etc.
6)M. Ogawa, M.Kano:Practice and challenges in
chemical process control Application in Japan, Sys-
tem/Control/Information, ISCIE Journal, Vol. 52―8,2008.
7)Y. Mori, Performance comparison of automatic correc-
tion for soft―sensor function that employs linear re-
gression analysis model, The56th Japan Joint Auto-
matic Control Conference,2013.
8)Y. Mori et al .:Japanese Patent application No.2013―
209503, unpublished at this writing.
9)Yokogawa Electric Corporation:ExaSMOC, Ex-
aRQE Instruction manual, IM36J06D14―0(3rd edi-
tion),2004.
10)Y. Mori:A calculation method to evaluate the control
effect by PLS regression analysis, Japan TAPPI Jour-
nal, Vol.67(12),2013.11)Y. Mori:Statistics analysis for pulp brightness data
using mixture of normal distributions analysis,80th
Pulp and Paper Research Conference,2013.
(Manuscript accepted14April,2014)
1195
― 99 ―October2014