english translation may 10, 2016 summary of consolidated
TRANSCRIPT

- 1 -
English Translation
May 10, 2016 Summary of Consolidated Earnings Report
for the Fiscal Year Ended March 31, 2016 (Japanese GAAP)
Name of listed company: Nippon Express Co., Ltd. Listed stock exchanges: Tokyo
Code: 9062 (URL: http://www.nipponexpress.com (English))
(URL: http://www.nittsu.co.jp (Japanese))
Representative: President, CEO Kenji Watanabe
Scheduled date for General Shareholders’ Meeting: June 29, 2016
Scheduled date of dividend payment: June 30, 2016
Scheduled date for release of Securities Report: June 29, 2016
Availability of supplementary briefing material on annual financial results: Available
(Millions of yen, rounded down) 1. Consolidated Financial Results for Fiscal Year Ended March 31, 2016 (from April 1, 2015 to March 31, 2016)
(1) Consolidated Business Results (%: compared with the previous period)
Revenues Operating income Ordinary income Net income attributable
to shareholders of Nippon Express
¥ million % ¥ million % ¥ million % ¥ million %Fiscal Year Ended Mar. 31, 2016
1,909,105 (0.8) 54,778 7.8 62,394 4.8 35,659 35.2
Fiscal Year Ended Mar. 31, 2015
1,924,929 9.8 50,811 24.3 59,563 18.8 26,382 0.1
(Note) Comprehensive income: Fiscal Year Ended Mar. 31, 2016: ¥2,251 million [(96.4%)] Fiscal Year Ended Mar. 31, 2015: ¥62,639 million [23.6%]
Basic earnings per
share Diluted earnings
per share Rate of return on
equity Ordinary income
on assets Operating margin
to sales ¥ ¥ % % %Fiscal Year Ended Mar. 31, 2016
35.61 ― 6.8 4.2 2.9
Fiscal Year Ended Mar. 31, 2015
25.87 ― 5.1 4.2 2.6
(Reference) Investment gain or loss on equity method: Fiscal Year Ended Mar. 31, 2016: ¥835 million Fiscal Year Ended Mar. 31, 2015: ¥744 million
(2) Consolidated Financial Position Total assets Net assets Equity ratio Net assets per share
¥ million ¥ million % ¥As of Mar. 31, 2016 1,484,953 538,018 35.2 521.77
As of Mar. 31, 2015 1,453,617 550,137 36.6 531.06(Reference) Equity: As of Mar. 31, 2016: ¥522,260 million As of Mar. 31, 2015: ¥531,909 million
(3) Consolidated Cash Flows Cash flows from
operating activities Cash flows from
investment activities Cash flow from
financing activities Cash and cash equivalents
at end of year ¥ million ¥ million ¥ million ¥ millionFiscal Year Ended Mar. 31, 2016
78,844 (122,881) 43,936 146,007
Fiscal Year Ended Mar. 31, 2015
74,519 (22,386) (33,636) 148,942

- 2 -
2. Dividends Information
Annual dividend per share First
Quarter Second Quarter
Third Quarter
Year End
Yearly
Total dividend(Annual)
Dividend payout ratio
(Consolidated)
Dividend payout ratio on
net assets (Consolidated)
¥ ¥ ¥ ¥ ¥ ¥ million % %Fiscal Year Ended Mar. 31, 2015
― 5.00 ― 5.00 10.00 10,136 38.7 2.0
Fiscal Year Ended Mar. 31, 2016
― 5.00 ― 6.00 11.00 11,013 30.9 2.1
Fiscal Year Ending Mar. 31, 2017 (Forecast)
― 5.00 ― 6.00 11.00 30.6
3. Forecast of Consolidated Financial Results for FY2016 (from April 1, 2016 to March 31, 2017)
(%: compared with the previous period)
Revenues Operating income Ordinary income
Net income attributable to
shareholders of Nippon Express
Net income per share
¥ million % ¥ million % ¥ million % ¥ million % ¥
Interim of year 935,000 (1.9) 23,500 1.6 27,800 0.5 16,500 8.5 16.48
Full year 1,930,000 1.1 57,000 4.1 63,000 1.0 36,000 1.0 35.97
*Notes (1) Significant changes of subsidiaries during the period under review (affecting specific subsidiaries due to changes in
scope of consolidation): No (2) Changes in accounting policies, changes in accounting estimates and corrections of errors
1) Changes in accounting policies due to the revision of accounting standards, etc.: Yes 2) Any changes in accounting policies other than 1) above: No 3) Changes in accounting estimates: No 4) Corrections of errors: No
(Note) Please refer to “2. Consolidated Financial Statements, (5) Notes to Consolidated Financial Statements (Changes in Accounting Policies)” on page 16 for details.
(3) Total number of issued shares (common stock)
1) Total number of issued shares at end of period (including treasury stock)
As of Mar. 31, 2016
1,038,000,000shares
As of Mar. 31, 2015
1,038,000,000shares
2) Total number of treasury stocks at end of period
As of Mar. 31, 2016
37,068,877 shares
As of Mar. 31, 2015
36,401,970 shares
3) Average number of shares during period
Fiscal Year Ended Mar. 31, 2016
1,001,470,476shares
Fiscal Year Ended Mar. 31, 2015
1,019,897,758shares
(Reference) Non-consolidated Financial Results
1. Non-consolidated Financial Results for the Fiscal Year ended March 31, 2016 (from April 1, 2015 to March 31, 2016) (1) Non-consolidated Business Results (%: compared with the previous period)
Revenues Operating income Ordinary income Net income
¥ million % ¥ million % ¥ million % ¥ million %Fiscal Year Ended Mar. 31, 2016
1,060,062 (2.7) 31,900 8.8 37,253 1.7 21,934 5.9
Fiscal Year Ended Mar. 31, 2015
1,089,935 4.4 29,321 22.3 36,625 17.5 20,719 23.2
Net income
per share Diluted earnings per
share ¥ ¥Fiscal Year Ended Mar. 31, 2016
21.90 ―
Fiscal Year Ended Mar. 31, 2015
20.32 ―
(2) Non-consolidated Financial Position Total assets Net assets Equity ratio Net assets per share
¥ million ¥ million % ¥
As of Mar. 31, 2016 932,773 361,473 38.8 361.14
As of Mar. 31, 2015 917,236 364,449 39.7 363.87(Reference) Equity: As of Mar. 31, 2016: ¥361,473 million As of Mar. 31, 2015: ¥364,449 million

- 3 -
2. Forecast of Non-consolidated Financial Results for FY2016 (from April 1, 2016 to March 31, 2017)
(%: compared with the previous period)
Revenues Ordinary income Net income Basic earnings per
share ¥ million % ¥ million % ¥ million % ¥
Interim of year 534,000 1.0 16,000 4.1 11,000 37.2 10.99
Full year 1,074,000 1.3 38,000 2.0 24,000 9.4 23.98
*Status of execution of the audit of financial statements Because this Consolidated Earnings Report is not subject to the audit of the annual financial statements under the Financial Instruments and Exchange Act, the procedures for said audit were not completed at the time of disclosing this report.
*Explanation for the appropriate use of financial forecasts and other special notes The forward-looking statements and other results forecasts stated herein are based on the information available at the time this report was prepared and on certain assumptions considered to be reasonable. Accordingly, actual business performance may differ significantly from forecasts due to a number of factors. Please refer to “1. Business Results and Analysis of Financial Position, (1) Analysis of Business Results (Performance Forecasts for Fiscal 2016)” on page 5 for the use of preconditions of the financial forecasts and the use of the forecasts.
Disclaimer: This English translation has been prepared for general reference purposes only. The Company shall not be responsible for any consequence resulting from the use of the English translation in place of the original Japanese text. In any legal matter, readers should refer to and rely upon the original Japanese text released May 10, 2016.

- 4 -
1. Business Results and Analysis of Financial Position
(1) Analysis of Business Results
(Business Results for FY2015)
During the consolidated fiscal year ended March 31, 2016, conditions in the Japanese economy remained uncertain
amid the slowdown in overseas economies including China and escalating geopolitical risks, and also the emergence
since the beginning of the year of factors that put downward pressure on the economy such as yen appreciation and
lower stock prices, despite expectations of improvement in wages and the employment environment driven by
favorable corporate earnings.
Amid these economic conditions, in the field of logistics, domestic freight suffered from sluggish freight movement,
reflecting signs of weakness in production by companies owing to shifts in economic currents, and stagnant shipments,
among other factors. International freight was generally weak, due to factors including a reduction in freight mainly to
Asian countries as a negative trend continued in both exports and imports.
In this business environment, the Nippon Express Group made united efforts to implement the four basic strategies of
“Further Expanding Our Global Logistics Business,” “Strengthening Management Practices for Our Domestic
Businesses,” “Expanding Business by Utilizing the Diversity of Group Companies” and “Contributing to Society through
Our Businesses in Accordance with Corporate Social Responsibility (CSR) Management” in order to achieve the three-
year medium-term management plan “Nippon Express Group Corporate Strategy 2015 – Innovation and Moving
Forward -“ that was in its concluding year.
Specifically, by implementing large-scale organizational reform, the Group moved ahead to create an organization that
can provide one-stop services and to establish a customer-oriented, account-based sales structure that handles
processes from sales to operations in an integrated manner.
In the global logistics business, the Group proceeded with enhancement of the transport network in Southeast Asia,
and worked to provide many new transport services such as halal logistics and integrated cold chain transport, while
expanding sales in regional logistics and warehouse services in each area.
In its domestic businesses, the Group strived to maximize profit through the creation of a high-quality and low-cost
operating structure, by thoroughly strengthening its sales capabilities in metropolitan areas while pressing ahead to
reinforce control of variable costs.
In addition, with respect to CSR management, the Group was engaged in global environmental conservation efforts
aimed at realizing a sustainable society, such as commencing operations of a CFC management system to prevent and
properly and easily manage greenhouse gas leaks.
Furthermore, the Group promoted business expansion by generating synergies through measures such as forming a
business alliance with Meitetsu Transport Co., Ltd. with the aim of building up operational efficiency, in addition to
acquiring shares in Wanbishi Archives Co., Ltd., a leading company in the information asset management industry, in
order to create new industrial platforms.
As a result, revenues decreased by ¥15.8 billion, or 0.8% year on year, to ¥1,909.1 billion, while operating income
increased by ¥3.9 billion, or 7.8% year on year, to ¥54.7 billion, and ordinary income increased by ¥2.8 billion, or 4.8%
year on year, to ¥62.3 billion. Net income attributable to shareholders of Nippon Express increased by ¥9.2 billion, or
35.2% year on year, to ¥35.6 billion.
Financial results by reportable segment are summarized below.
1. Combined Business (Distribution & Transportation, domestic companies)
As a result of factors including a decrease in motor transportation transactions, segment sales were ¥736.5 billion, a
year-on-year decrease of ¥5.7 billion, or 0.8%, while operating income was ¥22.4 billion, a year-on-year increase of
¥4.2 billion, or 23.6%, due to a decrease in fuel prices and the effect of price revisions.
2. Security Transportation (Distribution & Transportation, domestic companies)
Mainly owing to a decrease in security transportation business transactions, segment sales were down ¥1.5 billion, or
2.9% year on year, to ¥53.8 billion, while operating income was up by ¥0.6 billion, or 76.5% year on year, to ¥1.5 billion.

- 5 -
3. Heavy Haulage & Construction (Distribution & Transportation, domestic companies)
As a result of factors including an increase in various project items overseas, segment sales were up ¥4.5 billion, or
9.6% year on year, to ¥51.3 billion, and operating income was up by ¥1.5 billion, or 70.9% year on year, to ¥3.6 billion.
4. Air Freight Forwarding (Distribution & Transportation, domestic companies)
Owing to factors including a reactionary decline against the increase in export freight resulting from the impact of
crowded ports on the west coast of the U.S. in the previous year, segment sales were down ¥28.2 billion, or 13.4%
year on year, to ¥182.5 billion, and operating income was down ¥2.7 billion, or 27.4% year on year, to ¥7.3 billion.
5. Marine & Harbor Transportation (Distribution & Transportation, domestic companies)
Mainly owing to a decrease in domestic freight and import freight transactions, segment sales were down ¥0.6 billion,
or 0.5% year on year, to ¥118.2 billion, while operating income was up by ¥1.2 billion, or 24.6% year on year, to ¥6.1
billion.
6. The Americas (Distribution & Transportation, overseas companies)
As a result of factors including favorable air freight import transactions, segment sales were up ¥15.5 billion, or 19.6%
year on year, to ¥94.6 billion, and operating income was up ¥1.6 billion, or 49.5% year on year, to ¥5.0 billion.
7. Europe (Distribution & Transportation, overseas companies)
As a result of factors including robust air freight export transactions, segment sales were up ¥0.9 billion, or 1.2% year
on year, to ¥84.5 billion, while operating income was down by ¥0.8 billion, or 34.9% year on year, to ¥1.5 billion.
8. East Asia (Distribution & Transportation, overseas companies)
Mainly owing to strong air freight export transactions, segment sales were up ¥13.7 billion, or 13.6% year on year, to
¥115.0 billion, while operating income was down by ¥0.2 billion, or 11.8% year on year, to ¥1.6 billion.
9. South Asia & Oceania (Distribution & Transportation, overseas companies)
As a result of factors including favorable air freight export transactions, segment sales were up ¥5.6 billion, or 8.7%
year on year, to ¥70.2 billion, and operating income was up by ¥0.6 billion, or 68.5% year on year, to ¥1.5 billion.
10. Goods Sales
As a result of factors including a drop in the unit selling price of oil, segment sales were down by ¥52.8 billion, or 12.6%
year on year, to ¥367.3 billion, and operating income was down by ¥0.3 billion, or 5.3% year on year, to ¥6.0 billion.
11. Other
As a result of factors including the acquisition of shares of Nittsu NEC Logistics, Ltd., segment sales were up ¥30.0
billion, or 20.9% year on year, to ¥173.6 billion, and operating income was up by ¥0.1 billion, or 3.9% year on year, to
¥2.7 billion.
(Performance Forecasts for FY2016)
Performance forecasts for the next fiscal year have been made in consideration of trends in crude oil prices, risks of
exchange rate fluctuations and other such factors.
As stated in “1. Business Results and Analysis of Financial Position (1) Analysis of Business Results,” conditions are
expected to be highly uncertain due to factors including the impact of the economic slowdown overseas as well as yen
appreciation and lower stock prices.
The Nippon Express Group will develop businesses suited to the characteristics of each region in Japan and overseas
and strengthen its customer-oriented sales through global development of one-stop sales and account management.
As a result, the Group expects growth in revenues, operating income, ordinary income, and net income attributable to
shareholders of Nippon Express.

- 6 -
Performance forecasts for the fiscal year ending March 31, 2017 as of the release date of this report are as follows.
Performance Forecasts of Consolidated Financial Results (Full year)
Revenues ¥1,930 billion (up 1.1% year on year)
Operating income ¥57 billion (up 4.1% year on year)
Ordinary income ¥63 billion (up 1.0% year on year)
Net income attributable to shareholders of Nippon Express ¥36 billion (up 1.0% year on year)
Performance Forecasts of Non-consolidated Financial Results (Full year)
Revenues ¥1,074 billion (up 1.3% year on year)
Operating income ¥32 billion (up 0.3% year on year)
Ordinary income ¥38 billion (up 2.0% year on year)
Net income ¥24 billion (up 9.4% year on year)
* The above performance forecasts were deemed reasonable by the Company based on data currently available to the
Company and actual business performance may differ from the performance forecasts.
(2) Analysis of Financial Position
Total assets as at the end of the fiscal year ended March 31, 2016 amounted to ¥1,484.9 billion, an increase of ¥31.3
billion or 2.2% from the end of the previous fiscal year.
Current assets amounted to ¥682.3 billion, a decrease of ¥36.9 billion or 5.1% from the end of the previous fiscal year,
while noncurrent assets totaled ¥802.6 billion, an increase of ¥68.3 billion or 9.3% from the end of the previous fiscal
year.
The primary factors behind the decrease in current assets were the decrease in accounts receivable—trade, etc.
The primary factors behind the increase in noncurrent assets were the increase in goodwill and other, etc.
Total liabilities as at the end of the fiscal year ended March 31, 2016 were ¥946.9 billion, an increase of ¥43.4 billion or
4.8% from the end of the previous fiscal year.
Current liabilities decreased by ¥51.5 billion or 10.5% from the end of the previous fiscal year to ¥440.3 billion, while
noncurrent liabilities increased by ¥95.0 billion or 23.1% to ¥506.5 billion from the end of the previous fiscal year.
The decrease in current liabilities was primarily due to the decrease in short-term loans payable, etc.
The increase in noncurrent liabilities was mainly attributable to the increase in long-term loans payable, etc.
Net assets amounted to ¥538.0 billion at the end of the fiscal year ended March 31, 2016, a decrease of ¥12.1 billion or
2.2% from the end of the previous fiscal year.
This was attributable to the decrease in valuation differences on available-for-sale securities, etc.
Net cash provided by operating activities amounted to ¥78.8 billion, a year-on-year increase of ¥4.3 billion in proceeds.
This was primarily due to the increase in proceeds resulting from income before income taxes and non-controlling
interests and (increase) decrease in trade receivables, etc.
Net cash used in investment activities totaled ¥122.8 billion, a year-on-year increase of ¥100.4 billion in expenditures.
This was mainly due to the increase in payment for purchase of shares of subsidiaries resulting in change in scope of
consolidation.
Net cash provided by financing activities amounted to ¥43.9 billion, a year-on-year increase of ¥77.5 billion in proceeds.
This was mainly due to the increase in proceeds from long-term loans payable, etc.
As a result of the above, cash and cash equivalents at the end of the fiscal year ended March 31, 2016 decreased ¥2.9
billion year on year to ¥146.0 billion.

- 7 -
(Reference) Trends in the Group’s cash flow indicators are as follows.
FY2011 FY2012 FY2013 FY2014 FY2015 Equity ratio (%) 39.1 41.2 36.0 36.6 35.2 Marked-to-market equity ratio (%) 27.4 38.6 37.6 46.3 34.5 Ratio of cash flow to interest-bearing liabilities(years)
4.4 5.5 6.5 4.9 5.3
Interest coverage ratio (times) 25.0 18.7 18.7 25.3 30.2
(Notes)
Equity ratio: Equity / Total assets
Marked-to-market equity ratio: Market capitalization / Total assets
Ratio of cash flow to interest-bearing liabilities: Interest-bearing liabilities / Operating cash flow
Interest coverage ratio: Operating cash flow / Interest payment
* All indicators have been calculated based on consolidated financial data.
* Market capitalization is calculated by multiplying the closing share price as at the end of the fiscal year by the number
of issued shares as at the end of the fiscal year (after deducting treasury stock).
* For operating cash flow, cash flow from operating activities in the consolidated cash flow statement has been used.
Interest-bearing liabilities include all liabilities declared in the consolidated balance sheet for which interest is paid.
For interest payment, the amount of interest paid according to the consolidated cash flow statement is used.
(3) Basic Policy for Profit Sharing and Dividends for the Fiscal Year Ended March 31, 2016 and the Fiscal Year Ending
March 31, 2017
The Company regards the return of profits to shareholders as one of its most important priorities. We aim to maximize
returns, while also expanding our business operations, strengthening our financial position, increasing shareholders’
equity and improving profit ratios.
The earnings retained by Nippon Express will be used for investments mainly in the development of logistics bases and
the replacement of vehicles, to expand sales of our distribution and transportation services and improve our
transportation efficiency. We will also utilize retained earnings to strengthen our financial position as well as our
corporate foundation.
As stated in the “Notice of Revision of Dividend Forecast” released on May 10, 2016, for this fiscal year the Company
plans to pay an annual dividend of ¥11, consisting of an interim dividend of ¥5 and a year-end dividend of ¥6
(consolidated dividend payout ratio of 30.9%). For the fiscal year ending March 31, 2017, we plan to pay an annual
dividend of ¥11, consisting of an interim dividend of ¥5 and a year-end dividend of ¥6 (forecast consolidated dividend
payout ratio of 30.6%).

- 8 -
2. Consolidated Financial Statements
(1) Consolidated Balance Sheets
(Unit: Millions of yen)
FY2014 (as of March 31, 2015)
FY2015 (as of March 31, 2016)
ASSETS Current assets:
Cash and cash in banks 207,112 189,323Notes receivable—trade 13,471 22,280Accounts receivable—trade 321,679 296,592Inventories 6,020 6,368Advanced money 4,098 4,383Prepaid expenses 12,670 13,028Deferred tax assets 13,689 11,530Lease investment assets 108,273 112,827Other 33,602 27,163Less: allowance for doubtful accounts (1,304) (1,182)Total current assets 719,313 682,316
Noncurrent assets: Property and equipment
Vehicles 171,508 173,132Less: accumulated depreciation (147,415) (147,841)Vehicles, net 24,092 25,290
Buildings 563,414 571,593Less: accumulated depreciation (328,977) (343,905)Buildings, net 234,437 227,687
Structures 64,403 64,656Less: accumulated depreciation (52,618) (53,532)Structures, net 11,784 11,123
Machinery 72,983 76,644Less: accumulated depreciation (59,051) (63,017)Machinery, net 13,932 13,626
Tools, furniture and fixtures 102,492 105,464Less: accumulated depreciation (80,774) (84,256)Tools, furniture and fixtures, net 21,718 21,208
Vessels 17,769 17,731Less: accumulated depreciation (12,382) (13,042)Vessels, net 5,387 4,688
Land 176,165 177,438Leased assets 6,668 7,882
Less: accumulated depreciation (2,711) (3,794)Leased assets, net 3,956 4,087
Construction in progress 1,071 17,170Net property and equipment 492,545 502,321
Intangible assets Leasehold right 7,527 8,103Goodwill 14,821 47,411Other 37,737 72,658Total intangible assets 60,087 128,173
Investments and other assets Investment securities 133,577 112,130Long-term loans receivable 2,513 1,905Long-term loan to employees 139 104Long-term prepaid expense 4,643 4,406Security deposit 21,245 20,905Net retirement benefit asset 1,783 962Deferred tax assets 6,607 19,342Other 12,169 13,284Less: allowance for doubtful accounts (1,009) (899)Total investments and other assets 181,670 172,142
Total noncurrent assets 734,304 802,637Total assets 1,453,617 1,484,953

- 9 -
(Unit: Millions of yen)
FY2014 (as of March 31, 2015)
FY2015 (as of March 31, 2016)
LIABILITIES Current liabilities:
Notes payable—trade 7,308 7,506Accounts payable—trade 170,211 151,057Short-term loans payable 83,397 62,291Other Payables 25,949 29,825Income taxes payable 16,192 13,891Consumer tax payable 16,487 7,134Unpaid expenses 21,127 20,399Advance receipt 26,906 23,138Deposits 61,165 46,583Deposits from employees 27,764 28,036Provision for bonuses 21,752 21,529Provision for directors’ bonus 135 143Allowance for warranty and repair 62 –Allowance for class action lawsuit filed in the United States
3,899 –
Allowance for business structure improvement expenses
1,050 –
Other 8,530 28,829Total current liabilities 491,940 440,366
Noncurrent liabilities: Bonds payable 65,000 65,000Long-term loans payable 180,969 240,955Deferred tax liabilities 4,865 14,486Provision for directors’ retirement benefits 350 408Provision for special repairment 202 224Provision for loss on guarantees 829 829Provision for loss on contracts – 857Other provisions – 120Net retirement benefit liability 135,678 160,168Other 23,644 23,518Total noncurrent liabilities 411,539 506,568
Total liabilities 903,480 946,935NET ASSETS Shareholders’ equity:
Common stock 70,175 70,175Additional paid-in capital 26,908 25,306Retained earnings 419,851 445,495Less: treasury stock (19,444) (19,818)Total shareholders’ equity 497,490 521,158
Accumulated other comprehensive income: Valuation differences on available-for-sale securities
61,900 47,118
Deferred gains (losses) on hedges (7) (214)Foreign currency translation adjustments 14,901 8,085Remeasurements of retirement benefit plans
(42,375) (53,888)
Total accumulated other comprehensive income
34,419 1,101
Non-controlling interests 18,227 15,758Total net assets 550,137 538,018
Total liabilities and net assets 1,453,617 1,484,953

- 10 -
(2) Consolidated Statements of Income and Comprehensive Income
Consolidated Statements of Income
(Unit: Millions of yen)
FY2014 (from April 1, 2014 to
March 31, 2015)
FY2015 (from April 1, 2015 to
March 31, 2016) Revenues 1,924,929 1,909,105Operating costs 1,783,621 1,755,489Gross profit 141,308 153,615Selling, general and administrative expenses
Salaries, compensation, and welfare expenses
48,952 55,209
Depreciation and amortization 6,592 7,080Advertising expenses 4,110 3,830Provision for allowance for doubtful accounts
24 –
Other 30,816 32,716Total selling, general and administrative expenses
90,497 98,837
Operating income 50,811 54,778Non-operating income:
Interest income 708 559Dividends income 2,474 3,184Gain on sales of vehicles 349 349Equity in earnings of affiliates 744 835Income from foreign exchange 2,840 1,874Other 7,367 6,747Total non-operating income 14,483 13,550
Non-operating expenses: Interest expenses 2,882 2,791Other financial expenses – 803Loss on sale and retirement of vehicles 43 38Other 2,805 2,301Total non-operating expenses 5,731 5,934
Ordinary income 59,563 62,394Extraordinary income:
Gain on sales of noncurrent assets 2,875 4,862Gain on sales of investment securities 5,205 363Other 664 243Total extraordinary income 8,745 5,469
Extraordinary loss: Loss on disposal of noncurrent assets 7,686 6,477Loss on sales of investment securities 7 45Loss on valuation of investment securities 606 62Impairment loss 5,441 342Provision of allowance for class action lawsuit filed in the United States
3,899 –
Provision of allowance for business structure improvement expenses
1,050 –
Provision of allowance for loss on contracts – 949Other 638 790Total extraordinary loss 19,329 8,668
Income before income taxes and non-controlling interests
48,978 59,196
Income taxes—current 26,346 22,770Income taxes—deferred (3,429) 140Total income taxes 22,916 22,910Net income 26,062 36,285Net income (loss) attributable to non-controlling interests
(319) 625
Net income attributable to shareholders of Nippon Express
26,382 35,659

- 11 -
Consolidated Statements of Comprehensive Income
(Unit: Millions of yen)
FY2014 (from April 1, 2014 to
March 31, 2015)
FY2015 (from April 1, 2015 to
March 31, 2016) Net income 26,062 36,285Other comprehensive income:
Valuation differences on available-for-sale securities
21,823 (14,787)
Deferred gains (losses) on hedges (11) (206)Foreign currency translation adjustments 11,183 (7,030)Remeasurements of retirement benefit plans
3,132 (11,764)
Share of other comprehensive income of affiliates accounted for using the equity method
448 (244)
Other comprehensive income 36,576 (34,033)Comprehensive income 62,639 2,251
(Comprehensive income attributable to) Shareholders of Nippon Express 62,518 2,342Non-controlling interests 120 (90)

- 12 -
(3) Consolidated Statements of Changes in Net Assets
FY2014 (from April 1, 2014 to March 31, 2015)
(Unit: Millions of yen) Shareholders’ equity
Common stock Additional paid-in
capital Retained earnings Treasury stock
Total shareholders’
equity
Balance at beginning of the
year 70,175 26,908 417,869 (17,353) 497,599
Cumulative effects of changes
in accounting policies (1,819) (1,819)
Restated balance 70,175 26,908 416,050 (17,353) 495,779
Changes during the year
Cash dividends (10,258) (10,258)
Net income attributable to
shareholders of Nippon
Express
26,382 26,382
Change in amounts due to
change in scope of
consolidation
656 656
Changes in equity of
Nippon Express due to
transactions with non-
controlling shareholders
– –
Increase in treasury stock (15,072) (15,072)
Decrease in treasury stock 0 (0) 2 2
Retirement of treasury stock (0) (12,979) 12,979 –
Net changes in items other
than shareholders' equity
Total changes during the year – (0) 3,801 (2,090) 1,710
Balance at end of the year 70,175 26,908 419,851 (19,444) 497,490
Accumulated other comprehensive income
Valuation
differences on
available-for-sale
securities
Deferred gains
(losses) on
hedges
Foreign currency
translation
adjustments
Remeasurements
of retirement
benefit plans
Total
accumulated
other
comprehensive
income
Non-
controlling
interests
Total net
assets
Balance at beginning of the
year 40,077 3 3,829 (45,628) (1,717) 14,072 509,954
Cumulative effects of changes
in accounting policies (1,819)
Restated balance 40,077 3 3,829 (45,628) (1,717) 14,072 508,135
Changes during the year
Cash dividends (10,258)
Net income attributable to
shareholders of Nippon
Express
26,382
Change in amounts due to
change in scope of
consolidation
656
Changes in equity of
Nippon Express due to
transactions with non-
controlling shareholders
–
Increase in treasury stock (15,072)
Decrease in treasury stock 2
Retirement of treasury stock –
Net changes in items other
than shareholders' equity 21,822 (11) 11,072 3,253 36,136 4,155 40,291
Total changes during the year 21,822 (11) 11,072 3,253 36,136 4,155 42,002
Balance at end of the year 61,900 (7) 14,901 (42,375) 34,419 18,227 550,137

- 13 -
FY2015 (from April 1, 2015 to March 31, 2016)
(Unit: Millions of yen) Shareholders’ equity
Common stock Additional paid-in
capital Retained earnings Treasury stock
Total shareholders’
equity
Balance at beginning of the
year 70,175 26,908 419,851 (19,444) 497,490
Cumulative effects of changes
in accounting policies – –
Restated balance 70,175 26,908 419,851 (19,444) 497,490
Changes during the year
Cash dividends (10,015) (10,015)
Net income attributable to
shareholders of Nippon
Express
35,659 35,659
Change in amounts due to
change in scope of
consolidation
– –
Changes in equity of
Nippon Express due to
transactions with non-
controlling shareholders
(1,601) (1,601)
Increase in treasury stock (374) (374)
Decrease in treasury stock 0 0 0
Retirement of treasury stock – – – –
Net changes in items other
than shareholders' equity
Total changes during the year – (1,601) 25,643 (374) 23,668
Balance at end of the year 70,175 25,306 445,495 (19,818) 521,158
Accumulated other comprehensive income
Valuation
differences on
available-for-sale
securities
Deferred gains
(losses) on
hedges
Foreign currency
translation
adjustments
Remeasurements
of retirement
benefit plans
Total
accumulated
other
comprehensive
income
Non-
controlling
interests
Total net
assets
Balance at beginning of the
year 61,900 (7) 14,901 (42,375) 34,419 18,227 550,137
Cumulative effects of changes
in accounting policies –
Restated balance 61,900 (7) 14,901 (42,375) 34,419 18,227 550,137
Changes during the year
Cash dividends (10,015)
Net income attributable to
shareholders of Nippon
Express
35,659
Change in amounts due to
change in scope of
consolidation
–
Changes in equity of
Nippon Express due to
transactions with non-
controlling shareholders
(1,601)
Increase in treasury stock (374)
Decrease in treasury stock 0
Retirement of treasury stock –
Net changes in items other
than shareholders' equity (14,781) (206) (6,815) (11,513) (33,317) (2,469) (35,786)
Total changes during the year (14,781) (206) (6,815) (11,513) (33,317) (2,469) (12,118)
Balance at end of the year 47,118 (214) 8,085 (53,888) 1,101 15,758 538,018

- 14 -
(4) Consolidated Statements of Cash Flows
(Unit: Millions of yen)
FY2014 (from April 1, 2014 to
March 31, 2015)
FY2015 (from April 1, 2015 to
March 31, 2016) Cash flows from operating activities
Income before income taxes and non-controlling interests 48,978 59,196Depreciation and amortization 51,005 51,333Amortization of goodwill 2,453 2,764(Gain) loss on sale or write-down of securities, net (4,592) (255)(Gain) loss on sale or disposal of property and equipment, net
4,506 1,303
Impairment loss 5,441 342Increase (decrease) in provision for bonus 245 (481)Increase (decrease) in allowance for class action lawsuit filed in the United States
3,899 (3,899)
Increase (decrease) in allowance for business structure improvement expenses
1,050 (1,050)
Increase (decrease) in net retirement benefit liability 8,349 9,801Interest and dividend income (3,182) (3,743)Interest expense 2,882 2,791Equity in (earnings) losses of unconsolidated subsidiaries and affiliates
(744) (835)
(Increase) decrease in trade receivables (26,266) 11,350(Increase) decrease in inventories 2,817 (342)Increase (decrease) in accounts payable 1,915 (16,823)Increase (decrease) in consumption taxes etc. payable 11,050 (10,027)Other (5,074) 933Sub-total 104,735 102,357Interest and dividends received 3,954 4,082Interest paid (2,945) (2,614)Payment for deposits associated with class action lawsuit filed in the United States
(3,899) –
Income taxes paid (27,325) (24,980)Net cash provided by operating activities 74,519 78,844
Cash flows from investment activities Payment for purchase of securities (2,157) (3,456)Proceeds from sale of securities 8,012 2,224Payment for purchase of property and equipment (48,809) (50,219)Proceeds from sales of property and equipment 15,880 4,940Payment for purchase of shares of subsidiaries resulting in change in scope of consolidation
– (77,167)
Proceeds from purchase of shares of subsidiaries resulting in change in scope of consolidation
4,164 –
Other 522 797Net cash used in investment activities (22,386) (122,881)

- 15 -
(Unit: Millions of yen)
FY2014 (from April 1, 2014 to
March 31, 2015)
FY2015 (from April 1, 2015 to
March 31, 2016) Cash flows from financing activities
Change in short-term loans payable 5,179 (536)Change in commercial paper (6,000) –Proceeds from long-term loans payable 49,131 112,759Payment of long-term loans payable (40,710) (72,810)Proceeds from issuance of bonds – 20,000Redemption of bonds (15,000) –Payments from changes in ownership interests in subsidiaries that do not result in change in scope of consolidation
– (3,330)
Cash dividends (10,258) (10,015)Purchase of treasury stock (15,073) (374)Other (906) (1,755)Net cash provided by (used in) financing activities (33,636) 43,936
Effect of exchange rate changes on cash 4,373 (2,835)Net increase (decrease) in cash and cash equivalents 22,869 (2,935)Cash and cash equivalents at beginning of year 125,900 148,942Increase (decrease) in cash and cash equivalents due to change in scope of consolidation
172 –
Cash and cash equivalents at end of year 148,942 146,007

- 16 -
(5) Notes to Consolidated Financial Statements (Notes Regarding Going Concern Assumption) Not applicable. (Changes in Accounting Policies) Effective from the fiscal year ended March 31, 2016, the Company has applied the Accounting Standard for Business Combinations (ASBJ Statement No. 21, September 13, 2013; the “Business Combinations Standard”), the Accounting Standard for Consolidated Financial Statements (ASBJ Statement No. 22, September 13, 2013; the “Consolidated Financial Statements Standard”), the Accounting Standard for Business Divestitures (ASBJ Statement No. 7, September 13, 2013; the “Business Divestitures Standard”) and others. Accordingly, the accounting methods have been changed to record the difference arising from a change in the Company’s ownership interest in a subsidiary over which the Company continues to have control as additional paid-in capital and to record acquisition-related costs as expenses for the consolidated fiscal year in which they are incurred. Furthermore, for business combinations performed at and after the beginning of the fiscal year ended March 31, 2016, the method is changed to reflect an adjustment to the provisional amount arising from the finalization of the tentative accounting treatment relating to the allocation of acquisition cost in the consolidated financial statements for the fiscal year to which the date of business combination belongs. In addition, the Company has changed the presentation of net income and other related items, and the presentation of “minority interests” to “non-controlling interests.” To reflect these changes in presentation, reclassification has been made in the consolidated financial statements for the fiscal year ended March 31, 2015. The Business Combinations Standard and others have been adopted in accordance with transitional treatments stipulated in Paragraph 58-2 (4) of the Business Combinations Standard, Paragraph 44-5 (4) of the Consolidated Financial Statements Standard and Paragraph 57-4 (4) of the Business Divestitures Standard, and they are prospectively adopted from the beginning of the fiscal year ended March 31, 2016. As a result, additional paid-in capital at the end of the fiscal year ended March 31, 2016 decreased by ¥1,601 million. The effect of these changes on operating income, ordinary income and income before income taxes and non-controlling interests is immaterial. In the Consolidated Statements of Cash Flows for the fiscal year ended March 31, 2016, cash flows related to changes in ownership interests in subsidiaries that do not result in change in scope of consolidation are listed under “cash flows from financing activities,” while cash flows related to expenses incurred in relation with purchase of shares of subsidiaries resulting in change in scope of consolidation or expenses incurred in relation with changes in ownership interests in subsidiaries that do not result in change in scope of consolidation are listed under “cash flows from operating activities.” The balance of additional paid-in capital in the Consolidated Statements of Changes in Net Assets at the end of the fiscal year ended March 31, 2016 decreased by ¥1,601 million. The effect of these changes on per share information is immaterial.
(Business Combinations) Business Combination through Acquisition At the Board of Directors’ meeting held on October 30, 2015, the Company resolved to acquire 330,000 issued shares (the “Stock Acquisition”) of Wanbishi Archives Co., Ltd. (“Wanbishi Archives”), a wholly-owned subsidiary of TOYOTA INDUSTRIES CORPORATION, and entered into the share transfer agreement on the same date. Subsequently, in accordance with the agreement, effective on December 15, 2015, the Company acquired shares in Wanbishi Archives and made it a subsidiary.
1. Outline of the business combination
(1) Name and description of business of the acquired company Name of the acquired company: Wanbishi Archives Co., Ltd. Description of business: Information asset management and insurance agency business
(2) Main reasons for the business combination
The Company has played a role in the “social infrastructure” since its establishment under the corporate philosophy of becoming a driving force for social development through logistics. Meanwhile, Wanbishi Archives has taken the responsibility of managing highly confidential and significantly important documents and data of government authorities, financial institutions and medical institutions, etc., developing its business around the field of “social infrastructure” handling “trust and confidence,” which is a lifeline of corporate clients. Furthermore, Wanbishi Archives has fostered a high level of confidence within society as a leading company in the information asset management industry in which further growth and expansion is expected in the future.

- 17 -
Following the Stock Acquisition, the Company believes that Wanbishi Archives’ becoming a member of Nippon Express Group will accelerate the building of the security and storage platforms as part of social infrastructure and allow the Company to provide new value to more customers in Japan and abroad.
(3) Date of the business combination
December 15, 2015
(4) Legal format of the business combination Stock acquisition
(5) Name of the company after the combination Wanbishi Archives Co., Ltd.
(6) Ratio of voting rights acquired 100%
(7) Main rationale behind choice of acquired company As the Company paid cash consideration to acquire the shares of Wanbishi Archives, the latter has
become the acquired company. 2. Period of the acquired company’s financial results incorporated in the consolidated financial statements
The financial results for the period from January 1, 2016 to March 31, 2016 are incorporated.
3. Acquisition cost of the acquired company and its breakdown Consideration for the acquisition (in cash): ¥86,000 million Acquisition cost: ¥86,000 million
4. Details and amount of main acquisition-related costs
Advisory fees, etc.: ¥301 million
5. Amount of goodwill recognized, basis for recognition, method and period of amortization (1) Amount of goodwill recognized ¥35,724 million (2) Basis for recognition
As the acquisition cost for the acquired company exceeded its net asset value, the difference is recognized as goodwill.
(3) Method and period of amortization The goodwill is amortized in equal installments over a 20-year period.
6. Amount and major breakdown of assets received and liabilities assumed on the date of the business combination
Current assets: ¥11,970 million Noncurrent assets: ¥54,166 million Total assets ¥66,136 million Current liabilities: ¥2,878 million Noncurrent liabilities: ¥12,981 million Total liabilities: ¥15,860 million
7. Approximate amount of impact on the Consolidated Statement of Income for the fiscal year ended March 31,
2016 on the assumption that the business combination was completed at the beginning of the fiscal year, and method for calculation A description is omitted because the approximate amount of such impact is immaterial.
(Segment Information, etc.) [Segment Information] 1. Outline of the reportable segments
Reportable segments of the Nippon Express Group are its organizational units whose individual financial results can be identified separately, and serve as the basis and subject of regular review by the Board of Directors, for the purpose of allocating management resources and evaluating business performance.
- 18 -
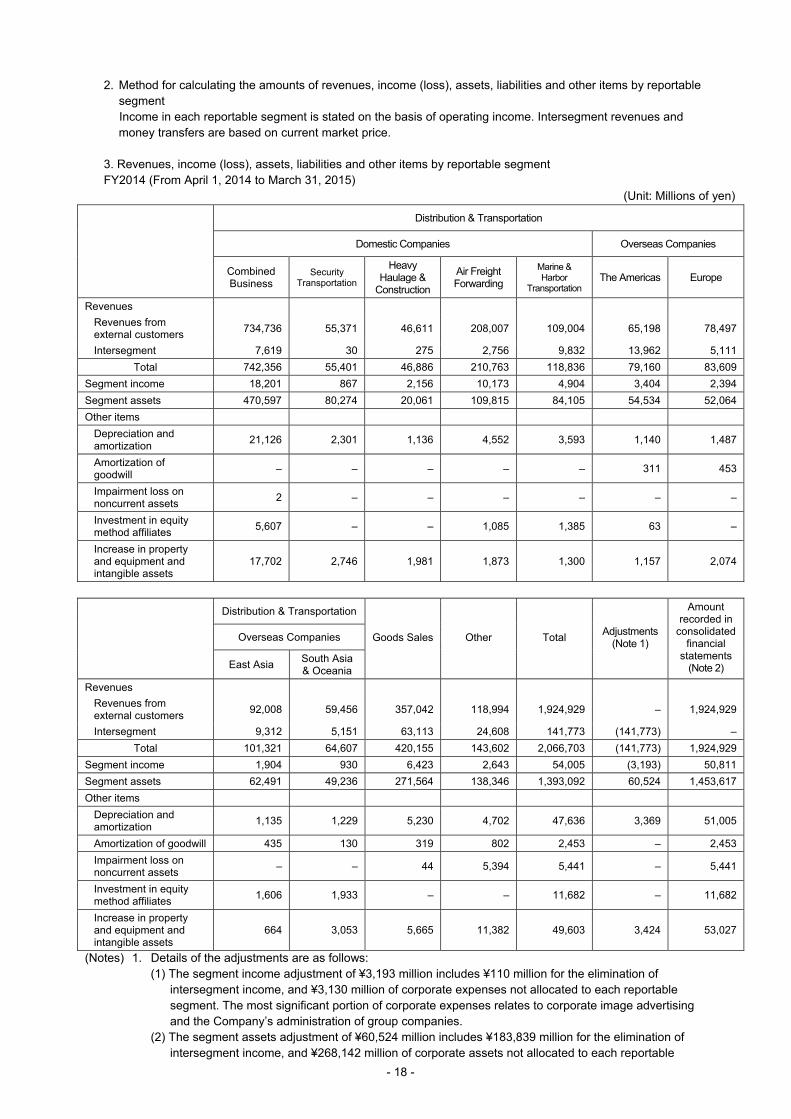
2. Method for calculating the amounts of revenues, income (loss), assets, liabilities and other items by reportable segment Income in each reportable segment is stated on the basis of operating income. Intersegment revenues and money transfers are based on current market price.
3. Revenues, income (loss), assets, liabilities and other items by reportable segment FY2014 (From April 1, 2014 to March 31, 2015)
(Unit: Millions of yen)
Distribution & Transportation
Domestic Companies Overseas Companies
Combined Business
Security Transportation
Heavy Haulage &
Construction
Air Freight Forwarding
Marine & Harbor
Transportation The Americas Europe
Revenues
Revenues from external customers
734,736 55,371 46,611 208,007 109,004 65,198 78,497
Intersegment 7,619 30 275 2,756 9,832 13,962 5,111
Total 742,356 55,401 46,886 210,763 118,836 79,160 83,609
Segment income 18,201 867 2,156 10,173 4,904 3,404 2,394
Segment assets 470,597 80,274 20,061 109,815 84,105 54,534 52,064
Other items
Depreciation and amortization
21,126 2,301 1,136 4,552 3,593 1,140 1,487
Amortization of goodwill
– – – – – 311 453
Impairment loss on noncurrent assets
2 – – – – – –
Investment in equity method affiliates
5,607 – – 1,085 1,385 63 –
Increase in property and equipment and intangible assets
17,702 2,746 1,981 1,873 1,300 1,157 2,074
Distribution & Transportation
Overseas Companies
East Asia South Asia & Oceania
Goods Sales Other Total Adjustments
(Note 1)
Amount recorded in
consolidated financial
statements(Note 2)
Revenues
Revenues from external customers
92,008 59,456 357,042 118,994 1,924,929 – 1,924,929
Intersegment 9,312 5,151 63,113 24,608 141,773 (141,773) –
Total 101,321 64,607 420,155 143,602 2,066,703 (141,773) 1,924,929
Segment income 1,904 930 6,423 2,643 54,005 (3,193) 50,811
Segment assets 62,491 49,236 271,564 138,346 1,393,092 60,524 1,453,617
Other items
Depreciation and amortization
1,135 1,229 5,230 4,702 47,636 3,369 51,005
Amortization of goodwill 435 130 319 802 2,453 – 2,453
Impairment loss on noncurrent assets
– – 44 5,394 5,441 – 5,441
Investment in equity method affiliates
1,606 1,933 – – 11,682 – 11,682
Increase in property and equipment and intangible assets
664 3,053 5,665 11,382 49,603 3,424 53,027
(Notes) 1. Details of the adjustments are as follows: (1) The segment income adjustment of ¥3,193 million includes ¥110 million for the elimination of
intersegment income, and ¥3,130 million of corporate expenses not allocated to each reportable segment. The most significant portion of corporate expenses relates to corporate image advertising and the Company’s administration of group companies.
(2) The segment assets adjustment of ¥60,524 million includes ¥183,839 million for the elimination of intersegment income, and ¥268,142 million of corporate assets not allocated to each reportable

- 19 -
segment. Corporate assets mainly represent cash and cash in banks, securities and noncurrent assets held by the head office not attributable to each reportable segment.
(3) The depreciation and amortization adjustment represents the depreciation and amortization at the head office not attributable to each reportable segment.
(4) The adjustment in increase in property and equipment and intangible assets represents primarily the capital expenditures at the head office not attributable to each reportable segment.
2. Segment income has been reconciled with operating income in the consolidated financial statements.

- 20 -
FY2015 (From April 1, 2015 to March 31, 2016) (Unit: Millions of yen)
Distribution & Transportation
Domestic Companies Overseas Companies
Combined Business
Security Transportation
Heavy Haulage &
Construction
Air Freight Forwarding
Marine & Harbor
Transportation The Americas Europe
Revenues
Revenues from external customers
728,820 53,773 51,051 179,492 108,189 79,895 79,267
Intersegment 7,748 30 344 3,041 10,016 14,801 5,311
Total 736,568 53,803 51,395 182,533 118,205 94,697 84,579
Segment income 22,495 1,530 3,686 7,385 6,109 5,088 1,559
Segment assets 471,376 62,056 23,124 89,515 81,628 47,477 51,038
Other items
Depreciation and amortization
21,636 2,280 1,271 3,465 3,488 1,299 1,693
Amortization of goodwill
– – – – – 311 438
Impairment loss on noncurrent assets
12 – – – – – –
Investment in equity method affiliates
5,883 – – 1,109 1,495 65 –
Increase in property and equipment and intangible assets
29,912 1,527 435 2,197 3,896 1,053 1,551
Distribution & Transportation
Overseas Companies
East Asia South Asia & Oceania
Goods Sales Other Total Adjustments
(Note 1)
Amount recorded in
consolidated financial
statements(Note 2)
Revenues
Revenues from external customers
105,103 65,007 309,206 149,297 1,909,105 – 1,909,105
Intersegment 9,964 5,218 58,122 24,334 138,935 (138,935) –
Total 115,068 70,225 367,328 173,632 2,048,040 (138,935) 1,909,105
Segment income 1,679 1,568 6,084 2,746 59,935 (5,157) 54,778
Segment assets 59,451 49,552 267,449 229,188 1,431,859 53,094 1,484,953
Other items
Depreciation and amortization
1,263 1,447 4,974 4,665 47,487 3,845 51,333
Amortization of goodwill 534 130 319 1,030 2,764 – 2,764
Impairment loss on noncurrent assets
– – 133 197 342 – 342
Investment in equity method affiliates
1,617 1,914 – – 12,086 – 12,086
Increase in property and equipment and intangible assets
1,476 4,295 5,964 72,769 125,080 2,422 127,502
(Notes) 1. Details of the adjustments are as follows: (1) The segment income adjustment of ¥5,157 million includes ¥233 million for the elimination of
intersegment income, and ¥5,031 million of corporate expenses not allocated to each reportable segment. The most significant portion of corporate expenses relates to corporate image advertising and the Company’s administration of group companies.
(2) The segment assets adjustment of ¥53,094 million includes ¥255,608 million for the elimination of intersegment income, and ¥323,094 million of corporate assets not allocated to each reportable segment. Corporate assets mainly represent cash and cash in banks, securities and noncurrent assets held by the head office not attributable to each reportable segment.
(3) The depreciation and amortization adjustment represents the depreciation and amortization at the head office not attributable to each reportable segment.
(4) The adjustment in increase in property and equipment and intangible assets represents primarily the capital expenditures at the head office not attributable to each reportable segment.

- 21 -
2. Segment income has been reconciled with operating income in the consolidated financial statements.
(Per Share Information) FY2014
(from April 1, 2014 to March 31, 2015) FY2015
(from April 1, 2015 to March 31, 2016)
Net assets per share (yen) 531.06 521.77
Basic earnings per share (yen) 25.87 35.61
(Notes) 1. Diluted earnings per share is not stated because there were no residual securities. 2. The bases for the computation of the amounts of Basic earnings per share are set out below.
(Unit: Millions of yen unless otherwise stated) FY2014
(from April 1, 2014 to March 31, 2015) FY2015
(from April 1, 2015 to March 31, 2016)
Basic earnings per share Net income attributable to shareholders of Nippon Express
26,382 35,659
Amount not attributable to common shareholders
– –
Net income attributable to shareholders of Nippon Express related to common stock
26,382 35,659
Weighted average number of common stock during the year (1,000 shares)
1,019,897 1,001,470
3. The bases for the computation of the amounts of net assets per share are set out below.
(Unit: Millions of yen unless otherwise stated) FY2014
(as of March 31, 2015) FY2015
(as of March 31, 2016)
Total net assets 550,137 538,018
Amount to deduct from total net assets 18,227 15,758
(Non-controlling interests) (18,227) (15,758)Net assets at end of year related to common stock
531,909 522,260
Number of common stock at end of year used to calculate net assets per share (1,000 shares)
1,001,598 1,000,931
(Significant Subsequent Events) Not applicable.

- 22 -
3. Reference Materials
(1) Consolidated Reference Materials
○ Financial Results of Reportable Segment for FY2015
(Unit: Millions of yen, %)
Change FY2015 FY2014
Amount Ratio
Combined Business 736,568 742,356 (5,787) (0.8)Security
Transportation 53,803 55,401 (1,597) (2.9)
Heavy Haulage & Construction
51,395 46,886 4,508 9.6
Air Freight Forwarding
182,533 210,763 (28,230) (13.4)
Marine & Harbor Transportation
118,205 118,836 (630) (0.5)Dom
estic
Com
pani
es
Subtotal 1,142,508 1,174,245 (31,737) (2.7)The Americas 94,697 79,160 15,536 19.6
Europe 84,579 83,609 969 1.2East Asia 115,068 101,321 13,747 13.6
South Asia & Oceania
70,225 64,607 5,618 8.7Ove
rsea
s C
ompa
nies
Subtotal 364,570 328,699 35,871 10.9
Dis
trib
utio
n &
Tra
nspo
rtat
ion
Total 1,507,079 1,502,944 4,134 0.3Goods Sales 367,328 420,155 (52,827) (12.6)
Other 173,632 143,602 30,029 20.9
Rep
orta
ble
Seg
men
t
Subtotal 2,048,040 2,066,703 (18,662) (0.9)Adjustment (138,935) (141,773) 2,838 –
Rev
enue
s
Total 1,909,105 1,924,929 (15,824) (0.8)Combined Business [3.1] 22,495 [2.5] 18,201 4,293 23.6
Security Transportation
[2.8] 1,530 [1.6] 867 663 76.5
Heavy Haulage & Construction
[7.2] 3,686 [4.6] 2,156 1,529 70.9
Air Freight Forwarding
[4.0] 7,385 [4.8] 10,173 (2,788) (27.4)
Marine & Harbor Transportation
[5.2] 6,109 [4.1] 4,904 1,205 24.6Dom
estic
Com
pani
es
Subtotal [3.6] 41,207 [3.1] 36,304 4,903 13.5The Americas [5.4] 5,088 [4.3] 3,404 1,684 49.5
Europe [1.8] 1,559 [2.9] 2,394 (834) (34.9)East Asia [1.5] 1,679 [1.9] 1,904 (224) (11.8)
South Asia & Oceania
[2.2] 1,568 [1.4] 930 637 68.5Ove
rsea
s C
ompa
nies
Subtotal [2.7] 9,896 [2.6] 8,633 1,262 14.6
Dis
trib
utio
n &
Tra
nspo
rtat
ion
Total [3.4] 51,103 [3.0] 44,938 6,165 13.7Goods Sales [1.7] 6,084 [1.5] 6,423 (339) (5.3)
Other [1.6] 2,746 [1.8] 2,643 103 3.9
Rep
orta
ble
Seg
men
t
Subtotal [2.9] 59,935 [2.6] 54,005 5,929 11.0Adjustment (5,157) (3,193) (1,963) –
Seg
men
t Inc
ome
(Ope
ratin
g In
com
e)
Total [2.9] 54,778 [2.6] 50,811 3,966 7.8(Note) Figures in brackets indicate Operating Margins.

- 23 -
○ Forecast of Financial Results for FY2016 (Full Year)
(Reportable Segment) (Unit: Millions of yen, %)
Change FY2016 FY2015
Amount Ratio
Japan 1,188,500 1,158,390 30,109 2.6
The Americas 84,600 94,697 (10,097) (10.7)
Europe 80,400 84,579 (4,179) (4.9)
East Asia 111,500 115,068 (3,568) (3.1)
South Asia & Oceania 79,000 70,225 8,774 12.5
Logi
stic
s
Subtotal 1,544,000 1,522,961 21,038 1.4
Security Transportation 55,700 53,803 1,896 3.5
Heavy Haulage & Construction
48,600 51,395 (2,795) (5.4)
Logistics Support 406,600 410,906 (4,306) (1.0)
Rep
orta
ble
Seg
men
t
Subtotal 2,054,900 2,039,067 15,832 0.8
Adjustment (124,900) (129,962) 5,062 –
Rev
enue
s
Total 1,930,000 1,909,105 20,894 1.1
Japan [3.4] 40,500 [3.2] 36,601 3,898 10.7
The Americas [5.0] 4,200 [5.4] 5,088 (888) (17.5)
Europe [2.5] 2,000 [1.8] 1,559 440 28.3
East Asia [1.5] 1,700 [1.5] 1,679 20 1.2
South Asia & Oceania [2.7] 2,100 [2.2] 1,568 531 33.9
Logi
stic
s
Subtotal [3.3] 50,500 [3.1] 46,497 4,002 8.6
Security Transportation [2.0] 1,100 [2.9] 1,570 (470) (30.0)
Heavy Haulage & Construction
[6.0] 2,900 [7.2] 3,687 (787) (21.4)
Logistics Support [2.0] 8,300 [2.0] 8,161 138 1.7
Rep
orta
ble
Seg
men
t
Subtotal [3.1] 62,800 [2.9] 59,917 2,882 4.8
Adjustment 5,800) (5,139) (660) –
Seg
men
t Inc
ome
(O
pera
ting
Inco
me)
Total [3.0] 57,000 [2.9] 54,778 2,221 4.1
(Notes) 1. In line with the “Nippon Express Group Corporate Strategy 2018 – New Sekai-Nittsu –,” the Company has decided to change its reportable segments effective from the fiscal year ending March 31, 2017. For forecast of financial results for FY2016, the figures for the previous fiscal year have been reclassified accordingly to make comparisons.
2. Figures in brackets indicate Operating Margins.

- 24 -
○ Forecast of Financial Results for First Half of FY2016
(Reportable Segment) (Unit: Millions of yen, %)
Change
First half of FY2016
First half of FY2015
Amount Ratio
Japan 585,600 573,174 12,425 2.2
The Americas 41,500 48,295 (6,795) (14.1)
Europe 37,900 41,039 (3,139) (7.6)
East Asia 50,900 57,467 (6,567) (11.4)
South Asia & Oceania 36,700 36,795 (95) (0.3)
Logi
stic
s
Subtotal 752,600 756,771 (4,171) (0.6)
Security Transportation 27,800 27,208 591 2.2
Heavy Haulage & Construction
25,900 27,517 (1,617) (5.9)
Logistics Support 192,200 207,249 (15,049) (7.3)
Rep
orta
ble
Seg
men
t
Subtotal 998,500 1,018,747 (20,247) (2.0)
Adjustment (63,500) (65,523) 2,023 –
Rev
enue
s
Total 935,000 953,224 (18,224) (1.9)
Japan [2.7] 16,100 [2.5] 14,321 1,778 12.4
The Americas [4.8] 2,000 [5.7] 2,732 (732) (26.8)
Europe [2.1] 800 [1.7] 699 100 14.4
East Asia [1.2] 600 [1.0] 581 18 3.2
South Asia & Oceania [2.5] 900 [2.3] 861 38 4.5
Logi
stic
s
Subtotal [2.7] 20,400 [2.5] 19,196 1,203 6.3
Security Transportation [1.4] 400 [2.7] 733 (333) (45.5)
Heavy Haulage & Construction
[5.0] 1,300 [5.9] 1,623 (323) (19.9)
Logistics Support [2.1] 4,100 [1.9] 4,039 60 1.5
Rep
orta
ble
Seg
men
t
Subtotal [2.6] 26,200 [2.5] 25,592 607 2.4
Adjustment (2,700) (2,471) (228) –
Seg
men
t Inc
ome
(O
pera
ting
Inco
me)
Total [2.5] 23,500 [2.4] 23,120 379 1.6
(Notes) 1. In line with the “Nippon Express Group Corporate Strategy 2018 – New Sekai-Nittsu –,” the Company has decided to change its reportable segments effective from the fiscal year ending March 31, 2017. For forecast of financial results for first half of FY2016, the figures for the previous fiscal year have been reclassified accordingly to make comparisons.
2. Figures in brackets indicate Operating Margins.
- 25 -
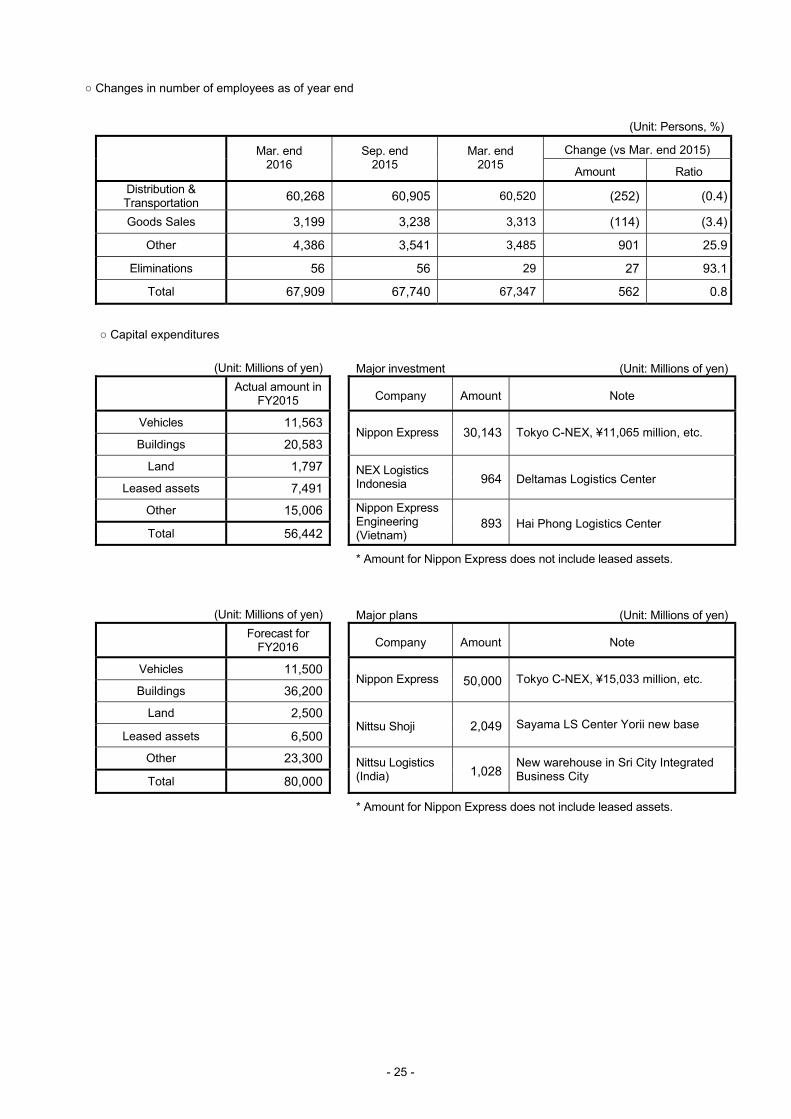
○ Changes in number of employees as of year end
(Unit: Persons, %)
Change (vs Mar. end 2015) Mar. end
2016 Sep. end
2015 Mar. end
2015 Amount Ratio
Distribution & Transportation 60,268 60,905 60,520 (252) (0.4)
Goods Sales 3,199 3,238 3,313 (114) (3.4)
Other 4,386 3,541 3,485 901 25.9
Eliminations 56 56 29 27 93.1
Total 67,909 67,740 67,347 562 0.8
○ Capital expenditures
(Unit: Millions of yen) Major investment (Unit: Millions of yen)
Actual amount in
FY2015 Company Amount Note
Vehicles 11,563
Buildings 20,583 Nippon Express 30,143 Tokyo C-NEX, ¥11,065 million, etc.
Land 1,797
Leased assets 7,491
NEX Logistics Indonesia 964 Deltamas Logistics Center
Other 15,006
Total 56,442
Nippon Express Engineering (Vietnam)
893 Hai Phong Logistics Center
* Amount for Nippon Express does not include leased assets.
(Unit: Millions of yen) Major plans (Unit: Millions of yen)
Forecast for
FY2016 Company Amount Note
Vehicles 11,500
Buildings 36,200 Nippon Express 50,000 Tokyo C-NEX, ¥15,033 million, etc.
Land 2,500
Leased assets 6,500 Nittsu Shoji 2,049 Sayama LS Center Yorii new base
Other 23,300
Total 80,000
Nittsu Logistics (India) 1,028
New warehouse in Sri City Integrated Business City
* Amount for Nippon Express does not include leased assets.

- 26 -
(2) Non-consolidated Reference Materials
○ Details of revenues and operating expenses for FY2015
(Unit: Millions of yen, %)
Change FY2015 % in
SalesFY2014 % in
Sales Amount Ratio
Railway utilization transportation 84,827 8.0 83,740 7.7 1,086 1.3Combined delivery
services 81,446 7.7 82,886 7.6 (1,440) (1.7)
Chartered truck services 271,310 25.6 274,419 25.2 (3,108) (1.1)
Mot
or
tran
spor
tatio
n
Subtotal 352,756 33.3 357,305 32.8 (4,548) (1.3)
Marine transportation 73,698 7.0 74,487 6.8 (788) (1.1)Harbor transportation 53,457 5.0 54,341 5.0 (884) (1.6)
Subtotal 127,156 12.0 128,829 11.8 (1,673) (1.3)(Exports) [ 62,395 ] ― [ 62,120 ] ― [ 275 ] [ 0.4 ](Imports) [ 38,367 ] ― [ 39,120 ] ― [ (753) ] [ (1.9) ]
Mar
ine
and
harb
or
tran
spor
tatio
n
(Domestic) [ 26,393 ] ― [ 27,588 ] ― [ (1,194) ] [ (4.3) ]Warehousing 114,551 10.8 114,941 10.5 (389) (0.3)
International air freight 95,194 9.0 123,312 11.3 (28,117) (22.8)
(Exports) [ 72,037 ] ― [ 100,535 ] ― [ (28,497) ] [ (28.3) ](Imports) [ 23,156 ] ― [ 22,776 ] ― [ 380 ] [ 1.7 ]
Domestic air freight 39,418 3.7 40,283 3.7 (864) (2.1)
Air
tran
spor
tatio
n
Subtotal 134,613 12.7 163,595 15.0 (28,982) (17.7)Heavy haulage & construction 61,708 5.8 58,139 5.4 3,568 6.1
Incidental operations and others 184,447 17.4 183,383 16.8 1,064 0.6
Total 1,060,062 100.0 1,089,935 100.0 (29,873) (2.7)(Domestic operation-related
revenues) [ 828,438 ] 78.1 [ 832,714 ] 76.4 [ (4,276) ] [ (0.5) ]
Rev
enue
s
(Overseas-related revenues) [ 231,623 ] 21.9 [ 257,220 ] 23.6 [ (25,597) ] [ (10.0) ]
Drivers/workers 119,508 11.3 119,567 11.0 (58) (0.0)
Office personnel 134,507 12.7 135,831 12.4 (1,324) (1.0)
Em
ploy
men
t co
sts
Subtotal 254,015 24.0 255,398 23.4 (1,383) (0.5)
Railway 43,640 4.1 43,058 4.0 581 1.4Marine 27,263 2.6 27,389 2.5 (126) (0.5)
Air 39,035 3.7 59,820 5.5 (20,785) (34.7)
For
war
ding
co
sts
Subtotal 109,939 10.4 130,269 12.0 (20,329) (15.6)Vehicle chartering and subcontracting costs 441,524 41.6 444,344 40.8 (2,819) (0.6)
Depreciation and amortization 29,527 2.8 30,046 2.8 (519) (1.7)Facility usage charges 72,132 6.8 72,689 6.7 (557) (0.8)
Other 121,022 11.4 127,865 11.6 (6,842) (5.4)
Ope
ratin
g ex
pens
es
Total 1,028,161 97.0 1,060,614 97.3 (32,452) (3.1)
Operating income 31,900 3.0 29,321 2.7 2,578 8.8

- 27 -
○ Details of revenues for the first and second half of FY2015
(Unit: Millions of yen, %)
Change FY2015 % in
SalesFY2014 % in
Sales Amount Ratio
Railway utilization transportation 40,724 7.7 40,426 7.7 297 0.7Combined delivery
services 39,882 7.5 40,323 7.6 (441) (1.1)
Chartered truck services 134,530 25.5 135,374 25.7 (844) (0.6)
Mot
or
tran
spor
tatio
n
Subtotal 174,412 33.0 175,698 33.3 (1,286) (0.7)
Marine transportation 38,393 7.3 37,618 7.2 775 2.1Harbor transportation 27,075 5.1 27,565 5.2 (490) (1.8)
Subtotal 65,468 12.4 65,183 12.4 284 0.4(Exports) [ 32,407 ] ― [ 31,198 ] ― [ 1,209 ] [ 3.9 ](Imports) [ 19,869 ] ― [ 19,969 ] ― [ (99) ] [ (0.5) ]
Mar
ine
and
harb
or
tran
spor
tatio
n
(Domestic) [ 13,192 ] ― [ 14,016 ] ― [ (824) ] [ (5.9) ]Warehousing 58,251 11.0 56,790 10.8 1,461 2.6
International air freight 47,590 9.0 49,037 9.3 (1,446) (3.0)
(Exports) [ 36,043 ] ― [ 38,075 ] ― [ (2,031) ] [ (5.3) ](Imports) [ 11,546 ] ― [ 10,961 ] ― [ 585 ] [ 5.3 ]
Domestic air freight 19,363 3.7 19,765 3.7 (401) (2.0)
Air
tran
spor
tatio
n
Subtotal 66,954 12.7 68,802 13.0 (1,848) (2.7)Heavy haulage & construction 32,681 6.2 30,607 5.8 2,073 6.8
Incidental operations and others 90,139 17.0 90,019 17.0 120 0.1
Total 528,633 100.0 527,530 100.0 1,103 0.2(Domestic operation-related
revenues) [ 410,035 ] 77.6 [ 411,107 ] 77.9 [ (1,071) ] [ (0.3) ]
1H o
f rev
enue
s
(Overseas-related revenues) [ 118,598 ] 22.4 [ 116,423 ] 22.1 [ 2,175 ] [ 1.9 ]
Railway utilization transportation 44,103 8.3 43,313 7.7 789 1.8Combined delivery
services 41,564 7.8 42,562 7.6 (998) (2.3)
Chartered truck services 136,780 25.7 139,044 24.7 (2,264) (1.6)
Mot
or
tran
spor
tatio
n
Subtotal 178,344 33.5 181,606 32.3 (3,262) (1.8)
Marine transportation 35,305 6.6 36,869 6.5 (1,564) (4.2)Harbor transportation 26,382 5.0 26,775 4.8 (393) (1.5)
Subtotal 61,687 11.6 63,645 11.3 (1,958) (3.1)(Exports) [ 29,988 ] ― [ 30,922 ] ― [ (933) ] [ (3.0) ](Imports) [ 18,497 ] ― [ 19,151 ] ― [ (653) ] [ (3.4) ]
Mar
ine
and
harb
or
tran
spor
tatio
n
(Domestic) [ 13,201 ] ― [ 13,571 ] ― [ (370) ] [ (2.7) ]Warehousing 56,299 10.6 58,150 10.3 (1,850) (3.2)
International air freight 47,603 9.0 74,274 13.2 (26,670) (35.9)
(Exports) [ 35,993 ] ― [ 62,459 ] ― [ (26,465) ] [ (42.4) ](Imports) [ 11,609 ] ― [ 11,814 ] ― [ (204) ] [ (1.7) ]
Domestic air freight 20,055 3.8 20,518 3.7 (463) (2.3)
Air
tran
spor
tatio
n
Subtotal 67,658 12.8 94,793 16.9 (27,134) (28.6)Heavy haulage & construction 29,026 5.5 27,531 4.9 1,495 5.4
Incidental operations and others 94,308 17.7 93,363 16.6 944 1.0
Total 531,428 100.0 562,405 100.0 (30,977) (5.5)(Domestic operation-related
revenues) [ 418,402 ] 78.7 [ 421,607 ] 75.0 [ (3,204) ] [ (0.8) ]
2H o
f rev
enue
s
(Overseas-related revenues) [ 113,025 ] 21.3 [ 140,797 ] 25.0 [ (27,772) ] [ (19.7) ]

- 28 -
○ Changes in number of employees as of year end (Unit: Person, %) Change
(vs Mar. end 2015)
Mar. end 2016
Sep. end 2015
Mar. end 2015
Change Ratio
Nationwide employees
716 737 779 (63) (8.1)
Other employees
16,248 16,685 16,459 (211) (1.3)
Driv
ers
/wor
kers
Subtotal 16,964 17,422 17,238 (274) (1.6) Nationwide employees
11,053 11,233 11,344 (291) (2.6)
Other employees
4,077 4,150 3,928 149 3.8 Offi
ce
pers
onne
l
Subtotal 15,130 15,383 15,272 (142) (0.9)
Total 32,094 32,805 32,510 (416) (1.3) ○ Cash flows
(Unit: Millions of yen)
FY2015 FY2014 Change Cash and cash equivalents at beginning of the year 49,817 58,366 (8,548) Cash flows from operating activities 58,974 47,789 11,185 Cash flows from investment activities (107,079) (10,435) (96,643) Cash flows from financing activities 40,860 (45,901) 86,762 Cash and cash equivalents at end of the year 42,573 49,817 (7,244)
○ Capital expenditures
(Unit: Millions of yen)
Actual amount in FY2015
Vehicles 7,084Buildings 16,294
Land 430Software 3,216
Other 3,118Total 30,143
* Major investment
(Unit: Millions of yen)
Type Description m2 Total
construction expenses
Actual amount in FY2015
Building Tokyo C-NEX 150,708 27,311 11,065 Building Honmoku Distribution Center 19,312 4,674 1,123 Building MRJ Komaki Set Parts Center 31,438 4,421 383
(Unit: Millions of yen)
Forecasted amount in FY2016
Vehicles 5,300Buildings 31,300
Land 1,400Software 4,300
Other 7,700Total 50,000
* Major investment
(Unit: Millions of yen)
Type Description (Planned to complete) m2
Total construction
expenses
Forecasted amount in FY2016
Building Tokyo C-NEX (January 2017) 150,708 27,311 15,033Building Honmoku Distribution Center (September 2016) 19,312 4,674 3,548Building MRJ Komaki Set Parts Center (January 2017) 31,438 4,421 3,449

- 29 -
○ Forecast of Financial Results for FY2016 (Full Year)
(Unit: Millions of yen, %)
Change FY2016 % in
SalesFY2015 % in
Sales Amount Ratio
Railway utilization transportation 85,700 8.0 84,827 8.0 872 1.0Combined delivery
services 81,200 7.6 81,446 7.7 (246) (0.3)
Chartered truck services 273,600 25.5 271,310 25.6 2,289 0.8
Mot
or
tran
spor
tatio
n
Subtotal 354,800 33.1 352,756 33.3 2,043 0.6
Marine transportation 77,800 7.2 73,698 7.0 4,101 5.6Harbor transportation 54,700 5.1 53,457 5.0 1,242 2.3
Mar
ine
and
harb
or
trans
porta
tion
Subtotal 132,500 12.3 127,156 12.0 5,343 4.2Warehousing 114,800 10.7 114,551 10.8 248 0.2
International air freight 96,400 9.0 95,194 9.0 1,205 1.3
Domestic air freight 40,200 3.7 39,418 3.7 781 2.0Air
tran
spor
tatio
n
Subtotal 136,600 12.7 134,613 12.7 1,986 1.5Heavy haulage & construction 60,100 5.6 61,708 5.8 (1,608) (2.6)
Incidental operations and others 189,500 17.6 184,447 17.4 5,052 2.7
Rev
enue
s
Total 1,074,000 100.0 1,060,062 100.0 13,937 1.3
Drivers/workers 120,300 11.2 119,508 11.3 791 0.7Office personnel 135,400 12.6 134,507 12.7 892 0.7
Em
ploy
men
t co
sts
Subtotal 255,700 23.8 254,015 24.0 1,684 0.7Railway 44,200 4.1 43,640 4.1 559 1.3Marine 30,000 2.8 27,263 2.6 2,736 10.0
Air 39,100 3.6 39,035 3.7 64 0.2
For
war
ding
co
sts
Subtotal 113,300 10.5 109,939 10.4 3,360 3.1Vehicle chartering and subcontracting costs 445,600 41.5 441,524 41.6 4,075 0.9
Depreciation and amortization 30,800 2.9 29,527 2.8 1,272 4.3Facility usage charges 72,600 6.8 72,132 6.8 467 0.6
Other 124,000 11.5 121,022 11.4 2,977 2.5
Ope
ratin
g ex
pens
es
Total 1,042,000 97.0 1,028,161 97.0 13,838 1.3
Operating income 32,000 3.0 31,900 3.0 99 0.3
Non-operating income 11,000 1.0 10,148 1.0 851 8.4Non-operating expenses 5,000 0.5 4,794 0.5 205 4.3
Ordinary income 38,000 3.5 37,253 3.5 746 2.0
Extraordinary income 3,300 0.3 3,032 0.3 267 8.8Extraordinary loss 5,000 0.4 6,859 0.6 (1,859) (27.1)
Income before income taxes 36,300 3.4 33,426 3.2 2,873 8.6
Income taxes 12,300 1.1 11,492 1.1 807 7.0
Net income 24,000 2.2 21,934 2.1 2,065 9.4

- 30 -
○ Forecast of Financial Results for First Half of FY2016 (Unit: Millions of yen, %)
Change First half of
FY2016 % in Sales
First half of FY2015 % in
Sales Amount Ratio
Railway utilization transportation 41,100 7.7 40,724 7.7 375 0.9Combined delivery
services 39,700 7.4 39,882 7.5 (182) (0.5)
Chartered truck services 135,400 25.4 134,530 25.5 869 0.6
Mot
or
tran
spor
tatio
n
Subtotal 175,100 32.8 174,412 33.0 687 0.4
Marine transportation 40,500 7.6 38,393 7.3 2,106 5.5Harbor transportation 27,700 5.2 27,075 5.1 624 2.3
Mar
ine
and
harb
or
trans
porta
tion
Subtotal 68,200 12.8 65,468 12.4 2,731 4.2
Warehousing 57,000 10.7 58,251 11.0 (1,251) (2.1)International
air freight 47,700 8.9 47,590 9.0 109 0.2
Domestic air freight 19,700 3.7 19,363 3.7 336 1.7Air
tran
spor
tatio
n
Subtotal 67,400 12.6 66,954 12.7 445 0.7Heavy haulage & construction 31,600 5.9 32,681 6.2 (1,081) (3.3)
Incidental operations and others 93,600 17.5 90,139 17.0 3,460 3.8
Rev
enue
s
Total 534,000 100.0 528,633 100.0 5,366 1.0
Drivers/workers 60,500 11.3 60,046 11.4 453 0.8Office personnel 68,400 12.8 67,935 12.8 464 0.7
Em
ploy
men
t co
sts
Subtotal 128,900 24.1 127,981 24.2 918 0.7Railway 21,300 4.0 21,066 4.0 233 1.1Marine 15,500 2.9 13,955 2.6 1,544 11.1
Air 19,300 3.6 20,164 3.8 (864) (4.3)
For
war
ding
co
sts
Subtotal 56,100 10.5 55,187 10.4 912 1.7Vehicle chartering and subcontracting costs 224,000 42.0 222,068 42.0 1,931 0.9
Depreciation and amortization 14,500 2.7 14,434 2.7 65 0.5Facility usage charges 36,300 6.8 36,212 6.9 87 0.2
Other 61,700 11.6 60,263 11.4 1,436 2.4
Ope
ratin
g ex
pens
es
Total 521,500 97.7 516,147 97.6 5,352 1.0
Operating income 12,500 2.3 12,486 2.4 13 0.1
Non-operating income 5,800 1.1 4,694 0.9 1,105 23.6Non-operating expenses 2,300 0.4 1,810 0.4 489 27.0
Ordinary income 16,000 3.0 15,369 2.9 630 4.1
Extraordinary income 3,000 0.5 1,146 0.2 1,853 161.8Extraordinary loss 2,200 0.4 4,586 0.8 (2,386) (52.0)
Income before income taxes 16,800 3.1 11,929 2.3 4,870 40.8
Income taxes 5,800 1.0 3,912 0.8 1,887 48.2
Net income 11,000 2.1 8,016 1.5 2,983 37.2