english gross domestic product, 1300-1700: · pdf fileand the multi-volume agrarian history of...
TRANSCRIPT

ENGLISH GROSS DOMESTIC PRODUCT, 1300-1700: SOMEPRELIMINARY ESTIMATES
Alexander Apostolides, University of Warwick, [email protected] Broadberry, University of Warwick, [email protected]
Bruce Campbell, Queen’s University Belfast, [email protected] Overton, University of Exeter, [email protected]
Bas van Leeuwen, University of Warwick, [email protected]
26 November 2008File: Pre1700v2.doc
Abstract: We provide annual estimates of GDP for England over the period 1300-1700, constructed from the output side. The GDP data are combined with populationestimates to calculate GDP per capita. Estimates of nominal GDP are also provided bycombining the volume series with a price index, based on a benchmark for 1688.Previous studies, based on the analysis of daily real wages, have found no trendgrowth over the period as a whole. In contrast, we find per capita income growth of0.13 to 0.16 per cent per annum, with the strongest growth after the Black Death andin the second half of the seventeenth century. The modest trend growth in per capitaincome can be reconciled with the stability of real daily wages because of an“industrious revolution”, increasing the days worked per year. The positive growth ofper capita income is also consistent with the evidence of rising personal wealth fromprobate inventories.
Acknowledgements: This paper forms part of the project “Reconstructing the NationalIncome of Britain and Holland, c.1270/1500 to 1850”, funded by the LeverhulmeTrust, Reference Number F/00215AR.

2
I. INTRODUCTION
There are two conflicting views of the long run development of living standards in the
English economy. One view, which is based largely on real wage evidence, paints a
bleak picture of long run stagnation from the late thirteenth century to the middle of
the nineteenth century, albeit with quite large fluctuations over sustained periods
(Phelps Brown and Hopkins, 1981). This view has recently been supported by Clark
(2005), who provides a real wage series which shows less extreme fluctuations than
that of Phelps Brown and Hopkins, but leaves the trend unchanged. Furthermore,
Clark (2007) adds new time series for land rents and capital income to arrive at a
picture of long run stagnation in GDP per head. This view sits uneasily with evidence
accumulated from the output side of the economy and from estimates of wealth,
which appear to show modest but sustained growth of living standards between the
middle ages and the Industrial Revolution. In particular, the output trends of
agriculture, the largest sector of the economy at this time, show rising labour
productivity as workers shifted into industry and services, where value added was
higher and growth more rapid (Overton and Campbell, 1996). In addition, probate
inventories show steadily rising wealth per capita, spread widely across social classes,
and not just restricted to the very rich (Overton, Whittle, Dean and Haan, 2004).
This paper, together with Broadberry and van Leeuwen (2008) represents a
first attempt to arrive at estimates of British GDP over the period 1270-1850, built up
from the output side, and to provide a reconciliation with the daily wage data which
underpins the stagnationist view. The key to reconciling the two approaches is the
changing number of days worked per year, so that annual real wages grew while daily
real wages stagnated. Hence, as van Zanden (2006) shows, it is possible to reconcile

3
growing GDP per head measured from the output side with stagnating daily real
wages. This is what de Vries (1994) calls the “industrious revolution”, with workers
toiling to obtain the new consumer goods which were increasingly showing up in the
probate inventories. The reconciliation of the output and income approaches is also
pursued for the agricultural sector by Allen (2005), using contemporary estimates of
the length of time required for specific tasks, combined with wage rates.
The paper proceeds as follows. Sections II to IV describe the procedures for
estimating output in agriculture, industry and services, respectively. Section V then
aggregates the sectoral outputs into real GDP and combines this with data on
population to derive estimates of per capita GDP. In section VI, real GDP is reflated
with a price index to provide a measure of nominal GDP, which can be compared
with benchmark estimates by other authors. Section VII then explores the consistency
between the output and income approaches, particularly in the agricultural sector,
where the best evidence is available. Section VIII presents evidence on wealth, which
provides a further consistency check on the GDP estimates.
II. AGRICULTURAL PRODUCTION
1. Arable farming
The starting point for arable production is the work of Overton and Campbell (1996),
the Medieval Accounts Database assembled by Campbell (2000; 2007) and the Early
Modern Probate Inventories Database constructed by Overton (2006) and Overton,
Whittle, Dean and Haan (2004), which provide the sown acreage for the principal
crops and yearly information on the yields per acre net of seed. These are presented

4
here in panels A and B of Table 1 and multiplied together to yield the outputs in panel
C.
Finally, we need to make an allowance for the consumption of oats and pulses
by animals working on the farms. The number of working horses and oxen per sown
acre is taken from the Medieval Accounts Database and the Early Modern Probate
Inventories Database. We assume that a mature horse consumed 16 bushels of oats
per year, and a mature ox 2.72 bushels on demesnes (Allen, 2005; Langdon, 1982;
1986). These per head consumption figures fluctuate slightly in line with changes in
the share of immature animals. Following Apostolides et al (2008), we also allow for
the fact that immature animals consumed less than mature animals that the
consumption of oats in the non-demesne sector was less than in the demesne sector.
For pulses, we followed Allen (2005) in subtracting 27 per cent for consumption by
animals in 1700 and 50 per cent in earlier years.
Although there are differences for individual crops in particular years, the
picture of the arable sector presented here is broadly in line with that of Allen (2005)
for benchmark years, but with the advantage that we provide annual estimates. The
volumes obtained from Table 1 are multiplied by the prices of individual products to
yield production values. The prices are taken largely from Clark (2004), who
synthesises the published data from Beveridge (1939), Thorold Rogers (1886-1902)
and the multi-volume Agrarian History of England and Wales, as well as integrating
new archival evidence
2. Pastoral farming
5
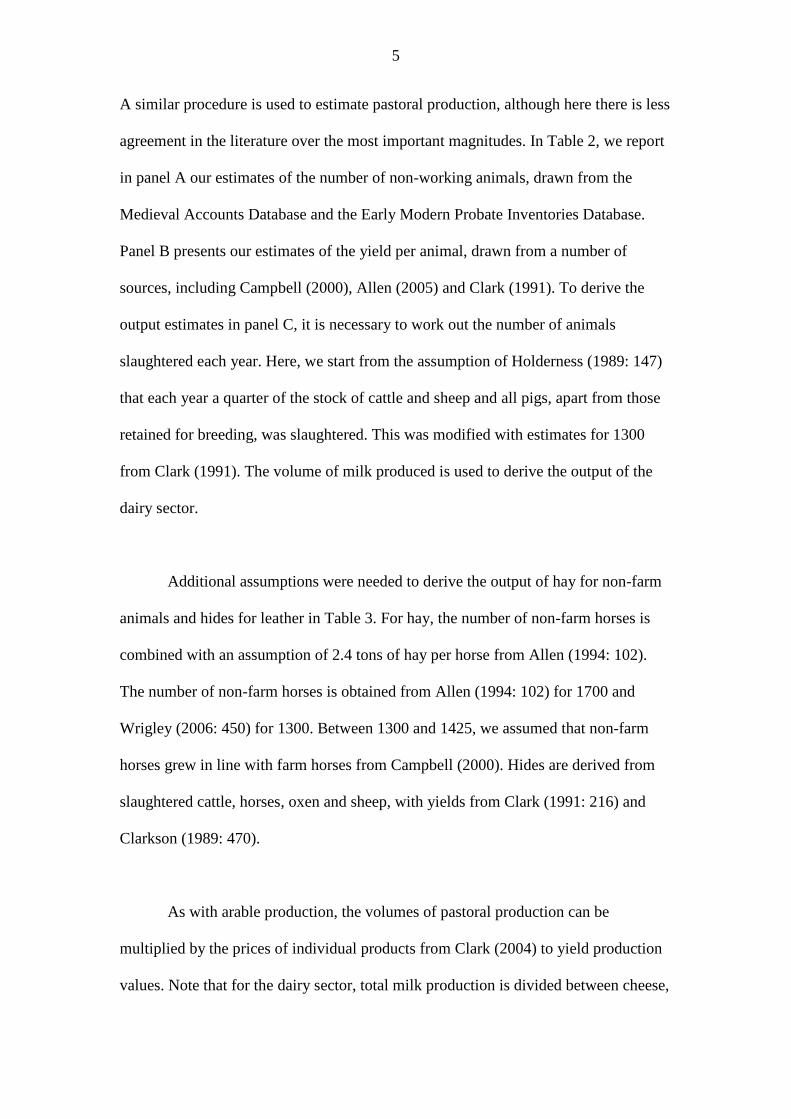
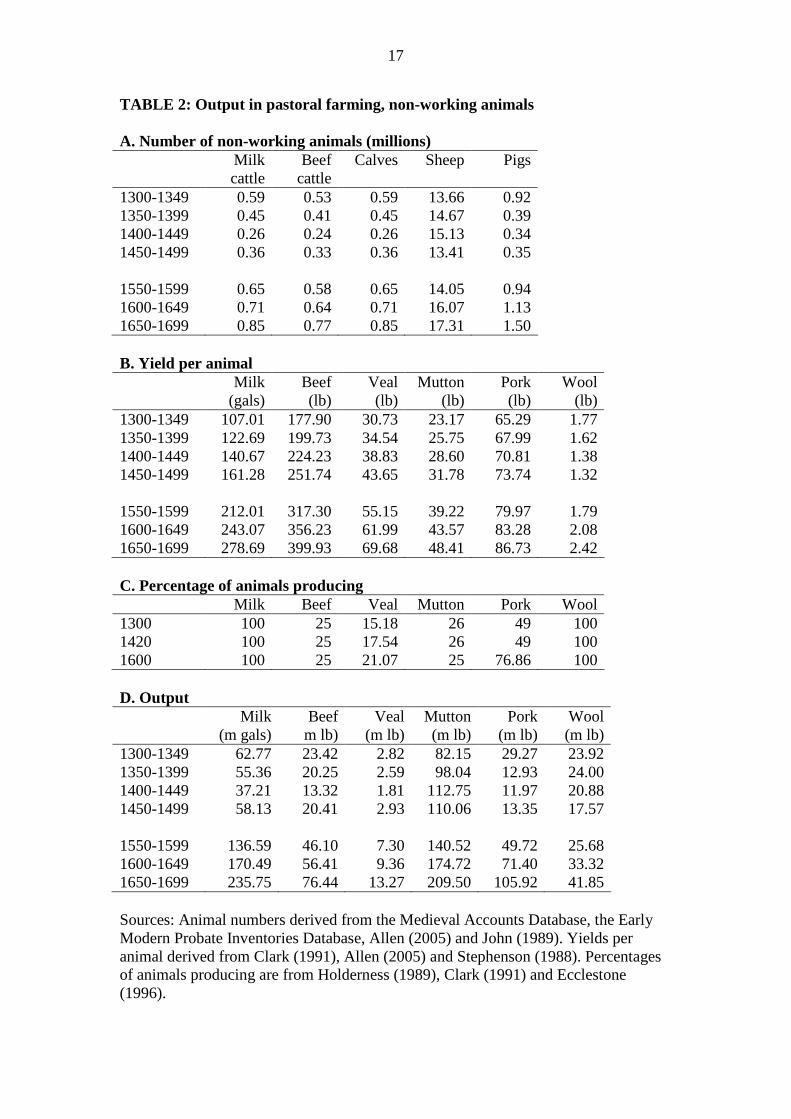
A similar procedure is used to estimate pastoral production, although here there is less
agreement in the literature over the most important magnitudes. In Table 2, we report
in panel A our estimates of the number of non-working animals, drawn from the
Medieval Accounts Database and the Early Modern Probate Inventories Database.
Panel B presents our estimates of the yield per animal, drawn from a number of
sources, including Campbell (2000), Allen (2005) and Clark (1991). To derive the
output estimates in panel C, it is necessary to work out the number of animals
slaughtered each year. Here, we start from the assumption of Holderness (1989: 147)
that each year a quarter of the stock of cattle and sheep and all pigs, apart from those
retained for breeding, was slaughtered. This was modified with estimates for 1300
from Clark (1991). The volume of milk produced is used to derive the output of the
dairy sector.
Additional assumptions were needed to derive the output of hay for non-farm
animals and hides for leather in Table 3. For hay, the number of non-farm horses is
combined with an assumption of 2.4 tons of hay per horse from Allen (1994: 102).
The number of non-farm horses is obtained from Allen (1994: 102) for 1700 and
Wrigley (2006: 450) for 1300. Between 1300 and 1425, we assumed that non-farm
horses grew in line with farm horses from Campbell (2000). Hides are derived from
slaughtered cattle, horses, oxen and sheep, with yields from Clark (1991: 216) and
Clarkson (1989: 470).
As with arable production, the volumes of pastoral production can be
multiplied by the prices of individual products from Clark (2004) to yield production
values. Note that for the dairy sector, total milk production is divided between cheese,
6
butter and fresh milk on the basis of assumptions derived from Biddick (1989) and
Holderness (1989).
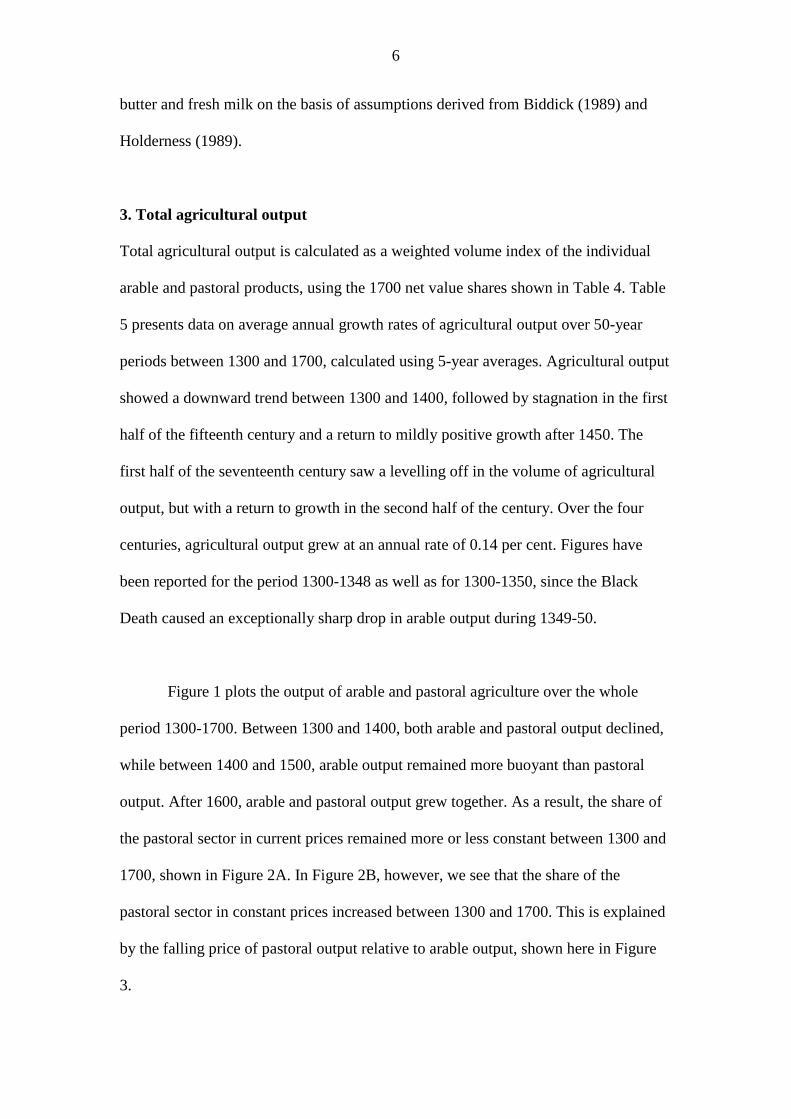
3. Total agricultural output
Total agricultural output is calculated as a weighted volume index of the individual
arable and pastoral products, using the 1700 net value shares shown in Table 4. Table
5 presents data on average annual growth rates of agricultural output over 50-year
periods between 1300 and 1700, calculated using 5-year averages. Agricultural output
showed a downward trend between 1300 and 1400, followed by stagnation in the first
half of the fifteenth century and a return to mildly positive growth after 1450. The
first half of the seventeenth century saw a levelling off in the volume of agricultural
output, but with a return to growth in the second half of the century. Over the four
centuries, agricultural output grew at an annual rate of 0.14 per cent. Figures have
been reported for the period 1300-1348 as well as for 1300-1350, since the Black
Death caused an exceptionally sharp drop in arable output during 1349-50.
Figure 1 plots the output of arable and pastoral agriculture over the whole
period 1300-1700. Between 1300 and 1400, both arable and pastoral output declined,
while between 1400 and 1500, arable output remained more buoyant than pastoral
output. After 1600, arable and pastoral output grew together. As a result, the share of
the pastoral sector in current prices remained more or less constant between 1300 and
1700, shown in Figure 2A. In Figure 2B, however, we see that the share of the
pastoral sector in constant prices increased between 1300 and 1700. This is explained
by the falling price of pastoral output relative to arable output, shown here in Figure
3.

7
III. INDUSTRIAL PRODUCTION
For the period before 1700, it is possible to obtain volume measures of some of the
key industries, including woollen textiles, iron, coal, tin and books. Exports of wool
and woollen cloth are given by Carus-Wilson and Coleman (1963) for the period
1280-1554. However, the export of wool is negatively related to the export of cloth,
so we use the production of wool from agriculture minus wool exports as an indicator
of the woollen textile industry. King (2005) provides data on bar iron production for
the period 1490-1700. The output of coal in the 1560s and circa 1700 is taken from
Hatcher (1993: 68), interpolated using shipments of coal from Newcastle, taken from
Nef (1932: 380-381). Book production is measured by the index of new English
language book titles obtained from the English Short Title Catalogue
(http://www.rlg.org/estc.html). Tin output is available on an annual basis for the
whole period from 1300 with relatively few gaps, from Hatcher (1973: 156-159) and
Mitchell (1988: 303-304).
We provide two indices of industrial production, using the weighting schemes
shown in Table 6. For Index 1, the weights are taken from Broadberry, Földvári and
van Leeuwen (2006), based on Hoffmann (1955), with an allowance for the printing
industry. However, this index makes no allowance for the food and building
industries, and therefore most likely overstates the growth rate for industry as a whole
by over-weighting rapidly growing sectors such as iron, coal and books. This is
countered in Index 2 by the inclusion of food processing, assumed to grow in line
with agricultural output, and building, assumed to grow in line with population.

8
Table 7 presents data on industrial growth rates over fifty year periods. As in
agriculture, there was a sharp increase in the growth rate of the industrial sector after
1500 and a clear deceleration during the second half of the seventeenth century. Both
movements are clearly visible in Figure 4, and apply equally to both series.
IV. SERVICES
Our treatment of the service sector is inspired by the approach of Deane and Cole
(1967), who broke eighteenth century services down into government, commerce, and
housing and other services. For government, we use an 11-year moving average of
real government revenue from O’Brien and Hunt (1999), which is available for the
whole period from the European State Finance Database at
http://www.le.ac.uk/hi/bon/ESFDB/frameset.html. We follow Deane and Cole in
assuming that commerce grew in line with industry, which means that we have two
variants of the service sector output index, depending on whether we use Index 1 or
Index 2. Housing and other services are assumed to grow in line with population, as in
Deane and Cole.
The weights for services are shown in Table 8, and are taken from the 1688
shares in Crafts (1985: 16). The resulting series for total service sector output are
plotted in Figure 5, and the growth rates presented in Table 9. Because of the
importance of housing and other services, which are assumed to move in line with
population, total service sector output trended downwards between 1300 and 1500,
before picking up strongly between 1500 and 1650. The fall in the growth rate during
the second half of the seventeenth century was less pronounced than in industry or

9
agriculture. These trends are equally apparent in both Index 1 and Index 2, graphed
here in Figure 5.
V. REAL GDP, POPULATION AND GDP PER CAPITA
It is now possible to construct an index of real GDP from the above series for
agriculture, industry and services, using the sectoral weights from Crafts (1985) for
circa 1700, shown here in Table 10. The resulting series can be used to calculate
growth rates over 50-year periods, presented in Table 11. Again , there are two series,
depending on whether we use Index 1 or Index 2 in industry (and hence also in
services). Again, both series show similar patterns, with GDP falling slightly between
1300 and 1500, before showing strong growth between 1500 and 1650 and slower
growth between 1650 and 1700. Over the whole period 1300-1700, the English
economy averaged a growth rate of between 0.18 and 0.21 per cent per annum.
Ultimately, we are interested in what happened to GDP per capita, the most
widely accepted indicator of material living standards over the long run. Although the
population of England has been firmly reconstructed by Wrigley and Schofield (1989)
and Wrigley, Davies, Oeppen and Schofield (1997) for the period since the
compulsory registration of births, marriages and deaths, estimates before 1541 are
more speculative. The data in Table 12 are based on the estimates of Wrigley, Davies,
Oeppen and Schofiled (1997), interpolated using Wrigley and Schofield (1989) for the
period 1600-1871 and Overton and Campbell (1996) for earlier years. We have taken
the mean of the Overton and Campbell estimates, which were reported on the basis of
upper and lower bounds. Additional observations have been added between 1300 and
1380 by interpolation using assumptions derived from the literature. This involves the

10
assumption of a slow rate of decline in the population, punctuated by the dramatic
decline of the Black Death years 1348-51 and a number of smaller crises. It should be
noted that these population estimates are at the lower end of the range of possibilities
that have been suggested for the end of the thirteenth century, with Hatcher (1977)
and Smith (1991) arguing for a population of 6 million around 1300, compared with
the range of 4.0 to 4.5 million suggested by Overton and Campbell (1996). However,
as Overton and Campbell (1996) point out, such a high population estimate has
implications for other variables such as land use, crop combinations, yields and
kilocalorie extraction rates and the share of the population living in towns, which
would be hard to square with other evidence.
Combining the population data with the real GDP series produces our
estimates of GDP per capita growth in Table 13. Again there are two series depending
on whether Index 1 or Index 2 is used for industry. The trend is of modest positive per
capita income growth throughout the period 1300-1700, at a rate of between 0.13 and
0.16 per cent per annum. We find that GDP per capita was almost constant up to
1348, but received a sharp boost with the Black Death, and continued to grow during
the rest of the fourteenth century. Per capita incomes continued to grow quite
modestly between 1400 and 1550. Between 1550 and 1650, per capita incomes
declined slightly before returning to growth in the second half of the seventeenth
century. These trends can also be seen in Figure 9, which plots GDP per capita on
both linear and logarithmic scales.
VI. PRICES AND NOMINAL GDP

11
Real GDP can be converted to current prices by reflating the volume index by a price
index. The base year is 1688, where we have used the nominal value of GDP from
Snooks (1995: 50). This is taken from Lindert and Williamson (1982: 389), adjusted
onto an England only basis in line with the relative populations of England and
Wales. Estimates in Table 14 use two different price deflators, taken from Clark
(2006) and Phelps Brown and Hopkins (1981). The estimates using the Clark (2006)
deflator produce an estimate of GDP in 1300 which is higher than the independent
benchmark estimates of Snooks (1995) and Mayhew (1995). However, using the
Phelps Brown/Hopkins price deflator, the situation is less clear-cut. Using GDP1, our
estimate of nominal GDP in 1300 is lower than suggested by both Snooks and
Mayhew. However, if we use GDP2, our estimate for 1300 falls between those of
Snooks and Mayhew.
VII. OUTPUT AND INCOME BASED MEASURES
Figure 10 charts the level of real wages between 1300 and 1700, which can be
compared with the level of GDP per capita in Figure 10A. Note that while the real
wage series is stationary, our estimates suggest positive trend growth of around 0.2
per cent per annum in per capita GDP between 1300 and 1700. We now investigate
the compatibility between our output-based estimates and the real wage data. One
possibility is simply that payments to other factors grew very rapidly, so that there
was a sharp redistribution of income away from labour. However, there is no evidence
to suggest that this was the case, and indeed it has never been seriously suggested in
the literature. We are thus left with the possibility that the daily real wage is not a
good guide to the annual earnings of workers because of an increase in the number of
days worked per year. This idea has been argued most forcefully by de Vries (1994),

12
who coined the term “Industrious Revolution” to describe the extra effort made by
workers to increase their incomes in order to purchase the growing variety of
consumer goods appearing during the early modern period.
The quantitative implications of this approach have been explored by van
Zanden (2005) in the context of a Cobb-Douglas production function, which has the
property of maintaining constant factor shares. For the period 1500-1800, van Zanden
shows that it is possible to reconcile a 20 per cent fall in the real wage with a doubling
of annual per capita income so long as there was a substantial increase in the number
of days worked per year. Without the increase in the number of days worked, the
share of wages in national income would have fallen sharply. Starting from the initial
assumption of a constant 50 per cent of the population working, van Zanden shows
that the days worked per year must have increased from 200 to 350. It has been
suggested by de Vries (1993: 110-111) that the number of feast days lost following
the reformation was of the order of 50, while Voth (1998) argues for the loss of a
further 50 holidays with the decline of “St. Monday”. However, it seems unlikely that
most male labourers worked more than 300 days, so some of the extra days worked
must have come from the increased labour supply of women and children.
The evidence on changes in the number of days worked and the reconciliation
between output-based and income-based measures is most fruitfully pursued in the
context of the agricultural sector, where the evidence is most abundant. In the national
accounting framework, the value of net output should equal the value of the factor
payments to labour, land and capital. Starting on the income side, to calculate
payments to labour, we need data on daily wages and the number of days worked. The

13
agricultural population in Table 12 is taken from Overton and Campbell (1996), who
start with the total population and subtract estimates of the urban and the rural non-
agricultural population. This is converted into the number of agricultural families in
Table 15 on the assumption that the average family consisted of two adults and 2.5
children (Allen, 2005). Allen then calculates the number of days needed to produce
the output and divides this by the number of families to arrive at the days worked per
family. We are close to Allen’s figures for days worked per family in 1300 and 1700,
but not for 1500, for two reasons. First, our estimate of output in 1500 is substantially
lower than that of Allen, who finds that despite a halving of the population,
agricultural output increased between 1300 and 1500. Second, the substantial increase
in days worked which Allen requires would be hard to square with most accounts of
the response to the Black Death, which suggest a decline in labour intensity (Bowden,
1967: 593-594). We thus find a substantial increase in days worked per family
between 1500 and 1700, consistent with an “industrious revolution”. Following
Burnett (2004), we correct the male daily wage for the percentage women working
and their daily wages.
Panel B of Table 15 requires data on rents and total acreage. Rents are
obtained from the data of Clark (2002) and Turner, Beckett and Afton (1997). The
acreage has to include pasture and meadow as well as arable land, and the former two
are taken from Allen (2005). Capital costs and tithes and taxes for benchmarks are
also taken from Allen (2005). Adding together wages, rents, capital income and tithes
and taxes yields the total incomes in Panel C, which matches reasonably well the
value of output.

14
VIII. WEALTH AND THE NATIONAL BALANCE SHEET
Table 16 presents data on probate inventory totals for Cornwall, Hertfordshire, Kent,
Lincolnshire and Worcestershire, which are used by Overton (2006) to make
inferences about what was happening to personal wealth in England between 1550
and 1750. The figures have been adjusted for the omission of the poorest 40 per cent
of the distribution, who were assumed to have wealth of £1. Given the high degree of
positive skewness and inequality in the distribution, indicated by the Pearson measure
of skewness and the Gini coefficient, respectively, the median provides the best
indicator of the path in average wealth at death. Over the period of two centuries
covered, median wealth approximately doubled, from £11.31 to £22.35 in constant
prices. This represents an annual growth rate of 0.34 per cent per annum. This is a bit
higher than the growth of real per capita income, but in the same ballpark.
Interestingly, looking at the subperiods, we find a decrease in per capita wealth
between 1550 and 1620, almost exactly in the period when per capita GDP also had a
slightly negative trend. For both wealth and per capita GDP, this trend became
positive afterwards.
IX. CONCLUSION
This paper provides annual estimates of GDP for England over the period 1300-1700,
constructed from the output side. Previous studies, based on the analysis of daily real
wages, have found no trend growth over the period as a whole. In contrast, we find
per capita income growth of 0.13 to 0.16 per cent per annum, with the strongest
growth after the Black Death and in the second half of the seventeenth century, and
weaker but generally positive growth between 1400 and 1550, while the period of
population growth between 1550 and 1650 was characterised by slightly negative per

15
capita growth. The modest trend growth in per capita income can be reconciled with
the stability of real daily wages because of an “industrious revolution”, increasing the
number of days worked per year. The positive growth of per capita income is also
consistent with the evidence of rising personal wealth from probate inventories.
Combined with the annual series for Great Britain from Broadberry, Földvári and van
Leeuwen (2006), it is now possible to track the transition to modern economic growth
in Britain using annual data for the whole period 1300-1850. The Industrial
Revolution is seen to be the culmination of a long process of economic development
and structural change, building on foundations laid in the fourteenth and seventeenth
centuries, as well as developments in the eighteenth and nineteenth centuries.

16
TABLE 1: Output in arable farming
A. Land use (millions of acres)Wheat Rye/Maslin Barley/Dredge Oats Pulses Other/
fallowTotal
arable1300 2.22 0.50 1.05 2.62 0.37 3.77 10.531380 1.52 0.30 1.01 1.55 0.39 3.22 7.981420 1.26 0.25 0.94 1.31 0.36 2.97 7.091600 1.72 0.71 1.34 1.22 0.57 2.68 8.231700 1.87 0.40 1.71 1.08 0.92 3.01 9.00
B. Yield net of seed (bushels per acre)Wheat Rye Barley Oats Pulses
1300-1349 8.24 10.36 9.46 6.60 6.141350-1399 7.46 9.21 9.74 7.49 5.861400-1449 5.89 10.46 8.44 6.55 5.421450-1499 6.48 13.96 8.56 5.95 4.49
1550-1599 7.88 9.21 8.40 7.87 7.621600-1649 10.45 16.28 11.16 10.97 8.621650-1699 11.36 14.19 12.48 10.82 8.39
C. Output net of seed (million bushels)Wheat Rye Barley Oats Pulses
1300-1349 16.37 4.45 9.77 14.71 2.291350-1399 11.60 2.89 9.78 12.05 2.231400-1449 7.68 2.87 8.15 8.73 1.991450-1499 8.95 5.82 7.96 7.65 1.82
1550-1599 12.93 5.31 10.73 9.34 4.111600-1649 18.37 7.26 16.13 12.91 5.511650-1699 20.85 6.30 20.47 11.79 8.02
D. Output net of seed and animal consumption (million bushels)Oats Pulses
1300-1349 11.91 1.151350-1399 9.54 1.121400-1449 5.84 1.001450-1499 4.18 0.91
1550-1599 5.03 2.421600-1649 7.47 3.541650-1699 4.58 5.60
Sources: Derived from the acreages, gross yields and seed rates in Overton andCampbell (1996), the Medieval Accounts Database and the Early Modern ProbateInventories Database. For consumption of oats and pulses by animals, see text.
17
TABLE 2: Output in pastoral farming, non-working animals
A. Number of non-working animals (millions)Milkcattle
Beefcattle
Calves Sheep Pigs
1300-1349 0.59 0.53 0.59 13.66 0.921350-1399 0.45 0.41 0.45 14.67 0.391400-1449 0.26 0.24 0.26 15.13 0.341450-1499 0.36 0.33 0.36 13.41 0.35
1550-1599 0.65 0.58 0.65 14.05 0.941600-1649 0.71 0.64 0.71 16.07 1.131650-1699 0.85 0.77 0.85 17.31 1.50
B. Yield per animalMilk
(gals)Beef(lb)
Veal(lb)
Mutton(lb)
Pork(lb)
Wool(lb)
1300-1349 107.01 177.90 30.73 23.17 65.29 1.771350-1399 122.69 199.73 34.54 25.75 67.99 1.621400-1449 140.67 224.23 38.83 28.60 70.81 1.381450-1499 161.28 251.74 43.65 31.78 73.74 1.32
1550-1599 212.01 317.30 55.15 39.22 79.97 1.791600-1649 243.07 356.23 61.99 43.57 83.28 2.081650-1699 278.69 399.93 69.68 48.41 86.73 2.42
C. Percentage of animals producingMilk Beef Veal Mutton Pork Wool
1300 100 25 15.18 26 49 1001420 100 25 17.54 26 49 1001600 100 25 21.07 25 76.86 100
D. OutputMilk
(m gals)Beef
m lb)Veal
(m lb)Mutton(m lb)
Pork(m lb)
Wool(m lb)
1300-1349 62.77 23.42 2.82 82.15 29.27 23.921350-1399 55.36 20.25 2.59 98.04 12.93 24.001400-1449 37.21 13.32 1.81 112.75 11.97 20.881450-1499 58.13 20.41 2.93 110.06 13.35 17.57
1550-1599 136.59 46.10 7.30 140.52 49.72 25.681600-1649 170.49 56.41 9.36 174.72 71.40 33.321650-1699 235.75 76.44 13.27 209.50 105.92 41.85
Sources: Animal numbers derived from the Medieval Accounts Database, the EarlyModern Probate Inventories Database, Allen (2005) and John (1989). Yields peranimal derived from Clark (1991), Allen (2005) and Stephenson (1988). Percentagesof animals producing are from Holderness (1989), Clark (1991) and Ecclestone(1996).

18
TABLE 3: Output in pastoral farming, working animals
A. Number of working animals (millions)Total
horsesNon-farm
horsesOxen
1300-1349 0.24 0.05 0.371350-1399 0.19 0.04 0.261400-1449 0.23 0.04 0.141450-1499 0.23 0.04 0.14
1550-1599 0.25 0.05 0.171600-1649 0.30 0.06 0.171650-1699 0.40 0.09 0.11
B. Consumption of hay by non-farm horsesMillion
tons1300 0.111325 0.091350 0.10
0.1113751400 0.121425 0.151700 0.22
C. Output of hides from working and non-working animals (million lb)Horses(m. lb)
Oxen(m. lb)
Cattle(m. lb)
Calves(m. lb)
Sheep(m. lb)
Hides(m. lb)
1300-1349 0.66 1.84 7.41 0.74 3.69 14.341350-1399 0.54 1.33 5.70 0.60 3.97 12.141400-1449 0.63 0.71 3.31 0.37 4.09 9.121450-1499 0.66 0.67 4.55 0.54 3.63 10.05
1550-1599 0.75 0.92 8.91 1.15 4.39 16.121600-1649 0.96 0.98 10.32 1.38 5.47 19.111650-1699 1.45 0.78 14.04 1.94 7.35 25.55
Sources: Non-farm horses for 1300 from Wrigley (2006), and for 1700 onwards fromAllen (1994) and Feinstein (1978). All other years obtained by interpolation on thebasis of the number of farm horses. Oxen from Campbell (2000). The assumption thateach horse consumed 2.4 tons of hay per year is taken from Allen (1994). Hide yieldsfrom Clark (1991), Ecclestone (1996) and Clarkson (1989: 470).

19
TABLE 4: Agricultural output weights
A. Arable productsYear Wheat Rye Barley Oats Pulses Total arable
products1300 20.1 2.5 6.7 6.1 1.1 36.41380 17.7 2.0 13.2 5.8 1.5 40.21420 11.8 1.8 8.3 2.9 1.1 25.91600 12.9 4.6 6.4 2.1 2.2 28.21700 22.5 3.4 11.2 1.0 3.6 41.8
B. Pastoral productsYear
Dairy Beef Pork Mutton Hay Wool Hides
Totalpastoralproducts
1300 8.1 2.2 21.4 13.9 0.7 15.8 1.3 63.61380 6.4 2.0 11.9 19.4 0.9 18.6 0.7 59.81420 4.6 1.3 14.9 29.1 1.6 20.7 1.9 74.11600 12.5 3.4 31.9 10.6 1.2 10.3 1.9 71.81700 13.9 3.8 19.0 10.6 3.1 6.5 1.4 58.2
Source: Derived from volumes in Tables 1-3 and prices from Clark (2004).
TABLE 5: Output growth in agriculture in constant 1700 prices (5-year movingaverages)
Arable sector(% per
annum)
Pastoralsector
(% perannum)
Totalagriculture
(% perannum)
1300-1350 -1.52 -0.09 -0.68
1300-1348 -1.05 -0.26 -0.681348-1400 -0.08 -0.52 -0.291400-1450 -0.22 0.27 0.021450-1475 0.76 0.09 0.421475-1555 0.20 0.39 0.291555-1600 0.34 0.48 0.421600-1650 -0.64 0.56 0.091650-1700 1.15 0.02 0.42
1300-1700 0.04 0.24 0.14
Source: Derived from Appendix 1. Growth rates calculated using 5-year averages.

20
TABLE 6: Industrial output weights in 1739-1761 (%)
Index 1 Index 2Tin 1.2 0.9Iron 13.4 5.6Books 9.8 4.4Coal 9.6 4.0Woollens 66.0 64.5Food 0.0 10.7Building 0.0 9.9Total 100.0 100.0
Source: Derived from Hoffmann (1955), as described in Broadberry, Földvári and vanLeeuwen (2006).
TABLE 7: Growth of industrial production (% per annum)
Index 1 Index 21300-1350 0.62 0.161350-1400 0.16 0.001400-1450 0.18 0.141450-1490 0.10 0.091490-1560 0.74 0.481560-1600 0.94 0.691600-1650 0.46 0.451650-1700 0.18 0.14
1300-1700 0.43 0.27
Source: Derived from Appendix 1. Growth rates calculated using 5-year averages.

21
TABLE 8: Service sector weights, circa 1700
(%)Commerce 37.2Housing and domestic 46.5Government 16.3Total 100.0
Source: Crafts (1985: 16).
TABLE 9: Growth of service sector output (% per annum)
Index 1 Index 21300-1350 -0.26 -0.281350-1400 -0.36 -0.351400-1450 -0.05 -0.041450-1490 0.02 0.031490-1560 0.54 0.421560-1600 0.77 0.681600-1650 0.62 0.621650-1700 0.44 0.42
1300-1700 0.22 0.19
Source: Derived from Appendix 1. Growth rates calculated using 5-year averages.

22
TABLE 10: Sectoral shares in GDP, circa 1700 (%)
(%)Agriculture 37Industry 20Services 43Total 100
Source: Crafts (1985: 16).
TABLE 11: Growth of GDP (% per annum)
Index 1 Index 21300-1348 -0.15 -0.16
1300-1350 -0.27 -0.291350-1400 -0.31 -0.321400-1450 0.03 0.031450-1490 0.09 0.091490-1560 0.61 0.511560-1600 0.64 0.561600-1650 0.50 0.501650-1700 0.32 0.31
1300-1700 0.21 0.18
Source: Derived from Appendix 1. Growth rates calculated using 5-year averages.

23
TABLE 12: Population
A. Levels of total and agricultural population (millions)Total
populationAgricultural
population1300 4.25 3.341348 3.83 3.011351 2.56 2.011380 2.37 1.791520 2.20 1.651600 4.12 2.871700 5.20 2.78
B. Growth rates of total and agricultural population (% per annum)Total
populationAgricultural
population1300-1348 -0.22 -0.22
1300-1350 -0.74 -0.741350-1400 -0.44 -0.531400-1450 -0.05 -0.061450-1490 -0.05 -0.061490-1550 0.43 0.371550-1600 0.78 0.691600-1650 0.51 0.251650-1700 -0.04 -0.31
1300-1700 0.05 -0.05
Source: Derived from Overton and Campbell (1996); Wrigley, Davies, Oeppen andSchofield (1997), interpolated using Wrigley and Schofield (1989).

24
TABLE 13: Growth of GDP per capita (% per annum)
Index 1 Index 21300-1348 0.00 -0.01
1300-1350 0.60 0.581350-1400 0.20 0.191400-1450 0.09 0.091450-1490 0.15 0.141490-1560 0.18 0.081550-1600 -0.14 -0.221600-1650 -0.01 -0.011650-1700 0.36 0.35
1300-1700 0.16 0.13
Source: Derived from Appendix 1. Growth rates calculated using 5-year averages.Note that 1300-1350 is an outlier because of the sharp drop in population during theBlack Death.
TABLE 14: GDP in current prices (£m)
A. Clark price deflatorGDP1 GDP2 Snooks Mayhew
1300 5.08 5.57 4.07 4.661380 4.26 4.621490 4.34 4.701600 30.48 30.701688 50.80 50.80 50.801700 70.06 70.01
B. Phelps Brown/Hopkins price deflatorGDP1 GDP2
1300 3.84 4.361380 3.26 3.651490 3.43 3.831600 31.61 31.841688 50.80 50.801700 68.31 68.26
Sources: GDP1 and GDP2 from Appendix 1; Price deflators from Clark (2006) andPhelps Brown and Hopkins (1981); Other benchmark estimates from Snooks (1995:50) and Mayhew (1995: 58).

25
TABLE 15: Income and output values in agriculture
A. Annual wage billAgricultural
families(millions)
Daysworked
perfamily
Totaldays
worked(millions)
Wage(d per
day)
Wage bill(£m)
1300 0.74 381 282 1.26 1.48
1380 0.40 331 132 2.93 1.61
1450 0.38 266 102 3.40 1.44
1600 0.64 404 258 6.22 6.68
1700 0.62 405 249 8.94 9.29
B. Rents and other non-wage incomesRent
(s. peracre)
Acres(millions)
Total rent(£m)
Capitalcosts(£m)
Tithesand taxes
(£m)
1300 0.941 12.53 0.59 0.30 0.45
1380 0.931 10.73 0.50 0.30 0.30
1450 0.922 11.09 0.51 0.27 0.20
1600 6.588 15.21 5.01 2.17 1.05
1700 11.731 18.98 11.13 2.88 2.13
C. Income and output values (£m)Total
incomesValue of
output
1300 2.82 2.99
1380 2.71 2.74
1450 2.42 2.26
1600 14.91 15.50
1700 25.43 25.87
Sources: See text.

26
TABLE 16: Probate inventory totals for Cornwall, Hertfordshire, Kent,Lincolnshire and Worcestershire at constant prices adjusted for the poor
Mean (£) Median (£) SD (£) Skewness CV Gini1550-59 34.17 11.31 63.69 1.08 1.86 0.651560-69 35.29 11.41 72.44 0.99 2.05 0.691570-79 40.75 11.44 82.60 1.06 2.03 0.701580-89 40.21 10.59 79.80 1.11 1.98 0.711590-99 47.44 10.69 95.47 1.15 2.01 0.731600-09 40.30 9.54 79.51 1.16 1.97 0.741610-19 41.21 8.15 94.11 1.05 2.28 0.761620-29 47.01 8.87 112.71 1.02 2.40 0.771630-39 48.09 8.57 109.32 1.08 2.27 0.761640-49 63.39 14.28 160.62 0.92 2.53 0.761650-59 57.90 19.02 95.08 1.23 1.64 0.701660-69 67.03 14.02 144.83 1.10 2.16 0.761670-79 83.00 15.23 221.44 0.92 2.67 0.781680-89 87.33 16.67 235.63 0.90 2.70 0.781690-99 90.38 16.72 174.87 1.26 1.93 0.751700-09 89.50 16.54 180.41 1.21 2.02 0.761710-19 109.42 17.45 233.44 1.18 2.13 0.761720-29 110.78 18.63 227.02 1.22 2.05 0.761730-39 125.43 23.94 306.32 0.99 2.44 0.751740-49 123.72 22.35 240.47 1.26 1.94 0.75
Source: Overton (2006).

27
FIGURE 1: Output in arable and pastoral agriculture (1700=100, log scale)
1
10
100
1000
1300 1350 1400 1450 1500 1550 1600 1650 1700
Pasture
Arable
Total

28
FIGURE 2: Share of pasture in total agricultural output
A. At current prices
0%
10%
20%
30%
40%
50%
60%
70%
80%
90%
100%
1300 1350 1400 1450 1500 1550 1600 1650 1700
B. At constant 1700 prices
0%
10%
20%
30%
40%
50%
60%
70%
80%
90%
1300 1350 1400 1450 1500 1550 1600 1650 1700

29
FIGURE 3: Ratio of pastoral to arable prices (1700=100)
0
50
100
150
200
250
300
350
400
450
500
1300 1350 1400 1450 1500 1550 1600 1650 1700
FIGURE 4: Industrial production indices (1700=100, log scale)
-
20.00
40.00
60.00
80.00
100.00
120.00
1300 1325 1350 1375 1400 1425 1450 1475 1500 1525 1550 1575 1600 1625 1650 1675 1700
aggregation industry 1
aggregation industry 2

30
FIGURE 5: Service sector output (1700=100, log scale)
1
10
100
1300 1350 1400 1450 1500 1550 1600 1650 1700
services 1
services 2
FIGURE 6: Real GDP (1700=100, log scale)
10
100
1000
1300 1350 1400 1450 1500 1550 1600 1650 1700
GDP 1
GDP 2

31
FIGURE 7: Total and agricultural population (millions)
0
1
2
3
4
5
6
1300 1350 1400 1450 1500 1550 1600 1650 1700
Agricultural population
Total population
FIGURE 8: Share of agricultural population in the total population (%)
0%
20%
40%
60%
80%
100%
1300 1350 1400 1450 1500 1550 1600 1650 1700
Agricultural population Other population

32
FIGURE 9: Real GDP per capita
A. 1700=100, linear scale
0
20
40
60
80
100
120
1300 1350 1400 1450 1500 1550 1600 1650 1700
GDP1
GDP2
B. 1700=100, log scale
10
100
1000
1300 1350 1400 1450 1500 1550 1600 1650 1700
GDP1
GDP2

33
FIGURE 10: Daily real wage of unskilled building workers (1700=100)

34
APPENDIX 1: VOLUME INDICES (1700=100)
year agriculture industry1 industry2 services1 services 2 GDP1 GDP2
1300 55.40 20.25 36.03 41.38 47.14 42.34 47.97
1301 58.74 13.78 29.57 39.26 44.91 41.37 46.96
1302 53.38 23.39 39.08 42.27 48.06 42.60 48.23
1303 55.33 16.07 31.57 39.64 45.23 40.73 46.23
1304 50.15 13.31 28.03 38.73 44.02 37.87 43.09
1305 57.80 8.94 24.21 37.28 42.67 39.20 44.57
1306 51.61 11.13 25.82 37.37 42.61 37.39 42.58
1307 57.53 10.26 25.56 36.97 42.39 39.23 44.62
1308 58.42 12.93 28.43 37.58 43.12 40.36 45.84
1309 56.45 13.07 28.34 37.33 42.79 39.55 44.96
1310 54.48 18.66 33.94 39.24 44.80 40.76 46.21
1311 56.50 16.22 31.60 38.45 44.01 40.68 46.15
1312 57.61 13.79 29.16 37.66 43.16 40.26 45.71
1313 57.28 14.42 29.77 37.59 43.09 40.24 45.68
1314 52.64 22.77 38.07 40.30 45.95 41.36 46.85
1315 42.91 17.34 31.22 38.56 43.63 35.92 40.88
1316 32.95 27.69 41.06 41.67 46.74 35.65 40.50
1317 44.81 24.41 38.91 40.56 45.96 38.90 44.12
1318 51.71 19.93 34.93 38.87 44.36 39.83 45.19
1319 50.05 18.88 33.63 38.20 43.59 38.72 43.99
1320 53.48 16.11 31.07 37.46 42.87 39.12 44.43
1321 40.83 17.82 31.44 37.81 42.80 34.93 39.80
1322 41.53 27.65 41.86 40.76 46.11 38.42 43.57
1323 50.56 20.30 35.11 38.48 43.91 39.31 44.61
1324 45.78 21.25 35.56 38.68 43.95 37.82 42.95
1325 49.29 20.84 35.50 38.26 43.64 38.85 44.10
1326 52.73 22.12 37.22 38.43 43.99 40.46 45.87
1327 49.36 16.94 31.37 36.77 42.00 37.46 42.60
1328 37.80 21.95 35.33 38.41 43.39 34.89 39.71
1329 47.01 17.78 31.95 36.98 42.15 36.85 41.91
1330 50.09 18.80 33.35 37.21 42.53 38.29 43.49
1331 42.09 17.69 31.27 36.62 41.58 34.86 39.71
1332 47.39 15.78 29.84 35.94 41.04 36.15 41.15
1333 57.57 17.48 32.79 36.60 42.14 40.54 45.98
1334 49.00 14.37 28.49 35.49 40.58 36.26 41.28
1335 46.96 14.61 28.49 35.70 40.72 35.65 40.58
1336 48.52 21.76 36.34 38.07 43.44 38.67 43.90
1337 55.26 26.71 42.40 39.83 45.67 42.91 48.56
1338 56.26 19.72 34.98 37.94 43.51 41.07 46.52
1339 40.51 9.45 22.20 35.42 39.97 32.11 36.61
1340 51.11 20.58 35.33 39.66 45.07 40.08 45.36
1341 48.49 19.25 33.58 39.68 44.93 38.85 43.98
1342 52.44 17.82 32.46 39.45 44.78 39.93 45.15
1343 49.38 22.40 36.97 40.90 46.29 40.34 45.57
1344 54.18 21.71 36.76 40.63 46.17 41.86 47.25
1345 47.23 20.68 34.87 40.55 45.78 39.05 44.14
1346 41.64 19.58 33.06 40.42 45.40 36.70 41.54
1347 44.97 25.04 39.22 42.37 47.68 39.87 44.99
1348 47.34 24.97 39.39 42.37 47.76 40.73 45.93
1349 34.48 25.74 37.83 38.83 43.44 34.60 39.00

35
APPENDIX 1 (CONTINUED): VOLUME INDICES (1700=100)
year agriculture industry1 industry2 services1 services 2 GDP1 GDP2
1350 33.99 25.45 36.64 34.89 39.18 32.67 36.75
1351 38.89 16.57 27.02 28.90 32.77 30.13 33.89
1352 45.12 25.43 37.16 31.46 35.91 35.31 39.57
1353 46.99 25.73 37.69 31.55 36.09 36.10 40.44
1354 43.32 11.32 21.93 27.45 31.28 30.09 33.86
1355 42.56 18.48 29.48 29.84 33.93 32.27 36.23
1356 36.68 21.38 31.93 30.59 34.58 31.00 34.83
1357 36.67 17.30 27.58 29.13 32.96 29.55 33.26
1358 46.79 19.05 30.58 29.64 33.92 33.87 38.02
1359 43.88 20.20 31.49 29.90 34.12 33.13 37.20
1360 43.51 18.24 29.36 29.42 33.55 32.40 36.40
1361 39.24 22.42 33.14 29.97 34.03 31.89 35.78
1362 40.95 13.65 23.84 26.45 30.18 29.26 32.90
1363 38.27 21.88 32.08 28.26 32.14 30.69 34.39
1364 44.69 26.59 37.79 29.58 33.88 34.58 38.66
1365 39.53 18.64 28.80 26.71 30.51 29.84 33.51
1366 44.57 17.83 28.51 26.45 30.41 31.43 35.27
1367 35.80 19.48 29.28 26.96 30.66 28.74 32.29
1368 38.27 23.40 33.71 28.03 31.97 30.89 34.65
1369 36.65 22.33 32.40 27.48 31.32 29.84 33.51
1370 39.88 31.03 41.98 30.13 34.41 33.92 37.95
1371 39.07 21.43 31.72 27.04 30.94 30.37 34.10
1372 37.21 21.49 31.59 27.28 31.11 29.80 33.46
1373 44.21 22.11 33.02 27.55 31.67 32.63 36.58
1374 39.13 21.49 31.80 27.63 31.54 30.66 34.40
1375 37.12 16.21 26.00 26.28 29.92 28.28 31.80
1376 46.22 25.48 36.82 29.19 33.51 34.75 38.87
1377 48.63 24.31 35.86 28.77 33.14 35.23 39.42
1378 45.99 16.94 27.76 27.04 31.04 32.03 35.91
1379 38.75 21.97 32.41 28.81 32.77 31.12 34.91
1380 38.66 23.27 33.79 29.56 33.57 31.67 35.50
1381 38.46 23.46 33.97 29.86 33.87 31.76 35.59
1382 38.67 23.11 33.62 29.55 33.56 31.64 35.46
1383 35.70 24.62 34.91 29.96 33.92 31.02 34.77
1384 41.60 21.13 31.79 28.90 32.93 32.05 35.91
1385 35.64 24.43 34.68 29.90 33.84 30.93 34.67
1386 44.67 24.50 35.72 29.98 34.24 34.32 38.40
1387 44.50 20.29 31.17 28.92 33.00 32.96 36.89
1388 44.13 22.45 33.43 29.67 33.82 33.58 37.56
1389 38.31 22.29 32.61 29.25 33.17 31.21 34.96
1390 34.49 20.95 30.75 28.79 32.52 29.33 32.89
1391 42.06 28.92 40.06 30.94 35.26 34.65 38.73
1392 41.52 24.22 35.00 29.44 33.56 32.87 36.79
1393 37.05 19.32 29.26 28.08 31.83 29.65 33.25
1394 38.66 21.23 31.48 28.68 32.56 30.88 34.60
1395 33.84 21.56 31.30 28.76 32.47 29.20 32.74
1396 34.53 22.55 32.43 29.12 32.90 29.81 33.41
1397 34.00 25.43 35.45 29.78 33.66 30.47 34.14
1398 41.48 24.89 35.69 29.43 33.56 32.98 36.92
1399 35.16 24.85 34.94 29.43 33.32 30.64 34.33

36
APPENDIX 1 (CONTINUED): VOLUME INDICES (1700=100)
year agriculture industry1 industry2 services1 services 2 GDP1 GDP2
1400 32.62 24.07 33.83 28.89 32.66 29.31 32.88
1401 31.00 27.16 36.92 29.76 33.58 29.70 33.29
1402 34.39 26.84 36.96 29.77 33.71 30.89 34.61
1403 30.49 27.79 37.53 30.00 33.83 29.74 33.33
1404 34.34 25.10 35.10 29.02 32.88 30.20 33.87
1405 32.25 25.56 35.35 29.32 33.12 29.65 33.25
1406 33.83 22.71 32.50 28.36 32.11 29.25 32.83
1407 26.90 24.10 33.20 28.83 32.38 27.17 30.52
1408 24.57 25.17 34.08 29.31 32.81 26.73 30.01
1409 34.27 25.26 35.25 29.35 33.21 30.35 34.01
1410 32.98 28.39 38.42 30.18 34.12 30.86 34.56
1411 32.43 27.43 37.34 29.97 33.85 30.37 34.02
1412 32.44 26.28 36.12 29.68 33.51 30.02 33.64
1413 31.07 23.49 32.99 28.83 32.50 28.59 32.07
1414 27.57 24.81 33.99 29.34 32.93 27.78 31.16
1415 28.89 25.06 34.40 29.49 33.14 28.38 31.82
1416 24.52 27.52 36.57 30.22 33.81 27.57 30.93
1417 31.67 28.01 37.87 30.47 34.34 30.42 34.06
1418 26.51 26.36 35.55 30.00 33.62 27.98 31.38
1419 34.08 26.45 36.48 30.10 34.00 30.84 34.53
1420 28.46 26.68 36.10 30.28 33.99 28.89 32.37
1421 35.70 26.54 36.76 30.25 34.22 31.53 35.27
1422 35.05 25.49 35.57 29.95 33.85 30.95 34.64
1423 35.98 23.29 33.32 29.24 33.09 30.54 34.21
1424 38.05 24.11 34.44 29.35 33.31 31.52 35.29
1425 35.85 28.17 38.54 30.36 34.41 31.96 35.77
1426 36.12 25.57 35.79 29.35 33.29 31.10 34.84
1427 35.80 23.55 33.59 28.47 32.32 30.20 33.86
1428 29.54 23.10 32.42 28.03 31.64 27.61 31.02
1429 31.82 28.85 38.82 29.48 33.40 30.22 33.90
1430 35.58 29.68 40.12 29.53 33.62 31.80 35.65
1431 36.83 26.33 36.67 28.32 32.31 31.07 34.85
1432 37.22 25.79 36.15 28.30 32.29 31.10 34.89
1433 35.80 28.68 39.08 29.04 33.10 31.47 35.29
1434 36.25 31.19 41.81 29.71 33.88 32.42 36.34
1435 31.38 25.27 34.95 27.92 31.68 28.67 32.22
1436 40.33 29.83 40.80 29.50 33.77 33.57 37.60
1437 26.38 31.13 40.67 29.88 33.70 28.83 32.38
1438 28.71 34.63 44.67 30.88 34.92 30.83 34.57
1439 32.02 35.65 46.12 31.07 35.28 32.34 36.24
1440 33.05 25.38 35.24 27.89 31.71 29.30 32.91
1441 28.85 25.60 35.01 27.95 31.62 27.81 31.27
1442 30.52 28.49 38.30 28.86 32.72 29.40 33.02
1443 37.81 24.26 34.56 27.43 31.37 30.64 34.39
1444 41.34 24.64 35.35 27.66 31.75 32.12 36.02
1445 31.98 28.83 38.78 28.98 32.89 30.06 33.73
1446 35.76 23.80 33.81 27.42 31.26 29.78 33.43
1447 32.85 30.45 40.59 29.41 33.42 30.89 34.64
1448 35.40 25.42 35.49 27.89 31.78 30.18 33.86
1449 38.45 31.07 41.86 29.61 33.84 33.17 37.15

37
APPENDIX 1 (CONTINUED): VOLUME INDICES (1700=100)
year agriculture industry1 industry2 services1 services 2 GDP1 GDP2
1450 31.12 25.27 34.85 27.97 31.69 28.59 32.11
1451 38.54 29.67 40.38 29.31 33.49 32.80 36.74
1452 35.91 28.29 38.61 28.78 32.81 31.32 35.12
1453 35.70 29.76 40.16 29.10 33.17 31.67 35.51
1454 37.30 29.45 40.01 28.93 33.05 32.13 36.02
1455 49.03 25.56 37.14 27.65 32.04 35.14 39.35
1456 40.81 29.22 40.14 28.86 33.10 33.35 37.36
1457 37.54 28.71 39.24 28.53 32.62 31.90 35.77
1458 36.30 27.97 38.31 28.22 32.24 31.16 34.96
1459 39.30 29.31 40.06 28.49 32.68 32.65 36.60
1460 36.86 32.15 42.82 29.32 33.53 32.68 36.62
1461 34.08 29.58 39.76 28.34 32.33 30.71 34.46
1462 38.26 31.87 42.66 28.95 33.19 32.98 36.96
1463 33.80 27.63 37.64 27.60 31.50 29.90 33.58
1464 28.51 25.22 34.48 26.95 30.56 27.18 30.58
1465 36.21 26.40 36.58 27.21 31.15 30.38 34.11
1466 37.96 26.93 37.31 27.21 31.22 31.13 34.94
1467 38.93 26.75 37.22 27.06 31.10 31.39 35.22
1468 36.57 27.97 38.25 27.41 31.42 30.91 34.69
1469 36.03 27.32 37.51 27.38 31.34 30.57 34.31
1470 37.01 27.98 38.30 27.64 31.66 31.17 34.97
1471 33.93 32.15 42.43 28.96 33.03 31.44 35.24
1472 45.88 27.00 38.23 27.38 31.68 34.15 38.25
1473 34.87 27.32 37.46 27.53 31.47 30.20 33.93
1474 39.78 25.52 36.08 27.26 31.31 31.54 35.40
1475 44.05 26.27 37.35 27.71 31.95 33.47 37.51
1476 42.86 23.47 34.22 26.98 31.06 32.15 36.06
1477 33.17 31.54 42.05 29.52 33.67 31.27 35.16
1478 36.99 27.84 38.51 28.35 32.48 31.44 35.35
1479 39.09 28.04 38.95 28.46 32.68 32.31 36.30
1480 44.81 30.00 41.68 29.03 33.54 35.06 39.34
1481 36.28 26.67 37.15 27.99 32.04 30.79 34.63
1482 29.34 29.07 38.96 28.92 32.82 29.10 32.76
1483 30.78 32.69 42.98 29.94 34.03 30.80 34.62
1484 40.17 29.56 40.69 28.86 33.17 33.18 37.26
1485 35.03 27.96 38.38 28.01 32.06 30.60 34.42
1486 39.30 26.94 37.78 27.44 31.61 31.73 35.69
1487 43.39 27.65 38.99 27.63 31.98 33.46 37.60
1488 36.07 26.72 37.18 27.68 31.72 30.59 34.42
1489 37.88 27.46 38.17 28.37 32.51 31.70 35.63
1490 37.35 28.17 38.32 28.75 32.72 31.82 35.55
1491 37.54 32.19 42.67 30.03 34.18 33.24 37.12
1492 42.14 30.88 41.78 30.04 34.30 34.69 38.70
1493 - 29.99 - 29.85 - - -
1494 - 28.61 - 29.67 - - -
1495 - 26.16 - 29.15 - - -
1496 - 25.25 - 29.06 - - -
1497 - 29.65 - 30.97 - - -
1498 - 28.17 - 30.55 - - -
1499 - 30.15 - 30.97 - - -
38
APPENDIX 1 (CONTINUED): VOLUME INDICES (1700=100)
year agriculture industry1 industry2 services1 services 2 GDP1 GDP2
1500 - 29.05 - 30.30 - - -
1501 - 31.14 - 30.85 - - -
1502 - 33.46 - 31.56 - - -
1503 - 32.68 - 30.98 - - -
1504 - 33.90 - 31.48 - - -
1505 - 33.67 - 31.46 - - -
1506 - 32.51 - 31.00 - - -
1507 - 33.39 - 31.25 - - -
1508 - 32.33 - 30.50 - - -
1509 - 31.44 - 30.31 - - -
1510 - 29.48 - 29.70 - - -
1511 - 30.03 - 29.82 - - -
1512 - 29.76 - 29.83 - - -
1513 - 33.24 - 31.15 - - -
1514 - 35.33 - 32.11 - - -
1515 - 33.41 - 31.59 - - -
1516 - 34.10 - 31.96 - - -
1517 - 32.62 - 31.65 - - -
1518 - 34.63 - 32.28 - - -
1519 - 33.43 - 31.81 - - -
1520 - 34.93 - 32.19 - - -
1521 - 37.19 - 33.03 - - -
1522 - 36.94 - 33.03 - - -
1523 - 36.73 - 33.93 - - -
1524 - 37.45 - 34.37 - - -
1525 - 37.02 - 34.34 - - -
1526 - 35.41 - 33.82 - - -
1527 - 35.65 - 33.93 - - -
1528 - 42.84 - 36.12 - - -
1529 - 39.27 - 35.03 - - -
1530 - 39.72 - 35.27 - - -
1531 - 40.78 - 35.85 - - -
1532 - 40.44 - 36.06 - - -
1533 - 41.32 - 36.63 - - -
1534 - 38.32 - 35.11 - - -
1535 - 40.21 - 35.90 - - -
1536 - 40.01 - 35.91 - - -
1537 - 40.17 - 36.22 - - -
1538 - 39.91 - 36.34 - - -
1539 - 38.81 - 36.38 - - -
1540 - 39.38 - 36.91 - - -
1541 - 39.79 - 38.05 - - -
1542 - 39.31 - 38.63 - - -
1543 - 40.85 - 39.33 - - -
1544 - 38.81 - 39.23 - - -
1545 - 42.42 - 40.66 - - -
1546 - 43.54 - 41.26 - - -
1547 - 41.27 - 40.63 - - -
1548 - 42.41 - 41.15 - - -
1549 - 42.95 - 41.48 - - -

39
APPENDIX 1 (CONTINUED): VOLUME INDICES (1700=100)
year agriculture industry1 industry2 services1 services 2 GDP1 GDP2
1550 - 48.65 - 43.52 - - -
1551 - 44.04 - 42.36 - - -
1552 - 42.99 - 41.84 - - -
1553 54.68 45.51 51.50 42.19 44.06 47.47 49.47
1554 43.12 49.91 54.80 43.54 45.06 44.66 46.29
1555 49.97 51.17 56.78 43.75 45.49 47.54 49.41
1556 33.95 53.97 58.86 44.56 46.06 42.52 44.14
1557 54.50 51.71 58.65 43.27 45.42 49.11 51.43
1558 76.54 39.11 48.59 38.76 41.74 52.81 55.99
1559 63.69 50.60 58.00 42.59 44.88 52.00 54.46
1560 54.31 49.53 55.75 42.33 44.26 48.21 50.28
1561 48.00 54.05 59.24 44.04 45.63 47.51 49.23
1562 50.78 50.21 55.68 43.18 44.87 47.40 49.22
1563 61.80 51.57 58.16 44.02 46.06 52.11 54.31
1564 72.68 51.83 59.41 44.47 46.83 56.38 58.91
1565 72.42 51.88 59.36 44.97 47.29 56.51 59.00
1566 90.16 49.71 59.22 44.56 47.54 62.47 65.65
1567 80.40 50.12 58.59 45.04 47.68 59.14 61.97
1568 78.99 45.84 54.12 44.10 46.70 57.36 60.13
1569 67.84 50.42 57.31 45.39 47.54 54.70 57.00
1570 57.20 49.78 55.18 44.09 45.76 50.08 51.88
1571 59.30 50.96 56.45 44.12 45.82 51.10 52.93
1572 49.39 50.35 54.71 44.38 45.73 47.43 48.88
1573 68.94 54.75 60.91 46.00 47.91 56.24 58.29
1574 54.76 59.89 63.54 47.78 48.89 52.78 53.99
1575 65.44 53.35 58.17 45.96 47.45 54.65 56.25
1576 64.94 55.48 59.99 46.88 48.26 55.28 56.78
1577 44.87 59.02 61.08 48.42 49.03 49.22 49.90
1578 63.94 56.48 60.72 47.92 49.22 55.56 56.97
1579 67.55 55.43 59.80 47.73 49.08 56.60 58.05
1580 62.22 55.86 59.09 48.16 49.15 54.90 55.97
1581 54.75 60.96 63.00 50.00 50.60 53.95 54.62
1582 57.08 61.27 63.89 50.54 51.33 55.11 55.97
1583 63.12 58.34 61.63 49.83 50.83 56.45 57.54
1584 66.59 60.29 63.97 50.66 51.78 58.48 59.70
1585 52.76 63.41 65.23 51.83 52.36 54.49 55.08
1586 44.35 66.81 68.04 53.35 53.69 52.71 53.10
1587 68.65 69.74 73.63 54.38 55.55 62.73 64.01
1588 75.25 64.32 68.87 52.61 54.00 63.33 64.84
1589 62.18 64.85 67.55 53.17 53.98 58.84 59.73
1590 67.95 66.69 69.57 54.29 55.15 61.82 62.77
1591 56.24 65.71 67.05 54.07 54.45 57.20 57.63
1592 63.45 61.51 63.34 53.00 53.54 58.57 59.17
1593 76.42 61.12 64.37 52.88 53.87 63.24 64.31
1594 53.14 64.11 64.66 54.26 54.40 55.81 55.98
1595 49.28 69.70 69.66 56.50 56.44 56.47 56.44
1596 45.14 72.18 71.62 57.55 57.32 55.88 55.67
1597 37.70 76.08 74.73 58.64 58.16 54.38 53.90
1598 50.29 75.66 75.75 58.33 58.30 58.82 58.83
1599 74.19 69.37 72.25 56.66 57.52 65.69 66.63

40
APPENDIX 1 (CONTINUED): VOLUME INDICES (1700=100)
year agriculture industry1 industry2 services1 services 2 GDP1 GDP2
1600 69.12 70.37 72.74 57.31 58.01 64.29 65.07
1601 65.27 70.33 72.42 57.59 58.20 62.98 63.66
1602 82.95 67.62 71.57 57.07 58.27 68.76 70.06
1603 90.71 65.48 69.86 56.54 57.88 70.97 72.42
1604 96.19 62.50 67.51 55.69 57.24 72.04 73.71
1605 92.87 67.01 71.50 57.46 58.84 72.47 73.96
1606 94.00 67.56 72.19 57.86 59.28 73.17 74.71
1607 83.55 69.82 72.65 59.04 59.89 70.26 71.19
1608 73.79 74.00 75.75 60.72 61.23 68.21 68.78
1609 87.18 76.93 79.85 62.06 62.92 74.33 75.28
1610 94.70 75.18 78.96 61.59 62.73 76.56 77.80
1611 79.88 76.49 78.78 62.29 62.96 71.64 72.38
1612 73.31 77.48 78.75 62.73 63.07 69.59 70.00
1613 90.71 80.24 83.05 63.69 64.52 77.00 77.91
1614 98.38 78.60 82.37 63.07 64.20 79.24 80.48
1615 95.67 77.61 80.75 63.00 63.94 78.01 79.04
1616 83.07 75.90 78.17 62.37 63.04 72.73 73.48
1617 99.98 73.77 77.63 61.67 62.84 78.27 79.54
1618 93.38 74.65 77.50 62.09 62.94 76.18 77.12
1619 86.35 70.79 73.14 61.17 61.88 72.41 73.18
1620 89.87 71.59 73.82 61.77 62.44 74.13 74.87
1621 85.72 75.94 77.31 63.49 63.88 74.21 74.65
1622 67.94 80.99 80.97 65.81 65.75 69.63 69.61
1623 68.62 84.17 83.70 67.09 66.88 71.07 70.89
1624 79.65 77.34 79.92 64.76 65.53 72.79 73.63
1625 81.82 78.58 80.45 65.30 65.84 74.07 74.67
1626 75.20 77.52 78.39 64.57 64.80 71.09 71.36
1627 83.98 74.76 76.56 64.35 64.88 73.69 74.28
1628 98.56 71.82 75.61 64.54 65.70 78.58 79.84
1629 63.33 73.06 73.55 65.70 65.83 66.30 66.45
1630 60.76 81.56 80.91 68.35 68.09 68.18 67.94
1631 69.51 84.50 84.62 69.05 69.03 72.31 72.32
1632 88.54 80.42 82.80 68.29 68.99 78.21 78.99
1633 79.83 80.06 81.34 69.00 69.36 75.22 75.63
1634 78.27 79.09 81.19 69.19 69.81 74.53 75.22
1635 94.32 79.38 82.89 69.41 70.48 80.62 81.78
1636 86.85 78.35 81.29 68.32 69.20 77.18 78.15
1637 78.16 79.96 81.87 69.71 70.27 74.89 75.51
1638 78.31 84.63 85.72 70.82 71.11 76.35 76.70
1639 92.17 78.29 82.77 69.12 70.50 79.48 80.97
1640 82.30 75.54 79.85 68.53 69.86 75.03 76.46
1641 80.62 82.14 84.60 70.11 70.83 76.40 77.21
1642 74.22 84.59 83.62 71.46 71.10 75.11 74.76
1643 74.51 80.62 83.97 70.92 71.94 74.19 75.30
1644 66.26 80.20 81.53 70.58 70.97 70.91 71.34
1645 65.49 80.58 82.31 71.23 71.74 70.98 71.54
1646 59.48 82.81 83.87 72.12 72.42 69.58 69.92
1647 58.76 85.06 84.67 73.53 73.37 70.37 70.22
1648 70.56 88.35 87.92 74.75 74.57 75.92 75.76
1649 73.26 89.86 90.49 77.11 77.27 78.24 78.43

41
APPENDIX 1 (CONTINUED): VOLUME INDICES (1700=100)
year agriculture industry1 industry2 services1 services 2 GDP1 GDP2
1650 76.05 94.07 95.37 79.89 80.25 81.31 81.72
1651 87.36 87.43 91.11 79.38 80.51 83.94 85.16
1652 110.33 85.45 91.94 79.98 82.00 92.30 94.47
1653 126.20 87.27 95.17 81.21 83.67 99.07 101.71
1654 123.38 82.87 90.41 78.26 80.62 95.88 98.40
1655 130.67 79.75 89.12 77.95 80.89 97.82 100.95
1656 120.20 84.11 92.50 79.33 81.95 95.41 98.21
1657 130.40 87.62 96.21 80.11 82.78 100.22 103.08
1658 96.72 92.41 95.52 80.75 81.68 88.99 90.01
1659 88.02 96.12 97.52 81.22 81.60 86.71 87.16
1660 98.29 98.01 98.87 80.74 80.94 90.69 90.95
1661 97.81 93.20 95.71 78.91 79.65 88.76 89.58
1662 84.39 94.46 96.26 78.26 78.77 83.77 84.35
1663 91.57 88.88 90.83 75.70 76.27 84.21 84.84
1664 87.57 87.46 91.34 75.26 76.43 82.25 83.53
1665 100.33 85.12 91.56 75.11 77.10 86.44 88.59
1666 129.19 82.26 91.96 74.70 77.72 96.37 99.61
1667 131.04 81.47 89.23 73.53 75.94 96.40 98.99
1668 115.41 86.66 92.90 75.96 77.88 92.70 94.77
1669 126.09 81.35 88.49 74.85 77.07 95.11 97.49
1670 112.61 90.42 94.85 77.66 79.00 93.14 94.60
1671 104.92 86.76 91.41 76.95 78.37 89.26 90.80
1672 95.29 80.85 83.67 75.88 76.75 84.06 84.99
1673 82.18 91.32 92.12 80.19 80.40 83.15 83.40
1674 75.83 98.23 97.18 83.30 82.92 83.53 83.15
1675 80.06 96.32 96.08 82.94 82.82 84.55 84.45
1676 96.63 91.15 92.93 80.44 80.96 88.57 89.15
1677 86.82 87.88 88.11 79.55 79.59 83.91 83.97
1678 102.79 97.62 99.49 83.15 83.69 93.31 93.91
1679 93.22 94.53 94.61 82.78 82.76 88.99 89.00
1680 100.70 98.19 97.86 83.68 83.52 92.88 92.74
1681 91.55 93.36 93.34 82.07 82.03 87.84 87.81
1682 92.70 94.45 94.65 81.33 81.35 88.16 88.21
1683 111.09 96.19 97.95 81.32 81.81 95.31 95.87
1684 96.60 97.34 97.06 81.09 80.95 90.08 89.96
1685 107.57 99.42 99.57 81.47 81.45 94.71 94.74
1686 90.21 92.63 92.49 79.76 79.67 86.20 86.13
1687 119.20 91.86 94.85 79.73 80.62 96.76 97.74
1688 109.05 94.49 95.58 80.45 80.74 93.84 94.18
1689 105.88 92.54 93.14 81.35 81.50 92.67 92.85
1690 107.71 94.56 96.05 82.81 83.24 94.37 94.85
1691 107.27 88.66 91.91 82.52 83.52 92.91 93.99
1692 116.12 91.15 95.66 85.54 86.94 97.98 99.48
1693 101.13 95.28 97.94 88.72 89.53 94.62 95.50
1694 114.02 95.79 99.75 90.43 91.66 100.23 101.55
1695 106.16 93.62 95.95 91.63 92.35 97.41 98.18
1696 94.63 95.15 96.27 94.36 94.71 94.62 94.99
1697 94.16 95.57 96.86 95.34 95.74 94.95 95.38
1698 90.49 98.56 98.73 97.58 97.63 95.15 95.21
1699 97.78 97.42 98.92 98.67 99.15 98.09 98.60
1700 100.00 100.00 100.00 100.00 100.00 100.00 100.00

42
APPENDIX 2: NOMINAL GDP (£m)
year GDP1 GDP2 year GDP1 GDP2 year GDP1 GDP2
1300 5.77 6.33 1350 4.62 5.03 1400 4.18 4.54
1301 5.32 5.84 1351 4.89 5.32 1401 4.50 4.89
1302 5.32 5.82 1352 6.45 7.00 1402 5.26 5.71
1303 4.80 5.27 1353 5.22 5.65 1403 4.41 4.79
1304 4.18 4.60 1354 3.87 4.21 1404 3.87 4.20
1305 5.04 5.54 1355 4.87 5.29 1405 3.70 4.02
1306 4.66 5.13 1356 4.76 5.18 1406 3.44 3.74
1307 4.74 5.21 1357 4.77 5.20 1407 3.37 3.66
1308 5.27 5.79 1358 5.46 5.93 1408 3.78 4.10
1309 5.86 6.45 1359 4.99 5.42 1409 4.61 5.00
1310 6.84 7.50 1360 5.04 5.48 1410 5.38 5.83
1311 6.62 7.27 1361 5.04 5.47 1411 4.54 4.92
1312 5.33 5.86 1362 4.30 4.68 1412 4.01 4.34
1313 5.29 5.81 1363 5.12 5.56 1413 3.68 4.00
1314 5.69 6.24 1364 6.11 6.62 1414 3.52 3.82
1315 5.41 5.95 1365 4.75 5.16 1415 3.69 4.00
1316 7.74 8.51 1366 4.66 5.06 1416 4.21 4.57
1317 8.33 9.14 1367 4.38 4.76 1417 4.98 5.40
1318 6.26 6.87 1368 5.20 5.65 1418 4.06 4.41
1319 4.48 4.92 1369 5.13 5.58 1419 4.56 4.94
1320 5.19 5.70 1370 7.98 8.64 1420 3.79 4.10
1321 5.13 5.66 1371 5.17 5.61 1421 4.46 4.82
1322 7.62 8.36 1372 4.52 4.91 1422 4.04 4.37
1323 6.92 7.60 1373 5.50 5.97 1423 3.70 4.01
1324 5.61 6.17 1374 4.51 4.90 1424 3.93 4.26
1325 6.17 6.78 1375 5.03 5.47 1425 4.27 4.62
1326 5.46 5.99 1376 6.28 6.80 1426 3.97 4.31
1327 4.36 4.80 1377 4.83 5.23 1427 3.76 4.08
1328 4.57 5.03 1378 4.09 4.44 1428 3.38 3.68
1329 5.42 5.96 1379 3.78 4.10 1429 4.80 5.21
1330 5.70 6.27 1380 4.65 5.05 1430 4.98 5.40
1331 5.70 6.28 1381 4.55 4.94 1431 4.11 4.46
1332 5.66 6.24 1382 4.25 4.60 1432 3.81 4.13
1333 5.04 5.53 1383 4.21 4.57 1433 4.71 5.11
1334 4.41 4.86 1384 4.27 4.63 1434 4.29 4.65
1335 4.24 4.67 1385 3.99 4.33 1435 3.75 4.07
1336 4.94 5.42 1386 4.88 5.28 1436 4.54 4.92
1337 5.02 5.50 1387 4.28 4.63 1437 3.86 4.20
1338 4.43 4.85 1388 4.01 4.34 1438 5.47 5.93
1339 3.23 3.56 1389 3.54 3.84 1439 6.34 6.87
1340 5.22 5.72 1390 4.25 4.61 1440 4.46 4.85
1341 4.28 4.69 1391 5.88 6.36 1441 3.07 3.34
1342 4.68 5.12 1392 4.45 4.82 1442 3.40 3.69
1343 4.55 4.97 1393 3.40 3.69 1443 3.72 4.04
1344 5.45 5.96 1394 3.77 4.08 1444 3.84 4.16
1345 4.31 4.72 1395 3.62 3.93 1445 3.40 3.69
1346 4.28 4.69 1396 3.71 4.02 1446 3.85 4.18
1347 5.76 6.29 1397 4.60 4.99 1447 4.22 4.58
1348 6.15 6.71 1398 4.79 5.19 1448 3.86 4.19
1349 4.06 4.43 1399 4.23 4.59 1449 4.34 4.71

43
APPENDIX 2 (CONTINUED): NOMINAL GDP (£m)
year GDP1 GDP2 year GDP1 GDP2 year GDP1 GDP2
1450 3.75 4.08 1500 - - 1550 - -
1451 4.54 4.92 1501 - - 1551 - -
1452 4.19 4.54 1502 - - 1552 - -
1453 4.28 4.64 1503 - - 1553 11.04 11.47
1454 4.15 4.50 1504 - - 1554 10.72 11.07
1455 4.20 4.55 1505 - - 1555 13.84 14.33
1456 4.09 4.43 1506 - - 1556 14.69 15.20
1457 3.89 4.22 1507 - - 1557 18.60 19.41
1458 4.17 4.53 1508 - - 1558 13.05 13.79
1459 4.54 4.92 1509 - - 1559 13.80 14.40
1460 4.51 4.89 1510 - - 1560 14.11 14.66
1461 4.60 5.00 1511 - - 1561 15.18 15.67
1462 4.86 5.27 1512 - - 1562 15.02 15.54
1463 3.40 3.69 1513 - - 1563 16.64 17.28
1464 2.97 3.23 1514 - - 1564 18.67 19.44
1465 3.47 3.77 1515 - - 1565 15.51 16.14
1466 3.73 4.05 1516 - - 1566 18.22 19.07
1467 3.94 4.28 1517 - - 1567 16.44 17.17
1468 4.09 4.44 1518 - - 1568 15.99 16.70
1469 4.00 4.34 1519 - - 1569 16.70 17.33
1470 4.21 4.56 1520 - - 1570 13.97 14.42
1471 4.41 4.79 1521 - - 1571 13.81 14.25
1472 4.47 4.85 1522 - - 1572 14.03 14.40
1473 3.69 4.01 1523 - - 1573 17.86 18.45
1474 3.67 3.99 1524 - - 1574 19.82 20.20
1475 3.86 4.19 1525 - - 1575 16.99 17.42
1476 3.75 4.07 1526 - - 1576 17.70 18.11
1477 4.45 4.84 1527 - - 1577 17.81 17.99
1478 4.28 4.66 1528 - - 1578 18.32 18.72
1479 4.63 5.03 1529 - - 1579 18.25 18.65
1480 5.35 5.81 1530 - - 1580 16.94 17.21
1481 4.07 4.43 1531 - - 1581 19.42 19.59
1482 4.47 4.86 1532 - - 1582 19.47 19.70
1483 5.07 5.52 1533 - - 1583 18.94 19.23
1484 4.89 5.32 1534 - - 1584 19.55 19.88
1485 3.91 4.26 1535 - - 1585 19.31 19.45
1486 4.04 4.40 1536 - - 1586 22.32 22.40
1487 4.42 4.80 1537 - - 1587 26.94 27.39
1488 3.94 4.29 1538 - - 1588 22.35 22.79
1489 4.26 4.64 1539 - - 1589 21.71 21.96
1490 4.27 4.62 1540 - - 1590 25.40 25.70
1491 4.58 4.95 1541 - - 1591 24.05 24.15
1492 4.61 4.98 1542 - - 1592 21.71 21.85
1493 - - 1543 - - 1593 24.21 24.53
1494 - - 1544 - - 1594 24.46 24.45
1495 - - 1545 - - 1595 28.44 28.32
1496 - - 1546 - - 1596 29.91 29.69
1497 - - 1547 - - 1597 32.16 31.76
1498 - - 1548 - - 1598 32.97 32.85
1499 - - 1549 - - 1599 30.01 30.33

44
APPENDIX 2 (CONTINUED): NOMINAL GDP (£m)
year GDP1 GDP2 year GDP1 GDP2
1600 29.58 29.82 1650 63.61 63.70
1601 29.51 29.72 1651 60.82 61.48
1602 30.33 30.79 1652 61.50 62.71
1603 31.26 31.78 1653 61.25 62.66
1604 32.22 32.85 1654 50.33 51.47
1605 33.93 34.50 1655 50.89 52.33
1606 33.95 34.54 1656 57.52 59.00
1607 34.02 34.34 1657 64.51 66.11
1608 38.47 38.65 1658 61.22 61.70
1609 42.61 43.00 1659 63.23 63.32
1610 39.07 39.56 1660 61.70 61.65
1611 37.23 37.48 1661 64.19 64.54
1612 38.12 38.20 1662 63.95 64.15
1613 44.72 45.09 1663 55.65 55.87
1614 45.01 45.55 1664 54.54 55.19
1615 43.72 44.13 1665 53.16 54.28
1616 41.19 41.46 1666 56.86 58.56
1617 45.03 45.60 1667 54.47 55.73
1618 42.94 43.31 1668 52.99 53.98
1619 37.89 38.15 1669 57.70 58.93
1620 36.30 36.53 1670 56.81 57.49
1621 37.37 37.45 1671 54.03 54.77
1622 41.21 41.04 1672 49.10 49.47
1623 41.09 40.83 1673 51.99 51.96
1624 40.50 40.82 1674 59.19 58.71
1625 41.67 41.86 1675 57.30 57.02
1626 41.12 41.12 1676 50.89 51.03
1627 38.83 39.00 1677 50.88 50.74
1628 41.28 41.79 1678 59.30 59.46
1629 35.77 35.72 1679 57.01 56.81
1630 43.56 43.25 1680 56.63 56.34
1631 49.63 49.46 1681 56.10 55.88
1632 48.86 49.17 1682 54.89 54.72
1633 45.29 45.38 1683 58.34 58.48
1634 44.09 44.33 1684 56.67 56.39
1635 49.85 50.38 1685 62.78 62.57
1636 47.87 48.29 1686 50.52 50.30
1637 47.51 47.73 1687 55.15 55.51
1638 52.35 52.39 1688 50.80 50.80
1639 48.55 49.27 1689 49.00 48.92
1640 42.41 43.06 1690 52.09 52.16
1641 47.28 47.60 1691 50.56 50.96
1642 42.62 42.27 1692 62.54 63.26
1643 44.07 44.57 1693 66.98 67.36
1644 42.50 42.61 1694 69.84 70.50
1645 42.25 42.44 1695 63.55 63.82
1646 43.66 43.72 1696 69.51 69.53
1647 51.23 50.93 1697 69.80 69.86
1648 61.62 61.26 1698 74.28 74.05
1649 61.77 61.69 1699 71.52 71.63
1700 65.19 64.96

45
REFERENCESAllen, R.C. (1994), “Agriculture during the Industrial Revolution”, in Floud, R. and
McClosky, D.N. (eds.), The Economic Hiostory of Britain since 1700, SecondEdition: Volume 1: 1700-1860, Cambridge: Cambridge University Press, 96-122.
Allen, R.C. (2005), “English and Welsh Agriculture, 1300-1850: Output, Inputs andIncome”, Nuffield College, Oxford,http://www.nuff.ox.ac.uk/General/Members/homepage.aspx?nuffid=ALLERC00.
Beveridge, W. (1939), Prices and Wages in England from the Twelfth to theNineteenth Century, Vol. I, Price Tables: Mercantile Era, London: Longmans,Green.
Biddick, K. (1989), The Other Economy: Pastoral Husbandry on a Medieval Estate,Berkeley: University of California Press.
Bowden, P. (1967), “Agricultural Prices, Farm Profits, and Rents”, in Thirsk, J. (ed.),The Agrarian History of England and Wales, Volume IV: 1500-1640,Cambridge: Cambridge University Press, 593-695.
Broadberry, S. and van Leeuwen, B. (2008), “British Economic Growth and theBusiness Cycle, 1700-1850: Annual Estimates”, University of Warwick,http://www2.warwick.ac.uk/fac/soc/economics/staff/faculty/broadberry/wp/.
Burnett, J. (2004), “The Wages and Employment of Female Day-Labourers in EnglishAgriculture, 1740-1850”, Economic History Review, 57, 664-690.
Campbell, B.M.S. (2000), English Seigniorial Agriculture, 1250-1450, Cambridge:Cambridge University Press.
Campbell, B.M.S. (2007), Three centuries of English crop yields, 1211-1491 [WWWdocument]. URL http://www.cropyields.ac.uk.
Carus-Wilson, E.M. and Coleman, O. (1963), England’s Export Trade, 1275-1547,Oxford: Clarendon.
Clark, G. (1991), “Labour Productivity in English Agriculture, 1300-1860”, inCampbell, B.M.S. and Overton, M. (eds.), Land, Labour and Livestock:Historical Studies in European Agricultural Productivity, Manchester:Manchester University Press, 211-235.
Clark, G. (2002), “Land Rental Values and the Agrarian Economy: England andWales, 1500-1914”, European Review of Economic History, 6, 281-308.
Clark, G. (2004), “The Price History of English Agriculture, 1209-1914”, Research inEconomic History, 22, 41-125.

46
Clark, G. (2005), “The Condition of the Working-Class in England, 1209-2004”,Journal of Political Economy, 113, 1307-1340.
Clark, G. (2006), “The Long March of History: Farm Wages, Population andEconomic Growth: England 1209-1869”, presented at International EconomicHistory Congress, Helsinki, Session 122, Progress, Stasis, and Crisis:Demographic and Economic Developments in England and Beyond,ADc.1000-c.1800, http://www.helsinki.fi/iehc2006/sessions81_124.html.
Clark, G. (2007), A Farewell to Alms: A Brief Economic History of the World,Princeton: Princeton University Press.
Clarkson, L.A. (1989), “The Manufacture of Leather”, in Mingay, G.E. (ed.), TheAgrarian History of England and Wales, Volume VI: 1750-1850, Cambridge:Cambridge University Press, 466-485.
Crafts, N.F.R. (1985), British Economic Growth during the Industrial Revolution,Oxford: Clarendon.
Deane, P. and Cole, W.A. (1967), British Economic Growth, 1688-1959: Trends andStructure, 2nd edition, Cambridge: Cambridge University Press.
Ecclestone, M. J. (1996), “Dairy Production on the Glastonbury Abbey Demesnes1258-1334”, unpublished M.A. dissertation, University of Bristol.
Hatcher, J. (1973), English Tin Production and Trade before 1550, Oxford:Clarendon Press.
Hatcher, J. (1977), Plague, Population and the English Economy, 1348-1530,London: Macmillan.
Hatcher, J. (1993), The History of the British Coal Industry, Volume 1, Before 1700:Towards the Age of Coal, Oxford; Oxford University Press.
Hoffmann, W.G. (1955), British Industry 1700-1950, Oxford: Blackwell.
Holderness, B.A. (1989), “Prices, Productivity, and Output”, in Mingay, G.E. (ed.),The Agrarian History of England and Wales, Volume VI: 1750-1850,Cambridge: Cambridge University Press, 84-189.
John A.H. (1989), “Statistical Appendix”, in Mingay G. E. (ed.), The AgrarianHistory of England and Wales, Volume VI: 1750-1850, Cambridge,Cambridge University Press, 972-1155.
King, P. (2005), “The Production and Consumption of Bar Iron in Early ModernEngland and Wales”, Economic History Review, 58, 1-33.
Langdon, J. (1982), “The Economics of Horses and Oxen in Medieval England”,Agricultural History Review, 30, 31-40.
47
Langdon, J. (1986), Horses, Oxen and Technological Innovation: The Use of DraughtAnimals in English Farming from 1066 to 1500, Cambridge: CambridgeUniversity Press.
Lindert, P.H. and Williamson, J.G. (1982), Revising England’s Social Tables 1688-1913”, Explorations in Economic History, 19, 385-408.
Mayhew, N. (1995), “Modelling Medieval Monetisation”, in Britnell, R. andCampbell, B.M.S. (eds.), A Commercialising Economy: England 1086 to c.1300, Manchester, Manchester University Press, 55-77.
Mitchell, B.R. (1988), British Historical Statistics, Cambridge: Cambridge UniversityPress.
Nef, J.U. (1932), The Rise of the British Coal Industry, Volume II, London:Routledge.
O’Brien, P.K. and Hunt, P.A. (1999), “England, 1485-1815”, in Bonney, R. (ed.), TheRise of the Fiscal State in Europe, c.1200-1850, Oxford: Oxford UniversityPress, 53-100.
Overton, M. (2006), “Household Wealth, Indebtedness, and Economic Growth inEarly Modern England”, presented at International Economic HistoryCongress, Helsinki, Session 122, Progress, Stasis, and Crisis: Demographicand Economic Developments in England and Beyond, ADc.1000-c.1800,http://www.helsinki.fi/iehc2006/sessions81_124.html.
Overton, M. and Campbell, B.M.S. (1996), “Production et productivité dansl’agriculture anglais, 1086-1871”, Histoire et Mesure, 11, 255-297.
Overton, M., Whittle, J., Dean, D. and Haan (2004), A., Production and Consumptionin English Households, 1600-1750, London: Routledge.
Phelps Brown, H. and.Hopkins, S.V. (1981), A Perspective of Wages and Prices,London: Methuen.
Smith, R.M. (1991), “Demographic Developments in Rural England, 1300-1348: ASurvey”, in Campbell, B.M.S. (ed.), Before the Black Death: Studies in the“Crisis” of the Early Fourteenth Century, Manchester: Manchester UniversityPress, 25-77.
Snooks, G.D. (1995), “The Dynamic Role of the Market in the Anglo-NormanEconomy and beyond, 1086-1300”, in Britnell, R. and Campbell, B.M.S.(eds.), A Commercialising Economy: England 1086 to c. 1300, Manchester,Manchester University Press, 27-54.
Stephenson, M. J. (1988), “Wool Yields in the Medieval Economy”, EconomicHistory Review, 61, 368-91.

48
Thorold Rogers, J.E. (1886-1902), A History of Agriculture and Prices in England,Volumes 3-7, Oxford: Clarendon Press.
Turner, M.E., Beckett, J.V. and Afton, B. (1997), Agricultural Rent in England, 1690-1914, Cambridge: Cambridge University Press.
Voth, H.-J. (1998), “Time and Work in Eighteenth-Century London”, Journal ofEconomic History, 58, 29-58.
de Vries, J. (1993), “Between Purchasing Power and the World of Goods:Understanding the Household Economy in Early Modern Europe”, in Brewer,J. and Porter, R. (eds.), Consumption and the World of Goods, London:Routledge, 85-132.
de Vries, J. (1994), “The Industrial Revolution and the Industrious Revolution”,Journal of Economic History, 54, 249-270.
Wrigley, E.A. (2006), “The Transition to an Advanced Organic Economy: Half aMillennium of English Agricultue”, Economic History Review, 59, 435-480.
Wrigley, E.A. and Schofield, R.S. (1989), The Population History of England, 1541-1871: A Reconstruction, Cambridge: Cambridge University Press.
Wrigley, E.A., Davies, R.S., Oeppen, J.E. and Schofield, R.S. (1997), EnglishPopulation History from Family Reconstitution, 1580-1837, Cambridge:Cambridge University Press.
van Zanden, J.L. (2005), “Cobb-Douglas in Pre-Modern Europe: Simulating EarlyModern Growth”, presented at International Economic History Congress,Helsinki, Session 122, Progress, Stasis, and Crisis: Demographic andEconomic Developments in England and Beyond, ADc.1000-c.1800,http://www.helsinki.fi/iehc2006/sessions81_124.html.