english 9 - linear vs. non-linear text
TRANSCRIPT

Bible Reading

Reading Path

Reading Path It is the way that the text or text
plus other features, can determine or order the way the we read it

Linear Text Most common type of reading It focuses on the arrangement of
the words, both grammatically and stylistically
Examples:Story, Speech, Letter, Newspaper Report, etc.

Non-Linear Text Text combined with visual
elements The Reading path is non-
sequential Pictures, Graphs, Tables and
Graphic Organizer

Charts or Graphs Graphical representation of data Represented by symbols or
legends Used to ease understanding of
large quantities of data and show the relationships of the data

Line Graphs A common type of chart which displays
information as a series of data points connected by straight line segments to show trends
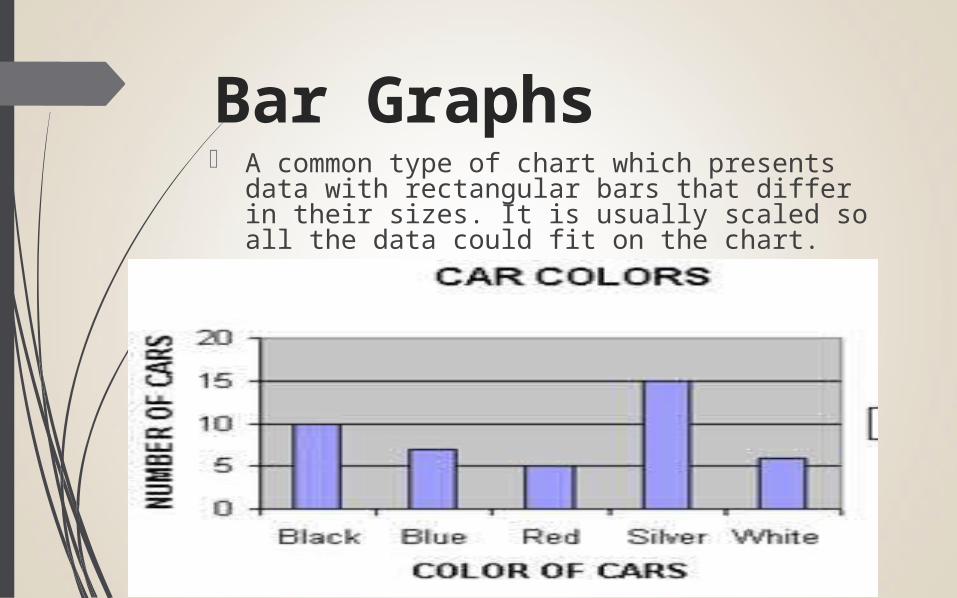
Bar Graphs A common type of chart which presents data
with rectangular bars that differ in their sizes. It is usually scaled so all the data could fit on the chart.
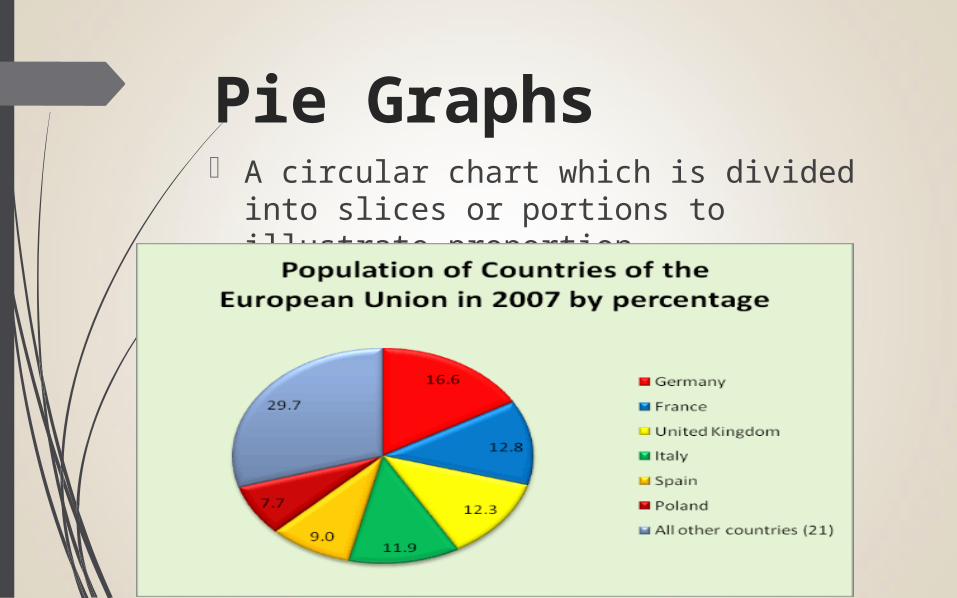
Pie Graphs A circular chart which is divided into
slices or portions to illustrate proportion

Histogram A graphical distribution of the
distribution of numerical data. It has no gaps between the bars

Questions:1. What is the most common language used in
Australia?2. What is the total percentage of the languages
English and Italian combined?3. What is the second most common language
used in Australia?4. What is the average percentage of the people
using English and other languages combined?5. What is the percentage of people using Chinese
language?


Graphic Organizer Also called as “concept map” A communication tool that uses
visual symbols to express knowledge, concepts or thoughts and the relationships between them
Provide a visual aid to facilitate learning and instruction
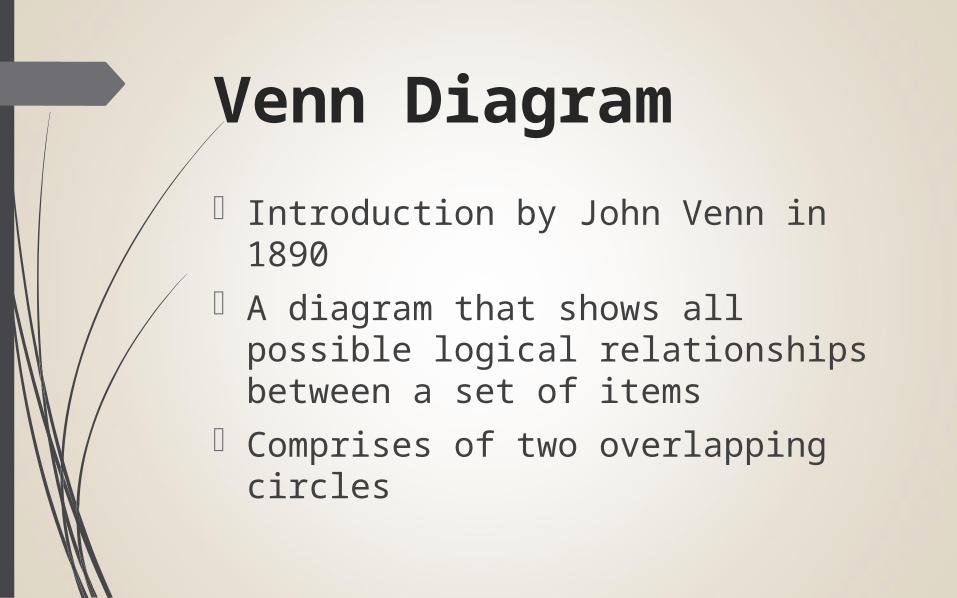
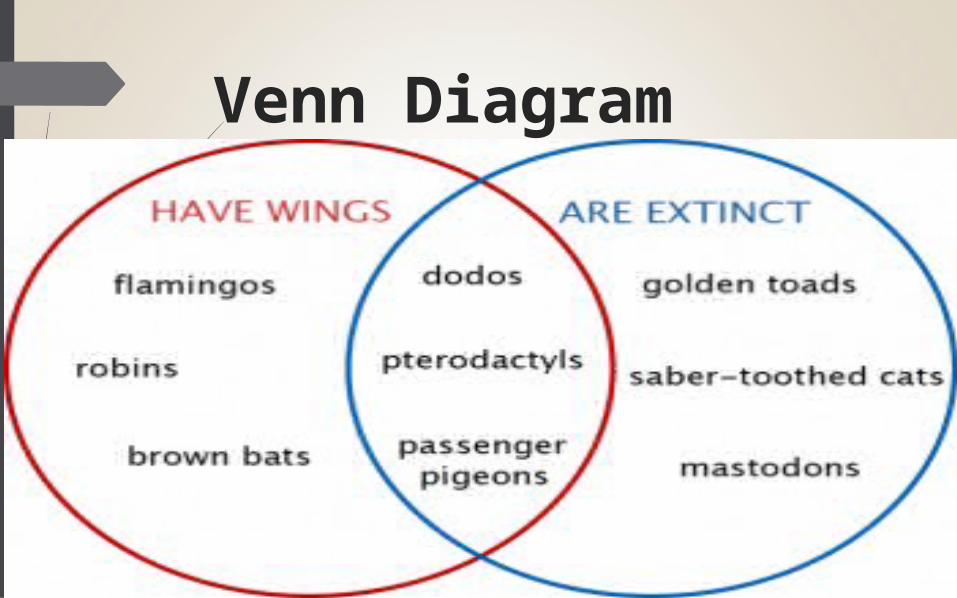
Venn Diagram Introduction by John Venn in 1890 A diagram that shows all possible
logical relationships between a set of items
Comprises of two overlapping circles
Venn Diagram

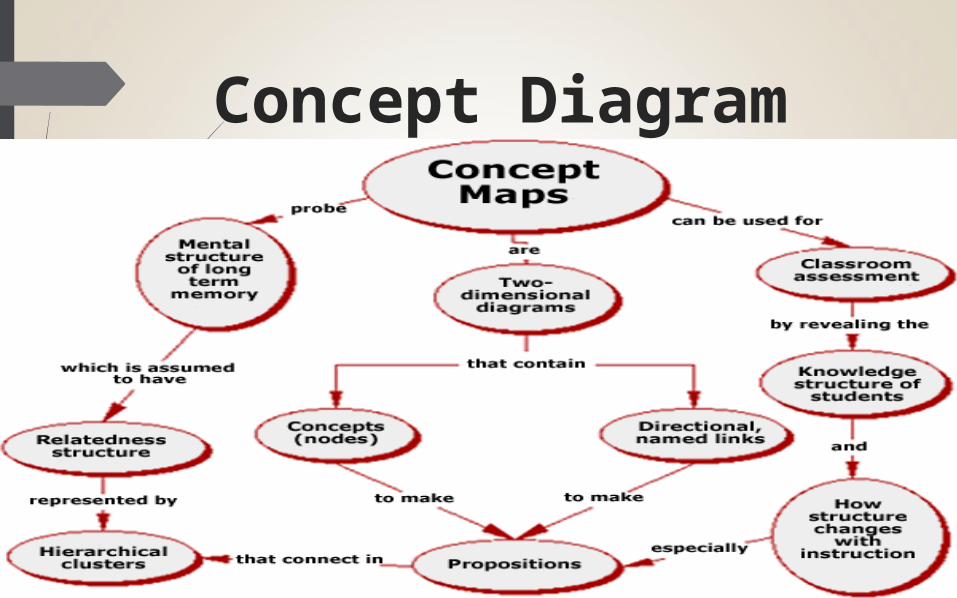
Concept Diagram A diagram that depicts suggested
relationships between concepts Typically represents ideas and
information as boxes and circle and uses lines to show the relationship between them
Concept Diagram