engineer’s report on groundwater … engineer’s report on groundwater conditions, water supply...
TRANSCRIPT
2015-2016
ENGINEER’S REPORT ON
GROUNDWATER CONDITIONS,
WATER SUPPLY AND BASIN UTILIZATION
IN THE
ORANGE COUNTY WATER DISTRICT
FEBRUARY 2017
ORANGE COUNTY WATER DISTRICT BOARD OF DIRECTORS
Philip L. Anthony Denis R. Bilodeau, P.E.
Shawn Dewane Cathy Green
Dina Nguyen, Esq. Vicente F. Sarmiento, Esq.
Stephen R. Sheldon James Vanderbilt Bruce Whitaker
Roger C. Yoh, P.E.
Michael R. Markus, P.E. General Manager


TABLE OF CONTENTS
Page
EXECUTIVE SUMMARY .............................................................................................................1
ACKNOWLEDGMENTS .............................................................................................................2
GLOSSARY OF ACRONYMS .....................................................................................................3
PART I: GROUNDWATER CONDITIONS ..............................................................................4
2015-16 Summary of Findings .........................................................................................4
Basin Hydrology ...............................................................................................................5
Groundwater Production .................................................................................................5
Basin Production Percentage ...........................................................................................7
Groundwater Levels .........................................................................................................7
Coastal Groundwater Conditions .................................................................................11
Annual Overdraft ............................................................................................................12
Groundwater Basin Accumulated Overdraft .............................................................13
Replenishment Recommendation .................................................................................15
Recommended Basin Production Percentage .............................................................16
PART II: WATER SUPPLY AND BASIN UTILIZATION .....................................................18
2015-16 Summary of Findings .......................................................................................18
Supplemental Water .......................................................................................................19
Availability of Supplemental Replenishment Water .................................................21
Water Demands ...............................................................................................................21
Water Demand Forecast .................................................................................................23
Advanced Wastewater Reclamation ............................................................................23
Water Quality ..................................................................................................................24
Water Resources Data ....................................................................................................25
PART III: WATER PRODUCTION COSTS FOR ENSUING WATER YEAR (2017-18) ....27
Summary of Findings .....................................................................................................27
Groundwater Production Costs for Non-Irrigation Use ...........................................28
Cost of Supplemental Water..........................................................................................29
LIST OF TABLES
No. Page
1 Historical Groundwater Production Within Orange County Water District ...........6
2 2017-18 Budget for Water Purchases ............................................................................16
3 2015-16 Supplemental Water Usage .............................................................................20
4 2015-16 Recycled Water Usage ......................................................................................21
5 Water Demands Within OCWD ...................................................................................22
6 2015-16 Water Quality Summary ..................................................................................26
7 Estimated 2017-18 Groundwater Production Costs ...................................................28
8 Estimated 2017-18 Supplemental Water Costs ...........................................................29
9 Estimated 2017-18 Water Production Cost Comparison ...........................................30
LIST OF FIGURES
No. Page
1 Groundwater Production .................................................................................................6
2 Groundwater Basin Production Percentage ..................................................................7
3 Accumulated Basin Overdraft ......................................................................................14
4 Historical Supplemental Water Usage .........................................................................20
5 Water Demand Projections ............................................................................................23
6 Adopted and Projected Water Rates for Non-Irrigation Use ...................................30

LIST OF PLATES
No. Page
1 Groundwater Contour Map, June 2016 .......................................................................31
2 Change in Groundwater Level from June 2015 to June 2016 ...................................32
3 Key Well Groundwater Elevation Trends ...................................................................33
APPENDICES
No. Page
1 Water Production Data 2015-16 ....................................................................................34 2 2015-16 Groundwater Production—Non-Irrigation Use Production Over 25 Acre-feet ............................................................................................................35 3 2015-16 Groundwater Production—Irrigation Use Production Over 25 Acre-feet ............................................................................................................36 4 Non-Local Water Purchased by OCWD for Water Years 1996-97 Through 2015-16 ..............................................................................................................37 5 2015-16 Water Resources Summary .............................................................................38 6 Typical Groundwater Extraction Facility Characteristics .........................................39 7 Values Used in Figure 6 for Water Rates for Non-Irrigation Use ............................40

1
EXECUTIVE SUMMARY
Total water demands within Orange County Water District (OCWD) were 367,402 acre-feet (AF) for the 2015-16 water year (beginning on July 1, 2015 and ending on June 30, 2016). This is the lowest figure for total water demands since 1982 which was caused by the State’s emergency drought regulations. Groundwater production for the water year totaled 277,090 AF including any available In-Lieu Program water and excluding MWD Groundwater Storage Program extractions. A total of 47,524 AF of supplemental water was used for the purpose of groundwater replenishment and barrier maintenance. For the water year which ended on June 30, 2016, the “annual overdraft” (annual basin storage decrease without supplemental replenishment water) was 141,000 AF. The accumulated overdraft decreased from 381,000 AF on June 30, 2015 to 379,000 AF on June 30, 2016. Precipitation within the basin was 62 percent of the long-term average during the water year, totaling 8.40 inches. Based on the groundwater basin conditions for the water year ending on June 30, 2016, OCWD may purchase up to 198,000 AF of water for groundwater replenishment during the ensuing water year, beginning on July 1, 2017, pursuant to the District Act.

2
ACKNOWLEDGMENTS
A number of public and private entities contributed data used in this report including:
City of Anaheim City of Buena Park East Orange County Water District City of Fountain Valley City of Fullerton City of Garden Grove Golden State Water Company City of Huntington Beach Irvine Ranch Water District City of La Palma Mesa Water District Metropolitan Water District of Southern California Municipal Water District of Orange County City of Newport Beach City of Orange County of Orange, Public Works Department Orange County Sanitation District City of Santa Ana Santa Ana Watershed Project Authority City of Seal Beach Serrano Water District City of Tustin United States Geological Survey City of Westminster Yorba Linda Water District
The cooperation received from all agencies is gratefully acknowledged. This report is based on the 2015-16 Basic Data Report which is placed on file at the office of OCWD in Fountain Valley.

3
GLOSSARY OF ACRONYMS
AF Acre-feet
AWPF Advanced Water Purification Facility
BEA Basin Equity Assessment
BPP Basin Production Percentage
CPTP Coastal Pumping Transfer Program
CUP Conjunctive Use Program
DATS Deep Aquifer Treatment System
DRWF Dyer Road Well Field
GAP Green Acres Project
GWRS Groundwater Replenishment System
IDP Irvine Desalter Project
IRWD Irvine Ranch Water District
MF Microfiltration
mg/L Milligrams per Liter
MBI Mid-Basin Injection
MGD Million Gallons per Day
MSL Mean Sea Level
MWD Metropolitan Water District of Southern California
MWDOC Municipal Water District of Orange County
NO3 Nitrate
O&M Operation and Maintenance
OCSD Orange County Sanitation District
OCWD Orange County Water District
RA Replenishment Assessment
RO Reverse Osmosis
RTS Readiness-to-Serve
SAR Santa Ana River
SWP State Water Project
TDS Total Dissolved Solids
UV Ultraviolet
WRD Water Replenishment District of Southern California
WSM Basin Water Supply Management Program

4
PART I: GROUNDWATER CONDITIONS Section 25 of the OCWD Act requires that OCWD order an annual investigation to report on the groundwater conditions within the District’s boundaries. A summary of the groundwater conditions for the water year covering July 1, 2015 to June 30, 2016 is as follows.
GROUNDWATER CONDITIONS 2015-16 SUMMARY OF FINDINGS
1. Groundwater production (including the In-Lieu Program) totaled 277,090 acre-feet
(AF) for the 2015-16 water year excluding extractions from the Metropolitan Water District of Southern California (MWD) Groundwater Storage Program.
2. Groundwater stored in the basin increased by 2,000 AF for the 2015-16 water year.
3. Accumulated Overdraft1 on June 30, 2016 was 379,000 AF.2 4. Annual Overdraft was 141,000 AF for the 2015-16 water year.
5. Average Annual Overdraft3 for the immediate past five water years (2011-12 through 2015-16) was 160,000 AF.
6. Projected Annual Overdraft3 for the current 2016-17 water year is 85,000 AF.
7. Projected Annual Overdraft3 for the ensuing 2017-18 water year is 148,000 AF.
8. Projected Accumulated Overdraft2 on June 30, 2017 is 320,000 AF.
9. Under the provisions of Section 27 of the District Act, a portion of the 2017-18 Replenishment Assessment (RA) could be equal to an amount necessary to purchase up to 198,000 AF of replenishment water.4
1 Accumulated overdraft was calculated using OCWD’s three-layer storage change methodology adopted on March 21, 2007 and the associated new benchmark for full-basin conditions. Water year 2005-06 was the first year this methodology was used. Additional explanation can be found in the report on “Evaluation of Orange County Groundwater Basin Storage and Operational Strategy” by OCWD in 2007.
2 Water from the Metropolitan Water District of Southern California Long-Term Groundwater Storage Program was included as part of the total stored water in determining the basin’s accumulated overdraft.
3 Annual overdraft is defined in the District Act as “annual basin storage decrease without supplemental replenishment water.”
4 Determined by adding the five-year annual overdraft (160,000 AF) to one-tenth of the accumulated overdraft (379,000 AF) which results in the following:
160,000 AF + [(379,000 AF) x 0.10] = 197,900 AF (or 198,000 AF when rounded).

5
BASIN HYDROLOGY Groundwater conditions in the Orange County groundwater basin are influenced by the natural hydrologic conditions of rainfall, capture and recharge of Santa Ana River (SAR) and Santiago Creek stream flows, natural infiltration of surface water, and the transmissive capacity of the basin. The basin is also influenced by groundwater extraction and injection through wells, use of imported water for groundwater replenishment, wastewater reclamation and water conservation efforts and activities throughout OCWD’s service area. The water year beginning on July 1, 2015, yielded an average of 8.40 inches of rainfall within OCWD’s boundaries, which is approximately 62 percent of the long-term annual average of 13.40 inches. Rainfall data within OCWD’s boundaries was provided by the Orange County Public Works for precipitation stations number 5, 61, 88, 96, 121, 163, 165, 169, 173, 219 and 229. The previous water year (2014-15) had rainfall equaling 8.20 inches which was also less than the long-term average rainfall. The average seasonal rainfall in the OCWD service area for the five-year period (from July 1, 2011 through June 30, 2016) was 9.07 inches, and below average rainfall in the watershed tends to lead to lower flows in the SAR reaching Orange County. Stream flow in the SAR measured downstream of Prado Dam for water year 2015-16 totaled 113,780 AF which was approximately 51 percent of the 30-year flow average of 223,362 AF.
GROUNDWATER PRODUCTION Groundwater production from wells within OCWD for the 2015-16 water year totaled 277,090 AF (excluding In-Lieu Program water, MWD Groundwater Storage Program extractions, and any groundwater used for the Talbert Barrier): 275,042 AF for non-irrigation and 2,048 AF for irrigation uses. The term “irrigation” used in the District Act and herein refers to irrigation for agricultural, horticultural or floricultural crops and for pasture grown for commercial purposes. OCWD’s In-Lieu Program replaces groundwater supplies with imported water to reduce groundwater pumping. During the 2015-16 water year, In-Lieu Program water was not available for purchase from MWD. Annual groundwater production and In-Lieu quantities within OCWD for the period 1966-67 through 2015-16 are presented in Figure 1 and Table 1. Groundwater production for 2015-16 for the major groundwater producers is summarized in Appendix 1. Groundwater production for all producers exceeding 25 AF per year for non-irrigation and irrigation purposes is presented in Appendices 2 and 3, respectively.

6
FIGURE 1. Groundwater Production
0
50,000
100,000
150,000
200,000
250,000
300,000
350,000
400,000
450,000
1970-7
1
1975-7
6
1980-8
1
1985-8
6
1990-9
1
1995-9
6
2000-0
1
2005-0
6
2010-1
1
2015-1
6
Gro
un
dw
ate
r P
rod
uc
tio
n
(ac
re-f
ee
t)
Water Year
In-Lieu
Non-Irrigation
Irrigation
TABLE 1. Historical Groundwater Production Within OCWD
Water Year Jul 1-Jun 30
Groundwater Production
(AF)
In-Lieu Program
(AF)
Water Year Jul 1-Jun 30
Groundwater Production
(AF)
In-Lieu Program
(AF) 1966-67 169,375 - 1991-92 271,224 39,789 1967-68 193,656 - 1992-93 273,587 38,900 1968-69 178,798 - 1993-94 264,159 48,134 1969-70 194,379 - 1994-95 298,217 15,622 1970-71 203,923 - 1995-96 324,111 5,542 1971-72 229,048 - 1996-97 331,406 7,883 1972-73 214,983 - 1997-98 313,805 15,096 1973-74 218,863 - 1998-99 342,823 13,352 1974-75 225,597 - 1999-00 345,362 38,007 1975-76 245,456 - 2000-01 350,385 18,640 1976-77 243,511 - 2001-02 352,113 19,473 1977-78 188,407 48,290 2002-03 297,191 61,463 1978-79 213,290 23,792 2003-04 284,621 52,168 1979-80 221,453 24,861 2004-05 244,370 69,617 1980-81 228,943 36,373 2005-06 228,159 89,216 1981-82 244,184 - 2006-07 299,118 50,740 1982-83 249,548 - 2007-08 366,185 - 1983-84 223,207 52,822 2008-09 324,147 -
1984-85 252,070 25,198 2009-10 285,575 -
1985-86 270,932 - 2010-11 259,861 10,435
1986-87 276,354 - 2011-12 241,082 40,564
1987-88 265,226 18,856 2012-13 309,295 -
1988-89 275,077 15,022 2013-14 330,782 -
1989-90 261,190 38,961 2014-15 305,259 -
1990-91 266,745 44,588 2015-16 277,090 -

7
BASIN PRODUCTION PERCENTAGE The Basin Production Percentage (BPP) is defined in the District Act as “…the ratio that all water to be produced from groundwater supplies within the district bears to all water to be produced by persons and operators within the district from supplemental sources as well as from groundwater within the district.” The BPP applies only to water producers that utilize more than 25 AF of groundwater per water year. Water producers that use 25 AF or less from the groundwater basin are excluded from the production percentage limitation. The BPP for the 2015-16 water year was established at 75.0 percent by the OCWD Board of Directors. The overall BPP achieved within OCWD for non-irrigation use in the 2015-16 water year was 78.7 percent. The achieved pumping is greater than 75.0 percent primarily due to additional extraction from several water quality projects that are given a Basin Equity Assessment (BEA) exemption to pump groundwater above the BPP. The production percentage achieved by each major producer for non-irrigation use is presented in Appendix 1. Historical assigned and achieved BPPs are illustrated below in Figure 2.
FIGURE 2. Groundwater BPP
GROUNDWATER LEVELS Groundwater levels in the Orange County groundwater basin are shown on Plate 1. Groundwater level data used to prepare this plate were collected during late June and early July 2016 from over 500 production and monitoring wells screened within the
0%
10%
20%
30%
40%
50%
60%
70%
80%
90%
100%
1993-9
4
1995-9
6
1997-9
8
1999-0
0
2001-0
2
2003-0
4
2005-0
6
2007-0
8
2009-1
0
2011-1
2
2013-1
4
2015-1
6
Basin
Pro
du
cti
on
Perc
en
tag
e
Water Year
In-Lieu
GroundwaterOCWD Assigned Basin Production Percentage

8
principal aquifer system (approximately 300 to 1,200 feet deep), from which over 90% of basin pumping occurs. The groundwater elevation contours range from 30 to 90 feet below mean sea level in the coastal area of the basin due to pumping. A general indicator of changing basin levels is the location of the zero (0) mean sea level (MSL) elevation contour line each year (MSL elevations are referenced to Vertical Datum NGVD 29). The zero contour line moved slightly landward (ranging from 0.01 to 0.30 miles) when compared to its alignment the prior year, indicating a small decrease in groundwater levels in the principal aquifer system. Plate 2 shows the change in groundwater levels from June 2015 to June 2016 for the principal aquifer system. In the principal aquifer, groundwater levels rose in most of the Forebay area but dropped slightly throughout the larger Pressure area of the basin. Below is a general overview of the change in groundwater levels from June 2015 to June 2016 for the three primary aquifer systems of the basin. Shallow Aquifer System : In the shallow aquifer, groundwater levels dropped slightly throughout most of the basin from June 2015 to June 2016 except in the Forebay areas of Anaheim and Fullerton where groundwater levels experienced a moderate rise despite the fifth consecutive year of drought conditions. The maximum groundwater level rise was approximately 15 feet surrounding Kraemer-Miller-Miraloma Basins due to increased Groundwater Replenishment System (GWRS) recharge in those basins resulting from the GWRS Initial Expansion which went online one month prior to the start of water year 2015-16. In fact, GWRS recharge in these three basins during water year 2015-16 was 65,229 AF, significantly more than the 39,688 AF recharged during the prior water year. Shallow aquifer groundwater levels rose approximately 10 feet along the Santa Ana River (SAR) in the Anaheim Forebay and approximately 5 feet in the Fullerton area slightly further away from the OCWD recharge facilities. In the Orange Forebay area, shallow aquifer groundwater levels dropped 5 to 10 feet, likely due to the lack of incidental recharge from the adjacent mountain-front areas since Santiago Basin and Santiago Creek had similar recharge totals as the prior water year. Overall, OCWD managed recharged in the Forebay area totaled 219,690 AF from all sources (GWRS, imported water and SAR) during water year 2015-16. Although it was a dry year and rainfall was slightly less than the prior year, this represented a 15.5% recharge increase from the prior water year and was approximately equal to the 20-year average. In the Irvine area, shallow aquifer groundwater levels declined slightly from 1 to 3 feet.

9
This gradual decline has been continuing for the last five years of drought as incidental recharge from the Santa Ana Mountains is insufficient to offset pumping from the Irvine Sub-basin. The groundwater level decline was only 1 to 2 feet throughout most of the Pressure area, i.e., in the central portion of the basin, the coastal area, and in the west Orange County area near the boundary with Los Angeles County. The Talbert Barrier area was the one exception in the coastal area where shallow aquifer groundwater levels rose slightly (1 to 5 feet) from June 2015 to June 2016. This rise was likely the result of increased barrier injection into the shallower aquifers susceptible to seawater intrusion during the ongoing low-basin conditions. Despite the relatively high accumulated overdraft in the basin, barrier injection operations were able to maintain protective groundwater elevations sufficiently above MSL seaward of the barrier for the majority of water year 2015-16 to prevent seawater intrusion. Principal Aquifer System : In the principal aquifer, groundwater levels rose in most of the Forebay area but dropped slightly throughout the larger Pressure area of the basin, somewhat similar to but slightly more pronounced than in the shallow aquifer described above. Principal aquifer groundwater levels rose in the Anaheim, Fullerton, and Orange Forebay areas, with a maximum rise of approximately 10 to 15 feet in the immediate vicinity of the OCWD recharge facilities in both Anaheim and Orange. In the greater Forebay area farther away from the OCWD recharge facilities, the groundwater level rise was less at approximately 5 to 10 feet. For the rest of the basin, the mild to moderate decline in principal aquifer groundwater levels was likely due to a basin pumping increase of 9% during the last two months of the water year in May and June of 2016 coinciding with the period when groundwater levels were measured for preparing the annual groundwater contour maps and storage calculation. Annual basin pumping was 7.9% less during water year 2015-16 as compared to the previous water year due to the state-mandated 25% water use reduction. However, the water use restrictions were relaxed during May and June of 2016, during which time pumping increased somewhat. Principal aquifer groundwater levels dropped approximately 5 to 10 feet throughout the western half of the Pressure area (e.g., Buena Park, Garden Grove, Westminster, Huntington Beach, and Los Alamitos), but the decline was somewhat larger at approximately 15 feet in Seal Beach and across the county line in Long Beach. The greater decline in Principal aquifer groundwater levels in Long Beach relative to west-central Orange County indicated that the gradient towards Los Angeles County was slightly

10
steeper in June 2016 than in June 2015 and thus the groundwater outflow during water year 2015-16 may have been more than the prior water year. In the immediate vicinity of the Talbert Barrier, principal aquifer groundwater levels dropped approximately 10 to 20 feet, which was nearly double the decline throughout the greater coastal area. This larger decline was relatively localized and likely due to deliberately reducing Talbert Barrier injection into the deeper main aquifer zone for replenishing the basin so as to maximize barrier injection into the shallower aquifer zones susceptible to seawater intrusion during the ongoing low-basin conditions. Northeast of the Talbert Barrier, principal aquifer groundwater levels in the IRWD Dyer Road Well Field (DRWF) area only declined 1 to 2 feet from June 2015 to June 2016. In the Irvine area in the vicinity of the Irvine Desalter Project (IDP) wells, the decline in principal aquifer groundwater levels was approximately 5 to 10 feet. As was discussed for the shallow aquifer, the gradual decline in principal aquifer groundwater levels in the Irvine area has been occurring for the past five years as the lack of incidental or natural recharge from the Santa Ana Mountains has been insufficient to keep pace with pumping from the principal aquifer within the Irvine Sub-basin (IDP wells and IRWD wells 21 and 22). Despite the progressively lower groundwater levels in the Irvine Sub-basin, the groundwater gradient and flow direction is still westerly from the Irvine Sub-basin out into the main portion of the basin. However, if the declining trend continues for several more years, the gradient could eventually reverse such that groundwater flow would be from the main basin into the Irvine Sub-basin as historically occurred during the high agricultural pumping years of The Irvine Company. Deep Aquifer System : In the deep aquifer, groundwater level changes from June 2015 to June 2016 were very similar to those in the principal aquifer but more subtle in some areas. Deep aquifer groundwater levels rose 10 to 15 feet in the Forebay area near the OCWD recharge facilities and had a lesser rise of 5 to 10 feet in the rest of the Forebay area farther away from the recharge facilities. In the Irvine area, deep aquifer groundwater levels had a mild decline of 2 to 3 feet in the vicinity of the IDP wells that pump from the principal aquifer. Farther west, deep aquifer groundwater levels rose 3 to 5 feet towards the 55 Freeway as well as farther west in Santa Ana in the vicinity of the IRWD Deep Aquifer Treatment System (DATS) wells. Deep aquifer groundwater levels declined approximately 5 to 10 feet in the western half of the Pressure area (west of SAR in the west-central portion of the basin) and approximately 15 feet in Seal Beach and across the county line in Long Beach. The slightly larger decline in the Long Beach area as compared to the west-central portion of Orange County indicated a slightly steeper gradient and thus groundwater outflow across the county line

11
in the deep aquifer during water year 2015-16 may have been more than the prior water year.
COASTAL GROUNDWATER CONDITIONS The coastal portion of the groundwater basin, essentially that area within five miles of the coast, is sensitive to seawater intrusion potential and seasonal effects on production well capacity due to lower groundwater levels. Coastal groundwater levels are affected by groundwater production, overall groundwater storage in the basin, and, to a somewhat lesser extent, injection at the Talbert and Alamitos barriers. Coastal groundwater production for water year 2015-16 totaled 95,879 AF (includes Fountain Valley, Huntington Beach, IRWD DRWF and DATS wells, Mesa Water, Newport Beach, OCWD deep wells in Fountain Valley, Seal Beach, and Westminster). The coastal groundwater production for water year 2015-16 was 6% less than the prior water year despite a 3% increase in the BPP to 75%. The Coastal Pumping Transfer Program (CPTP) implemented during water years 2013-14 and 2014-15 was not continued during water year 2015-16. Therefore, the coastal pumping reduction during water year 2015-16 was solely due to reduced demand stemming from the state-mandated water use restrictions. Talbert Barrier injection totaled 35,233 AF for water year 2015-16, representing a decrease of 3.4% from the prior water year. Although basin accumulated overdraft was still relatively high during water year 2015-16, the reduction in coastal pumping discussed above led to a slight reduction in the required amount of injection necessary to maintain protective elevations seaward of the barrier. Also, additional injection was required during the prior water year to recover from a one-month GWRS shutdown during June 2014. A key OCWD monitoring well M26 is located near Adams Avenue seaward of the barrier. Shallow aquifer groundwater levels of monitoring well M26 had declined to 12 feet below mean sea level at the start of previous water year (2014-15) due to the aforementioned GWRS shutdown, but then steadily rose thereafter, eventually rising back above MSL and reaching protective elevations of approximately 3 feet above MSL during the second half of water year 2014-15 due to increased injection during those months. During water year 2015-16, groundwater levels in the shallow aquifer at M26 were stably maintained at or slightly above protective elevations throughout the year. Talbert Barrier injection consisted of nearly 100% (99.98%) GWRS recycled water and 0.02% (7 AF) of imported potable water from the MWD OC-44 connection during water year 2015-16. During normal operating conditions throughout the water year, barrier injection was 100% GWRS water. The MWD potable water was only used to keep the barrier pipeline full and pressurized during brief intermittent plant shutdowns.

12
At the Alamitos Barrier, the OCWD portion of injection totaled 2,399 AF for water year 2015-16, which was slightly higher than past years. The higher injection total was an operational attempt to achieve protective elevations near the barrier under relatively low basin conditions. The injection total included all sources of water (81% imported and 19% recycled for water year 2015-16) but only represents OCWD’s share, which is less than half of the total injection based on the location of the barrier wells that lie within both Los Angeles and Orange counties. A supply goal of Alamitos Barrier injection has been an approximately 50/50 blend of imported and recycled water. However, the recycled portion was lower the last three years because of Leo J. Van der Lans treatment plant shutdowns related to the plant expansion construction activities. During water year 2015-16, monthly groundwater production in the coastal area had less overall seasonal fluctuation from the winter to summer months than in recent years likely due to the state-mandated water use restrictions that were proportionally more impactful during the warm summer months limiting outdoor water usage (e.g., landscape irrigation). Coastal production was approximately 9,000 AF per month during the summer months and approximately 7,000 AF per month during the winter months. Pumping from the IRWD DRWF did follow more of a typical demand curve during water year 2015-16, but pumping from IRWD DATS wells was nearly constant year-round. In contrast, pumping from Mesa Water wells 6 and 11 into Mesa’s colored water treatment plant (also known as Mesa Water Reliability Facility) was seasonally variable with very low monthly pumping from December 2015 through March 2016 and greater pumping the rest of the water year during the warmer months. However, pumping from the Mesa Water clear wells was nearly constant year-round during water year 2015-16. Huntington Beach pumping also had very little seasonal fluctuation, while Seal Beach pumping had a reversed seasonal trend in which pumping was less during the summer months than in the winter months.
ANNUAL OVERDRAFT Annual groundwater basin overdraft, as defined in the District Act, is the quantity by which production of groundwater supplies exceeds natural replenishment of groundwater supplies during a water year. This difference between extraction and replenishment can be estimated by determining the change in volume of groundwater in storage that would have occurred had supplemental and recycled water not been used for any groundwater recharge purpose, including seawater intrusion protection, advanced water reclamation and the In-Lieu Program. For the 2015-16 water year, it is estimated that the volume of groundwater in storage increased by 2,000 AF. Approximately 143,000 AF of water was supplied to the basin as follows: 1) directly from the percolation or injection of purchased imported water from the Colorado River and State Water Project (SWP), 2) use of recycled water to supplement

13
purchased imported water in the Alamitos seawater intrusion barrier, and 3) use of GWRS recycled water. Therefore, the annual overdraft was 141,000 AF for the 2015-16 water year. For the five-year period from July 1, 2010 to June 30, 2015, an annual average of approximately 128,000 AF of supplemental water and recycled water was percolated or injected into the underground basin for replenishment or used directly in place of pumping groundwater (i.e., In-Lieu Program). The average annual overdraft during the same five-year period was approximately 160,000 AF.
GROUNDWATER BASIN ACCUMULATED OVERDRAFT The accumulated overdraft, as defined in the District Act, is the quantity of water needed to be replaced at OCWD’s intake area to prevent landward movement of ocean water into the fresh groundwater body. Landward movement of ocean water can be prevented if groundwater levels near the coast are several feet above sea level. Groundwater levels along the coast are related to the volume of water stored in the intake area, water pumped from the entire basin and the pattern or location of pumping. However, the Talbert and Alamitos seawater intrusion control projects have been implemented to prevent landward movement of ocean water into the fresh groundwater body. Due to the operation of seawater intrusion barrier facilities, there is no longer a direct correlation between accumulated overdraft and controlling seawater intrusion. These facilities allow greater utilization of the storage capacity of the groundwater basin. OCWD is also dedicated to maximizing its replenishment capabilities by actively negotiating with the U.S. Army Corps of Engineers to increase its water conservation program behind Prado Dam and implementing a Long-Term Facilities Plan to evaluate cost-effective improvements to its groundwater recharge capabilities. In February 2007, OCWD staff completed a report entitled “Evaluation of Orange County Groundwater Basin Storage and Operational Strategy.” This report presented a new methodology that had been developed, tested, and documented for calculating accumulated overdraft and storage change based on a three aquifer layer approach. Furthermore, the report provided the basis for calculating accumulated overdraft using a new full-basin benchmark that was developed for each of the three aquifer layers, which in effect replaces the traditional single-layer full benchmark of 1969. The annual analysis of basin storage change and accumulated overdraft for water year 2015-16 has been completed. Based on the three-layer methodology, an accumulated overdraft of 379,000 AF was calculated for the water year ending June 30, 2016. The accumulated overdraft for the prior water year ending June 30, 2015 was 381,000 AF (also calculated using the three-layer storage method). Therefore, an annual increase of 2,000 AF (reported earlier herein this report) in stored groundwater was calculated as the difference between the June 2015 and June 2016 accumulated overdrafts.

14
Figure 3 shows the accumulated basin overdraft quantities for the period 1977 through 2016.
FIGURE 3. Accumulated Basin Overdraft
The accumulated overdraft for the current water year ending on June 30, 2017 is projected to be 320,000 AF. The annual overdraft is estimated to be 85,000 AF. This quantity is based on assumed annual groundwater production of approximately 298,000 AF for the current water year (including groundwater pumping within the BPP, In-Lieu Program water, groundwater pumped above the BPP from water quality improvement projects and MWD Groundwater Storage Program extractions) and that natural replenishment (including captured SAR flows and incidental recharge) is estimated to be approximately 213,000 AF for the basin under slightly-below average rainfall conditions. In addition, GWRS production is assumed to reach 95,000 AF. Projected annual overdraft for the ensuing water year (2017-18) is estimated to be 148,000 AF. This estimate is based on the assumption that total annual groundwater production for the ensuing water year will be 303,000 AF, a figure that is based upon an assumed BPP of 75 percent and includes 22,000 AF of production above the BPP from water quality improvement projects (discussed further in the subsequent section entitled Recommended Basin Production Percentage). The natural replenishment is estimated to be 155,000 AF (average of last five years) under below-average rainfall conditions, and the GWRS production is assumed to reach 103,000 AF. OCWD, MWD, the Municipal Water District of Orange County (MWDOC) and participating producers approved the funding agreement for the MWD Long-Term Groundwater Storage Program on June 25, 2003. This conjunctive use program (also informally referred to as MWD CUP) provides for MWD to store up to 66,000 AF in the
0
50,000
100,000
150,000
200,000
250,000
300,000
350,000
400,000
450,000
500,000
1977
1981
1985
1989
1993
1997
2001
2005
2009
2013
2017
Overd
raft
(acre
-feet)
Water Year
June 2016 = 379,000 AF
Dewatered
Volume
Groundwater

15
OCWD groundwater basin to be pumped (less basin losses) by participating producers in place of receiving imported supplies during water shortage events. A compensation package from MWD was included in the agreement to build eight new groundwater production wells, improvements to the seawater intrusion barrier, construction of the Diemer Bypass Pipeline and an annual administrative fee. The preferred means to store water in the MWD storage account has been through the In-Lieu deliveries to participating groundwater producers. Water into the MWD storage account has also been conducted through direct replenishment utilizing OCWD Forebay recharge basins. During water year 2015-16, MWD did not store any water into the MWD CUP storage account. In any event, the water stored or extracted by MWD is considered to be MWD supply and not groundwater production. During water year 2015-16, 16,212 AF were extracted from the MWD CUP account by the participating groundwater producers. The annual quantities and cumulative totals of MWD water stored since the inception of the program are shown in Appendix 4. It is important to note that the reported quantities do not include pumping extractions from the account or basin losses.
REPLENISHMENT RECOMMENDATION Section 27(b) of the District Act states the following: “The total of the replenishment assessment levied in any year shall not exceed an amount of money found to be necessary to purchase sufficient water to replenish the average annual overdraft for the immediate past five water years plus an additional amount of water sufficient to eliminate over a period of not less than 10 years nor more than 20 years, the accumulated overdraft, plus an amount of money to pay the costs of initiating, carrying on, and completing any of the powers, projects and purposes for which this district is organized.” Based upon Section 27(b), that portion of the RA that is used for water purchases for the ensuing water year 2017-18 is limited to the amount needed to purchase 198,000 AF as calculated below:
Five-year (7/1/2011 through 6/30/2016) Average Annual Overdraft* = 160,000 AF Accumulated Overdraft (End of Water Year 2015-16) = 379,000 AF Assumed Time Period to Eliminate Accumulated Overdraft = 10 years Potential Water Purchase Amount: 160,000 AF + (379,000 AF/10 years) = 197,900 AF (use 198,000 AF)
*Referred to as the Average Annual Overdraft in Section 27(b) of the District Act.
Table 2 presents the proposed 2017-18 budget for water purchases, which shows the proposed quantity of purchased water (67,000 AF) being significantly less than the prescribed limit of 198,000 AF as allowed for under the provisions of Section 27(b) of the District Act.

16
TABLE 2. 2017-18 Budget for Water Purchases
Water Source AF Rate ($/AF)* Total Cost ($) Alamitos Barrier 2,000 $1,112.00 $ 2,224,000 MWD Untreated Non-interruptible Water 65,000 $680.50 $44,232,500
Water Purchases Sub-total 67,000 — $46,456,500
Applicable Charges Total Cost ($) MWDOC Surcharge — — $ 400,000 MWD/MWDOC Capacity Charge — — $ 900,000
MWD/MWDOC RTS Charge — — $ 1,920,000
Additional Charges Sub-total — — $ 3,220,000
TOTAL WATER PURCHASES COST 67,000 — $49,676,500
* Rates include required MWDOC Capacity and Readiness to Serve (RTS) charges where appropriate.
RECOMMENDED BASIN PRODUCTION PERCENTAGE
In December 2002, OCWD approved a basin management approach for determining the BPP for future water years. The management approach is based upon the development of a base amount of groundwater production the basin can annually sustain utilizing dependable water supplies OCWD expects to receive. It is a policy for OCWD to provide an estimate of the BPP each January for the following fiscal year to assist the groundwater producers in the preparation of their annual budgets. A BPP of 75 percent is currently being proposed for the ensuing water year 2017-18. Analysis of the groundwater basin’s projected accumulated overdraft, the available supplies to the basin (assuming below-average hydrology) and the projected pumping demands indicate that this level of pumping could potentially be sustained for 2017-18 without detriment to the basin. A BPP of 75 percent corresponds to approximately 303,000 AF of groundwater production which includes 22,000 AF of groundwater production above the BPP to account for several groundwater quality enhancement projects (see description below). In order to achieve water quality objectives in the groundwater basin, it is estimated for the ensuing water year 2017-18 that additional production of approximately 22,000 AF (above the BPP) will be undertaken by the City of Tustin, City of Garden Grove, Mesa Water District and IRWD. These agencies need the additional pumping allowance in order to accommodate groundwater quality improvement projects. As in prior years, production above the BPP from these projects would be partially or fully exempt from the BEA as a result of the benefit provided to the basin by removing poor-quality groundwater and treating it for beneficial use.

17
In March 2017, staff will review with the OCWD Board of Directors the basis and the assumptions made for the proposed BPP and receive any direction on the matter. In April 2017, staff will again apprise the OCWD Board of Directors on the status of the aforementioned conditions. If the estimates of basin supplies in the current or ensuing year are substantially different than those contained in the respective conditions, a revised BPP may then be recommended.

18
PART II: WATER SUPPLY AND BASIN UTILIZATION Section 31.5 of the District Act requires an investigation and annual report setting forth the following information related to water supply and basin utilization within the OCWD service area, together with other information as OCWD may desire:
WATER SUPPLY AND BASIN UTILIZATION 2015-16 SUMMARY OF FINDINGS
1. Water usage from all supplemental sources totaled 118,149 AF for the 2015-16 water year including any available In-Lieu Program water (none for 2015-16).
2. Water usage from recycled water produced from within OCWD including the
GWRS totaled 121,788 AF for the 2015-16 water year. 3. Water demands within OCWD totaled 367,402 AF for the 2015-16 water year. 4. Estimated demands for groundwater for the ensuing 2017-18 water year are 303,000
AF.

19
SUPPLEMENTAL WATER Supplemental water is used by water agencies within OCWD’s boundary to augment groundwater supplies in satisfying their user demands and by OCWD to recharge the groundwater basin. Supplemental water, as defined in Section 31.5 of the District Act, is any water that originates from outside the SAR watershed (comprised of an area of 2,081 square miles) with the exception of water that originates within the portion of the Santiago Creek watershed that lies upstream of Villa Park Dam which is counted as supplemental water. It is important to note that the Santiago Creek watershed lies entirely within the SAR watershed. Sources of supplemental water typically include imported deliveries from MWD and diversions from Irvine Lake/Santiago Reservoir (i.e., Santiago Creek) that are conveyed to users within OCWD boundaries. MWD deliveries originate from either the Colorado River or the SWP. In addition, supplemental water would also include deliveries from within the SAR watershed that involve water exchanges (i.e., releasing a quantity of water that originates from within the SAR watershed while importing an equal quantity of supplemental water to replace it). Non-local waters are defined, for the purposes of this report, as waters purchased from agencies outside of OCWD’s boundary for use within OCWD. Non-local waters include supplemental water and water deliveries purchased by OCWD where the water source is located within the SAR watershed. Water deliveries to OCWD from the Arlington Desalter in Riverside and the San Bernardino Valley Municipal Water District’s High Groundwater Mitigation Project are considered non-local waters. Both projects involve pumping (and treatment in Arlington’s case) and release of groundwater from the SAR upstream groundwater basins to OCWD via the SAR for groundwater replenishment at OCWD Forebay recharge facilities. For the purpose of being consistent with previous Engineer’s Reports and to present information in a concise manner, non-local water deliveries that are purchased and used by OCWD for groundwater replenishment are included in the supplemental water totals in this report. Recycled wastewater produced and used within OCWD is considered, for the purposes of this report, as neither non-local water nor supplemental water (sometimes referred to as neutral water). Therefore, recycled water that originates from within OCWD is reported separately from supplemental water totals. However, recycled water used in the Alamitos Barrier is supplied by Water Replenishment District of Southern California (WRD) and originated from outside the SAR watershed, and, as such, is categorized as supplemental water. Water agencies utilizing supplemental water are listed in Appendix 1. As summarized in Table 3, the use of supplemental water in OCWD’s service area during 2015-16 water year totaled 118,149 AF of which 70,625 AF resulted from the direct use by water agencies and 47,524 AF (including any available In-Lieu Program water) were used for groundwater
20
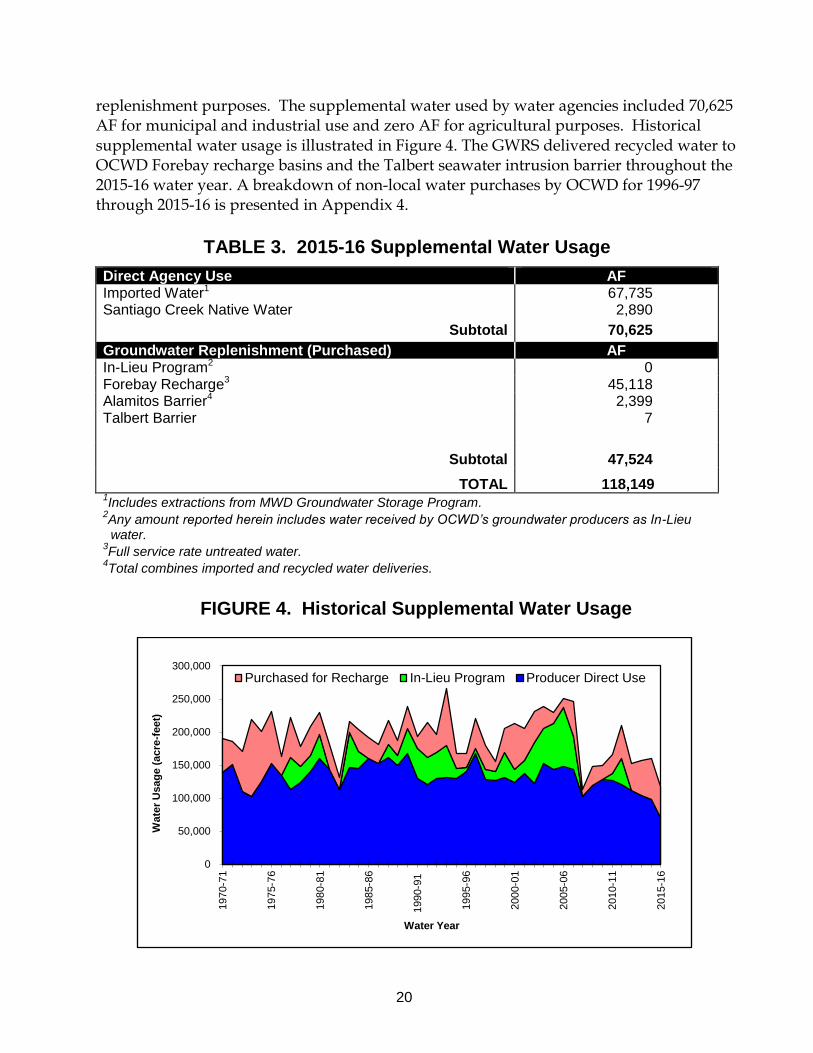
replenishment purposes. The supplemental water used by water agencies included 70,625 AF for municipal and industrial use and zero AF for agricultural purposes. Historical supplemental water usage is illustrated in Figure 4. The GWRS delivered recycled water to OCWD Forebay recharge basins and the Talbert seawater intrusion barrier throughout the 2015-16 water year. A breakdown of non-local water purchases by OCWD for 1996-97 through 2015-16 is presented in Appendix 4.
TABLE 3. 2015-16 Supplemental Water Usage
Direct Agency Use AF Imported Water1 67,735 Santiago Creek Native Water 2,890
Subtotal 70,625
Groundwater Replenishment (Purchased) AF In-Lieu Program2 0 Forebay Recharge3 45,118 Alamitos Barrier4 2,399 Talbert Barrier 7
Subtotal 47,524
TOTAL 118,149 1Includes extractions from MWD Groundwater Storage Program.
2Any amount reported herein includes water received by OCWD’s groundwater producers as In-Lieu water.
3Full service rate untreated water.
4Total combines imported and recycled water deliveries.
FIGURE 4. Historical Supplemental Water Usage
0
50,000
100,000
150,000
200,000
250,000
300,000
1970-7
1
1975-7
6
1980-8
1
1985-8
6
1990-9
1
1995-9
6
2000-0
1
2005-0
6
2010-1
1
2015-1
6
Wate
r U
sag
e (
acre
-feet)
Water Year
Purchased for Recharge In-Lieu Program Producer Direct Use

21
Recycled water use within OCWD is presented in Table 4 (excluding WRD-supplied recycled water to the Alamitos Barrier because this water is categorized as supplemental water and already included in the total amount reported in Table 3). The major uses of recycled water are groundwater replenishment (including Kraemer, Miller and Miraloma recharge basins and Talbert Barrier injection wells) and supply water for irrigation and industrial users.
TABLE 4. 2015-16 Recycled Water Usage
Groundwater Replenishment Water Usage (AF) GWRS AWPF (for Talbert Barrier) 35,226 GWRS AWPF (for Recharge Basins)1 65,296 GWRS AWPF (for Mid-Basin Injection) Subtotal
1,579 102,101
Irrigation Water Usage (AF) IRWD2 15,606 OCWD (Green Acres Project)3 4,081
Subtotal 19,687
TOTAL 121,788
1Includes 67 AF of GWRS recycled water delivered to City of Anaheim Canyon Power Plant and
Anaheim Regional Transportation Intermodal Center (ARTIC). 2Recycled water used within the portion of OCWD that lies within IRWD’s boundaries (excludes
OCWD/IRWD intertie water deliveries to the Green Acres Project). 3Excludes deliveries to the Orange County Sanitation District and includes IRWD/OCWD Intertie
deliveries to the Green Acres Project.
AVAILABILITY OF SUPPLEMENTAL REPLENISHMENT WATER MWD provided untreated full service water supplies to its groundwater-basin agencies during the water year 2015-16 in spite of a low allocation of State Project Water. The availability of supplemental water from MWD to recharge the groundwater basin in the ensuing water year is likely as MWD is anticipating a normal allocation of State Project Water.
WATER DEMANDS During the 2015-16 water year, the total water demands within OCWD’s service area were 367,402 AF. This is the lowest figure for total water demands since 1982 which was caused by the State’s emergency drought regulations. Total demands include the use of groundwater, MWD In-Lieu Program water, imported water, Santiago Creek native water and recycled water. Total demands exclude any groundwater, supplemental water and recycled water (such as the GWRS recycled water) used by OCWD for groundwater

22
recharge and water conservation credits given to groundwater producers for their conservation efforts. Water demands for 2015-16 and projected water demands for 2016-17 and 2017-18 are summarized in Table 5. The water demands for the current year 2016-17 were determined by assessing the data that is presently available for the first half of the water year and projecting that data to develop the total annual demands. The water demands for the ensuing year 2017-18 are based on the projections provided by the retail water agencies within OCWD’s service area. Long-term projections are presented in Figure 5.
TABLE 5. Water Demands Within OCWD
Ground-water1
Imported Water2,3
Santiago Creek Native
Water3
Recycled Water4
Total
2015-16 Non-Irrigation 275,042 67,735 2,890 - 345,667 Irrigation 2,048 - - 19,687 21,735 Total 277,090 67,735 2,890 19,687 367,402
2016-17 (Current Year)5 Non-Irrigation 288,000 67,200 2,800 - 358,000 Irrigation 2,000 - - 20,000 22,000
Total 290,000 67,200 2,800 20,000 380,000
2017-18 (Ensuing Year)5 Non-Irrigation 301,000 69,200 2,800 - 373,000 Irrigation 2,000 - - 20,000 22,000 Total 303,000 69,200 2,800 20,000 395,000
1 Includes In-Lieu Program water, if available.
2 Excludes water conservation credits and imported water used for groundwater replenishment.
3 “Imported Water” and “Santiago Creek Native Water” are both counted as supplemental water.
4 Excludes GWRS recycled water recharged into the groundwater basin. Includes recycled water from IRWD and OCWD’s Green Acres Project (excluding OCSD’s usage).
5 Water demands are estimated by OCWD assuming average hydrology.

23
FIGURE 5. Water Demand Projections
WATER DEMAND FORECAST OCWD participates with MWDOC and retail groundwater producers to predict future demands in OCWD’s service area. Each groundwater producer projected its total water demands to the year 2035. These projections include the effect of local water conservation efforts. Figure 5 illustrates the historical and the projected water demands for OCWD’s service area to the year 2035. Population within OCWD’s service area is expected to increase from the current 2.28 million people (based on Census 2010 demographic data) to approximately 2.6 million people by the year 2035. This population growth is expected to increase water demands from the current 367,402 AF per year to 447,000 AF per year in 2035 (a water demand projection that takes into consideration future water conservation savings). In an effort to support increasing water demands, OCWD will look to increase basin production by operating the existing GWRS, maximizing the current AWPF production capacity, capturing more SAR storm flows, expanding the production of GWRS to its ultimate capacity (with the assumption that additional wastewater flows are available), purchasing imported supplies for groundwater recharge whenever supplies are available, developing other local recycled water supplies for replenishment purposes and expanding recharge facilities.
ADVANCED WASTEWATER RECLAMATION Groundwater, supplemental water and local surface water have historically been the primary water sources within OCWD. In recent decades, wastewater reclamation has
0
100,000
200,000
300,000
400,000
500,000
600,0001989-9
0
1994-9
5
1999-0
0
2004-0
5
2009-1
0
2014-1
5
2019-2
0
2024-2
5
2029-3
0
2034-3
5
Wate
r D
em
an
d (
acre
-feet)
Water Year
Historical Demand
Projected Demand

24
increasingly become a significant source of additional water. Purified recycled water has been produced by OCWD for use as injection water in the Talbert Barrier and as percolation water in Kraemer, Miller and Miraloma recharge basins. OCWD and IRWD also recycle wastewater at their respective treatment plants for irrigation and industrial uses. The GWRS is an advanced wastewater reclamation project jointly-funded by OCWD and the Orange County Sanitation District (OCSD). The project was operational in January 2008. The advanced treatment processes utilized in the GWRS consist of microfiltration (MF) followed by reverse osmosis (RO) membranes and ultraviolet (UV) light disinfection in combination with hydrogen peroxide. For water year 2015-16, the GWRS treated wastewater from the OCSD to drinking water standards and delivered 102,034 AF of purified water for direct injection into the Talbert seawater intrusion barrier and percolation into the OCWD groundwater basin via recharge basins and mid-basin injection (MBI) well. For water year 2015-16, OCWD and IRWD recycled water deliveries for landscape irrigation and industrial uses in Fountain Valley, Costa Mesa, Huntington Beach, Newport Beach, Santa Ana and IRWD’s service area within OCWD totaled 19,687 AF. WRD operates a 3-MGD Alamitos Barrier Recycled Water Project, known as the Leo J. Vander Lans Water Treatment Facility. This project supplies highly treated recycled water to the Alamitos Barrier. The Leo J. Vander Lans advanced wastewater treatment facility located in Long Beach utilizes the treatment processes of MF, RO and UV light disinfection. Currently undergoing an expansion to 8 MGD, this project is ultimately intended to replace most of the imported water used to supply the Alamitos Barrier with purified recycled water. The project operated for eleven months during the water year 2015-16 and supplied 452 AF of purified recycled water to the Alamitos Barrier, which represented 19 percent of the barrier’s supply that OCWD is responsible for payment. Recycled water deliveries from the Leo J. Vander Lans plant to the Orange County portion of the Alamitos Barrier are classified as supplemental water because this recycled water originates from outside the SAR watershed. It is noteworthy to mention that the Leo J. Vander Lans Water Treatment Facility is presently under expansion in an effort to increase its treatment capacity.
WATER QUALITY OCWD maintains a comprehensive groundwater protection policy that includes water quality monitoring, removal of contaminants, regulatory agency support, toxic residuals removal and hazardous waste management. In addition, OCWD provides water quality information to regulatory agencies, other water agencies and the general public. In order to meet the current and future water quality testing requirements, OCWD operates the Advanced Water Quality Assurance Laboratory at the Fountain Valley campus. The

25
laboratory houses approximately 30 chemists and laboratory technicians, 12 water quality monitoring personnel and all the analytical instruments that are needed to perform more than 400,000 analyses of approximately 20,000 water samples taken each water year. The laboratory supports the extensive water quality testing requirements for the GWRS. When blended together by the major agencies within OCWD’s service area, the blended groundwater (without treatment) and treated supplemental water for 2015-16 was determined to have a flow-weighted average of 489 milligrams per liter (mg/L) of total dissolved solids (TDS) which is less than the average TDS concentration of 496 mg/L reported for the prior year (2014-15). The average groundwater TDS concentration for the basin for 2015-16 was 449 mg/L (compared to 452 mg/L reported for 2014-15), ranging from a low of 222 mg/L in Seal Beach to a high of approximately 711 mg/L in certain inland areas. Average concentrations of TDS, nitrate (NO3) and hardness for groundwater and groundwater combined with supplemental water supplied by agencies within OCWD’s service area during the 2015-16 water year are summarized in Table 6. These concentrations were determined from groundwater and supplemental water analyses and from production reports submitted to and filed with OCWD by each water agency. The City of Tustin and IRWD have active groundwater treatment projects that help to reduce certain constituents reported in Table 6 in their groundwater supply prior to service to their customers (see note 6 for detailed explanation).
WATER RESOURCES DATA A summary of water resources data within OCWD for the 2015-16 water year and the previous water year (2014-15) is included in Appendix 5.

26
TABLE 6. 2015-16 Water Quality Summary
Groundwater1,7 Delivered Blend1,2,7
City/Agency TDS3 NO3-N4 Hard-
ness5 TDS3 NO3-N
4 Hard- ness5
Anaheim 584 2.9 323 599 2.2 317 Buena Park 422 1.4 262 470 1.2 269 East Orange County Water District 606 4.3 342 617 3.2 329 Fountain Valley 431 1.4 249 486 1.1 260 Fullerton 482 2.4 252 523 1.9 263 Garden Grove 528 3.6 320 556 2.9 315 Golden State Water Company 419 1.8 236 471 1.4 250 Huntington Beach 337 0.2 172 414 0.3 203 Irvine Ranch Water District6 352* 0.8* 129* 356* 0.8* 131* La Palma 295 ND
8 148 397 ND
8 190 Mesa Water District 333 0.4 113 338 0.4 116 Newport Beach 268 1.4 134 362 1.1 174 Orange 464 2.0 269 513 1.6 276 Santa Ana 401 2.1 239 455 1.7 252 Seal Beach 222 ND
8 81 356 ND8 148
Serrano Water District 711 3.2 374 710 1.9 361 Tustin6 698* 7.0* 384* 690* 5.8* 369* Westminster 362 1.3 233 421 1.1 246 Yorba Linda Water District 686 1.7 344 675 1.3 330 Weighted Average7 449 1.9 237 489 1.6 249
1 All groundwater results (alone or blend) are for untreated groundwater (see note 6 below). Units are reported in mg/L.
2 Delivered blend includes untreated groundwater and treated imported MWD water (i.e., blend of Colorado River water and State Project water as measured at the MWD Diemer Plant), except Serrano Water District, which blends with treated Santiago Reservoir water. Units are reported in mg/L. Annual average water qualities for MWD and Santiago Reservoir (Irvine Lake) for 2015-16 are as follows:
MWD Water Quality Santiago Reservoir Water Quality TDS = 648 mg/L TDS = 709 mg/L N03-N = 0.2 mg/L N03-N = ND mg/L Hardness (as CaCO3) = 295 mg/L Hardness (as CaCO3) = 343 mg/L 3 Secondary Drinking Water Standards for TDS are as follows:
500 mg/L = recommended limit 1,000 mg/L = upper limit 4 Primary Drinking Water Standard for nitrate NO3-N (i.e., nitrate expressed as nitrogen) is 10 mg/L.
5 Hardness is reported as mg/L of CaCO3. General classifications of hard and soft water are within the following concentration ranges:
0-75 mg/L = soft 150-300 mg/L = hard 75-150 mg/L = moderately hard 300 and up mg/L = very hard 6
Agencies with active groundwater quality improvement projects that treat for one or more of the constituents listed in the table. The results shown herein for “groundwater” and “delivered blend” reflect results from untreated groundwater. Water quality constituents that are marked with an asterisk (*) are reduced prior to delivery to customers.
7All water quality results are flow-weighted averages based on groundwater and imported water delivered to each agency.
8 ND = not detected. Nitrate (expressed as NO3-N) analytical detection limit for OCWD Advanced Water Quality Assurance Laboratory is 0.1 mg/L.

27
PART III: WATER PRODUCTION COSTS FOR ENSUING WATER YEAR (2017-18)
Section 31.5 of the District Act requires that costs of producing groundwater and obtaining supplemental water be evaluated annually. These costs vary for each groundwater producer and depend on many factors. Although these variations in cost are recognized, it is necessary for the purpose of this report to arrive at figures representing the average cost of producing groundwater and purchasing supplemental water.
ENSUING WATER YEAR (2017-18) WATER PRODUCTION COSTS SUMMARY OF FINDINGS
1. Cost for producing water from the groundwater basin within OCWD including a
replenishment assessment for 2017-18 is estimated to be $647.00 per acre-foot. 2. Cost of treated, non-interruptible supplemental water for 2017-18 is estimated to be
$1,077.00 per acre-foot.

28
GROUNDWATER PRODUCTION COSTS FOR NON-IRRIGATION USE Cost for producing an acre-foot of groundwater in the ensuing 2017-18 water year has been estimated for a potable water well for a large groundwater producer (i.e., a city water department, water district) in OCWD’s service area. Operations and maintenance (O&M) and energy costs were determined using the cost information provided by nineteen large groundwater producers from a survey conducted by OCWD in fall 2016. The capital cost component was derived using the available actual project cost data for eight production wells constructed in 2008 under the MWD Long-Term Groundwater Storage Program and adjusted to present values using Engineering News-Record Construction Cost Index. Appendix 6 contains several of the key design characteristics for eight wells that were constructed under the MWD’s program. The OCWD RA used in the determination of groundwater production cost is the proposed RA for 2017-18. The estimated cost for groundwater production for a large groundwater producing entity such as a city water department or a water district is presented in Table 7. The total cost to produce an acre-foot of groundwater within OCWD in the ensuing 2017-18 water year is estimated to be $647 per acre-foot. Based on the responses to the aforementioned survey, the flow-weighted average (based upon the quantity of groundwater pumped) for energy cost equaled $68 per AF. Operation and Maintenance (O&M) costs ranged from $32 to $279 per acre-foot with a median cost of approximately $72 per acre-foot. Elements that influence these costs include load factors and variations in groundwater levels. Recently drilled wells are generally deeper than those drilled decades ago. From the aforementioned survey, the average load factor which indicates the percent-of-use of an extraction facility equaled 50 percent.
TABLE 7. Estimated 2017-18 Groundwater Production Costs
Cost Item Non-Irrigation Use
Annual Cost ($) Cost per AF ($/AF)
Energy 176,8001 682 RA 1,157,0001 4453 Total Production Costs 1,333,800 513
Capital 161,2004 624 O&M 187,2001 722 Total Other Costs 348,400 134
Total Cost to Producers 1,682,200 647
1 Based upon an annual average production of 2,600 AF per production well.
2 Based on survey of major agencies within OCWD’s service area, non-irrigation groundwater users.
3 Proposed RA for 2017-18.
4 Based on 2008 average cost for design and construction of a production well (excluding land cost) under the MWD Long-Term Groundwater Storage Program (cost amortized over 30 years at 5 percent interest) and adjusted to 2016 dollars using Engineering News-Record Construction Cost Index for Los Angeles area. Typical design parameters are listed in Appendix 6.

29
COST OF SUPPLEMENTAL WATER Supplemental water is supplied to OCWD’s service area by MWD. MWD delivers both treated and untreated water as either a non-interruptible supply or an interruptible supply. As a result, there are several categories of water available from MWD. The categories most applicable for purposes of this report are 1) uninterruptible (i.e., firm) treated water, which is referred to as “full service water,” and 2) uninterruptible untreated water. Treated water is purchased and used directly by various groundwater producers for municipal and industrial purposes, while untreated water is purchased and recharged into the basin by OCWD to support higher groundwater production. Table 8 shows the estimated cost for the MWD uninterruptible treated water (full service water) cost for the ensuing 2017-18 water year. Figure 6 illustrates the historical supplemental water costs along with the historical groundwater production costs. A comparison of estimated costs for groundwater versus supplemental water (non-irrigation use) during the ensuing water year 2017-18 is summarized in Table 9 and also in Figure 6. Values used in Figure 6 are presented in tabular form in Appendix 7.
TABLE 8. Estimated 2017-18 Supplemental Water Cost1
Rate and Charge Components Treated Water Rate ($/AF)
Firm Deliveries Full Service Water
MWD Supply Rate (MWDOC Melded Rate)
205.00 294.00 128.00 53.50
316.50 80.00
1,077.00
MWD System Access Rate
MWD System Power Rate MWD Water Stewardship Rate MWD Treatment Surcharge MWD RTS and Capacity Charges2
Total
1 Rates are an average of calendar year 2017 and proposed calendar year 2018. Supplemental water costs for MWD’s member agencies (i.e., Anaheim, Fullerton and Santa Ana) are not reported herein due to the variability among these agencies on water supply allocations between MWD’s Tier 1 and Tier 2.
2 Readiness-to-Serve (RTS) and Capacity Charges have been converted to an approximate cost per acre-foot, but are not normally reported in terms of unit cost.
Cost components for supplemental treated and untreated water are listed in Table 8. Beyond the normally expected water supply, treatment and power charges, there are several other charges. The System Access charge is for costs associated with the conveyance and distribution system, including capital and O&M costs. The Water Stewardship charge is used to support MWD’s financial commitment to conservation,

30
FIGURE 6. Adopted and Projected Water Rates for Non-Irrigation Use1
1 Refer to Appendix 7 for actual values used in Figure 6.
TABLE 9. Estimated 2017-18 Water Production Cost Comparison
Non-Irrigation Use Groundwater Cost ($/AF)
Supplemental Water Cost ($/AF)
Fixed Cost
62.001 1,077.003
Variable Cost
585.002 -3
Total 647.00 1,077.00
1 Capital cost.
2 Cost for energy, O&M and proposed RA.
3 Delineation of fixed and variable costs is not available.
water recycling, groundwater recovery and other water management programs approved by MWD. MWD uses the Capacity Charge to recover its cost for use of peaking capacity within its distribution system. The Readiness-to-Serve (RTS) charge is to recover MWD’s cost associated with providing standby and peak conveyance capacity and system emergency storage capacity.
$0
$200
$400
$600
$800
$1,000
$1,2002001-0
2
2003-0
4
2005-0
6
2007-0
8
2009-1
0
2011-1
2
2013-1
4
2015-1
6
2017-1
8
Wate
r R
ate
($/a
cre
-fo
ot)
Water Year
MWD/MWDOC Treated FullService
MWD/MWDOC Treated In-LieuProgram
Groundwater Production Cost (RAPlus Energy)
OCWD ReplenishmentAssessment (RA)

Estimated GroundwaterElevations Within ThePrincipal AquiferFeet above Mean Sea Level* (ft MSL)
31
SANT
A ANA
RIVER
PACIFIC OCEAN
300260
-60
-60
-40
-30
-20
20 40
100
20
0
200
5
IRVINE
ANAHEIM
ORANGE
SANTAANA
BREA
FULLERTON
TUSTIN
NEWPORTBEACH
YORBALINDA
COSTAMESA
HUNTINGTONBEACH
GARDENGROVE
SEALBEACH
CERRITOS
BUENAPARK
LONGBEACH
WESTMINSTER
CYPRESS
PLACENTIA
LAHABRA
LAMIRADA
FOUNTAINVALLEY
VILLAPARK
STANTONLOS
ALAMITOS
LAPALMA
HAWAIIANGARDENS
405
605
5
91
73
57
22
551
90
39
72
241
261
133
0-10-20
-30
20
40
6080
-80
100
120
-60
-90
140
160
-70
-50
180
200
-40
220
240260
280
260
-40
100
220
-70
-30
180
-60
80
-30
140
40
160
-50
60
-40
20
-50
120
-50
California
Nevada
Oregon PLATE 1GROUNDWATER CONTOUR MAP
JUNE 20160 2 41
Miles
*NOTE: MSL elevations are referenced to Vertical Datum NGVD 29
-90 to -10020 to 300Recharge Facility Areas
Water BodiesOrange County Water District
Freeways / HighwaysRivers / Streams

32
SANT
A ANA
RIVER
PACIFIC OCEAN
0
-10
IRVINE
ANAHEIM
ORANGE
SANTAANA
BREA
FULLERTON
TUSTIN
NEWPORTBEACH
YORBALINDA
COSTAMESA
HUNTINGTONBEACH
GARDENGROVE
SEALBEACH
CERRITOS
BUENAPARK
LONGBEACH
WESTMINSTER
CYPRESS
PLACENTIA
LAHABRA
LAMIRADA
FOUNTAINVALLEY
VILLAPARK
STANTONLOSALAMITOS
LAPALMA
HAWAIIANGARDENS
5
405
605
5
91
73
57
2255
241
261
133
1
90
39
72
0
-10
10
-20
20
20
-10
-10
-10
10
0
-10
0
0
0
-10
0
0
-20
California
Nevada
Oregon Estimated GroundwaterElevation Changes Within The Principal Aquifer (Feet) PLATE 2
CHANGE IN GROUNDWATER LEVELFROM JUNE 2015 TO JUNE 2016
0 2 41Miles
-20 to -10010 to 20Recharge Facility Areas
Water BodiesOrange County Water District
Freeways / HighwaysRivers / Streams
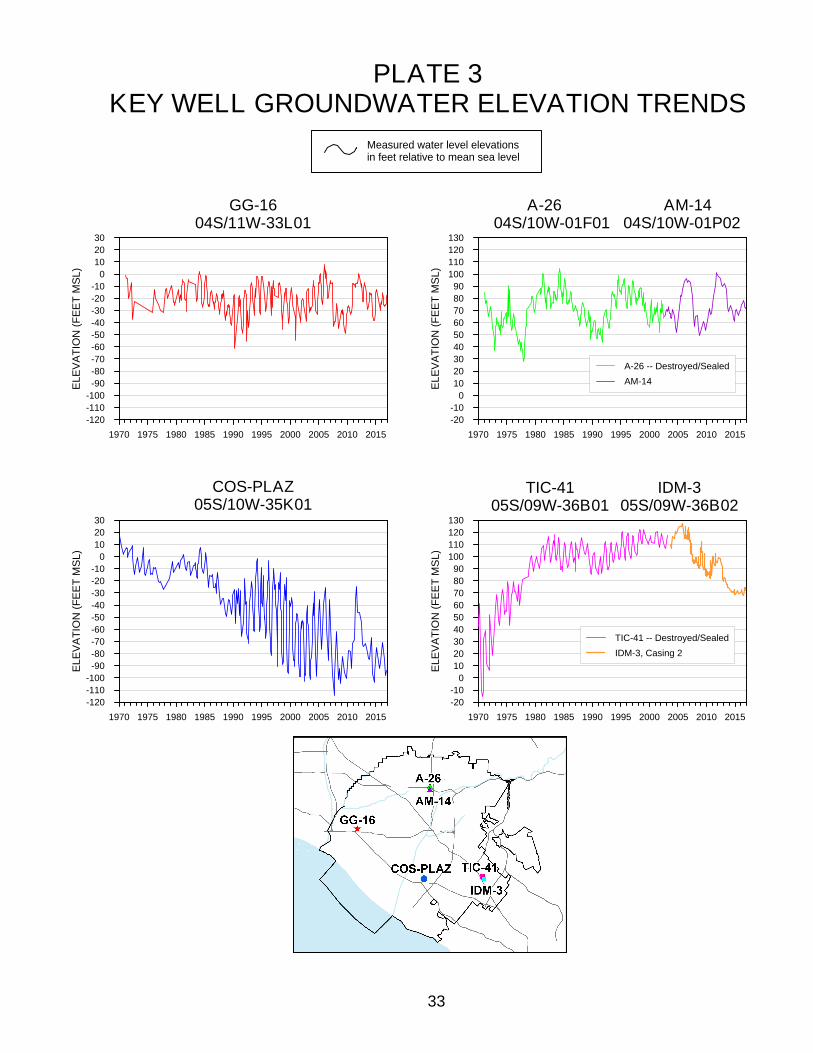
PLATE 3KEY WELL GROUNDWATER ELEVATION TRENDS
Measured water level elevationsin feet relative to mean sea level
33
1970 1975 1980 1985 1990 1995 2000 2005 2010 2015-120-110-100-90-80-70-60-50-40-30-20-10
0102030
ELEV
ATIO
N (F
EET
MSL
)
COS-PLAZ05S/10W-35K01
1970 1975 1980 1985 1990 1995 2000 2005 2010 2015-120-110-100-90-80-70-60-50-40-30-20-10
0102030
ELEV
ATIO
N (F
EET
MSL
)
GG-1604S/11W-33L01
1970 1975 1980 1985 1990 1995 2000 2005 2010 2015-20-10
0102030405060708090
100110120130
ELEV
ATIO
N (F
EET
MSL
)
A-26 AM-1404S/10W-01F01 04S/10W-01P02
A-26 -- Destroyed/SealedAM-14
1970 1975 1980 1985 1990 1995 2000 2005 2010 2015-20-10
0102030405060708090
100110120130
ELEV
ATIO
N (F
EET
MSL
)
TIC-4105S/09W-36B01
IDM-305S/09W-36B02
TIC-41 -- Destroyed/SealedIDM-3, Casing 2

34
APPENDIX 1. Water Production Data 2015-16
(AF) Actual BPP
Pumping CUP 2Total
DeliveriesConservation
Credit 3
Anaheim, City of 7 43,018.2 2,029.3 - 40,988.9 13,409.0 253.8 - 13,662.8 54,651.7 75.0%
Buena Park, City of 7 11,104.3 2,217.2 - 8,887.1 2,932.9 29.2 - 2,962.1 11,849.2 75.0%
East Orange County Water District 468.7 - - 468.7 172.1 3.9 - 176.0 644.7 72.7%
County of Orange 135.1 - - 135.1 54.5 - - 54.5 189.6 71.3%
Fountain Valley, City of 5,961.8 - - 5,961.8 1,984.7 33.3 - 2,018.0 7,979.8 74.7%
Fullerton, City of 17,537.8 - 8.0 17,545.8 5,848.9 45.1 - 5,894.0 23,439.8 74.8%
Garden Grove, City of 4,7 18,216.6 2,040.8 - 16,175.8 5,341.9 63.9 - 5,405.8 21,581.6 75.0%
Golden State Water Company 7 17,630.8 1,770.0 - 15,860.8 5,197.2 132.0 - 5,329.2 21,190.0 74.9%
Huntington Beach, City of 18,667.6 - - 18,667.6 6,059.8 127.1 - 6,186.9 24,854.5 75.1%
Irvine Ranch Water District 4, 5 45,463.1 - 933.0 46,396.1 510.4 857.0 - 1,367.4 47,763.5 97.1%
La Palma, City of 1,223.7 - - 1,223.7 490.5 9.9 - 500.4 1,724.1 71.0%
Mesa Water District 4 14,786.1 - 68.4 14,854.5 206.0 67.4 - 273.4 15,127.9 98.2%
Newport Beach, City of 9,589.0 - - 9,589.0 3,036.2 30.9 - 3,067.1 12,656.1 75.8%
Orange, City of 5 17,375.9 - - 17,375.9 6,158.5 92.2 - 6,250.7 23,626.6 73.5%
Orange County Water District 6 96.9 - - 96.9 - - - 0.0 96.9 100.0%
Santa Ana, City of 7 29,269.2 4,523.9 - 24,745.3 8,182.9 83.3 - 8,266.2 33,011.5 75.0%
Seal Beach, City of 2,187.8 - - 2,187.8 1,032.7 7.8 - 1,040.5 3,228.3 67.8%
Serrano Water District 5 1,210.6 - - 1,210.6 853.7 5.4 - 859.1 2,069.7 58.5%
Tustin, City of 4 7,702.3 - - 7,702.3 1,553.7 55.6 - 1,609.3 9,311.6 82.7%
Westminster, City of 7 9,785.4 2,059.3 - 7,726.1 2,518.1 57.3 - 2,575.4 10,301.5 75.0%
Yorba Linda Water District7 12,360.1 1,571.5 7.4 10,796.0 5,081.2 52.0 - 5,133.2 15,929.2 67.8%
Total Major Groundwater Producers 283,791.0 16,212.0 1,016.8 268,595.8 70,624.9 2,007.1 0.0 72,632.0 341,227.8 78.7%
Other Producers 6,623.0 - 1,031.0 7,654.0 0.0 0.0 0.0 0.0 7,654.0
Exempt Well Production 840.2 - - 840.2 0.0 0.0 0.0 0.0 840.2
Total Amount 291,254.2 16,212.0 2,047.8 277,090.0 70,624.9 2,007.1 0.0 72,632.0 349,722.0
79.1%
1 Water classed as being used for purposes other than commercial agriculture.
2 Additional groundwater extraction in response to MWD's CUP pumping.
3 Accounts for only those credits allowed for under the program initiated on September 20, 1995.
4 Agencies that participate in a groundwater water quality improvement project.
6 Groundwater quantity reported herein is that quantity used by OCWD for purposes other than seawater intrusion barrier maintenance.
7 These agencies participated in the MWD Long-Term Groundwater Storage Program for which groundwater was extracted and accounted for as supplemental water.
Total Grand TotalNon-Irrigation 1
Only
Groundwater (AF) Supplemental Water (AF)
Non-Irrigation 1 Non-Irrigation 1
5 Agencies that can receive Santiago Creek native water above Villa Park Dam that are conveyed to users within OCWD. Such water, if delivered, is included within the classification of "Supplemental Water"
as defined in the District Act.
Groundwater Producer Irrigation
Pumping
Irrigation
Deliveries
Basin Production Percentage (includes non-irrigation deliveries, but excludes water conservation credits)

35
APPENDIX 2. 2015-16 Groundwater Production — Non-Irrigation Use Production Over 25 Acre-feet
PRODUCER AF PRODUCER AF
Alta Vista Country Club 385.4 Mesa Verde Country Club 347.9
Anaheim Cemetery 43.8 Mesa Water District 14,786.1
Anaheim, City of * 43,018.2 Midway City Mutual Water Company 145.2
Angelica Textile Services – Plant 10
Buena Park, City of *
30.0
11,104.3
Mile Square Golf Course
Navy Golf Course
92.3
516.0
Canyon RV Park 110.2 Newport Beach Golf Course 82.3
Coca Cola North America 212.2 Newport Beach, City of 9,589.0
County of Orange 135.1 Orange County Cemetery District 68.2
Cypress GC LLC/Cypress Golf Club 55.8 Orange County Water District 63.1
Donovan Golf Course Management 257.4 Orange, City of 17,375.9
DS Services of America, Inc. 352.1 Page Avenue Mutual Water Company 39.3
East Orange County Water District 468.7 R.J. Noble Company 29.3
Eastlake Village HOA 83.0 Riverview Golf 195.7
Eastside Water Association 193.9 Santa Ana Country Club 225.2
Fairhaven Memorial Park 160.3 Santa Ana, City of * 29,269.2
Forest Lawn Memorial Park 242.4 Seal Beach, City of 2,187.8
Fountain Valley, City of 5,961.8 Sequoia Management Services, LL 533.2
Fullerton, City of 17,537.8 Serrano Water District 1,210.6
Garden Grove, City of * 18,216.6 South Coast Chores HOC c/o Optima 66.4
Golden State Water Company * 17,630.8 South Midway City Water Company 79.6
Hargis and Associates, Inc. 69.5 The Boeing Company 270.4
Huntington Beach, City of 18,667.6 The Good Shepherd Cemetery 69.4
Hynes Estates, Inc. 53.0 The Lakes Master Association 105.2
Irvine Ranch Water District 45,463.1 Tustin, City of 7,702.3
Knott’s Berry Farm 300.5 Westminster, City of * 9,785.4
La Palma, City of 1,223.7 Westminster Memorial Park 324.8
Lockheed Martin Corporation 32.5 Yorba Linda Country Club 324.1
Los Alamitos Race Course 291.1 Yorba Linda Water District * 12,360.1
Melrose Abbey Funeral Center 40.8 Total 290,185.7
* These agencies extracted additional groundwater in response to MWD’s CUP pumping.
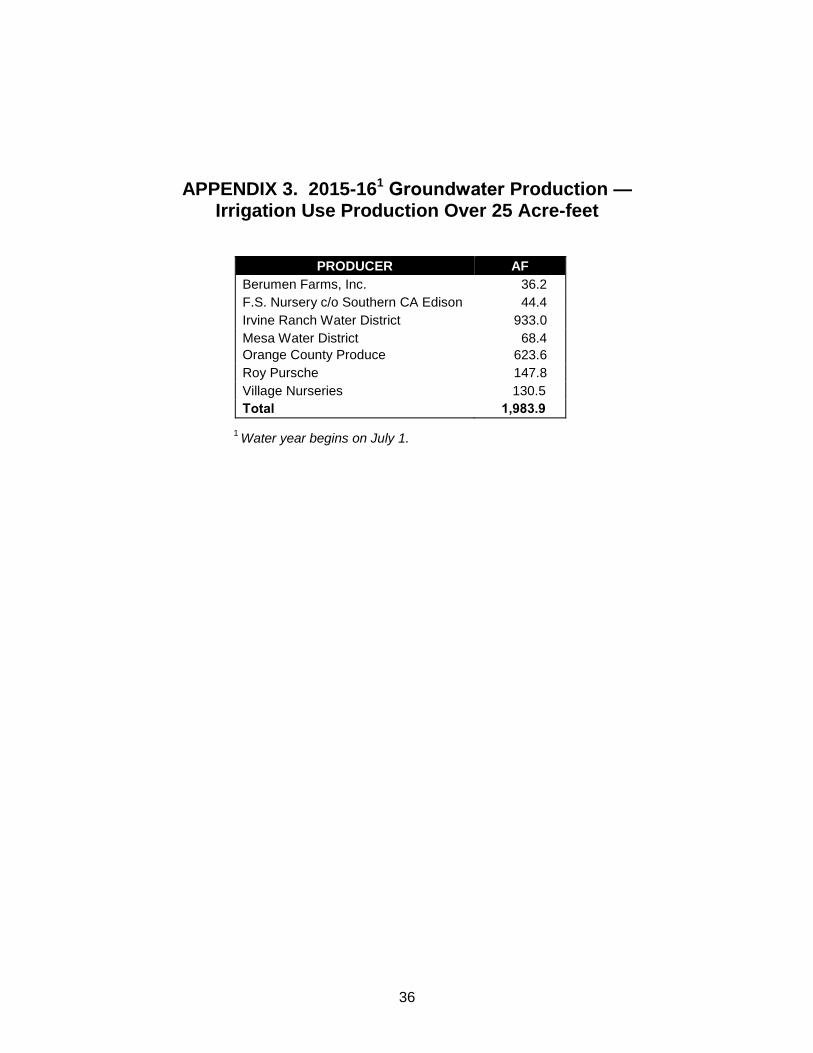
36
APPENDIX 3. 2015-161 Groundwater Production — Irrigation Use Production Over 25 Acre-feet
PRODUCER AF
Berumen Farms, Inc. 36.2
F.S. Nursery c/o Southern CA Edison 44.4
Irvine Ranch Water District 933.0
Mesa Water District
Orange County Produce
68.4
623.6
Roy Pursche 147.8
Village Nurseries 130.5
Total 1,983.9
1 Water year begins on July 1.

37
APPENDIX 4. Non - Local Water Purchased by OCWD for
Water Years 1996-97 through 2015-16
Water
Exchange Talbert Barrier Forebay Recharge In-Lieu Program Basin Water SAR Upstream GW Projects TOTAL
Western Alamitos FV1 MCWD Forebay CUP
2 CUP
2 Supply Mgmt. Arlington San Bernard.
Mun. WD Barrier OC32A OC44B Recharge Recharge In-Lieu In-Lieu Program3 Desalter Valley Mun.WD
Water Purch. Purch. Purch. Purch. Purch. Delivery Delivery Purch. Purch. Purch. Purch. Purch.
Year AF AF AF AF AF AF AF AF AF AF AF AF
1996-97 2958.0 1,885.5 - - 33,742.7 - - 7,883.0 - 6,176.2 - 52,645.4
1997-98 701.8 1,613.8 - - 19,029.4 - - - 27,674.9 2,516.9 - 51,536.8
1998-99 996.1 1,493.6 - - 10,371.5 - - - 13,351.9 2,351.3 - 28,564.4
1999-00 - 1,873.6 - - 28,478.1 - - 24,726.0 13,280.8 4,994.6 - 73,353.1
2000-01 - 1,672.5 941.7 - 59,138.4 - - 11,191.0 7,449.0 5,177.9 2,787.6 88,358.1
2001-02 2,990.3 2,282.2 2,673.0 - 30,092.6 - - 19,472.4 - 5,819.8 4,296.4 67,626.7
2002-03 3,471.4 1,448.7 1,540.1 - 35,755.1 - - 25,631.0 35,832.0 4,924.7 - 108,603.0
2003-04 3,605.0 1,938.3 1,703.3 3,380.6 14,832.0 2,462.7 2,479.6 49,688.8 - 4,087.3 - 84,177.6
2004-05 - 1,914.9 2,451.8 8,368.6 3,810.8 - 15,021.1 54,596.1 - 567.5 - 86,730.8
2005-06 - 833.04 1,079.9 5,431.1 7,256.7 - 15,452.9 73,763.1
5 - - - 103,816.7
2006-07 1,745.0 534.14 143.9 7,394.7 42,173.0 - 14,427.3 36,313.0 - 227.6 - 102,958.6
2007-08 2,882.4 1,505.74 - 4,581.4 - - - - - 1,266.6 - 10,236.1
2008-09 3,663.5 2,094.24 - 4,140.3 18,100.0 - - - - 428.2 - 28,426.2
2009-10 - 1,321.94 - 176.9 20,535.7 - - - - 106.2 - 22,140.7
2010-11 - 1,689.14 - 100.5 11,038.6 16,500.0 - 10,435.4 - - - 39,763.6
2011-12 - 1,198.74 - 1.9 41,230.8 7,709.6 9,719.9 30,843.6 - - - 90,704.5
2012-13 - 1,721.84 - 3.7 24,356.1 15,570.8 - - - - - 41,652.4
2013-14 - 2,370.24 - 6.2 50,700.5 - - - - - - 53,076.9
2014-15 - 2,236.34 - 17.7 48,616.8 - - - - - - 60,870.8
6
2015-16 - 2,398.94 - 7.0 45,118.0 - - - - - - 47,523.9
Total 23,013.5 34,027.0 10,533.7 33,610.6 544,376.8 42,243.1 57,100.8 344,543.4 97,588.6 38,644.8 7,084.0 1,195,242.46
1 Includes only imported water and excludes groundwater deliveries from Fountain Valley to OCWD.
2 “CUP” is the multi-agency conjunctive use program (known as the MWD Long-Term Groundwater Storage Program or MWD CUP). Basin losses are not taken into account.
3 Known as Basin Water Supply Management Program (WSM) water. WSM program was terminated on December 31, 2003.
4 Includes both MWD imported deliveries and supplemental recycled water deliveries.
5 Includes 16,000 AF of 2005-06 MWD Supplemental Storage Program (i.e., “Super In-Lieu”) water that was received as In-Lieu by the groundwater producers.
6 Includes purchase of 10,000 AF of stored water from MWD CUP storage account at full-service untreated water rate in water year 2014-15.

38
APPENDIX 5. 2015-16 Water Resources Summary
2015-2016 Water Year
(AF)
2014-2015 Water Year
(AF)
Change from last year to this
year
SUMMARY OF BASIN CONDITIONS
BASIN SUPPLIES
Water Purchases from MWD (excludes In-Lieu) 45,118 48,727 (3,609)
Water into MWD Storage Account (excludes In-Lieu) 0 0 0
SAR and Santiago Creek Flows1 113,203 107,924 5,279
GWRS AWPF Water to Forebay Recharge Basins 65,229 39,688 25,541
GWRS AWPF Water to Mid-Basin Injection 1,579 310 1,269
GWRS AWPF Water to Talbert Barrier 35,226 36,471 (1,245)
Imported Water to Talbert Barrier (OC-44 & Fountain Valley) 7 18 (11)
Alamitos Barrier 2,399 2,236 163
Incidental Recharge 36,401 49,936 (13,535)
Evaporation from Recharge Facilities (3,250) (2,904) (346)
SAR Flow Lost to Pacific Ocean (610) (3,230) 2,620
Total Groundwater Recharge 295,302 279,176 16,126
WATER PRODUCTION
Groundwater Production 277,090 305,259 (28,169)
MWD Storage Program Extractions 16,212 12,917 3,295
Total Groundwater Production 293,302 318,176 (25,030)
BASIN STATUS
Change in Groundwater Storage 2,000 (39,000) 41,000
Change in Groundwater Storage excluding MWD Stored Water 18,212 (26,083) 44,295
Accumulated Overdraft (AOD) (379,000) (381,000) 2,000
AOD without MWD Storage Program Water (379,177) (397,440) 18,263
IN-LIEU WATER
OCWD In-Lieu Purchases 0 0 0
MWD In-Lieu Storage 0 0 0
Total In-Lieu 0 0 0
OTHER KEY INFORMATION
1. Imported Deliveries to Producers (less MWD withdrawal)2 54,413 81,212 (26,799)
2. Total Dissolved Solids of SAR below Prado Dam (mg/L) 578 640 (62)
3. Total Nitrogen of SAR below Prado Dam (mg/L) 3.8 3.8 0
4. Total GWRS AWPF Production3 102,101 76,534 25,567
5. Green Acres Project 4,081 4,319* (238)
6. Base Flow of Santa Ana River 69,101 63,756 5,345
7. Year-end Storage behind Prado Dam 5 1 4
8. Year-end Storage in Recharge Facilities 10,841 9,733 1,108
9. Total Artificial Recharge (percolation plus barriers) 258,902 229,240 29,662
10. Rainfall Measured at OCWD Field Headquarters (inches) 8.47 9.27 (0.8)
11. Annual Mean Temperature at Santa Ana Fire Station (°F) 68.3 69.3 (1)
1 Accounts for storage to/from recharge facilities.
2 Santiago Creek Native and In-Lieu water are included (excludes imported water used for groundwater replenishment).
3 Total includes deliveries to recharge basins, Talbert Barrier, MBI, Anaheim Canyon Power Plant and ARTIC.
*These values have been revised and were provided to OCWD after the publication of the 2014-2015 Engineer’s Report.

39
APPENDIX 6. Typical Groundwater Extraction
Facility Characteristics
PARAMETER CHARACTERISTICS Water System Pressure 62 psi Load (Use) Factor 63% Design Flow Rate 2,563 gpm Annual Production 2,600 AF Bowl Efficiency (minimum) 84% Motor Horsepower 325 hp Type Motor Electric Well Casing Diameters 16 – 20 inches Type of Pump Vertical Turbine Depth of Well 1,052 feet Depth of Bowls 278 feet Total Dynamic Head 325 feet Estimated Life 30 years Annual Cost of Facilities
1 $161,200
1 2016 cost was based on a 2008 cost with an interest rate of 5 percent amortized over a 30-
year period and excluding the cost for land. The 2008 cost was adjusted to 2016 dollars using Engineering News-Record Construction Cost Index for Los Angeles area.

40
APPENDIX 7. Values Used in Figure 6 For Water Rates for Non-Irrigation Use
Water Year
RA ($/AF)
Estimated
Groundwater Production Cost1,2
($/AF)
MWD Treated
Interruptible Rate (In-Lieu Program)2,3
($/AF)
MWD Treated Non-Interruptible
Rate (Full Service)2,3
($/AF) 1985-86 32 85 181 225
1986-87 32 91 187 231
1987-88 32 91 187 231
1988-89 42 105 187 231
1989-90 45 119 136 231
1990-91 48 91 137 232
1991-92 51 100 156 263
1992-93 60 116 206 325
1993-94 67.5 124 257 389
1994-95 88 145 279 416
1995-96 85 140 294 440
1996-97 88 140 303 448
1997-98 91 141 303 455
1998-99 94 143 303 458
1999-00 100 150 303 459
2000-01 107 150 303 459
2001-02 117 162 303 459
2002-03 127 176 299 455
2003-04 149 203 301 460
2004-05 172 229 318 479
2005-06 205 258 337 494
2006-07 223 278 354 510
2007-08 237 296 382 538
2008-09 249 307 420 586
2009-10 249 308 5014 701
2010-11 249 310 6024 744
2011-12 254 315 6334 794
2012-13 266 330 -5 794
2013-14 276 334 -5 890
2014-15 294 349 -5 923
2015-16 322 386 -5 942
2016-17 402 473 -5 979
2017-18 445 513 -5 1,077
4
1 Includes RA plus energy cost to produce groundwater.
2 Rate is rounded. 3 Rate is proposed.
4 Rate is estimated.
5 This rate is no longer available because MWD terminated the Replenishment Program.