engineering identification, and engineering … journal of engineering education – december 2017...
TRANSCRIPT

American Journal of Engineering Education – December 2017 Volume 8, Number 2
Copyright by author(s); CC-BY 157 The Clute Institute
The Effects Of Gender, Engineering Identification,
And Engineering Program Expectancy On Engineering Career Intentions: Applying
Hierarchical Linear Modeling (HLM) In Engineering Education Research
Chosang Tendhar, Long Island University, USA Marie C. Paretti, Virginia Tech, USA Brett D. Jones, Virginia Tech, USA
ABSTRACT This study had three purposes and four hypotheses were tested. Three purposes: (1) To use hierarchical linear modeling (HLM) to investigate whether students’ perceptions of their engineering career intentions changed over time; (2) To use HLM to test the effects of gender, engineering identification (the degree to which an individual values a domain as an important part of the self), and engineering program expectancy (one’s belief in the possibility of his or her success in engineering) on the growth trajectory of students’ engineering career intentions; and (3) To introduce the uses of longitudinal design and growth curve analysis in engineering education research. Survey data was collected at four time points using measures that produce scores with known validity. Sample sizes at each time point were 470, 239, 129, and 115, respectively. We used SPSS 22.0 to perform descriptive statistics and reliability analyses, and HLM version 7.0 to analyze growth. Between their first and third years, undergraduate students’ perceived engineering career intentions neither grew nor declined significantly, with no significant difference between male and female students. Engineering identification significantly predicted individual differences when controlling for engineering program expectancy, whereas engineering program expectancy did not predict career intentions when controlling for engineering identification. These findings are possibly signs of overall stabilization of the declining trends in career intentions and reversal of women’s perceptions of commitment to engineering careers. The contributions and limitations of this study are also discussed. Keywords: Engineering Identification; Gender; Career Choice; Persistence; Hierarchical Linear Model (HLM)
INTRODUCTION
ecruiting and retaining students in science, technology, engineering, and math (STEM) fields is a priority because the number of U.S. students pursuing STEM careers, particularly engineering, may not be sufficient to fulfill future demand (Weiss, 2009). The Science and Engineering indicators, published
by the National Science Foundation (2010), revealed that the number of jobs in science and engineering is increasing while the number of U.S. students pursuing science and engineering degrees remains flat. This explains the continued interest in addressing the demand-supply gap of STEM professionals through research in major and career intentions, among others. The issues of recruitment and retention in STEM fields have been well documented and received serious attention about six decades ago (Steinberg, 1949; Lucena, 2005). Women and minorities were found to switch out of STEM
R

American Journal of Engineering Education – December 2017 Volume 8, Number 2
Copyright by author(s); CC-BY 158 The Clute Institute
majors at a higher rate than others (e.g., Hall, Dickerson, Batts, Kauffmann, & Bosse, 2011; Ingersoll & May, 2012; Larose, Ratelle, Guay, Senecal, & Harvey, 2006; Mau, 2003; National Science Board, 2007). It has been noted that 50% of the college bound students with initial interest in STEM majors drop out, and of those who enter one of the STEM majors roughly half of them end up with non-STEM degrees (Chen, 2013; Daempfle, 2003). Not all of those who earn STEM degrees necessarily pursue careers in STEM fields (e.g., Lichtenstein et al., 2009). Much of the research in recent years, particularly following landmark study of Seymour and Heweitt (1997), has focused on factors affecting retention within engineering majors. They identified classroom and departmental climate issues as primary factors in students’ decisions to leave science, math, and engineering majors. These findings are echoed in studies focused solely on engineering (Lichtenstein, Loshbaugh, Claar, Bailey, & Sheppard, 2007; Marra, Rodgers, Shen, & Bogue, 2012). Many non-cognitive variables (e.g., motivational constructs and extra-curricular activities) were found to impact students’ commitment to engineering majors. For example, competence-based beliefs such as self-efficacy (Bandura, 1977) and expectancy (Eccles et al., 1983; Wigfield & Eccles, 2000) have emerged as critical factors in engineering retention (Burtner, 2005; Cross & Vick, 2001; Eris et al., 2010; Jones, Osborne, Paretti, & Matusovich, 2014; Matusovich, Streveler, & Miller, 2010), particularly for women (e.g., Marra, Rodgers, Shen, & Bogue, 2009). Other salient factors that counter attrition include intrinsic motivation (Eris et al., 2007; French, Immekus, & Oakes, 2003; French, Immekus, & Oakes, 2005); sense of belonging or “fit” (Danielak, Gupta, & Elby, 2014; Foor, Walden, & Trytten, 2007; Jones et al., 2014); engineering identification (Jones, Tendhar, & Paretti, 2016); and educational experiences such as reflective learning (Lichtenstein, McCormick, Sheppard, & Puma, 2010), campus and community involvement (Meyers, Pieronek, & Mcwilliams, 2012), and first year experience and living learning communities (Vasko & Baumann, 2012). A greater number of researchers, thus far, have focused on retention within engineering majors compared to persistence in engineering careers. A few important studies pertaining to engineering career do exist, however. As early as 1998, Nauta, Epperson, and Kahn (1998) found that ability, self-efficacy, role models, and role conflict (e.g., home versus work) predicted career intentions for women in math, engineering, and physical sciences. Eris et al. (2010) found that engineering career intentions strengthened for those students who remained in engineering majors during college. Furthermore, students’ math and science skills as well as their high school mentors were influential in strengthening their career intentions. In studying career intentions in first-year engineering students, Jones, Paretti, Hein, and Knott (2010) found that interest and utility value (Eccles et al., 1983) were the strongest predictors of career intention throughout the first year. By the end of the first year, the same study found that engineering identification was also a statistically significant predictor. In terms of gender differences, Sheppard et al., (2010) found that there were none for students intending to enter the engineering workforce. Amelink and Creamer (2010) found that women were significantly less likely than men to see themselves in an engineering career in 10 years. Singh et al. (2013) noted that women’s representation in the field is far below their graduation rate. They noted that “half of women who are trained as engineers leave the field, while only 10% of white men do” (p. 281) citing data from both the National Science Foundation and the Society of Women Engineers. Theoretical Frameworks for Persistence in Engineering Careers Based on prior studies in retention and persistence, we turn to two primary frameworks for this study: expectancy for success and domain identification, specifically engineering identification. Expectancy for success. Expectancy for success, defined as how well individuals believe that they will do on upcoming tasks (generally within a specific domain), is a key component of expectancy-value theory (Eccles et al., 1983; Eccles, Adler, & Meece, 1984; Wigfield & Eccles, 2000). It is closely related to self-efficacy (Bandura, 1986, 1997), which has been used widely in engineering education research, particularly in studies of women’s experiences (Cross & Vick, 2001; Hutchison, Follman, Sumpter, & Bodner, 2006; Marra & Bogue, 2007; Shull & Weiner, 2002; Singh et al., 2013). Self-efficacy and expectancy for success are similar in that both involve judgments about one’s own likely future success. But self-efficacy historically focuses on judgements about particular tasks (Bandura, 1986,
American Journal of Engineering Education – December 2017 Volume 8, Number 2
Copyright by author(s); CC-BY 159 The Clute Institute
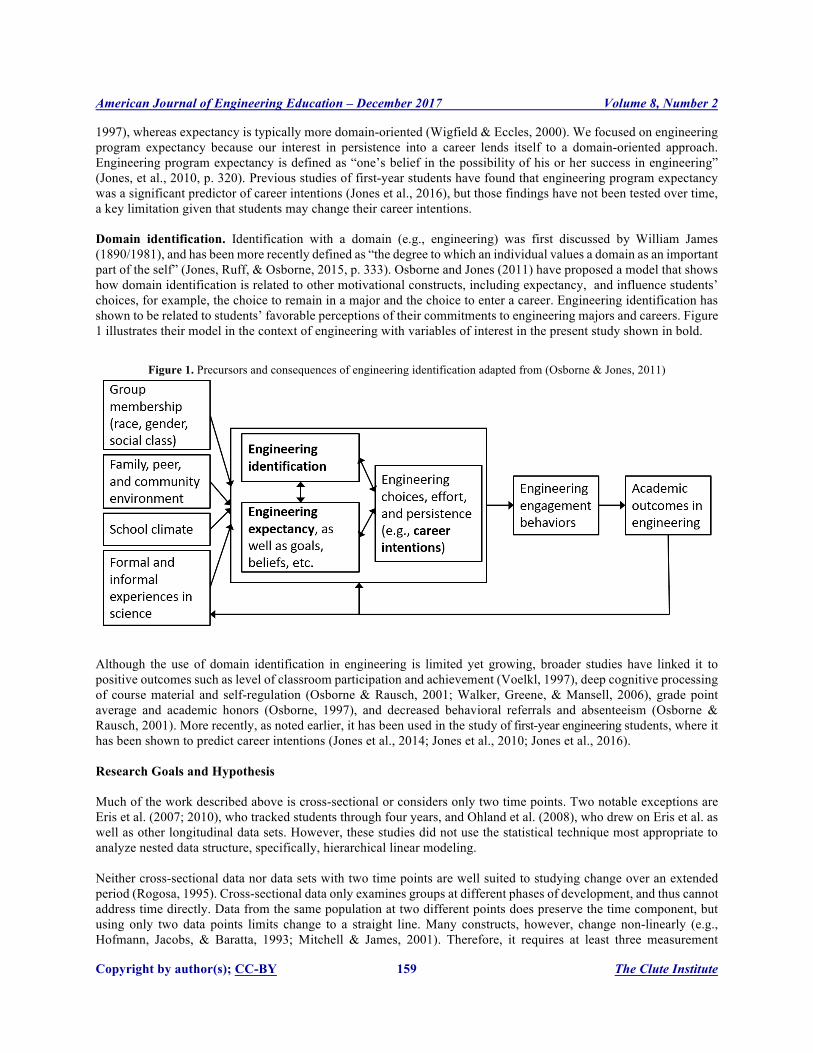
1997), whereas expectancy is typically more domain-oriented (Wigfield & Eccles, 2000). We focused on engineering program expectancy because our interest in persistence into a career lends itself to a domain-oriented approach. Engineering program expectancy is defined as “one’s belief in the possibility of his or her success in engineering” (Jones, et al., 2010, p. 320). Previous studies of first-year students have found that engineering program expectancy was a significant predictor of career intentions (Jones et al., 2016), but those findings have not been tested over time, a key limitation given that students may change their career intentions. Domain identification. Identification with a domain (e.g., engineering) was first discussed by William James (1890/1981), and has been more recently defined as “the degree to which an individual values a domain as an important part of the self” (Jones, Ruff, & Osborne, 2015, p. 333). Osborne and Jones (2011) have proposed a model that shows how domain identification is related to other motivational constructs, including expectancy, and influence students’ choices, for example, the choice to remain in a major and the choice to enter a career. Engineering identification has shown to be related to students’ favorable perceptions of their commitments to engineering majors and careers. Figure 1 illustrates their model in the context of engineering with variables of interest in the present study shown in bold.
Figure 1. Precursors and consequences of engineering identification adapted from (Osborne & Jones, 2011)
Although the use of domain identification in engineering is limited yet growing, broader studies have linked it to positive outcomes such as level of classroom participation and achievement (Voelkl, 1997), deep cognitive processing of course material and self-regulation (Osborne & Rausch, 2001; Walker, Greene, & Mansell, 2006), grade point average and academic honors (Osborne, 1997), and decreased behavioral referrals and absenteeism (Osborne & Rausch, 2001). More recently, as noted earlier, it has been used in the study of first-year engineering students, where it has been shown to predict career intentions (Jones et al., 2014; Jones et al., 2010; Jones et al., 2016). Research Goals and Hypothesis Much of the work described above is cross-sectional or considers only two time points. Two notable exceptions are Eris et al. (2007; 2010), who tracked students through four years, and Ohland et al. (2008), who drew on Eris et al. as well as other longitudinal data sets. However, these studies did not use the statistical technique most appropriate to analyze nested data structure, specifically, hierarchical linear modeling. Neither cross-sectional data nor data sets with two time points are well suited to studying change over an extended period (Rogosa, 1995). Cross-sectional data only examines groups at different phases of development, and thus cannot address time directly. Data from the same population at two different points does preserve the time component, but using only two data points limits change to a straight line. Many constructs, however, change non-linearly (e.g., Hofmann, Jacobs, & Baratta, 1993; Mitchell & James, 2001). Therefore, it requires at least three measurement

American Journal of Engineering Education – December 2017 Volume 8, Number 2
Copyright by author(s); CC-BY 160 The Clute Institute
occasions to model growth effectively (Singer & Willett, 2003). Similarly, studies that report only mean scores at different time points (e.g., Brainard & Carlin, 1998) imply a single trend line for all individuals included in the study, and thus disregard intra- and inter-individual variations. The application of robust growth modeling techniques remains uncommon, but much needed, in engineering education research. Growth modeling, as described in more detail under Methods section, provides an effective method to predict and understand both the associations, or lack thereof, between variables over time and the consequences of such associations (e.g., George & Jones, 2000). To this end, our study thus has three purposes:
(1) To use growth modeling techniques to investigate whether students’ perceptions of their engineering career intentions change over the first three years of their undergraduate engineering program.
(2) To use growth modeling techniques to test the effects of gender, engineering identification, and engineering program expectancy on the growth trajectory of students’ engineering career intentions.
(3) To introduce the uses of longitudinal design and growth curve analysis in engineering education research.
Research Hypotheses Based on the existing literature on persistence in engineering careers and the purposes of this study, we tested four hypotheses: Hypothesis 1: Students’ perceptions of engineering career intentions will significantly decline during the period of this study. Hypothesis 2: Male students will have stronger initial career intentions and stronger growth rates in career intentions than female students. Hypothesis 3: Engineering identification will significantly predict engineering career intentions, controlling for engineering program expectancy. Hypothesis 4: Engineering program expectancy will significantly predict engineering career intentions, controlling for engineering identification.
METHODS To test our hypotheses and illustrate the usefulness of growth curve analysis for understanding persistence, we conducted a quantitative study using data collected at four time points over three years from engineering students at a single institution. Participants and Procedure Engineering students at a Mid-Atlantic U.S. research-intensive university with predominantly white population completed an online questionnaire on four different occasions during their first three years at the university: (1) January 2010 (beginning of the second semester of the first year), (2) April 2010 (end of second semester of the first year), (3) April 2011 (end of second semester of sophomore year), and (4) April 2012 (end of second semester of junior year). The use of four measurement points exceeds the minimum needed to do growth modeling (Singer & Willett, 2003), adding robustness to the analysis. The initial survey was sent to all first-year engineering students enrolled in the second semester of a two-semester introduction to engineering course. At time point one, 470 students completed the questionnaire (response rate: ~ 40%); 345 (73%) were male and 125 (27%) were female. Note that females were overrepresented among respondents, a trend that continued in subsequent surveys. Subsequent surveys were sent to only those who responded to the initial survey. The sample size decreased to 239, 129, and 115 at time points two, three, and four, respectively. At time point two, 70% (n = 167) of the respondents were male and 30% (n = 72) were female. At time point three, 65% (n = 85) were male and 35% (n = 44) were female. At the last measurement

American Journal of Engineering Education – December 2017 Volume 8, Number 2
Copyright by author(s); CC-BY 161 The Clute Institute
occasion, 58% (n = 67) were male and 42% (n = 48) were female. The institutional review board at this institution approved the study.
MEASURES Measures for this study are taken from Jones et al. (2010) (see also Jones et al., 2016). Engineering Career Intentions The dependent variable in this study was engineering career intentions, which was measured with one item: “How likely is it that your eventual career will directly relate to engineering?” The five response options ranged from 1 (I am as sure as I can be right now that my career will not directly relate to engineering) to 5 (I am as sure as I can be right now that my career will directly relate to engineering). Jones et al. (2010) adapted this item from Schmader, Johns, and Barquissau (2004). Demographic Variables Because the number of underrepresented minority students in the study was too low to analyze statistically, the only demographic variable used was self-reported gender. The survey item was stated simply as “Gender,” with “Male” and “Female” as the only choices. Engineering Identification We assessed engineering identification with the four items that Jones et al. (2010) adapted from Schmader, Major, and Gramzow (2001). The scale had a Cronbach’s alpha of .84 (Jones et al., 2010) and .93 (Jones et al. 2016). One of the sample items was, “Doing well on engineering tasks is very important to me.” The seven response options for the scale items ranged from 1 (strongly disagree) to 7 (strongly agree). Engineering Program Expectancy We assessed engineering program expectancy with the five-item scale that Jones et al. (2010) adapted from Eccles and Wigfield (1995). The scale had a Cronbach’s alpha of 0.93 (Jones et al., 2014) and 0.93. One of the sample items was, “How have you been doing in your engineering-related courses this year?” The seven response options ranged from 1 (much worse than average) to 7 (much better than average.)
DATA ANALYSIS We used the Statistical Package for the Social Science (SPSS) 22.0 to conduct exploratory analyses, including both descriptive statistics and reliability analyses. We used Hierarchical Linear Modeling (HLM) version 7.0 to analyze the longitudinal data and followed the model-building steps outlined by Singer and Willet (2003). HLM is also called multilevel modeling, random coefficient modeling, and linear mixed modeling, and it is used when factors are nested within one another, creating levels, rather than existing independently. Growth modeling is a specific type of HLM used to study individual change over time. A growth model allows researchers to explore both intraindividual (within-person) and interindividual (between-person) change over time, and simultaneously consider additional factors that may affect change. HLM thus overcomes key limitations of techniques like regression with respect to longitudinal data. Regression assumes that all individuals have the same initial scores and that all grow or decline at the same rate. HLM, in contrast, captures both the intra- and inter-individual aspects, making it a more accurate and powerful tool for fully understanding change over time. At the same time, HLM is robust enough to accommodate missing data, especially when the gaps occur randomly; growth modeling does not require complete information from all respondents (Bliese & Ployhart, 2002; Raudenbush & Bryk, 2002; Singer & Willett, 2003). Such robustness is particularly useful in longitudinal studies where participants drop out at various time points for a variety of reasons. In this study, for example, the sample size decreased from 470 for the initial survey to 115 for the final survey. In modeling change over time, it is possible that a conceptually and

American Journal of Engineering Education – December 2017 Volume 8, Number 2
Copyright by author(s); CC-BY 162 The Clute Institute
theoretically plausible independent variable (e.g., expectancy, domain identification, gender) may predict significant variability in the initial status of the dependent variable (career intention, in this case), but not its rate of change, and vice versa. We thus used a two-level HLM to investigate the effect of gender, engineering identification, and engineering program expectancy on the growth trajectory of students’ engineering career intentions during their first three years in college. In this study, the measurement occasions (time points 1, 2, 3, and 4) were nested within students. Therefore, the four time points are Level 1, as is typical in growth modeling, and the students are Level 2. The Level 1 analysis focused on the growth trajectory of engineering students’ career intentions (intraindividual change). That is, whether there was a significant variation in within-person engineering career intentions over time. The Level 2 analysis focused on interindividual change and explores first whether there was significant variability in students’ initial status (intercept) and rate of change (slope) with respect to engineering career intentions, and second, what factors predicted that variability.
RESULTS Descriptive Statistics and Correlations Table 1 presents the mean, standard deviation, and where applicable the reliability (α) of each study variable, along with the correlations among variables. The reliabilities of the engineering identification scale ranged from .85 to .96 over the four surveys and the reliabilities for engineering program expectancy ranged from .82 to .96, indicating that the reliabilities of these scales were acceptable. Mean values for career intentions, measured on a 5-point scale, were 4.19, 4.34, 4.26, and 4.15 across the four surveys. Mean engineering identification scores, measured on a 7-point scale, initially rose slightly from 6.17 to 6.2, and then decreased to 6.11 and 6.00 in the last two surveys. Mean engineering expectancy scores, also on a 7-point scale, dropped across the first three surveys (5.42, 5.3, and 4.96) and then rose slightly (5.17) on the last one. Across all measures, the standard deviation generally increased over time as seen in Table 1.
Table 1. Descriptive Statistics, Reliabilities, and Correlations Among the Study Variables M SD α 1 2 3 4 5 6 7 8 9 10 11 12
Car1 4.19 .87 - - Car2 4.34 .87 - .73 - Car3 4.26 .95 - .40 .41 - Car4 4.15 1.16 - .29 .24 .68 - EI1 6.17 .86 .85 .29 .30 .26 .35 - EI2 6.20 .78 .92 .19 .30 .33 .31 .61 - EI3 6.11 1.04 .93 .26 .21 .73 .51 .42 .49 - EI4 6.00 1.14 .96 .20 .20 .61 .72 .54 .42 .67 - EE1 5.42 .84 .91 .22 .21 .21 .16 .38 .29 .25 .38 - EE2 5.30 .82 .92 .13 .22 .17 .15 .33 .36 .24 .37 .80 - EE3 4.96 .96 .92 .12 .12 .29 .20 .23 .15 .32 .47 .66 .66 - EE4 5.17 .90 .90 .10 .20 .35 .23 .25 .20 .37 .51 .58 .56 .75 -
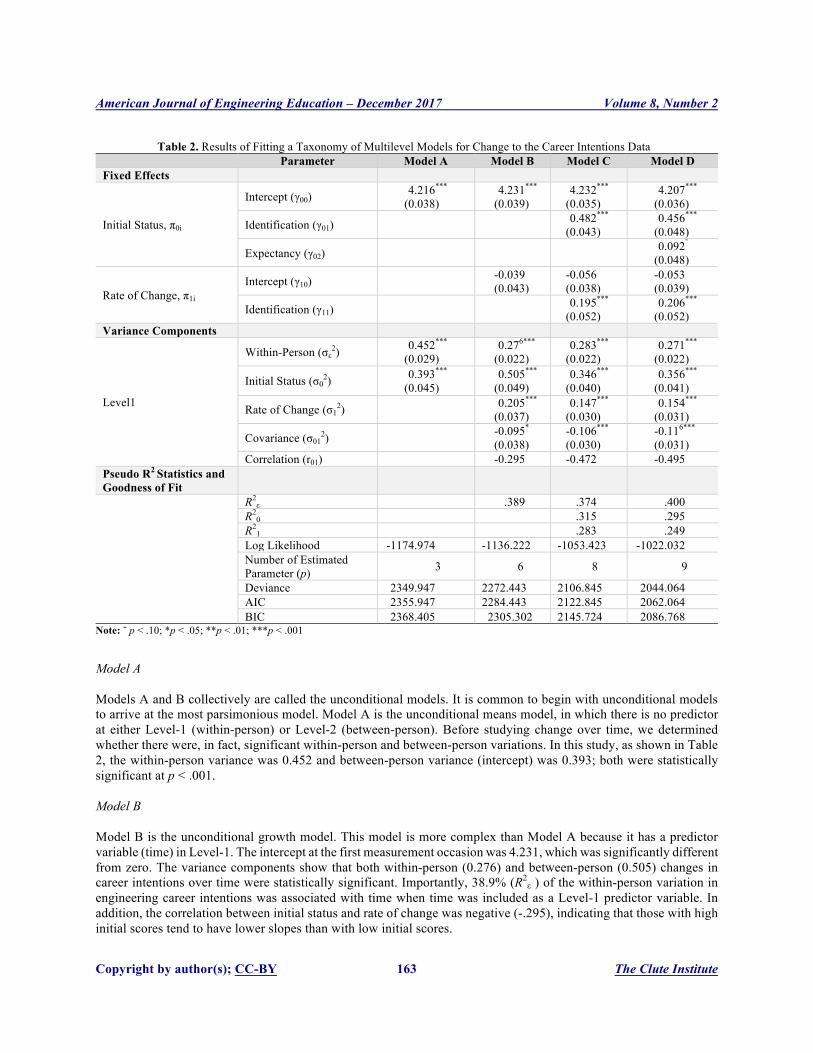
Note: Car#=Engineering Career Intentions at each time point (5 point scale with 5 as strongest intention); EI#=Engineering Identification at each time point; EE#=Engineering Program Expectancy at each time point (7 point scale for EI and EE with 7 as maximum). Model Fit Table 2 presents a taxonomy of the four statistical models tested. The taxonomy begins with the unconditional means model (Model A, described below), and each successive models is an extension of the prior model (Singer & Willett, 2003). The complexity of the models increases from left to right as each new model includes additional predictor variables. In this way, the previous models are nested within each new model, which allows us to use goodness of fit statistics such as Akaike Information Criterion (AIC) and Bayesian Information Criterion (BIC) to compare models and determine the best-fitting model. These statistics are also included in Table 2.
American Journal of Engineering Education – December 2017 Volume 8, Number 2
Copyright by author(s); CC-BY 163 The Clute Institute
Table 2. Results of Fitting a Taxonomy of Multilevel Models for Change to the Career Intentions Data
Parameter Model A Model B Model C Model D Fixed Effects
Initial Status, π0i
Intercept (γ00) 4.216***
(0.038) 4.231***
(0.039) 4.232***
(0.035) 4.207***
(0.036)
Identification (γ01) 0.482***
(0.043) 0.456***
(0.048)
Expectancy (γ02) 0.092῀ (0.048)
Rate of Change, π1i Intercept (γ10) -0.039
(0.043) -0.056 (0.038)
-0.053 (0.039)
Identification (γ11) 0.195*** (0.052)
0.206*** (0.052)
Variance Components
Level1
Within-Person (σε2) 0.452***
(0.029) 0.276***
(0.022) 0.283***
(0.022) 0.271***
(0.022)
Initial Status (σ02) 0.393***
(0.045) 0.505***
(0.049) 0.346***
(0.040) 0.356***
(0.041)
Rate of Change (σ12) 0.205***
(0.037) 0.147***
(0.030) 0.154***
(0.031)
Covariance (σ012) -0.095*
(0.038) -0.106*** (0.030)
-0.116*** (0.031)
Correlation (r01) -0.295 -0.472 -0.495 Pseudo R2 Statistics and Goodness of Fit
R2ε .389 .374 .400
R20 .315 .295
R21 .283 .249
Log Likelihood -1174.974 -1136.222 -1053.423 -1022.032 Number of Estimated Parameter (p) 3 6 8 9
Deviance 2349.947 2272.443 2106.845 2044.064 AIC 2355.947 2284.443 2122.845 2062.064 BIC 2368.405 2305.302 2145.724 2086.768
Note: ῀ p < .10; *p < .05; **p < .01; ***p < .001 Model A Models A and B collectively are called the unconditional models. It is common to begin with unconditional models to arrive at the most parsimonious model. Model A is the unconditional means model, in which there is no predictor at either Level-1 (within-person) or Level-2 (between-person). Before studying change over time, we determined whether there were, in fact, significant within-person and between-person variations. In this study, as shown in Table 2, the within-person variance was 0.452 and between-person variance (intercept) was 0.393; both were statistically significant at p < .001. Model B Model B is the unconditional growth model. This model is more complex than Model A because it has a predictor variable (time) in Level-1. The intercept at the first measurement occasion was 4.231, which was significantly different from zero. The variance components show that both within-person (0.276) and between-person (0.505) changes in career intentions over time were statistically significant. Importantly, 38.9% (R2
ε ) of the within-person variation in engineering career intentions was associated with time when time was included as a Level-1 predictor variable. In addition, the correlation between initial status and rate of change was negative (-.295), indicating that those with high initial scores tend to have lower slopes than with low initial scores.

American Journal of Engineering Education – December 2017 Volume 8, Number 2
Copyright by author(s); CC-BY 164 The Clute Institute
When we considered the overall trend in engineering career intentions, however, the rate of change was negative (-0.039), but statistically not significantly different from zero. The overall growth trajectory, therefore, was flat during the study period. However, there was a significant variability in the rate of change (.205) for the study participants. This variability points to the need to add Level-2 predictor variables in the next model to determine what predicts this variability. As noted above, the model building process requires adding theoretically supported independent variables one at a time, given that an independent variable might predict variability in initial status but not in rate of change or vice versa. The process also requires retaining only those variables that significantly predict initial status and/or rate of change to arrive at a parsimonious model that provide a best fit to the data. In this case, as noted earlier, the three independent variables were gender, engineering identification, and engineering program expectancy. We tested the effects of those variables on engineering career intentions in that order. Gender Gender did not predict variations in either initial status or rate of change. In other words, there was no statistically significant difference between the mean scores of male and female students on their perceptions of engineering career intentions in the initial survey and no significant variation by gender in the rate of change. Therefore, gender was not included in subsequent models. Model C Model C tested the effects of engineering identification. As Table 2 shows, engineering identification significantly predicted variations in the initial status (0.482, significant at p < .001) and the rate of change (0.195). As in Model B, the overall growth trajectory showed a declining trend (negative slope), but the rate of deceleration was not significantly different from zero, again indicating a flat trajectory overall. With respect to the pseudo R2 statistics, the results show that time explained 37.4% of the Level-1 within-individual variance, while engineering identification explained 31.5% of the variance in initial status and 28.3% of the variance in the rate of change. Model D Finally, Model D includes engineering program expectancy. As Table 2 shows, engineering program expectancy was marginally significant (0.092, significant at p < .10) in predicting the individual differences in the initial status, controlling for engineering identification. However, it did not significantly predict variance in the rate of change, and therefore, was not included as a predictor of slope in the final model. Engineering identification, on the other hand, continued to predict variances in both the initial status (0.456) and the rate of change (0.206) (both significant at p < .001), controlling for engineering program expectancy. With respect to the pseudo R2 statistics, the results show that time explained 40% of the total Level-1 within-individual variance, while engineering identification and engineering program expectancy explained 29.5% of the total variance in initial status and engineering identification explained 24.9% of the variance in the rate of change. Selection of the Most Parsimonious and the Best Fitting Model As described above, the complexity of the model increased at each level as we added predictor variables in Level-1 in Model B and predictor variables in Level-2 in Models C and D. Thus, Model A is nested within Model B, which added time as a Level-1 predictor, and Model B is nested within Model C, which added engineering identification as a Level-2 predictor. Model D matches Model C but adds a second Level-2 predictor, engineering program expectancy. The fact that each new model subsumes the previous model allows us to compare fit of any two sequential models using goodness of fit statistics, including log likelihood, deviance, AIC, and BIC. The model with smaller values for each statistic is considered the better fit. As Table 2 shows, each new model provides a better fit than the previous model, with Model D providing the best fit. Notably, when we compare Models C and D, the difference in deviance between the two is 62.781, but Model D includes an additional parameter. To determine whether this additional parameter in fact provides a better fit, we also needed to consider chi-square. The critical value for chi-square with df = 1 is 3.841 at α = .05. Given that the difference in deviance is above 3.841, we concluded that Model D, with both

American Journal of Engineering Education – December 2017 Volume 8, Number 2
Copyright by author(s); CC-BY 165 The Clute Institute
engineering identification and engineering program expectancy, was a better fit. The final model uses engineering identification and engineering program expectancy to predict between-person differences at the beginning of the study, but only engineering identification to predict the rate of the change. The equations for Model D were as follows: Level-1: 𝐸𝑛𝑔𝑖𝑛𝑒𝑒𝑟𝑖𝑛𝑔𝐶𝑎𝑟𝑒𝑒𝑟𝐼𝑛𝑡𝑒𝑛𝑡𝑖𝑜𝑛𝑠-. = 𝜋1- + 𝜋3- ∗ (𝑇𝑖𝑚𝑒-.) + 𝜀-.,
𝑖. 𝑖. 𝑑.~ 𝑁(𝑜, 𝜎@A)
where i.i.d. indicates that level-1 random errors (εti) are independent and identically distributed. Level-2: 𝜋1- = 𝛾CC + 𝛾C3𝐸𝑛𝑔𝑖𝑛𝑑𝑒𝑒𝑟𝑖𝑛𝑔𝐼𝑑𝑒𝑛𝑡𝑖𝑓𝑖𝑐𝑎𝑡𝑖𝑜𝑛- + 𝛾CA𝐸𝑛𝑔𝑖𝑛𝑒𝑒𝑟𝑖𝑛𝑔𝐸𝑥𝑝𝑒𝑐𝑡𝑎𝑛𝑐𝑦- + 𝜇C- 𝜋1- = 𝛾CC + 𝛾C3𝐸𝑛𝑔𝑖𝑛𝑒𝑒𝑟𝑖𝑛𝑔𝐼𝑑𝑒𝑛𝑡𝑖𝑓𝑖𝑐𝑎𝑡𝑖𝑜𝑛- + 𝛾CA𝐸𝑛𝑔𝑖𝑛𝑒𝑒𝑟𝑖𝑛𝑔𝐸𝑥𝑝𝑒𝑐𝑡𝑎𝑛𝑐𝑦- + 𝜇1- 𝑢1-𝑢3-
𝑖. 𝑖. 𝑑~ 𝑁 0
0 ,𝜏CC 𝜏C3𝜏3C 𝜏33
DISCUSSION
With the growth model in place, we were able to evaluate the four study hypotheses and contextualize our findings within the landscape of prior research on career persistence in engineering. The data did not support our hypotheses one and two. However, hypothesis three was fully supported while hypothesis four was partially supported. Most importantly, we hope that this study makes the hierarchical linear modeling technique more accessible to engineering education researchers. Examining mean scores of career intentions and its increasing standard deviation over time suggest that missing data occurred randomly. Higher standard deviation is an indication of higher variations in students’ perceptions of career intentions. Therefore, it is safe to infer that not all those students who completed the surveys during time points three and four necessarily had strong inclinations for engineering careers. Engineering Career Intentions Hypothesis 1 suggested that students’ perceptions of engineering career intentions would significantly decline over the course of the study. The coefficient of the instantaneous growth rate in the final model (-0.053) indicates that engineering career intentions had a declining growth trajectory, but the rate of deceleration was not statistically significant. In other words, the overall growth trajectory was flat indicating that there was no declining trend in students’ perceptions of engineering career intentions and so the data did not support Hypothesis 1. This finding is encouraging because the declining trends in engineering career intentions appears to have stabilized. More work remains, however, in this area in terms of further strengthening students’ career intentions. The plausible factors that predicted career intentions and tested in this longitudinal model are presented below. Gender Hypothesis 2 suggested that male students would have stronger initial career intentions and stronger growth rates in career intentions than female students, but the results did not support that hypothesis. Given the variations across prior studies with respect to sex and/or gender noted earlier, these results point toward progress within at least one undergraduate engineering program in supporting women’s persistence in engineering careers. Importantly, the study university included a number of strong support programs for women and underrepresented minorities such as, living-learning communities, intentional cohorting in first-year courses, and an active student chapter of the Society of

American Journal of Engineering Education – December 2017 Volume 8, Number 2
Copyright by author(s); CC-BY 166 The Clute Institute
Women Engineers. However, the impact of these programs on engineering career intentions was not evaluated in this longitudinal study. Engineering Identification Hypothesis 3 posited that engineering identification (the extent to which students value engineering as an important part of themselves) would significantly predict engineering career intentions. Of the four hypotheses, this was the only one strongly supported by the data. As Model D demonstrates, when controlling for expectancy beliefs, engineering identification significantly predicted individual differences in both the initial status and the rate of change at p < .001. In many cross-sectional studies (e.g., Jones et al., 2014; 2016), statistically significant relationships between engineering identification and engineering career intentions were found. The findings of this longitudinal study, therefore, brought further empirical evidence to the effects of engineering identification on engineering career intentions. Furthermore, consistent with the findings of cross-sectional studies (e.g., Jones et al., 2014; 2016), engineering identification, compared to engineering program expectancy, had a greater impact on engineering career intentions. Engineering Program Expectancy Finally, Hypothesis 4 posited that engineering program expectancy would predict engineering career intentions when controlling for engineering identification. The final model shows that engineering program expectancy marginally predicted variance in the initial status at p < 0.10, but it did not predict variance in the rate of change. Therefore, Hypothesis 4 was not supported. Such findings conflict with cross-sectional studies of Nauta et al. (1998) showing self-efficacy as a strong predictor of women’s career intentions and that of Jones et al. (2016) where engineering program expectancy significantly predicted engineering career intentions. Contributions of this Study Our study made four unique contributions to the field of engineering education concerning student retention for the engineering workforce. First, this was a first longitudinal study of engineering career intentions with four data points. The fact that this study had more than three waves of data made it a good study to model change. Longitudinal studies overcome many weaknesses of cross-sectional studies. For example, we can be more confident about the associations, or lack thereof, between dependent and independent variables. Any inferences drawn from the findings of longitudinal studies can be more valid. Second, the finding that gender was not a statistically significant predictor might be a sign of reversal of trend of women not opting for careers in engineering fields in large numbers. In other words, women appear to have an equally strong perceptions of engineering career intentions, as strong as their male counterpart. Third, this study used an advanced statistical technique, specifically Hierarchical Linear Modeling, to test the plausibility of the longitudinal model under investigation recognizing the nested data structure. Therefore, this study expands the range of available methods within engineering education and demonstrates the power of growth modeling to explore and identify factors that affect students’ career intentions. Fourth, this study found that expectancy belief is a necessary condition, but not a sufficient condition to influence students’ decisions to pursue engineering careers. However, students who identify highly with engineering (strong perceptions of engineering identification) have a higher probability of committing to engineering careers. Limitation and Future Research This study offers important contributions to research on career intentions in engineering, but it also has several limitations that point to the need for future work. First, the high mean scores for initial engineering career intentions may have left too little room for growth. Using a more fine-grained scale to measure career intentions (e.g., seven response options rather than five) may help address this limitation. Second, since participants self-selected to respond to the survey, respondents may be those more likely to pursue engineering careers. In light of the attrition rate observed in this study, which is not all that unique in most longitudinal studies, finding ways to gather data from non-respondents would enhance the confidence in the findings of the study. Third, the final measurement occasion did not occur during students’ senior year. Adding a senior year data point, therefore, would be a key component in future work given the “quixotic” (Lichtenstein et al., 2009, p. 232) nature of students’ career decisions and the uncertainty

American Journal of Engineering Education – December 2017 Volume 8, Number 2
Copyright by author(s); CC-BY 167 The Clute Institute
that persists into the senior year. Fourth, as noted above, the research was conducted at a single, predominantly white institution. Given the importance of institutional factors in shaping students’ experiences and trajectories, this growth model should be cross-validated using a diverse respondent pool from multiple institutions, particularly minority-serving institutions. Finally, the importance of domain identification in the final model points to the need for future work, specifically to investigate plausible predictors of engineering identification.
ACKNOWLEDGEMENTS
This material is based upon work supported by the National Science Foundation under Grant No. HRD #0936704. Any opinions, findings, and conclusions or recommendations expressed in this material are those of the author(s) and do not necessarily reflect the views of the National Science Foundation. The authors would like to thank Virginia Tech's Open Access Subvention Fund for paying the publication fees for this article.
AUTHOR BIOGRAPHIES Chosang Tendhar:Dr. Tendhar is an Assistant Director of Assessment in the Office of Assessment at Arnold and Marie Schwartz College of Pharmacy and Health Sciences with Long Island University, Brooklyn. He works with students and faculty to provide the services of a psychometrician and statistician in designing surveys, tests, and conducting scholarly research. He has a Bachelor in Commerce from Mahajanas College, Mysore-India; an MBA from the University of Wyoming; an MS Finance from the University of Memphis; and a Ph.D. in Educational Research and Evaluation from Virginia Tech. His research interests include Science, Technology, Engineering, and Mathematics (STEM) education, particularly students’ decision making process in committing to engineering majors and careers using the domain identification model, the effect of active learning techniques on students’ motivation, and competency based education in health professions education. He often uses motivational theories, such as the MUSIC Model of Motivation and advanced quantitative techniques, such as structural equation modeling (SEM) and hierarchical linear modeling (HLM) in his research. Marie C. Paretti: Dr. Paretti is a Professor of Engineering Education at Virginia Tech and director of the Virginia Tech Engineering Communication Center (VTECC). She holds a B.S. in chemical engineering and an M.A. in English from Virginia Tech and Ph.D. in English from the University of Wisconsin-Madison. Drawing on theories of situated learning and social construction, her work includes multiple NSF-funded studies on the teaching and learning of communication, effective teaching practices in design education, the effects of differing pedagogies on personal and professional identities, the dynamics of cross-disciplinary collaboration in academia and industry, and gender and race in engineering. Brett D. Jones: Dr. Jones is a full Professor of Educational Psychology in the School of Education at Virginia Tech. He has held faculty positions as an educational psychologist at Duke University, the University of South Florida St. Petersburg, and Virginia Tech. He received his B.A.E. in Architectural Engineering from The Pennsylvania State University and his M.A. and Ph.D. in Educational Psychology from the University of North Carolina at Chapel Hill. His research, which includes examining instructional methods that support students’ motivation and learning, has led to more than 80 articles, several book chapters, and three books (www.theMUSICmodel.com).
REFERENCES Amelink, C. T., & Creamer, E. G. (2010). Gender differences in elements of the undergraduate experience that influence
satisfaction with the engineering major and the intent to pursue engineering as a career. Journal of Engineering Education, 99(1), 81-92. doi:10.1002/j.2168-9830.2010.tb01044.x
Bandura, A. (1977). Self-efficacy: Toward a unifying theory of behavior change. Psychological Review, 84, 191-215. Bandura, A. (1986). Social foundations of thought and action: A social cognitive theory. Englewood Cliffs, NJ: Prentice-Hall. Bandura, A. (1997). Self-efficacy: The exercise of control. New York: Freeman. Bliese, P. D., & Ployhart, R. E. (2002). Growth modeling using random coefficient models: Model building, testing, and
illustrations. Organizational Research Methods, 5(4), 362-387. doi:10.1177/109442802237116 Brainard, S. G., & Carlin, L. (1998). A six-year longitudinal study of undergraduate women in engineering and science. Journal
of Engineering Education, 87(4), 369-375.

American Journal of Engineering Education – December 2017 Volume 8, Number 2
Copyright by author(s); CC-BY 168 The Clute Institute
Burtner, J. (2005). The use of discriminant analysis to investigate the influence of non-cognitive factors on engineering school persistence. Journal of Engineering Education, 94(3), 335-338.
Chen, X. (2013). STEM attrition: College students’ paths into and out of STEM fields. National Center for Educational Statistics, Institute of Education Sciences (NCES 2014-001). Washington, DC: US Department of Education.
Cross, S. E., & Vick, N. V. (2001). The interdependent self-construal and social support: The case of persistence in engineering. Personality and Social Psychology Bulletin, 27(7), 820-832.
Daempfle, P. A. (2003). An analysis of the high attrition rates among first year college science, math and engineering majors. Journal of College Student Retention, 5(1), 37-52. doi: 10.2190/DWQT-TYA4-T20W-RCWH
Danielak, B. A., Gupta, A., & Elby, A. (2014). Marginalized identities of sense-makers: reframing engineering student retention. Journal of Engineering Education, 103(1), 8-44. doi:10.1002/jee.20035
Eccles, J. S., Adler, T. F., Futterman, R., Goff, S. B., Kaczala, C. M., Meece, J. L., & Midgley, C. (1983). Expectancies, values, and academic behaviors. In J. T. Spence (Ed.), Achievement and Achievement Motivation (pp. 75-146). San Francisco, CA: Freeman.
Eccles, J. S., Adler, T. F., & Meece, J. L. (1984). Sex differences in achievement: A test of alternate theories. Journal of Personality and Social Psychology, 46, 26-43.
Eccles, J. S., & Wigfield, A. (1995). In the mind of the actor: The structure of adolescents’ achievement task values and expectancy-related beliefs. Personality and Social Psychology Bulletin, 21(3), 215-225.
Eris, O., Chachra, D., Chen, H., Rosca, C., Ludlow, L., Sheppard, S., & Donaldson, K. (2007, June). A preliminary analysis of correlates of engineering persistence: Results from a longitudinal study. Paper presented at the American Society for Engineering Education Annual Conference and Exposition, Honolulu.
Eris, O., Chachra, D., Chen, H. L., Sheppard, S., Ludlow, L., Rosca, C., . . . Toye, G. (2010). Outcomes of a longitudinal administration of the persistence in engineering survey. Journal of Engineering Education, 99(4), 371-395. doi:10.1002/j.2168-830.2010.tb01069.x
Foor, C. E., Walden, S. E., & Trytten, D. A. (2007). “I wish that i belonged more in this whole engineering group:” Achieving individual diversity. Journal of Engineering Education, 96(2), 103-115.
French, B. F., Immekus, J. C., & Oakes, W. (2003). A structural model of engineering students success and persistence. Proceedings - Frontiers in Education Conference, 1, T2A-19-T12A-24.
French, B. F., Immekus, J. C., & Oakes, W. C. (2005). An examination of indicators of engineering students' success and persistence. Journal of Engineering Education, 94(4), 419-425.
George, J. M., & Jones, G. R. (2000). The role of time in theory and theory building. Journal of Management, 26(4), 657-684. Hall, C., Dickerson, J., Batts, D., Kauffmann, P., & Bosse, M. (2011). Are we missing opportunities to encourage interest in
STEM fields? Journal of Technology Education, 23(1), 32-46. Hofmann, D. A., Jacobs, R., & Baratta, J. E. (1993). Dynamic criteria and the measurement of change. Journal of Applied
Psychology, 78(2), 194. doi: http://dx.doi.org/10.1037/0021-9010.78.2.194 Hutchison, M. A., Follman, D. K., Sumpter, M., & Bodner, G. M. (2006). Factors influencing the self-efficacy beliefs of first-
year engineering students. Journal of Engineering Education, 95(1), 39-47. Ingersoll, R., & May, H. (2012). The magnitude, destinations and determinants of mathematics and science teacher turnover.
Educational Evaluation and Policy Analysis, 34(4), 435-464. doi:10.3102/0162373712454326 Jones, B. D., Osborne, J. W., Paretti, M. C., & Matusovich, H. M. (2014). Relationships among students’ perceptions of a first-
year engineering design course and their engineering identification, motivational beliefs, course effort, and academic outcomes. International Journal of Engineering Education, 30(6A), 1340-1356.
Jones, B. D., Paretti, M. C., Hein, S. F., & Knott, T. W. (2010). An analysis of motivation constructs with first-year engineering students: Relationships among expectancies, values, achievement, and career plans. Journal of Engineering Education, 99(4), 319-336.
Jones, B. D., Ruff, C., & Osborne, J. W. (2015). Fostering students’ identification with mathematics and science. In K. A. Renninger, M. Nieswandt, & S. Hidi (Eds.), Interest in Mathematics and Science Learning (pp. 331-352). Washington, DC: American Educational Research Association.
Jones, B. D., Tendhar, C., & Paretti, M. C. (2016). The effects of students’ course perceptions on their domain identification, motivational beliefs, and goals. Journal of Career Development, 43(5), 383-397. doi:10.1177/0894845315603821
Larose, S., Ratelle, C. F., Guay. F., Senecal, C., & Harvey, M. (2006). Trajectories of science self-efficacy beliefs during the college transition and academic and vocational adjustment in science and technology programs. Educational Research and Evaluation, 12(4), 373-393. doi:10.1080/13803610600765836
Lichtenstein, G., Loshbaugh, H., Claar, B., Bailey, T., & Sheppard, S. D. (2007, June). Should I stay or should I go? Engineering students' persistence is based on little experience or data. Paper presented at the American Society for Engineering Education Annual Conference and Exposition, Honolulu.
Lichtenstein, G., Loshbaugh, H., Claar, B., Chen, B., Sheppard, S., & Jackson, K. (2009). An engineering major does not (necessarily) an engineer make: Career decision-making among undergraduate engineers. Journal of Engineering Education, 98(3), 227-234. doi:10.1002/j.2168-9830.2009.tb01021.x

American Journal of Engineering Education – December 2017 Volume 8, Number 2
Copyright by author(s); CC-BY 169 The Clute Institute
Lichtenstein, G., McCormick, A. C., Sheppard, S. D., & Puma, J. (2010). Comparing the undergraduate experience of engineers to all other majors: Significant differences are programmatic. Journal of Engineering Education, 99(4), 305-317. doi:10.1002/j.2168-9830.2010.tb01065.x
Lucena, J. C. (2005). Defending the nation: U.S. policymaking in science and engineering education from Sputnik to the war against terrorism. Lanham, MD: University Press of America.
Marra, R., & Bogue, B. (2007). Self efficacy in women engineering students: Three years of data at U.S. institutions. Paper presented at the American Society for Engineering Education, Honolulu, HI.
Marra, R. M., Rodgers, K. A., Shen, D., & Bogue, B. (2009). Women engineering students and self-efficacy: A multi-year, multi-institution study of women engineering student self-efficacy. Journal of Engineering Education, 98(1), 27-38.
Marra, R. M., Rodgers, K. A., Shen, D., & Bogue, B. (2012). Leaving engineering: A multi-year single institution study. Journal of Engineering Education, 101(1), 6-27. doi:10.1002/j.2168-9830.2012.tb00039.x
Matusovich, H. M., Streveler, R. A., & Miller, R. L. (2010). Why do students choose engineering? A qualitative, longitudinal investigation of students' motivational values. Journal of Engineering Education, 99(4), 289-303. doi:10.1002/j.2168-9830.2010.tb01064.x
Mau, W. C. (2003). Factors that influence persistence in science and engineering career aspirations. The Career Development Quarterly, 51(3), 234-243. doi: 10.1002/j.2161-0045.2003.tb00604.x
Meyers, K., Pieronek, C. F., & Mcwilliams, L. H. (2012). Engineering student involvement. Paper presented at the American Society for Engineering Education.
Mitchell, T. R., & James, L. R. (2001). Building better theory: Time and the specification of when things happen. Academy of Management Review, 26(4), 530-547. doi:10.5465/AMR.2001.5393889
National Science Board, (2007). A national action plan for addressing the critical needs of the U.S. science, technology, engineering, and mathematics education system. Arlington, VA: National Science Foundation.
National Science Foundation (2010). Higher education in science and engineering, chapter 2. Retrieved from http://www.nsf.gov/statistics/seind10/pdf/c02.pdf
Nauta, M. M., Epperson, D. L., & Kahn, J. H. (1998). A multiple-groups analysis of predictors of higher level career aspirations among women in mathematics, science, and engineering majors. Journal of Counseling Psychology, 45(4), 483-496.
Ohland, M. W., Sheppard, S. D., Lichtenstein, G., Eris, O., Chachra, D., & Layton, R. A. (2008). Persistence, engagement, and migration in engineering program. Journal of Engineering Education, 97(3), 259-278.
Osborne, J. W. (1997). Identification with academics and academic success among community college students. Community College Review, 25(1), 59-67.
Osborne, J. W., & Jones, B. D. (2011). Identification with academics and motivation to achieve in school: How the structure of the self influences academic outcomes. Educational Psychology Review, 23(1), 131-158. doi:10.1007/s10648-011-9151-1
Osborne, J. W., & Rausch, J. L. (2001). Identification with Academics and Academic Outcomes in Secondary Students. Paper presented at the American Education Research Association, Seattle, WA.
Raudenbush, S. W., & Bryk, A. S. (2002). Hierarchical linear models: Applications and data analysis methods. Thousand Oaks, CA: Sage.
Rogosa, D. (1995). Myths and methods:“Myths about longitudinal research” plus supplemental questions. In J. M. Gottman (Ed.), The Analysis of Change (pp. 3-66). Mahwah, NJ: Lawrence Erlbaum Associates.
Schmader, T., Major, B., & Gramzow, R. H. (2001). Coping with ethnic stereotypes in the academic domain: Perceived injustice and psychological disengagement. Journal of Social Issues, 57(1), 93-111.
Schmader, T., Johns, M., & Barquissau, M. (2004). The costs of accepting gender differences: The role of stereotype endorsement in women's experience in the math domain. Sex Roles, 50(11-12), 835-850.
Seymour, E., & Hewitt, N. M. (1997). Talking about leaving: Why undergraduates leave the sciences. Boulder, CO: Westview Press.
Sheppard, S., Gilmartin, S., Chen, H. L., Donaldson, K., Lichtenstein, G., Eriş, Ö., Lande, M., & Toye, G. (2010). Exploring the engineering student experience: Findings from the Academic Pathways of People Learning Engineering Survey (APPLES) (CAEE-TR-10-01). Seattle, WA: Center for the Advancement for Engineering Education. Retrieved from http://www.engr.washington.edu/caee/APPLES_report.html
Shull, P. J., & Weiner, M. (2002). Thinking inside the box: Self-efficacy of women in engineering. International Journal of Engineering Education, 18(4), 438-446.
Singer, J. D., & Willett, J. B. (2003). Applied longitudinal data analysis: Modeling change and event occurrence. New York: Oxford University Press.
Singh, R., Fouad, N. A., Fitzpatrick, M. E., Liu, J. P., Cappaert, K. J., & Figuereido, C. (2013). Stemming the tide: Predicting women engineers' intentions to leave. Journal of Vocational Behavior, 83(3), 281-294.
Steinberg, S. S. (1949). The relations of secondary mathematics to engineering education. Mathematics Teacher, 42(8), 386-388. Vasko, T. J., & Baumann, P. F. (2012). Comparison of a first-year-experience course with and without a living-learning-
community arrangement. Paper presented at the American Society for Engineering Education. Voelkl, K. E. (1997). Identification with school. American Journal of Education, 105, 294-318.

American Journal of Engineering Education – December 2017 Volume 8, Number 2
Copyright by author(s); CC-BY 170 The Clute Institute
Walker, C. O., Greene, B. A., & Mansell, R. A. (2006). Identification with academics, intrinsic/extrinsic motivation, and self-efficacy as predictors of cognitive engagement. Learning and Individual Differences, 16(1), 1-12. doi:10.1016/j.lindif.2005.06.004
Weiss, T. (2009, June 3). The 10 hardest jobs to fill in America. Forbes.com. Retrieved from http://www.forbes.com. Wigfield, A., & Eccles, J. S. (2000). Expectancy-value theory of achievement motivation. Contemporary Educational
Psychology, 25, 68-81.