engineering feasibility and costs of conversion of indian point
TRANSCRIPT
ENGINEERING FEASIBILITY AND COSTS OF CONVERSION
OF INDIAN POINT UNITS 2 AND 3 TO A CLOSED-LOOP CONDENSER COOLING WATER CONFIGURATION
Prepared for Entergy Nuclear Indian Point 2, LLC, and Entergy Nuclear Indian Point 3, LLC
Prepared by:
Enercon Services, Inc.
500 TownPark Lane, Suite 275 Kennesaw, GA 30144
February 12, 2010
CONVERSION OF INDIAN POINT UNITS 2 & 3 TO A CLOSED-LOOP COOLING WATER CONFIGURATION
i
TABLE OF CONTENTS
Attachments ............................................................................................................................... iii Executive Summary ................................................................................................................... iv
1 Background and Introductions ................................................................................................ 1 1.1 History .............................................................................................................................. 1 1.2 Purpose and Scope of this Report .................................................................................... 6
2 Conceptual Design .................................................................................................................. 7 2.1 Conversion of Unit 2 and Unit 3 ...................................................................................... 7 2.2 Conversion of Only Unit 2 ............................................................................................. 14 2.3 Conversion of Only Unit 3 ............................................................................................. 14
3 Station Operational Parameters ............................................................................................. 15 3.1 Administrative/Operating Limits ................................................................................... 15 3.2 Closed-Loop Operational Efficiency (PEPSE Analysis) ............................................... 16
4 Algonquin Pipeline Relocation ............................................................................................. 21 4.1 Pipeline Configuration ................................................................................................... 21 4.2 Feasibility of Relocation ................................................................................................ 22 4.3 Spectra Schedule and Cost Impacts ............................................................................... 23
5 Blasting ................................................................................................................................. 25 5.1 Restrictions to Blasting at IPEC ..................................................................................... 25 5.2 Cost and Schedule Impacts ............................................................................................ 27 5.3 Blasting Outage Timing ................................................................................................. 28
6 Spoils Removal ..................................................................................................................... 29 6.1 Blasting Spoils................................................................................................................ 29 6.2 Contamination of Spoils ................................................................................................. 30 6.3 On-Site Relocation of Spoils .......................................................................................... 30 6.4 Off-Site Relocation of Spoils ......................................................................................... 30 6.5 Cost and Schedule Impacts ............................................................................................ 32
7 Cooling Tower Operation / Plume Emissions ...................................................................... 33 7.1 Water Consumption........................................................................................................ 33 7.2 Cooling Tower Plume Emissions ................................................................................... 38 7.3 Plume Abatement ........................................................................................................... 38
8 General Site Considerations .................................................................................................. 40 8.1 Aesthetic Impacts ........................................................................................................... 40 8.2 Archaeological Considerations ...................................................................................... 40 8.3 Local Zoning Restrictions .............................................................................................. 41 8.4 Sound Restrictions .......................................................................................................... 43
9 Construction and Outage Duration ....................................................................................... 45 9.1 Conversion of Unit 2 and Unit 3 .................................................................................... 46 9.2 Conversion of Only Unit 2 ............................................................................................. 47 9.3 Conversion of Only Unit 3 ............................................................................................. 48
10 Economic and Power Loss Estimates ................................................................................... 49 10.1 Initial Capital Costs .................................................................................................... 49 10.2 Lost Electrical Generation Due to Construction Outage ............................................ 51

CONVERSION OF INDIAN POINT UNITS 2 & 3 TO A CLOSED-LOOP COOLING WATER CONFIGURATION
ii
10.3 Lost Electrical Generation Due to New Condenser Operating Parameters and Parasitic Losses ......................................................................................................................... 51 10.4 Operations and Maintenance Costs ............................................................................ 52
11 Conclusions ........................................................................................................................... 54 11.1 Challenges to the NYSDEC Proposed Project ........................................................... 54 11.2 Duration of the NYSDEC Proposed Project............................................................... 55 11.3 Cost and Power Loss of the NYSDEC Proposed Project ........................................... 56
12 References ............................................................................................................................. 57

CONVERSION OF INDIAN POINT UNITS 2 & 3 TO A CLOSED-LOOP COOLING WATER CONFIGURATION
iii
Attachments
Attachment 1 – 2003 Economic and Environmental Impacts Associated with Conversion of Indian Point Units 2 and 3 to a Closed-Loop Condenser Cooling Water Configuration
Attachment 2 – Post Modification Site Rendering and Conceptual Drawings
Attachment 3 – Subsurface Radiological Considerations Related to Construction of Closed-Loop Cooling at Indian Point Energy Center Units 2 and 3 (GZA GeoEnvironmental, Inc.)
Attachment 4 – Closed-Loop Performance
Attachment 5 – Electrical Distribution Model Output Results
Attachment 6 – Feasibility Evaluation of Relocating the Algonquin Gas Transmission Pipelines (Spectra Energy Transmission, LLC)
Attachment 7 – Blasting Feasibility Study for Conversion of Indian Point Units 2 and 3 to a Closed-Loop Cooling Water Configuration (Precision Blasting Services)
Attachment 8 – Cultural / Historic Considerations for Cooling Tower Feasibility
Attachment 9 – Construction Schedule
Attachment 10 – Capital Cost Evaluation

CONVERSION OF INDIAN POINT UNITS 2 & 3 TO A CLOSED-LOOP COOLING WATER CONFIGURATION
iv
Executive Summary
Entergy Nuclear Indian Point 2, LLC, and Entergy Nuclear Indian Point 3, LLC (collectively, Entergy), have submitted a timely and complete renewal application for a State Pollutant Discharge Elimination System (SPDES) permit (SPDES Permit NY0004472) for Indian Point Energy Center (IPEC) nuclear powered electric generating stations 2 and 3 (collectively, the Stations, individually Unit 2 and Unit 3). The New York State Department of Environmental Conservation (NYSDEC) staff has proposed modifications in IPEC’s draft SPDES permit, including possible construction and operation of cooling towers in a closed-loop cooling configuration (NYSDEC Proposed Project). Consideration of the NYSDEC Proposed Project is subject to certain feasibility and alternative technologies assessments, as directed by the NYSDEC Assistant Commissioner’s August 13, 2008 Interim Decision. Accordingly, NYSDEC may revisit its proposed modifications to the draft SPDES permit for IPEC and change them pursuant to Entergy’s closed-loop cooling feasibility and alternative technologies reports.
The Interim Decision provides that Entergy must submit an engineering report that addresses significant construction and operational considerations, associated with conversion of the Stations’ existing cooling water systems to closed-loop cooling, taking into account site constraints, including, but not limited to, existing physical features and the relocation of the Algonquin Gas Transmission pipelines. As part of this feasibility analysis of the NYSDEC Proposed Project, this Report supplements and amends the preliminary 2003 Economic and Environmental Impacts Associated with Conversion of IPEC Units 2 and 3 to a Closed-Loop Condenser Cooling Water Configuration Report (2003 Report), prepared by Enercon Services, Inc. (ENERCON).
ENERCON was retained to further evaluate the potential conversion to closed-loop cooling. While different types of cooling towers exist, with varying levels of cost, performance, and impacts, the cooling tower configurations that could reasonably be considered for Unit 2 and Unit 3 are limited to a single 100% capacity round hybrid cooling tower for each Unit.
Even with this configuration, several site-specific conditions have been identified at IPEC that would challenge the feasibility of the NYSDEC Proposed Project. Such challenges include, but are not limited to, the following:
As TRC Environmental Corporation concluded, air emissions resulting from operation of the cooling towers would exceed the National Ambient Air Quality Standards for PM10 and PM2.5. Saltwater cooling towers of the scale proposed at IPEC would typically be expected to produce plume emissions exceeding National Ambient Air Quality Standards in non-attainment areas (see discussion of San Onofre Nuclear Generating Station in Section 7.2).
As Saratoga Associates, Landscape Architects, Architects, Engineers and Planners, P.C. concluded, construction of cooling towers at IPEC may be incompatible with New York law and policy relating to scenic resources and aesthetic impacts.
Archeological concerns have been identified that could affect the excavation schedule and, potentially, tower placement.

CONVERSION OF INDIAN POINT UNITS 2 & 3 TO A CLOSED-LOOP COOLING WATER CONFIGURATION
v
The required tower configurations do not conform to municipal law, and Village of Buchanan officials are on record in opposition to the construction of cooling towers at IPEC. As such, required local zoning approvals may be difficult to obtain.
The topography of the IPEC site and general space constraints, in conjunction with the fact that the elevation of the tower basins must be sufficiently low to prevent damage to the condenser tubes, limit the potential locations for cooling towers. Where located, approximately 2 million cubic yards of soil and inwood marble bedrock would need to be excavated in conjunction with tower construction. This exceeds 50% of the total crushed marble sold or used in the U.S. in 2007. Blast removal would be required to excavate large quantities of bedrock at the cooling tower locations and in the piping trenches outside of the Riverfront area. To avoid prolonged forced outages, blasting operations are proposed to occur while both Units are online. For reference, blasting operations would produce quantities of broken rock equivalent to between 364 and 518 truck loads (20-cubic yard capacity) each day.
Excavation in the Riverfront area would intersect groundwater contamination plumes containing tritium and strontium, with potential for soil contamination, requiring sampling, analysis, handling, and disposal protocols. Additional construction delays beyond those identified in this Report may result from these conditions.
Algonquin Gas Transmission pipelines currently exist where the Unit 3 tower would be constructed, requiring relocation of those facilities within the IPEC site. The Algonquin Gas Transmission pipelines supply approximately 50% of the natural gas demand in New England, and the pipelines’ owner has emphasized that this supply cannot be interrupted, requiring accommodations that may cause further construction delay. This relocation also would require Federal Energy Regulatory Commission (FERC) approval.
Conversion of the Stations to closed-loop cooling would be an unprecedented undertaking that would likely encounter unforeseen challenges during design and implementation that are not anticipated or addressed here.
The total duration of the NYSDEC Proposed Project is expected to extend almost 13 years. This schedule includes an 18-month design period before NYSDEC approval, a 36-month permitting and licensing period between NYSDEC approval of the project and the start of construction, and the expected construction duration of more than eight years, which includes an estimated 42 weeks of continuous forced outage, conducted simultaneously, at both units. Of the eight-year construction schedule, approximately four years would be required for drilling, blasting, and spoils removal. This construction timeframe reflects conditions that have arisen since the initial 2003 conceptual construction schedule, as well as additional analysis of the conditions described at that time, including the following:
Excavation for the conversion to closed-loop cooling would overlap with areas of known radiological groundwater contamination, the remediation of which is currently subject to NRC oversight. Development and employment of protocols for sampling, analysis, handling and disposal of contaminated soil and water may result in substantial construction delays.
The relocation of the on-site Algonquin pipelines must be undertaken and completed prior to any blasting work performed at the Unit 3 cooling tower location.

CONVERSION OF INDIAN POINT UNITS 2 & 3 TO A CLOSED-LOOP COOLING WATER CONFIGURATION
vi
Considering the conceptual nature of the current design parameters, the lack of comparable retrofits, and typical unknown conditions that arise in major construction projects, this schedule represents a reasonably aggressive scenario. Significantly longer durations than currently estimated could result.
The anticipated direct overnight capital cost for the conversion for both Unit 2 and Unit 3 is collectively estimated at a minimum of $1.19 billion. The estimated cost includes relocation of the Algonquin Gas Transmission pipelines. As Unit 2 and Unit 3 have net capacities of 1078 MWe and 1080 MWe, respectively, a 42 week forced outage at both Units 2 and 3, accounting for a coincident maintenance outage at one Unit, would result in approximately 14,502,000 MWhr of lost electrical generation, significantly increasing the overall costs of conversion and adverse environmental impacts. A subsequent report will address forced outage costs specifically, as well as related impacts.1
As a result of conversion, the Stations would also incur ongoing operational and parasitic electrical generation losses. Averaged across the entire year, the combined operational and parasitic losses would be approximately 88.2 MWe; however, operational power losses would increase to approximately 157.8 MWe during the peak summer power generation season. Again, this report does not directly calculate the impacts of lost electrical generation. In addition to ongoing operational and parasitic losses, the Stations would also incur annual operations and maintenance costs due to the NYSDEC Proposed Project. Annual operations and maintenance costs associated with closed-loop cooling at the Stations would be more than $4 million for the first five years, with increasing costs in the subsequent years due to the need for increased equipment replacement and repair.
No nuclear stations designed solely for once-through cooling have been converted to closed-loop cooling. Conversion of the condenser cooling system of an existing plant presents fundamental design problems that result in plant performance impacts or require redesign of the condenser. At the Stations, the expected performance impacts could not be mitigated by condenser modifications without the complete reconstruction of the turbine building. Moreover, absent any practical history of closed-loop cooling retrofits at nuclear facilities, engineering observations and conclusions regarding any such conversion must be made on a purely speculative basis and are inherently subject to unforeseen challenges during the detailed design phase and the subsequent implementation. As such, the cost and schedule estimates presented herein are likely understated, representing a lower bound for the cost and durations for the actual project. In addition, due to the untried nature of this type of conversion and the intrusive plant modifications that would be required, the feasibility of a closed-loop cooling retrofit at a nuclear facility cannot be guaranteed at any point in the design stage. Only upon successful operation of a completed closed-loop cooling retrofit could this type of conversion be conclusively considered feasible.
1 Entergy’s legal counsel has directed that forced outage costs be considered, consistent with the Interim Decision, under New York’s State Environmental Quality Review Act (“SEQRA”) and/or an economic test not currently defined by NYSDEC in a separate assessment, and accordingly need not be addressed now.

CONVERSION OF INDIAN POINT UNITS 2 & 3 TO A CLOSED-LOOP COOLING WATER CONFIGURATION
1
1 Background and Introductions
1.1 History
Unit 2 and Unit 3 were each approved for service by the New York Public Service Commission in the mid-1970s to meet a demonstrated need for electric power. Both Units are pressurized water reactors (PWRs) with net capacities of 1078 MWe and 1080 MWe for Unit 2 and Unit 3, respectively. Located on the east side of the Hudson River in the Village of Buchanan, each Unit utilizes a once-through type condenser cooling water system (i.e., circulating water (CW) system), with the intakes from and a shared discharge canal to the Hudson River. The design flow rate of the CW system (i.e., CW system capacity) for each unit is 840,000 gpm.
1.1.1 PWR System Operation
Unit 2 and Unit 3 are Westinghouse four-loop PWRs. PWRs consist of two separate systems: a closed, pressurized reactor coolant system (primary system), and a power conversion system (secondary system) for the generation of electricity. The basic configuration of a typical PWR is shown in Figure 1.1. In the primary system, reactor coolant is heated by nuclear fission in the reactor. The primary system operates at high pressure to prevent the production of steam in the reactor. The heated reactor coolant is used in the steam generators to produce steam in the secondary system. The steam formed in the steam generator is transferred by the secondary system to the main turbine generator, where it is converted into electricity. After passing through the low pressure turbine, the steam is routed to the main condenser, which is operated at a vacuum to allow for the greatest removal of energy by the low pressure turbines. The steam is condensed into water in the condenser by the flow of circulating water through the condenser tubes. The water is then pumped back to the steam generator for reuse. The primary and secondary systems are physically separated in the steam generator, minimizing radioisotope transfer to the secondary system.
The power output of the reactor, and the outlet temperature of the reactor coolant, are controlled by adjusting several factors which affect the core’s reactivity. The reactor control system is designed to avoid nuclear plant transients for prescribed design load perturbations. Long-term regulation of the core reactivity is accomplished by adjusting the concentration of boric acid in the reactor coolant, while short term reactivity control for power changes or reactor trip is accomplished by the movement of control rod clusters [Ref. 12.7].

CONVERSION OF INDIAN POINT UNITS 2 & 3 TO A CLOSED-LOOP COOLING WATER CONFIGURATION
2
Figure 1.1 Basic Arrangement of a PWR
1.1.2 Circulating Water System Background
The circulating water systems for Unit 2 and Unit 3 each consist of six circulating water pumps that draw water from the Hudson River and discharge into the inlet water boxes of their respective condensers. Each circulating water pump has a design intake flow capacity of 140,000 gpm and is housed in an individual well within each unit’s consolidated cooling water intake structure (CWIS). Unit 2 and Unit 3 have separate CWISs, each configured with central service water intake channels located between three circulating water channels on each side. The CWISs contain bar racks that filter debris, and coarse mesh traveling water screens that filter fish and residual debris from the intake water prior to the circulating water pumps suction. Unit 2 contains six Allis Chalmers dual speed circulating water pumps rated at 140,000 gpm at 21 feet total dynamic head (TDH) when running at 254 rpm, and 84,000 gpm and 15 feet of total dynamic head when running at 187 rpm. Unit 3 contains six Allis Chalmers variable speed pumps that are rated for 140,000 gpm at 29 ft TDH when running at 360 rpm and 84,000 gpm at 19.5 ft TDH when running at 250 rpm. The circulating water pumps discharge through 84 inch headers to the inlet water boxes and the circulating water subsequently passes through the condenser tubes condensing steam admitted from the turbines. Flow from the condenser outlet waterboxes of Unit 2 and Unit 3 is discharged through 96 inch piping, and combines in the discharge tunnel prior to being returned to the Hudson River via the discharge canal.
1.1.3 Novelty of Closed-Loop Cooling Retrofits
No nuclear power plant designed for once-through cooling has ever been retrofitted to closed-loop condenser cooling. One nuclear power plant, Palisades Nuclear Generating Station (PNGS), although initially designed for once-through cooling, was redesigned for closed-loop cooling during construction; consequently, the circulating water system
MSR
HudsonRiver

CONVERSION OF INDIAN POINT UNITS 2 & 3 TO A CLOSED-LOOP COOLING WATER CONFIGURATION
3
components, particularly the condensers, were sized to accommodate the expected heat rejection capability provided by cooling towers.
Absent any practical history of closed-loop cooling retrofits at nuclear facilities, engineering observations and conclusions regarding any such conversion must be made on a purely speculative basis and are inherently subject to unforeseen challenges, with a corresponding, potentially large, degree of uncertainty. Thus, conclusions about feasibility, while based on best professional judgment, do not have the benefit of either available technology or past efforts at comparable facilities. Due to the untried nature of this type of conversion and the intrusive plant modifications that would be required, the feasibility of a closed-loop cooling retrofit at a nuclear facility cannot be guaranteed at any point in the design stage. Only upon successful operation of a completed closed-loop cooling retrofit could this type of conversion be conclusively considered feasible. Likewise, only direct comparison to a successful closed-loop cooling retrofit could provide reliable basis for cost estimates. For this assessment, cost estimates were done in such a way as to minimize the necessary assumptions, and relied instead on well-developed, detailed conceptual designs. However, given the absence of any practical applications, costs are likely to be understated.
1.1.4 Conclusions from the 2003 Report
In 2003, ENERCON performed a preliminary evaluation of the feasibility of converting IPEC Units 2 and 3 to closed-loop cooling, and an assessment of the associated economic and environmental impacts (see Attachment 1). The 2003 Report concluded that conversion of IPEC to closed-loop cooling would be theoretically feasible; however, with appreciable elevation changes, a general lack of available space, a subsurface primarily composed of solid rock, the location of a major interstate gas pipeline, local air quality, archeological and aesthetic considerations, etc., significant site-specific challenges existed. This Report further investigates these and other challenges to a closed-loop conversion of IPEC.
There are various methods for heat rejection from a closed-loop cooling system, including cooling ponds, canals, and towers. However, the 2003 Report concluded that cooling towers would be the only heat rejection method not rendered infeasible by space constraints at IPEC. Several cooling tower types were evaluated: natural-draft towers, mechanical-draft towers, and hybrid towers.
Conversion of the condenser cooling system of an existing plant presents fundamental design problems. The design of the condenser and turbine is based on the anticipated temperature of the condenser cooling water. If the condenser cooling water were not as cold as the original once-through design requires for optimal performance, then the condenser heat rejection would be reduced and the backpressure on the turbine increased. With an increase of backpressure on the turbine, performance is significantly affected, and ultimately generator output is reduced. The 2003 Report determined that cooling towers, through evaporative cooling, could not match the low temperature of the River intake. In the winter months the impact would be lessened, but during the summer performance would suffer appreciably.

CONVERSION OF INDIAN POINT UNITS 2 & 3 TO A CLOSED-LOOP COOLING WATER CONFIGURATION
4
Due to IPEC-specific zoning and permitting constraints, a tower with visible plume abatement and noise abatement was deemed necessary. Additionally, due to the rocky terrain and rapid elevation changes, a tower with a minimum footprint was selected to reduce overall excavation and clearing. A single round hybrid cooling tower for each Unit was found to most closely meet each Unit’s performance needs.
A hybrid, also referred to as a “wet/dry” or “plume abated” cooling tower, addresses many of the shortcomings of other types of cooling tower, particularly as applies to the IPEC site. Basically, a hybrid tower is the combination of the wet tower, with its inherent cooling efficiency, and a dry heat exchanger section used to reduce or eliminate visible plumes in the majority of atmospheric conditions. After the plume leaves the lower “wet” section of the tower, it travels upward through a “dry” section where heated, relatively dry air is mixed with the plume in the proportions required to achieve a non-visible plume in most circumstances.
Figure 1.2 illustrates the air flow path through a cell of a parallel path hybrid tower, and the applicable simplified psychrometric chart.
Figure 1.2 Partial Desaturation of Air in a Parallel Path Hybrid Tower
A hybrid cooling tower is designed to significantly reduce both the apparent density and the persistency of the plume. Incoming hot water flows first through the dry heat exchanger (finned coil) sections, then through the wet (evaporative cooling) fill section. Parallel streams of air flow across the coil sections and through the fill sections, leaving the coil sections at dry condition 3, and leaving the fill sections at saturated condition 2. These two separate streams of air then mix together going through the fans, along the lines 3-4 and 2-4 respectively, exiting the fan cylinder at sub-saturated condition 4. This exit air then returns to ambient conditions along line 4-1, avoiding the region of super-saturation (visible plume) in most cases.

CONVERSION OF INDIAN POINT UNITS 2 & 3 TO A CLOSED-LOOP COOLING WATER CONFIGURATION
5
Figure 1.3 Round Hybrid Tower versus Linear Cell-Type Hybrid Tower
As detailed in the 2003 Report, the round hybrid tower has the following attributes and features (see Figure 1.3):
The concentrated center plume is not susceptible to recirculation to the tower inlets, improving tower performance. Additionally, the center plume is discharged at a higher elevation, approximately 165 feet, and reaches significantly greater heights due to the flow velocity and thermal concentration created by the central discharge shroud. This feature promotes distribution of entrained salts over a much larger area, thus lowering local concentrations, and reducing ground level plumes that could compromise Station systems, including plant security.
The round tower has an appreciably smaller size footprint than an equal capacity linear tower. With the high excavation costs at IPEC, the smaller footprint would facilitate construction. The round design, at approximately 500 feet in diameter for the required capacity for each Unit, compares favorably to a linear tower that could approach 1500 feet in length, running parallel to the River shore.
Less piping, in a simpler configuration, is required for a round tower. Supply and return piping is required for each cooling tower. To provide cooling for either Unit 2 or 3, a single round tower or a pair of linear towers would be required. In addition to the requirement for more towers, linear towers are also subject to more restrictive siting requirements. Siting restrictions can significantly increase piping requirements due to the need for adequate spacing between towers and also between towers and other buildings.
Dedicated fans for the dry and wet sections of the round hybrid allows efficient tower usage, with the dry section fans operating at reduced capacity when ambient

CONVERSION OF INDIAN POINT UNITS 2 & 3 TO A CLOSED-LOOP COOLING WATER CONFIGURATION
6
conditions don’t dictate their usage for plume control. Linear, cell-type hybrid towers have a single fan per cell, inducing flow through both sections, hence operate at full fan power at all times.
The conceptual design provided in the 2003 Report balanced the siting of each cooling tower against the site terrain and proximity to each Turbine Building to minimize the excavation required. Siting was also constrained by the maximum cooling tower basin elevation, which was fixed by the maximum pressure allowable through the condenser. The cooling tower supply and return piping was also concentrated into two 122-inch and two 144-inch concrete lined steel pipes for each cooling tower to minimize the excavation required and reduce capital costs.
Because any changes to the condenser cooling systems would involve the very heart of the plant, construction in the Riverfront area and tie-in with the condenser cooling systems would have to be completed with both Units in a forced outage. Although much of the excavation work and cooling tower erection could be done pre-outage, new circulating water pumping stations and changes to the common discharge canal force a major outage.
1.2 Purpose and Scope of this Report
Although the existing once-through circulating water scheme provides both the lowest cost method of condenser cooling and supports the highest level of Station capacity, IPEC has been required by the NYSDEC to further evaluate possible conversion of the existing system to a closed-loop circulating water system configuration. The overall purpose and scope of this Report is to determine feasibility of the NYSDEC Proposed Project and, also, update the 2003 Report in order to achieve a higher measure of certainty, with appropriate defined ranges, for the costs of retrofitting with closed-loop cooling and the schedule for doing so. This includes further development of the initial conceptual design to a level of detail commensurate with more accurate subsequent cost estimates, updating the previously estimated construction and procurement costs to the current dollar value, addressing additional impacts and new site conditions identified since the 2003 Report, and updating construction costs and outage schedules to account for additional analysis performed since the original report submittal.
CONVERSION OF INDIAN POINT UNITS 2 & 3 TO A CLOSED-LOOP COOLING WATER CONFIGURATION
7
2 Conceptual Design As discussed in Section 1.1.3, there have been no conversions of existing operating nuclear stations from once-through to closed-loop cooling. Due to this uncertainty, an investigative analysis on the impact of closed-loop cooling on plant systems, operation, and electrical output must be considered. Conversion to closed-loop cooling would represent a massive and difficult engineering and construction undertaking.
Three design alternatives are considered for closed-loop cooling at IPEC: (1) retrofit both Units to closed-loop cooling, (2) retrofit only Unit 2 to closed-loop cooling, or (3) retrofit only Unit 3 to closed-loop cooling. Conceptual designs, including major plant modifications, have been developed for all three alternatives consistent with the conclusions of the 2003 Report (Section 1.1.4). The conceptual designs are based on summary level scope intended to identify challenges and predict budgetary costs.
2.1 Conversion of Unit 2 and Unit 3
The conversion of both Units 2 and 3 to closed-loop cooling would require the installation of two 100% capacity round hybrid cooling towers and the associated piping and equipment (Attachment 1). The cooling towers would need to be placed to the northeast and southwest of the Stations, as shown in Attachment 2, Sketch ENTGNU011-SK-001. Construction of the Unit 3 cooling tower would require relocation of the Algonquin Gas Transmission pipelines, as discussed in Section 4. Each cooling tower would be approximately 165 feet tall and 525 feet in diameter (Attachment 1).
2.1.1 Circulating Water System Piping
The new circulating water piping would need to be routed from new circulating water pumps to the cooling towers and back to the condenser. The cooling tower supply piping would need to be two 120-inch (10 feet) diameter concrete-lined steel pipes (AWWA Specification C200 and C205) per Unit. Gravity-driven flow from the cooling tower basin to the condenser would need to be via two 144-inch (12 feet) diameter concrete-lined steel pipes (AWWA Specification C200 and C205) per Unit.
Retrofitting a nuclear power plant from a once-through cooling design to closed-loop cooling has not occurred; therefore, there is a large degree of uncertainty in the operation of any closed-loop cooling retrofit. The startup, steady-state operation, and shutdown of the closed-loop cooling system would require balancing the circulating water flow between the cooling tower basin and the discharge canal reservoir. The control scheme would require a programmable logic control system and redundant instrumentation, and be capable of balancing the closed-loop cooling equipment to meet ambient environmental conditions, plant operational requirements, and maintain adequate inventory each basin.
2.1.1.1 Pipe Routing / Interferences
The new Unit 2 circulating water pump house would need to be located on the existing discharge canal between the Unit 1 and Unit 3 turbine-generator buildings, as shown in Attachment 2, Sketch ENTGNU011-SK-001. Also shown in Attachment 2, Sketch

CONVERSION OF INDIAN POINT UNITS 2 & 3 TO A CLOSED-LOOP COOLING WATER CONFIGURATION
8
ENTGNU011-SK-001, the cooling tower supply piping would need to be routed from the new pump house to the Unit 2 cooling tower through the “Riverfront”, the space between the intake structures and turbine-generator buildings of each Unit. There are several underground utilities present in the Riverfront area, the most significant of which is the Unit 2 service water and existing circulating water supply piping and electrical duct banks. Furthermore, this area is commonly used for vehicular traffic and is part of the heavy load path (i.e., the road must withstand loads up to 300 tons). Therefore, the supply and return piping would need to be buried to sufficient depth beneath the road elevation and backfilled to support the current traffic patterns and the resultant structural loads. Outside the protected area (i.e., outside the graded and paved Riverfront area), the piping would need to be routed to the cooling towers following approximately the same gradient as the surface elevation, providing a minimum of 10 feet depth of cover (see Attachment 2, Sketch ENTGNU011-SK-002).
Routing the piping from the Riverfront area to the Unit 2 cooling tower basin presents significant challenges. The piping elevation would rise approximately 15 feet between the Riverfront area and the Unit 2 cooling tower basin, following the gradient of the surface elevation, and excavation of the bedrock would be required. The drainage areas created by the construction of the Independent Spent Fuel Storage Installation (ISFSI) would also create challenges for the Unit 2 pipe routing. These areas would either need to be avoided or moved to appropriate locations consistent with the drainage requirements of the ISFSI.
The new Unit 3 circulating water pump house would need to be located on the existing discharge canal near the end, as shown in Attachment 2, Sketch ENTGNU011-SK-001. The cooling tower supply piping would need to be routed almost directly southeast to the Unit 3 cooling tower. Both the cooling tower supply and return pipes would need to be routed to the cooling towers following approximately the same gradient as the surface elevation, providing a minimum of 10 feet depth of cover (see Attachment 2, Sketch ENTGNU011-SK-003). Inside the protected area, the cooling tower return piping would need to be routed to the Unit 3 condenser through the Riverfront area between the Unit 3 turbine-generator building and intake structure. Similar to the Unit 2 routing, the Unit 3 pipes would need to be buried to accommodate current traffic and access patterns and to avoid many underground utilities, including the existing Unit 3 service water piping.
Installation of the new circulating water piping in the Riverfront area would require an outage of both Units. Several safety-related systems would still require offline cooling (e.g., Spent Fuel Pool, Emergency Diesel Generators); however, the existing service water supply would be interrupted by excavation under and around the service water piping. Each safety-related system requiring offline cooling would need to be reviewed and provided with secondary cooling. Additional security would also be required during construction within the protected area.
2.1.1.2 Tie-In Locations
The Unit 2 cooling tower return piping would tie-in to the existing Unit 2 CW piping in the Riverfront area prior to flowing through the condensers, as shown in Attachment 2, Sketch ENTGNU011-SK-004. Each cooling tower return pipe would supply three

CONVERSION OF INDIAN POINT UNITS 2 & 3 TO A CLOSED-LOOP COOLING WATER CONFIGURATION
9
existing CW pipes. One cooling tower return pipe would be routed at centerline elevation 1’-0” above MSL through the Riverfront to tie-in to the three northernmost existing CW pipes. The 1’-0” centerline elevation would allow a 7.5’ depth of cover. The other cooling tower return pipe would be routed at centerline elevation (-) 11’-0” below MSL through the Riverfront to pass underneath the exiting service water piping at centerline elevation 1’-0” above MSL, with 5’ of clearance between pipes. After clearing the existing service water piping, the cooling tower return line rises to centerline elevation 1’-0” above MSL to connect to the three southernmost existing CW pipes. A header would be required at the end of each cooling tower return line to connect to the existing CW pipes at centerline elevation 6’-6” above MSL. A throttling valve would be required after the tie-in on each existing CW pipe to regulate flow to each condenser waterbox and allow for condenser maintenance.
The Unit 3 cooling tower return pipes would tie-in to the existing Unit 3 CW pipes in the Riverfront area prior to flowing through the condensers, as shown in Attachment 2, Sketch ENTGNU011-SK-007. Each cooling tower return pipe would supply three existing CW pipes. One cooling tower return pipe would be routed at elevation 1’-0” above MSL through the Riverfront to tie-in to the three southernmost existing CW pipes. The 1’-0” elevation would allow a 7.5’ depth of cover. The other cooling tower return pipe would be routed at centerline elevation (-) 11’-0” below MSL through the Riverfront to pass underneath the exiting service water piping at centerline elevation 1’-0” above MSL, with 5’ of clearance between pipes. After clearing the existing service water piping, the cooling tower return line would rise to centerline elevation 1’-0” above MSL to connect to the three northernmost existing CW pipes. A header would be required at the end of each cooling tower return line to connect to the existing CW pipes at centerline elevation 6’-6” above MSL. A throttling valve would be required after the tie-in on each existing CW pipe to regulate flow to each condenser waterbox and allow for condenser maintenance.
The new circulating water pumps for each Unit would draw suction from the modified discharge canal to supply water to the cooling tower supply pipelines. In its modified configuration, the discharge canal would no longer serve its once-through cooling function to return circulation water to the Hudson River and would become the new circulating water pump pit. The new Unit 2 pump house would be located on the discharge canal between the Unit 1 and Unit 3 turbine generator buildings. The new Unit 3 pump house would be located on the discharge canal along the Hudson River bank. Additional details on how closed-loop cooling would require reconfiguration of the discharge canal are provided in Section 2.1.3.
2.1.2 Intake Structure
Although the existing circulating water pumps and screens would no longer be required for closed-loop operation, service water flow would still be maintained through the existing intake structures. The discharge from the service water systems would be used after a conversion to closed-loop cooling for makeup water to the cooling towers.

CONVERSION OF INDIAN POINT UNITS 2 & 3 TO A CLOSED-LOOP COOLING WATER CONFIGURATION
10
2.1.2.1 Closed-Loop Operation
The makeup water flow rate required to support closed-loop cooling would vary based on Hudson River water quality and meteorological conditions as further discussed in Section 7.1. In addition, the closed-loop cooling start-up sequence would require a large amount of makeup water to charge the system. All makeup and start-up flow would be supplied to the discharge canal to provide adequate flow to the new circulating water pumps.
Under typical operation, the makeup water flow would be provided to the Unit 2 and Unit 3 reservoirs by the service water discharge. An ancillary makeup pump (shown in Attachment 2, Sketch ENTGNU011-SK-007) would provide additional makeup flow directly to the Unit 2 reservoir under conditions when the total required makeup flow exceeds the service flow discharged by both Units. The additional flow from the makeup pump would flow over the weir between the Unit 2 and 3 pump reservoirs to provide flow to the Unit 3 pump reservoir. The ancillary pump would also likely be used during the closed-loop start-up sequence. The blowdown flow plus any excess service water flow would be discharged through the Unit 2 and Unit 3 reservoir weirs.
Additional operational procedures would be required to ensure flow balance throughout the closed-loop cooling system. As a result, conversion of IPEC to closed-loop cooling would increase the complexity of plant operations and require additional operations personnel.
2.1.2.2 Current Equipment to Remain Under Closed-Loop Operation
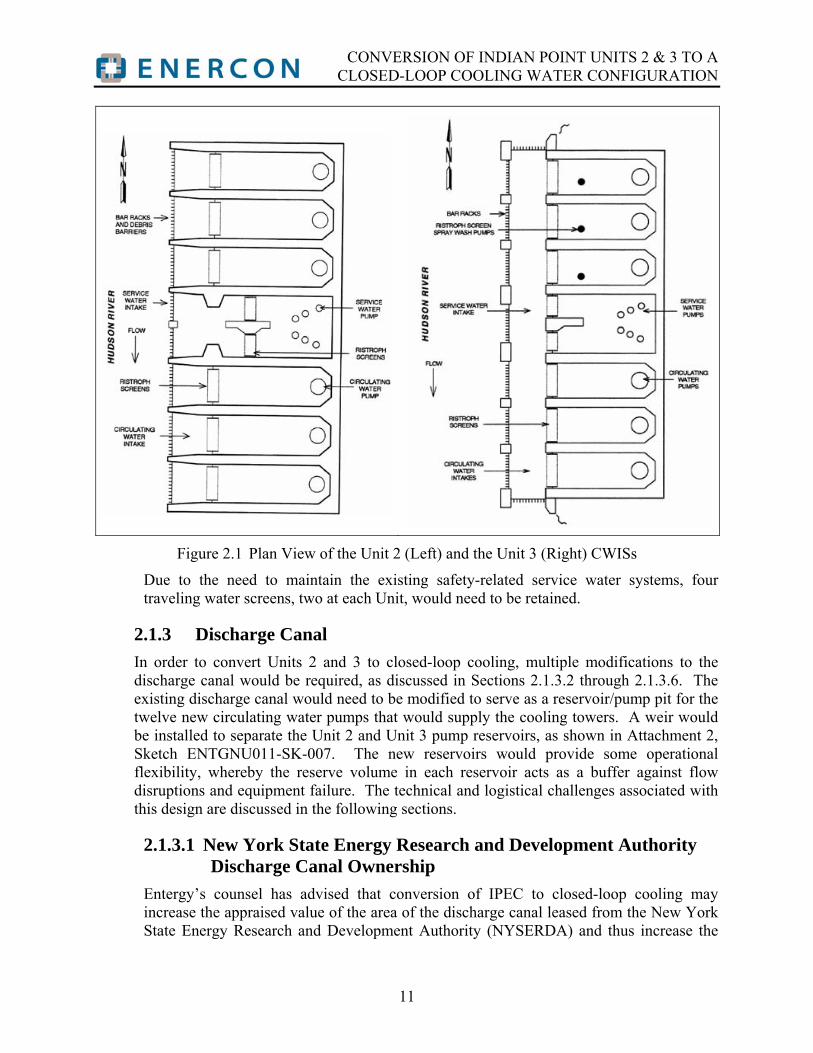
The current intake structures are divided into separate channels for each of the six circulating water pumps with a center channel shared by the six service water pumps as shown in Figure 2.1. Each of the circulating water pump channels is served by a Ristroph-type traveling water screen and the service water pump channels have two Ristroph-type traveling water screens.2
2 A full description of the Ristroph-type traveling water screens is included in Section 2.3.1.1 of the Evaluation of Alternative Intake Technologies at Indian Point Units 2 & 3 [Ref. 12.8], submitted with this Report.
CONVERSION OF INDIAN POINT UNITS 2 & 3 TO A CLOSED-LOOP COOLING WATER CONFIGURATION
11
Figure 2.1 Plan View of the Unit 2 (Left) and the Unit 3 (Right) CWISs
Due to the need to maintain the existing safety-related service water systems, four traveling water screens, two at each Unit, would need to be retained.
2.1.3 Discharge Canal
In order to convert Units 2 and 3 to closed-loop cooling, multiple modifications to the discharge canal would be required, as discussed in Sections 2.1.3.2 through 2.1.3.6. The existing discharge canal would need to be modified to serve as a reservoir/pump pit for the twelve new circulating water pumps that would supply the cooling towers. A weir would be installed to separate the Unit 2 and Unit 3 pump reservoirs, as shown in Attachment 2, Sketch ENTGNU011-SK-007. The new reservoirs would provide some operational flexibility, whereby the reserve volume in each reservoir acts as a buffer against flow disruptions and equipment failure. The technical and logistical challenges associated with this design are discussed in the following sections.
2.1.3.1 New York State Energy Research and Development Authority Discharge Canal Ownership
Entergy’s counsel has advised that conversion of IPEC to closed-loop cooling may increase the appraised value of the area of the discharge canal leased from the New York State Energy Research and Development Authority (NYSERDA) and thus increase the

CONVERSION OF INDIAN POINT UNITS 2 & 3 TO A CLOSED-LOOP COOLING WATER CONFIGURATION
12
discharge canal rent obligations upon renewal of the lease in March 2017 above the current annual cost of approximately $1.0 million.
2.1.3.2 Pump Submergence Modification
New Unit 2 and Unit 3 pump houses would need to be constructed on the existing discharge canal, near the Unit 3 turbine-generator building and along the Hudson River bank, respectively. The conceptual pump house locations are shown on Sketch ENTGNU011-SK-001 in Attachment 2.
In order to provide the necessary flow to the cooling towers, the new circulating pumps would need to be approximately 45 ft long. Providing the correct submergence of the pump is necessary for continuous closed-loop operation, whereby inadequate submergence would cause damage to the pumps, render the circulating water system inoperable, and cause the plant to trip offline. The required submergence value of these pumps would necessitate excavation to increase the depth of the existing discharge canal in the locations of the new pump houses. The new depth at elevation (-) 32’-5” under the Unit 2 pump house would slope up gradually to meet the existing canal depth at elevation (-) 17’-0” below mean sea level (MSL). The existing canal depth in the Unit 3 pump house location at elevation (-) 20’-0” would require less excavation. This design maximizes the water inventory margin available above the minimum required submergence level of the pumps (Attachment 1). The minimum required submergence would be reached when the water level dropped from the nominal elevation of (+) 1’-0” above MSL to (-) 14’-0” below MSL. This level would need to be reached in the Unit 2 and Unit 3 reservoirs after approximately 4 to 6 minutes if supply to the reservoirs was suddenly cut off. Once the water level has dropped below the minimum required submergence, the circulating water pumps would no longer be capable of pumping water from the reservoirs to the cooling towers. A weir would need to be installed in the existing discharge canal prior to converging with the Unit 3 discharge tunnel outlet, as shown in Attachment 2 Sketch ENTGNU011-SK-007, to separate the reservoirs for each Unit and prevent an inventory drop in one reservoir from affecting the other.
2.1.3.3 Reservoir Capacity
Modifications would be required to convert the existing discharge canal to serve as the Unit 2 and Unit 3 pump reservoirs. These modifications would include increasing the depth of the canal beneath the new pump houses to accommodate new circulating water pumps, adding a weir prior to converging with the Unit 3 discharge tunnel outlet, as shown in Attachment 2 Sketch ENTGNU011-SK-007, to separate the Unit 2 and Unit 3 pump reservoirs. After modifications, the Unit 2 and Unit 3 reservoirs would hold over 4.2 million and 6.5 million gallons, respectively.
2.1.3.4 Offline Effluent Flow
Flow from each Unit’s discharge tunnel would need to be rerouted directly to the Hudson River, using temporary piping, to maintain dry construction conditions in the existing discharge canal for modification to new pump reservoirs. Routing of temporary piping
CONVERSION OF INDIAN POINT UNITS 2 & 3 TO A CLOSED-LOOP COOLING WATER CONFIGURATION
13
would be difficult due to the fact that the discharge tunnel is rectangular in shape, with the outlet piping into the discharge tunnel prior to flowing into the discharge canal.
Even though construction in the Riverfront area would require an outage of both Units, several safety-related systems would still require offline cooling (e.g., Spent Fuel Pool, Emergency Diesel Generators). Each of these systems would need to be reviewed and secondary cooling provided. Discharge from these secondary cooling systems would need to be returned directly to the Hudson River via temporary piping.
2.1.3.5 Groundwater Contamination
As discussed in Attachment 3, groundwater, currently subject to NRC regulatory oversight because of the presence of radiological contamination (primarily tritium (H-3) and strontium (Sr-90)), migrates through a portion of the expected cooling tower excavation area. GZA GeoEnvironmental, Inc. (GZA), an environmental and geotechnical consulting firm, developed groundwater contamination plume models for tritium and strontium based on quarterly groundwater sampling and elevation measurements taken at various monitoring points, as well as the analyses summarized in previous Quarterly Reports and the Conceptual Site Model presented in the final Hydrogeologic Site Report [Ref. 12.14]. According to GZA, sampling and analysis protocols for groundwater and excavated material would be developed and employed to manage site work and determine appropriate handling and disposal requirements (see Attachment 3).
Further, during the excavation process discussed in Section 6, excavation would be required at depths well below the groundwater table in the contaminated areas. To maintain dry conditions required for pipe construction and backfilling, contaminated groundwater would need to be continually pumped from the excavation area below the groundwater table (i.e., dewatering). As described in Attachment 3, absent careful management, dewatering could cause the groundwater to migrate from contaminated areas to clean areas, altering the existing radionuclide plume. To control spreading, dewatering from within contaminated groundwater areas would have to begin prior to excavation in the contaminated area, but coincident with excavation and dewatering in the adjacent clean areas. This dewatering would also have to be continued until completion of the excavation.
As discussed in Attachment 3, groundwater may contain tritium, strontium, and potentially smaller concentrations of other radionuclides, including cesium, that would have to be disposed of. GZA analyzed several disposal options and concluded that the only feasible method of disposal would be discharge directly to the Hudson River (Attachment 3). GZA has been advised by Entergy’s legal counsel that NYSDEC appears to believe they have jurisdiction of discharge to the Hudson River. GZA concluded, therefore, that disposal options are limited.
2.1.3.6 Low Volume Waste Effluents
Conversion to closed-loop cooling would have engineering and operational impacts on the liquid waste disposal system regulated by NRC. With respect to radiological materials, discharge streams are managed consistent with 10 CFR 20 dose limits and to

CONVERSION OF INDIAN POINT UNITS 2 & 3 TO A CLOSED-LOOP COOLING WATER CONFIGURATION
14
ensure consistency with 10 CFR 50 design objectives for keeping potential exposure levels as low as is reasonably achievable (ALARA). Likewise, discharge of non-radioactive material (i.e., boron, chlorine, etc.) is authorized and governed by the SPDES permit [Ref. 12.20]. Both are managed in the existing liquid waste disposal system.
Conversion to closed-loop cooling would require significant changes to the existing liquid waste disposal system, any of which would require reconsideration and/or revision of plant operating procedures and the operating margins to current regulatory limits. Therefore, a thorough review of the final design under 10 CFR 50.59 would be required to ensure compliance with 10 CFR 50 ALARA practices and 10 CFR 20 dose and release rate limits, as well as environmental reviews of SPDES permit limitations for non-radioactive releases.
2.2 Conversion of Only Unit 2
Conversion of Unit 2 to closed-loop cooling would require the installation of one 100% capacity round hybrid cooling tower and the associated piping and equipment as described in the 2003 Report (Attachment 1). The cooling tower would need to be placed to the northeast of the Unit Containment Building, as shown in Attachment 2, Sketch ENTGNU011-SK-002. The closed-loop cooling design of only Unit 2 would be identical to that discussed in Section 2.1 without the modifications to Unit 3.
2.3 Conversion of Only Unit 3
Conversion of Unit 3 to closed-loop cooling would require the installation of one round hybrid cooling tower and the associated piping and equipment as described in the 2003 Report (Attachment 1). The cooling tower would need to be placed to the southwest of the Unit 3 Containment Building, as shown in Attachment 2, Sketch ENTGNU011-SK-003. Construction of the Unit 3 cooling tower would require relocation of the Algonquin Gas Transmission pipelines, as discussed in Section 4. The closed-loop cooling design of only Unit 3 would be identical to that discussed in Section 2.1, whereby the only modification to Unit 2 would be additional piping to transport Unit 2 low level effluents to the Unit 3 discharge point.

CONVERSION OF INDIAN POINT UNITS 2 & 3 TO A CLOSED-LOOP COOLING WATER CONFIGURATION
15
3 Station Operational Parameters Unit 2 and Unit 3 are water-dependent – meaning both that they require a specific quantity and temperature of water. The Stations were designed for and currently utilize the consistently cold brackish water from the Hudson River for operation. Specifically, the main steam condensers at both Units were designed to operate over the fixed range of circulating water inlet temperatures provided by the Hudson River. Deviation beyond this range impacts plant performance. Conversion of IPEC to closed-loop cooling would reduce access to the relatively cold Hudson River water and increase the circulating water inlet temperature to the main condensers. Therefore, the impact of this increase to circulating water temperature on plant systems, operation, and output must be evaluated.
Conversion of a nuclear power plant designed for once-through cooling to closed-loop cooling has never occurred (Section 1.1.3). As such, the following analysis is theoretical, and while benchmarked against actual plant data, is not reflective of any history of operation of a nuclear power plant converted to closed-loop cooling. Subject to these limitations, the theoretical impacts on Units 2 and 3 due to conversion from once-through to closed-loop cooling are evaluated herein.
This evaluation of closed-loop cooling is performed using a state-of-the-art site performance evaluation of power system efficiency (PEPSE) model that accurately predicts and provides plant operational parameters and power reductions associated with conversion of IPEC to closed-loop cooling. PEPSE is used across the nuclear power industry, as well as the power industry as a whole, and is the standard analytical tool to model “what if” scenarios to determine system impacts of altering power plant operation. The PEPSE model is designed for each Unit’s actual configuration and performance, and used to benchmark theoretical plant performance against measured data to provide an accurate summary of the expected results of conversion to closed-loop cooling. Similar to the methodology employed in the 2003 Report, an analysis was done over the range of expected circulating water inlet temperatures to determine plant performance; however, the current analysis utilizes an updated PEPSE model to account for modifications to each Unit and was performed using a much larger set of discrete input parameters to increase precision.
3.1 Administrative/Operating Limits
The Stations’ equipment operation is governed by a set of administrative limits3 used to ensure safe and reliable operation of each Unit. Specifically, PWRs are subject to nuclear safety constraints on operations of various Station equipment, including pump net positive suction head requirements, overall plant control characteristics, core thermal power limits, and core thermal-hydraulic stability. The Stations’ equipment operation must be thoroughly analyzed in regard to the modifications likely required to convert Unit 2 and 3 from once-through to closed-loop cooling, in order to ensure these administrative limits are not exceeded.
3 Administrative limits are limits used to prevent encroachment of NRC licensed limitations (e.g., technical specification limitations, FSAR limitations, etc.) and equipment operational limits. They represent practical limits for safe and reliable plant operation.

CONVERSION OF INDIAN POINT UNITS 2 & 3 TO A CLOSED-LOOP COOLING WATER CONFIGURATION
16
Changes to the Stations’ cooling water equipment to offset the losses associated with conversion to closed-loop cooling are restricted by the size and configuration of the equipment within the Turbine Building, particularly the condenser and the surrounding components. The main condensers were sized to reflect the use of a stable and cold inlet water source (i.e., water drawn from the Hudson River). In order to maintain current operational efficiencies, a drastic modification of the condenser (through a size increase) would be required; however, due to the physical constraints of the Turbine Building, a significant size increase of the condensers is not possible without the complete reconstruction of the turbine building. A condenser / turbine building modification of this magnitude would be unprecedented (i.e., implementation of a condenser redesign of this magnitude has never occurred at an operational nuclear power plant). Due to the magnitude of this redesign, the lack of any history of a nuclear plant undertaking such a modification, and the physical constraints of the Unit 2 and Unit 3 Turbine Buildings, it is concluded that modification of the current cooling water equipment to compensate for the expected power generation would not be able to offset the losses associated with conversion to closed-loop cooling.
The administrative limits given in the Alarm Response Procedures [Ref. 12.15; Ref. 12.16] require that the main condenser vacuum be above approximately 3.92 and 4.92 in-Hg for Units 2 and 3, respectively.4 These administrative limits, while considered in the PEPSE analysis, were not projected to be exceeded based on historical meteorological conditions.
3.2 Closed-Loop Operational Efficiency (PEPSE Analysis)
As discussed in the 2003 Report (Attachment 1), closed-loop cooling performance is based on the ambient meteorological conditions, with the result that operational losses at the Stations would vary based on seasonal wet-bulb temperature at IPEC. The wet bulb temperature is a meteorological measurement which incorporates both moisture content and temperature of the ambient air. Local meteorological data was obtained, reviewed, and analyzed for use as an input to the PEPSE models for each Unit. The PEPSE model uses, among other things, cooling water intake temperature and flow rates to accurately calculate plant operational parameters and the resulting net power generated. The PEPSE model provides the expected plant operational parameters and power reductions necessary to theoretically operate IPEC Units 2 and 3 without exceeding equipment limitations and/or resulting in nuclear safety considerations. It should be noted that conversion of a nuclear power plant designed for once-through cooling to closed-loop cooling has never occurred and as such, the following analysis is theoretical. Although benchmarked against actual plant data, the analysis is not reflective of any closed loop conversion of a nuclear power plant.
4 The pressure setpoints listed in the Alarm Response Procedures [Ref. 12.15; Ref. 12.16] are 25 and 26 in-Hg absolute for Units 2 and 3, respectively. Subtracting each of these setpoints from a standard atmospheric pressure of 29.92 in-Hg results in the main condenser vacuum setpoints of 3.92 and 4.92 in-Hg for Units 2 and 3, respectively.
CONVERSION OF INDIAN POINT UNITS 2 & 3 TO A CLOSED-LOOP COOLING WATER CONFIGURATION
17
3.2.1 Cooling Tower Efficiency / PEPSE Analysis
The IPEC PEPSE models were reviewed and run to produce the results discussed herein.5 A diagram of the IPEC PEPSE model has been included in Attachment 4, Figures 4-1 through 4-12.
3.2.1.1 Meteorological Data Analysis
The performance of any closed-loop cooling water system is primarily driven by the ambient weather conditions at the site and the baseline inlet water temperature values. Cooling towers define their performance via an approach to wet bulb temperature. The wet bulb temperature is necessary for closed-loop cooling analysis, as cooling towers utilize an evaporative process to remove heat from the continuously recirculated cooling water. The approach to wet bulb describes the number of degrees above the ambient wet bulb temperature by which the cooling tower can be expected to reduce the cooling water temperature, whereby a lower approach equates to lower cooling water temperature exiting the cooling tower. The approach to wet bulb is a value that is based on the size and efficiency of the cooling tower, and essentially represents the cooling ability of the equipment. Although wet bulb temperature is not measured directly by site meteorological instruments, wet bulb temperature was calculated using dry bulb temperature and dew point temperature, both of which are measured onsite.
Any data set used to predict the performance of the Stations relies heavily on the presence of either wet bulb temperature measurements or a combination of values that can be used to calculate the wet bulb temperature (e.g., dry bulb temperature and relative humidity, dry bulb temperature and dew point, etc.). Entergy provided eight years of meteorological data (2001-2008) and a thorough review was conducted to normalize the data, ensuring that a uniform data set with no erroneous data is used as the basis for analysis. Particular focus was paid to the review and acceptance of the meteorological data, as even minor errors present in the meteorological data would propagate throughout the analysis. Furthermore, there is almost always some degree of data loss associated with meteorological monitoring. This data loss may be due to a number of causes (equipment failure, biological/human error, etc.). A general guideline for meteorological data acceptance is that the data maintain an average 90% data recovery rate [Ref. 12.35]. The average recovery rate for the eight year period analyzed (2001-2008) was 97.2% as shown in Attachment 4, Table 4-1; therefore, the data provided by IPEC greatly exceeds the threshold for validity and represents an extremely robust data set.
3.2.1.2 Inlet Water Data Analysis
Entergy supplied eight years (2001-2008) of average daily inlet water temperatures. This data was reviewed to ensure that a uniform data set with no erroneous data is used as the basis for analysis. The average recovery rate for the eight year period analyzed was
5 While finalizing the Report analysis, updated versions of the IPEC PEPSE models were again developed by Entergy. The new models were reviewed and compared to the PEPSE models originally used for this Report. It was determined that while previous updates were substantial, the most recent updates to the PEPSE model were less substantial and would not result in any significant differences in the analysis.
CONVERSION OF INDIAN POINT UNITS 2 & 3 TO A CLOSED-LOOP COOLING WATER CONFIGURATION
18
99.8%, representing an extremely robust data set. The monthly recovery rate per year is shown in Attachment 4, Table 4-2.
3.2.2 Closed-Loop Losses
Conversion of the Stations to closed-loop cooling would introduce both ongoing operational efficiency losses associated with operating beyond the original condenser design conditions and parasitic losses associated with the operation of the pumps and cooling tower fans. If the effect of closed-loop conversion on plant operation is averaged across the entire year, operational power losses would account for a loss in power generation of approximately 11.1 MWe and 4.7 MWe at Units 2 and 3, respectively; however, operational power losses would peak during the warmest temperature and highest dewpoint conditions, when electricity demand is at its highest. Over the historical data analyzed (2001-2008), the peak combined operational power loss occurred on June 7th, 2008 at 2PM, and accounted for a combined operational power loss of 85.4 MWe.
Additional parasitic losses from the circulating water pumps and the cooling tower fans and booster pumps would add an additional 36.1 MWe per Unit in power generation losses. Summing the operational and parasitic losses, Units 2 and 3 combined would experience an average power generation loss of 88.0 MWe and peak summer power generation loss of 157.6 MWe.
3.2.2.1 Operational Losses
After review and benchmarking, the IPEC PEPSE model was run over a theoretical bounding range of CW inlet temperatures to calculate the baseline closed-loop operation of the Stations (i.e., the performance of the Stations if converted to closed-loop operation). The PEPSE model allows for the calculation of system outputs and operational conditions as a direct function of various system inputs. Because these system outputs are fixed, the PEPSE model is limited to the unidirectional calculation of operational conditions via system input. To evaluate performance in the full range of operating conditions, the net thermal input (MWt) for the system was iterated over a series of CW inlet temperatures to find the closest parameters and linearly interpolate between them to calculate the system output and operational conditions (i.e., net power generated (MWe), hotwell temperatures (°F)/condenser backpressures (in-Hg) for each main condenser shell, and the condenser output temperatures (°F)). Overall, the CW inlet temperature for each hour is input across a set of data spreadsheets, which in turn allows for the calculation of the limiting operational parameters.
As the operation of cooling towers is driven primarily by ambient environmental temperatures, seasonal and daylight conditions have a significant impact on IPEC closed-loop operation (see Attachment 4, Sections 4 and 5). The average closed-loop cooling operational losses on a yearly basis, including the monthly operational power losses that would be incurred at each Unit, are provided in Attachment 4, Section 3. Table 3.1 presents the average continuous power generation losses that would be incurred at each Unit if the Stations were to be converted to closed-loop cooling. Since closed loop power loss is the difference in power generation from once-through to closed-loop cooling, the

CONVERSION OF INDIAN POINT UNITS 2 & 3 TO A CLOSED-LOOP COOLING WATER CONFIGURATION
19
months with the highest average power loss, May and June, are those with the largest River water to ambient wet-bulb temperature differential.
Table 3.1 Unit 2 and Unit 3 Average Continuous Closed-Loop Cooling Power Generation Losses
Month
Power Loss (MWe)
Unit 2 Unit 3
January 5.7 0.1
February 5.3 0.1
March 8.2 0.2
April 15.8 3.2
May 20.8 9.4
June 19.3 13.6
July 9.8 8.5
August 6.2 5.6
September 7.6 6.0
October 12.2 6.1
November 14.1 3.4
December 7.9 0.4
Average Annual 11.1 4.7
As shown in Table 3.1, the overall effect of a closed-loop conversion on plant operation, examined using the IPEC PEPSE models would be an average continuous loss in power generation of approximately 11.1 MWe and 4.7 MWe at Units 2 and 3, respectively (15.8 MWe, total); however, power loss would vary both seasonally and intraday, dependent on the difference between River water and ambient wet-bulb temperature. Over the historical data analyzed (2001-2008), the peak combined operational power loss of 85.4 MWe occurred on June 7th, 2008 at 2PM, when electricity demand was at its highest.
3.2.2.2 Parasitic Losses
In addition to the operational losses, the new cooling towers and equipment would require an appreciable amount of power to operate (i.e., parasitic losses) which would effectively reduce each Unit’s output power. The cooling towers selected for closed-loop operation of the Stations are round hybrid cooling towers, designed with noise and plume abatement features. In particular, round hybrid cooling towers require significant additional electrical loads since they utilize two fans per cell to draw air in through both the wet and dry sections of the cooling tower.
Also, the new circulating water pumps for closed-cycle cooling would require more power than the existing circulating water pumps. The additional power required over the

CONVERSION OF INDIAN POINT UNITS 2 & 3 TO A CLOSED-LOOP COOLING WATER CONFIGURATION
20
existing circulating water pump requirements would be another parasitic loss associated with conversion to closed-loop cooling.
The parasitic losses associated with each component of closed-loop cooling would be as follows:
Cooling Towers (26.5 MWe per Unit)
o 44 wet fans (300 HP)
o 44 dry fans (350 HP)
o 4 booster pumps (61,250 gpm at 26 ft)
Additional Circulating Water Pump Load (9.6 MWe per Unit)
o 6 circulating water pumps (117,000 gpm at 72 ft)
Summing the additional parasitic losses from the circulating water pumps and the cooling tower fans and booster pumps would be approximately 36.1 MWe per Unit, or a combined parasitic loss of 72.2 MWe. Whenever a Unit would be online, these parasitic losses would continually draw from the net generating electricity.
3.2.2.3 Electrical Distribution Effects
Using the Electrical Transient Analyzer Program (ETAP) software, Attachment 5 provides a model of the anticipated electrical distribution system required to support the conversion of Units 2 and 3 to closed-loop operation. This analysis accounts for the expected electrical parasitic losses due to the new components required for closed loop operation at both Unit 2 and Unit 3 to determine if extensive improvement to the electrical distribution system would be required.
Reviewing the one line diagrams of this study, the available fault current at the Buchanan 138kV switchyard bus by the IPEC grid contribution is 16.73 kA . The additional loads added by conversion to closed-loop cooling would increase this available fault current by 1.75kA, or approximately 10%. Per discussions with site personnel, the Buchanan 138kV switchyard bus has a capacity rating in the order of 60kA, supplying significant margin against a short-circuit event. Due to the magnitude of this margin, and due to the relatively small increase of load, no modifications to the switchyard would be expected by conversion of IPEC to closed-loop cooling; however, additional electrical distribution analysis and consideration of the available protective devices ratings would be required in the detailed design phase to competely ensure adequate margin is present. Conversion of Unit 2 or Unit 3 individually to closed-loop cooling would impact the electrical distribution system to a lesser degree then conversion of both Units, and as such this analysis is bounding for each individual conversion scenario. Additional details on the electrical analysis conducted are included in Attachment 5.

CONVERSION OF INDIAN POINT UNITS 2 & 3 TO A CLOSED-LOOP COOLING WATER CONFIGURATION
21
4 Algonquin Pipeline Relocation Due to physical site constraints and water flow requirements, the Unit 3 cooling tower must be located on the southwest portion of the IPEC site, as discussed in Section 2.1 and shown in Attachment 2 Sketch ENTGNU011-SK-001. However, a portion of this location overlaps the existing right-of-way (ROW) for the Algonquin Gas Transmission (Algonquin) pipelines. In order to accommodate excavation and construction of a cooling tower for Unit 3, the existing pipelines would have to be relocated within the IPEC site, pursuant to the terms of the pipeline easement. Spectra Energy Transmission, LLC (Spectra), owner and operator of the Algonquin pipelines, has preliminarily evaluated the feasibility of the required relocation (Attachment 6). The preliminary timeline for relocating the pipelines is approximately 24 months and the estimated cost is approximately $13.8 million, with an accuracy level of (-)25% to (+)40%. The feasibility evaluation considers design, permitting, material, labor, and construction, but does not include the cost and schedule of spoils removal, which would significantly increase the estimated cost provided by Spectra.
4.1 Pipeline Configuration
The regional interstate Algonquin pipeline system transports natural gas from New Jersey and southeastern New England to major markets in New England, including Boston, Hartford, and Providence [Ref. 12.27]. The Algonquin pipelines transport 2.5 billion cubic feet of gas per day to serve approximately fifty percent of the natural gas demand in New England (Attachment 6). Algonquin serves as a major artery through the northeast portion of the United States, connecting to Spectra’s Texas Eastern Transmission and Maritimes & Northeast Pipeline.
Currently, the Algonquin Pipeline system crosses the Hudson River next to IPEC. Due to the significant level of service provided by Algonquin to the region, Spectra has advised that the Hudson River crossing is considered a critical site and the throughput of the pipeline facilities at this location cannot be interrupted. The Algonquin facilities crossing the IPEC site are comprised of two gas pipelines running east to west through the IPEC site on a 65 foot wide ROW. At the southwest property boundary, a third pipeline is tied into the two other pipelines along with valving and internal inspection facilities for all three pipelines. The valve site area is near the Hudson River bank, within the excavation area of the Unit 3 cooling tower. The connection piping is visible above ground, as shown in Figure 4.1. The ROW expands significantly at the valve site to accommodate the additional piping and equipment. The existing Algonquin pipeline ROW is shown by solid white lines in Figure 4.1. The proposed location for the Unit 3 cooling tower is shown by a dotted white oval. The excavation required for construction of the cooling towers would extend approximately 150 ft beyond the dotted oval, to create the 700 ft diameter clearing around the tower and gradual slope from the clearing to the existing grade.

CONVERSION OF INDIAN POINT UNITS 2 & 3 TO A CLOSED-LOOP COOLING WATER CONFIGURATION
22
Figure 4.1 Existing Algonquin Gas Transmission Pipeline Right-Of-Way, With Proposed Unit 3 Cooling Tower Location Shown by Dotted Line
4.2 Feasibility of Relocation
In order to construct the Unit 3 cooling tower configuration shown in Attachment 2, the Algonquin pipeline would have to be relocated. Spectra has provided an evaluation of the required pipeline relocation and proposed that pipeline be rerouted around the Unit 3 cooling tower excavation area, as shown in Attachment 2 ENTGNU011-SK-001 (Attachment 6). The lack of available space between the cooling tower excavation area and the Hudson River bank would require relocation of the valve site and an extension of the third pipeline. The valve site would be relocated along the existing pipeline to the area adjacent to the Broadway roadway. An extension of the third pipeline would be installed running parallel to the existing pipelines across the IPEC site. At the Unit 3 cooling tower excavation location, all three pipelines would be rerouted around the cooling tower to tie into the existing Hudson River crossing. The existing 65 ft wide ROW would need to expand to 100 ft wide to accommodate the extension of the third pipeline. During blast excavation at the Unit 3 cooling tower location, the required blasting offset (50 ft) from the nearest relocated pipeline would prohibit blasting within 15 ft of the expanded 100 ft ROW. The Unit 3 cooling tower location has moved in a northerly direction from the original location considered in the 2003 Report (Attachment 1) to accommodate the expanded ROW and blasting offset proposed by Spectra. The revised Unit 3 cooling tower location is shown in this Report (Attachment 2) and is the basis for all excavation discussions in this Report (e.g., Sections 5 and 6).

CONVERSION OF INDIAN POINT UNITS 2 & 3 TO A CLOSED-LOOP COOLING WATER CONFIGURATION
23
The Algonquin Pipeline System is one of the largest interstate pipelines in the United States [Ref. 12.23]. As such, it is regulated by the Federal Energy Regulatory Commission (FERC). Any relocation of the Algonquin pipeline would require the prior approval of the FERC, a process which could take a year or more [Ref. 12.19]. If FERC approval could not be obtained, the feasibility of closed-loop cooling for Unit 3 would be in jeopardy, as site real estate constraints preclude alternate cooling tower sites.
4.3 Spectra Schedule and Cost Impacts
Siting of the Unit 3 cooling tower requires relocation of the Algonquin pipeline facilities, which must be approved by FERC. A preliminary timeline and feasibility cost estimate for the relocation is provided by Spectra in Attachment 6.
Spectra’s preliminary timeline, shown in Table 4.1, was developed absent any detailed field work, facility design, or agency consultation and without any detailed construction coordination concerns. This timeline should therefore be considered a high level overview of the time required to relocate the pipeline facilities and may be understated. The relocated pipeline facilities would need to be constructed in a staged manner to allow tied-in to existing facilities during the months of June through September, when the typical system demands may allow for an approximate 7 day outage for each relocated pipeline to be tied-in and connected. By scheduling the tie-in during the summer months and in conjunction with any other planned system outages, there may be little to no impact to the services of Algonquin’s customers (Attachment 6).
Table 4.1 Spectra’s Preliminary Timeline for Algonquin Pipeline Relocation
Activity Duration Notes
Preliminary field work 2 months
Facility design 4 months
Permitting 14 months Includes preparations of applications to FERC and New York State
Construction 4 months
In-Service 21 days 7 day outage to tie-in each pipeline (in sequence) must occur between June and September
Total 24 months Assumes 3 week tie-in occurs during planned system outages
The feasibility cost estimate provided by Spectra for the relocation of the pipeline facilities is approximately $13.8 million, with an accuracy level of (-) 25% to (+) 40% (Attachment 6). The feasibility estimate considers design, permitting, material, labor, and construction costs. Of note, the cost of spoils disposal is not included; therefore, the spoils generated by the pipeline relocation are included in considerations of the total spoils that would be generated by the conversion of IPEC to closed-loop cooling (Section 6).
The pipeline would have additional schedule and cost impacts on the conversion project as a whole. FERC approval for the pipeline relocation must be obtained before substantial design

CONVERSION OF INDIAN POINT UNITS 2 & 3 TO A CLOSED-LOOP COOLING WATER CONFIGURATION
24
work for conversion of Unit 3 to closed-loop cooling would be undertaken, and the installation of the relocated pipeline would have to be complete before blast excavation could begin at the Unit 3 tower location. Each consideration would delay the overall schedule for both Units due to the combined outage at the end of the conversion. In addition, due to the significant amount and duration of blast removal, Spectra would require field personnel and experts to monitor the relocated pipeline facilities throughout the construction period (Attachment 6). The cost of pipeline monitoring would be estimated by Spectra after evaluation of the blasting plan and construction schedule, and is not currently included.
CONVERSION OF INDIAN POINT UNITS 2 & 3 TO A CLOSED-LOOP COOLING WATER CONFIGURATION
25
5 Blasting Conversion of the Stations to closed-loop condenser cooling would require the excavation of approximately 2 million cubic yards of soil and inwood marble bedrock. Blast removal would be required to excavate large quantities of bedrock at the cooling tower locations and in the piping trenches outside of the Riverfront area. The feasibility, cost, and schedule of blast removal have been evaluated by Dr. Calvin J. Konya, a nationally recognized blasting consultant. Dr. Konya’s report is included as Attachment 7, which updates the original analysis for the 2003 Report (Attachment 1). Dr. Konya’s report describes the costs and duration associated with significant aspects of blast removal at IPEC, emphasizing the impact of site-specific vibration limits on blasting operations. Dr. Konya’s cost estimate for drilling and blasting, excluding removal and disposal of spoils, is over $40 million. The drilling and blast removal would be expected to take approximately 4 years.
5.1 Restrictions to Blasting at IPEC
Blast removal at IPEC would be limited by proximity to Units 2 and 3, the Algonquin pipeline, and the Village of Buchanan. The respective vibration limitations imposed by these site-specific considerations were reviewed and incorporated into the blasting plan described in Attachment 7.
5.1.1 Onsite Blasting Restrictions
As discussed in Section 5.2, blasting excavation would be required for a period of 4 years, and blasting operations are proposed to occur while both Units are online. In addition, the continued operation of the relocated Algonquin pipeline, discussed in Section 4, would be required. Therefore, blasting limitations were determined that would allow and ensure the continued operation of Unit 2, Unit 3, and the relocated Algonquin pipeline.
Each Unit is designed to withstand an earthquake of Modified Mercalli Intensity VII, which corresponds to a maximum horizontal acceleration of approximately 0.15 g [Ref. 12.17; Ref. 12.18]. The seismic monitoring equipment, located in the Unit 3 containment building, is designed to detect ground motion approaching or exceeding this facility design basis. The equipment is triggered by a horizontal acceleration of ≥0.01g to record the magnitude, duration, frequency and direction of seismic events. Initiation of the seismic monitoring equipment is one of the entry conditions for the seismic event procedure, which requires the immediate inspection of various systems, structures, and components at both units. In addition, an engineering evaluation of the impact of the seismic event on the plant must be completed and the seismic instrumentation must be recalibrated. When a horizontal acceleration of ≥0.1 g is detected, an alarm in the Control Room initiates an abnormal operating procedure which could lead to shutdown of the reactors.
The maximum horizontal acceleration of ground motion due to blasting is therefore limited to 0.1 g, as measured at the containment structure. The 0.1 g acceleration limit translates to a vibration limit of 0.104 inch/sec due to the high frequencies of blasting compared to the frequencies of earthquakes. Small diameter blastholes and a tightly-spaced blasthole pattern would be used to meet this limit, as discussed in Attachment 7. At the edges of excavation closest to the containment buildings, additional vibration control would be

CONVERSION OF INDIAN POINT UNITS 2 & 3 TO A CLOSED-LOOP COOLING WATER CONFIGURATION
26
implemented by deck loading the blastholes. Deck loading allows several charges in one blasthole to be fired independently on millisecond delays, thereby reducing the ground vibrations resulting from the blast.
As discussed in Section 4, the Algonquin pipelines cross the IPEC site to the south of Unit 3. Spectra, owner and operator of the Algonquin pipelines, has proposed an allowable blasting offset of 50 ft as part of a preliminary relocation plan (Attachment 6). Spectra Guideline TG-111 specifies a calculation to determine a maximum allowable charge weight based on distance from the pipelines. At the edge of the proposed blasting offset, 50 feet from the relocated pipeline, the maximum allowable charge weight would be greater than the charge weight specified in the blasting plan to meet the 0.1g horizontal acceleration limit at the containment building. Therefore, the blasting techniques that would be used to protect the Unit 3 facilities would satisfy Spectra’s criteria as well, after relocation of the pipeline. Spectra would also require field personnel and experts to monitor the relocated pipeline facilities throughout the construction period (Attachment 6).
A thorough analysis of the impact of blasting vibration on specific Unit components and the relocated pipelines would be required to finalize blasting procedures. This analysis would require testing of individual components to determine appropriate vibration limits. Additionally, impact of vibration on construction activities would need to be determined, as cooling tower construction for Unit 2 would likely begin before blasting excavation ended at the Unit 3 cooling tower site. Each of these blasting considerations would be affected by the site-specific ground conditions, which would need to be determined by on-site ground calibration (Attachment 7).
IPEC personnel may experience noticeable vibration from blasting, e.g., loose objects around the site may rattle. There is a slight potential that these effects could also be experienced off-site near the Unit 3 tower excavation. The distance from the excavation to the nearest residential areas would be approximately 1000 ft; therefore, no noticeable blasting effects would be expected in these locations.
5.1.2 Code of the Village of Buchanan - Quarrying and Blasting
IPEC is located in the Village of Buchanan, New York. The Village of Buchanan designates acceptable hours for blasting operations, and controls the degree of velocity and displacement of vibrations during those hours when blasting is authorized [Ref. 12.5]. Blasting is not permitted in the incorporated portion of the Village of Buchanan except between the hours of 8:00 a.m. and 7:00 p.m., excluding Saturdays, Sundays, and public holidays when blasting is not permitted at any time. In compliance with regulated blasting industry standards, blasting operations would also only be conducted in daylight; thus, blasting operations would end at dusk or 7:00 p.m., whichever is earlier.
During the hours when blasting is permitted, peak particle velocity and overpressure produced by any blast measured at the closest structure or building not owned or used by the entity conducting the blast may not exceed 0.75 inch/sec for frequencies less than 40 Hz or 2.0 inch/sec for frequencies of 40 Hz or more. In addition, air pressure levels emanating from such blasts may not exceed 131 dB for a high pass filter of 0.1 Hz, 128 dB for a high pass filter of 2 Hz, or 125 dB for a high pass filter of 6 Hz. The blasting plan

CONVERSION OF INDIAN POINT UNITS 2 & 3 TO A CLOSED-LOOP COOLING WATER CONFIGURATION
27
formulated by Dr. Konya was designed to comply with these Village of Buchanan restrictions.
5.1.3 Code of the Village of Buchanan - Soil Disturbances and Excavations
Entergy’s counsel has advised that construction of the NYSDEC Proposed Project will require a soil and excavation permit from the Village of Buchanan. Section 159 of the Code states that an application must be submitted and a permit must be obtained from the Village Building Inspector prior to any excavation. The Inspector may issue the permit only after review and approval by the Village Planning Board. The application must demonstrate that the work will not cause, among other things, substantial traffic hazards. Also, the application must show that the period of time and the methods for the completion of the work are reasonable. Section 159 provides for 2 year excavation permits. Permits may also contain restrictions on the excavation, such as a limitation on the hours of authorized operations.
With respect to traffic hazards, and as noted in the discussion of blasting spoils removal in Section 6, blasting operations alone would produce between 364 and 518 truck loads per day (using 20-cy trucks). As discussed in Section 5.2, blasting and excavation could take as long as 4 years. These factors will be considered under Section 159 of the Code. Section 159 also requires a certificate of insurance, establishing the extent of liability of the applicant or contractor. Inquiries regarding insurance for the NYSDEC Proposed Project have received limited response and it may be difficult to obtain coverage for all associated risks, especially nuclear incident risks (Attachment 7, Section 3). Thus, permitting is not assured.
5.2 Cost and Schedule Impacts
The cost and duration of significant aspects of blast removal at IPEC are estimated in Dr. Konya’s report (Attachment 7).
Blast removal duration would be primarily limited by the time necessary to drill the blastholes. All blastholes drilled in one day could be prepared, loaded, and fired in approximately 15 minutes at the end of the shift. Therefore, the maximum number of drills that could be efficiently used would control the project duration. Using typical drilling rates for the type of bedrock at IPEC, Dr. Konya estimates that 2078 10-hour days of drilling would be required to complete the project. The blasting plan calls for 10 drills to be used, reducing the overall project duration to 208 days of drilling. Assuming a typical 85% equipment availability, the drill days required would increase to 245 days. Based on actual blasting experience in the New York area, Dr. Konya estimates that drilling could only be conducted the equivalent of 150 10-hour days per year due to weather shutdowns, equipment delays, blasting delays, and shorter drilling and blasting hours in spring and fall due to reduced daylight hours. Under typical commercial operating conditions, the blasting would take approximately 1.6 years (see Attachment 7). However, at an operating nuclear site, the duration would necessarily increase to accommodate the various policies, procedures, and work practices dictated by industrial safety, nuclear safety, security, and other relevant site programs. Due to these additional considerations particular to the nuclear industry, the

CONVERSION OF INDIAN POINT UNITS 2 & 3 TO A CLOSED-LOOP COOLING WATER CONFIGURATION
28
duration would be expected to be approximately 2.5 times longer than a comparable commercial operation, resulting in an expected duration of approximately 4 years.
Cost estimates for the significant aspects of blast removal at IPEC are based on the typical rates for similarly complex jobs and industry quotations. The overall cost estimate for blast excavation for conversion of both Unit 2 and Unit 3 to closed-loop cooling is detailed in Table 5.1. Blasting costs are estimated to be over $40 million, not including removal and disposal of the spoils (contaminated or clean) generated by blasting. The removal and disposal of all spoils generated by the conversion of IPEC to closed-loop cooling are discussed in Section 6.
Table 5.1 Blast Removal Cost Estimate for Conversion of Both Units
Total Units Rate [/Unit] Cost
Cooling Towers 1,796,000 yd3 $15 $26,940,000
Trenches 94,600 yd3 $58 $5,487,000
Presplitting 61,080 yd2 $85 $5,192,000
Blasting Consultant 800 days $2000 $1,600,000 Seismic Monitoring 34 months $26140 $889,000
Total $40,108,000
5.3 Blasting Outage Timing
In order to avoid a prolonged forced construction outage at each Unit, blasting operations would occur with both Units online, as discussed in Section 5.1.1.
Moreover, if blasting operations are able to be coordinated to overlap with scheduled outages, the cost of blasting could be marginally reduced. Per Attachment 7, a potential cost savings of approximately 5% could be realized during the outage duration by avoiding the need for deck loading in the blastholes near Unit 3. However, deck loading would still be required in blastholes near the Algonquin pipeline. Blasting during scheduled outages would not impact the total number of blastholes required or the presplitting costs. The blasting project duration would not be impacted by overlap with scheduled outages; only the cost of blasting in proximity of Unit 3 during an outage would be impacted.
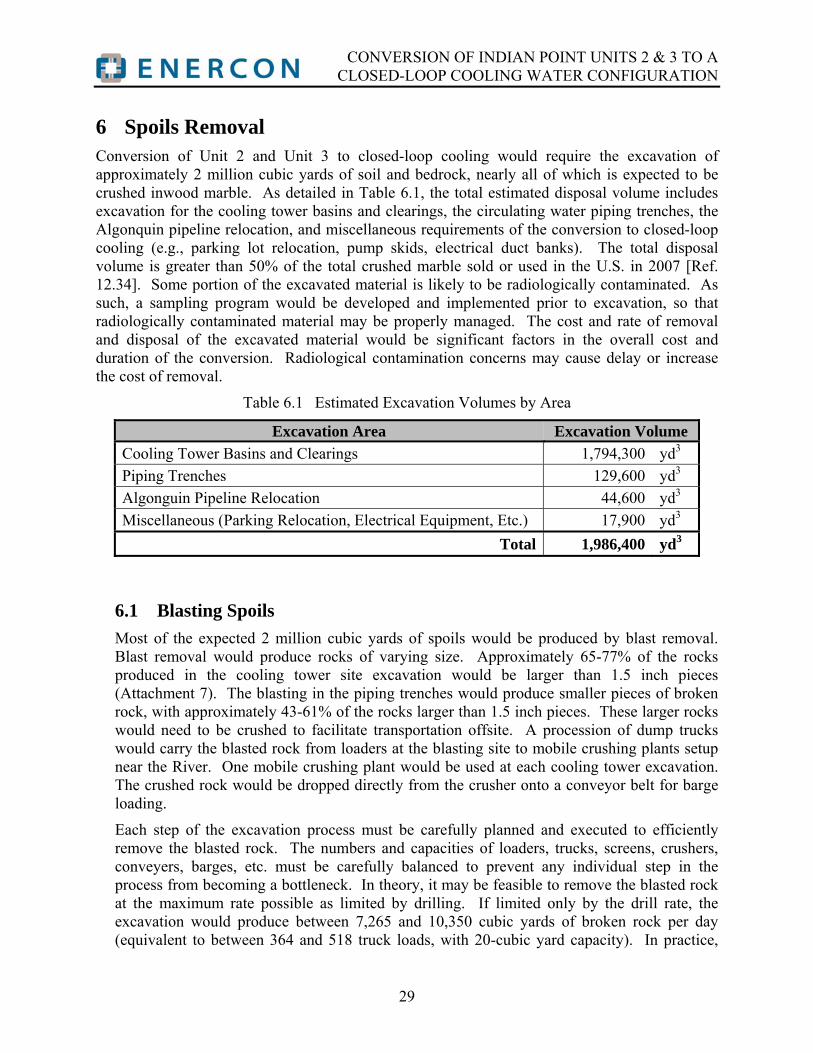
CONVERSION OF INDIAN POINT UNITS 2 & 3 TO A CLOSED-LOOP COOLING WATER CONFIGURATION
29
6 Spoils Removal Conversion of Unit 2 and Unit 3 to closed-loop cooling would require the excavation of approximately 2 million cubic yards of soil and bedrock, nearly all of which is expected to be crushed inwood marble. As detailed in Table 6.1, the total estimated disposal volume includes excavation for the cooling tower basins and clearings, the circulating water piping trenches, the Algonquin pipeline relocation, and miscellaneous requirements of the conversion to closed-loop cooling (e.g., parking lot relocation, pump skids, electrical duct banks). The total disposal volume is greater than 50% of the total crushed marble sold or used in the U.S. in 2007 [Ref. 12.34]. Some portion of the excavated material is likely to be radiologically contaminated. As such, a sampling program would be developed and implemented prior to excavation, so that radiologically contaminated material may be properly managed. The cost and rate of removal and disposal of the excavated material would be significant factors in the overall cost and duration of the conversion. Radiological contamination concerns may cause delay or increase the cost of removal.
Table 6.1 Estimated Excavation Volumes by Area
Excavation Area Excavation Volume
Cooling Tower Basins and Clearings 1,794,300 yd3
Piping Trenches 129,600 yd3
Algonguin Pipeline Relocation 44,600 yd3
Miscellaneous (Parking Relocation, Electrical Equipment, Etc.) 17,900 yd3
Total 1,986,400 yd3
6.1 Blasting Spoils
Most of the expected 2 million cubic yards of spoils would be produced by blast removal. Blast removal would produce rocks of varying size. Approximately 65-77% of the rocks produced in the cooling tower site excavation would be larger than 1.5 inch pieces (Attachment 7). The blasting in the piping trenches would produce smaller pieces of broken rock, with approximately 43-61% of the rocks larger than 1.5 inch pieces. These larger rocks would need to be crushed to facilitate transportation offsite. A procession of dump trucks would carry the blasted rock from loaders at the blasting site to mobile crushing plants setup near the River. One mobile crushing plant would be used at each cooling tower excavation. The crushed rock would be dropped directly from the crusher onto a conveyor belt for barge loading.
Each step of the excavation process must be carefully planned and executed to efficiently remove the blasted rock. The numbers and capacities of loaders, trucks, screens, crushers, conveyers, barges, etc. must be carefully balanced to prevent any individual step in the process from becoming a bottleneck. In theory, it may be feasible to remove the blasted rock at the maximum rate possible as limited by drilling. If limited only by the drill rate, the excavation would produce between 7,265 and 10,350 cubic yards of broken rock per day (equivalent to between 364 and 518 truck loads, with 20-cubic yard capacity). In practice,

CONVERSION OF INDIAN POINT UNITS 2 & 3 TO A CLOSED-LOOP COOLING WATER CONFIGURATION
30
well coordinated efforts would be required to remove, process, and dispose of this expected quantity of material. Significant schedule delays could be introduced by any inefficiency in the rock removal operation.
Due to the large scale of the excavation, counsel for Entergy advises that crushing operations may be viewed by the Village of Buchanan as a primary use of the IPEC property that is prohibited by the Zoning Code, as discussed in Section 8.3.1.
6.2 Contamination of Spoils
Historical site assessments and groundwater sampling at IPEC, including that performed by GZA, have indicated that groundwater is radiologically contaminated in some areas of the site, primarily with strontium-90 and tritium [Ref. 12.14] (Attachment 3). A Long Term Groundwater Monitoring Program (LTMP) has been implemented at IPEC to characterize and monitor the extent of subsurface contamination. The results of the program have indicated relatively stable groundwater contamination plumes and a decreasing trend in radionuclide levels [Ref. 12.13]. GZA’s groundwater contamination plume models indicate localized contamination near Units 1 and 2 that ultimately discharges to the Hudson River, as shown in Figures 1 and 2 of Attachment 3. GZA has advised that all spoils excavated from within the plume boundaries would likely be contaminated. Therefore, the volume of contaminated spoils that would be generated is expected to be at least 6350 cubic yards. As shown in Section 6.5, contamination would increase the cost of spoils disposal.
Additional sampling and radiological testing would be required to determine the quantities and locations of contaminated soil. The sampling program would cover areas that could potentially be contaminated, consistent with GZA’s recommendations. The blasting/excavation schedule would allow workers sufficient time to monitor blasted rock.
6.3 On-Site Relocation of Spoils
A limited portion of the excavation spoils may theoretically be reused or stored onsite. However, the expected 2 million cubic yards of excavated spoils would greatly exceed IPEC’s storage capacity. As such, most of the material would need to be removed. In addition, the only available area onsite for spoils storage would be the eastern hardwood forest habitat to the northeast of the Unit 2 cooling tower location. The potential impact on the local terrestrial ecology (which includes potential endangered species habit [Ref. 12.11]) would likely preclude spoils storage in that area. Due to these considerations and constraints, it has been assumed that spoils would not be relocated onsite.
6.4 Off-Site Relocation of Spoils
The entire 2 million cubic yards of excavated spoils are assumed to require off-site relocation, due to the constraints discussed in Section 6.3. Two separate methods of disposal would be required, respectively, for contaminated and clean spoils.
6.4.1 Radiologically Contaminated Spoils
Any detection of radiological contamination above a defined minimum detectable concentration would require the excavated spoils to be properly disposed of as radioactive

CONVERSION OF INDIAN POINT UNITS 2 & 3 TO A CLOSED-LOOP COOLING WATER CONFIGURATION
31
waste. Contaminated spoils would be classified as directed by 10 CFR 61.55, based the types and quantities of radionuclides present. Class A wastes may have a maximum tritium concentration of 40 curies/m3, or a maximum strontium concentration of 0.04 curies/m3 [Ref. 12.3]. If both tritium and strontium contamination are present, the maximum concentration of both radionuclides is determined by the sum of fractions rule, as described in 10 CFR 61.55. The sum of fractions rule significantly reduces the maximum concentration allowed of both (or either) radionuclide.
NRC regulations stipulate that nuclear facilities may only dispose of licensed nuclear materials offsite by transfer to an authorized recipient, in this case a licensed disposal facility [Ref. 12.1]. Currently, there are three commercial low-level waste (LLW) disposal sites in the United States. Only one of these sites would accept waste from Indian Point: EnergySolutions Clive Operations (Clive), located in Clive, Utah. Clive is licensed by the State of Utah to accept Class A waste, and accepts waste from all regions of the United States [Ref. 12.22].
In addition to meeting the concentration limits listed in 10 CFR 61.55, Class A waste must be packaged according to 10 CFR 61.56. The processing, packaging, and final disposal of contaminated spoils would be conducted by specialists in radioactive waste handling and processing. In processing, contaminated materials would be identified and separated to minimize disposal volumes and reduce the cost of regulated and licensed disposal. Contaminated materials would likely be transported by truck to the processing facility.
6.4.2 Clean Spoils
Potential options for the off-site disposal of clean spoils include sale as a commodity, use as fill material, or artificial reef building projects. Site geologic studies indicate that most of the spoils would be inwood marble, a crystalline metamorphic rock “made from” limestone with considerable heat and pressure [Ref. 12.14]. Crushed stone is a major basic raw material for the construction industry. If clean inwood marble generated by excavation could be crushed onsite and sold as a crushed stone commodity, a portion of the cost of disposal could be recovered.
If the clean spoils are not suitable for sale as a crushed stone commodity, another potential option for disposal is use as backfill for mine reclamation. In 1975, New York State enacted the Mined Land Reclamation law to ensure the environmentally sound, economic development of New York's mineral resources and the return of affected land to productive use for current and future generations. The law requires each regulated mining operation to develop an approved reclamation plan that provides for return to productive use.
Donation of the crushed rock to artificial reef projects off the coasts of New Jersey and New York was considered as another potential method of disposal. The permitting process for this method of disposal would likely represent significant additional cost of disposal and may introduce schedule delays. Therefore, other options of disposal for the clean spoils would likely be preferred.
For each of the clean spoils disposal options considered, spoils would likely be removed from IPEC by barge. Transportation of the spoils by barge would be approximately half as
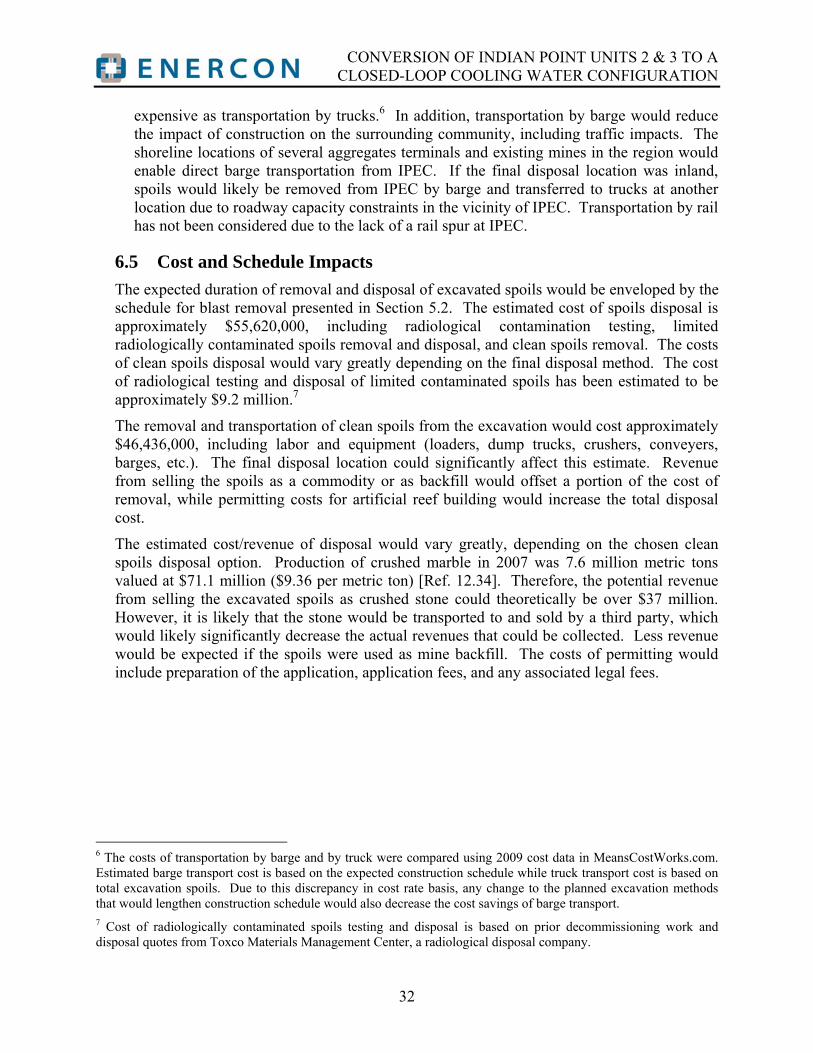
CONVERSION OF INDIAN POINT UNITS 2 & 3 TO A CLOSED-LOOP COOLING WATER CONFIGURATION
32
expensive as transportation by trucks.6 In addition, transportation by barge would reduce the impact of construction on the surrounding community, including traffic impacts. The shoreline locations of several aggregates terminals and existing mines in the region would enable direct barge transportation from IPEC. If the final disposal location was inland, spoils would likely be removed from IPEC by barge and transferred to trucks at another location due to roadway capacity constraints in the vicinity of IPEC. Transportation by rail has not been considered due to the lack of a rail spur at IPEC.
6.5 Cost and Schedule Impacts
The expected duration of removal and disposal of excavated spoils would be enveloped by the schedule for blast removal presented in Section 5.2. The estimated cost of spoils disposal is approximately $55,620,000, including radiological contamination testing, limited radiologically contaminated spoils removal and disposal, and clean spoils removal. The costs of clean spoils disposal would vary greatly depending on the final disposal method. The cost of radiological testing and disposal of limited contaminated spoils has been estimated to be approximately $9.2 million.7
The removal and transportation of clean spoils from the excavation would cost approximately $46,436,000, including labor and equipment (loaders, dump trucks, crushers, conveyers, barges, etc.). The final disposal location could significantly affect this estimate. Revenue from selling the spoils as a commodity or as backfill would offset a portion of the cost of removal, while permitting costs for artificial reef building would increase the total disposal cost.
The estimated cost/revenue of disposal would vary greatly, depending on the chosen clean spoils disposal option. Production of crushed marble in 2007 was 7.6 million metric tons valued at $71.1 million ($9.36 per metric ton) [Ref. 12.34]. Therefore, the potential revenue from selling the excavated spoils as crushed stone could theoretically be over $37 million. However, it is likely that the stone would be transported to and sold by a third party, which would likely significantly decrease the actual revenues that could be collected. Less revenue would be expected if the spoils were used as mine backfill. The costs of permitting would include preparation of the application, application fees, and any associated legal fees.
6 The costs of transportation by barge and by truck were compared using 2009 cost data in MeansCostWorks.com. Estimated barge transport cost is based on the expected construction schedule while truck transport cost is based on total excavation spoils. Due to this discrepancy in cost rate basis, any change to the planned excavation methods that would lengthen construction schedule would also decrease the cost savings of barge transport. 7 Cost of radiologically contaminated spoils testing and disposal is based on prior decommissioning work and disposal quotes from Toxco Materials Management Center, a radiological disposal company.

CONVERSION OF INDIAN POINT UNITS 2 & 3 TO A CLOSED-LOOP COOLING WATER CONFIGURATION
33
7 Cooling Tower Operation / Plume Emissions The operation of the two hybrid cooling towers selected is described in detail in the 2003 Report (Attachment 1); however, several specific concerns are discussed in further detail below.
7.1 Water Consumption
Conversion of Unit 2 and Unit 3 to closed-loop cooling would significantly reduce the water intake currently required by each Unit. However, a continuous supply of water would still be withdrawn from the Hudson River for evaporative cooling tower operation, and 75% of the water withdrawn would be consumed. In terms of water consumption, closed-loop cooling systems have substantially more potential environmental impacts than once-through systems [Ref. 12.21].
Evaporation and drift from the cooling towers would represent a significant loss of circulating water that would have to be replenished. Unlike with the current once-through cooling, the water lost through evaporation and drift would not be returned directly to the Hudson River and would represent a true loss of River water. Typically, evaporating water leaves a cooling tower as a pure vapor, increasing the concentration of total dissolved solids (TDS) in the circulating water. Local air quality also contributes to circulating water quality degradation, as the air is effectively washed by the water in the tower (i.e., the cascading water in the cooling tower acts as a scrubber that removes particulates from the atmosphere and concentrates them in the circulating water). To maintain the required water quality for the cooling towers sited at IPEC, a portion of the concentrated circulating water, referred to as blowdown, would be released to and replaced with water from the Hudson River. Therefore, a continuous circulating water supply of 27,440 gpm (Equation 5) would be required to make up the total losses from evaporation, drift, and blowdown. Evaporation and drift from the towers would amount to 20,594 gpm (Equation 6), or nearly 30 million gallons per day, of lost Hudson River water.
7.1.1 Hudson River Water Consumption
The brackish water from the Hudson River currently used in the Stations’ circulating water systems would also be used for the circulating water in a closed-loop system. Hudson River water analysis and flow rate data show that the plant intake is largely fresh water during times of relatively high River flow rate, and very brackish when River flows are low. As discussed above, evaporation in the cooling tower would increase the concentration of dissolved solids in the circulating water, as compared to the River water. The number of times the dissolved minerals in the circulating water are concentrated, versus the level in the River water, i.e., the cycles of concentration, is an important parameter for cooling tower operation. Since the intake water quality at IPEC varies dramatically based on Hudson River flow rate, an acceptable number of cycles of concentration would be dependent on the current intake water quality. The cooling tower circulating water salinity would be maintained at approximately 7200 ppm, or between three and five cycles, depending upon the makeup water salinity8. The higher the salt
8 Chloride concentration (salinity) data was obtained by the U.S. Geological Service for the Verplanck Station, immediately adjacent to IPEC, for the period 1969 to 1975 (Attachment 1).

CONVERSION OF INDIAN POINT UNITS 2 & 3 TO A CLOSED-LOOP COOLING WATER CONFIGURATION
34
content of the makeup water, the fewer cycles of concentration are necessary to maintain 7200 ppm dissolved solids in the circulating water. Estimated blowdown and makeup flow rates would be based on an annual average Hudson River makeup water salinity of 1800 ppm and four cycles of concentration, meaning that the concentration of total dissolved solids in the circulating water would be four times that of the incoming Hudson River water [Ref. 12.29]. To achieve an average of four cycles of concentration in implementation, an automated control system would be required to reduce makeup flow during periods of good water quality (relatively fresh water) and increase makeup flow during periods of poor water quality (brackish water).
The evaporation and drift flow rates can be calculated using the tower specifications provided by the cooling tower vendor, SPX Cooling Technologies (SPX). Evaporation can be approximated by multiplying the maximum evaporation percentage, 1.47% for summer conditions with the dry section of the cooling towers in operation (Attachment 1), by the total water flow rate (gpm). Per the cooling tower vendor, SPX, the total circulating water flow rate required by each Unit at IPEC would be 700,000 gpm. Therefore, the maximum evaporation flow rate from the cooling towers for each Unit at IPEC is estimated as follows:
gpm29010gpm700,000% 1.47% UnitnEvaporatioUnit ,QE (1)
The drift rate is calculated by multiplying the drift percentage, 0.001% in this case (Attachment 1), by the total water flow rate (gpm):
gpm 0.7gpm 000,700%001.0% UnitDriftUnit QD (2)
The required blowdown to maintain 4 cycles of concentration, C4, is estimated using the expected evaporation and drift rates [Ref. 12.28]:
gpm 423,3
3
gpm 0.73gpm 290,10
1
1
4
Unit4UnitUnit
C
DCEB (3)
The makeup flow required by each Unit for cooling tower operation at IPEC is the sum of tower water losses due to evaporation, drift, and blowdown:
gpm 720,13gpm 423,3gpm 0.7gpm 290,10UnitUnitUnitUnit BDEM (4)
Figure 7.1 provides a per Unit closed-loop flow cycle, including makeup, evaporation, drift, and blowdown flowrates.

CONVERSION OF INDIAN POINT UNITS 2 & 3 TO A CLOSED-LOOP COOLING WATER CONFIGURATION
35
Figure 7.1 IPEC per Unit Closed-Loop Flow Cycle
The total estimated makeup flow required by IPEC is double the makeup flow required by each Unit:
MGD5.39gpm 440,27gpm 720,1322 UnitTotal MM (5)
The total estimated water flow lost from the Hudson River is double the evaporation and drift flow from each Unit:
MGD7.29gpm 594,20gpm 0.7gpm290,1022 UnitTotal LL (6)
As described in Section 2.1.2.1, the closed-loop configuration considered in this Report would use service water discharge to provide makeup flow. The maximum required makeup flow, based on historical meteorological data and River conditions, would not exceed the design capacity of the Stations’ service water systems, i.e., 46,000 gpm at Unit 2 (including Unit 1 River water flow of 16,000 gpm) and 36,000 gpm at Unit 3 [Ref. 12.17, 12.18]. IPEC has a maximum design flow capacity of 886,000 gpm for Unit 2 and 876,000 for Unit 3 [Ref. 12.8]. Therefore, the closed-loop cooling reductions in intake flow from total design flow would exceed 94.8% and 95.9% for Units 2 and 3, respectively. Based on historic flow data from 2001 to 2008, flow reductions would be approximately 98.0% at Unit 2 and 97.8% at Unit 3.

CONVERSION OF INDIAN POINT UNITS 2 & 3 TO A CLOSED-LOOP COOLING WATER CONFIGURATION
36
7.1.2 Recycled Wastewater Consumption
Consideration has been given to the use of recycled wastewater as an alternative to using Hudson River water as makeup water for a closed-loop cooling system at Units 2 and 3. The use of recycled wastewater as makeup for cooling towers has been studied at coastal power plants in California (Attachment 1). Recycled wastewater can be treated to enable cooling tower operation at six cycles of concentration, meaning that the concentration of TDS in the circulating water would be six times that of the incoming recycled wastewater
The estimated evaporation and drift rates would be unaffected by the allowable cycles of concentration; therefore, the values would be identical to those calculated in Section 7.1.1:
gpm29010Unit ,E gpm 0.7Unit D
The required blowdown to maintain 6 cycles of concentration, C6, is estimated using the expected evaporation and drift rates [Ref. 12.28]:
gpm 051,2
5
gpm 0.75gpm 290,10
1
1
6
Unit6UnitUnit
C
DCEB (7)
The makeup flow required per Unit for cooling tower operation at IPEC using recycled wastewater would be the sum of tower water losses through evaporation, drift, and blowdown:
gpm 348,12gpm 051,2gpm 0.7gpm 290,10UnitUnitUnitUnit BDEM (8)
The total makeup flow required by IPEC would double the makeup flow required by each Unit:
MGD6.35gpm 696,24gpm 348,1222 UnitTotal MM (9)
The feasibility of the recycled wastewater option depends on the distance between IPEC and the nearest wastewater treatment facilities able to provide adequate makeup flow, as well as the quality of the recycled wastewater and available treatment options.
The SPDES permits, discharge flow rates, and distances from IPEC for all SPDES-permitted wastewater treatment plants (WWTPs) located in Westchester County are shown in Table 7.1. The distances from IPEC are based on either the facility address or the outfall GPS coordinates listed in the SPDES permits.
Table 7.1 SPDES Water Discharge Permit Flows
Facility (SPDES Permit)
Flow % Req’d Makeup
Flow
Driving Distance to
IPEC (approx.)
Direct Distance (approx.)
Buchanan WWTP (NY0029971)
0.5 MGD
(347.2 gpm) 1.4% <1 mi. <1 mi.
Peekskill WWTP (NY100803)
10 MGD
(6,944.4 gpm) 28.1% 4 mi. 3 mi.
Ossining WWTP (NY108324)
7 MGD (4,861.1 gpm)
19.7% 10 mi. 9 mi.
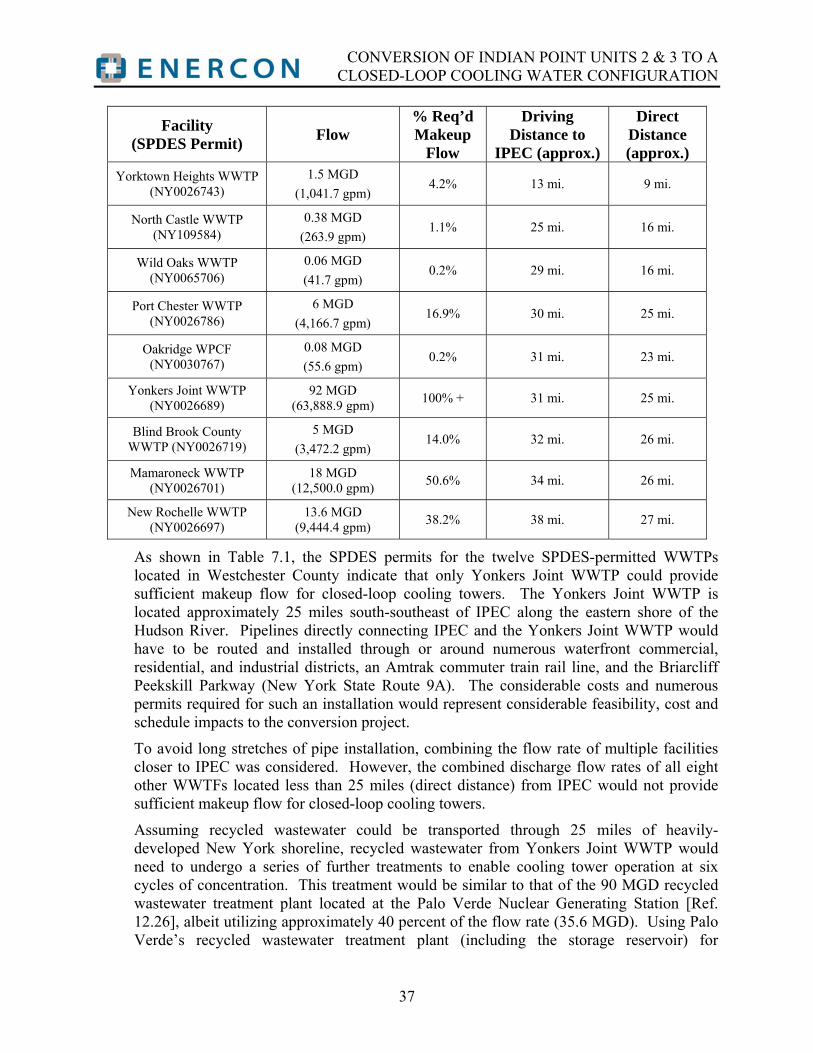
CONVERSION OF INDIAN POINT UNITS 2 & 3 TO A CLOSED-LOOP COOLING WATER CONFIGURATION
37
Facility (SPDES Permit)
Flow % Req’d Makeup
Flow
Driving Distance to
IPEC (approx.)
Direct Distance (approx.)
Yorktown Heights WWTP (NY0026743)
1.5 MGD
(1,041.7 gpm) 4.2% 13 mi. 9 mi.
North Castle WWTP (NY109584)
0.38 MGD
(263.9 gpm) 1.1% 25 mi. 16 mi.
Wild Oaks WWTP (NY0065706)
0.06 MGD
(41.7 gpm) 0.2% 29 mi. 16 mi.
Port Chester WWTP (NY0026786)
6 MGD
(4,166.7 gpm) 16.9% 30 mi. 25 mi.
Oakridge WPCF (NY0030767)
0.08 MGD
(55.6 gpm) 0.2% 31 mi. 23 mi.
Yonkers Joint WWTP (NY0026689)
92 MGD (63,888.9 gpm)
100% + 31 mi. 25 mi.
Blind Brook County WWTP (NY0026719)
5 MGD
(3,472.2 gpm) 14.0% 32 mi. 26 mi.
Mamaroneck WWTP (NY0026701)
18 MGD (12,500.0 gpm)
50.6% 34 mi. 26 mi.
New Rochelle WWTP (NY0026697)
13.6 MGD (9,444.4 gpm)
38.2% 38 mi. 27 mi.
As shown in Table 7.1, the SPDES permits for the twelve SPDES-permitted WWTPs located in Westchester County indicate that only Yonkers Joint WWTP could provide sufficient makeup flow for closed-loop cooling towers. The Yonkers Joint WWTP is located approximately 25 miles south-southeast of IPEC along the eastern shore of the Hudson River. Pipelines directly connecting IPEC and the Yonkers Joint WWTP would have to be routed and installed through or around numerous waterfront commercial, residential, and industrial districts, an Amtrak commuter train rail line, and the Briarcliff Peekskill Parkway (New York State Route 9A). The considerable costs and numerous permits required for such an installation would represent considerable feasibility, cost and schedule impacts to the conversion project.
To avoid long stretches of pipe installation, combining the flow rate of multiple facilities closer to IPEC was considered. However, the combined discharge flow rates of all eight other WWTFs located less than 25 miles (direct distance) from IPEC would not provide sufficient makeup flow for closed-loop cooling towers.
Assuming recycled wastewater could be transported through 25 miles of heavily-developed New York shoreline, recycled wastewater from Yonkers Joint WWTP would need to undergo a series of further treatments to enable cooling tower operation at six cycles of concentration. This treatment would be similar to that of the 90 MGD recycled wastewater treatment plant located at the Palo Verde Nuclear Generating Station [Ref. 12.26], albeit utilizing approximately 40 percent of the flow rate (35.6 MGD). Using Palo Verde’s recycled wastewater treatment plant (including the storage reservoir) for

CONVERSION OF INDIAN POINT UNITS 2 & 3 TO A CLOSED-LOOP COOLING WATER CONFIGURATION
38
comparison, if recycled wastewater from Yonkers Joint WWTP was utilized, the water treatment system required by the Stations would occupy approximately 16 acres. Construction of a recycled wastewater treatment plant of this size would further increase the costs associated with transporting and processing recycled water for use as makeup flow for closed-loop cooling towers. As a result of the considerable unknowns, costs, and the numerous permits required, using recycled wastewater from Yonkers Joint WWTP is considered infeasible.
7.2 Cooling Tower Plume Emissions
Pursuant to the Interim Decision governing this SPDES permit proceeding, air permitting expert TRC Environmental Corporation (TRC) evaluated the potential air quality impacts of cooling tower plume emissions on the surrounding community, consistent with applicable federal, state and local law [Ref. 12.29]. TRC concluded that drift from the cooling towers would contain an appreciable concentration of dissolved minerals and additives that form particulate matter (PM10 and PM2.5). As such, the cooling towers, individually and collectively, would result in particulate matter emissions. TRC determined that these emissions would exceed the National Ambient Air Quality Standards for PM10 and PM2.5. TRC also examined mitigation measures to reduce particulate emissions, but concluded that available mitigation measures would not sufficiently redress air quality concerns in a manner consistent with applicable regulatory requirements. TRC concluded that the particulate emissions from the cooling towers will cause an adverse air quality impact to the surrounding community such that obtaining the required construction and operating air emissions permits would not be possible.
The conclusion reached by TRC for the Stations’ cooling tower particulate emissions mirrors the conclusion reached for San Onofre Generating Station (SONGS) [Ref. 12.9]. SONGS is located in San Diego County, which like the area surrounding IPEC, is currently designated as non-attainment for PM10 and PM2.5. At SONGS, drift impacts due to the operation of closed-loop salt water cooling towers would be significant and require a major-source Title V air permit from the San Diego County Air Pollution Control District. It was determined that it would be unlikely that SONGS could locate and purchase a sufficient number of PM10 emission credits to cover the emissions from closed-loop salt water cooling towers. If the required drift offsets were unavailable, conversion of SONGS to closed-loop cooling would be infeasible.
7.3 Plume Abatement
As discussed in Section 2, the cooling towers that would be installed at Units 2 and 3 would be round hybrid towers designed with noise and plume abatement features, that come at a cost to electric output. When cooling towers are operated without abatement, visible water vapor plumes can form under certain meteorological conditions. According to TRC [Ref. 12.29], these visible plumes normally would be confined to the area immediately over the cooling tower and over the IPEC property, although under cool temperatures (typically during the late fall, winter, and early spring seasons) with high ambient humidity, elevated visible plumes could extend for several hundred to thousands of meters. TRC’s results indicate that, without plume abatement (i.e., operation of the cooling towers without using the dry section), a visible

CONVERSION OF INDIAN POINT UNITS 2 & 3 TO A CLOSED-LOOP COOLING WATER CONFIGURATION
39
plume would occur immediately south and northwest of each cooling tower for 610 daylight hours per year on average.
Plumes could not only result in complaints by local residents and businesses, but also may contribute to corrosion and ice formation on nearby components and plume shadowing (which could affect the local agriculture by decreasing the amount of ambient sunlight). Therefore, in order to avoid visible plumes, the cooling towers at IPEC would be operated with continuous plume abatement, with a corresponding loss in electricity output. As discussed in Section 3.2.2.2, utilizing the 44 dry section fans (350 HP) at maximum capacity to achieve continuous plume abatement would result in a loss of more than 13.5 MWe per Unit (over 100,000 MW-hrs annually per Unit).

CONVERSION OF INDIAN POINT UNITS 2 & 3 TO A CLOSED-LOOP COOLING WATER CONFIGURATION
40
8 General Site Considerations
8.1 Aesthetic Impacts
The conversion of the Stations to closed-loop cooling would require several new structures to be constructed on the site (Section 2), the largest being the hybrid cooling towers. A Visual Assessment (VA) was prepared by visual analysis expert Saratoga Associates, Landscape Architects, Architects, Engineers and Planners, P.C. (Saratoga). Saratoga evaluated the potential visual impact of these structures on the scenic resources of the region consistent with applicable state and local law and policy [Ref. 12.25]. Saratoga concluded that, given their unprecedented scale and visual impact, construction and operation of cooling towers at IPEC, singularly or collectively, cannot be reconciled with applicable aesthetic standards, practice, or precedent. Specifically, Saratoga determined that the NYSDEC Proposed Project may be incompatible with the NYSDEC Visual Policy in that it impairs scenic resources of statewide significance. Furthermore, it is concluded that mitigation techniques would have little effect.
Figure 8.1 Visual Representation of Cooling Towers at IPEC9
8.2 Archaeological Considerations
Phase I-A and Phase I-B archeological studies were conducted by ENERCON to assess the presence of historic properties in the Area of Potential Effect (APE) from cooling tower installation at IPEC [Ref. 12.10]. The Phase I studies identified evidence of both historic and pre-historic components in the APE. Reports documenting these findings were submitted to
9 The visual representation of cooling towers at IPEC provided is for wet-mode operation of the cooling towers. This has been provided to illustrate the magnitude of the plume that is created, either visible (wet-mode) or invisible (plume abated). It should be noted that even with plume abatement, a visible plume would occur under certain meteorological conditions.

CONVERSION OF INDIAN POINT UNITS 2 & 3 TO A CLOSED-LOOP COOLING WATER CONFIGURATION
41
the New York State Historic Preservation Office (NYSHPO). NYSHPO indicated that if a decision is made to install cooling towers, the APE should be reassessed, a geomorphological assessment should be conducted (if warranted), and a Phase II archaeological site examination should be conducted for the historic and prehistoric components identified in the Phase I studies. Additional information on the correspondence between ENERCON and NYSHPO is documented in Attachment 8.
In the event of a decision to proceed with the NYSDEC Proposed Project, a Phase II investigation would be undertaken to determine if significant archeological deposits are present. The duration and cost of a Phase II investigation is unknown at this time. Since no additional archaeological cost or schedule delay has been incorporated in this report, both cost and schedule are understated.
8.3 Local Zoning Restrictions
Entergy’s counsel has advised that the NYSDEC Proposed Project will be subject to certain local zoning restrictions. IPEC is located within the M-2 Planned Industrial Zoning District of the Village of Buchanan and the Village Zoning Code establishes restrictions on both the use of, and dimensions of, structures located on property within this District [Ref. 12.2; Ref. 12.6].
8.3.1 Use Regulations
Section 211-10 of the Zoning Code authorizes “the peaceful use of atomic energy” as a principal use of the IPEC property [Ref. 12.6]. Entergy’s counsel has advised that the Village may view the NYSDEC Proposed Project as a separate use, given the blasting, crushing, transport and potential sale of clean excavated spoils involved. Section 211 does not allow mining, and the Village may prohibit blasting and/or crushing operations. The Village does permit certain accessory uses, but these appear to be limited to residential uses (i.e., swimming pools, etc) and certain retail sales. Thus, obtaining the requisite zoning approvals for the NYSDEC Proposed Project is not assured.
8.3.2 Performance Standards Related to Non-Residential Uses
Section 211 of the Village Zoning Code also establishes standards for non-residential uses, including noise and air pollution standards [Ref. 12.6]. As discussed below, due to these standards, obtaining the requisite zoning approvals for the NYSDEC Proposed Project is not assured.
8.3.2.1 Noise
Section 211-23 establishes enforceable standards for noise generating activities [Ref. 12.6]. The table on the following page provides the allowable decibel levels (as measured at the property line), for each frequency range.
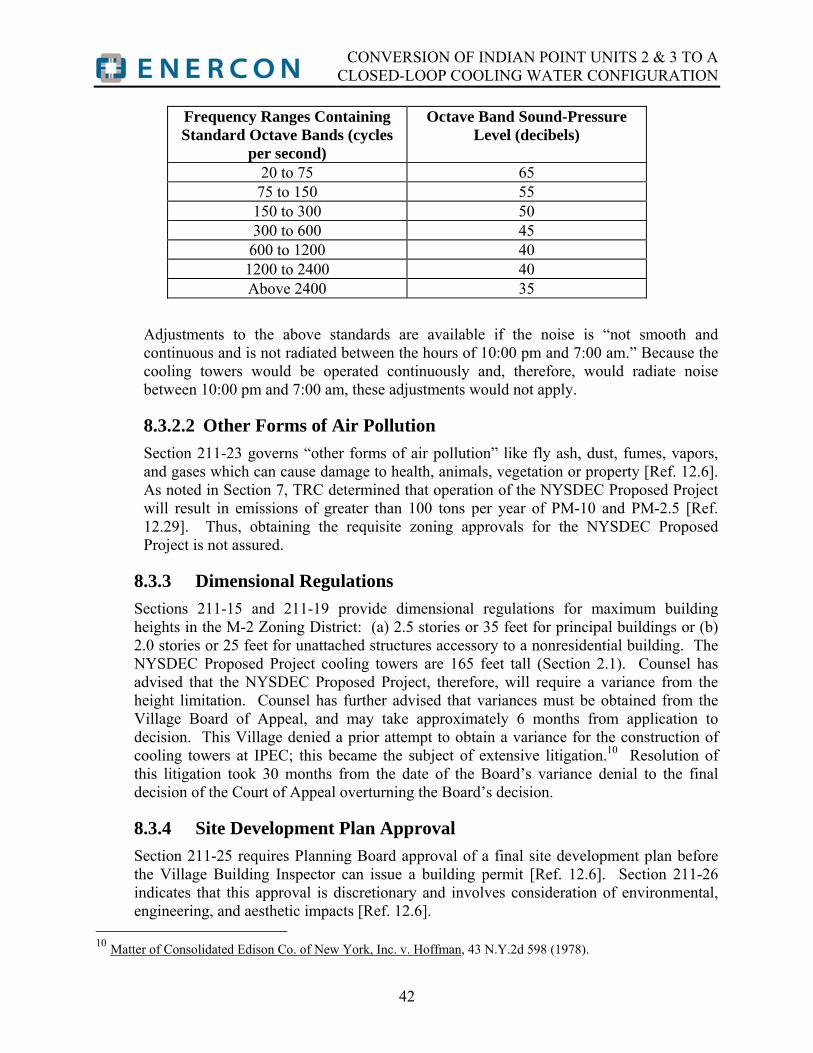
CONVERSION OF INDIAN POINT UNITS 2 & 3 TO A CLOSED-LOOP COOLING WATER CONFIGURATION
42
Frequency Ranges Containing Standard Octave Bands (cycles
per second)
Octave Band Sound-Pressure Level (decibels)
20 to 75 65 75 to 150 55 150 to 300 50 300 to 600 45 600 to 1200 40 1200 to 2400 40 Above 2400 35
Adjustments to the above standards are available if the noise is “not smooth and continuous and is not radiated between the hours of 10:00 pm and 7:00 am.” Because the cooling towers would be operated continuously and, therefore, would radiate noise between 10:00 pm and 7:00 am, these adjustments would not apply.
8.3.2.2 Other Forms of Air Pollution
Section 211-23 governs “other forms of air pollution” like fly ash, dust, fumes, vapors, and gases which can cause damage to health, animals, vegetation or property [Ref. 12.6]. As noted in Section 7, TRC determined that operation of the NYSDEC Proposed Project will result in emissions of greater than 100 tons per year of PM-10 and PM-2.5 [Ref. 12.29]. Thus, obtaining the requisite zoning approvals for the NYSDEC Proposed Project is not assured.
8.3.3 Dimensional Regulations
Sections 211-15 and 211-19 provide dimensional regulations for maximum building heights in the M-2 Zoning District: (a) 2.5 stories or 35 feet for principal buildings or (b) 2.0 stories or 25 feet for unattached structures accessory to a nonresidential building. The NYSDEC Proposed Project cooling towers are 165 feet tall (Section 2.1). Counsel has advised that the NYSDEC Proposed Project, therefore, will require a variance from the height limitation. Counsel has further advised that variances must be obtained from the Village Board of Appeal, and may take approximately 6 months from application to decision. This Village denied a prior attempt to obtain a variance for the construction of cooling towers at IPEC; this became the subject of extensive litigation.10 Resolution of this litigation took 30 months from the date of the Board’s variance denial to the final decision of the Court of Appeal overturning the Board’s decision.
8.3.4 Site Development Plan Approval
Section 211-25 requires Planning Board approval of a final site development plan before the Village Building Inspector can issue a building permit [Ref. 12.6]. Section 211-26 indicates that this approval is discretionary and involves consideration of environmental, engineering, and aesthetic impacts [Ref. 12.6].
10 Matter of Consolidated Edison Co. of New York, Inc. v. Hoffman, 43 N.Y.2d 598 (1978).
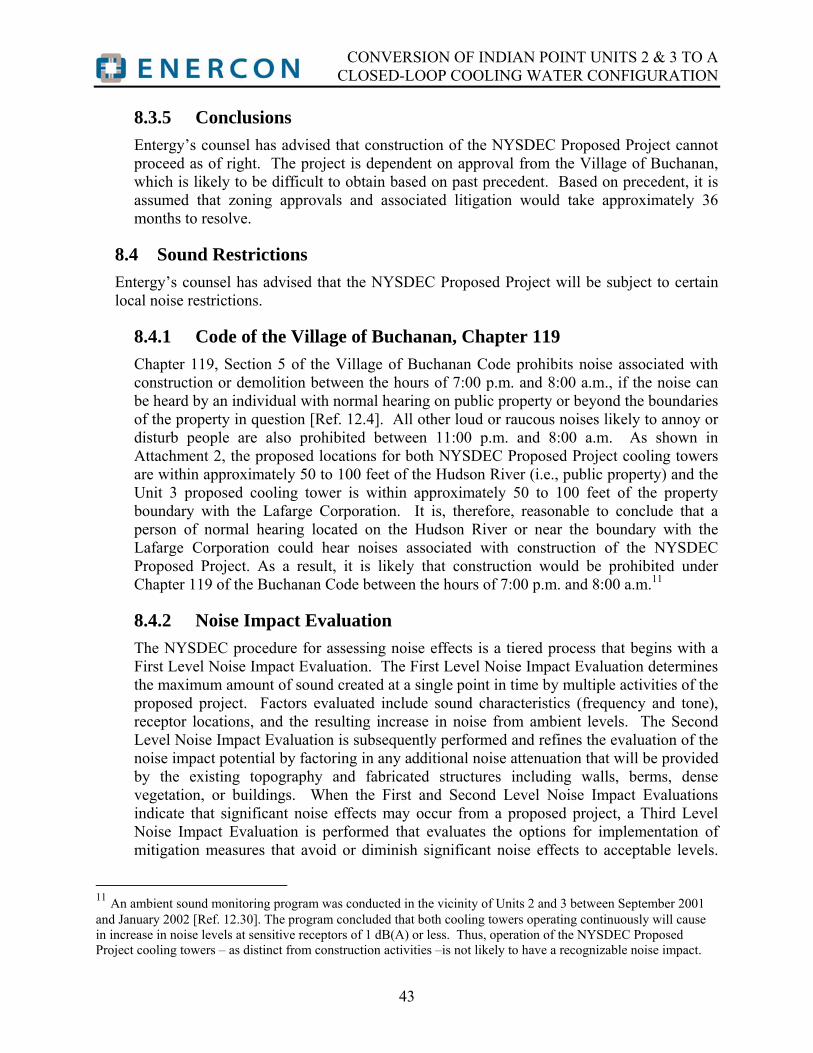
CONVERSION OF INDIAN POINT UNITS 2 & 3 TO A CLOSED-LOOP COOLING WATER CONFIGURATION
43
8.3.5 Conclusions
Entergy’s counsel has advised that construction of the NYSDEC Proposed Project cannot proceed as of right. The project is dependent on approval from the Village of Buchanan, which is likely to be difficult to obtain based on past precedent. Based on precedent, it is assumed that zoning approvals and associated litigation would take approximately 36 months to resolve.
8.4 Sound Restrictions
Entergy’s counsel has advised that the NYSDEC Proposed Project will be subject to certain local noise restrictions.
8.4.1 Code of the Village of Buchanan, Chapter 119
Chapter 119, Section 5 of the Village of Buchanan Code prohibits noise associated with construction or demolition between the hours of 7:00 p.m. and 8:00 a.m., if the noise can be heard by an individual with normal hearing on public property or beyond the boundaries of the property in question [Ref. 12.4]. All other loud or raucous noises likely to annoy or disturb people are also prohibited between 11:00 p.m. and 8:00 a.m. As shown in Attachment 2, the proposed locations for both NYSDEC Proposed Project cooling towers are within approximately 50 to 100 feet of the Hudson River (i.e., public property) and the Unit 3 proposed cooling tower is within approximately 50 to 100 feet of the property boundary with the Lafarge Corporation. It is, therefore, reasonable to conclude that a person of normal hearing located on the Hudson River or near the boundary with the Lafarge Corporation could hear noises associated with construction of the NYSDEC Proposed Project. As a result, it is likely that construction would be prohibited under Chapter 119 of the Buchanan Code between the hours of 7:00 p.m. and 8:00 a.m.11
8.4.2 Noise Impact Evaluation
The NYSDEC procedure for assessing noise effects is a tiered process that begins with a First Level Noise Impact Evaluation. The First Level Noise Impact Evaluation determines the maximum amount of sound created at a single point in time by multiple activities of the proposed project. Factors evaluated include sound characteristics (frequency and tone), receptor locations, and the resulting increase in noise from ambient levels. The Second Level Noise Impact Evaluation is subsequently performed and refines the evaluation of the noise impact potential by factoring in any additional noise attenuation that will be provided by the existing topography and fabricated structures including walls, berms, dense vegetation, or buildings. When the First and Second Level Noise Impact Evaluations indicate that significant noise effects may occur from a proposed project, a Third Level Noise Impact Evaluation is performed that evaluates the options for implementation of mitigation measures that avoid or diminish significant noise effects to acceptable levels.
11 An ambient sound monitoring program was conducted in the vicinity of Units 2 and 3 between September 2001 and January 2002 [Ref. 12.30]. The program concluded that both cooling towers operating continuously will cause in increase in noise levels at sensitive receptors of 1 dB(A) or less. Thus, operation of the NYSDEC Proposed Project cooling towers – as distinct from construction activities –is not likely to have a recognizable noise impact.

CONVERSION OF INDIAN POINT UNITS 2 & 3 TO A CLOSED-LOOP COOLING WATER CONFIGURATION
44
Mitigation measures may include reducing noise frequency or impulse noise by changing equipment, modifying equipment, or using the appropriate mufflers; reducing noise duration by limiting the days of operation or hours where construction is allowed; and, reducing noise levels by increasing setbacks, erecting sound barriers, or preserving natural barriers as possible.
As stated above, construction activities to convert Units 2 and 3 to closed-loop cooling would likely be restricted to between 8:00 a.m. and 7:00 p.m. and would require a noise impact evaluation.

CONVERSION OF INDIAN POINT UNITS 2 & 3 TO A CLOSED-LOOP COOLING WATER CONFIGURATION
45
9 Construction and Outage Duration As discussed in Section 2, three design alternatives are considered for closed-loop cooling at IPEC: (1) retrofit both Units to closed-loop cooling, (2) retrofit only Unit 2 to closed-loop cooling, or (3) retrofit only Unit 3 to closed-loop cooling. Conceptual construction and outage schedules have been developed for all three alternatives and are provided in Attachment 9. Considering the conceptual nature of the current design parameters and the unknown forces outside of the project’s direct control, many of the tasks are aggressively optimistic and could be severely impacted as work progresses. The initial design and all permitting and licensing requirements are assumed to be completed prior to the start of construction. Construction work and field engineering would continue in tandem up to and through the recommended outage period.
Several factors could present significant scheduling challenges but were not considered for the conceptual construction and outage schedule. These issues, along with the scheduling issues addressed in this report, include but are not limited to:
Duration of regulatory agency interactions (e.g., federal, state and local zoning/permitting/licensing restrictions).
Prior relocation of the Algonquin gas pipeline.
Uncertainty surrounding the large volume of uncontaminated and radiologically contaminated spoils and construction debris disposal.
Construction delays due to the possible disturbance of tritiated groundwater pathway.
Riverside activities and potential maritime implications.
Archaeological concerns delaying construction or requiring resiting of the cooling towers.
Resource availability (material, equipment, and most specifically craft labor).
Impacts of increased plant security and the necessary construction equipment access.
Unpredictable weather phenomena (e.g., blasting weather restrictions).
The above concerns are not all inclusive but represent some of the major challenges to the NYSDEC Proposed Project. It would be difficult to determine the exact impacts at this point based on probability or severity of the issue involved, but each would tend to increase overall cost and schedule, some substantially.
Subject to the uncertainty detailed above, Attachment 9 provides a schedule of the significant construction activities for each of the three design alternatives. It should be noted that to accurately reflect the timeframe during which construction activities would begin, the estimated local zoning/permitting duration of 36 months, provided by Entergy’s counsel, is included within each schedule.

CONVERSION OF INDIAN POINT UNITS 2 & 3 TO A CLOSED-LOOP COOLING WATER CONFIGURATION
46
9.1 Conversion of Unit 2 and Unit 3
As discussed in Section 2.1, the conversion of both Units 2 and 3 to closed-loop cooling would require the installation of two round hybrid cooling towers and the associated piping and equipment. As shown in Attachment 9, the total length of construction would extend approximately 97 months including approximately 42 weeks of continuous forced outage. Considering the conceptual nature of the current design parameters and the unknown effects of outside forces, the scheduling of many tasks are understated and could be significantly impacted, as discussed above.
9.1.1 Online Construction Schedule
As discussed in Section 2.1, the cooling towers would be placed to the northeast and southwest of the Station’s Containment Buildings, as shown in Attachment 2, Sketch ENTGNU011-SK-001. To this extent, construction activities that would not be impactive to operation, including excavation of the cooling tower basins and relocation of the Algonquin Pipelines, could be conducted with each Unit online.
Prior to construction of the cooling towers, several general site activities would have to be completed at both Units, including access road construction, fence relocation and additions, environmental protection measures, barge access construction and security modifications. Approximately 13 weeks of general construction activities would be required at Unit 2 prior to cooling tower construction.
Several additional activities would have to be undertaken at Unit 3, including relocation of the Algonquin pipelines, an existing parking lot, and the current sewage lift station and the demolition of the existing sewage treatment facilities that would result in approximately 118 weeks of general construction activities prior to the construction of the cooling tower. Therefore, construction of the Unit 2 cooling tower would be able to begin first, and, after the additional activities were finished at Unit 3, construction of the Unit 3 cooling tower could begin.
Subject to schedule uncertainty, cooling tower construction would be limited by the drilling rate of blast operations, as discussed in Section 5, and is estimated to take approximately 271 weeks at Unit 2 and 284 weeks at Unit 3 (see Attachment 9). Construction of the Unit 3 cooling tower would begin approximately 3 months after the start of construction on the Unit 2 cooling tower. As discussed in Section 5, construction of hybrid cooling towers would entail significant excavation at IPEC and would require approximately 4 years for blasting and rock removal alone.
9.1.2 Outage Construction Schedule
In contrast to those activities outlined in Section 9.1.1, due to the proximity of several construction activities to nuclear safety-related equipment and the impact on or removal of equipment necessary for power generation (e.g., circulating water pumps), certain activities would require consecutive extended construction outages. Due to the joint nature of several of the construction activities (i.e., demolition of the Riverfront area, construction of the pump houses in the existing discharge canal, etc.) the construction outages would be conducted concurrently. Approximately 42 weeks of continuous outage for the

CONVERSION OF INDIAN POINT UNITS 2 & 3 TO A CLOSED-LOOP COOLING WATER CONFIGURATION
47
construction and implementation of closed-loop cooling would be required for each Unit. At IPEC, maintenance and refueling outages are scheduled to occur approximately every 24 months for each Unit and typically last approximately 25 days. The scheduled outages are staggered so that both Units are not offline at the same time; therefore it is likely that the extended construction outages could be scheduled to coincide with one Unit’s scheduled maintenance outage.
9.2 Conversion of Only Unit 2
As discussed in Section 2.2, the conversion of Unit 2 to closed-loop cooling would require the installation of one round hybrid cooling tower and the associated piping and equipment. As shown in Attachment 9, the total length of construction would extend more than 73 months including approximately 42 weeks of continuous outage, scheduled to coincide with Unit 2 maintenance and refueling outage (i.e., a 38 week continuous forced outage). Considering the conceptual nature of the current design parameters and the unknown effects of outside forces, the scheduling of many tasks represents a best-case scenario and could be significantly impacted, as discussed above.
9.2.1 Online Construction Schedule
As discussed in Section 2.2, the Unit 2 cooling tower would be placed to the northeast of Unit 2, as shown in Attachment 2, Sketch ENTGNU011-SK-002. To this extent, construction activities that would not be impactive to operation, including excavation of the cooling tower basin, could be conducted with the Unit online.
Prior to construction of the cooling towers, several general site activities would have to be completed including access road construction, fence relocation and additions, and security modifications environmental protection. In addition to these activities, barge access construction would be required resulting in approximately 13 weeks of general construction activities prior to cooling tower construction.
Subject to schedule uncertainty, cooling tower construction is estimated to take approximately 270 weeks (see Attachment 9). As discussed in Attachment 7, construction of a hybrid cooling tower at Unit 2 would entail significant excavation and would require approximately 4 years for blasting and rock removal alone.
9.2.2 Outage Construction Schedule
In contrast to those activities outlined in Section 9.2.1, due to the proximity of several construction activities to nuclear safety-related equipment and the impact on or removal of equipment necessary for power generation (e.g., circulating water pumps), certain activities would require consecutive extended construction outages. Approximately 42 weeks of continuous outage for the construction and implementation of closed-loop cooling would be required. At IPEC, maintenance and refueling outages are scheduled to occur approximately every 24 months and typically last approximately 25 days. It is likely that the extended construction outages could be scheduled to coincide with Unit 2’s scheduled maintenance outage, resulting in a non-planned forced construction outage of approximately 38 weeks.

CONVERSION OF INDIAN POINT UNITS 2 & 3 TO A CLOSED-LOOP COOLING WATER CONFIGURATION
48
9.3 Conversion of Only Unit 3
As discussed in Section 2.3, the conversion of Unit 3 to closed-loop cooling would require the installation of one round hybrid cooling tower and the associated piping and equipment. As shown in Attachment 9, the total length of construction would extend approximately 98 months including approximately 42 weeks of continuous outage, scheduled to coincide with Unit 3 maintenance and refueling outage (i.e., a 38 week continuous forced outage). Considering the conceptual nature of the current design parameters and the unknown effects of outside forces, the scheduling of many tasks represents a best-case scenario and could be significantly impacted, as discussed above.
9.3.1 Online Construction Schedule
As discussed in Section 2.3, the cooling tower would be placed to the southwest of the Unit 3, as shown in Attachment 2, Sketch ENTGNU011-SK-003. To this extent, construction activities that would not be impactive to operation, including excavation of the cooling tower basin and relocation of the Algonquin Pipelines, could be conducted with the Unit online.
Prior to construction of the cooling towers, several general site activities would have to be completed including access road construction, fence relocation and additions, and security modifications environmental protection. In addition to these activities, barge access construction, relocation of the Algonquin pipelines, an existing parking lot, and the current sewage lift station and the demolition of the existing sewage treatment facilities would result in approximately 118 weeks of general construction activities prior to the construction of the cooling tower.
Subject to schedule uncertainty, cooling tower construction is estimated to take approximately 288 weeks (see Attachment 9). As discussed in Attachment 7, construction of a hybrid cooling tower at Unit 3 would entail significant excavation and would require approximately 4.2 years for blasting and rock removal alone.
9.3.2 Outage Construction Schedule
In contrast to those activities outlined in Section 9.3.1, due to the proximity of several construction activities to nuclear safety-related equipment and the impact on or removal of equipment necessary for power generation (e.g., circulating water pumps), certain activities would require consecutive extended construction outages. Approximately 42 weeks of continuous outage for the construction and implementation of closed-loop cooling would be required. At IPEC, maintenance and refueling outages are scheduled to occur approximately every 24 months and typically last approximately 25 days. Subtracting the planned maintenance outage from the construction outage duration, implementation of closed-loop cooling at Unit 3 would require a non-planned forced construction outage of approximately 38 weeks.

CONVERSION OF INDIAN POINT UNITS 2 & 3 TO A CLOSED-LOOP COOLING WATER CONFIGURATION
49
10 Economic and Power Loss Estimates This section estimates the costs or lost electrical generation for the five major aspects of converting IPEC Units 2 and 3 to closed-loop cooling:
initial capital costs
construction outage lost electrical generation
lost electrical generation due to new condenser operating parameters
lost electrical generation due to parasitic losses
operation and maintenance costs, including water treatment costs
The capital costs of the closed-loop conversion include design, procurement, implementation, and startup activities, as detailed in Attachment 10. The duration of the required Unit outages described in Section 9 is used to determine the lost electrical generation.
10.1 Initial Capital Costs
The initial capital costs to convert the Stations to closed-loop cooling include the cost of engineering design; the selection, procurement, and installation of major equipment (i.e., cooling towers, pumps, valves, etc.); and the costs of closed-loop construction, including the blasting required to excavate the cooling tower areas. Capital cost estimation was done in such a way as to minimize the necessary assumptions, and relied instead on well-developed, detailed conceptual designs to increase the accuracy of the estimates. The 2003 Report (Attachment 1) lists the components and construction activities necessary for closed-loop operation, providing a high level of detail to the conceptual design estimation.
Three estimation techniques were used to determine the initial capital costs:
(1) Vendor provided budgetary estimates
Leading industry vendors were contacted for updated quotations on the major equipment and material components to allow for as accurate an estimation as possible, with the correspondence, reference material, and quotations provided in Attachment 9.
(2) Third-party detailed construction estimates
Since blasting at each of the cooling tower sites would require a unique engineering solution, a nationally recognized consultant was used to determine a conceptual design, cost, and schedule for blasting (Attachment 7).
(3) Computational estimation utilizing national production rates and cost factoring
Remaining cooling equipment and construction activities were estimated using 2009 RSMeans cost data software at MeansCostWorks.com. RSMeans is a construction cost estimating tool that provides detailed cost estimates for the construction industry including labor, piping, concrete, industrial equipment, electrical systems, and other heavy construction components.

CONVERSION OF INDIAN POINT UNITS 2 & 3 TO A CLOSED-LOOP COOLING WATER CONFIGURATION
50
The capital cost estimate contained in Attachment 9 combines these resources to produce a conceptual cost analysis. The major cost centers were defined and presented in line item format in order to provide flexibility in the application of cost. Some of these line items would be equally shared by both Units 2 and 3 as several of the required construction activities would be common between both Units. These common costs would not simply be cut in half and are conservatively assumed to remain if only one Unit were converted to closed-loop cooling since there would be additional costs associated with ensuring that the operating Unit not being converted would not be adversely impacted by construction at the other Unit. The engineering, design, and inspection cost was estimated at 15% of estimates which were not quoted for turn-key construction [Ref. 12.31].
The anticipated direct capital cost (presented in 2009 US dollars) for the conversion for both IPEC Unit 2 and Unit 3 is collectively estimated at a minimum of $1.19 billion without any escalation over time. The anticipated direct capital cost for the conversion of only Unit 2 is estimated at a minimum of $629 million, and the anticipated direct capital cost for the conversion of only Unit 3 is estimated at a minimum of $649 million, without any escalation over time. The one-time costs of conversion of both IPEC Units 2 and 3 to closed-loop cooling are summarized in Table 11.1.
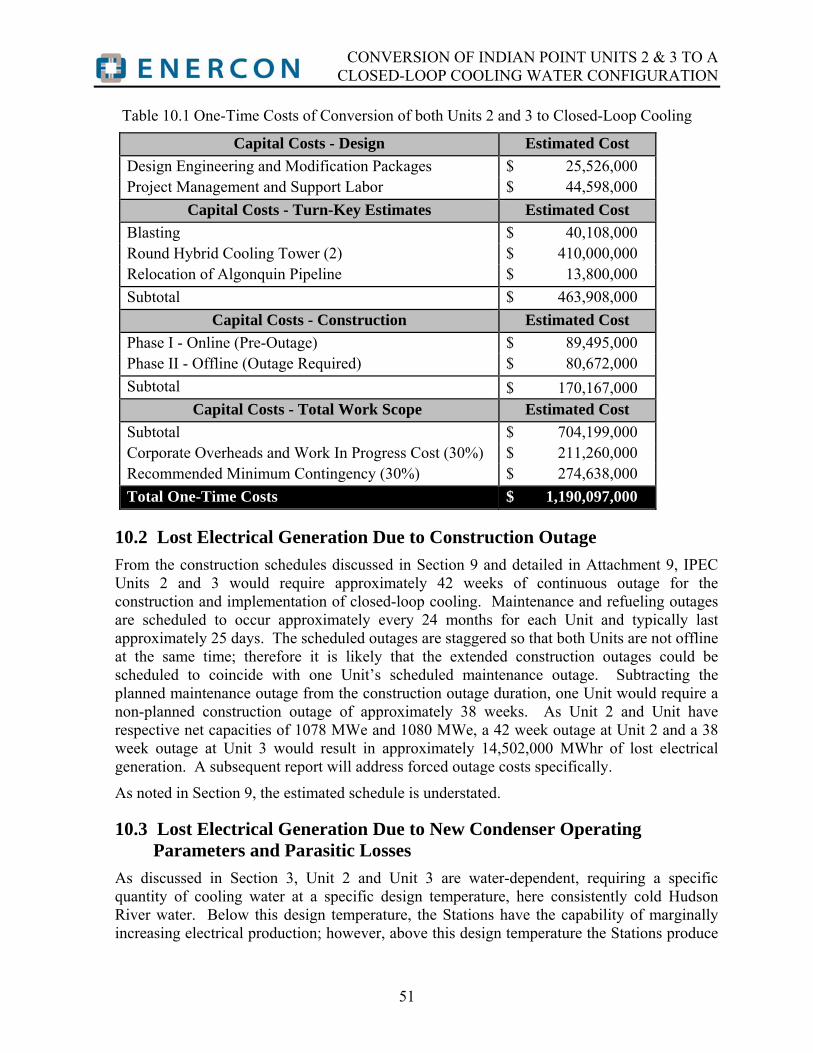
CONVERSION OF INDIAN POINT UNITS 2 & 3 TO A CLOSED-LOOP COOLING WATER CONFIGURATION
51
Table 10.1 One-Time Costs of Conversion of both Units 2 and 3 to Closed-Loop Cooling
Capital Costs - Design Estimated Cost
Design Engineering and Modification Packages $ 25,526,000 Project Management and Support Labor $ 44,598,000
Capital Costs - Turn-Key Estimates Estimated Cost
Blasting $ 40,108,000 Round Hybrid Cooling Tower (2) $ 410,000,000 Relocation of Algonquin Pipeline $ 13,800,000
Subtotal $ 463,908,000
Capital Costs - Construction Estimated Cost
Phase I - Online (Pre-Outage) $ 89,495,000 Phase II - Offline (Outage Required) $ 80,672,000
Subtotal $ 170,167,000 Capital Costs - Total Work Scope Estimated Cost
Subtotal $ 704,199,000 Corporate Overheads and Work In Progress Cost (30%) $ 211,260,000 Recommended Minimum Contingency (30%) $ 274,638,000
Total One-Time Costs $ 1,190,097,000
10.2 Lost Electrical Generation Due to Construction Outage
From the construction schedules discussed in Section 9 and detailed in Attachment 9, IPEC Units 2 and 3 would require approximately 42 weeks of continuous outage for the construction and implementation of closed-loop cooling. Maintenance and refueling outages are scheduled to occur approximately every 24 months for each Unit and typically last approximately 25 days. The scheduled outages are staggered so that both Units are not offline at the same time; therefore it is likely that the extended construction outages could be scheduled to coincide with one Unit’s scheduled maintenance outage. Subtracting the planned maintenance outage from the construction outage duration, one Unit would require a non-planned construction outage of approximately 38 weeks. As Unit 2 and Unit have respective net capacities of 1078 MWe and 1080 MWe, a 42 week outage at Unit 2 and a 38 week outage at Unit 3 would result in approximately 14,502,000 MWhr of lost electrical generation. A subsequent report will address forced outage costs specifically.
As noted in Section 9, the estimated schedule is understated.
10.3 Lost Electrical Generation Due to New Condenser Operating Parameters and Parasitic Losses
As discussed in Section 3, Unit 2 and Unit 3 are water-dependent, requiring a specific quantity of cooling water at a specific design temperature, here consistently cold Hudson River water. Below this design temperature, the Stations have the capability of marginally increasing electrical production; however, above this design temperature the Stations produce

CONVERSION OF INDIAN POINT UNITS 2 & 3 TO A CLOSED-LOOP COOLING WATER CONFIGURATION
52
significantly less electricity and could ultimately impact the low pressure turbine procedural limits. To analyze the effect closed-loop cooling would have on the Stations’ electrical generation, a state-of-the-art PEPSE model for each Unit was used. As discussed in Section 3, the annual average continuous operational losses for Units 2 and 3 were determined to be 11.1 MWe and 4.7 MWe, respectively; however, operational power losses would peak during warmest conditions when electricity demand is at its highest. Over the historical data analyzed (2001-2008), the peak combined operational power loss occurred on June 7th, 2008 at 2PM, and accounted for a combined operational power loss of 85.4 MWe.
As discussed in Section 3.2.2.2, the equipment necessary to operate closed-loop cooling at Unit 2 and Unit 3 would require significant input electricity, referred to as parasitic losses. Closed-loop conversion of the Stations utilizing hybrid cooling towers would require a continuous 36.1 MWe per Unit aggregate parasitic loss (72.2 MWe, total).
The lost electrical generation from both the ongoing operational efficiency losses associated operating beyond the original condenser design conditions and the parasitic losses associated with the pumps and cooling tower fans is summarized in Table 10.2. These losses require replacement sources, as will be addressed in a separate report.
Table 10.2 Lost Electrical Generation from Conversion of both Units 2 and 3 to Closed-Loop Cooling
Lost Electrical Generation Annual Average Peak*
Operational Efficiency Losses 15.8 MWe 85.4 MWe
Parasitic Losses** 72.2 MWe 72.2 MWe
Total Lost Electrical Generation 88.0 MWe 157.6 MWe *Over the historical data analyzed (2001-2008), the peak combined operational power loss occurred on June 7th, 2008 at 2PM. **Parasitic losses are continuous, and thus the annual average and peak electrical losses are the same.
10.4 Operations and Maintenance Costs
As discussed in Section 3.3 of the 2003 Report (Attachment 1), significant operations and maintenance (O&M) support for the closed-loop cooling systems would be required. Additional O&M costs for the components added due to the conversion to closed-loop cooling were estimated by identifying the general tasks for each component, and then based on operational experience and input from vendors, quantifying the estimated required man-hours and associated costs.
Although the conversion to closed-loop cooling is complex, significant new/modified plant components would be limited to the cooling towers with their fans and booster pumps, and the appreciably larger circulating water pumps located in new pump houses. Based on the tasks identified in the 2003 Report, annual additional operations support for the closed-loop configuration is estimated to be approximately $336,000 for each Unit. Based on vendor estimates and historical data, the maintenance costs per Unit were estimated as follows:

CONVERSION OF INDIAN POINT UNITS 2 & 3 TO A CLOSED-LOOP COOLING WATER CONFIGURATION
53
Annual maintenance cost estimate per Unit (years 1-5) $670,000
Annual maintenance cost estimate per Unit (years 6-15) $1,340,000
Annual maintenance cost estimate per Unit (years 16-20) $2,680,000
As discussed in Section 3.6 of the 2003 Report (Attachment 1), additional chemicals would be injected into the makeup circulating water to prevent micro and macro fouling of the main condenser and cooling towers. Appreciably increased costs would be associated with the increased level of water treatment required for closed-loop cooling. Local conditions could greatly affect annual costs, but an annual cost per Unit of approximately $1,005,000 would be extremely conservative (i.e., understated).
To support the equipment necessary for continuous closed-loop operation, significant operation and maintenance would be incurred. Below is a summation of these annual costs per Unit including labor and material for the hybrid cooling towers and water treatment.
Years 1 - 5 $2,011,000/year
Years 6 - 15 $2,681,000/year
Years 16 - 30 $4,021,000/year

CONVERSION OF INDIAN POINT UNITS 2 & 3 TO A CLOSED-LOOP COOLING WATER CONFIGURATION
54
11 Conclusions Several site-specific conditions exist at IPEC that would challenge the feasibility of the NYSDEC Proposed Project. These challenges significantly impact the expected duration and cost of the project, which are based on conceptual design absent any practical history of closed-loop cooling retrofits at nuclear facilities.
11.1 Challenges to the NYSDEC Proposed Project
Challenges to the NYSDEC Proposed Project include, but are not limited to, the following:
Air emissions resulting from operation of the cooling towers would exceed the National Ambient Air Quality Standards for PM10 and PM2.5. Available mitigation measures would not sufficiently redress air quality concerns in a manner consistent with applicable regulatory requirements.
Due to the size of the structures, construction and operation of cooling towers at IPEC may be incompatible with the NYSDEC Visual Policy in that they would impair scenic resources of statewide significance. The addition of the cooling towers would have a significant negative aesthetic impact on the surrounding area.
Documented prehistoric artifacts found in the Unit 3 cooling tower location indicate that a site of archeological significance may exist.
The construction of cooling towers cannot proceed prior to obtaining a variance from the Village of Buchanan Board of Appeal (to allow construction in excess of the maximum height allowed) and a site development plan approval from the Village Planning Board for the construction of the cooling towers. Village officials are on record in opposition of the construction of cooling towers at IPEC and local zoning approvals may be difficult to obtain.
Algonquin Gas Transmission pipelines currently exist where the Unit 3 tower would be constructed and would require relocation. The Algonquin Gas Transmission pipelines supply approximately 50% of the natural gas demand in New England and this supply cannot be interrupted. A preliminary evaluation suggests that relocation of the pipelines may be feasible; however, further evaluation of the pipeline relocation may impact the location and/or feasibility of the Unit 3 cooling tower. Any relocation of the Algonquin pipeline would require the prior approval of the FERC.
Excavation in the Riverfront area would intersect groundwater contamination plumes containing tritium and strontium. Construction delays may be introduced due to the disturbance of these plumes and the mitigation measures required to properly manage radiologically contaminated materials.
Conversion of the Stations to closed-loop condenser cooling would require the excavation of approximately 2 million cubic yards of soil and inwood marble bedrock. Blast removal would be required to excavate large quantities of inwood marble bedrock at the cooling tower locations and in the piping trenches outside of the Riverfront area. Because a forced outage at both Units would represent a considerable loss in power generation, blasting operations are proposed to occur while both Units are online. A

CONVERSION OF INDIAN POINT UNITS 2 & 3 TO A CLOSED-LOOP COOLING WATER CONFIGURATION
55
preliminary blasting plan is based on IPEC seismic design bases; however, site-specific testing and evaluation of blast vibration on individual plant components would be required to finalize blasting limitations and methods.
A continuous supply of approximately 27,400 gpm of makeup water would be required for evaporative cooling tower operation. Unlike the current once-through cooling, the water lost through evaporation and drift from the towers would not be returned directly to the Hudson River, but instead would represent a true loss of cooling water. This would result in a loss of Hudson River water averaging nearly 30 million gallons per day.
The topography of the IPEC site and general space constraints limit the potential locations for cooling towers. The elevation of the tower basin must be sufficiently low to prevent damage to condenser tubes. In addition, the towers require a 700 ft diameter excavation for clearance to ensure adequate air flow. The tower locations considered in this Report address these concerns, but any required relocation may have significant feasibility impacts on the project.
Conversion of IPEC to closed-loop cooling would be an unprecedented undertaking that would likely encounter unforeseen challenges during design and implementation. Thus, assumptions about engineering feasibility, while based on best professional judgment, do not have the benefit of either available technology or past efforts at comparable facilities.
11.2 Duration of the NYSDEC Proposed Project
The total duration of the NYSDEC Proposed Project is expected to extend almost 13 years. An eighteen month design period would precede NYSDEC approval of the project. A delay of 36 months is anticipated between NYSDEC approval and the start of construction for litigation on project permitting. The estimated length of construction for retrofit of both Units 2 and 3 would extend 97 months, and include an estimated 42 weeks of continuous forced outage and the permitting and construction period for relocation of the Algonquin pipeline. The drilling, blasting, and spoils removal would be expected to take approximately 4 years. Considering the conceptual nature of the current design parameters, the lack of comparable retrofits, and typical unknown conditions that arise in major construction projects, this schedule represents a best-case scenario; significantly longer durations than currently estimated could result.
If only Unit 2 were converted to closed-loop cooling, the total length of construction would extend more than 73 months including approximately 42 weeks of continuous outage, scheduled to coincide with Unit 2 maintenance and refueling outage (i.e., a 38 week continuous forced outage). If only Unit 3 were converted to closed-loop cooling, the total length of construction would extend more than 98 months including approximately 42 weeks of continuous outage, scheduled to coincide with Unit 2 maintenance and refueling outage (i.e., a 38 week continuous forced outage). The design and permitting periods would be similar to those for conversion of both Units.
CONVERSION OF INDIAN POINT UNITS 2 & 3 TO A CLOSED-LOOP COOLING WATER CONFIGURATION
56
11.3 Cost and Power Loss of the NYSDEC Proposed Project
The anticipated direct overnight capital cost for the conversion for both IPEC Unit 2 and Unit 3 is collectively estimated at a minimum of $1.19 billion without any escalation over time. If individually converted to closed loop cooling, IPEC Unit 2 and Unit 3 would have estimated capital costs of $629 million and $649 million, respectively.
As Unit 2 and Unit 3 have net capacities of 1078 MWe and 1080 MWe, respectively, a 42-week outage at both Units 2 and 3, accounting for a coincident maintenance outage at one Unit, would result in approximately 14,502,000 MWhr of lost electrical generation.
In addition to one-time costs and power loss, IPEC would also incur annual costs due to conversion to closed-loop cooling. Annual operations and maintenance costs associated with closed-loop cooling at IPEC would be more than $4 million for the first five years, with increasing costs in the subsequent years due to the need for increased equipment replacement and repair. IPEC would also incur ongoing operational and parasitic electrical generation losses. If the effect of closed-loop conversion on plant operation is averaged across the entire year, the combined operational losses due to decreased condenser efficiency would be approximately 15.8 MWe; however, operational power losses would peak during warmest conditions when electricity demand is at its highest. Over the historical data analyzed, the peak combined operational power loss occurred on June 7th, 2008 at 2PM, and accounted for a combined operational power loss of 85.4 MWe. Additional parasitic losses from the circulating water pumps and the cooling tower fans and booster pumps would add an additional 36.1 MWe per Unit in power generation losses. Summing the operational and parasitic losses, Units 2 and 3 combined would experience an average power generation loss of 88.0 MWe and peak summer power generation loss of 157.6 MWe. For reference, 157.6 MWe is enough electricity to satisfy the average power consumption of more than 1.38 million U.S. households.12
12 Calculation based on the 2007 average U.S residential electricity consumption of 936 kWh and the 2007 national-level transmission and distribution loss of 6.5% [Ref. 12.32].

CONVERSION OF INDIAN POINT UNITS 2 & 3 TO A CLOSED-LOOP COOLING WATER CONFIGURATION
57
12 References
12.1 Barlow, G. Precision Blasting in Shadow of On-Line Plant. Electrical World. February 1, 1979. pp. 43-45.
12.2 Buchanan Village Board. Comprehensive Master Plan: Village of Buchanan, NY. March 2005. Available at URL: http://www.fpclark.com/buchanan/masterplan.html Accessed February 3, 2010.
12.3 10 CFR Part 61.55. Code of Federal Regulations, Title 10, Energy, Part 61, Licensing Requirements for Land Disposal of Radioactive Waste
12.4 Code of the Village of Buchanan. Chapter 119, Noise.
12.5 Code of the Village of Buchanan. Chapter 143, Quarrying and Blasting.
12.6 Code of the Village of Buchanan. Chapter 211, Zoning.
12.7 Consolidated Edison Company of New York, Inc. Economic and Environmental Impacts of Alternative Closed-Cycle Cooling Systems for Indian Point Unit 2. Volume No. 1. December 1, 1974.
12.8 Enercon Services, Inc. Evaluation of Alternative Intake Technologies at Indian Point Units 2 & 3. 2010.
12.9 Enercon Services, Inc. Feasibility Study for Installation of Cooling Towers at San Onofre Nuclear Generating Station. 2009.
12.10 Enercon Services, Inc. Phase IB Archeological Investigation of Potential Cooling Tower Construction Sites at Indian Point Energy Center, Westchester County, New York. July 2009.
12.11 Entergy Nuclear Operations, Inc. Applicant’s Environment Report, Operating License Renewal Stage. Appendix E to Indian Point, Units 2 and 3, License Renewal Application. April 23, 2007.
12.12 Entergy Nuclear Operations, Inc. Procedure EN-DC-114. Project Management. Rev. 10. June 12, 2009.
12.13 GZA GeoEnvironmental, Inc. Final IPEC Quarterly Long-Term Groundwater Monitoring Report: Quarter Four 2008. New York, New York. September 1, 2009.
12.14 GZA GeoEnvironmental, Inc. Hydrogeologic Site Investigation Report, Indian Point Energy Center, Buchanan, New York. Norwood, Massachusetts. January 7, 2008.
12.15 Indian Point Energy Center. Procedure 2-ARP-SDF. Turbine Recorder. Rev. 24. 2007.

CONVERSION OF INDIAN POINT UNITS 2 & 3 TO A CLOSED-LOOP COOLING WATER CONFIGURATION
58
12.16 Indian Point Energy Center. Procedure 3-ARP-007. Panel SDF – Turbine Recorder. Rev. 27. 2009.
12.17 Indian Point Energy Center. Indian Point 2 UFSAR. Rev. 21. 2008.
12.18 Indian Point Energy Center. Indian Point 3 UFSAR. Rev. 3. 2009.
12.19 New York State Department of Environmental Conservation. Fact Sheet. New York State Pollutant Discharge Elimination System (SPDES) Draft Permit Renewal with Modification, IP2 and IP3 Electric Generating Station, Buchanan, NY. November 2003.
12.20 New York State Department of Environmental Conservation. New York State Pollutant Discharge Elimination System (SPDES) Discharge Permit. SPDES Permit Number: NY-0004472.
12.21 Nuclear Energy Institute. Water Use, Electric Power, and Nuclear Energy: A Holistic Approach to Environmental Stewardship. Washington, D.C. July 2009.
12.22 Nuclear Regulatory Commission. Website. NRC: Locations of Low-Level Waste Disposal Facilities. Available at URL: http://www.nrc.gov/waste/llw-disposal/locations.html Accessed February 3, 2010.
12.23 Rextag Strategies. Interstate Natural Gas Infrastructure Map Book. 3rd Edition. San Diego, CA. 2009.
12.24 RS Means Company, Inc. RS Means Building Construction Cost Data 2008, 66th ed. Construction Publishers & Consultants, Kingston, Massachusetts. 2008.
12.25 Saratoga Associates, Landscape Architects, Architects, Engineers and Planners, P.C. Indian Point Energy Center Closed Cycle Cooling Conversion Feasibility Study Visual Assessment. June 1, 2009.
12.26 Schumerth, Dennis. Gray & Impaired Water Cooling in Surface Condensers and Heat Exchangers. Proceedings of PWR2006 ASME Power. Atlanta, GA. May 2-4, 2006.
12.27 Spectra Energy. Algonquin Gas Transmission. Available at: http://www.spectraenergy.com/what_we_do/businesses/us/assets/algonquin/. Accessed February 3, 2010.
12.28 SPX Cooling Technologies. Cooling Tower Fundamentals. 2nd Edition. Overland Park, Kansas. 2006.
12.29 TRC Environmental Corporation. Cooling Tower Impact Analysis for the Entergy Indian Point Energy Center Westchester County, New York. Lyndhurst, NJ. September 2009.
12.30 TRC Environmental Corporation. Indian Point Peaking Facility, Sound. Draft Report 2003.
CONVERSION OF INDIAN POINT UNITS 2 & 3 TO A CLOSED-LOOP COOLING WATER CONFIGURATION
59
12.31 United States Department of Energy. Cost Estimating Guide. Publication No. DOE G 430.1-1. March 28, 1997.
12.32 United States Department of Energy – Energy Information Administration, Frequently Asked Questions – Electricity. Available at: http://tonto.eia.doe.gov/ask/electricity_faqs.asp. Accessed February 3, 2010.
12.33 United States Environmental Protection Agency. Hudson River PCBs. Available at: http://www.epa.gov/hudson/actions.htm. Accessed February 3, 2010.
12.34 United States Geological Survey. 2007 Minerals Yearbook, Stone (Crushed). Willet, Jason. January 2009.
12.35 United States Nuclear Regulatory Commission. Regulatory Guide 1.23, Meteorological Monitoring Programs for Nuclear Power Plants.