engineered alumina / silicon carbide laminated composites francesca...
TRANSCRIPT
Doctoral School in Materials Science and Engineering
Engineered Alumina / Silicon Carbide
Laminated Composites
Francesca De Genua
April 2014
XX
IV c
ycle

ENGINEERED ALUMINA /SILICON CARBIDE
LAMINATED COMPOSITES
Francesca De Genua
E-mail: [email protected]
Approved by:
Prof. V.M. Sglavo, Advisor Department of Industrial Engineering University of Trento, Italy.
Ph.D. Commission:
Prof. G. Straffelini, Department of Industrial Engineering University of Trento, Italy.
Prof. M. R. Chierotti, Department of Chemistry University of Torino, Italy. Prof. P. Fermo, Department of Inorganic, Metallorganic and Analytic Chemistry University of Milano, Italy. Prof. M. Scoponi, ISOF Institute CNR of Bologna, Italy.
University of Trento,
Department of Industrial Engineering
April 15, 2014

University of Trento - Department of Industrial Engineering
Doctoral Thesis
Francesca De Genua - 2014 Published in Trento (Italy) – by University of Trento ISBN:

To my daughter Chiara,
desidera e tenta,
perché di aspirazioni e tentativi è fatta la vita.

v
Abstract
High-melting temperature oxides, carbides and nitrides are superior in
hardness and strength to metals, especially in severe conditions. However, the
extensive use of such ceramics in structural engineering applications often
encountered critical problems due to their lack of damage tolerance and to the
limited mechanical reliability. Several ceramic composites and, in particular,
laminated structures have been developed in recent years to enhance strength,
toughness and to improve flaw tolerance. Significant strength increase and improved
mechanical reliability, in terms of Weibull modulus or minimum threshold failure
stress, can be achieved by the engineering of the critical surface region in the
ceramic component. Such effect can be realized by using a laminated composite
structure with tailored sub-surface insertion of layers with different composition.
Such laminate is able to develop, upon co-sintering, a spatial variation of residual
stress with maximum compression at specific depth from the surface due to the
differences in thermal expansion coefficient of the constituting layers.
In the present work silicon carbide has been selected as second phase to
graduate the thermal expansion coefficient of alumina due to its relatively low
specific density that could allow the production of lighter components with
improved mechanical performance, also for high temperature applications. Ceramic
laminates with strong interfaces composed of Al2O3/SiC composite layers were
produced by pressureless sintering or Spark Plasma Sintering (SPS) of green layers
stacks prepared by tape casting water-based suspensions. Monolithic composites
containing up to 30 vol% silicon carbide were fabricated and thoroughly
characterized. Five engineered ceramic laminates with peculiar layers combination
that is able to promote the stable growth of surface defects before final failure were
also designed and produced. By changing the composition of the stacked laminae
and the architecture of the laminate, tailored residual stress profile and T-curve were
generated after co-sintering and successive cooling in each multilayer.
The results of the mechanical characterization show that the engineered
laminates are sensibly stronger than parent monolithic composite ceramic and
vi
exhibit surface damage insensitivity, according to the design. Such shielding effect
is especially observed when macroscopic cracks are introduced by high load Vickers
indentations. Some designed multilayers exhibit reduced strength scatter and higher
Weibull modulus, which implies superior mechanical reliability. Fractographic
observations on fracture surfaces of the engineered laminates show a graceful crack
propagation within the surface layers in residual compressive stress which can be
attributed to the stable growth of superficial cracks before final failure as it is
predicted by the apparent fracture toughness curve. Such fracture behaviour is
considered to be responsible for the peculiar surface damage insensitivity and the
improved mechanical performance.
vii
Table of contents
Abstract .................................................................................................................... v
Table of contents.................................................................................................... vii
Chapter I ................................................................................................................ 11
Introduction ........................................................................................................... 11
Chapter II ............................................................................................................... 17
Background............................................................................................................ 17
2.1 Fracture behaviour of ceramic materials ................................................. 17 2.1.1 Brittle behaviour and strength scatter.................................................. 17 2.1.2 T-curve behaviour and microstructural toughening............................. 23
2.2 Alumina/silicon carbide composites ....................................................... 33 2.2.1 SiC whiskers-reinforced alumina composites...................................... 34 2.2.2 SiC platelets-reinforced alumina composites ...................................... 36 2.2.3 SiC particles-reinforced alumina composites ...................................... 37 2.2.4 Alumina/silicon carbide hybrid composites ........................................ 39 2.2.5 Sintering of alumina/silicon carbide composites ................................. 39
2.3 Ceramic laminates................................................................................... 42 2.3.1 Laminates with improved mechanical behaviour ................................ 42 2.3.2 Laminates with mechanical behaviour improved by toughening
mechanisms......................................................................................... 43 2.3.2.1 Metal/ceramic laminates.................................................................. 43 2.3.2.2 Porous and weak interlayers............................................................ 43 2.3.2.3 Laminates with two strong outer layers and a tough inner layer ..... 45
2.3.3 Laminates with mechanical behaviour improved by residual stresses. 46 2.3.3.1 Residual stresses in laminates ......................................................... 46 2.3.3.2 Laminates with two compressive outer layers and a tensile inner
layer.................................................................................................48 2.3.3.3 Threshold strength laminates........................................................... 49 2.3.3.4 High reliability ceramic laminates by design .................................. 49
2.3.4 Defects in laminates ............................................................................ 55 2.3.5 Processes suitable to produce ceramic laminates ................................ 57
2.3.5.1 Dry powder-based processes ........................................................... 58
viii
2.3.5.2 Slip-based processes........................................................................ 61
Chapter III ............................................................................................................. 69
Experimental Procedure ....................................................................................... 69
3.1 Material and process selection ................................................................ 69 3.1.1 Material selection ................................................................................ 69 3.1.2 Process selection ................................................................................. 72
3.1.2.1 Green forming method .................................................................... 72 3.1.2.2 Sintering.......................................................................................... 73
3.2 Laminates production.............................................................................. 74 3.2.1 Slurry preparation................................................................................ 74 3.2.2 Tape casting ........................................................................................ 77 3.2.3 Stacking and lamination ...................................................................... 79 3.2.4 Burn-out and pre-sintering treatment .................................................. 80 3.2.5 Pressureless sintering .......................................................................... 81 3.2.6 Spark Plasma Sintering ....................................................................... 82
3.3 Homogeneous Laminates ........................................................................ 84 3.3.1 Physical characterization..................................................................... 84 3.3.2 Mechanical characterization................................................................ 86
3.4 Engineered Laminates............................................................................. 88 3.4.1 Structure of engineered laminates ....................................................... 88 3.4.2 Weibull analysis and post-indentation strength................................... 91 3.4.3 Investigation on stable growth............................................................. 92
Chapter IV ............................................................................................................. 95
Results and discussion........................................................................................... 95
4.1 Green tapes.............................................................................................. 95
4.2 Pre-sintered laminates ............................................................................. 96
4.3 Pressureless sintering .............................................................................. 99
5.1 Spark plasma sintering .......................................................................... 106
5.2 Homogeneous laminates ....................................................................... 107 5.2.1 Microstructure and composition........................................................ 107 5.2.2 Density and porosity.......................................................................... 112 5.2.3 Thermal expansion behaviour ........................................................... 114 5.2.4 Young’s modulus and Poisson’s ratio ............................................... 116
ix
5.2.5 Hardness and fracture toughness....................................................... 117 5.2.6 Strength ............................................................................................. 119
5.3 Engineered laminates ............................................................................ 122 5.3.1 Structure............................................................................................ 122 5.3.2 Residual stress profiles...................................................................... 123 5.3.3 Apparent fracture toughness and expected mechanical behaviour .... 127 5.3.4 Weibull analysis ................................................................................ 133 5.3.5 Post-indentation strength................................................................... 139 5.3.6 Stable growth: expectations and experimental evidences.................. 143
Conclusion and future perspectives ................................................................... 149
References ............................................................................................................ 151
Appendix: Code of the numerical algorithm..................................................... 157
Scientific Production ........................................................................................... 161
Participation to Congresses ................................................................................ 163
Other activities..................................................................................................... 165
Acknowledgments................................................................................................ 167

x
11
Chapter I
Introduction
Materials have always been an integral part of human culture and
civilization. The role of materials has been so important that historians have
identified early cultures by the most significant material used then, consider the
Stone, the Bronze and the Iron Ages of the past. Today, we are not limited to one
predominant material. Engineers adapt materials to society’s needs and advanced
technologies rely on sophisticated materials thus we can refer to our modern society
as the “age of technology” [1].
Ceramics industry is the largest raw materials industry and ceramics are
encountered in virtually every facet of everyday life. Traditional ceramics such as
cements, glasses, refractories and clays are largely silica or clay based and typically
involve low-cost fabrication processes. The main use of these ceramics is focused on
tableware, sanitary wares, fireclays, construction materials and applications
involving static loading in compressive locations. This use exploits the dominating
characteristics of ceramics as chemical stability, high melting point, high hardness,
high elastic modulus and compressive strength, and higher resistance than that of
either metals or polymers to high temperatures and to severe environments [1–3]. In
view of such an attractive combination of properties, the development and discovery
of novel uses of ceramic materials have been improved and ceramics have been
considered as potential materials for many sectors of industrial society as aerospace,
electronics, nuclear, biomedical, catalytic, electronic, communication, structural and
tribological applications [4].
Adequate mechanical properties as strength, hardness, toughness and wear
resistance are of prime importance for structural applications. An optimum
combination of high toughness with high hardness and strength is usually required.
Therefore, in the past decades, the study of mechanical behaviour of ceramics and
the development of ceramic materials with proper combination of mechanical
properties has been the major focus in the ceramics community [5]. This has led to
12
the discovery of new classes of structural ceramic materials that are typically used in
components which are load bearing and at the same time exposed to severe
conditions of wear, corrosion and temperature. Significant success has been
achieved in many modern designs as cutting-tool technologies, wear resistant
components, heat exchangers, prosthetics, heat engine components, thermal barrier
coatings and ballistic armour [4].
Unfortunately, ceramics are inherently strong in compression but apparently
week in tension and bending. General attributes seriously affecting an extensive
application of ceramics as structural materials are their lack of the requisite
toughness, brittleness and variability in strength. The strength of ceramics is indeed
statistical by nature of the flaw distribution within the body because any geometric
irregularity leads to a stress concentration. The average size, size distribution and
type of inhomogeneity determines average strength and strength distribution.
Moreover a crack once started may grow spontaneously when the critical stress
intensity is exceeded and, without ample ductility, no energy is consumed by plastic
deformation. Therefore, the failure is brittle, immediate and occurs in catastrophic
manner while the wide strength scatter lead to poor mechanical reliability and impair
safe design [6–8].
In order to overcome these problems, two principal routes have been
explored in the last decades and the challenge for scientists has been to make
ceramics stronger or tougher. The first route consists in decreasing flaw presence
and severity with more sophisticated preparation process control, proof testing or by
reducing the component dimensions [9,10]. Glass fibres are a typical example used
to show that, if no flaws are present, the tensile strength will be as high as the
compressive strength. If protected from surface abrasion, glass fibres attain strengths
greater than steel [8]. The ceramics community has been involved with more interest
in the second route that regards the design and development of new materials and
structures with increasing toughness and improved flaw tolerance [6,8]. In this case,
fracture is controlled by a toughness curve and the material possesses a T-curve
behaviour. Current approaches to toughening are energy dissipative and increase the
apparent strain before fracture is completed. Since plastic deformation is strongly
inhibited in ceramics, this process can involve several microstructural toughening
13
mechanisms as matrix microcracking, fibre debonding and phase transformation
toughening. In the first two mechanisms, fractured surfaces are increased markedly
so more surface energy has to be provided, micro-displacements appear as apparent
strains and the energy consumption during fracture is increased. Polycrystalline
structures with anisotropic grains or composite structures with particles, platelets,
whiskers or fibers as second phases were produced to exhibit crack pinning, crack
deflection, crack bridging, fibre pullout, debonding and stress-induced
microcracking [11,12]. Phase transformation toughening utilizes a rapid stress
induced structural transformation that involves a molar volume increase and/or
shape change. The increased toughness is derived from the work required to induce
the transformation in the vicinity of the propagating crack and from the compressive
stresses produced by volume expansion that strengthen the material ahead of the
crack tip. This concept has been applied in monolithic zirconia and systems
containing dispersed zirconia particles [11,12]. Stress induced plasticity in metallic
binder and dispersed phases also enhanced fracture resistance [8]. Unfortunately, all
these solutions require an accurate control of raw materials and processing, are quite
expensive and only partially overcome the problem of strength scatter.
The latest developments in ceramic composites show that the use of layered
structures is the most promising method to increase mechanical performances and
reliability. Indeed, with multilayer ceramics it is possible to design a structure that
can be used to control cracks and brittle fracture. Some metal/ceramic laminates and
several multilayer ceramics, produce in a wide range of materials as alumina,
zirconia, silicon carbide, silicon nitride and boron nitride, have been investigated in
the past. In metal/ceramic laminates, the toughness enhancement is controlled by the
closure exerted by the metallic bridging layers astride the crack [13]. In ceramic
laminates, toughness has been enhanced by the introduction of weak interfaces or
internal stresses. The presence of weak interfaces allows for energy dissipation
before fracture through mechanisms of crack deflection, crack bridging and interface
delamination. The weakness is given by layers not wholly sintered, generally a
different material with respect to the main multilayer component, or by the addition
of pore forming agents in specific layers, bringing to porous structures [14–16].
Although the improvements in fracture resistance in these laminates were sufficient
14
to ensure their safe use in many structural applications, delamination and easy crack
propagation along the weak interface has been the major impediment for a wider
use. In the case of ceramic laminates with strong interfaces, strength and toughness
has been enhanced through design of controlled residual stresses. Tempered glasses
are a well recognize and inexpensive method to enhance mechanical properties by
the introduction of surface compressive stresses [1]. This goal can be achieved in
ceramics through the production of laminates where residual stresses arise from
differences in sintering rates, Young’s modulus or thermal expansion coefficients
among the laminae of dissimilar materials. The layer composition, as well as the
system’s geometry, allows the designer to control the magnitude of the residual
stresses. In particular, if compressive stresses are located at the surface of the
multilayer, strength is enhanced [17]. Reliability is favoured when compressive
residual stresses are induced in internal layers as in laminated structures composed
of alternating thin compressive layers and thicker tensile layers. These laminates are
characterized by a threshold strength below which rupture does not occur [18,19].
The most important limitation of such multilayers is that they can be used only with
specific orientations to the applied load and they are not suitable for producing
shells or tubes usually required in industrial applications.
Recently, Sglavo and co-workers [20–25] have demonstrated that the
introduction of a residual stress profile with the maximum compression at a certain
depth from the surface of a glass or a ceramic laminate can force the stable
propagation of surface flaws up to this specific depth before the final catastrophic
failure. Therefore, these materials exhibit high strength independent on the
dimensions of inherent defects and characterized by a limited scatter. High
mechanical reliability or minimum strength have been experimentally observed in
oxides laminated structures. In addition, the production of these innovative ceramic
laminates is economic because based on common ceramic materials and inexpensive
conventional fabrication methods. These laminated bodies are therefore natural
candidates for structural applications as in the case of load bearing components in
automotive and aircraft industry, biomedical prosthesis, chemical plant linings and
safety systems. The motivation for the use of these laminated composites can be
traced back to the observation of biological structures in which the most performing
15
parts of the material are located in regions that experience the highest stresses.
In this work, the approach proposed by Sglavo has been followed to design
and develop new alumina/silicon carbide composite laminates with high thermo-
mechanical performances. This materials system has been selected to produce lower
density bodies respect to the oxides systems previously studied. In fact, more often
density becomes a limitation or a requirement in selecting the ceramics for
structural, defence and biomedical applications. In addition, alumina and silicon
carbide possess higher thermal conductivity than most other ceramics. Thus they are
less subject to thermal cracking from sharp temperature gradients and have potential
for dynamic high temperature service such as rotors in gas turbines [1].
Alumina/silicon carbide composites have been studied extensively for their good
thermo-mechanical behaviour, especially remarkable high-temperature creep
resistance, and alumina itself is a potential matrix for structural composites with
high temperature capability because of its good stability at high temperatures [11].
The alumina/silicon carbide system represents also a challenge because of the
adverse effects during sintering, as weight loss and poor densification, so they are
generally prepared by hot pressing [11,26].
In the present paper, alumina/silicon carbide multilayered ceramics with
residual stress profiles engineered to promote the propagation of surface defects in a
stable manner up to a maximum depth have been designed and produced by tape
casting, lamination and sintering. Specifically, pressureless sintering and Spark
Plasma Sintering have been used for novel laminates manufacturing routes. The
results of the mechanical characterisation of the engineered laminates, compared to
the behaviour of simple homogeneous laminates, prove that the manufacturing
procedure described in this work can be used successfully to produce
alumina/silicon carbide composite laminates with improved reliability. Evidences of
stable growth phenomena occurring in the laminates have been demonstrated by the
analysis of the post indentation strength and by fractographic analysis.

17
Chapter II
Background
2. Background
2.1 Fracture behaviour of ceramic materials
2.1.1 Brittle behaviour and strength scatter
Ceramics are compounds that contain metallic and non metallic elements
held together by very strong covalent or ionic partially covalent bonding.
Considerable energy is required to break these bonding, therefore ceramic materials
exhibit refractoriness, chemical inertia, high elastic modulus and hardness, also at
temperatures above 1000°C. The chemical structure of this class of materials is also
responsible of another typical feature of ceramics: brittleness. The strong atomic
bonding do not allow a relevant plastic deformation, in which sliding between
crystalline planes occurs, and fracture happens essentially by bond rupture that
propagates in the body at high velocity and low stress levels in elastic field.
Therefore fracture occurs in brittle and catastrophic manner. Little energy is
absorbed in brittle fracture, just the energy to separate atoms and create new surface
is required. Negligible energy for plastic deformation or other dissipative processes
is involved over most of their useful range of operational temperature. As a
consequence, the energy requirement to fracture, or fracture toughness, of ceramics
is poor, with values typically below 5 MPa m0.5 [5,6].
Linear Elastic Fracture Mechanics (LEFM) is the basic theory of fracture
that deals with sharp cracks in elastic bodies. It is generally applied to materials that
exhibit linear elastic behaviour up to failure, as ceramics [7,8]. The basis of LEFM
has been originally developed by Griffith (1920) in realizing that bulk strength of
most materials is lower than the theoretical cohesive strength predicted from
interatomic potential considerations. He assumed most materials must contain cracks
that act as stress concentrators and reduce the maximum load bearing capability.
Griffith considered an infinite plate of unit thickness subjected to an external
18
uniform tensile loading and containing a through-thickness crack. He suggested a
criteria for the crack extension by developing an energy approach in which the static
crack is considered as a thermodynamically reversible system and fracture is a
process controlled by energy exchanges between the body and the loading system.
In 1948 Irwin observed that the energy balance proposed by Griffith involves terms
promoting crack extension and a term representing the resistance of the material. So
he defined two parameters: the “strain energy release rate” G as fracture driving
force and the “crack resistance force” R that represents all the crack propagation
resistance processes available inside the material. In addition, Irwin suggested that
all stress systems in the vicinity of a crack can be derived by only three modes of
loading of the crack faces (crack opening mode or mode I, shear mode or mode II
and tearing mode or mode III) and demonstrated, using an elastic analysis of
stresses, that the local tensions near a crack are higher than the stress applied to the
body. This amplification of stresses near the crack tip is represented by a parameter
called “stress intensity factor” K. Irwin proposed a simple relationship between K
and G and introduced a stress approach alternative to the energy approach. Both
approaches compare the moving force for crack propagation and the relative
material resistance pointing out that fracture occurs when a critical condition is
reached. In particular, failure is considered to occur when G and K, functions of
stress state and crack geometry, reach respectively R and the “fracture toughness”
Kc. These critical values are material intrinsic properties.
In this work, the stress approach and, for synthesis, only the crack loading
mode I will be considered. Among the three crack loading modes, mode I is indeed
the more common and dangerous in brittle materials. The stress intensity factor KI
corresponding to mode I is expressed by the relationship:
( ) 5.0I cπσYK = Eq. (2.1)
where Y is a dimensionless parameter that depends on the crack and loading
geometries, σ is the nominal applied stress and c is the crack length as measured
along the direction normal to the stress axis. The equilibrium condition for the crack
propagation is reached when KI reaches the critical value KIC:
19
ICI KK = Eq. (2.2)
Therefore, only the material toughness KIC and the defect dimension c are necessary
to completely describe the material strength σb as in the equation:
( ) 5.0IC
bcπY
Kσ = Eq. (2.3)
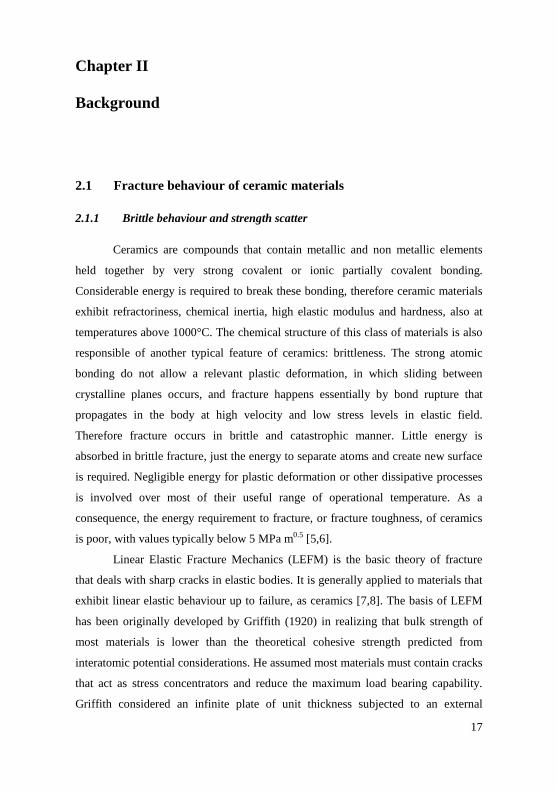
Considering Eq. (2.1) and Eq. (2.3) it is possible to represent the applied stress as
the angular coefficient of a straight line through the origin in the graphic KI/(Yπ0.5)
vs c0.5 (Figure 2.1). So, the strength of a material of toughness KIC, independent of
crack length, can be easily identified when the defect dimension is known.
Figure 2.1: Strength as a function of single-value fracture toughness KIC and defect
dimension c in the graphic KI/(Yπ0.5) vs c0.5. Strengths σb0 and σb1 relatives to c0 and
c1 crack lengths are shown.
Defects considered in Fracture Mechanics are sharp cracks with a well
defined geometry. In brittle materials these defects are generally assumed to form by
cleavage of atomic bonds in regions in which there are high local stresses. These
high stresses arise because of the heterogeneous nature of the material at the
20
microstructural level or because of inelastic deformation that cannot be
accommodated [6]. Defects, generally present both inside the component and on its
surface, can form during processing from voids, inclusions or agglomerates or can
produced during subsequent service from thermal shock or contacts events as
impacts, erosion and wear. Surface defects are considered more severe for ceramics
because bending load is usually applied and because internal flaws are more easily
avoidable through processing optimization. These crack like defects form a variable
and unknown statistic population, usually of the order of 5 µm to 200 µm in size
[27], that according to Eq. (2.3) lead to a strength distribution. Brittle fracture
strength depend on the stressed volume or surface area and typically exhibit
significant scatter, frequently with a coefficient of variation about the mean in
excess of 10% [27]. Consequently, ceramics are not characterized by a fracture
strength with a limited variability, useable safely in design, and manifest a poor
mechanical reliability that restrict their use in structural applications.
A probabilistic prediction of material performance is widely adopted for
materials which strength depends on the presence of an unknown defects population.
This variability in strength is often express in terms of probability of failure Pf of a
sample under a stress or probability of survival Ps = 1 - Pf. These probability, related
to the probability of existence in the material of defects of specific dimensions, are
generally calculated by using the probabilistic model developed by Weibull and
based on the weakest link fracture theory. The Weibull distribution of flaws is
usually adopted as statistical approach due to its capability to analyze material’s
phenomena represented by a symmetrical and asymmetrical data set. In the weakest
link approach the probability of occurrence of two events is the product of the
probability that each event take place independently. The test sample is considered
as a chain made of N elements and the failure of the entire chain happens when the
rupture of the weakest link befall. According to this approach, fracture is controlled
by the most critical defect, that is the defect of largest dimension favourably oriented
toward the tensile stress direction. The Weibull failure probability at a given stress σ
is defined in its simplest form by the two empirical parameters relation:
21
−
−=
m
0σ
σ
f e1P Eq. (2.4)
where σ0 is the characteristic strength and m is the Weibull modulus. The
characteristic strength can be interpreted as the strength value in which the
cumulative probability of failure of a body with unit volume is 63.2% and can be
calculated setting σ = σ0 in Eq. (2.4). It is related to the mean strength and dislocates
the distribution of strength in the stress space. The Weibull modulus describes the
scattering of the mechanical strength data. For ceramics, m is usually of the order of
5 to 20 [6], in particular of about 10 [8] for conventional as-finished ceramics while,
for structural ceramics, m varies between 3 and 12 [28], depending on processing
conditions. The higher the m value, the lower is the strength dispersion and the
higher the mechanical reliability. The expression of Eq. (2.4) is usually rearranged in
terms of logarithms to obtain the following relationship which allows an easy
estimation of the Weibull parameters:
0f
σlnmσlnmP1
1lnln −=
− Eq. (2.5)
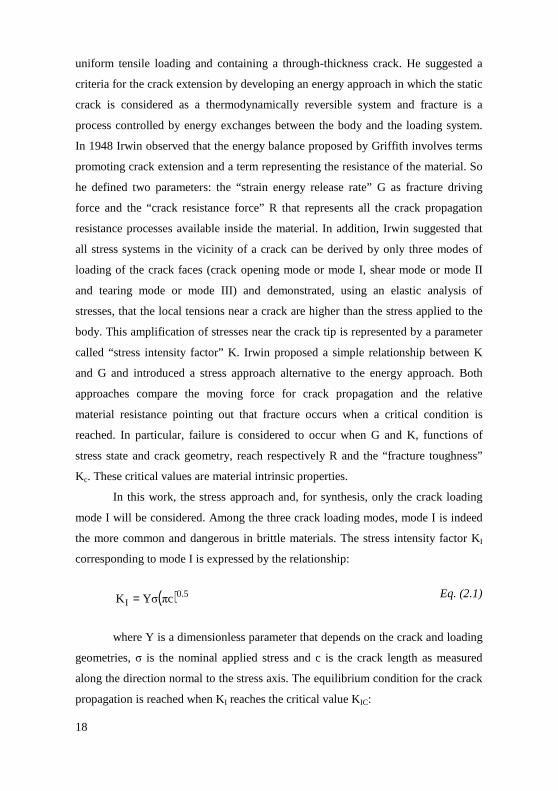
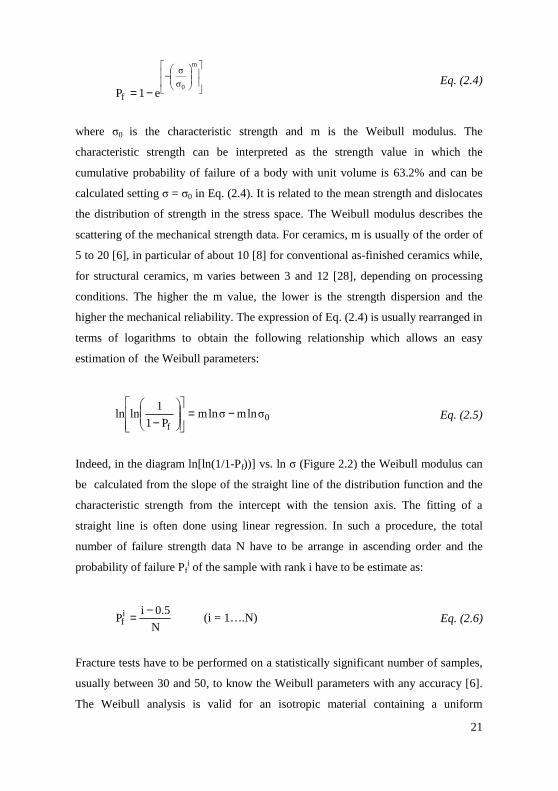
Indeed, in the diagram ln[ln(1/1-Pf))] vs. ln σ (Figure 2.2) the Weibull modulus can
be calculated from the slope of the straight line of the distribution function and the
characteristic strength from the intercept with the tension axis. The fitting of a
straight line is often done using linear regression. In such a procedure, the total
number of failure strength data N have to be arrange in ascending order and the
probability of failure Pfi of the sample with rank i have to be estimate as:
N
5.0iPi
f−= (i = 1….N) Eq. (2.6)
Fracture tests have to be performed on a statistically significant number of samples,
usually between 30 and 50, to know the Weibull parameters with any accuracy [6].
The Weibull analysis is valid for an isotropic material containing a uniform
22
distribution of isolated, not interacting defects and undergoing to fracture for
unstable propagation of the largest defect.
Figure 2.2: Weibull diagram for soda-lime glass and a vitreous-bonded
polycrystalline alumina tested under inert conditions [8].
Several alternatives have been proposed to overcome the problem of an
unacceptably high failure probability for typical design stress. One approach is to
reduce the strength dispersion and to improve the mechanical reliability of single
value toughness materials without changing the fracture toughness. This could be
accomplished by reducing the presence and/or dangerousness of defects by
shrinking the flaws distribution and limiting the largest defect dimension. For this
aim, some sophisticated powder processing technologies [10], that abate the density
and dimension of defects, and methods as crack healing [9], applicable to ceramics
that have the ability to heal cracks and recover strength, have been developed. Proof
testing [6,8] is also used, especially in aerospace and aircraft field, as a technique to
control the strength distribution. In a typical proof test, components are subjected to
a proof stress higher than that anticipated in service in severe conditions. The weak
components, with the largest flaws, fail or give an indication of failure and are
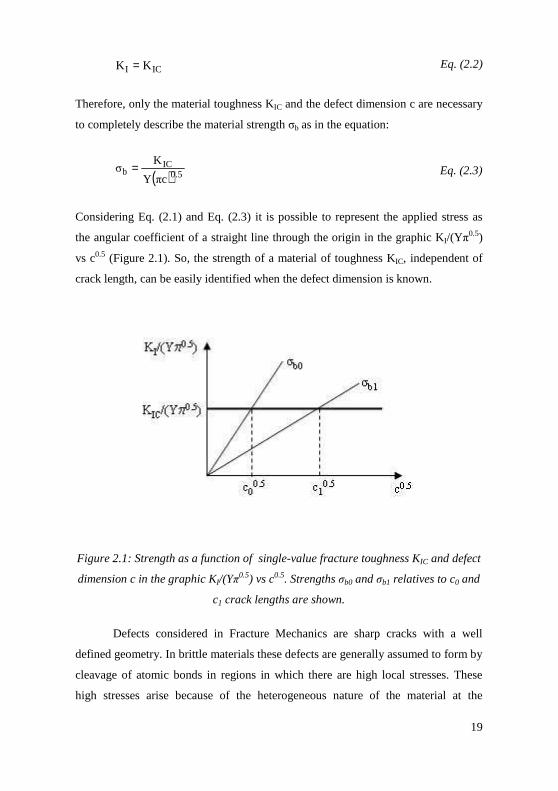
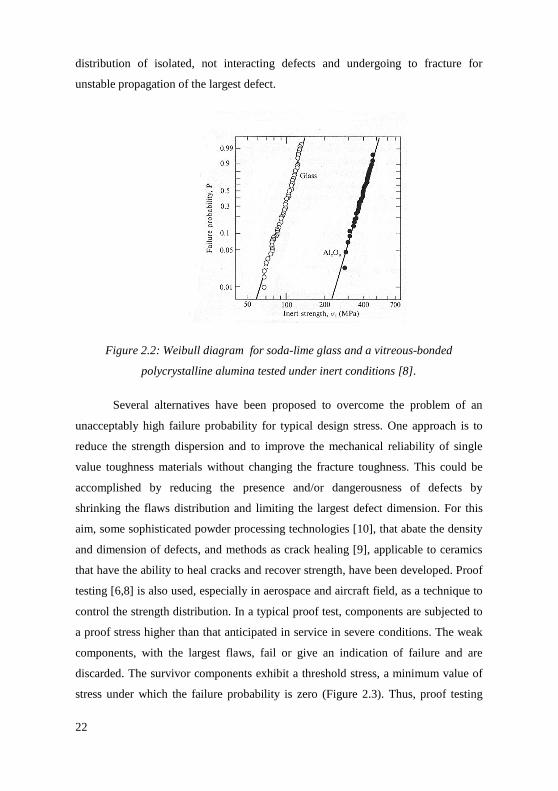
discarded. The survivor components exhibit a threshold stress, a minimum value of
stress under which the failure probability is zero (Figure 2.3). Thus, proof testing
23
truncates the strength distribution at lower stresses, guarantees that all components
will be at least as strong as the proof stress and establish a well defined stress level
for design. This method is very expensive, generates a high amount of waste
products and cannot be easily performed on big components. In addition, only the
severity of processing defects can be reduced while the reliability decrease due to
defects generated during service can not be avoided. Potential problems occur also
when subcritical crack growth accompanies proof testing.
Figure 2.3: Weibull plots for hot-pressed silicon nitride before (open circles) and
after (filled circles) proof testing at σ = σP [8].
2.1.2 T-curve behaviour and microstructural toughening
In the early use of fracture mechanics, brittle ceramics was considered to
assume a fracture toughness independent on crack length [6]. In this case, the
equilibrium condition for crack propagation is defined by Eq. (2.2). Now, consider a
body with single value toughness KIC containing a crack of length c0 and subjected
to an applied load gradually increased from zero to a maximum level (Figure 2.1).
At low stress levels the corresponding stress intensity factor KI is lower than KIC and
the crack maintains its length, if subcritical phenomena are not active. When the
applied stress is high enough to reach the critical conditions expressed by Eq. (2.2),
and thus the σb0 value, the crack initiate to propagate. Moreover, as the crack
24
extends, the applied stress intensity factor increases more rapidly then the material
toughness, a finite difference between KI and KIC is produced and the excess energy
stored in the material is dissipated in kinetic energy as crack acceleration. The crack
begins its acceleration on a relatively smooth surface or “mirror zone” [8]. The
running crack speed increases up to a maximum value related to the motion ability
of the local stress field near the crack tip. When the maximum speed is reached, the
mechanical energy released by crack propagation is dissipated in branching and
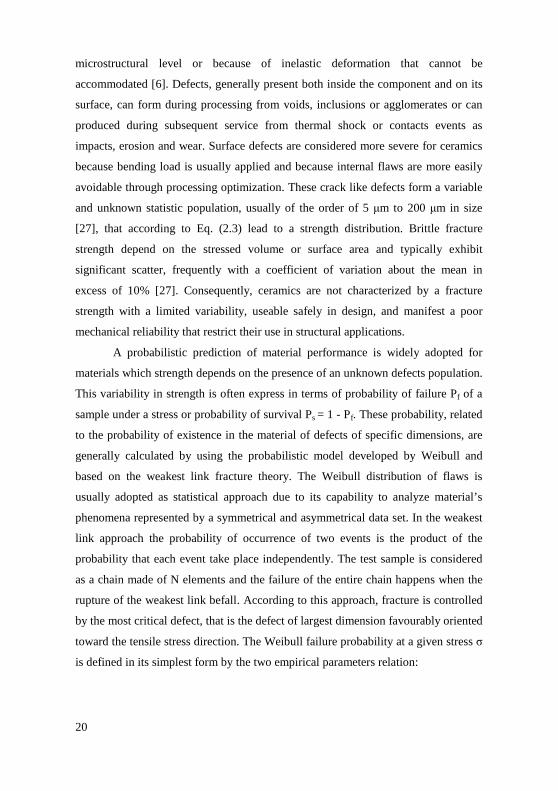
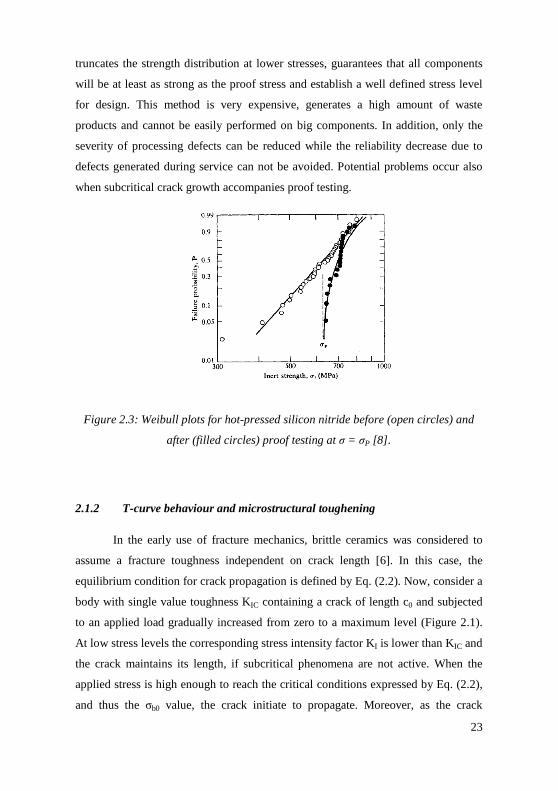
noising. At this critical stage of propagation severe surface roughening or “hackle
zone” is produced. An intervening transition region of fine scale subsidiary
fracturing of “mist zone” is also present (Figure 2.4). This kind of fracture
propagation is unstable.
Figure 2.4: Fracture surface of fused silica glass rod broken in bending, showing
mirror, mist and hackle zones spreading outward from fracture origin (indicated by
the arrow in the lower edge) [29].
However stable, slow and quasi-static, crack growth is also possible in two
particular circumstances. In some cases the combination of sample geometry and
loading conditions can lead the applied stress intensity factor to decrease with
increasing crack length. This requirement is satisfied for fixed grip loading
25
conditions on a material exhibiting single value toughness as in the Obreimoff
(1930) experiment on the cleavage of mica [6,8]. For this case, the crack propagates
to an equilibrium length but immediately arrest, since the stress intensity factor is
lower than the toughness for any further crack increment. To restart propagation it is
necessary to increase the displacement. The second circumstance occurs in materials
exhibiting a fracture toughness that increases steeper than the applied stress intensity
factor with crack extension. These materials experience the T-curve behaviour,
where T means toughness. When the energy approach is followed, the denomination
R-curve behaviour, where R is the resistance to crack growth, is commonly used.
Therefore, the conditions of stable propagation of crack are satisfied when the
equilibrium is satisfied and when the increase of toughness with crack extension is
larger than the corresponding increase of stress intensity factor:
≤
=
dc
dK
dc
dKKK
ICI
ICI Eq. (2.7)
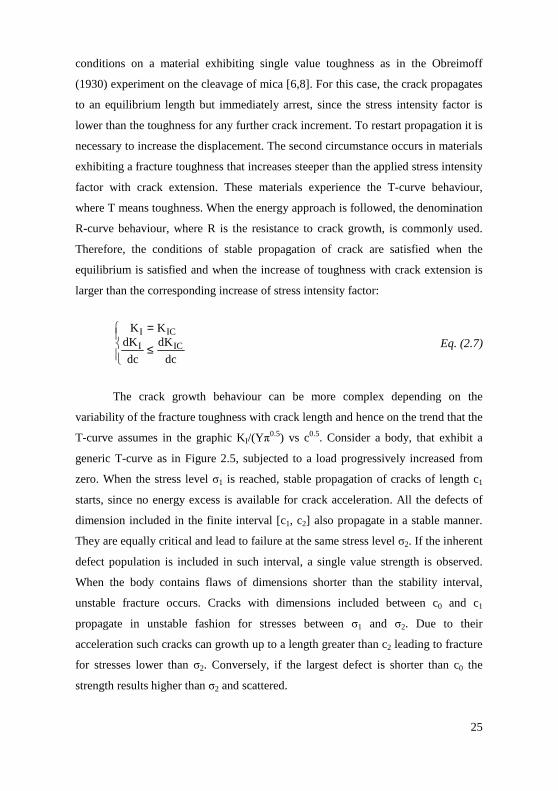
The crack growth behaviour can be more complex depending on the
variability of the fracture toughness with crack length and hence on the trend that the
T-curve assumes in the graphic KI/(Yπ0.5) vs c0.5. Consider a body, that exhibit a
generic T-curve as in Figure 2.5, subjected to a load progressively increased from
zero. When the stress level σ1 is reached, stable propagation of cracks of length c1
starts, since no energy excess is available for crack acceleration. All the defects of
dimension included in the finite interval [c1, c2] also propagate in a stable manner.
They are equally critical and lead to failure at the same stress level σ2. If the inherent
defect population is included in such interval, a single value strength is observed.
When the body contains flaws of dimensions shorter than the stability interval,
unstable fracture occurs. Cracks with dimensions included between c0 and c1
propagate in unstable fashion for stresses between σ1 and σ2. Due to their
acceleration such cracks can growth up to a length greater than c2 leading to fracture
for stresses lower than σ2. Conversely, if the largest defect is shorter than c0 the
strength results higher than σ2 and scattered.
26
Figure 2.5: T-curve with a stable crack growth interval [c1,c2]. Straight lines
correspond to the applied stress intensity factor associated to the threshold stress σ1
and the strength σ2.
Fracture toughness, considered as a function of crack length, is more
properly a function of the crack length increase in materials where toughening
processes at the crack tip are active on growing cracks. The T-curve behaviour of
such materials is a key factor to obtain a reduced defect sensitivity, or flaw
tolerance, a lower strength scatter, a better mechanical reliability and a more wide
industrial application. For this reason, fracture mechanics concepts have been used
by scientists to study toughening mechanisms and to produce new ceramics with
manipulated microstructure and improved mechanical behaviour. Plastic
deformation mechanisms are inhibited in ceramic materials, thus researchers have
developed specific polycrystalline or composites microstructures in which energy
dissipative toughening mechanisms are promoted. One theory on how the material
microstructure influences crack propagation and toughness is crucial for the study
and development of tough ceramics. Unfortunately, the general behaviour of real
cracks in ceramic microstructures is too much complex to be treated and several
theories, that simplify the model considering a single toughening mechanism at a
time, have been proposed. As a matter of fact, different mechanisms can act together
27
and the total effect is not necessarily a simple linear combination of the single
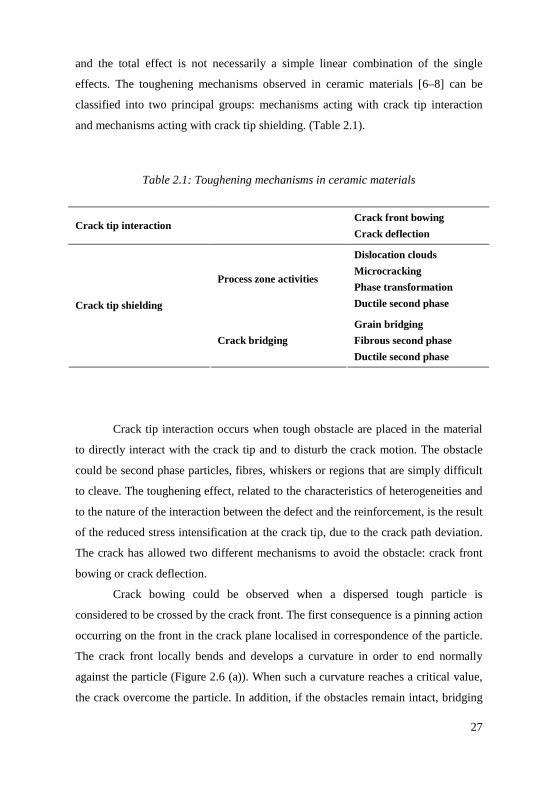
effects. The toughening mechanisms observed in ceramic materials [6–8] can be
classified into two principal groups: mechanisms acting with crack tip interaction
and mechanisms acting with crack tip shielding. (Table 2.1).
Table 2.1: Toughening mechanisms in ceramic materials
Crack tip interaction Crack front bowing
Crack deflection
Process zone activities
Dislocation clouds
Microcracking
Phase transformation
Ductile second phase Crack tip shielding
Crack bridging
Grain bridging
Fibrous second phase
Ductile second phase
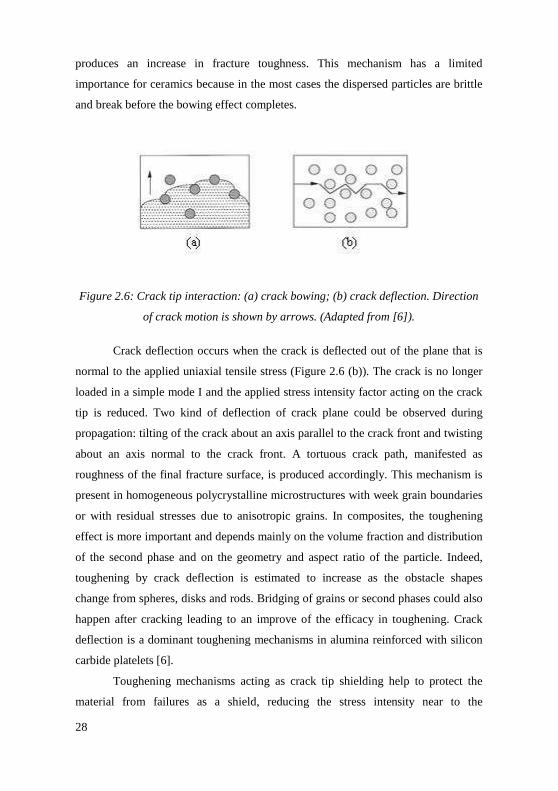
Crack tip interaction occurs when tough obstacle are placed in the material
to directly interact with the crack tip and to disturb the crack motion. The obstacle
could be second phase particles, fibres, whiskers or regions that are simply difficult
to cleave. The toughening effect, related to the characteristics of heterogeneities and
to the nature of the interaction between the defect and the reinforcement, is the result
of the reduced stress intensification at the crack tip, due to the crack path deviation.
The crack has allowed two different mechanisms to avoid the obstacle: crack front
bowing or crack deflection.
Crack bowing could be observed when a dispersed tough particle is
considered to be crossed by the crack front. The first consequence is a pinning action
occurring on the front in the crack plane localised in correspondence of the particle.
The crack front locally bends and develops a curvature in order to end normally
against the particle (Figure 2.6 (a)). When such a curvature reaches a critical value,
the crack overcome the particle. In addition, if the obstacles remain intact, bridging
28
produces an increase in fracture toughness. This mechanism has a limited
importance for ceramics because in the most cases the dispersed particles are brittle
and break before the bowing effect completes.
Figure 2.6: Crack tip interaction: (a) crack bowing; (b) crack deflection. Direction
of crack motion is shown by arrows. (Adapted from [6]).
Crack deflection occurs when the crack is deflected out of the plane that is
normal to the applied uniaxial tensile stress (Figure 2.6 (b)). The crack is no longer
loaded in a simple mode I and the applied stress intensity factor acting on the crack
tip is reduced. Two kind of deflection of crack plane could be observed during
propagation: tilting of the crack about an axis parallel to the crack front and twisting
about an axis normal to the crack front. A tortuous crack path, manifested as
roughness of the final fracture surface, is produced accordingly. This mechanism is
present in homogeneous polycrystalline microstructures with week grain boundaries
or with residual stresses due to anisotropic grains. In composites, the toughening
effect is more important and depends mainly on the volume fraction and distribution
of the second phase and on the geometry and aspect ratio of the particle. Indeed,
toughening by crack deflection is estimated to increase as the obstacle shapes
change from spheres, disks and rods. Bridging of grains or second phases could also
happen after cracking leading to an improve of the efficacy in toughening. Crack
deflection is a dominant toughening mechanisms in alumina reinforced with silicon
carbide platelets [6].
Toughening mechanisms acting as crack tip shielding help to protect the
material from failures as a shield, reducing the stress intensity near to the
29
propagating crack tip. They are always characterized by a process zone around the
crack tip or by a bridging zone behind the crack tip that contains unbroken
reinforcing items behaving as ligament between the opposite cracked surfaces. In
some cases, process zone and bridging zone could be present together with a
synergic effect on fracture toughness. The resistance to crack propagation in the
process zone toughening mechanisms is due to phenomena, localised in a circular
region in the front of the crack, involving a non linear deformation that reduce the
stresses acting on the crack tip. The shielding effect in this region rises from the
interaction between the highly intensified stress field and the material
heterogeneities. The main process zone toughening mechanisms are dislocation
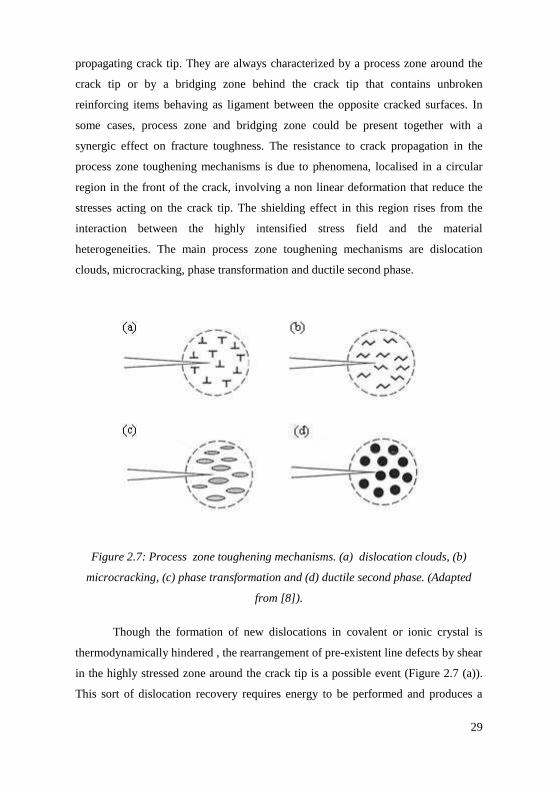
clouds, microcracking, phase transformation and ductile second phase.
Figure 2.7: Process zone toughening mechanisms. (a) dislocation clouds, (b)
microcracking, (c) phase transformation and (d) ductile second phase. (Adapted
from [8]).
Though the formation of new dislocations in covalent or ionic crystal is
thermodynamically hindered , the rearrangement of pre-existent line defects by shear
in the highly stressed zone around the crack tip is a possible event (Figure 2.7 (a)).
This sort of dislocation recovery requires energy to be performed and produces a
30
slight increase in fracture toughness. Therefore, this mechanism is of limited
importance in ceramic materials.
Microcracking phenomenon regards the nucleation and the development of
microcracks within the process zone because of the high stress level present in the
location (Figure 2.7 (b)). Nucleation starts in intrinsic week sites as intergranular
defects or zones containing localized residual tensile stresses. These residual stresses
could be the result of phase transformations, thermal expansion anisotropy in single
phase polycrystalline ceramics and thermal expansion or elastic mismatch in
composite materials. So, microcracking can form spontaneously during fabrication
processes, as in a cooling step, due to differences in the thermal expansion
coefficient of phases or anisotropic grains. The toughening effect derives from the
stress relaxation within the process zone and from the energy dissipated as
mechanical work to increase the length and the crack open displacement of
microcracks.
Phase transformation toughening is the most important process zone
toughening mechanism. This phenomenon could be exploited in materials
containing grains able to withstand a phase transformation with volume expansion
under the action of the stress field around the propagating crack (Figure 2.7 (c)).
Transformation toughening almost always involves the use of partially stabilized
zirconia particles in a ceramic matrix, as alumina. Zirconia has several polymorphic
transformations as it cools, cubic to tetragonal at 2370°C and tetragonal to
monoclinic at 1000−1200°C [6]. The latter step is a martensitic type reaction that
involves a ~4% volume expansion and a ~7% shear strain [6]. This step is easily
avoided during the cooling process after sintering by stabilizing the tetragonal phase
at ambient temperature with several agents as yttria, ceria and magnesia. However
the phase transition could also occurs by a shear displacement. Therefore, the
application of large mechanical stresses to the composite, as during the fracture
process near the crack tip, nucleates the tetragonal to monoclinic phase change. The
accompanying volume expansion induces compressive stresses that strengthen the
material ahead of the crack tip and increase fracture toughness.
The dispersion of ductile particles, typically metals, in a ceramic matrix is
another practical way to increase fracture toughness (Figure 2.7 (d)). The high
31
tensile stresses present in the region around the crack tip allow to reach the yielding
condition for the ductile phase and hence the energy consumption in plastic
deformation. The fracture toughness increase is also related to the subsequent
bridging phenomena by ductile particles acting on the crack surfaces.
Crack bridging mechanisms are due to processes occurring before the crack
tip, also at high distances. Pulling forces between the cracked surfaces are developed
by the interlock of agents acting as bridges that hinder additional crack opening. The
mechanical work required to overcome these pulling forces promotes an increase of
fracture toughness. The reinforcing agents can be simple grains, fibres, whiskers or
ductile particles. Many monophase polycrystalline ceramics with elongated and
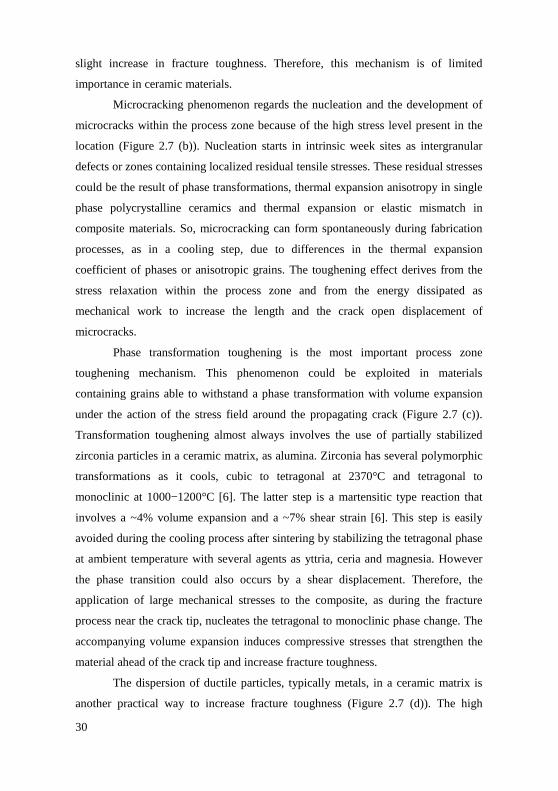
large grains exhibit grain bridging after intergranular fracture (Figure 2.8).
Figure 2.8: Grain bridging. (Adapted from [8]).
The shape and dimensions of grains and the presence of residual stresses,
that support the grains contact after fracture, are the microstructural variables of this
mechanism. In particular, two toughening effects happen when the crack propagates
on the intergranular path and runs into a grain boundary. Crack deflection
phenomenon occurs because the crack plane is tilted on the grain boundary and it is
not yet perpendicular to the applied load. Grain bridging follows the fracture with
mechanic interlock and friction between grains. The toughness improvement is
higher for longer cracks involving more grains and for bigger grain dimensions.
Nevertheless, the grain size has to be small enough to obtain good strength values
according to the Hall-Petch relationship [12]. The T-curve behaviour induced by this
toughening mechanism in polycrystalline alumina is substantial, especially for
grains with size of about 10−20 µm [30]. The prevalent fracture mode in alumina is
indeed the intergranular mode, with transgranular fracture partially present in grains
32
bigger than 15 µm [8].
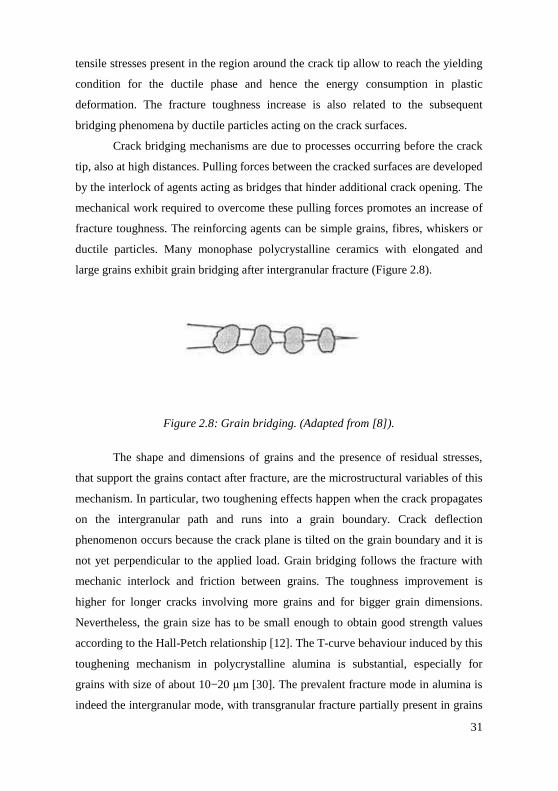
The arising of a bridging zone during fracture is an efficient toughening
mechanism acting in composite microstructures where a second reinforcing phase is
added to a matrix. These ceramic composites can be classified, according to the
main active phenomenon, as composites reinforced with brittle embodiments and
composites reinforced with ductile second phases.
Figure 2.9: Crack bridging in composites. (a) fibrous second phase, (b) ductile
second phase. (Adapted from [8]).
The brittle reinforcements, usually whiskers and fibres, are characterized by
toughness values comparable with the matrix one and high strength. Therefore, the
bridging zone effect (Figure 2.9 (a)) is usually increased by the presence of week
interfaces between the matrix and the second phase. Intact bridges and frictionally
sliding bridges, or pull-out, are the basic events observable as the crack propagates.
When the bridging item is not broken and still bonded to both crack surfaces, part of
the tensile stresses are supported as localised pulling forces by elastic deformation of
the item intersected by the crack front. Only the reinforcement in the region near the
crack are involved in this pulling action since the crack opening displacement is too
large at higher distances. Pull-out occur when the reinforcing agent strength is
higher than the adhesion between agent and matrix. This phenomenon of frictionally
sliding bridges is always preceded by debonding, a phase when the crack deflects
and follows a path along the interfaces reinforcement/matrix. Excluding phase
transformation, pull-out is the most effective toughening mechanism in ceramics
since the amount of involved energy is considerably large. Quite high toughness
values can be also reached when ductile particles are added to a ceramic matrix. The
33
bridging effect is exerted during the elastic elongation of intact particles up to the
yielding condition and during the further plastic deformation of bridges arranged in
the region near the crack (Figure 2.9 (b)).
As a consequence of these toughening mechanisms, T-curve behaviour,
leading to increase of fracture toughness typically from 1−5 MPa m0.5 up to even 35
MPa m0.5 [6], and improved mechanical reliability can be observed in proper well-
designed monophase or composite microstructures.
2.2 Alumina/silicon carbide composites
Alumina is one of the most popular ceramic materials used in structural
applications because of its excellent properties such as chemical stability, high
melting temperature, strength, hardness and corrosion resistance. Due to its
refractory nature, alumina is widely used in thermal liners, thermal barrier
installations, high temperature insulating systems, crucibles and heaters. However,
similarly to most ceramics, the intrinsic brittleness of monolithic alumina limits its
reliability and prevents its wider usage. Therefore, addition of inert second phase,
like hard ceramic particulate, platelets and whiskers, to monolithic alumina is an
effective way for strengthening and toughening. The second phases control the
microstructure, by suppression of grain growth or control of grain morphology, and
improve toughness according to the mechanisms presented previously. Some
popular examples of ceramic matrix composites include Al2O3/ZrO2(p) and
Al 2O3/SiC(w) which are used as wear parts, bioceramics and cutting-tool inserts.
SiC is an ideal candidate for the reinforcement for alumina composites,
especially for structural applications at high temperature, due to its wide availability,
low cost, low density and excellent thermal properties, such as low thermal
expansion coefficient, high thermal conductivity and high melting point.
Conversely, SiC has poor sinterability, owing to its strong covalent bonding and low
surface-to-grain boundary energy ratio. Alumina, which has high ionic character and
low oxygen diffusion coefficient, compensates the poor sinterability of SiC and
protect the carbide from oxidation in severe operative conditions [11,12]. Al2O3/SiC
composites have been studied extensively for their good mechanical behaviour,
34
especially good high temperature performances. Large differences in the mechanical
properties of Al2O3/SiC composites could be obtained because of the variations in
microstructure and fracture behaviour related to the effect of different SiC
reinforcements shapes as whiskers, platelets and particulates.
2.2.1 SiC whiskers-reinforced alumina composites
SiC whiskers have been successfully incorporated into alumina by many
researchers to obtain superior mechanical and tribological properties as compared
with conventional monolithic alumina, also at temperatures above 1200°C
[11,12,31,32]. Al2O3/SiC(w) is one of the most widely studied ceramic composite
materials and it is presently being commercially fabricated for wear and mechanical
machining applications. Generally, the SiC whisker diameters and aspect ratios are
in the range of 0.1 µm to 1 µm and about 10−20, respectively. Mechanical properties
such as fracture toughness and fracture strength of alumina remarkably increase with
increasing whisker content, that could reach 40 vol%, as shown in Table 2.2 [11,31].
The increase in fracture toughness of these composites has been attributed to crack
deflection due to whiskers presence, with some contribution from crack bridging and
whisker pull-out occurring in the process zone around the crack front (Figure 2.10).
Rising T-curve behaviour with increasing crack extension has also been observed in
these composites, as associated to the toughening mechanisms [32]. However,
whiskers reinforced composites are relatively expensive materials to produce and
there are health concerns related to the asbestos-like geometry of whiskers. Since
microstructural homogeneity of whisker reinforced alumina is of primary
importance to achieve successful toughening and its lack may be responsible for
strength decrease, whisker agglomeration may represent strength limiting flaw.
Unfortunately, it is difficult to obtain good dispersion of whiskers within a matrix
and whiskers-containing powder compacts are not easy to compact and densify
because of formation of constraining networks of whiskers. These networks usually
exert tensional stresses on the matrix and severely inhibit particle rearrangement and
shrinkage during sintering. Therefore hot pressing, which leads to composites with
anisotropic properties, is a common practice for the densification of whisker
containing composites.
35
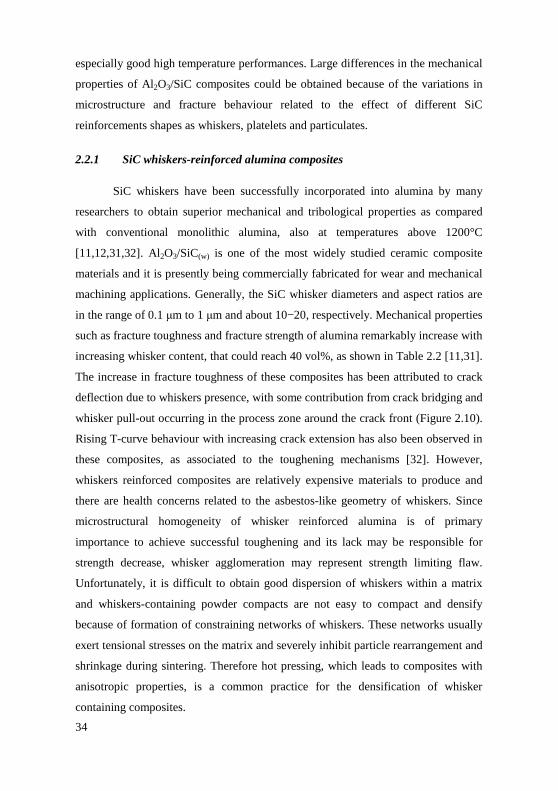
Table 2.2: Fracture strength and toughness at ambient temperature of Al2O3/SiC(w)
composites with different whiskers content (Adapted from [11]).
Whiskers content [vol%] Strength [MPa] Toughness [MPa m0.5]
0 150 4.3
5 475 4.0
10 540 4.8
15 652 4.6
20 675 6.1
30 641 8.7
40 850 6.2
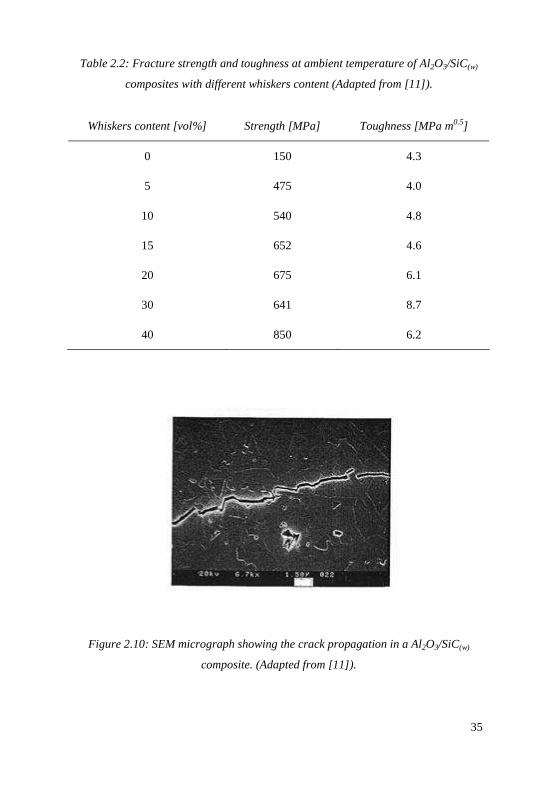
Figure 2.10: SEM micrograph showing the crack propagation in a Al2O3/SiC(w)
composite. (Adapted from [11]).
36
2.2.2 SiC platelets-reinforced alumina composites
The great advantage in using platelets as reinforcements in composite
fabrication (Figure 2.11) is related to their less critical geometry respect to whiskers.
Platelets are not dangerous to health as are whiskers, are cheaper to manufacture
and process, since no special processing technique are required, and could be
introduced in a ceramic matrix in higher contents respect to whiskers without
agglomeration problems that could hinder densification [11,12,33,34]. Platelets are
available in wide range of dimensions and chemical composition. Strength and
toughness of alumina can be increased upon the addition of SiC platelets, with
careful control of the reinforcements sizes and orientation, but the toughening effect
is limited as compared to whiskers reinforced alumina. For example, a toughness
value of 7.1 MPa m0.5, with 70% of increase respect to pure alumina, was reported
for an alumina composite containing 30 vol% SiC platelets [33]. Crack deflection
and grain bridging, acting only when the platelet faces are oriented parallel to the
tensile stress direction, are toughening mechanisms leading to the T-curve
behaviour.
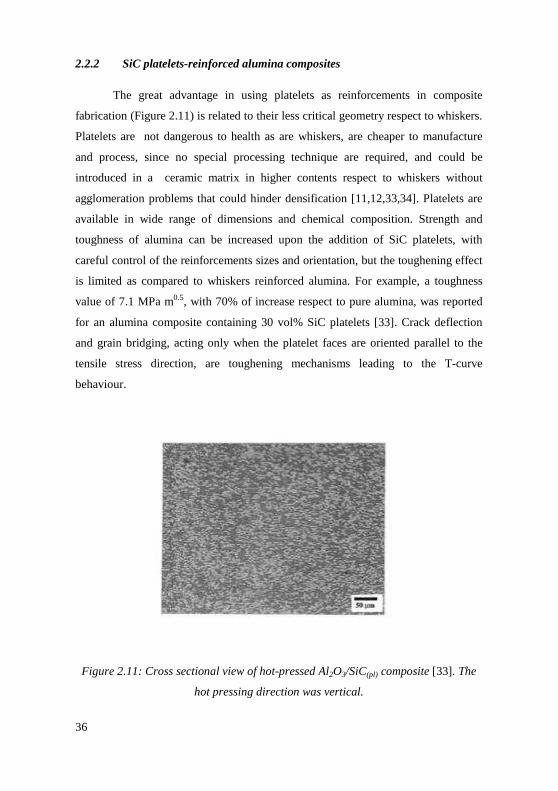
Figure 2.11: Cross sectional view of hot-pressed Al2O3/SiC(pl) composite [33]. The
hot pressing direction was vertical.
37
2.2.3 SiC particles-reinforced alumina composites
The improvement of the mechanical properties of alumina ceramics by SiC
particles as inert second phases is another promising alternative for the more
common whisker reinforcement. Effectively, Al2O3/SiC particle composites were
developed more recently and, in particular, Al2O3/SiC nanocomposites have been
researched intensively because they have been reported to have drastically improved
mechanical properties over the basic alumina [26,35–42].
Nanocomposite materials can be defined as composites of more than one
Gibbsian solid phase where at least one of the phases shows dimensions in the
nanometre range [26]. The solid phases can be exist either in amorphous,
semicrystalline or crystalline states. Niihara and co-workers [35] reported that the
flexure strength of hot pressed alumina changed from 350 MPa to more than 1 GPa
when it was reinforced with only 5 vol% of SiC particles with an average size below
0.3 µm. The fracture toughness also increased from 3.5 MPa m0.5 to 4.8 MPa m0.5. In
addition, these nanocomposites has excellent high-temperature properties. For
instance, its creep rate at 1200°C is about three orders of magnitude lower than that
of alumina. Chae et al. [36] produced by spark plasma sintering alumina reinforced
with 20 vol% nano-SiC exhibiting flexural strength of 812 MPa and average fracture
toughness of 3.6 MPa m0.5 compared with 663 MPa and 2.95 MPa m0.5 for the pure
alumina compact, respectively. Flaw healing, machining induced surface
compressive stresses, refinement of matrix grains because of the SiC nanoparticles
and tightening of the grain boundaries by the compressive stress field created by the
intragranular nanoparticles embedded in the alumina grains are believed to be the
main strengthening mechanisms. The grain refinement in alumina has been
attributed to a decreased grain boundary mobility and retarded grain growth of
alumina caused by SiC particles. Indeed, the diffusion at the Al2O3/SiC interface is
slow due to the strong directional bonding of both Al 2O3 and SiC [42]. In addition,
fracture mode changes from mixed inter/transgranular in pure alumina to pure
transgranular within the nanocomposites, because of the dispersion of the
nanoparticles within the matrix. This was explained by Levin et al. [38] as a
consequence of the tensile residual stresses field which develops in the matrix
38
around intragranular particles because of the thermal expansion mismatch. In
polycrystalline alumina, tensile residual microstresses are expected at some grain
boundaries because of thermoelastic anisotropy. These tensile microstresses can
promote intergranular fracture in monolithic alumina. SiC particles included in
alumina matrix grains should create local compressive stresses on grain boundaries
thus strengthening the boundaries. The formation of stress fields around the silicon
carbide particles is based on the differences in thermal expansion of the materials,
which causes radial compressive stresses around silicon carbide particles upon
cooling. The stronger Al2O3/SiC interface bonding with respect to Al2O3/Al 2O3
boundaries (the magnitude of interfacial fracture energy between SiC and Al2O3 is
over twice the Al2O3/Al 2O3 grain boundary fracture energy) can also be taken into
account as inhibiting the crack to propagate along the interface. The residual stresses
deflect the crack towards the intragranular particles, promoting transgranular
fracture in the matrix. The change in fracture mode can also account adequately for
the increase in fracture toughness in these nanocomposites. Only in the case of
elongated and irregular alumina grain morphology, obtained by adjusting SiC
content and presence of impurity, a T-curve behaviour could also be considered as
toughening effect [37]. In fact the T-curve in nanocomposites is less apparent
respect to alumina because of the matrix grain size decrease that impair grain
bridging.
Strength and fracture toughness of alumina can be increased also by the
inclusion of micrometric SiC particles. Zhang et al [42] observed that hot pressed
alumina with 20 vol% SiC particles, with average size equal to 2.7 µm, shows
strength and toughness higher than that of monolithic alumina by about 20% at
ambient temperature while at 1200°C the increase is of about of 30% and 70%
respectively. The strengthening and toughening effect is higher for higher SiC
contents. These particulate reinforced alumina matrix composites display improved
fracture toughness due to crack tip shielding, crack branching and crack deflection.
Micrometric SiC particles are usually allocated at the grain boundaries, which
results strengthened by the strong SiC/Al2O3 interfaces, leading to a typical fine and
equiaxed morphology of alumina grains and a transgranular fracture mode of the
composite.
39
2.2.4 Alumina/silicon carbide hybrid composites
The addition of nanometre-size SiC particles within alumina matrix grains
has been found to achieve a remarkable improvement in fracture strength, reliability
and high temperature deformation resistance respect to pure alumina. However the
significant increase in fracture toughness was difficult to achieve in Al2O3/SiC
nanocomposites. One possible solution of overcoming this disadvantage is to add a
third phase into nanocomposites, since the addition of reinforcement with high
aspect ratio leads to a large increase in fracture toughness. According to this idea,
fully dense SiC platelets reinforced Al2O3/SiC nanocomposites exhibiting improved
strength, as high as 700 MPa, fracture toughness, with up to 8.5 MPa m0.5, T-curve
behaviour and creep resistance were fabricated by conventional powder mixing
process and hot pressing [43].
2.2.5 Sintering of alumina/silicon carbide composites
Alumina produced by conventional powder routes can be completely
densified in air at 1550°C while higher temperatures are necessary to sinter
Al 2O3/SiC composites. Indeed, diffusion at the Al2O3/SiC interface is slower than at
the Al2O3/Al 2O3 interface due to the strong directional bonding of both Al2O3 and
SiC. Since densification in alumina is controlled by grain boundary diffusion the
presence of intergranular SiC limits densification [42]. Consequently, work has been
carried out into the use of sintering aids which lower the sintering temperatures,
enhance diffusion rates or allow for faster sintering by creating a liquid phase [44–
47]. Y2O3 and MgO have been investigated as sintering aids for Al2O3/SiC
composites both individually and together. In alumina ceramics, it is well known
that MgO is able to inhibit discontinuous grain growth and to promote sintering
which leads to full density [48]. On the other hand, a small addition of Y2O3 can
enhance the densification rate but accelerates the grain growth and is not so good for
densification of alumina [46]. However, yttria enhanced the sinterability of the
Al 2O3/SiC composites without any substantial microstructural degradation. Pillai et
al. [46] found the most dramatic effect was with 1 wt% Y2O3, with increasing
density of a Al2O3/5 vol% SiC nanocomposite from 92% to 99% at only 1550°C.
40
Cock et al. [44] produced fully dense fine grained Al 2O3/5 vol% SiC nanocomposite
with an yttria content of 1.5 wt% and a sintering temperature of 1600°C. The
enhancement of sintering by yttria in the Al2O3/SiC composites is because of the
reaction of silica on the surface of the SiC particles (the surface of SiC particles is
usually covered by a 0.3−0.7 nm coating of native amorphous silica [49]) with
alumina and yttria and possibly other impurities to increase Si and Y concentrations
in Al2O3/Al 2O3 grain boundaries producing a grain boundary composition with
relatively high diffusion rates at the used sintering temperatures. Discrete regions of
(3Y2O3·5Al2O3) yttrium aluminum garnet (YAG) could form within the alumina
grains at the highest yttria content, probably precipitating upon cooling from a
multicomponent eutectic liquid, with melting temperature below 1700°C.
Unfortunately, the formation of low melting liquid phases due to sintering aids are
detrimental to high temperature properties of these composites.
Therefore, high sintering temperatures above 1700°C, in Ar or N2 as inert
atmospheres used to avoid SiC oxidation, are usually required in fabricating
Al 2O3/SiC composites. On the other hand, it has been reported that in conditions of
high temperature and low oxygen partial pressure, significant weight losses of the
composite samples and several deleterious reactions like alumina decomposition,
formation of carbides, oxycarbides, liquid phases and volatile species can occur [50–
56]. Barclay et al. [50] observed that, when sintering was conducted in a graphite
resistance furnace with a flowing argon atmosphere, the problem of SiC oxidation
was eliminated, however the compacts exhibited weight losses on the order of 1%
and 10% at 1550°C and 1800°C respectively due to significant reduction of
alumina. Assmann et al. [56] found weight losses above 30 wt% for the 25 vol% SiC
content composite pressureless sintered at 1766°C under flowing Ar in a graphite
furnace. Weight loss increases with sintering temperature and time, and SiC content.
When sintering was conducted in N2, weight loss was reduced but phases as AlN, ε-
SiAl7O2N7 and Al11O5N were formed. Moreover, a permanent melt with the
composition of the eutectic in the Al2O3/Al 4C3 system or a silicate glass due to the
reaction between Al2O3,Al4C3 and SiC can be produced [55]. Misra [54] pointed out
the effect of C and SiO2 content in SiC liquid phase sintering and showed that the
involved major gaseous species are CO, Al2O, SiO and Al vapour. Jackson et al.
41
[53] reported that sintering SiC with mixtures of Al2O3/Al 4C3 to form Al2OC or a
liquid phase is accompanied by a loss in weight which contributed to a reaction
between Al2O3 and SiC to produce gaseous SiO, Al2O and CO. Also Gadalla et al.
[51] proved that alumina reacts with SiC to form, above 1700°C, Al2OC and Al4O4C
as condensed phases and SiO and CO as gaseous species. Baud et al. [57] made a
complete thermodynamic analysis of the vaporization behaviour of SiC/Al2O3 and
SiC/Al2O3/Y2O3 samples in a open system at 1200−2300K concluding that
vaporization occurs following the fundamental following reactions:
Al 2O3(s) + SiC(s) ↔ Al2O(g) + SiO(g) + CO(g) React. (2.1)
Al 2O3(s) + 2SiC(s) + Al2O ↔ 2SiO(g) + 2CO(g) + 4 Al(g) React. (2.2)
Therefore, the main gas species are Al(g), Al2O(g), SiO(g) and CO(g). The relative
amount of the constituent solid compounds changes with time. For alumina rich
samples the mixture tends toward pure alumina. When taking into account additional
graphite, the CO(g) partial pressure increases and additional phases like Al4O4C,
Al 2OC or Al4SiC4 can occur. These results leads to the affirmation that a control of
the sintering conditions of the Al2O3/SiC system is essential.
In view of the difficulties encountered with pressureless sintering, hot
pressing has been used to densify these composites [11,26]. Conventional powder
processing, polymer precursor or sol-gel processing routes followed by hot pressing
at 1550−1800°C and 20−40 MPa under Ar or N2 atmospheres are used to obtain
fully densified Al2O3/SiC composites. More innovative routes such as spark plasma
sintering have also been investigated. Spark plasma sintering allows to reach
theoretical densities at lower temperatures respect to hot pressing with higher rate of
densification [36]. This enhancement was explained thanks to an acceleration of the
diffusion process due to additional mass-transport mechanisms induced by the spark
plasma. In addition, lowest temperatures as a function of SiC content have been
observed and attributed to the difference of thermal conductivity between Al2O3 and
SiC. Generally the thermal conductivity of SiC is higher than that of Al2O3
especially at elevated temperatures. Therefore, the addition of SiC might be
expected to promote heat transfer from the graphite die to the compacts.
42
2.3 Ceramic laminates
2.3.1 Laminates with improved mechanical behaviour
Reinforced microstructures exhibiting toughening mechanisms have been
presented in the previous paragraphs. Unfortunately, numerous restrictions which
limit the use of ceramic composites for structural applications can be considered .
The main problem regard the high costs of composite processing and starting
materials, since a careful control of the microstructure and of its homogeneity is
required. Degradation phenomena, involving the change of microstructure with time,
can happen in service that decrease the toughening efficiency. A partial strength
scatter, due to a residual dependence on starting crack size, still remains. For these
reasons, today the arrangement of ceramic layers in laminated structures is the most
promising route to improve the mechanical and tribological performances of
ceramics.
Laminates are products that possess material composition, structure and
microstructure which change with position in a regular manner. Typical applications
of laminated ceramics include solid oxide fuel cells, electronic substrates,
multilayered ceramic packages, gas sensor devices, filters, thermal barrier coatings
and laminates with improved mechanical properties. The last item is the application
of relevance in the present work. One of the main advantages of ceramic laminates
with respect to traditional composites regards the reduced tendency to debonding
and degradation phenomena occurring at the phase boundary since any residual
stress is distributed within a larger volume. Interphase adhesion is higher when the
structure changes in a gradual manner. In addition, the material can be improved by
a second phase not in its whole volume but rather only where the tensile stresses are
higher. In recent years, there has been considerable interest in the mechanical
behaviour of a variety of multilayered ceramic composites. In the following
paragraphs a brief summary of the state of the art of ceramic laminates with
improved mechanical behaviour is presented, setting apart laminates with
mechanical behaviour improved by toughening mechanisms, as crack bridging or
crack deflection, and laminates characterized by the presence of residual stresses.
43
2.3.2 Laminates with mechanical behaviour improved by toughening mechanisms
2.3.2.1 Metal/ceramic laminates
Toughness enhancement could be obtained in metal/ceramic laminates
where ceramic layers are alternated with metallic layers. As in the case of
composites with ductile second phase crack tip shielding mechanisms are promoted.
The toughness increase is controlled by the closure exerted by the metallic bridging
layers astride the crack in the ceramic layers. Mekky et al. [13] produced a Ni/Al2O3
multilayer exhibiting a T-curve behaviour. In spite of the metallic nature of some
layers the study of these laminates can be performed within the domain of Linear
Elastic Fracture Mechanics if a well bonded interface exists.
2.3.2.2 Porous and weak interlayers
As discussed previously, the incorporation of fibrous reinforcements in a
ceramic matrix is an easy way to create fiber/matrix interfaces with low fracture
resistance that represent preferential paths for the propagating cracks. The presence
of such weak interfaces increases the fracture resistance of the ceramic.
Nevertheless, the fabrication of fiber reinforced ceramic is time consuming, complex
and expensive. Increased toughness, T-curve behaviour as well as non catastrophic
fracture behaviour have been also observed in laminates by introducing porous or
weak interlayers to promote low-energy paths for growing cracks. Indeed, when
weak interlayers are alternated with stronger ceramics layers the rupture occurs by
crack propagation normally to the strong layer plane and then by crack deflection at
an angle of 90° inside the weak interlayers (Figure 2.12 (a)). The typical load-
displacement curve of these laminates (Figure 2.12 (b)) presents an initial linear
trend, similar to the one observed for homogeneous ceramics, up to a peak load. The
first load drop arises from a crack initiating from some surface defects and growing
in the through thickness direction. Then the crack is arrested and deflected by the
adjacent weak interlayer. Interfacial delamination and increasing of measured load
until some new cracks form in the second strong layer are allowed. Such a sequence
is repeated in the other strong and weak layers.
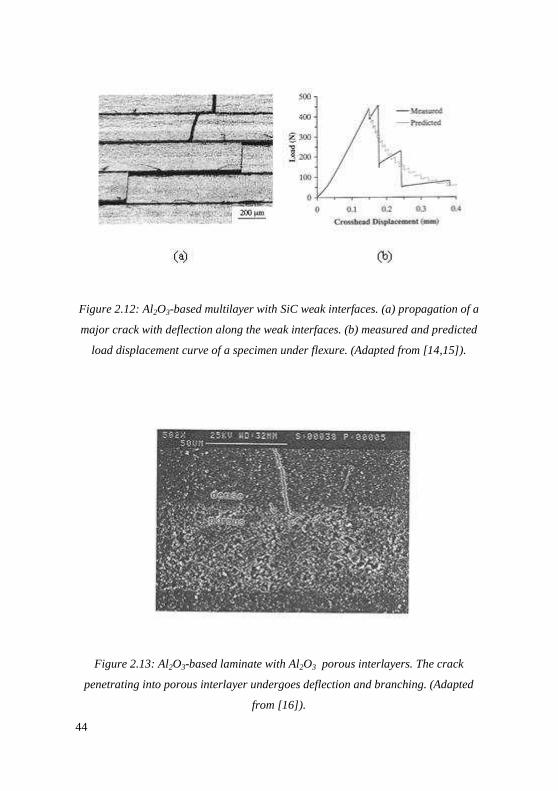
44
Figure 2.12: Al2O3-based multilayer with SiC weak interfaces. (a) propagation of a
major crack with deflection along the weak interfaces. (b) measured and predicted
load displacement curve of a specimen under flexure. (Adapted from [14,15]).
Figure 2.13: Al2O3-based laminate with Al2O3 porous interlayers. The crack
penetrating into porous interlayer undergoes deflection and branching. (Adapted
from [16]).
45
She et al. [14,15] have fabricated multilayered Al2O3 ceramics with weak SiC
interphases by extrusion molding and hot pressing. Due to the crack deflection
mechanism the bending strength, toughness and fracture energy were respectively
563 MPa, 15.1 MPam0.5 and 3335 J/m2. Finding a proper interface material for any
given ceramic is the main shortcoming of these laminates with weak interfaces. A
similar fracture behaviour could be obtain in a laminate where dense and porous
layers are alternated, the latter playing the role as weak layers [16]. Controlled
porosity is introduce in the weak layers by adding starch particles to slurry in slip
based processes and consequent burn-out. This solution satisfy the requirements for
chemical compatibility of interfacial materials and avoid the building up of internal
stresses due to differences in thermal expansion coefficients which can be source of
delamination during fabrication. Crack deflection, microcracking and branching,
responsible of the toughening effect, have been observed within such systems
(Figure 2.13).
2.3.2.3 Laminates with two strong outer layers and a tough inner layer
As described before, the development of reliable ceramics for structural
applications has been approached from two different directions. The first approach is
to develop ever stronger materials through processing and microstructural
refinements. These techniques typically improve strength but still leave the material
with a low toughness. The other approach is to activate the T-curve behaviour
inducing toughening mechanisms as in composite materials. This will typically
improve the toughness and the strength for large initial flaws. However these
improvements are often achieved at the expense of strength for small flaws. This
unfortunate trade-off between strength and toughness has lead to the development of
a trilayer laminated composite which exhibit the high strength of the surface
material for small flaws and the high strength of the tough body material for larger
flaws [58]. According to this approach, Cho et al. [59] produced a laminate
containing surface layers consisting of relatively fine, equiaxed α-SiC grains,
designed for high strength, while the inner layer is made of elongated α-SiC grains,
designed for high toughness. Chemical compatibility and strong bonding between
layers has been also achieved. Improved strength, toughness and damage resistance
46
has been achieved with this three-layer ceramic laminate.
2.3.3 Laminates with mechanical behaviour improved by residual stresses
2.3.3.1 Residual stresses in laminates
Residual stresses can be defined as those stresses that remain in a body after
manufacturing in the absence of any applied external load or thermal gradients. The
main distinctive characteristic of residual stresses is that self-equilibrium must be
maintained in any free standing body, which means that the presence of a tensile
stress in the component is balanced by a compressive stress elsewhere in the same
body. These stresses can generate in the body through (i) thermal expansion or
sintering rate mismatch, (ii) local dilatations or deviatoric strains occurring during
chemical reactions or phase transformations with molar volume changes, and (iii)
differential plastic deformation like that occurring during grinding operations [60].
The introduction of stresses within the material is an alternative procedure to
improve mechanical performances in ceramics. For example, surface compression is
usually induced in tempered glass, used for glass windows, lateral or rear car
windows , ophthalmological lenses and other high strength applications. To produce
tempered glass, the glass plate is heated to a temperature high enough to allow
adjustments to stresses among the atoms, then is quickly cooled down. The surface
contracts because of the drop in temperature and becomes rigid, while the center is
still hot and can adjust its dimensions to the surface contractions. When the center
cools and contracts slightly later compressive stresses are produced at the surface
and tensile stresses are produced in the center. A considerable deflection must be
applied to the glass before tensile stresses can be developed in the surface of the
glass where cracks start. In effect, since the compressive stresses must be overcome
first, the overall strength of the glass is enhanced as much as 300% [1].
The impediment to free deformation at the base of residual stresses creation
is known as constrain effect. The same effect is present in an orthotropic laminate
made of cosintered layers of different composition and perfectly adherent one to
each other. Orthotropy happens when each layer in the laminate is homogeneous,
isotropic, linear elastic and the stacking order of the laminae satisfy the symmetry
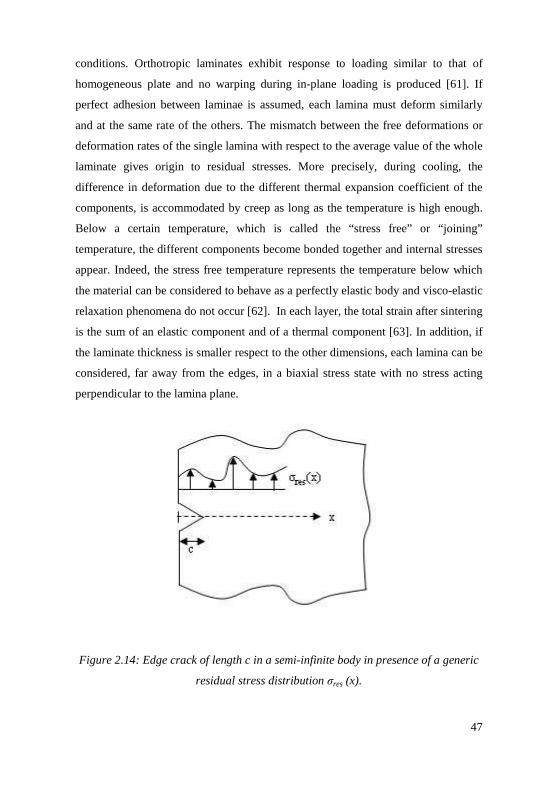
47
conditions. Orthotropic laminates exhibit response to loading similar to that of
homogeneous plate and no warping during in-plane loading is produced [61]. If
perfect adhesion between laminae is assumed, each lamina must deform similarly
and at the same rate of the others. The mismatch between the free deformations or
deformation rates of the single lamina with respect to the average value of the whole
laminate gives origin to residual stresses. More precisely, during cooling, the
difference in deformation due to the different thermal expansion coefficient of the
components, is accommodated by creep as long as the temperature is high enough.
Below a certain temperature, which is called the “stress free” or “joining”
temperature, the different components become bonded together and internal stresses
appear. Indeed, the stress free temperature represents the temperature below which
the material can be considered to behave as a perfectly elastic body and visco-elastic
relaxation phenomena do not occur [62]. In each layer, the total strain after sintering
is the sum of an elastic component and of a thermal component [63]. In addition, if
the laminate thickness is smaller respect to the other dimensions, each lamina can be
considered, far away from the edges, in a biaxial stress state with no stress acting
perpendicular to the lamina plane.
Figure 2.14: Edge crack of length c in a semi-infinite body in presence of a generic
residual stress distribution σres (x).
48
The magnitude of these residual stresses can be tailored through an accurate choice
of system geometry and layers composition.
We consider here an infinite plate with a generic non uniform stress
distribution σres(x) acting along the direction x perpendicular to the plate surface on
a through-thickness sharp crack of length c (Figure 2.14). The stress intensity factor
KI,res related to the stress distribution can be estimated by using the weight function
approach:
( )∫
=c
0resres,I dx
c
x,
w
chxσK Eq. (2.8)
where h is a weight function, w is the plate width and the other symbols have the
standard meaning [6]. The weight function is a geometric function that satisfy the
singularity conditions at the crack tip. It is tabulated in literature for many
geometries and loading conditions. If the residual stresses are separated from
external loading, the term due to their presence can be included in the material
fracture resistance to obtain the so called apparent fracture toughness KI,app or T:
res,IICapp,I KKK −= Eq. (2.9)
The crack propagates under the external load when the value of such characteristic is
reached. In the case of negative compressive residual stresses the second term in Eq.
(2.9) is positive and the apparent fracture toughness increases with respect to KIC.
This beneficial effect can lead to a T-curve behaviour [23,64]. As described in the
following paragraphs, several laminated ceramic structures with improved
mechanical behaviour, due to the introduction of residual stresses, have been
developed.
2.3.3.2 Laminates with two compressive outer layers and a tensile inner layer
Surface macroscopic compressive stresses can be introduced in a laminate to
reduce the intense tensile stresses acting on the crack tip and to hinder the surface
cracks propagation with an effect similar to what discussed in tempered glasses
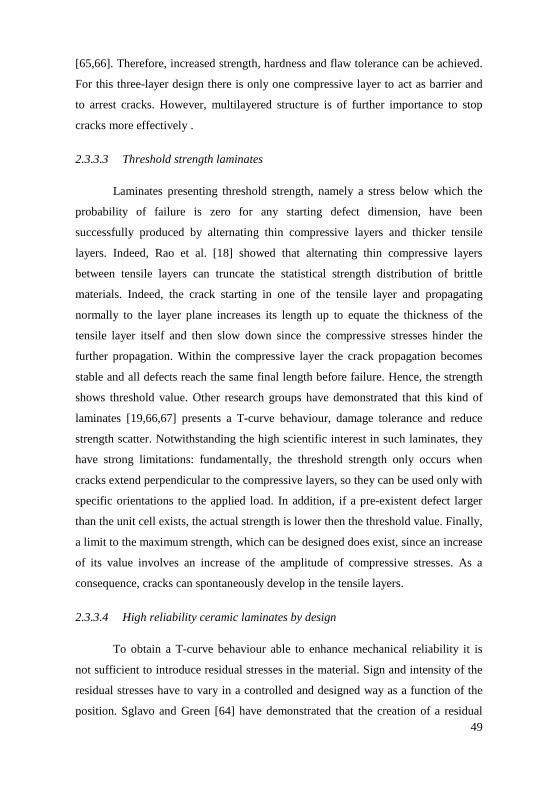
49
[65,66]. Therefore, increased strength, hardness and flaw tolerance can be achieved.
For this three-layer design there is only one compressive layer to act as barrier and
to arrest cracks. However, multilayered structure is of further importance to stop
cracks more effectively .
2.3.3.3 Threshold strength laminates
Laminates presenting threshold strength, namely a stress below which the
probability of failure is zero for any starting defect dimension, have been
successfully produced by alternating thin compressive layers and thicker tensile
layers. Indeed, Rao et al. [18] showed that alternating thin compressive layers
between tensile layers can truncate the statistical strength distribution of brittle
materials. Indeed, the crack starting in one of the tensile layer and propagating
normally to the layer plane increases its length up to equate the thickness of the
tensile layer itself and then slow down since the compressive stresses hinder the
further propagation. Within the compressive layer the crack propagation becomes
stable and all defects reach the same final length before failure. Hence, the strength
shows threshold value. Other research groups have demonstrated that this kind of
laminates [19,66,67] presents a T-curve behaviour, damage tolerance and reduce
strength scatter. Notwithstanding the high scientific interest in such laminates, they
have strong limitations: fundamentally, the threshold strength only occurs when
cracks extend perpendicular to the compressive layers, so they can be used only with
specific orientations to the applied load. In addition, if a pre-existent defect larger
than the unit cell exists, the actual strength is lower then the threshold value. Finally,
a limit to the maximum strength, which can be designed does exist, since an increase
of its value involves an increase of the amplitude of compressive stresses. As a
consequence, cracks can spontaneously develop in the tensile layers.
2.3.3.4 High reliability ceramic laminates by design
To obtain a T-curve behaviour able to enhance mechanical reliability it is
not sufficient to introduce residual stresses in the material. Sign and intensity of the
residual stresses have to vary in a controlled and designed way as a function of the
position. Sglavo and Green [64] have demonstrated that the creation of a residual
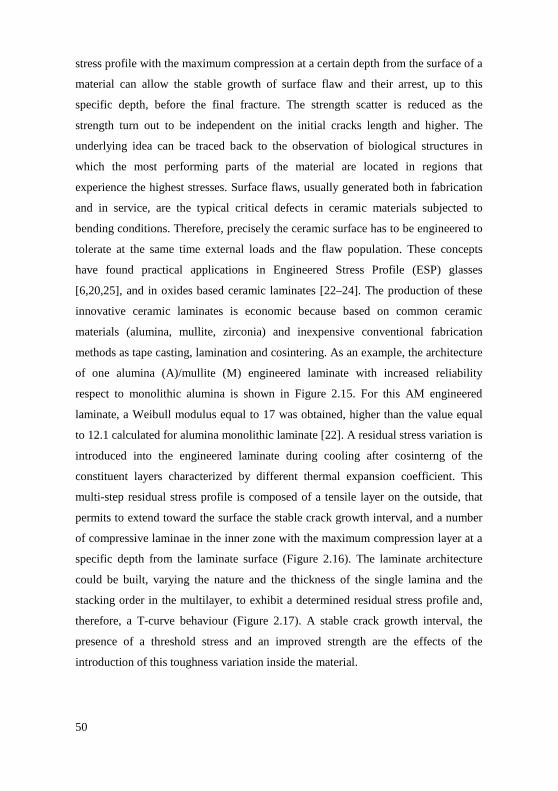
50
stress profile with the maximum compression at a certain depth from the surface of a
material can allow the stable growth of surface flaw and their arrest, up to this
specific depth, before the final fracture. The strength scatter is reduced as the
strength turn out to be independent on the initial cracks length and higher. The
underlying idea can be traced back to the observation of biological structures in
which the most performing parts of the material are located in regions that
experience the highest stresses. Surface flaws, usually generated both in fabrication
and in service, are the typical critical defects in ceramic materials subjected to
bending conditions. Therefore, precisely the ceramic surface has to be engineered to
tolerate at the same time external loads and the flaw population. These concepts
have found practical applications in Engineered Stress Profile (ESP) glasses
[6,20,25], and in oxides based ceramic laminates [22–24]. The production of these
innovative ceramic laminates is economic because based on common ceramic
materials (alumina, mullite, zirconia) and inexpensive conventional fabrication
methods as tape casting, lamination and cosintering. As an example, the architecture
of one alumina (A)/mullite (M) engineered laminate with increased reliability
respect to monolithic alumina is shown in Figure 2.15. For this AM engineered
laminate, a Weibull modulus equal to 17 was obtained, higher than the value equal
to 12.1 calculated for alumina monolithic laminate [22]. A residual stress variation is
introduced into the engineered laminate during cooling after cosinterng of the
constituent layers characterized by different thermal expansion coefficient. This
multi-step residual stress profile is composed of a tensile layer on the outside, that
permits to extend toward the surface the stable crack growth interval, and a number
of compressive laminae in the inner zone with the maximum compression layer at a
specific depth from the laminate surface (Figure 2.16). The laminate architecture
could be built, varying the nature and the thickness of the single lamina and the
stacking order in the multilayer, to exhibit a determined residual stress profile and,
therefore, a T-curve behaviour (Figure 2.17). A stable crack growth interval, the
presence of a threshold stress and an improved strength are the effects of the
introduction of this toughness variation inside the material.
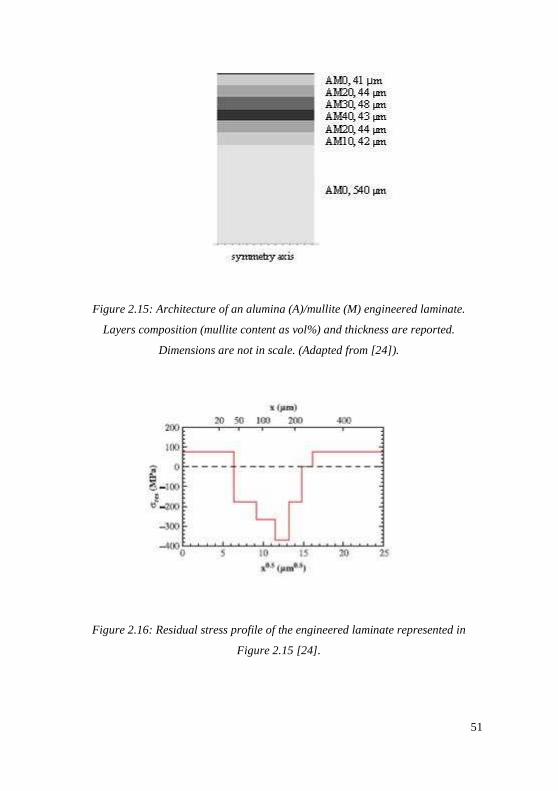
51
Figure 2.15: Architecture of an alumina (A)/mullite (M) engineered laminate.
Layers composition (mullite content as vol%) and thickness are reported.
Dimensions are not in scale. (Adapted from [24]).
Figure 2.16: Residual stress profile of the engineered laminate represented in
Figure 2.15 [24].
52
Figure 2.17: Apparent fracture toughness for the engineered laminate represented
in Figure 2.15 [24].
The approach used for the laminate design is summarized in the following
mathematical analysis. Considering a thin orthotropic multilayer with strong
interfaces between the n layers, the biaxial stress state in each layer, generated by
thermal contraction during cooling, can be calculated on the basis of equilibrium of
forces, compatibility of the deformations related to constrain and the constitutive
model:
Self-equilibrium 0tσn
1iii =∑
= Eq. (2.10)
Compatibility εT∆αeε iii =+= Eq. (2.11)
Costitutive model i*ii eEσ = Eq. (2.12)
where the subscript i represents the rank of the generic layer and σ is the acting
stress, t is the thickness, ε is the deformation, e is the elastic strain, α is the thermal
expansion coefficient, E* is the Young modulus in the case of biaxial stress state,
expressed by Eq. (2.13), and ∆T is the temperature difference, expressed by Eq.
53
(2.14):
i
i*i
ν1
EE
−= Eq. (2.13)
RTSF TTT∆ −= Eq. (2.14)
E is the Young modulus in uniaxial stress state, ν is the Poisson’s modulus, TSF is
the stress free temperature and TRT is room temperature. The linear system of Eq.
(2.10), Eq. (2.11) and Eq. (2.12) represent a set of 3n+1 equations and 3n+1
unknowns that can be easily solved. The resulting residual stress in the generic layer
i is equal to:
( ) T∆ααEσ i*ii,res −= Eq. (2.15)
where α represents the average coefficient of thermal expansion of the whole
laminate expressed as:
∑
∑
=
==n
1ii
*i
n
1iii
*i
tE
αtE
α Eq. (2.16)
Since the stress level in Eq. (2.15) does not depend on stacking order, the calculation
is valid for each sequence of laminae, providing the symmetry condition is
maintained. In order to understand the effect of residual stress intensity and location
on the apparent fracture toughness of an edge crack in a semi-infinite body, Sglavo
et al. [22,23] have analyzed some special cases of profile: step profile, square wave
profile and two square waves based profile. An inductive approach and the
superposition principle have been used to calculate the T-curve for a general multi-
step profile. In the case of a laminate composed of n layers with constant residual
stresses σres,i (Figure 2.18), the apparent fracture toughness KI,app,i within layer i in
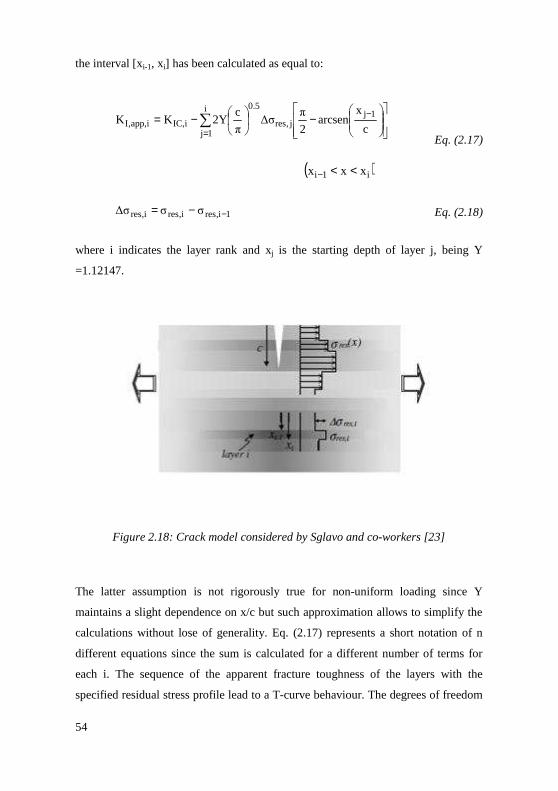
54
the interval [xi-1, xi] has been calculated as equal to:
∑=
−
−
−=i
1j
1jj,res
5.0
i,ICi,app,I c
xarcsen
2
πσ∆
π
cY2KK
( )i1i xxx <<−
Eq. (2.17)
1i,resi,resi,res σσσ∆ −−= Eq. (2.18)
where i indicates the layer rank and xj is the starting depth of layer j, being Y
=1.12147.
Figure 2.18: Crack model considered by Sglavo and co-workers [23]
The latter assumption is not rigorously true for non-uniform loading since Y
maintains a slight dependence on x/c but such approximation allows to simplify the
calculations without lose of generality. Eq. (2.17) represents a short notation of n
different equations since the sum is calculated for a different number of terms for
each i. The sequence of the apparent fracture toughness of the layers with the
specified residual stress profile lead to a T-curve behaviour. The degrees of freedom
55
to produce the desired T-curve are 2n-2 since n equation with 2n parameters (xi, ∆σi)
are now available and two conditions have to be satisfied (force equilibrium and
equivalence between the sum of single layer thickness and the total laminate
thickness). In addition, the calculations can be referred to the semi-thickness as the
laminate is symmetric. Referring to the most internal between the tensile layers
placed at the surface as k and to the most compressed layer as l it is possible to
determine the stable crack growth interval [xk, xl], the threshold stress σth and the
strength σb of the laminate:
( ) 5.0k
1k,app,Ik,app,Ith
xπY
)K,Kmin(σ
+= Eq. (2.19)
( ) 5.0l
1l,app,Il,app,Ib
xπY
)K,Kmax(σ
+= Eq. (2.20)
Therefore the input parameters of laminate design are the coefficients of thermal
expansion, Young’s moduli, Poisson’s ratios, fracture toughness and the layers
thickness. Another important but experimentally unknown input parameter is the
stress free temperature TSF assumed as equal as 1200°C, while room temperature is
25°C [62]. The presented model is very simple and approximated but the error in the
calculation of the apparent fracture toughness in each layer has been estimated as
being as less than 10% [22]. These innovative laminates possess high mechanical
reliability and equivalent mechanical characteristics along any loading orientation.
These properties make these laminated bodies as natural candidates for structural
applications as in the case of load bearing components in automotive and aircraft
industry, biomedical prosthesis, chemical plant linings and safety systems.
2.3.4 Defects in laminates
The constrain effect developed in cosintering layers within a laminate with
strong interfaces is responsible of the arising of residual stresses within the
multilayer. If this effect is sufficiently higher, porosity and deleterious defects can
also outcome. Some specific defects with scale comparable with the layer thickness
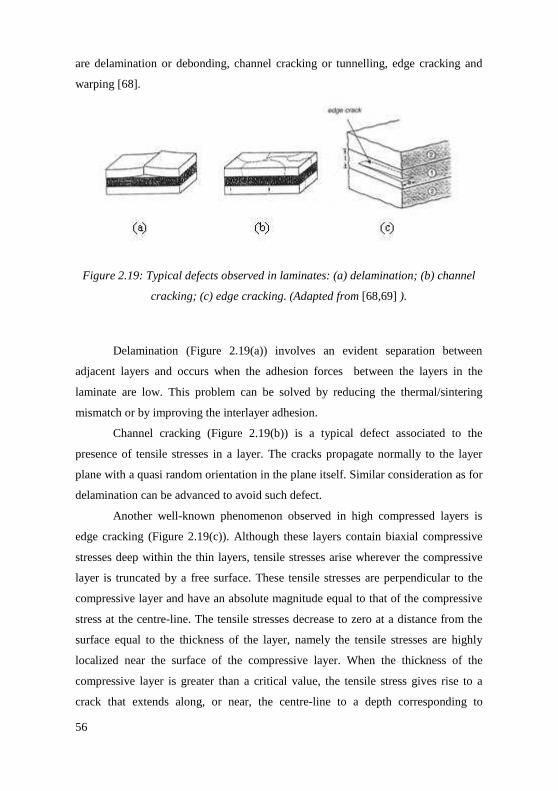
56
are delamination or debonding, channel cracking or tunnelling, edge cracking and
warping [68].
Figure 2.19: Typical defects observed in laminates: (a) delamination; (b) channel
cracking; (c) edge cracking. (Adapted from [68,69] ).
Delamination (Figure 2.19(a)) involves an evident separation between
adjacent layers and occurs when the adhesion forces between the layers in the
laminate are low. This problem can be solved by reducing the thermal/sintering
mismatch or by improving the interlayer adhesion.
Channel cracking (Figure 2.19(b)) is a typical defect associated to the
presence of tensile stresses in a layer. The cracks propagate normally to the layer
plane with a quasi random orientation in the plane itself. Similar consideration as for
delamination can be advanced to avoid such defect.
Another well-known phenomenon observed in high compressed layers is
edge cracking (Figure 2.19(c)). Although these layers contain biaxial compressive
stresses deep within the thin layers, tensile stresses arise wherever the compressive
layer is truncated by a free surface. These tensile stresses are perpendicular to the
compressive layer and have an absolute magnitude equal to that of the compressive
stress at the centre-line. The tensile stresses decrease to zero at a distance from the
surface equal to the thickness of the layer, namely the tensile stresses are highly
localized near the surface of the compressive layer. When the thickness of the
compressive layer is greater than a critical value, the tensile stress gives rise to a
crack that extends along, or near, the centre-line to a depth corresponding to
57
approximately the thickness of the compressive layer. Consistent with the theory
developed by Ho et al. [69], the centre-line crack, called an edge crack, is only
observed when either the compressive stress or the thickness of the compressive
layer exceeds a critical value. For the fixed value of compressive stress, the critical
compressive layer thickness (tc) required for edge cracking is given by:
( ) 2
2IC
cσυ134.0
Kt
+= Eq. (2.21)
where KIC, ν, and σ are the fracture toughness, Poisson’s ratio and the stress of the
thin compressive layer material respectively.
Distortions, curvature and uneven modifications of the planar geometry of
symmetric laminates are also possible upon cooling. These warping effects are
usually related to local differences in the layer thickness occurring somewhere in the
laminate. The resulting lack of moment balance produce a curvature in the material
to satisfy equilibrium.
2.3.5 Processes suitable to produce ceramic laminates
Melting is not a suitable fabrication technology for ceramics since,
generally, their melting temperature is too high and degradation phenomena occur
earlier. Sintering after powder forming of green products is the most common
technique involved in the production of ceramics. The typical classification for
ceramics processing regards the physical state of the forming material: dry powder
or fluid suspension, or slip, in which the powders are dispersed. Some organic or
inorganic additives can be present in both cases, the distinction remaining the actual
presence of a fluid solvent. The forming process is usually chosen according to
economic factors and shape, dimensions and final characteristics that the product has
to satisfy. Ceramic sheets are used in many widely different end products such as
substrates for electronic circuits, discrete electrical devices, multilayered cofired
packages for integrated circuits, multilayered assemblies such as fuel cells and plate
electrodes. Green tapes are also used as intermediate steps in the production of more
intricate shapes. Several processes are used to form large area and thin, flat ceramic
58
sheets and then laminates: pressing, electrophoretic deposition, tape casting, slip
casting, rolling and other, followed by sintering or hot pressing. Simply adaptations
of the methods used to produce traditional ceramics and also new solutions proposed
and developed rightly for the purpose are employed. All these processes have in
common the capability to originate a predetermined gradient in the green structure
of the laminate, which give rise to a spatial variation in the structure of fired
ceramic. In the following paragraphs, a brief overview about the most techniques
involved in the production of multilayers is presented. Competing processes to make
similar flat ceramic parts include extrusion, vibrational induced particle segregation,
multiphase jet solidification, reactive hot pressing, infiltration, interdiffusion of
cosintering materials will not be explored here since they are not widely used for
this purpose and they have many serious limitations [70–72]. A separate subject
regards the techniques used to produce thin coatings, like CVD (Chemical Vapour
Deposition), PVD (Phase Vapour Deposition) and sputtering. All the deposition
methods can be also considered for laminates fabrication, the main restrictions
remaining the maximum thickness, which can be obtained in a single step, the
deposition rate and the costs.
2.3.5.1 Dry powder-based processes
Cold pressing of ceramic powders followed by sintering [73] can be used to
produce laminates. Powder feed is composed of granules of different size and
deformability mixed together to obtain the maximum compact density and the
minimum porosity volume. Little amount of water or binder and other organic
additives are generally added to promote the relative motion between the powders,
arising during pressing. Cold pressing could be uniaxial, when the pressure is
applied in only one direction, or isostatic, when pressure is applied in each direction
with equal intensity. The desired structure gradation in the space, useful to obtain
laminated structures, is actually obtained by stacking batches of different
compositions. However, layers thickness and dimensional tolerances are much more
difficult to control when thin layers have to be produced. As for the homogeneous
ceramics, the compressed green material has then to be sintered to obtain a fired and
dense material showing the same graded structure present in the pre-form. Pressing
59
is today the most widely practiced forming process for reasons of productivity and
the ability to produce parts ranging widely in size and shape.
Roll compactions [74] is another dry pressing process in which a prepared
powder is continuously pressed between two rollers to form flexible green tapes.
The tape made with this process is then immediately available for cutting or
handling. Sintering process is needed to obtain the final product. The advantage of
rolling, as a method of green layers production, are that it allows easy thickness
control, achieves high green density of the tapes, and requires a rather low amount
of solvent and organic additives as compared to other methods. Rolling lends to
higher volumes of materials but require more rigid powder preparation. Therefore it
is not often used for new material development or small quantity production.
Hot Pressing (HP) and Hot Isostatic Pressing (HIP) [73] can be used to
densify ceramics in a more effective way respect to simple cold pressing followed
by sintering. A sintered product is directly obtained by performing uniaxial powder
pressing (HP) in a refractory die and sintering at the same time. Conversely, with hot
isostatic pressing (HIP) a product previously sintered to the final stage of sintering is
subjected to a hot pressurized gas. These techniques are pressure assisted sintering
processes generally used to produce high temperature melting materials, when a
sintering aid or grain growth inhibitor is unacceptable. The mechanical pressure
used in this techniques, usually in the range of 10−200 MPa, can increase the driving
pressure for densification by acting against the internal pore pressure without
increasing the driving force for grain growth. Indeed, the main effects for the
enhancement of sintering in these processes are thermal diffusion and plastic flow
due to the high pressure. Therefore, respect to conventional sintering technology,
they allow to obtain high density products with fine microstructure at lower
temperatures. The industrial use of hot pressing is limited because the productivity is
relatively low, restricted in size and geometry of the samples, and the die
maintenance is expensive. However, today, hot pressing is the main sintering
technique to produce alumina/silicon carbide composites.
Recently, the Spark Plasma Sintering (SPS) process [36,75,76], also known
as Pulsed Electric Current Sintering (PECS) has attracted a great deal of interest as a
new cost-effective processing method for sintering and sinter-bonding, at
60
considerably rapid heating rates, various kind of powder materials and laminated
structures as, for example, TiN/Al2O3, SiC/TiC, Si3N4-SiC/BN-Al2O3 and HA/Y-
TZP [77–79]. SPS is an innovative technology similar to the conventional HP
process because mechanical pressure is applied during the heating stage.
Nevertheless, in contrast to the conventional HP, in which the heat is provided by
external heating elements, in SPS the heat is generated internally. In fact, a pulsed
direct electric current passes through the graphite die and, depending on the
electrical conductivity of the material to be sintered, also through the powder
compact within the die itself. Such electrical current propagation significantly
improves heat transfer by different mechanisms involving Joule heating, diffuse
electrical field, spark plasma, and spark impact pressure, resulting in a current-
activated sintering. Spark plasma has a surface activating and cleaning effect on the
particles being sintered and allows a rapid heating of the compact particles. The
occurrence of a plasma discharge is still debated but it seems to be widely accepted
that an electric discharge process takes place on a microscopic level. Therefore, SPS
has several advantages over conventional sintering methods including high heating
rates, lower processing temperatures, and short holding times, thus allowing the
production of highly dense materials with improved quality and good control of
grain coarsening.
Plasma-spray [70] is a well-known process used to produce thick coatings,
like the thermal barriers on the blades in gas turbines. High tension is applied
between two electrodes placed in a torch in such a way that the resulting electric arc
promotes the transformation of the flowing gas in the plasma state. In front of the
nozzle temperature can locally reach values as high as 30000 K. The ceramic
powder is fed near the torch tip, where is heated, dragged by the gas flame and
sprayed onto the substrate. The torch, moved by a robotic system, is used to focus
the flame onto the substrate and to change the target position on the surface. Many
parameters can be varied in order to modify the thickness, the structure and the
microstructure of the sprayed material, including gas flow, powder feeding position
and rates, distance between torch and substrate, substrate pre-heating and powder
morphology. Plasma spray can work either in vacuum or in air, depending on the
nature of the powders to be sprayed. Typically a porous structure and a rough
61
surface finishing is obtained by plasma spray, the coating thickness typically ranging
from a few tens to several hundred of microns. Compared to other coating processes,
plasma spray allows a high mass transport and thus a high speed deposition.
Furthermore, layer thickness can be varied easily by adjusting experimental
parameters and, contrary to pressing-based processes, no thermal treatment is
required after spraying. Unfortunately, some restrictions are also present since a
substrate to be coated is always required and no self-supported body can be
produced. In addition, a residual porosity and a rough surface finishing of the
sprayed layer can not be avoided.
2.3.5.2 Slip-based processes
Colloidal processing offers the possibility to produce strong and reliable
ceramics of good quality through careful control of the initial suspension and its
evolution during fabrication. This can be accomplished by reducing the size of the
strength degrading heterogeneities, as inorganic and organic inclusions or
agglomerates.
Among colloidal processing, tape casting [80,81] and lamination of different
thin and flat ceramic layers to form thick specimens is a relatively simple and
inexpensive process considered a valid route to produce green ceramic laminates.
Tape casting has been widely used to develop ceramic substrate, multilayer structure
capacitor, solid electrolytes, solid oxide fuel cell, and has been performed on several
materials including alumina, zirconia, barium titanate, nickel, nickel oxide and
piezoelectric materials. It is a wet forming method which consists in layering a slip
containing the ceramic powders, onto a temporary rigid plane support by gravity
flow occurring while the reservoir carrying the slip, called doctor blade, is moved
with respect to the substrate. The relative motion between the reservoir and the
substrate can be obtained either by moving the carrier film (stationary blade) or the
reservoir itself (moving blade), while the slip flows through a controlled slit present
in the bottom rear part of the doctor blade (Figure 2.20). The casted green tape is a
single continuous sheet presenting a thickness much smaller than the other two
dimensions.
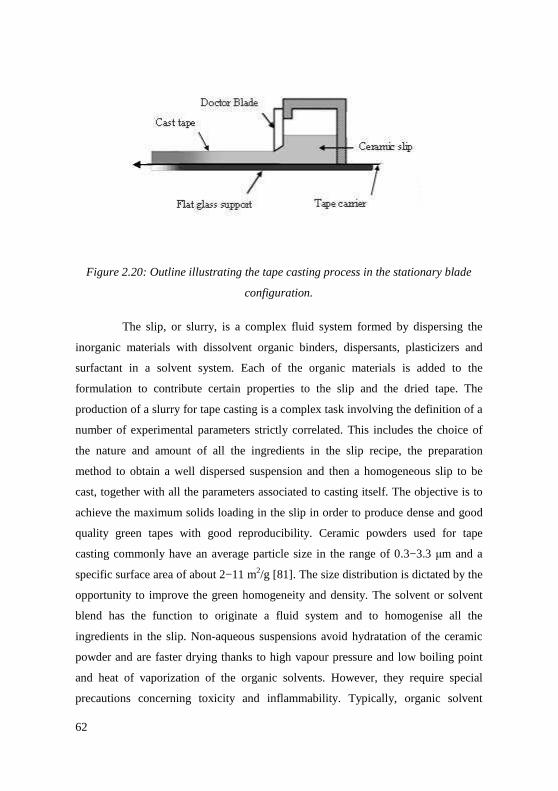
62
Figure 2.20: Outline illustrating the tape casting process in the stationary blade
configuration.
The slip, or slurry, is a complex fluid system formed by dispersing the
inorganic materials with dissolvent organic binders, dispersants, plasticizers and
surfactant in a solvent system. Each of the organic materials is added to the
formulation to contribute certain properties to the slip and the dried tape. The
production of a slurry for tape casting is a complex task involving the definition of a
number of experimental parameters strictly correlated. This includes the choice of
the nature and amount of all the ingredients in the slip recipe, the preparation
method to obtain a well dispersed suspension and then a homogeneous slip to be
cast, together with all the parameters associated to casting itself. The objective is to
achieve the maximum solids loading in the slip in order to produce dense and good
quality green tapes with good reproducibility. Ceramic powders used for tape
casting commonly have an average particle size in the range of 0.3−3.3 µm and a
specific surface area of about 2−11 m2/g [81]. The size distribution is dictated by the
opportunity to improve the green homogeneity and density. The solvent or solvent
blend has the function to originate a fluid system and to homogenise all the
ingredients in the slip. Non-aqueous suspensions avoid hydratation of the ceramic
powder and are faster drying thanks to high vapour pressure and low boiling point
and heat of vaporization of the organic solvents. However, they require special
precautions concerning toxicity and inflammability. Typically, organic solvent
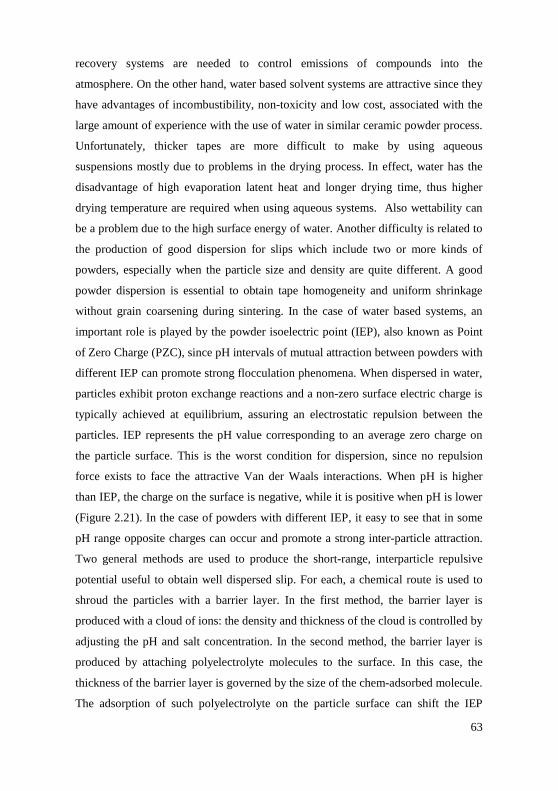
63
recovery systems are needed to control emissions of compounds into the
atmosphere. On the other hand, water based solvent systems are attractive since they
have advantages of incombustibility, non-toxicity and low cost, associated with the
large amount of experience with the use of water in similar ceramic powder process.
Unfortunately, thicker tapes are more difficult to make by using aqueous
suspensions mostly due to problems in the drying process. In effect, water has the
disadvantage of high evaporation latent heat and longer drying time, thus higher
drying temperature are required when using aqueous systems. Also wettability can
be a problem due to the high surface energy of water. Another difficulty is related to
the production of good dispersion for slips which include two or more kinds of
powders, especially when the particle size and density are quite different. A good
powder dispersion is essential to obtain tape homogeneity and uniform shrinkage
without grain coarsening during sintering. In the case of water based systems, an
important role is played by the powder isoelectric point (IEP), also known as Point
of Zero Charge (PZC), since pH intervals of mutual attraction between powders with
different IEP can promote strong flocculation phenomena. When dispersed in water,
particles exhibit proton exchange reactions and a non-zero surface electric charge is
typically achieved at equilibrium, assuring an electrostatic repulsion between the
particles. IEP represents the pH value corresponding to an average zero charge on
the particle surface. This is the worst condition for dispersion, since no repulsion
force exists to face the attractive Van der Waals interactions. When pH is higher
than IEP, the charge on the surface is negative, while it is positive when pH is lower
(Figure 2.21). In the case of powders with different IEP, it easy to see that in some
pH range opposite charges can occur and promote a strong inter-particle attraction.
Two general methods are used to produce the short-range, interparticle repulsive
potential useful to obtain well dispersed slip. For each, a chemical route is used to
shroud the particles with a barrier layer. In the first method, the barrier layer is
produced with a cloud of ions: the density and thickness of the cloud is controlled by
adjusting the pH and salt concentration. In the second method, the barrier layer is
produced by attaching polyelectrolyte molecules to the surface. In this case, the
thickness of the barrier layer is governed by the size of the chem-adsorbed molecule.
The adsorption of such polyelectrolyte on the particle surface can shift the IEP
64
position (Figure 2.21) and favour the inter-particle repulsion.
Figure 2.21: Relative Acoustophoretic Mobility (RAM) for 16.7 wt% dispersion of
A-16SG alumina in pure water with and without the polyelectrolyte Darvan C.
(Adapted from [82])
Therefore, a dispersant is needed to promote and maintain stable the powder
dispersion in the solvent. This effect is achieved by electrostatic repulsion, steric
hindrance of adsorbed dispersant molecules or a combination of the two
mechanisms. The optimum amount of dispersant is thus proportional to the powder
surface area. The binder is a long-chain polymer or a colloid that provides strength
and flexibility to green tapes after evaporation of the solvent through organic bridges
between the ceramic particles. Binder selection depends on its viscosity, strength,
glass temperature and burn-out atmosphere. A high molecular weight is desired in
the binder for high toughness and strength and a low glass transition temperature. If
present in sufficient amount, the binder represents a continuous polymeric matrix
entrapping the ceramic powder thus allowing handling, storage and green machining
65
as cutting and punching. The binder should be compatible with the dispersant,
should provide lubrication between particles and should not interact during solvent
evaporation. In most cases, low molecular weight polymers are also added as
plasticizers to increase the green deformability at room temperature. The
combination of binder and plasticizer must be balanced to provide the required
mechanical properties and to permit a high concentration of inorganic particles in
the slurry. Two groups of substances mainly have been used as binders for aqueous
tape casting of ceramics: cellulose ethers and vinyl or acrylic-type polymers [80].
The colloidal properties of acrylic polymer emulsions lead to slip formulations
containing high solid contents in well-dispersed systems. Moreover, these emulsions
have useful and unique characteristics such as low viscosity, internal plasticization
and controllable crosslinking, which provide a good cohesion to the green sheet but
with a low strain to failure. On the other hand, they include some surfactants in
order to stabilize the emulsion which can promote foam formation. Other additives,
including wetting agents to promote spreading of the slurry on the carrier substrate,
homogenizers which contribute to a better surface quality and antifoaming agent to
prevent foaming during mixing, can be used.
Milling, in particular wet ball milling or vibratory milling, is used to break
aggregates and to disperse powder agglomerates as well as to mix and homogenize
the organic additives. It is well known that mixing of the organic ingredients, in
aqueous tape casting, is commonly accomplished by using a two-stage milling
process [80,81]. The liquid, the powders and other additives of low molecular
weight are mixed by using ball milling procedure for 12−24 h at a relatively higher
viscosity at which shear forces are able to disperse agglomerates. Then, dissolved
gas in the slurry is commonly removed in a close container under vacuum. Next, the
binder and plasticizer are added and milling continues for another 2−24 h to
complete the mixing. The two stage milling process is used to reduce the scale of
inhomogeneity in the slurry without foaming or degrading the high molecular
weight binder molecules. Before casting the slip is filtered to remove any residual
coarse agglomerate or polymer cluster. Indeed, agglomerates and undissolved
organic material must be finer than the thickness of the tape for proper forming and
for ultimate thermal and mechanical properties. Due to the high solid content and to
66
the presence of organic polymers, the slip to cast presents usually a high viscosity
and a pseudoplastic rheological behaviour (its viscosity decreases when shear rate
increases). In some cases, time dependent phenomena as thixotropy can also be
observed. The slurry is usually cast on a smooth polymeric tape carrier, as Mylar®,
Teflon® or silicone, by the relative movement between the doctor blade and the
carrier. The cast tape thickness can be easily controlled by adjusting the blade gap,
the casting speed and the slip viscosity. Casting is followed by drying which has the
main function to remove the solvent. Drying is usually performed in closed system
or at open air, from room temperature to 85°C, with relative humidity from 50% to
70%. During this stage, the solvent escapes by diffusion and evaporation, while the
solid phases (powders, binder and plasticizers) settle at the bottom. Flexible and
deformable dried green sheets, with a typical thickness in the range of 25−1250 µm,
are generally produced. To obtain a multilayered structure, the tape casting is
followed by a lamination process where the layers stack is thermo-compressed to
give the green laminate. The obtained bond strength between layers is important for
maintaining product integrity during the sintering process. Lamination is usually
performed at a temperature range of 50−150°C and pressures of 3−30 MPa. Then,
the organic matter present in the green laminates is generally removed by a slow
heating burn-out treatment before sintering. One of the main advantages of tape
casting regards the good density and homogeneity of the green, which allows the
production of a dense fired ceramic with a uniform microstructure. Some problems
do exist associated to the anisotropy of the shrinkage during drying: solvent removal
occurs in fact only from the top surface. The residual stresses due to substrate
constrain can not be sustained when the thickness increases over some critical extent
or when the binder is not properly plasticized, the main outcomes being cracks and
defects produced in the green.
Sequential slip casting [83] is a simple modification of the slip casting
method, which is performed in this case by batch. Gravity is always the force
controlling the particle settling and the deposition rate can be adjusted by means of
several parameters, the most important being particle size and slip viscosity. As for
traditional slip casting, organic suspending agent can be used to the purpose. A
tailored profile in the structure is constructed by a proper change of the batch
67
composition with time, by emptying and filling the mould with a new slip every
time a new layer is desired. Also in this case layer thickness can be controlled easily
by adjusting the settling time.
Conversely, in the case of sedimentation slip casting the graded structure is
obtained by means of different settling rates of the slip components [84] and there is
no need to a continuous change of the slip. A further evolution of the process is
called graded casting: an automated procedure for mould feeding permits the
formation of a continuous gradient in the composite [84]. With respect to tape
casting, the binder content is limited and this is a substantial advantage since costs
are reduced accordingly and the controlled burn-out phase is less critical. A drying
phase follows to complete the solvent removal, which partially diffuses across the
porous mould during casting. Large and complex shapes can be obtained quite
easily, the main limitation regarding the overall duration required by the process.
Centrifugal consolidation is quite similar to the previous one. The main
difference regards the driving force for the material deposition, which is here
supplied by the centrifugal acceleration in place of gravity. In addition, a
simultaneous move of the suspension medium also occurs in the opposite direction
and no flow through the sedimented body is required for the solvent removal during
drying. The deposition rate can be controlled by adjusting the rotational speed, while
a limitation exists regarding the orientation and the shapes which can be processed.
The technique seems very promising and is particularly suitable for bodies
presenting an axial symmetry, like discs, tubes and shells. Small flat multilayered
laminates have been also produced by placing the container in a radial direction,
though a slight curvature in the green sample can not be avoided [72]. Self-
supported bodies can be also produced.
Electrophoresis [72] works by applying an external dc electric field to a
slurry promoting the migration of charged particles to the opposite charged
electrode. The particles must be well dispersed within the medium to show high
electrophoretic mobility. Water is also used as solvent because it is polar, economic,
ecological and safe. The electric field generated by the applied potential difference is
the force controlling the deposition rate of material. At the electrode, the double
layer which guarantees the repulsion of moving particles is distorted and short range

68
attractive forces are developed. Then, particle transfers its charge to the electrode
and remain attached to the growing layer, usually with a high packing density. A
drying step is then required to remove solvent. The layer thickness vary typically
from a few to a few hundred microns. A graded structure can be obtained by
changing the slip or by using particles with different mobility, while the single layer
thickness can be easily controlled by voltage application time.
69
Chapter III
Experimental Procedure
3. Experimental Procedure
3.1 Material and process selection
3.1.1 Material selection
The aim of this work was to produce alumina/silicon carbide multilayered
laminates presenting a T-curve behaviour arising from properly designed residual
stress profile. According to the practical rules presented before, in order to generate
residual stresses in the multilayer, it is necessary to use materials with different
thermal expansion coefficients and sintering shrinkage. Since the sole thermal
expansion mismatch between the materials is considered as the driving force for the
production of residual stresses, the production of a multi step residual stress profile
in a cofired laminate requires a range of different laminae, each one presenting a
different thermal expansion coefficient. This can be easily achieved by producing
several composites and by tailoring the thermal behaviour through the composite
composition control.
Among laminated composites, one of the most studied system is the
alumina/zirconia one [19]; alumina, zirconia and mullite have been already used as
starting materials in the production of laminates exhibiting residual stress profiles
and T-curve behaviour [22–24]. The material systems selected for the proposed
study are alumina and silicon carbide because, in the range of temperature
25−1500°C, alumina has a coefficient of thermal expansion of ~8·10-6°C-1, while
silicon carbide has ~5·10-6°C-1 (Table 3.1). The reason for choosing alumina and
silicon carbide as the constituent materials of ceramic laminates can be traced back
to the fact that both materials are mutually insoluble, there are no intermediate
phases, no solid state or eutectic reactions that could lead to material changes during
the high temperature cofiring treatment, in inert and proper conditions; in addition, it
is possible to obtain excellent bonding between the layers in the absence of
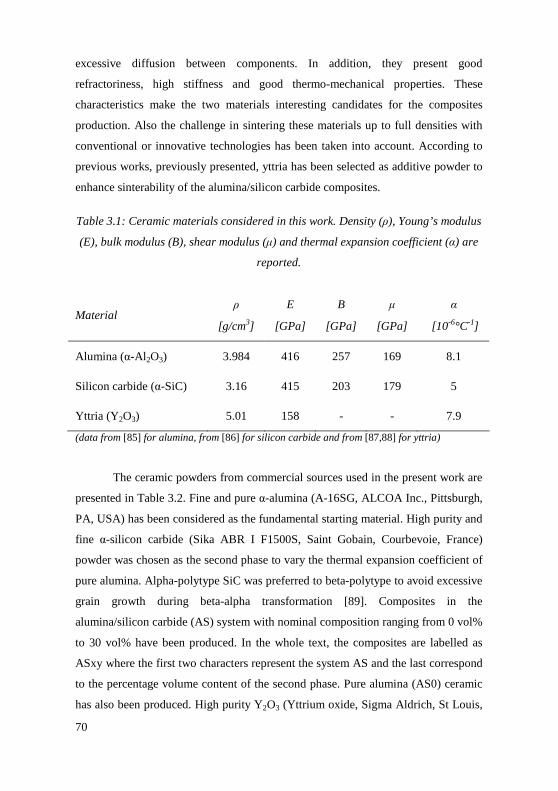
70
excessive diffusion between components. In addition, they present good
refractoriness, high stiffness and good thermo-mechanical properties. These
characteristics make the two materials interesting candidates for the composites
production. Also the challenge in sintering these materials up to full densities with
conventional or innovative technologies has been taken into account. According to
previous works, previously presented, yttria has been selected as additive powder to
enhance sinterability of the alumina/silicon carbide composites.
Table 3.1: Ceramic materials considered in this work. Density (ρ), Young’s modulus
(E), bulk modulus (B), shear modulus (µ) and thermal expansion coefficient (α) are
reported.
Material ρ
[g/cm3]
E
[GPa]
B
[GPa]
µ
[GPa]
α
[10-6°C-1]
Alumina (α-Al 2O3) 3.984 416 257 169 8.1
Silicon carbide (α-SiC) 3.16 415 203 179 5
Yttria (Y2O3) 5.01 158 - - 7.9
(data from [85] for alumina, from [86] for silicon carbide and from [87,88] for yttria)
The ceramic powders from commercial sources used in the present work are
presented in Table 3.2. Fine and pure α-alumina (A-16SG, ALCOA Inc., Pittsburgh,
PA, USA) has been considered as the fundamental starting material. High purity and
fine α-silicon carbide (Sika ABR I F1500S, Saint Gobain, Courbevoie, France)
powder was chosen as the second phase to vary the thermal expansion coefficient of
pure alumina. Alpha-polytype SiC was preferred to beta-polytype to avoid excessive
grain growth during beta-alpha transformation [89]. Composites in the
alumina/silicon carbide (AS) system with nominal composition ranging from 0 vol%
to 30 vol% have been produced. In the whole text, the composites are labelled as
ASxy where the first two characters represent the system AS and the last correspond
to the percentage volume content of the second phase. Pure alumina (AS0) ceramic
has also been produced. High purity Y2O3 (Yttrium oxide, Sigma Aldrich, St Louis,
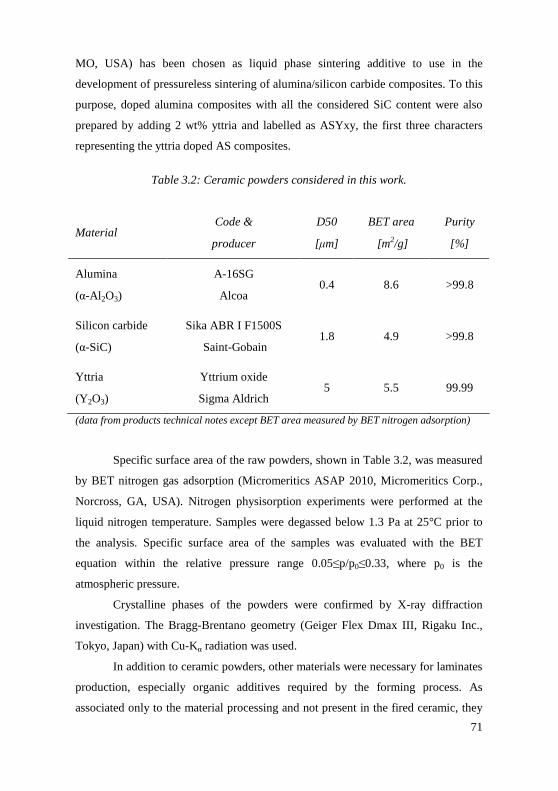
71
MO, USA) has been chosen as liquid phase sintering additive to use in the
development of pressureless sintering of alumina/silicon carbide composites. To this
purpose, doped alumina composites with all the considered SiC content were also
prepared by adding 2 wt% yttria and labelled as ASYxy, the first three characters
representing the yttria doped AS composites.
Table 3.2: Ceramic powders considered in this work.
Material Code &
producer
D50
[µm]
BET area
[m2/g]
Purity
[%]
Alumina
(α-Al 2O3)
A-16SG
Alcoa 0.4 8.6 >99.8
Silicon carbide
(α-SiC)
Sika ABR I F1500S
Saint-Gobain 1.8 4.9 >99.8
Yttria
(Y2O3)
Yttrium oxide
Sigma Aldrich 5 5.5 99.99
(data from products technical notes except BET area measured by BET nitrogen adsorption)
Specific surface area of the raw powders, shown in Table 3.2, was measured
by BET nitrogen gas adsorption (Micromeritics ASAP 2010, Micromeritics Corp.,
Norcross, GA, USA). Nitrogen physisorption experiments were performed at the
liquid nitrogen temperature. Samples were degassed below 1.3 Pa at 25°C prior to
the analysis. Specific surface area of the samples was evaluated with the BET
equation within the relative pressure range 0.05≤p/p0≤0.33, where p0 is the
atmospheric pressure.
Crystalline phases of the powders were confirmed by X-ray diffraction
investigation. The Bragg-Brentano geometry (Geiger Flex Dmax III, Rigaku Inc.,
Tokyo, Japan) with Cu-Kα radiation was used.
In addition to ceramic powders, other materials were necessary for laminates
production, especially organic additives required by the forming process. As
associated only to the material processing and not present in the fired ceramic, they
72
were not included here and are discussed in the paragraph on tape casting.
3.1.2 Process selection
3.1.2.1 Green forming method
In the second chapter, several production processes to obtain ceramic
laminates have been presented. Suspension processing techniques can be used to
prepare green bodies with high relative density, small pore sizes and homogeneous
microstructure. In the present work, tape casting has been selected as green forming
technique as it is a simple and relatively low cost method which does not require any
special equipment. In the past, it was successfully used to produce laminates in a
variety of materials with high density and a wide range of thickness, ranging from
25 µm up to over 1250 µm, and is therefore suitable for the production of laminas
whose thickness must be easily adjusted.
Water-based slurries were considered because of the many advantages which
the universal solvent offers. Contrary to organic solvents, its use is in fact safe,
healthy, low-cost and does not involve any environmental problem associated to
disposal. These considerations are valid not only for the lab-scale experiments of
relevance here, but mainly for any out-coming industrial application, since the
volumes and the subsequent risks are extremely higher in the latter case. In addition,
there are no problems related to degradation of the ceramic powders considered in
this work.
The polyelectrolyte approach to produce the short-range, interparticle
repulsive potential useful to obtain well dispersed slip has been chosen since it has
greater applicability to many different powders and mixtures of different powders
common to ceramic processing. A commercial polyelectrolyte dispersant (Table 3.3)
was considered and the optimum amount obtained by literature [82,90–92]. Acrylic
emulsions (Table 3.3) have been chosen as binders since they are very promising for
tape casting slurry formulations owing to their features expected to reduce some
drawbacks linked to aqueous preparation. The suitable amount of binder to be added
has been determined experimentally, considering previous works results [22–24].
73
3.1.2.2 Sintering
As described in the second chapter, densification of the Al2O3/SiC
composites is severely limited by the presence of the second phase, thus requiring
hot pressing technique to achieve full densification. For many potential applications
of these materials, hot pressing would be prohibitively expensive and pressureless
sintering routes would be preferable if near full density could be achieved.
In this work, pressureless sintering has been chosen as one densification
route to investigate the practicability of applying conventional processing to
alumina/silicon carbide laminates presenting a T-curve behaviour. This would
provide a basis for cost-effective scale up technique to fabricate larger amounts of
near net shape products. However, as discussed in the second chapter, a significant
barrier to the application of conventional sintering to alumina/silicon carbide
composites is their reduced sinterability compared to alumina and their composition
variations due to vaporization processes occurring at the sintering temperatures. To
overcome the weight loss problem, the limitation of vapours flow in the sintering
atmosphere can be used, which is achievable by enhancing the green density of the
samples and reducing the size of the open porosity, or by a reduction of the sintering
gas flow or by the use of a powder bed. Each one of these strategies has been
selected by using a proper green forming method, realizing sintering cycles under a
minimum gas flow and by surrounding the samples by a buffer bed. Even though
high temperature sintering processes are generally performed in graphite furnaces, in
this work an alumina tube furnace has been chosen as sintering equipment since the
presence of carbon, in contact or not, in furnace environments is detrimental to
alumina. In fact, formation of aluminium carbide, Al4C3, or oxycarbides as Al2OC,
by carbothermal reduction of alumina, starting from 1400°C, under vacuum or
atmospheric pressure of argon in presence of carbon, has been reported [93,94].
The laminated Al2O3/SiC composites were fabricated also by means of the
Spark Plasma Sintering (SPS) technique due to its beneficial characteristics. In
addition, SPS had not been used before for the said kind of multilayers.
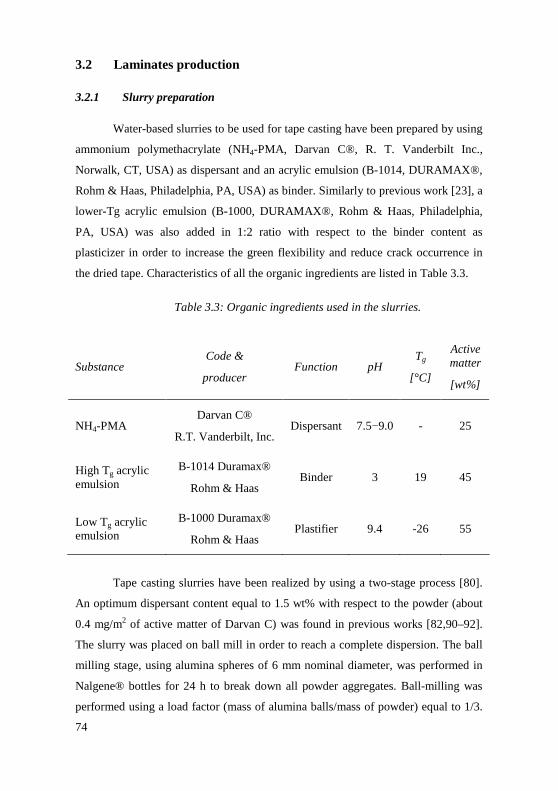
74
3.2 Laminates production
3.2.1 Slurry preparation
Water-based slurries to be used for tape casting have been prepared by using
ammonium polymethacrylate (NH4-PMA, Darvan C®, R. T. Vanderbilt Inc.,
Norwalk, CT, USA) as dispersant and an acrylic emulsion (B-1014, DURAMAX®,
Rohm & Haas, Philadelphia, PA, USA) as binder. Similarly to previous work [23], a
lower-Tg acrylic emulsion (B-1000, DURAMAX®, Rohm & Haas, Philadelphia,
PA, USA) was also added in 1:2 ratio with respect to the binder content as
plasticizer in order to increase the green flexibility and reduce crack occurrence in
the dried tape. Characteristics of all the organic ingredients are listed in Table 3.3.
Table 3.3: Organic ingredients used in the slurries.
Substance Code &
producer Function pH
Tg
[°C]
Active matter
[wt%]
NH4-PMA Darvan C®
R.T. Vanderbilt, Inc. Dispersant 7.5−9.0 - 25
High Tg acrylic emulsion
B-1014 Duramax®
Rohm & Haas Binder 3 19 45
Low Tg acrylic emulsion
B-1000 Duramax®
Rohm & Haas Plastifier 9.4 -26 55
Tape casting slurries have been realized by using a two-stage process [80].
An optimum dispersant content equal to 1.5 wt% with respect to the powder (about
0.4 mg/m2 of active matter of Darvan C) was found in previous works [82,90–92].
The slurry was placed on ball mill in order to reach a complete dispersion. The ball
milling stage, using alumina spheres of 6 mm nominal diameter, was performed in
Nalgene® bottles for 24 h to break down all powder aggregates. Ball-milling was
performed using a load factor (mass of alumina balls/mass of powder) equal to 1/3.
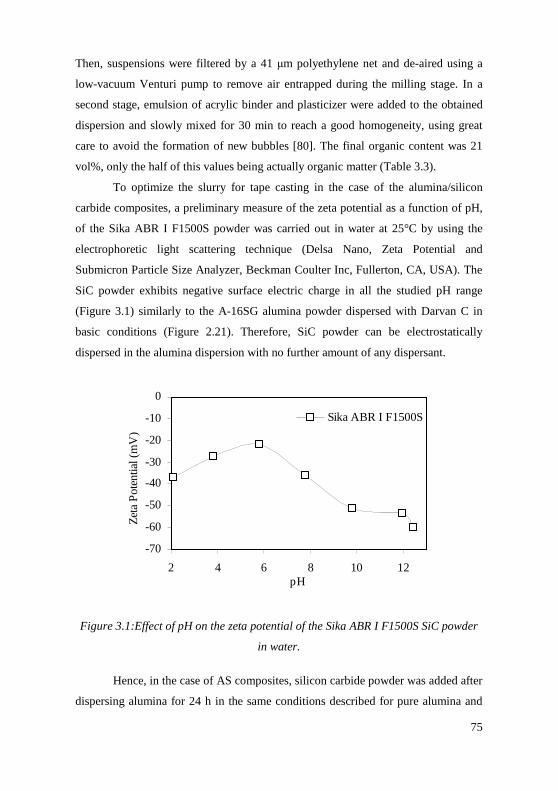
75
Then, suspensions were filtered by a 41 µm polyethylene net and de-aired using a
low-vacuum Venturi pump to remove air entrapped during the milling stage. In a
second stage, emulsion of acrylic binder and plasticizer were added to the obtained
dispersion and slowly mixed for 30 min to reach a good homogeneity, using great
care to avoid the formation of new bubbles [80]. The final organic content was 21
vol%, only the half of this values being actually organic matter (Table 3.3).
To optimize the slurry for tape casting in the case of the alumina/silicon
carbide composites, a preliminary measure of the zeta potential as a function of pH,
of the Sika ABR I F1500S powder was carried out in water at 25°C by using the
electrophoretic light scattering technique (Delsa Nano, Zeta Potential and
Submicron Particle Size Analyzer, Beckman Coulter Inc, Fullerton, CA, USA). The
SiC powder exhibits negative surface electric charge in all the studied pH range
(Figure 3.1) similarly to the A-16SG alumina powder dispersed with Darvan C in
basic conditions (Figure 2.21). Therefore, SiC powder can be electrostatically
dispersed in the alumina dispersion with no further amount of any dispersant.
-70
-60
-50
-40
-30
-20
-10
0
2 4 6 8 10 12pH
Zet
a P
oten
tial (
mV
)
Sika ABR I F1500S
Figure 3.1:Effect of pH on the zeta potential of the Sika ABR I F1500S SiC powder
in water.
Hence, in the case of AS composites, silicon carbide powder was added after
dispersing alumina for 24 h in the same conditions described for pure alumina and
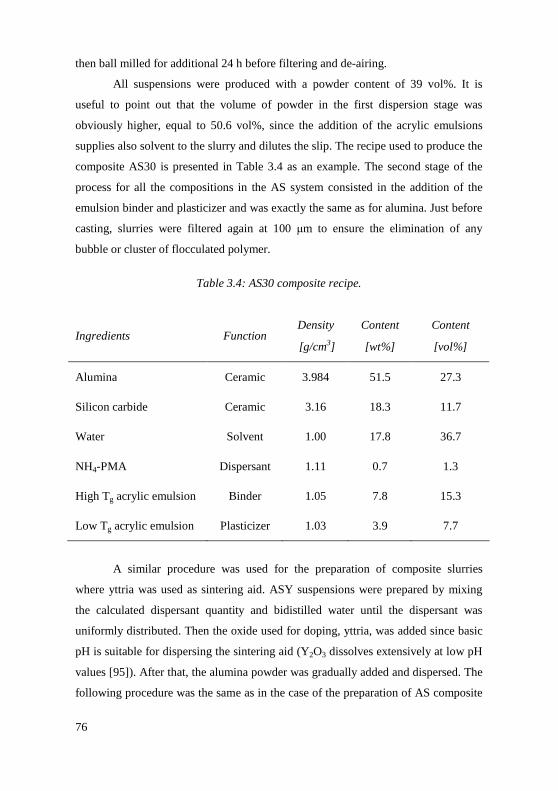
76
then ball milled for additional 24 h before filtering and de-airing.
All suspensions were produced with a powder content of 39 vol%. It is
useful to point out that the volume of powder in the first dispersion stage was
obviously higher, equal to 50.6 vol%, since the addition of the acrylic emulsions
supplies also solvent to the slurry and dilutes the slip. The recipe used to produce the
composite AS30 is presented in Table 3.4 as an example. The second stage of the
process for all the compositions in the AS system consisted in the addition of the
emulsion binder and plasticizer and was exactly the same as for alumina. Just before
casting, slurries were filtered again at 100 µm to ensure the elimination of any
bubble or cluster of flocculated polymer.
Table 3.4: AS30 composite recipe.
Ingredients Function Density
[g/cm3]
Content
[wt%]
Content
[vol%]
Alumina Ceramic 3.984 51.5 27.3
Silicon carbide Ceramic 3.16 18.3 11.7
Water Solvent 1.00 17.8 36.7
NH4-PMA Dispersant 1.11 0.7 1.3
High Tg acrylic emulsion Binder 1.05 7.8 15.3
Low Tg acrylic emulsion Plasticizer 1.03 3.9 7.7
A similar procedure was used for the preparation of composite slurries
where yttria was used as sintering aid. ASY suspensions were prepared by mixing
the calculated dispersant quantity and bidistilled water until the dispersant was
uniformly distributed. Then the oxide used for doping, yttria, was added since basic
pH is suitable for dispersing the sintering aid (Y2O3 dissolves extensively at low pH
values [95]). After that, the alumina powder was gradually added and dispersed. The
following procedure was the same as in the case of the preparation of AS composite
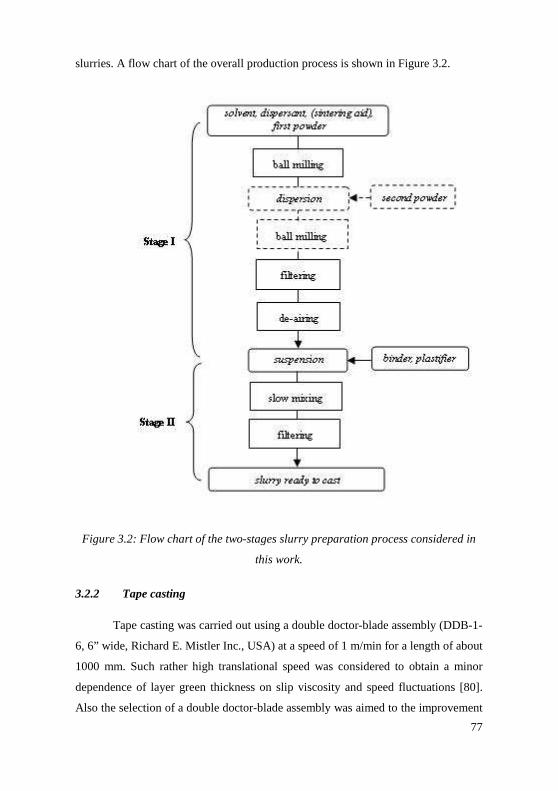
77
slurries. A flow chart of the overall production process is shown in Figure 3.2.
Figure 3.2: Flow chart of the two-stages slurry preparation process considered in
this work.
3.2.2 Tape casting
Tape casting was carried out using a double doctor-blade assembly (DDB-1-
6, 6” wide, Richard E. Mistler Inc., USA) at a speed of 1 m/min for a length of about
1000 mm. Such rather high translational speed was considered to obtain a minor
dependence of layer green thickness on slip viscosity and speed fluctuations [80].
Also the selection of a double doctor-blade assembly was aimed to the improvement
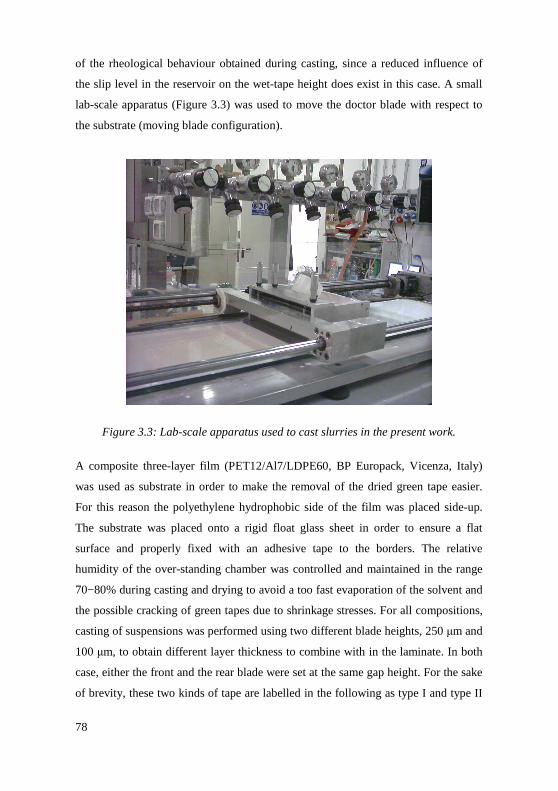
78
of the rheological behaviour obtained during casting, since a reduced influence of
the slip level in the reservoir on the wet-tape height does exist in this case. A small
lab-scale apparatus (Figure 3.3) was used to move the doctor blade with respect to
the substrate (moving blade configuration).
Figure 3.3: Lab-scale apparatus used to cast slurries in the present work.
A composite three-layer film (PET12/Al7/LDPE60, BP Europack, Vicenza, Italy)
was used as substrate in order to make the removal of the dried green tape easier.
For this reason the polyethylene hydrophobic side of the film was placed side-up.
The substrate was placed onto a rigid float glass sheet in order to ensure a flat
surface and properly fixed with an adhesive tape to the borders. The relative
humidity of the over-standing chamber was controlled and maintained in the range
70−80% during casting and drying to avoid a too fast evaporation of the solvent and
the possible cracking of green tapes due to shrinkage stresses. For all compositions,
casting of suspensions was performed using two different blade heights, 250 µm and
100 µm, to obtain different layer thickness to combine with in the laminate. In both
case, either the front and the rear blade were set at the same gap height. For the sake
of brevity, these two kinds of tape are labelled in the following as type I and type II
79
tapes, with reference to green tapes cast at 250 µm and 100 µm, respectively. After
tape casting and drying, the green sheets showed smooth surface, homogeneous
microstructure and uniform thickness of approximately 120 µm and 50 µm
respectively.
3.2.3 Stacking and lamination
Green disks of 30 mm nominal diameter as well as sheets of nominal
dimension 60 mm x 45 mm were cut from the green tapes using a hollow punch or
an hand-cutter, stacked together according to the desired laminate architecture and
uniaxially thermo-compressed at 80°C under a pressure of 30 MPa. The pressure
was applied for 15 min in load control using a universal mechanical testing machine
(mod. 810, MTS Systems GmbH, Berlin, Germany). A heating rate of about
3°C/min was considered. A 100 µm silicon-coated PET layer was placed between
the laminate and the stainless steel dies to prevent sticking to steel of the surface
layers and make the removal easier after thermo-compression. Care was taken to
maintain the same side-up for each green lamina during pile-up to obtain a better
adhesion between the different layers. In fact, it was demonstrated elsewhere that the
binder distribution is not homogeneous in the green tape after drying [80,96], the
bottom surface (substrate side) being richer of organic phase. Therefore, the same
side was used for each lamina in a given laminate to avoid delamination. Two
different kind of disks composed of 20 or 34 layers were produced: monolithic disks
of identical layers and symmetrical multilayered materials constituted by a prefixed
stacking of layers. For sake of brevity, these two kinds of multilayer are labelled in
the following as thin (20 layers) and thick (34 layers) laminates. Only stacks of 20
laminae were used for green samples fabrication. Disks were ground with 180-grit
SiC paper on the lateral surfaces to eliminate any layer misalignment or border
imperfection. Bars of nominal dimensions 30 mm x 9 mm x 2 mm useful for
mechanical testing were cut after thermo-compression of rectangular laminates and
then re-laminated [96] before the thermal treatment to avoid any delamination
caused by localized shear stresses due to cutting operations. Pre-cutting of bars is a
valid solution to avoid cutting of fired laminates, since the presence of high residual
stresses as well as the hardness of sintered materials make that operation a long,
80
tedious and low-efficient task.
3.2.4 Burn-out and pre-sintering treatment
Burn-out conditions were selected on the basis of the results of the
thermogravimetric analysis on the silicon carbide powder and on the organic
ingredients listed in Table 3.3. Binder, plasticizer and dispersant must be removed in
fact by pyrolysis before sintering and the thermal treatment must provide for such a
purpose. In addition, in order to maintain the composition in the composite materials
the oxidation of the silicon carbide powder has to be avoided. Indeed, the amount of
silica induced on SiC particles during processing must be carefully controlled as it
results in formation of mullite and liquid phases during sintering and glassy
intergranular phases in the dense materials. Thermo-gravimetric analysis of the
silicon carbide powder was performed in air flow (200 cc/min) up to 1450°C at
5°C/min using a TG/DTA apparatus (STA 409, NETZSCH GmbH, Selb, Germany)
to individuate the temperature range in which oxidation occurs. Thermo-gravimetric
analysis of the organic ingredients was performed up to 1100°C at 5°C/min to locate
the temperature range of pyrolysis phenomena and define the correct thermal
treatment accordingly. An inert gas atmosphere (argon flow of 200 cm3/min) has
been used to study the effect of the inert character of the atmosphere on the thermal
degradation.
As time is required for polymer degradation, which occurs usually by
cracking, a slow heating rate is usually required in the temperature range where
pyrolysis takes place to obtain a homogeneous ceramic green. For the same reason,
laminates were supported in the furnace using alumina sponges, which allow an easy
removal of the produced gaseous species and lease a more uniform porosity in the
ceramic body after burn-out. According to the observed pyrolysis intervals, all
laminates were subjected to a debinding treatment, carried out by slow heating
(1°C/min) up to 600°C in argon flow (100 cm3/min) to allow the complete burn-out
of the organic phase. The temperature was then raised to 4°C/min up to 1000°C for a
successive pre-sintering treatment (dwell time = 12 min) useful to produce samples
that can be easily handled.
Each sample was weighed before and after the pre-sintering treatment to
81
determine the average weight change for the material and this was compared with
the weight change detected by TG analysis to evaluate the amount of carbonaceous
residue of the organic substances burn-out.
For all the AS compositions, green compact open porosity and pore size
distribution were analyzed by mercury intrusion porosimetry (Pascal 140 and
Porosimeter 2000, CE Instruments, Milano, Italy). The pore channel radii
distribution was obtained using standard values for the mercury surface energy (484
erg/cm2 or 4.84·10-5 J/cm2) and the contact angle (140°).
3.2.5 Pressureless sintering
The effect of temperature, atmosphere and powder bed on pressureless
sintering behaviour of alumina/silicon carbide composites, with and without yttria as
sintering aid, was investigated to provide the experimental conditions found to be
favourable for the laminates fabrication. Pressureless sintering of the specimens was
conducted in an alumina tube furnace (HTRH 100-300/18, GERO
Hochtemperaturöfen GmbH, Germany) under flowing N2 or Ar atmosphere
(50cc/min) during 2h at a temperature of 1700°C or 1750°C. The heating rate was
4°C/min until high temperature. In some experiments the laminates were placed onto
an alumina sponge while in other cases the samples were put in an alumina vessel
and surrounded by a powder bed. Pure A16-SG alumina powder (A bed), pure Sika
ABR I F1500S silicon carbide powder (S bed) and 50 mol% A16-SG/ Sika ABR I
F1500S powder (AS bed) were used as beds to promote a protective atmosphere
during firing. As discussed in previous chapter, sintering of Al2O3/SiC compositions
is accompanied by the formation of volatile species as Al(g), Al2O(g), SiO(g) and
CO(g), their concentration, and consequently the weight loss in the composite, being
determined by the material composition and by the sintering atmosphere and
temperature. The gaseous species formation is mainly due to the interaction between
an equal number of moles of Al2O3 and SiC (React. (2.1)). Therefore, to hinder the
decomposition of SiC due to interaction with Al2O3, a mixture of 50 mol% of SiC
and Al2O3 has been considered, as beneficial buffer bed, and tested. Such AS bed
was produced by manually mixing the powders before the use.
After sintering, weight loss and relative density of samples were determined.
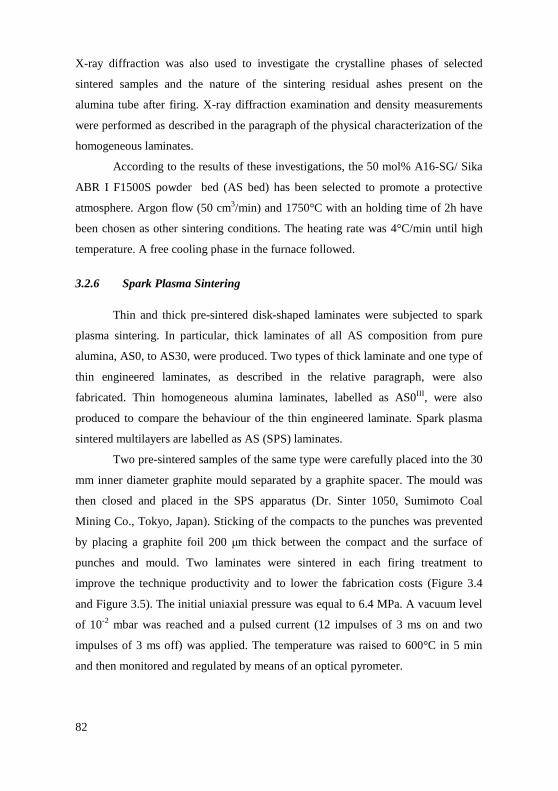
82
X-ray diffraction was also used to investigate the crystalline phases of selected
sintered samples and the nature of the sintering residual ashes present on the
alumina tube after firing. X-ray diffraction examination and density measurements
were performed as described in the paragraph of the physical characterization of the
homogeneous laminates.
According to the results of these investigations, the 50 mol% A16-SG/ Sika
ABR I F1500S powder bed (AS bed) has been selected to promote a protective
atmosphere. Argon flow (50 cm3/min) and 1750°C with an holding time of 2h have
been chosen as other sintering conditions. The heating rate was 4°C/min until high
temperature. A free cooling phase in the furnace followed.
3.2.6 Spark Plasma Sintering
Thin and thick pre-sintered disk-shaped laminates were subjected to spark
plasma sintering. In particular, thick laminates of all AS composition from pure
alumina, AS0, to AS30, were produced. Two types of thick laminate and one type of
thin engineered laminates, as described in the relative paragraph, were also
fabricated. Thin homogeneous alumina laminates, labelled as AS0III , were also
produced to compare the behaviour of the thin engineered laminate. Spark plasma
sintered multilayers are labelled as AS (SPS) laminates.
Two pre-sintered samples of the same type were carefully placed into the 30
mm inner diameter graphite mould separated by a graphite spacer. The mould was
then closed and placed in the SPS apparatus (Dr. Sinter 1050, Sumimoto Coal
Mining Co., Tokyo, Japan). Sticking of the compacts to the punches was prevented
by placing a graphite foil 200 µm thick between the compact and the surface of
punches and mould. Two laminates were sintered in each firing treatment to
improve the technique productivity and to lower the fabrication costs (Figure 3.4
and Figure 3.5). The initial uniaxial pressure was equal to 6.4 MPa. A vacuum level
of 10-2 mbar was reached and a pulsed current (12 impulses of 3 ms on and two
impulses of 3 ms off) was applied. The temperature was raised to 600°C in 5 min
and then monitored and regulated by means of an optical pyrometer.
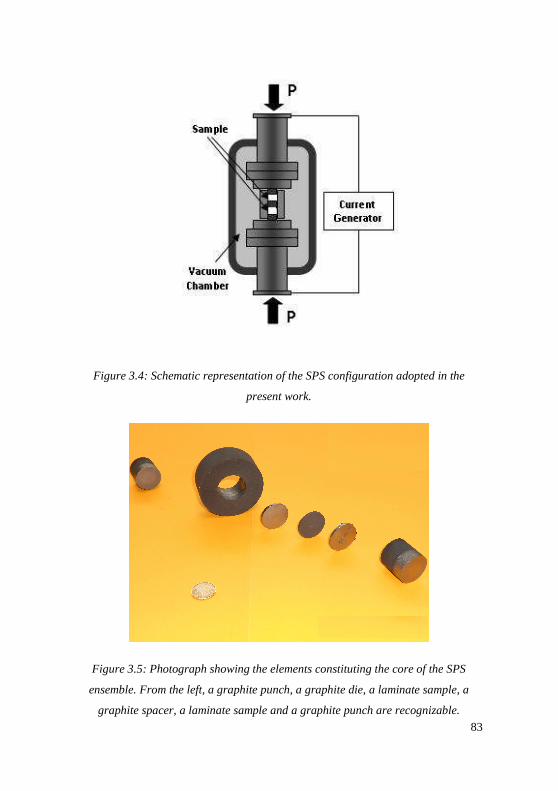
83
Figure 3.4: Schematic representation of the SPS configuration adopted in the
present work.
Figure 3.5: Photograph showing the elements constituting the core of the SPS
ensemble. From the left, a graphite punch, a graphite die, a laminate sample, a
graphite spacer, a laminate sample and a graphite punch are recognizable.
84
Then, the uniaxial pressure was raised to 28.7 MPa and the temperature was
increased, at first up to 1650°C (heating rate = 100°C/min) and then to 1700°C
(heating rate = 50°C/min). After a holding time of 2 min, the pressure was released,
the current turned off, and the sample cooled down. A sintering temperature equal to
1700°C was chosen for the spark plasma sintering process to obtain dense
microstructures for all the compositions and to make a comparison with the
analogous pressureless sintered materials.
3.3 Homogeneous Laminates
3.3.1 Physical characterization
Crystalline phases in selected sintered samples were examined through X-
ray diffraction in the Bragg-Brentano geometry (Geiger Flex Dmax III, Rigaku Inc.,
Tokyo, Japan) with Cu-Kα radiation, operated at 40 kV and 30 mA, and a graphite
monochromator in the diffracted beam. The step size and step time are 0.05°/step
and 5 s respectively. The quantity of phase composition of selected samples was
analyzed with Rietveld refinement of the XRD data. The Rietveld analysis program
Materials Analysis using Diffraction (MAUD, Version 2.26) [97] was employed to
evaluate the collected diffraction patterns.
Bulk densities of sintered samples were measured by the Archimedes’
immersion method in de-ionized water at room temperature. Six samples for each
material were considered. Relative densities and porosity were also calculated with
reference to the theoretical densities of fully densified composites. Assuming a
density of 3.984 g/cm3 for alumina and 3.16 g/cm3 for silicon carbide (Table 3.1),
the theoretical densities of composites were calculated by the rule of mixtures:
( )1v21v112 f1ρfρρ −+= Eq. (3.1)
where ρ12, ρ1 and ρ2 are the densities of the composite, phase 1 and phase 2
respectively and fv1 the volume fraction of phase 1.
The thermal expansion coefficient required for the residual stress calculation
by Eq. (2.15) and Eq. (2.16) was measured in the range 25−1000°C by a dilatometry
85
apparatus (DIL 402, NETZSCH GmbH, Selb, Germany) using an alumina sample
holder and a heating rate of 5°C/min. The experimental values were compared to the
Turner’s equation [3] proposed to estimate the thermal expansion coefficient of a
generic composite with a fine and equiaxed microstructure, reported in the following
in the case of a two phase composite:
( )( )1v21v1
1v221v11
f1BfB
f1BαfBαα
−+−+= Eq. (3.2)
where B1 and B2 are the bulk moduli of phase 1 and 2, respectively, α1 and α2 the
corresponding thermal expansion coefficients and fv1 the volume fraction of phase 1.
The microstructure of the sintered materials was observed using Scanning
Electron Microscopy, SEM, (JSM-5500, JEOL Inc., Tokyo, Japan) and energy
dispersive microanalysis (Analyzer 500, IXRF Systems Inc., Houston, TX, USA).
Specimen surfaces were polished to 1 µm and thermally etched at 1500°C for 20
minutes in argon atmosphere. The average grain size, G, of monolithic alumina
samples was evaluated on SEM micrograph using the lineal intercept technique:
MN
C56.1G = Eq. (3.3)
where C is the total length of test line used, N the number of intercepts and M the
magnification of the photomicrograph [98]. A modified lineal intercept equation was
used to obtain the average grain size of the primary phase in two phase systems:
eff
eff
MN
C56.1G = Eq. (3.4)
where Ceff is the corrected test line length and Neff the effective number of intercept
[99]. Randomly drawn lines intersecting at least 150 grains was considered for each
measure. Silicon carbide grains were identified by energy dispersive microanalysis
and generally appeared smooth and light coloured relative to alumina. The
86
observation of fracture surface of homogeneous and engineered laminates after
mechanical testing was also done by SEM.
3.3.2 Mechanical characterization
The spark plasma sintered compact disks were ground with 250 µm diamond
wheel on the lateral surface to facilitate the graphite foil removal and cut with a
diamond blade into rectangular bars (thin and thick laminates to approximately 1.3 x
7 x 25 mm and 2 x 7 x 25 mm, respectively). Pressureless sintered bars with
approximately 1.7 x 7 x 25 mm nominal dimensions were produced. Each laminate
was ground using 125 µm grain size diamond disk to obtain lateral surfaces
perpendicular to the laminas plane. The edges, to be in tension, of specimens were
bevelled with 800-grit SiC paper to remove macroscopic defects and geometric
irregularities. In the case of spark plasma sintered samples, the provisional tensile
load surface of all bend specimens was the one in contact with the graphite punch
and perpendicular to the pressing axis. No further polishing or finishing operations
were performed on the sample surfaces or edges to avoid any artificial reduction of
flaws severity.
Fracture strength test was carried out in four-point bending mode with inner
and outer span of 10 and 20 mm, respectively, with crosshead speed of 0.2 mm/min.
The tests were performed according to the ASTM Standard C 1161-02c, though the
samples did not conform to the exact size recommendations. The strength values
were calculated from the average of 10−12 tests at each load.
Young’s modulus, E, was calculated from the load-displacement curve
obtained by four-point bending test. All displacement data were corrected for the
machine stiffness. Assuming a Young’ modulus of 416 GPa for alumina and 415
GPa for silicon carbide (Table 3.1), the theoretical Young’s modulus of fully
densified composites was considered to remains quite unvaried according to the
Hashin-Shtrikman model and the equation:
µB3
Bµ9E
+= Eq. (3.5)
87
where B and µ are the bulk modulus and the shear modulus determined as an
average of the upper and lower bounds calculated according to the model. In the
case of porous pressureless sintered materials the equation proposed by Roberts and
Garboczi [100] was used to estimate the elastic modulus:
n
00 P
P1
E
E
−= Eq. (3.6)
where E is the Young’s modulus of the porous material, P is the porosity, E0 is the
Young’s modulus of the dense material, P0 and n are empirical correlation
parameters depending on the pores model.
The Poisson’s ratio of the spark plasma sintered homogeneous laminates
were also calculated by Hashin-Sthtrikman model and the equation:
( )µB32
µ2B3ν
+−= Eq. (3.7)
where B and µ are the bulk modulus and the shear modulus determined as an
average of the upper and lower bounds calculated according to the model. In the
case of porous pressureless sintered materials the equation proposed by Roberts and
Garboczi [100] was used to estimate Poisson’s ratio:
( )0n0
0 ννP
Pνν −+= Eq. (3.8)
where ν is the Poisson’s ratio of the porous material, P is the porosity, ν0 is the
Poisson’s ratio of the dense material, P0 and νn are fitting parameters depending on
the pores model.
The hardness, H, values were measured by means of Vickers indentation
method from the following formula [6]:
2d
P8544.1H = Eq. (3.9)
88
where P is the indentation load and d the projected diagonal of the indentation. A
load of 300 N was applied for 15 s on the 1 µm polished surface perpendicular to the
pressing axis, in the case SPS laminates.
Fracture toughness, KIC, was calculated using the Indentation Method
(IM)[101] after measuring the radial crack length, c, by optical microscopy using a
200X magnification:
5.1
5.0
ICc
P
H
E016.0K
= Eq. (3.10)
Spark plasma sintered and pressureless sintered alumina (AS0)
homogeneous laminates were also subjected to additional mechanical
characterisation, including a Weibull analysis, tests of post-indentation strength and
a fractographic analysis of broken samples, as described in detail in the following
paragraph. Only this composition was considered in these analyses since alumina is
the proper reference material to make a mechanical behaviour comparison respect to
the engineered laminates. Indeed, alumina represents the ceramic constituting the
internal region and the surface layer of the engineered multilayers.
3.4 Engineered Laminates
3.4.1 Structure of engineered laminates
In the second chapter an approach to design laminates with high mechanical
reliability has been presented. Considering the selected composite materials, the two
layers thickness (types I and II) cast in the present work and the two sintering
methods (PS and SPS), five different multilayered symmetric laminates were
designed and produced. The structure of the laminates was selected to obtain a
residual stress profile optimised to support bending loads and promote a stable
propagation of surface defects up to a maximum depth in the interval 50−85 µm.
Such laminates, labelled as AS-I (PS), ASY-I (PS) and AS-I (SPS), AS-II (SPS),
AS-III (SPS) present the structures shown in Figure 3.6. AS-I (PS) was produced by
pressureless sintering using composites in the sole AS system, ASY-I using also
yttria as sintering aid, whereas AS-I (SPS), AS-II (SPS), AS-III (SPS) were obtained
89
by spark plasma sintering of AS composites multilayers in order to obtain fully
densified materials. If a notation similar to that used for composite plies is
considered [11], the multilayer structure in terms of composition and sequence of
the laminae can be expressed as:
AS-I (PS) AS0II/AS10II/AS20II/AS10II/(AS0I)16//
ASY-I (PS) AS0II/ASY10II/ASY20II/ASY10II/(AS0I)16//
AS-I (SPS) AS0II/AS10II/AS20II/AS10II/(AS0I)30//
AS-II (SPS) AS0II/AS20II/AS30II/AS20II/(AS0I)30//
AS-III (SPS) AS0II/AS10II/AS20II/AS10II/(AS0I)16//
where the numerical subscripts represent the layer type previously discussed (I =
type I, II = type II) and the superscript represents the times a single layer is repeated.
In this notation the symbol slash (“/”) separates two contiguous layer and, if
repeated twice, represents the symmetry plane at the centre of the laminate. As
usually, the sequence presented above starts from the external layer. For instance,
the laminate AS-III (PS) is obtained by spark plasma sintering stacks of, in the
order, one thin AS0 layer, one thin AS10 layer, one thin AS20 layer, one thin AS10
layer and finally sixteen thick AS0 layers. Such sequence is repeated in the reverse
order in order to obtain a symmetric multilayer (Figure 3.6). Typical layers
thickness, as estimated on the produced engineered laminates by optical microscopy
and SEM, are also reported in Figure 3.6.
The residual stress distributions were calculated for each laminate by Eq.
(2.15) and the corresponding T-curve estimated according to the model represented
by Eq. (2.17) using a numerical procedure implemented in a commercial software
(MATHEMATICA ®, Wolfram Research, Inc., Champaing, IL, USA), the code
being listed in the Appendix.
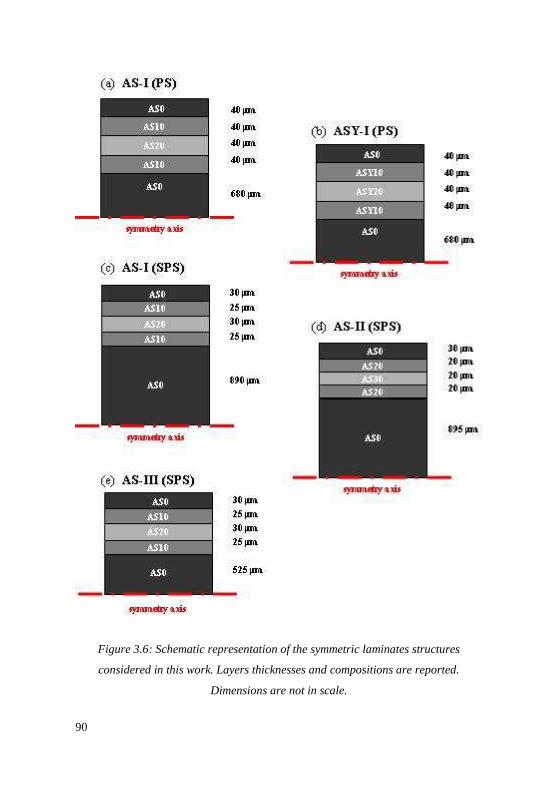
90
Figure 3.6: Schematic representation of the symmetric laminates structures
considered in this work. Layers thicknesses and compositions are reported.
Dimensions are not in scale.
91
To this purpose, the required material properties, as Young modulus, thermal
expansion coefficient and fracture toughness, as well as the layer thickness
estimated by previous characterisation were used. The free deformation was
supposed to be related only to thermal expansion and room temperature of 25°C and
stress free temperature equal to 1200°C were considered in Eq. (2.15) according to
previous works [62]. Once the correct trend of the T-curve was numerically
estimated, the design bending strength and threshold stress were estimated by Eq.
(2.19) and Eq. (2.20), as well as the depth of the largest edge cracks propagating in a
stable fashion.
3.4.2 Weibull analysis and post-indentation strength
Sintered bars of the engineered laminates AS-I (PS), ASY-I (PS), AS-I
(SPS), AS-II (SPS), AS-III (SPS) together with the corresponding homogeneous
alumina laminates AS0 (PS), AS0 (SPS), AS0III (SPS) with 7 mm x 25 mm
nominal dimension were ground using a 125 µm grain size diamond disk to obtain
lateral surfaces perpendicular to the laminas plane. Edges were slightly chamfered
with 800 SiC papers to remove macroscopic defects and geometrical irregularities as
previously described.
Four-points bending tests were carried out using the same apparatus
described before with an actuator speed of 0.2 mm/min and inner and outer span of
10 mm and 20 mm, respectively. For each laminate, 26−30 samples were
considered, while 12−20 samples were tested in the case of thick spark plasma
sintered laminates. A Weibull analysis was performed on bending strength data.
Monolithic alumina specimens produced using the same sintering conditions were
tested for comparative purposes.
Using the same experimental apparatus and the same test conditions,
bending strengths on indented samples were also measured in order to investigate
the damage tolerance of the engineered laminates. Vickers indentations with loads of
10 N, 30 N and 100 N were placed on the sample surface to introduce defects of
different sizes. Three indentations were produced in the centre of the perspective
tensile surface. Homogeneous AS0 (PS), AS0 (SPS) and AS0III (SPS) were also
tested in the same conditions for comparison. For each condition 3−4 indented
92
samples were considered, while only two samples of the AS-II (SPS) laminate,
indented at 30 N and 100 N, were tested. In the case of pressureless sintered
engineered laminates, some indentations at higher loads (150 N) were also
performed to investigate the interaction of deeper cracks with the sub-surface
residual stress profile.
The mechanical behaviour observed in the case of the five optimised
multilayers considered in the present work is presented in the next chapter. As
previously discussed, the mechanical behaviour of each profile is compared to that
one of the corresponding homogeneous laminate.
3.4.3 Investigation on stable growth
The reduced strength scatter expected for the optimised laminates is related
to the T-curve behaviour promoted by the residual stress profile. In addition to an
increase of damage resistance, stable growth phenomena for surface cracks are
expected to occur. An experimental verification of such a stable propagation of
surface cracks is therefore aimed to prove that what designed actually happens.
Fractographic analysis is an important tool to understand the fracture mechanisms,
allowing to identify whether the fracture was a result of material deficiency or
residual stress induced condition by design.
A fractographic analysis of the fracture surfaces of indented and non-
indented broken samples was performed either for the engineered and the
corresponding homogeneous laminates. The fracture origin and location, on surface
or near surface, was identified. The presence of any mark or unexpected feature was
recorded, paying special attention to the presence of the fracture mirror, when
present. Both optical and scanning electron microscopy were used to this purpose.
As already discussed in the second chapter, when the critical condition for
brittle failure is reached (Eq. (2.2)), crack starts to propagate increasing its speed up
to a maximum value. Beyond this point, any further mechanical energy released is
dissipated by crack tilting, twisting and branching and the fracture surface presents a
higher roughness. Therefore, a smooth region is usually present just near the starting
defect while roughness increases at larger distance (Figure 2.4). In most cases, two
kinds of region can be typically recognised: a mist zone with a medium roughness
93
and a hackle zone where roughness is coarser. This special feature is always
produced on the fracture surface around the crack origin, its shape being associated
to the loading condition and its size to the strength value [29]. Nevertheless, it is
important to point out that if no mirror is observed on the surface, there is also the
possibility that this is associated to a low fracture strength, since the radius of
fracture mirror can be larger than the sample section.
Regardless the actual size of the fracture mirror, its shape is expected to give
useful information about the position of the starting defect and to the loading
condition, the negative curvature pointing the direction of crack propagation and the
opposite showing therefore the side where crack origin is. The position and shape of
the fracture mirrors observed for the engineered laminates and for the corresponding
homogeneous samples were discussed to investigate the kind of the critical defects.

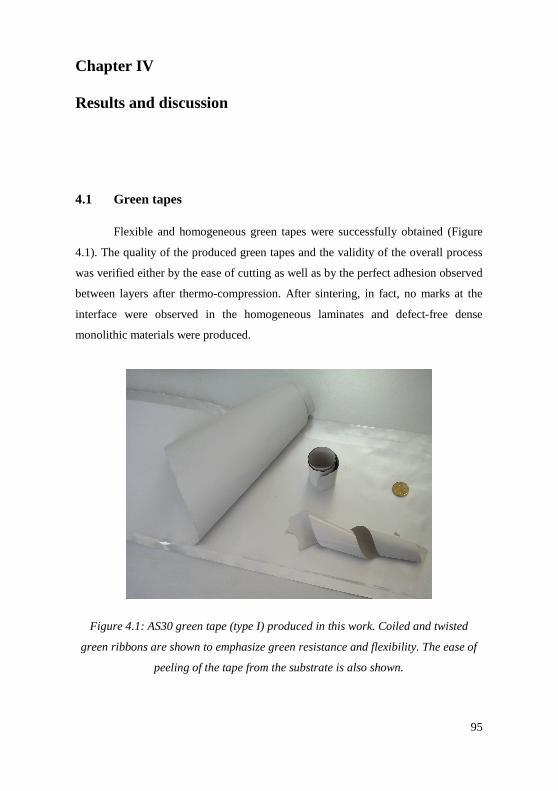
95
Chapter IV
Results and discussion
4. Results and discussion
4.1 Green tapes
Flexible and homogeneous green tapes were successfully obtained (Figure
4.1). The quality of the produced green tapes and the validity of the overall process
was verified either by the ease of cutting as well as by the perfect adhesion observed
between layers after thermo-compression. After sintering, in fact, no marks at the
interface were observed in the homogeneous laminates and defect-free dense
monolithic materials were produced.
Figure 4.1: AS30 green tape (type I) produced in this work. Coiled and twisted
green ribbons are shown to emphasize green resistance and flexibility. The ease of
peeling of the tape from the substrate is also shown.
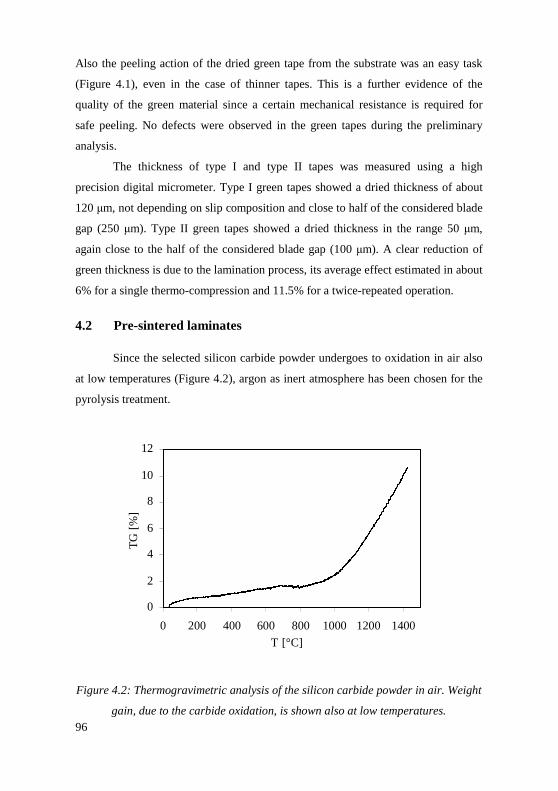
96
Also the peeling action of the dried green tape from the substrate was an easy task
(Figure 4.1), even in the case of thinner tapes. This is a further evidence of the
quality of the green material since a certain mechanical resistance is required for
safe peeling. No defects were observed in the green tapes during the preliminary
analysis.
The thickness of type I and type II tapes was measured using a high
precision digital micrometer. Type I green tapes showed a dried thickness of about
120 µm, not depending on slip composition and close to half of the considered blade
gap (250 µm). Type II green tapes showed a dried thickness in the range 50 µm,
again close to the half of the considered blade gap (100 µm). A clear reduction of
green thickness is due to the lamination process, its average effect estimated in about
6% for a single thermo-compression and 11.5% for a twice-repeated operation.
4.2 Pre-sintered laminates
Since the selected silicon carbide powder undergoes to oxidation in air also
at low temperatures (Figure 4.2), argon as inert atmosphere has been chosen for the
pyrolysis treatment.
0
2
4
6
8
10
12
0 200 400 600 800 1000 1200 1400
T [°C]
TG
[%
]
Figure 4.2: Thermogravimetric analysis of the silicon carbide powder in air. Weight
gain, due to the carbide oxidation, is shown also at low temperatures.
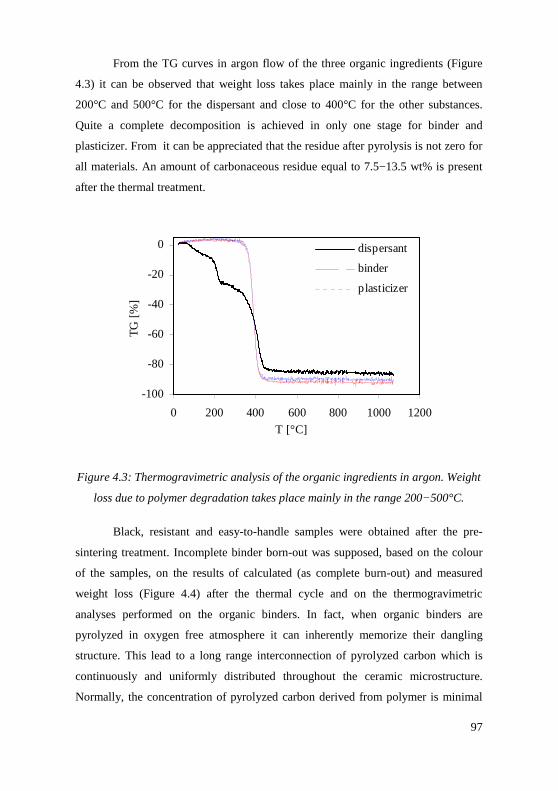
97
From the TG curves in argon flow of the three organic ingredients (Figure
4.3) it can be observed that weight loss takes place mainly in the range between
200°C and 500°C for the dispersant and close to 400°C for the other substances.
Quite a complete decomposition is achieved in only one stage for binder and
plasticizer. From it can be appreciated that the residue after pyrolysis is not zero for
all materials. An amount of carbonaceous residue equal to 7.5−13.5 wt% is present
after the thermal treatment.
-100
-80
-60
-40
-20
0
0 200 400 600 800 1000 1200
T [°C]
TG
[%]
dispersant
binder
plasticizer
Figure 4.3: Thermogravimetric analysis of the organic ingredients in argon. Weight
loss due to polymer degradation takes place mainly in the range 200−500°C.
Black, resistant and easy-to-handle samples were obtained after the pre-
sintering treatment. Incomplete binder born-out was supposed, based on the colour
of the samples, on the results of calculated (as complete burn-out) and measured
weight loss (Figure 4.4) after the thermal cycle and on the thermogravimetric
analyses performed on the organic binders. In fact, when organic binders are
pyrolyzed in oxygen free atmosphere it can inherently memorize their dangling
structure. This lead to a long range interconnection of pyrolyzed carbon which is
continuously and uniformly distributed throughout the ceramic microstructure.
Normally, the concentration of pyrolyzed carbon derived from polymer is minimal
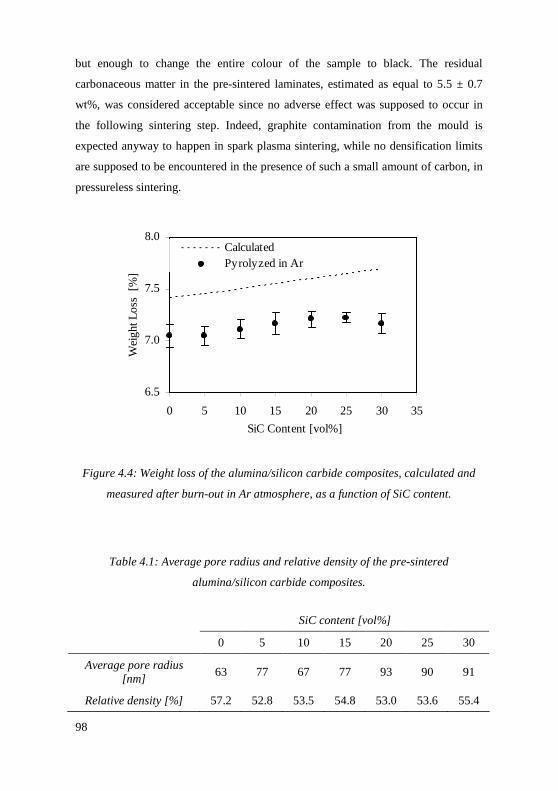
98
but enough to change the entire colour of the sample to black. The residual
carbonaceous matter in the pre-sintered laminates, estimated as equal to 5.5 ± 0.7
wt%, was considered acceptable since no adverse effect was supposed to occur in
the following sintering step. Indeed, graphite contamination from the mould is
expected anyway to happen in spark plasma sintering, while no densification limits
are supposed to be encountered in the presence of such a small amount of carbon, in
pressureless sintering.
6.5
7.0
7.5
8.0
0 5 10 15 20 25 30 35
SiC Content [vol%]
Wei
ght
Lo
ss
[%]
CalculatedPyrolyzed in Ar
Figure 4.4: Weight loss of the alumina/silicon carbide composites, calculated and
measured after burn-out in Ar atmosphere, as a function of SiC content.
Table 4.1: Average pore radius and relative density of the pre-sintered
alumina/silicon carbide composites.
SiC content [vol%]
0 5 10 15 20 25 30
Average pore radius [nm]
63 77 67 77 93 90 91
Relative density [%] 57.2 52.8 53.5 54.8 53.0 53.6 55.4
99
The pre-sintered monolithic laminates exhibited a total porosity of
approximately 45% (Table 4.1) with narrow pore size distribution from 63 nm to 93
nm. The packing density and quality of green samples is high enough to help the
sintering of the compacts. The addition of yttria had no significant effect on the
green properties and on the pore size distribution of the alumina compacts.
Frequent delamination was encountered during the pre-sintering process of
the AS-II (SPS) laminate samples where layers containing large compressive
stresses (AS30) are present. The high residual stresses produced by thermal
mismatch upon cooling can not be sustained, in fact, by the porous green materials
and shear delamination occurs. Nevertheless, this result can be considered as a proof
of the existence of high residual stresses directly related to the sole contribution of
thermal expansion mismatch.
4.3 Pressureless sintering
The pressureless sintered Al2O3/SiC compacts exhibited weight loss in the
order of 1−6 wt% (Figure 4.6) at 1700°C, the higher values corresponding to higher
SiC content and for the samples sintered on the alumina sponge. The use of an Ar
atmosphere and of the AS bed led to the lower weight loss, equal to about 1 wt% for
all compositions (Table 4.2). Relative densities decreased with SiC content, ranging
from about 90% for pure alumina to about 65% for the AS30 composite (Figure 4.7
and Table 4.2). When N2 was used as sintering atmosphere a better densification of
alumina was achieved respect to Ar, as observed by Coble [102]. Indeed, N2 provide
less resistance to final pore closure in alumina due to a higher diffusivity. However,
the effect of N2 in the sintering of the composites was detrimental, especially for
high SiC contents (Figure 4.6 and Figure 4.7).
Weight losses were increased at 1750°C, reaching values of about 16%
when N2 was used as sintering gas (Figure 4.8). Mass changes were higher for
samples placed on alumina sponge or into alumina bed, and were minimized
(~1−2.5 wt%) in the case of the AS bed, as expected by considering the vaporization
reaction occurring in the firing treatment. Relative densities were slightly increased
respect to the 1700°C firing cycle (Figure 4.9 and Table 4.2).
Analogous considerations could be proposed when yttria was used as
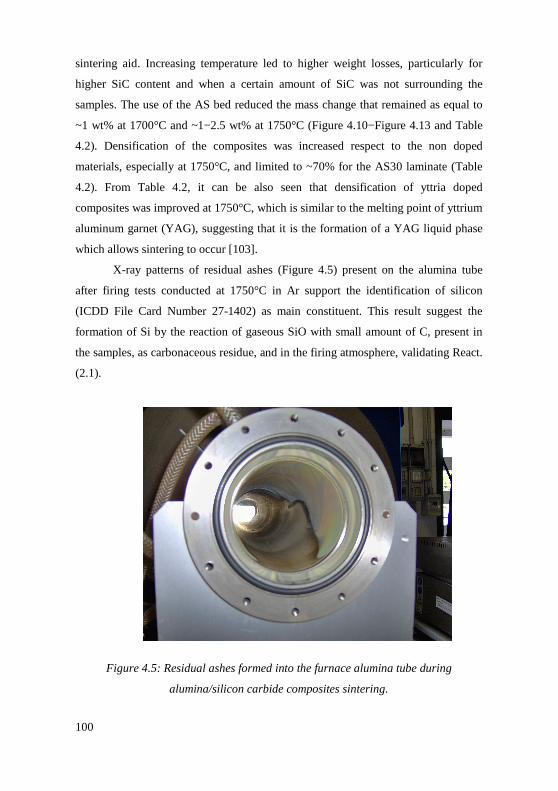
100
sintering aid. Increasing temperature led to higher weight losses, particularly for
higher SiC content and when a certain amount of SiC was not surrounding the
samples. The use of the AS bed reduced the mass change that remained as equal to
~1 wt% at 1700°C and ~1−2.5 wt% at 1750°C (Figure 4.10−Figure 4.13 and Table
4.2). Densification of the composites was increased respect to the non doped
materials, especially at 1750°C, and limited to ~70% for the AS30 laminate (Table
4.2). From Table 4.2, it can be also seen that densification of yttria doped
composites was improved at 1750°C, which is similar to the melting point of yttrium
aluminum garnet (YAG), suggesting that it is the formation of a YAG liquid phase
which allows sintering to occur [103].
X-ray patterns of residual ashes (Figure 4.5) present on the alumina tube
after firing tests conducted at 1750°C in Ar support the identification of silicon
(ICDD File Card Number 27-1402) as main constituent. This result suggest the
formation of Si by the reaction of gaseous SiO with small amount of C, present in
the samples, as carbonaceous residue, and in the firing atmosphere, validating React.
(2.1).
Figure 4.5: Residual ashes formed into the furnace alumina tube during
alumina/silicon carbide composites sintering.
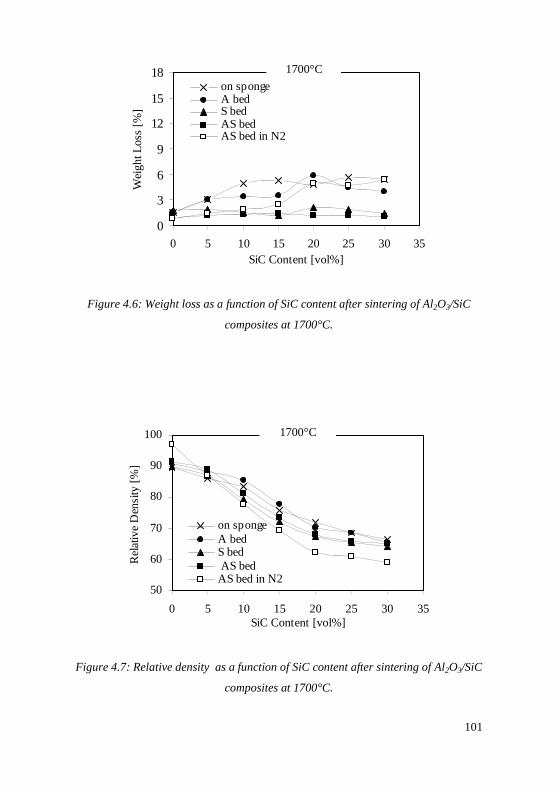
101
0
3
6
9
12
15
18
0 5 10 15 20 25 30 35SiC Content [vol%]
Wei
ght L
oss
[%]
on spongeA bedS bedAS bedAS bed in N2
1700°C
Figure 4.6: Weight loss as a function of SiC content after sintering of Al2O3/SiC
composites at 1700°C.
50
60
70
80
90
100
0 5 10 15 20 25 30 35SiC Content [vol%]
Rel
ativ
e D
ensi
ty [%
]
on spongeA bedS bed AS bedAS bed in N2
1700°C
Figure 4.7: Relative density as a function of SiC content after sintering of Al2O3/SiC
composites at 1700°C.
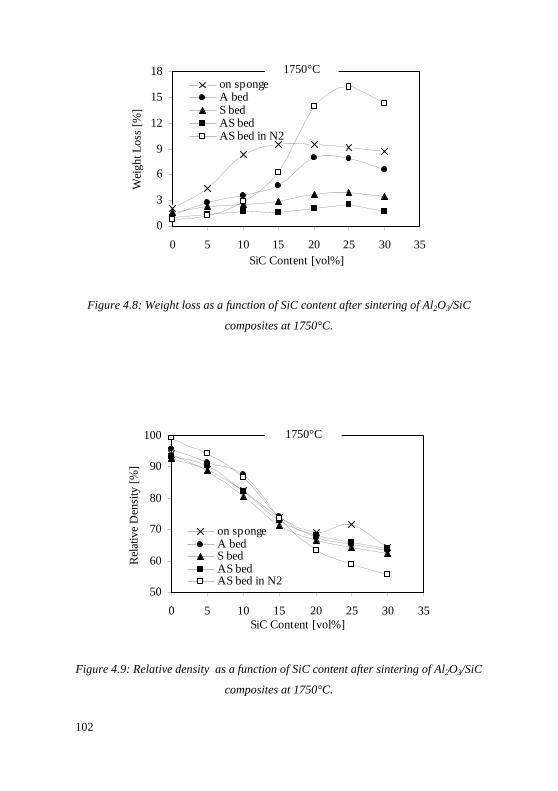
102
0
3
6
9
12
15
18
0 5 10 15 20 25 30 35SiC Content [vol%]
Wei
ght L
oss
[%]
on spongeA bedS bedAS bedAS bed in N2
1750°C
Figure 4.8: Weight loss as a function of SiC content after sintering of Al2O3/SiC
composites at 1750°C.
50
60
70
80
90
100
0 5 10 15 20 25 30 35SiC Content [vol%]
Rel
ativ
e D
ensi
ty [
%]
on spongeA bedS bedAS bedAS bed in N2
1750°C
Figure 4.9: Relative density as a function of SiC content after sintering of Al2O3/SiC
composites at 1750°C.
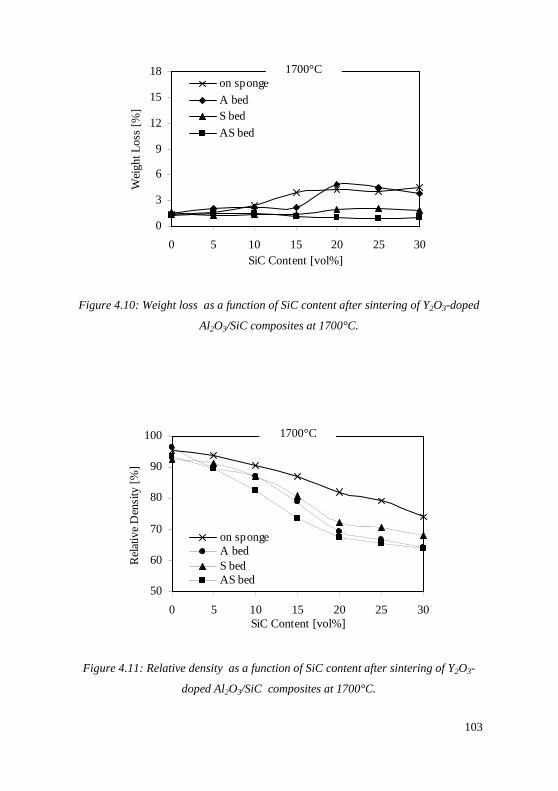
103
0
3
6
9
12
15
18
0 5 10 15 20 25 30SiC Content [vol%]
Wei
ght L
oss
[%]
on sponge
A bedS bed
AS bed
1700°C
Figure 4.10: Weight loss as a function of SiC content after sintering of Y2O3-doped
Al2O3/SiC composites at 1700°C.
50
60
70
80
90
100
0 5 10 15 20 25 30SiC Content [vol%]
Rel
ativ
e D
ensi
ty [%
]
on spongeA bedS bedAS bed
1700°C
Figure 4.11: Relative density as a function of SiC content after sintering of Y2O3-
doped Al2O3/SiC composites at 1700°C.
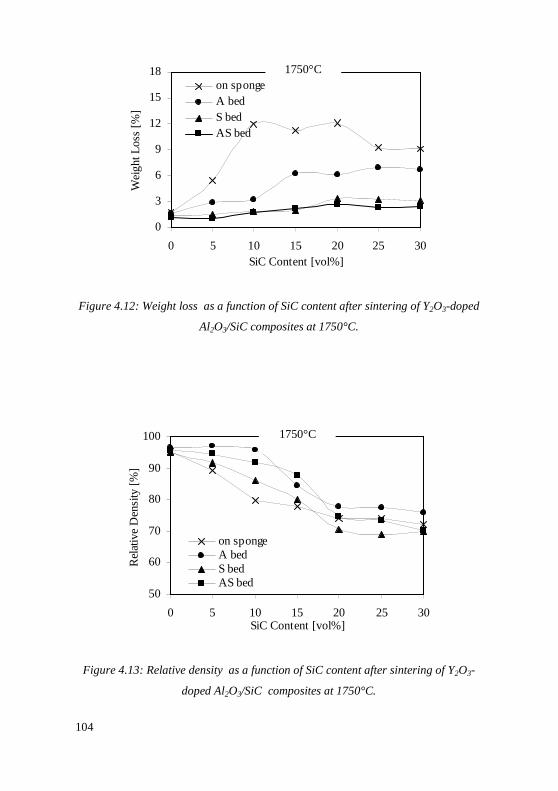
104
0
3
6
9
12
15
18
0 5 10 15 20 25 30SiC Content [vol%]
Wei
ght
Los
s [%
]
on spongeA bedS bedAS bed
1750°C
Figure 4.12: Weight loss as a function of SiC content after sintering of Y2O3-doped
Al2O3/SiC composites at 1750°C.
50
60
70
80
90
100
0 5 10 15 20 25 30SiC Content [vol%]
Rel
ativ
e D
ensi
ty [
%]
on spongeA bedS bedAS bed
1750°C
Figure 4.13: Relative density as a function of SiC content after sintering of Y2O3-
doped Al2O3/SiC composites at 1750°C.
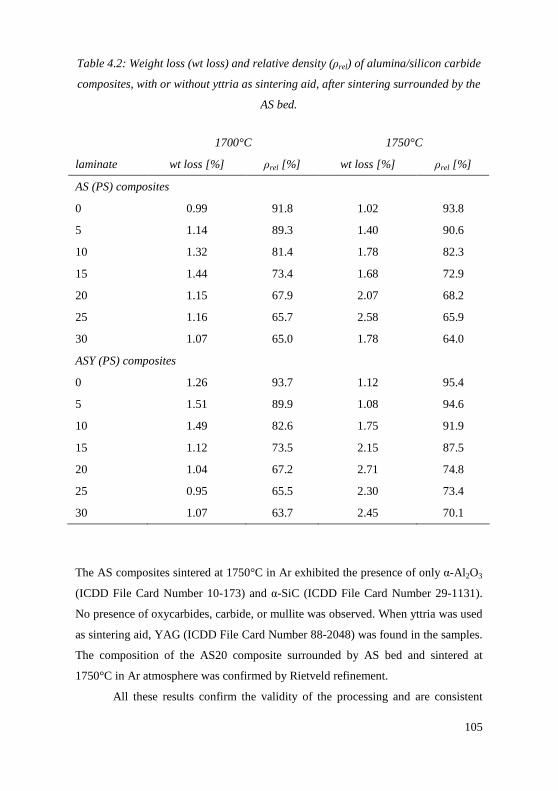
105
Table 4.2: Weight loss (wt loss) and relative density (ρrel) of alumina/silicon carbide
composites, with or without yttria as sintering aid, after sintering surrounded by the
AS bed.
1700°C 1750°C
laminate wt loss [%] ρrel [%] wt loss [%] ρrel [%]
AS (PS) composites
0 0.99 91.8 1.02 93.8
5 1.14 89.3 1.40 90.6
10 1.32 81.4 1.78 82.3
15 1.44 73.4 1.68 72.9
20 1.15 67.9 2.07 68.2
25 1.16 65.7 2.58 65.9
30 1.07 65.0 1.78 64.0
ASY (PS) composites
0 1.26 93.7 1.12 95.4
5 1.51 89.9 1.08 94.6
10 1.49 82.6 1.75 91.9
15 1.12 73.5 2.15 87.5
20 1.04 67.2 2.71 74.8
25 0.95 65.5 2.30 73.4
30 1.07 63.7 2.45 70.1
The AS composites sintered at 1750°C in Ar exhibited the presence of only α-Al 2O3
(ICDD File Card Number 10-173) and α-SiC (ICDD File Card Number 29-1131).
No presence of oxycarbides, carbide, or mullite was observed. When yttria was used
as sintering aid, YAG (ICDD File Card Number 88-2048) was found in the samples.
The composition of the AS20 composite surrounded by AS bed and sintered at
1750°C in Ar atmosphere was confirmed by Rietveld refinement.
All these results confirm the validity of the processing and are consistent
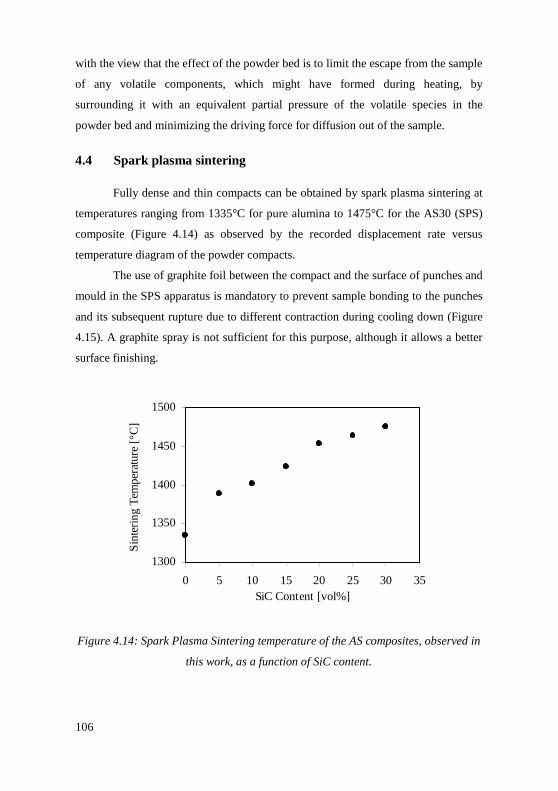
106
with the view that the effect of the powder bed is to limit the escape from the sample
of any volatile components, which might have formed during heating, by
surrounding it with an equivalent partial pressure of the volatile species in the
powder bed and minimizing the driving force for diffusion out of the sample.
4.4 Spark plasma sintering
Fully dense and thin compacts can be obtained by spark plasma sintering at
temperatures ranging from 1335°C for pure alumina to 1475°C for the AS30 (SPS)
composite (Figure 4.14) as observed by the recorded displacement rate versus
temperature diagram of the powder compacts.
The use of graphite foil between the compact and the surface of punches and
mould in the SPS apparatus is mandatory to prevent sample bonding to the punches
and its subsequent rupture due to different contraction during cooling down (Figure
4.15). A graphite spray is not sufficient for this purpose, although it allows a better
surface finishing.
1300
1350
1400
1450
1500
0 5 10 15 20 25 30 35SiC Content [vol%]
Sin
terin
g T
empe
ratu
re [
°C]
Figure 4.14: Spark Plasma Sintering temperature of the AS composites, observed in
this work, as a function of SiC content.
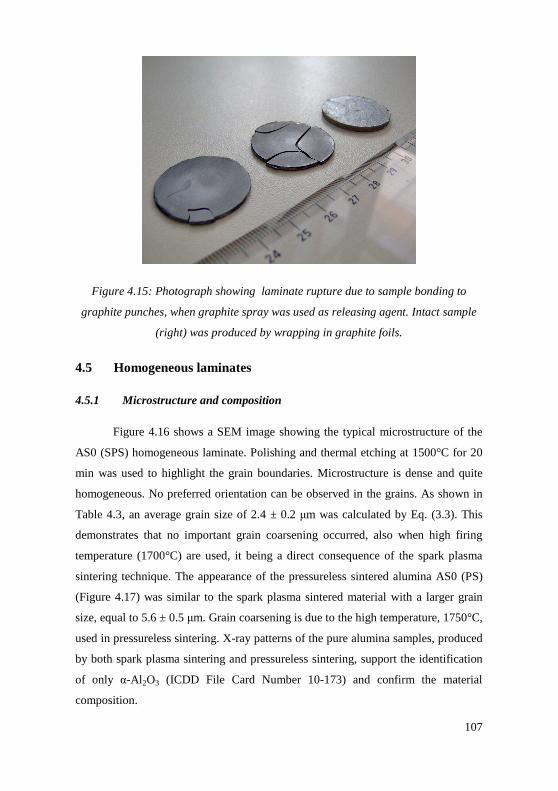
107
Figure 4.15: Photograph showing laminate rupture due to sample bonding to
graphite punches, when graphite spray was used as releasing agent. Intact sample
(right) was produced by wrapping in graphite foils.
4.5 Homogeneous laminates
4.5.1 Microstructure and composition
Figure 4.16 shows a SEM image showing the typical microstructure of the
AS0 (SPS) homogeneous laminate. Polishing and thermal etching at 1500°C for 20
min was used to highlight the grain boundaries. Microstructure is dense and quite
homogeneous. No preferred orientation can be observed in the grains. As shown in
Table 4.3, an average grain size of 2.4 ± 0.2 µm was calculated by Eq. (3.3). This
demonstrates that no important grain coarsening occurred, also when high firing
temperature (1700°C) are used, it being a direct consequence of the spark plasma
sintering technique. The appearance of the pressureless sintered alumina AS0 (PS)
(Figure 4.17) was similar to the spark plasma sintered material with a larger grain
size, equal to 5.6 ± 0.5 µm. Grain coarsening is due to the high temperature, 1750°C,
used in pressureless sintering. X-ray patterns of the pure alumina samples, produced
by both spark plasma sintering and pressureless sintering, support the identification
of only α-Al 2O3 (ICDD File Card Number 10-173) and confirm the material
composition.
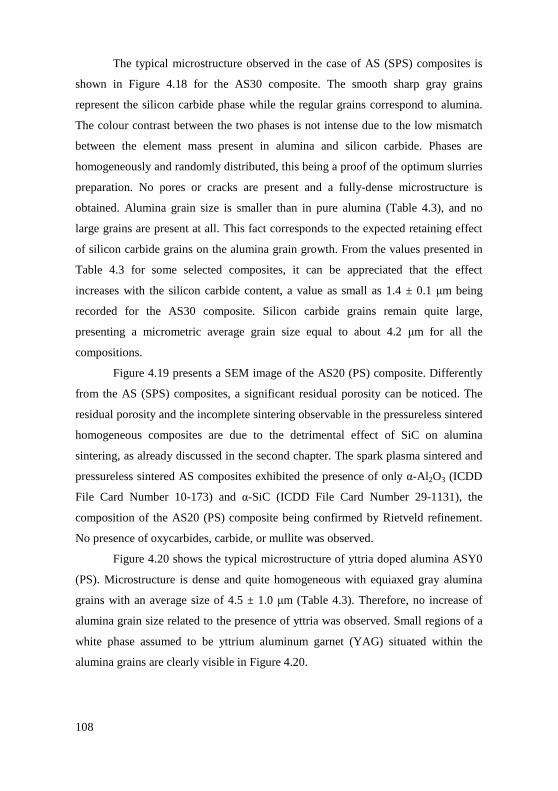
108
The typical microstructure observed in the case of AS (SPS) composites is
shown in Figure 4.18 for the AS30 composite. The smooth sharp gray grains
represent the silicon carbide phase while the regular grains correspond to alumina.
The colour contrast between the two phases is not intense due to the low mismatch
between the element mass present in alumina and silicon carbide. Phases are
homogeneously and randomly distributed, this being a proof of the optimum slurries
preparation. No pores or cracks are present and a fully-dense microstructure is
obtained. Alumina grain size is smaller than in pure alumina (Table 4.3), and no
large grains are present at all. This fact corresponds to the expected retaining effect
of silicon carbide grains on the alumina grain growth. From the values presented in
Table 4.3 for some selected composites, it can be appreciated that the effect
increases with the silicon carbide content, a value as small as 1.4 ± 0.1 µm being
recorded for the AS30 composite. Silicon carbide grains remain quite large,
presenting a micrometric average grain size equal to about 4.2 µm for all the
compositions.
Figure 4.19 presents a SEM image of the AS20 (PS) composite. Differently
from the AS (SPS) composites, a significant residual porosity can be noticed. The
residual porosity and the incomplete sintering observable in the pressureless sintered
homogeneous composites are due to the detrimental effect of SiC on alumina
sintering, as already discussed in the second chapter. The spark plasma sintered and
pressureless sintered AS composites exhibited the presence of only α-Al 2O3 (ICDD
File Card Number 10-173) and α-SiC (ICDD File Card Number 29-1131), the
composition of the AS20 (PS) composite being confirmed by Rietveld refinement.
No presence of oxycarbides, carbide, or mullite was observed.
Figure 4.20 shows the typical microstructure of yttria doped alumina ASY0
(PS). Microstructure is dense and quite homogeneous with equiaxed gray alumina
grains with an average size of 4.5 ± 1.0 µm (Table 4.3). Therefore, no increase of
alumina grain size related to the presence of yttria was observed. Small regions of a
white phase assumed to be yttrium aluminum garnet (YAG) situated within the
alumina grains are clearly visible in Figure 4.20.
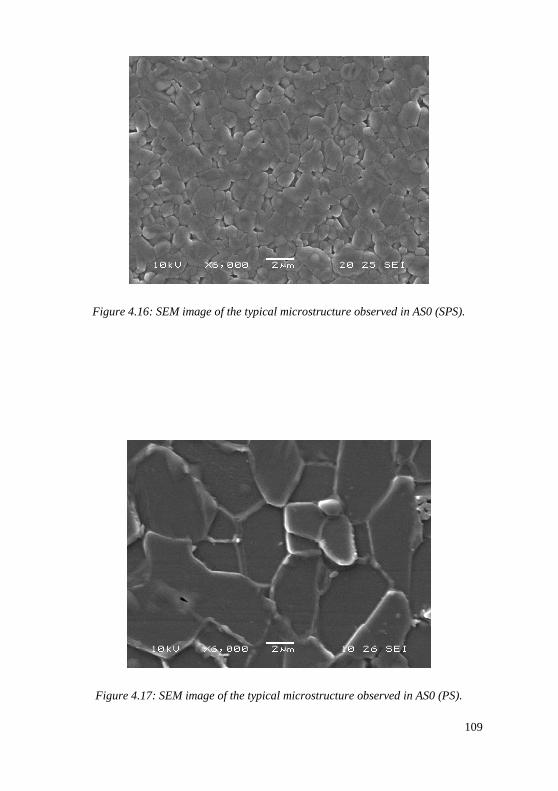
109
Figure 4.16: SEM image of the typical microstructure observed in AS0 (SPS).
Figure 4.17: SEM image of the typical microstructure observed in AS0 (PS).
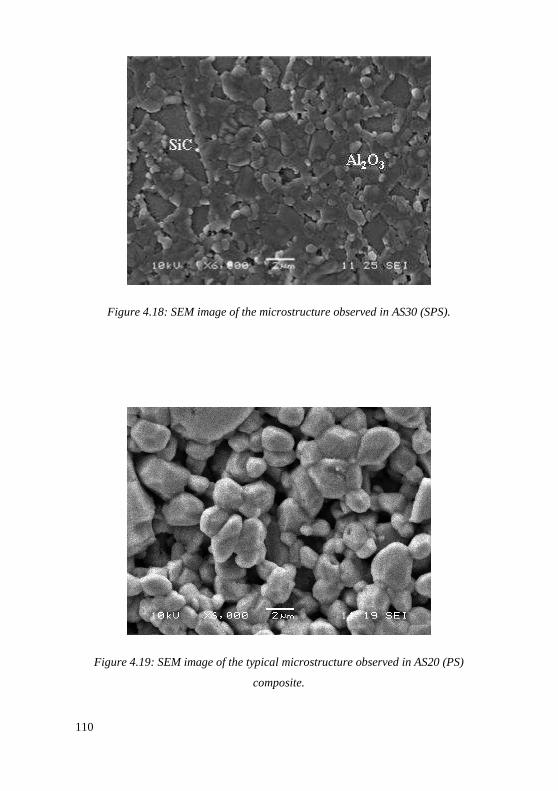
110
Figure 4.18: SEM image of the microstructure observed in AS30 (SPS).
Figure 4.19: SEM image of the typical microstructure observed in AS20 (PS)
composite.
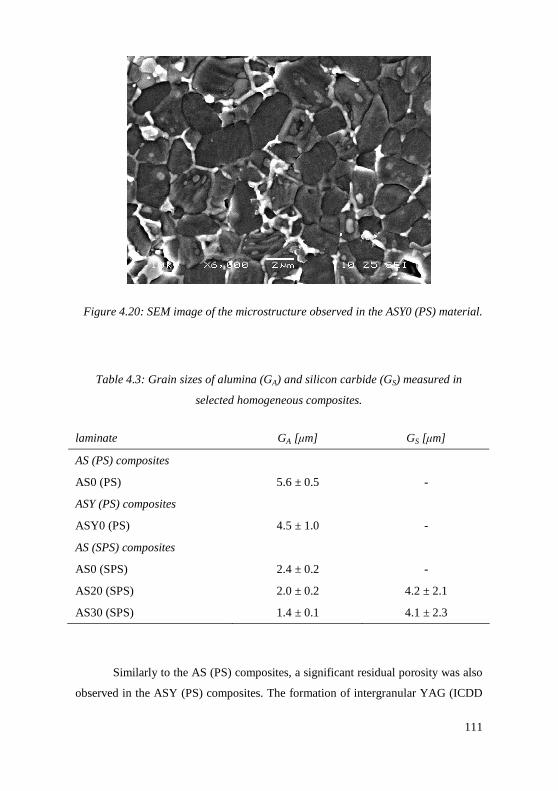
111
Figure 4.20: SEM image of the microstructure observed in the ASY0 (PS) material.
Table 4.3: Grain sizes of alumina (GA) and silicon carbide (GS) measured in
selected homogeneous composites.
laminate GA [µm] GS [µm]
AS (PS) composites
AS0 (PS) 5.6 ± 0.5 -
ASY (PS) composites
ASY0 (PS) 4.5 ± 1.0 -
AS (SPS) composites
AS0 (SPS) 2.4 ± 0.2 -
AS20 (SPS) 2.0 ± 0.2 4.2 ± 2.1
AS30 (SPS) 1.4 ± 0.1 4.1 ± 2.3
Similarly to the AS (PS) composites, a significant residual porosity was also
observed in the ASY (PS) composites. The formation of intergranular YAG (ICDD
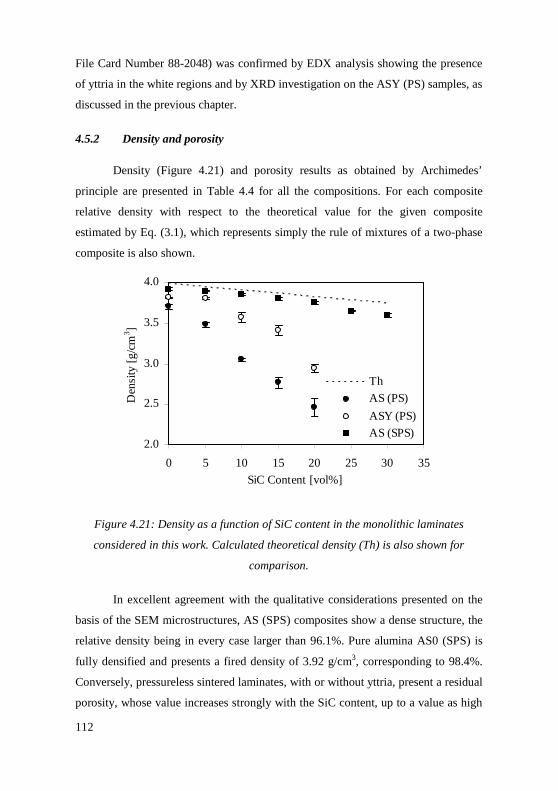
112
File Card Number 88-2048) was confirmed by EDX analysis showing the presence
of yttria in the white regions and by XRD investigation on the ASY (PS) samples, as
discussed in the previous chapter.
4.5.2 Density and porosity
Density (Figure 4.21) and porosity results as obtained by Archimedes’
principle are presented in Table 4.4 for all the compositions. For each composite
relative density with respect to the theoretical value for the given composite
estimated by Eq. (3.1), which represents simply the rule of mixtures of a two-phase
composite is also shown.
2.0
2.5
3.0
3.5
4.0
0 5 10 15 20 25 30 35
SiC Content [vol%]
Den
sity
[g
/cm3 ]
Th
AS (PS)
ASY (PS)
AS (SPS)
Figure 4.21: Density as a function of SiC content in the monolithic laminates
considered in this work. Calculated theoretical density (Th) is also shown for
comparison.
In excellent agreement with the qualitative considerations presented on the
basis of the SEM microstructures, AS (SPS) composites show a dense structure, the
relative density being in every case larger than 96.1%. Pure alumina AS0 (SPS) is
fully densified and presents a fired density of 3.92 g/cm3, corresponding to 98.4%.
Conversely, pressureless sintered laminates, with or without yttria, present a residual
porosity, whose value increases strongly with the SiC content, up to a value as high
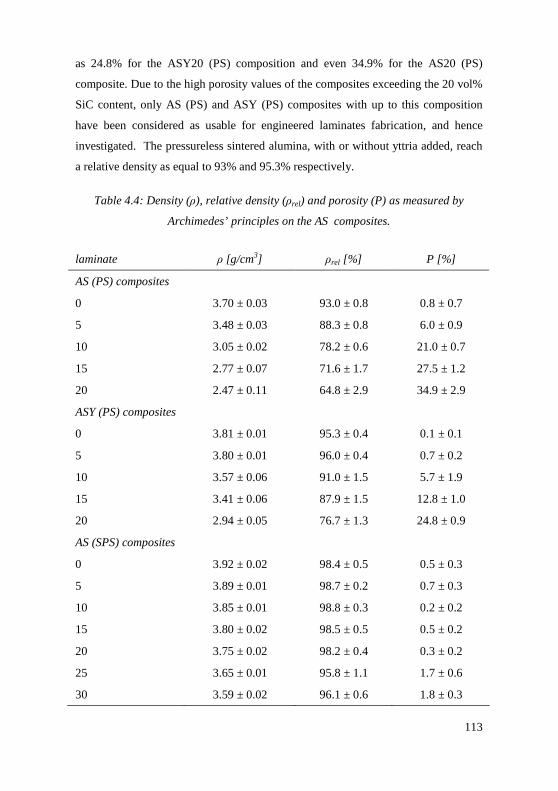
113
as 24.8% for the ASY20 (PS) composition and even 34.9% for the AS20 (PS)
composite. Due to the high porosity values of the composites exceeding the 20 vol%
SiC content, only AS (PS) and ASY (PS) composites with up to this composition
have been considered as usable for engineered laminates fabrication, and hence
investigated. The pressureless sintered alumina, with or without yttria added, reach
a relative density as equal to 93% and 95.3% respectively.
Table 4.4: Density (ρ), relative density (ρrel) and porosity (P) as measured by
Archimedes’ principles on the AS composites.
laminate ρ [g/cm3] ρrel [%] P [%]
AS (PS) composites
0 3.70 ± 0.03 93.0 ± 0.8 0.8 ± 0.7
5 3.48 ± 0.03 88.3 ± 0.8 6.0 ± 0.9
10 3.05 ± 0.02 78.2 ± 0.6 21.0 ± 0.7
15 2.77 ± 0.07 71.6 ± 1.7 27.5 ± 1.2
20 2.47 ± 0.11 64.8 ± 2.9 34.9 ± 2.9
ASY (PS) composites
0 3.81 ± 0.01 95.3 ± 0.4 0.1 ± 0.1
5 3.80 ± 0.01 96.0 ± 0.4 0.7 ± 0.2
10 3.57 ± 0.06 91.0 ± 1.5 5.7 ± 1.9
15 3.41 ± 0.06 87.9 ± 1.5 12.8 ± 1.0
20 2.94 ± 0.05 76.7 ± 1.3 24.8 ± 0.9
AS (SPS) composites
0 3.92 ± 0.02 98.4 ± 0.5 0.5 ± 0.3
5 3.89 ± 0.01 98.7 ± 0.2 0.7 ± 0.3
10 3.85 ± 0.01 98.8 ± 0.3 0.2 ± 0.2
15 3.80 ± 0.02 98.5 ± 0.5 0.5 ± 0.2
20 3.75 ± 0.02 98.2 ± 0.4 0.3 ± 0.2
25 3.65 ± 0.01 95.8 ± 1.1 1.7 ± 0.6
30 3.59 ± 0.02 96.1 ± 0.6 1.8 ± 0.3
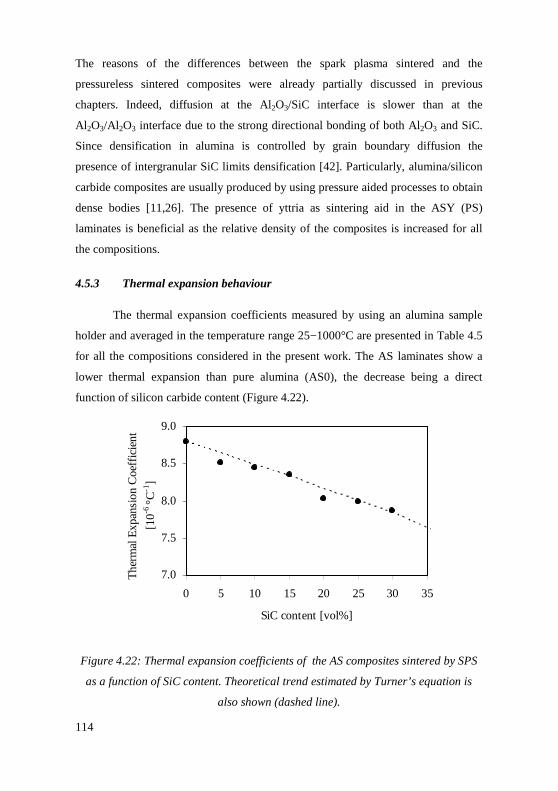
114
The reasons of the differences between the spark plasma sintered and the
pressureless sintered composites were already partially discussed in previous
chapters. Indeed, diffusion at the Al2O3/SiC interface is slower than at the
Al 2O3/Al 2O3 interface due to the strong directional bonding of both Al2O3 and SiC.
Since densification in alumina is controlled by grain boundary diffusion the
presence of intergranular SiC limits densification [42]. Particularly, alumina/silicon
carbide composites are usually produced by using pressure aided processes to obtain
dense bodies [11,26]. The presence of yttria as sintering aid in the ASY (PS)
laminates is beneficial as the relative density of the composites is increased for all
the compositions.
4.5.3 Thermal expansion behaviour
The thermal expansion coefficients measured by using an alumina sample
holder and averaged in the temperature range 25−1000°C are presented in Table 4.5
for all the compositions considered in the present work. The AS laminates show a
lower thermal expansion than pure alumina (AS0), the decrease being a direct
function of silicon carbide content (Figure 4.22).
7.0
7.5
8.0
8.5
9.0
0 5 10 15 20 25 30 35
SiC content [vol%]
Th
erm
al E
xpan
sio
n C
oeffi
cien
t
[10-6
°C-1
]
Figure 4.22: Thermal expansion coefficients of the AS composites sintered by SPS
as a function of SiC content. Theoretical trend estimated by Turner’s equation is
also shown (dashed line).
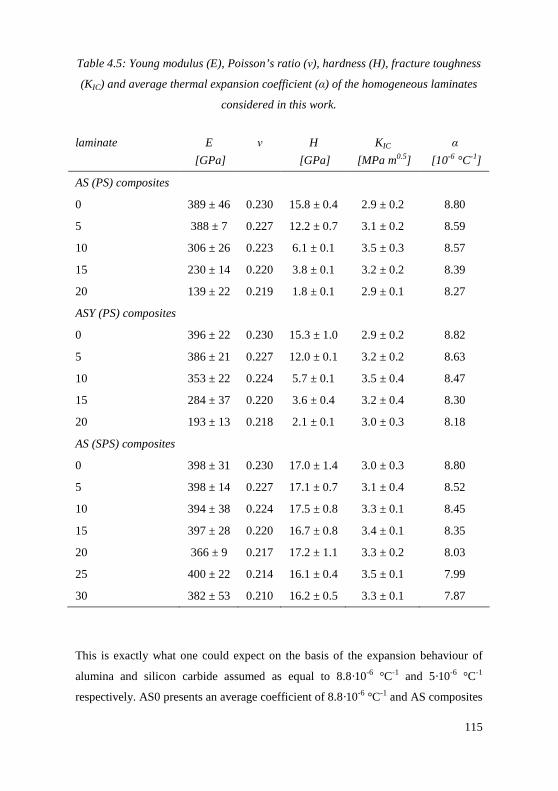
115
Table 4.5: Young modulus (E), Poisson’s ratio (ν), hardness (H), fracture toughness
(KIC) and average thermal expansion coefficient (α) of the homogeneous laminates
considered in this work.
laminate E
[GPa]
ν H
[GPa]
KIC
[MPa m0.5]
α
[10-6 °C-1]
AS (PS) composites
0 389 ± 46 0.230 15.8 ± 0.4 2.9 ± 0.2 8.80
5 388 ± 7 0.227 12.2 ± 0.7 3.1 ± 0.2 8.59
10 306 ± 26 0.223 6.1 ± 0.1 3.5 ± 0.3 8.57
15 230 ± 14 0.220 3.8 ± 0.1 3.2 ± 0.2 8.39
20 139 ± 22 0.219 1.8 ± 0.1 2.9 ± 0.1 8.27
ASY (PS) composites
0 396 ± 22 0.230 15.3 ± 1.0 2.9 ± 0.2 8.82
5 386 ± 21 0.227 12.0 ± 0.1 3.2 ± 0.2 8.63
10 353 ± 22 0.224 5.7 ± 0.1 3.5 ± 0.4 8.47
15 284 ± 37 0.220 3.6 ± 0.4 3.2 ± 0.4 8.30
20 193 ± 13 0.218 2.1 ± 0.1 3.0 ± 0.3 8.18
AS (SPS) composites
0 398 ± 31 0.230 17.0 ± 1.4 3.0 ± 0.3 8.80
5 398 ± 14 0.227 17.1 ± 0.7 3.1 ± 0.4 8.52
10 394 ± 38 0.224 17.5 ± 0.8 3.3 ± 0.1 8.45
15 397 ± 28 0.220 16.7 ± 0.8 3.4 ± 0.1 8.35
20 366 ± 9 0.217 17.2 ± 1.1 3.3 ± 0.2 8.03
25 400 ± 22 0.214 16.1 ± 0.4 3.5 ± 0.1 7.99
30 382 ± 53 0.210 16.2 ± 0.5 3.3 ± 0.1 7.87
This is exactly what one could expect on the basis of the expansion behaviour of
alumina and silicon carbide assumed as equal to 8.8·10-6 °C-1 and 5·10-6 °C-1
respectively. AS0 presents an average coefficient of 8.8·10-6 °C-1 and AS composites
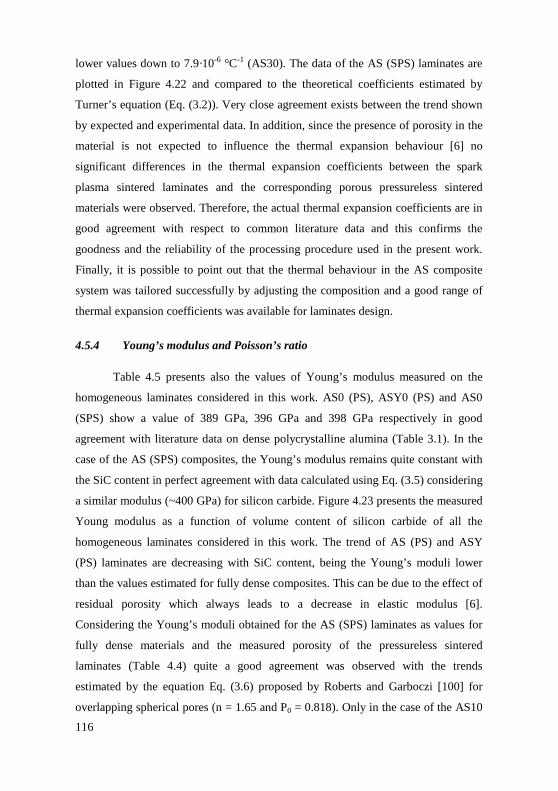
116
lower values down to 7.9·10-6 °C-1 (AS30). The data of the AS (SPS) laminates are
plotted in Figure 4.22 and compared to the theoretical coefficients estimated by
Turner’s equation (Eq. (3.2)). Very close agreement exists between the trend shown
by expected and experimental data. In addition, since the presence of porosity in the
material is not expected to influence the thermal expansion behaviour [6] no
significant differences in the thermal expansion coefficients between the spark
plasma sintered laminates and the corresponding porous pressureless sintered
materials were observed. Therefore, the actual thermal expansion coefficients are in
good agreement with respect to common literature data and this confirms the
goodness and the reliability of the processing procedure used in the present work.
Finally, it is possible to point out that the thermal behaviour in the AS composite
system was tailored successfully by adjusting the composition and a good range of
thermal expansion coefficients was available for laminates design.
4.5.4 Young’s modulus and Poisson’s ratio
Table 4.5 presents also the values of Young’s modulus measured on the
homogeneous laminates considered in this work. AS0 (PS), ASY0 (PS) and AS0
(SPS) show a value of 389 GPa, 396 GPa and 398 GPa respectively in good
agreement with literature data on dense polycrystalline alumina (Table 3.1). In the
case of the AS (SPS) composites, the Young’s modulus remains quite constant with
the SiC content in perfect agreement with data calculated using Eq. (3.5) considering
a similar modulus (~400 GPa) for silicon carbide. Figure 4.23 presents the measured
Young modulus as a function of volume content of silicon carbide of all the
homogeneous laminates considered in this work. The trend of AS (PS) and ASY
(PS) laminates are decreasing with SiC content, being the Young’s moduli lower
than the values estimated for fully dense composites. This can be due to the effect of
residual porosity which always leads to a decrease in elastic modulus [6].
Considering the Young’s moduli obtained for the AS (SPS) laminates as values for
fully dense materials and the measured porosity of the pressureless sintered
laminates (Table 4.4) quite a good agreement was observed with the trends
estimated by the equation Eq. (3.6) proposed by Roberts and Garboczi [100] for
overlapping spherical pores (n = 1.65 and P0 = 0.818). Only in the case of the AS10
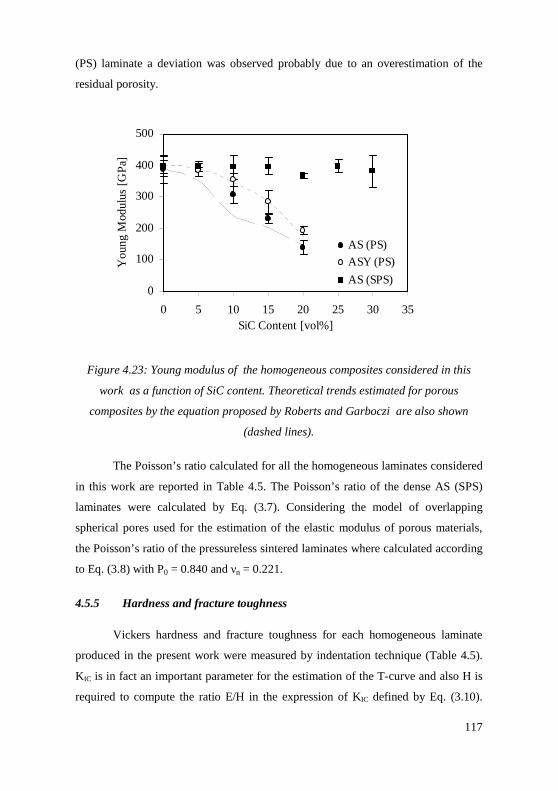
117
(PS) laminate a deviation was observed probably due to an overestimation of the
residual porosity.
0
100
200
300
400
500
0 5 10 15 20 25 30 35SiC Content [vol%]
Yo
ung
Mod
ulus
[GP
a]
AS (PS)
ASY (PS)
AS (SPS)
Figure 4.23: Young modulus of the homogeneous composites considered in this
work as a function of SiC content. Theoretical trends estimated for porous
composites by the equation proposed by Roberts and Garboczi are also shown
(dashed lines).
The Poisson’s ratio calculated for all the homogeneous laminates considered
in this work are reported in Table 4.5. The Poisson’s ratio of the dense AS (SPS)
laminates were calculated by Eq. (3.7). Considering the model of overlapping
spherical pores used for the estimation of the elastic modulus of porous materials,
the Poisson’s ratio of the pressureless sintered laminates where calculated according
to Eq. (3.8) with P0 = 0.840 and νn = 0.221.
4.5.5 Hardness and fracture toughness
Vickers hardness and fracture toughness for each homogeneous laminate
produced in the present work were measured by indentation technique (Table 4.5).
K IC is in fact an important parameter for the estimation of the T-curve and also H is
required to compute the ratio E/H in the expression of KIC defined by Eq. (3.10).
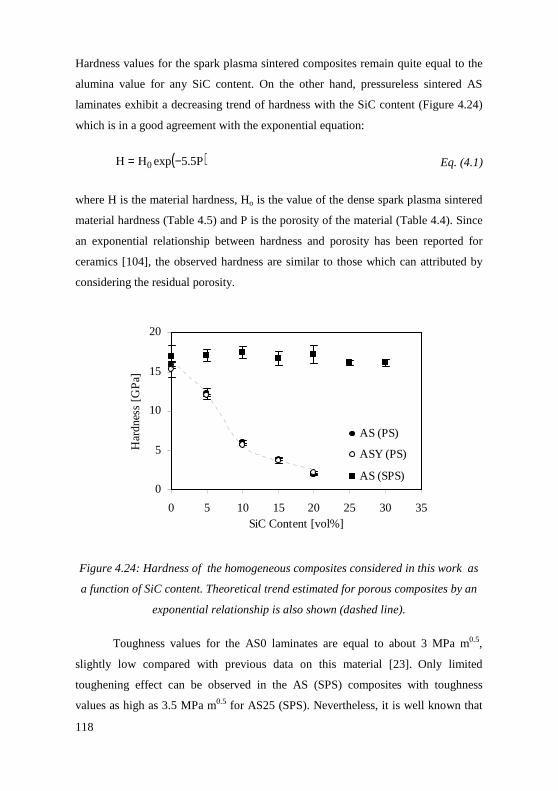
118
Hardness values for the spark plasma sintered composites remain quite equal to the
alumina value for any SiC content. On the other hand, pressureless sintered AS
laminates exhibit a decreasing trend of hardness with the SiC content (Figure 4.24)
which is in a good agreement with the exponential equation:
( )P5.5expHH 0 −= Eq. (4.1)
where H is the material hardness, Ho is the value of the dense spark plasma sintered
material hardness (Table 4.5) and P is the porosity of the material (Table 4.4). Since
an exponential relationship between hardness and porosity has been reported for
ceramics [104], the observed hardness are similar to those which can attributed by
considering the residual porosity.
0
5
10
15
20
0 5 10 15 20 25 30 35SiC Content [vol%]
Har
dnes
s [G
Pa]
AS (PS)
ASY (PS)
AS (SPS)
Figure 4.24: Hardness of the homogeneous composites considered in this work as
a function of SiC content. Theoretical trend estimated for porous composites by an
exponential relationship is also shown (dashed line).
Toughness values for the AS0 laminates are equal to about 3 MPa m0.5,
slightly low compared with previous data on this material [23]. Only limited
toughening effect can be observed in the AS (SPS) composites with toughness
values as high as 3.5 MPa m0.5 for AS25 (SPS). Nevertheless, it is well known that
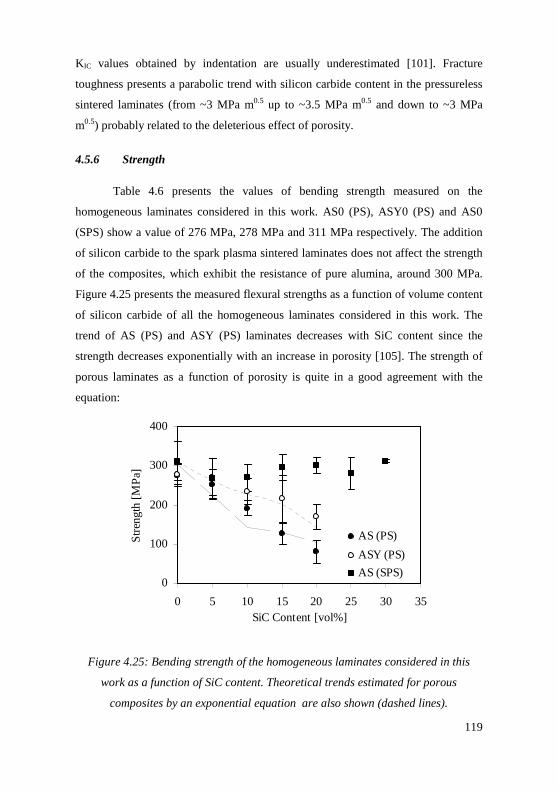
119
K IC values obtained by indentation are usually underestimated [101]. Fracture
toughness presents a parabolic trend with silicon carbide content in the pressureless
sintered laminates (from ~3 MPa m0.5 up to ~3.5 MPa m0.5 and down to ~3 MPa
m0.5) probably related to the deleterious effect of porosity.
4.5.6 Strength
Table 4.6 presents the values of bending strength measured on the
homogeneous laminates considered in this work. AS0 (PS), ASY0 (PS) and AS0
(SPS) show a value of 276 MPa, 278 MPa and 311 MPa respectively. The addition
of silicon carbide to the spark plasma sintered laminates does not affect the strength
of the composites, which exhibit the resistance of pure alumina, around 300 MPa.
Figure 4.25 presents the measured flexural strengths as a function of volume content
of silicon carbide of all the homogeneous laminates considered in this work. The
trend of AS (PS) and ASY (PS) laminates decreases with SiC content since the
strength decreases exponentially with an increase in porosity [105]. The strength of
porous laminates as a function of porosity is quite in a good agreement with the
equation:
0
100
200
300
400
0 5 10 15 20 25 30 35SiC Content [vol%]
Str
engt
h [M
Pa]
AS (PS)
ASY (PS)
AS (SPS)
Figure 4.25: Bending strength of the homogeneous laminates considered in this
work as a function of SiC content. Theoretical trends estimated for porous
composites by an exponential equation are also shown (dashed lines).
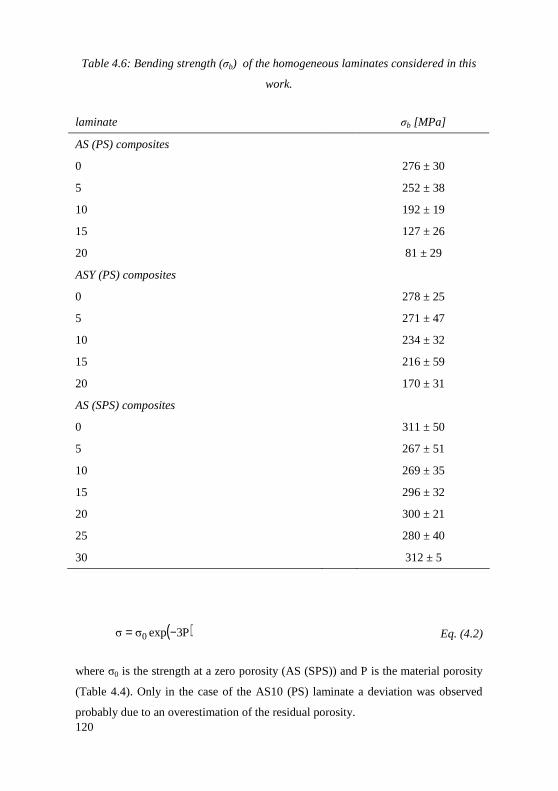
120
Table 4.6: Bending strength (σb) of the homogeneous laminates considered in this
work.
laminate σb [MPa]
AS (PS) composites
0 276 ± 30
5 252 ± 38
10 192 ± 19
15 127 ± 26
20 81 ± 29
ASY (PS) composites
0 278 ± 25
5 271 ± 47
10 234 ± 32
15 216 ± 59
20 170 ± 31
AS (SPS) composites
0 311 ± 50
5 267 ± 51
10 269 ± 35
15 296 ± 32
20 300 ± 21
25 280 ± 40
30 312 ± 5
( )P3expσσ 0 −= Eq. (4.2)
where σ0 is the strength at a zero porosity (AS (SPS)) and P is the material porosity
(Table 4.4). Only in the case of the AS10 (PS) laminate a deviation was observed
probably due to an overestimation of the residual porosity.
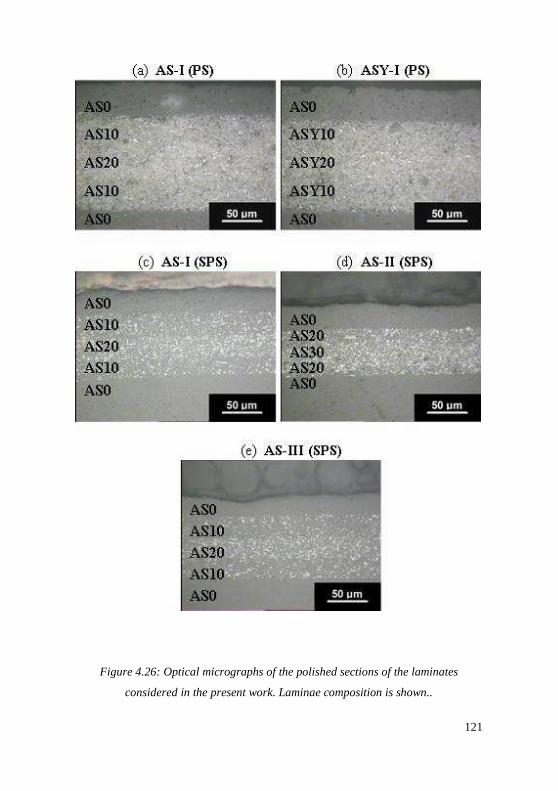
121
Figure 4.26: Optical micrographs of the polished sections of the laminates
considered in the present work. Laminae composition is shown..
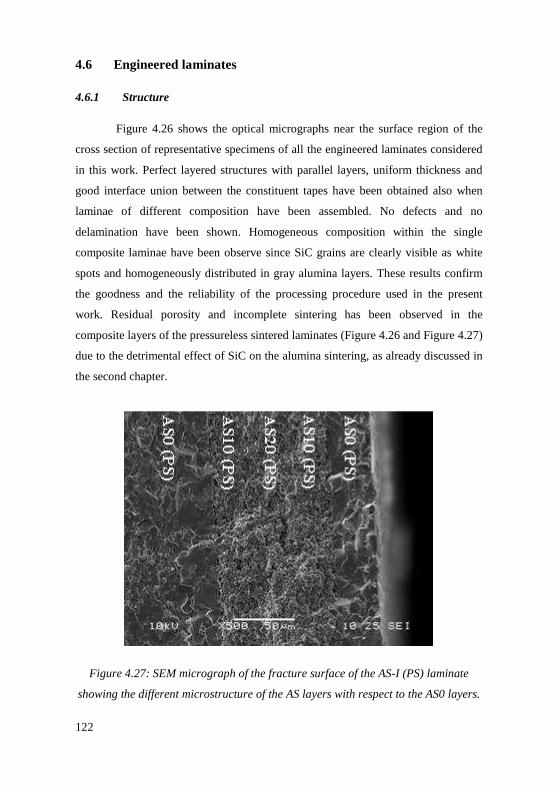
122
4.6 Engineered laminates
4.6.1 Structure
Figure 4.26 shows the optical micrographs near the surface region of the
cross section of representative specimens of all the engineered laminates considered
in this work. Perfect layered structures with parallel layers, uniform thickness and
good interface union between the constituent tapes have been obtained also when
laminae of different composition have been assembled. No defects and no
delamination have been shown. Homogeneous composition within the single
composite laminae have been observe since SiC grains are clearly visible as white
spots and homogeneously distributed in gray alumina layers. These results confirm
the goodness and the reliability of the processing procedure used in the present
work. Residual porosity and incomplete sintering has been observed in the
composite layers of the pressureless sintered laminates (Figure 4.26 and Figure 4.27)
due to the detrimental effect of SiC on the alumina sintering, as already discussed in
the second chapter.
Figure 4.27: SEM micrograph of the fracture surface of the AS-I (PS) laminate
showing the different microstructure of the AS layers with respect to the AS0 layers.
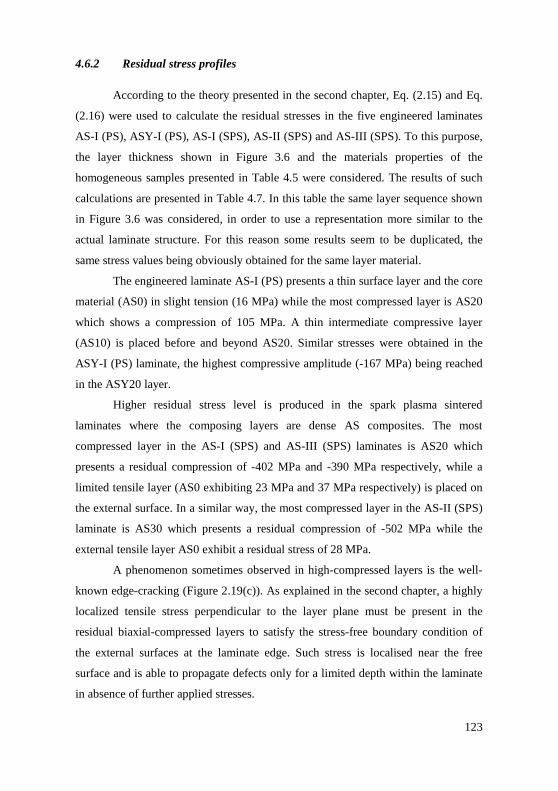
123
4.6.2 Residual stress profiles
According to the theory presented in the second chapter, Eq. (2.15) and Eq.
(2.16) were used to calculate the residual stresses in the five engineered laminates
AS-I (PS), ASY-I (PS), AS-I (SPS), AS-II (SPS) and AS-III (SPS). To this purpose,
the layer thickness shown in Figure 3.6 and the materials properties of the
homogeneous samples presented in Table 4.5 were considered. The results of such
calculations are presented in Table 4.7. In this table the same layer sequence shown
in Figure 3.6 was considered, in order to use a representation more similar to the
actual laminate structure. For this reason some results seem to be duplicated, the
same stress values being obviously obtained for the same layer material.
The engineered laminate AS-I (PS) presents a thin surface layer and the core
material (AS0) in slight tension (16 MPa) while the most compressed layer is AS20
which shows a compression of 105 MPa. A thin intermediate compressive layer
(AS10) is placed before and beyond AS20. Similar stresses were obtained in the
ASY-I (PS) laminate, the highest compressive amplitude (-167 MPa) being reached
in the ASY20 layer.
Higher residual stress level is produced in the spark plasma sintered
laminates where the composing layers are dense AS composites. The most
compressed layer in the AS-I (SPS) and AS-III (SPS) laminates is AS20 which
presents a residual compression of -402 MPa and -390 MPa respectively, while a
limited tensile layer (AS0 exhibiting 23 MPa and 37 MPa respectively) is placed on
the external surface. In a similar way, the most compressed layer in the AS-II (SPS)
laminate is AS30 which presents a residual compression of -502 MPa while the
external tensile layer AS0 exhibit a residual stress of 28 MPa.
A phenomenon sometimes observed in high-compressed layers is the well-
known edge-cracking (Figure 2.19(c)). As explained in the second chapter, a highly
localized tensile stress perpendicular to the layer plane must be present in the
residual biaxial-compressed layers to satisfy the stress-free boundary condition of
the external surfaces at the laminate edge. Such stress is localised near the free
surface and is able to propagate defects only for a limited depth within the laminate
in absence of further applied stresses.
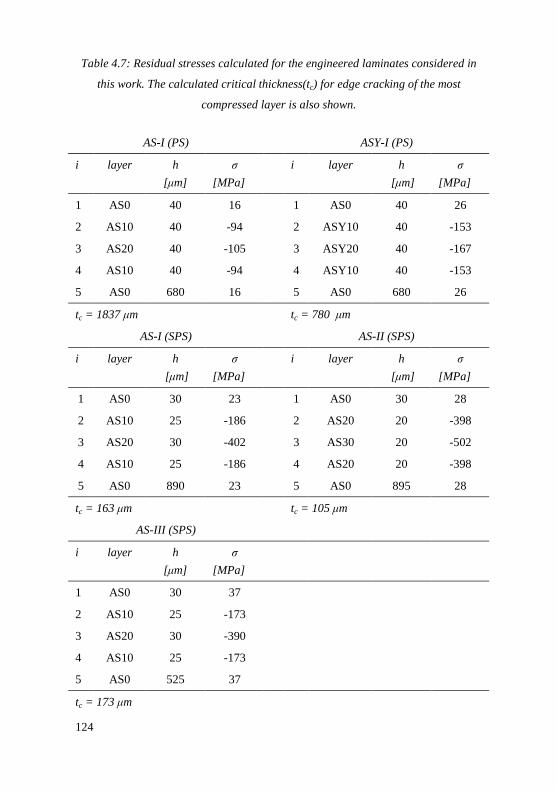
124
Table 4.7: Residual stresses calculated for the engineered laminates considered in
this work. The calculated critical thickness(tc) for edge cracking of the most
compressed layer is also shown.
AS-I (PS) ASY-I (PS)
i layer h
[µm]
σ
[MPa]
i layer h
[µm]
σ
[MPa]
1 AS0 40 16 1 AS0 40 26
2 AS10 40 -94 2 ASY10 40 -153
3 AS20 40 -105 3 ASY20 40 -167
4 AS10 40 -94 4 ASY10 40 -153
5 AS0 680 16 5 AS0 680 26
tc = 1837 µm tc = 780 µm
AS-I (SPS) AS-II (SPS)
i layer h
[µm]
σ
[MPa]
i layer h
[µm]
σ
[MPa]
1 AS0 30 23 1 AS0 30 28
2 AS10 25 -186 2 AS20 20 -398
3 AS20 30 -402 3 AS30 20 -502
4 AS10 25 -186 4 AS20 20 -398
5 AS0 890 23 5 AS0 895 28
tc = 163 µm tc = 105 µm
AS-III (SPS)
i layer h
[µm]
σ
[MPa]
1 AS0 30 37
2 AS10 25 -173
3 AS20 30 -390
4 AS10 25 -173
5 AS0 525 37
tc = 173 µm
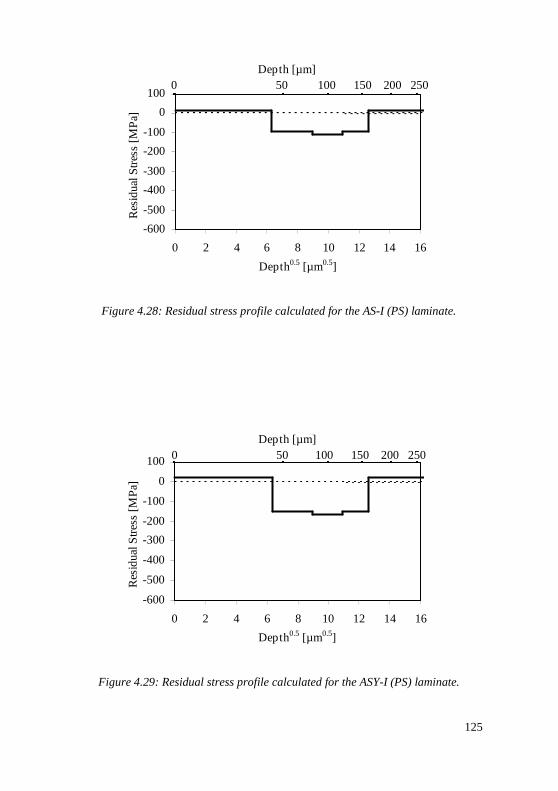
125
-600
-500
-400
-300
-200
-100
0
100
0 2 4 6 8 10 12 14 16
Depth0.5 [µm0.5]
Res
idua
l Str
ess
[MP
a]
Depth [µm] 0 50 100 150 200 250
Figure 4.28: Residual stress profile calculated for the AS-I (PS) laminate.
-600
-500
-400
-300
-200
-100
0
100
0 2 4 6 8 10 12 14 16
Depth0.5 [µm0.5]
Res
idua
l Str
ess
[MP
a]
Depth [µm] 0 50 100 150 200 250
Figure 4.29: Residual stress profile calculated for the ASY-I (PS) laminate.
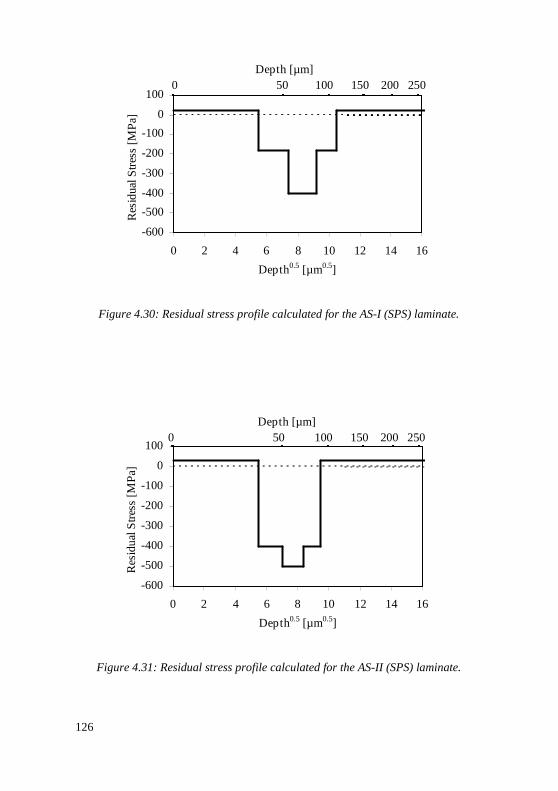
126
-600
-500
-400
-300
-200
-100
0
100
0 2 4 6 8 10 12 14 16
Depth0.5 [µm0.5]
Res
idua
l Str
ess
[MP
a]
Depth [µm]0 50 100 150 200 250
Figure 4.30: Residual stress profile calculated for the AS-I (SPS) laminate.
-600
-500
-400
-300
-200
-100
0
100
0 2 4 6 8 10 12 14 16
Depth0.5 [µm0.5]
Res
idu
al S
tres
s [M
Pa]
Depth [µm]0 50 100 150 200 250
Figure 4.31: Residual stress profile calculated for the AS-II (SPS) laminate.
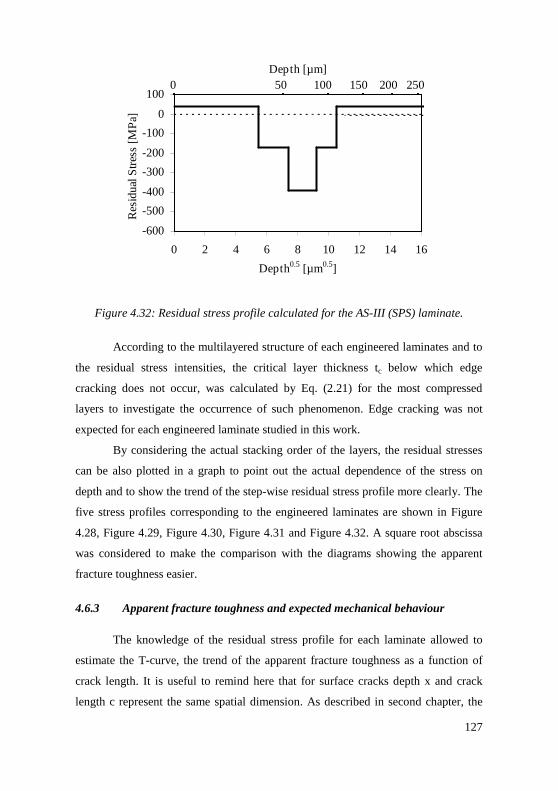
127
-600
-500
-400
-300
-200
-100
0
100
0 2 4 6 8 10 12 14 16
Depth0.5 [µm0.5]
Res
idu
al S
tres
s [M
Pa]
Depth [µm]0 50 100 150 200 250
Figure 4.32: Residual stress profile calculated for the AS-III (SPS) laminate.
According to the multilayered structure of each engineered laminates and to
the residual stress intensities, the critical layer thickness tc below which edge
cracking does not occur, was calculated by Eq. (2.21) for the most compressed
layers to investigate the occurrence of such phenomenon. Edge cracking was not
expected for each engineered laminate studied in this work.
By considering the actual stacking order of the layers, the residual stresses
can be also plotted in a graph to point out the actual dependence of the stress on
depth and to show the trend of the step-wise residual stress profile more clearly. The
five stress profiles corresponding to the engineered laminates are shown in Figure
4.28, Figure 4.29, Figure 4.30, Figure 4.31 and Figure 4.32. A square root abscissa
was considered to make the comparison with the diagrams showing the apparent
fracture toughness easier.
4.6.3 Apparent fracture toughness and expected mechanical behaviour
The knowledge of the residual stress profile for each laminate allowed to
estimate the T-curve, the trend of the apparent fracture toughness as a function of
crack length. It is useful to remind here that for surface cracks depth x and crack
length c represent the same spatial dimension. As described in second chapter, the
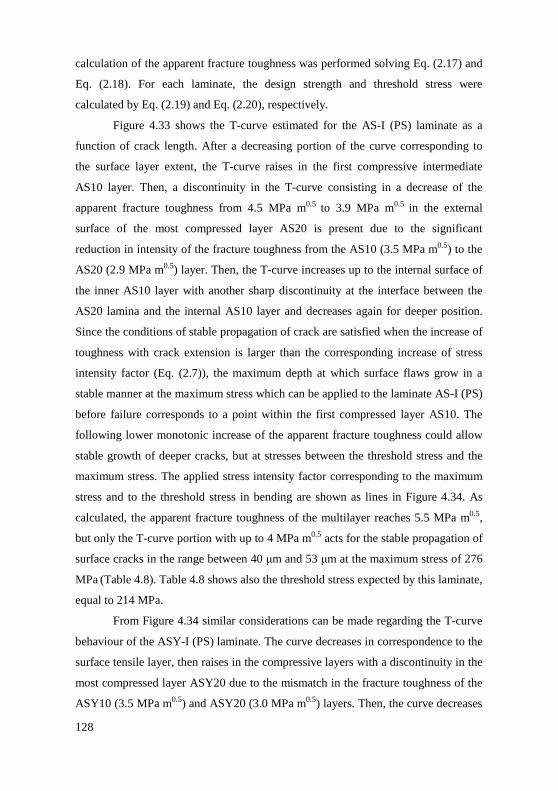
128
calculation of the apparent fracture toughness was performed solving Eq. (2.17) and
Eq. (2.18). For each laminate, the design strength and threshold stress were
calculated by Eq. (2.19) and Eq. (2.20), respectively.
Figure 4.33 shows the T-curve estimated for the AS-I (PS) laminate as a
function of crack length. After a decreasing portion of the curve corresponding to
the surface layer extent, the T-curve raises in the first compressive intermediate
AS10 layer. Then, a discontinuity in the T-curve consisting in a decrease of the
apparent fracture toughness from 4.5 MPa m0.5 to 3.9 MPa m0.5 in the external
surface of the most compressed layer AS20 is present due to the significant
reduction in intensity of the fracture toughness from the AS10 (3.5 MPa m0.5) to the
AS20 (2.9 MPa m0.5) layer. Then, the T-curve increases up to the internal surface of
the inner AS10 layer with another sharp discontinuity at the interface between the
AS20 lamina and the internal AS10 layer and decreases again for deeper position.
Since the conditions of stable propagation of crack are satisfied when the increase of
toughness with crack extension is larger than the corresponding increase of stress
intensity factor (Eq. (2.7)), the maximum depth at which surface flaws grow in a
stable manner at the maximum stress which can be applied to the laminate AS-I (PS)
before failure corresponds to a point within the first compressed layer AS10. The
following lower monotonic increase of the apparent fracture toughness could allow
stable growth of deeper cracks, but at stresses between the threshold stress and the
maximum stress. The applied stress intensity factor corresponding to the maximum
stress and to the threshold stress in bending are shown as lines in Figure 4.34. As
calculated, the apparent fracture toughness of the multilayer reaches 5.5 MPa m0.5,
but only the T-curve portion with up to 4 MPa m0.5 acts for the stable propagation of
surface cracks in the range between 40 µm and 53 µm at the maximum stress of 276
MPa (Table 4.8). Table 4.8 shows also the threshold stress expected by this laminate,
equal to 214 MPa.
From Figure 4.34 similar considerations can be made regarding the T-curve
behaviour of the ASY-I (PS) laminate. The curve decreases in correspondence to the
surface tensile layer, then raises in the compressive layers with a discontinuity in the
most compressed layer ASY20 due to the mismatch in the fracture toughness of the
ASY10 (3.5 MPa m0.5) and ASY20 (3.0 MPa m0.5) layers. Then, the curve decreases
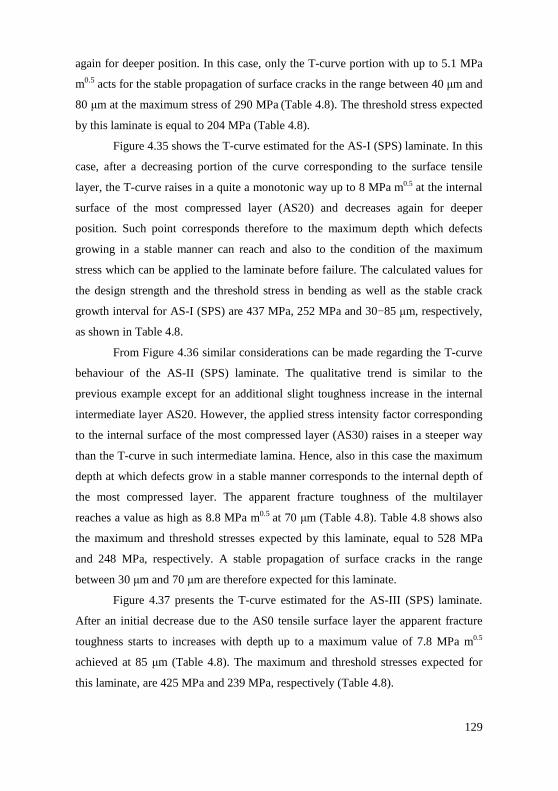
129
again for deeper position. In this case, only the T-curve portion with up to 5.1 MPa
m0.5 acts for the stable propagation of surface cracks in the range between 40 µm and
80 µm at the maximum stress of 290 MPa (Table 4.8). The threshold stress expected
by this laminate is equal to 204 MPa (Table 4.8).
Figure 4.35 shows the T-curve estimated for the AS-I (SPS) laminate. In this
case, after a decreasing portion of the curve corresponding to the surface tensile
layer, the T-curve raises in a quite a monotonic way up to 8 MPa m0.5 at the internal
surface of the most compressed layer (AS20) and decreases again for deeper
position. Such point corresponds therefore to the maximum depth which defects
growing in a stable manner can reach and also to the condition of the maximum
stress which can be applied to the laminate before failure. The calculated values for
the design strength and the threshold stress in bending as well as the stable crack
growth interval for AS-I (SPS) are 437 MPa, 252 MPa and 30−85 µm, respectively,
as shown in Table 4.8.
From Figure 4.36 similar considerations can be made regarding the T-curve
behaviour of the AS-II (SPS) laminate. The qualitative trend is similar to the
previous example except for an additional slight toughness increase in the internal
intermediate layer AS20. However, the applied stress intensity factor corresponding
to the internal surface of the most compressed layer (AS30) raises in a steeper way
than the T-curve in such intermediate lamina. Hence, also in this case the maximum
depth at which defects grow in a stable manner corresponds to the internal depth of
the most compressed layer. The apparent fracture toughness of the multilayer
reaches a value as high as 8.8 MPa m0.5 at 70 µm (Table 4.8). Table 4.8 shows also
the maximum and threshold stresses expected by this laminate, equal to 528 MPa
and 248 MPa, respectively. A stable propagation of surface cracks in the range
between 30 µm and 70 µm are therefore expected for this laminate.
Figure 4.37 presents the T-curve estimated for the AS-III (SPS) laminate.
After an initial decrease due to the AS0 tensile surface layer the apparent fracture
toughness starts to increases with depth up to a maximum value of 7.8 MPa m0.5
achieved at 85 µm (Table 4.8). The maximum and threshold stresses expected for
this laminate, are 425 MPa and 239 MPa, respectively (Table 4.8).
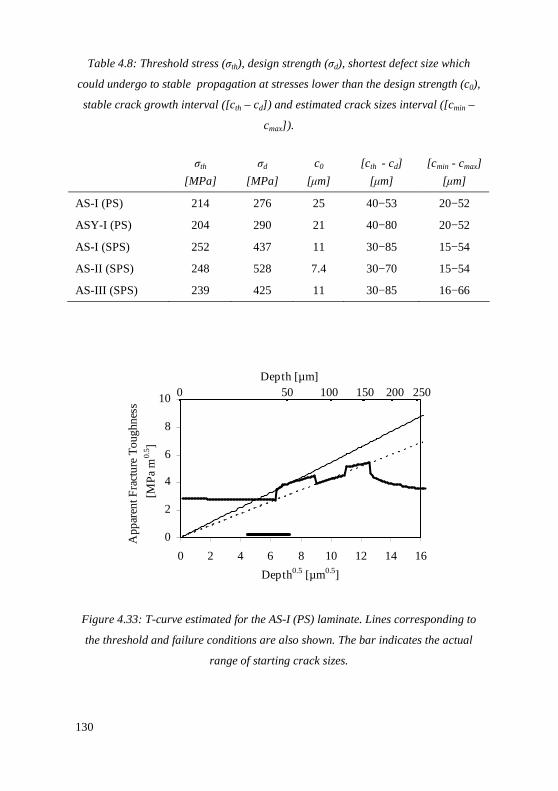
130
Table 4.8: Threshold stress (σth), design strength (σd), shortest defect size which
could undergo to stable propagation at stresses lower than the design strength (c0),
stable crack growth interval ([cth – cd]) and estimated crack sizes interval ([cmin –
cmax]).
σth
[MPa]
σd
[MPa]
c0
[µm]
[cth - cd]
[µm]
[cmin - cmax]
[µm]
AS-I (PS) 214 276 25 40−53 20−52
ASY-I (PS) 204 290 21 40−80 20−52
AS-I (SPS) 252 437 11 30−85 15−54
AS-II (SPS) 248 528 7.4 30−70 15−54
AS-III (SPS) 239 425 11 30−85 16−66
0
2
4
6
8
10
0 2 4 6 8 10 12 14 16
Depth0.5 [µm0.5]
App
aren
t Fra
ctu
re T
oug
hnes
s
[MP
a m
0.5 ]
Depth [µm]0 50 100 150 200 250
Figure 4.33: T-curve estimated for the AS-I (PS) laminate. Lines corresponding to
the threshold and failure conditions are also shown. The bar indicates the actual
range of starting crack sizes.
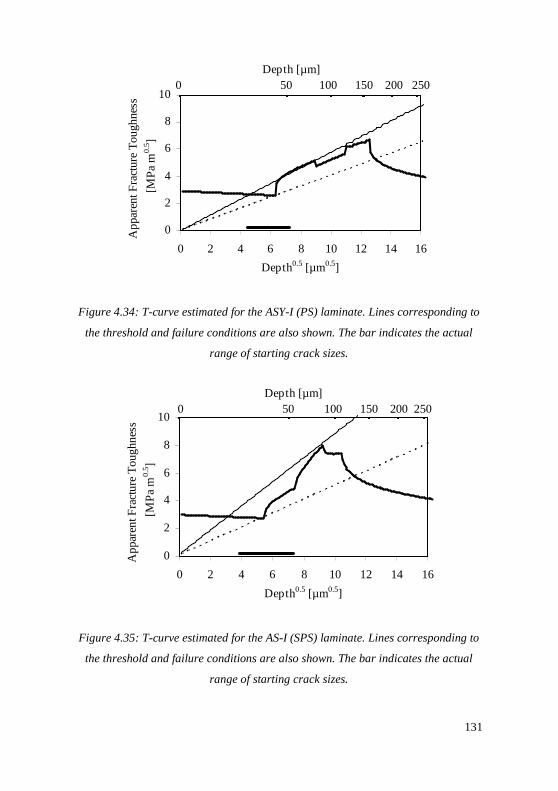
131
0
2
4
6
8
10
0 2 4 6 8 10 12 14 16
Depth0.5 [µm0.5]
Ap
pare
nt F
ract
ure
Tou
ghne
ss
[MP
a m
0.5 ]
Depth [µm]0 50 100 150 200 250
Figure 4.34: T-curve estimated for the ASY-I (PS) laminate. Lines corresponding to
the threshold and failure conditions are also shown. The bar indicates the actual
range of starting crack sizes.
0
2
4
6
8
10
0 2 4 6 8 10 12 14 16
Depth0.5 [µm0.5]
Ap
pare
nt F
ract
ure
Tou
ghn
ess
[MP
a m
0.5 ]
Depth [µm] 0 50 100 150 200 250
Figure 4.35: T-curve estimated for the AS-I (SPS) laminate. Lines corresponding to
the threshold and failure conditions are also shown. The bar indicates the actual
range of starting crack sizes.
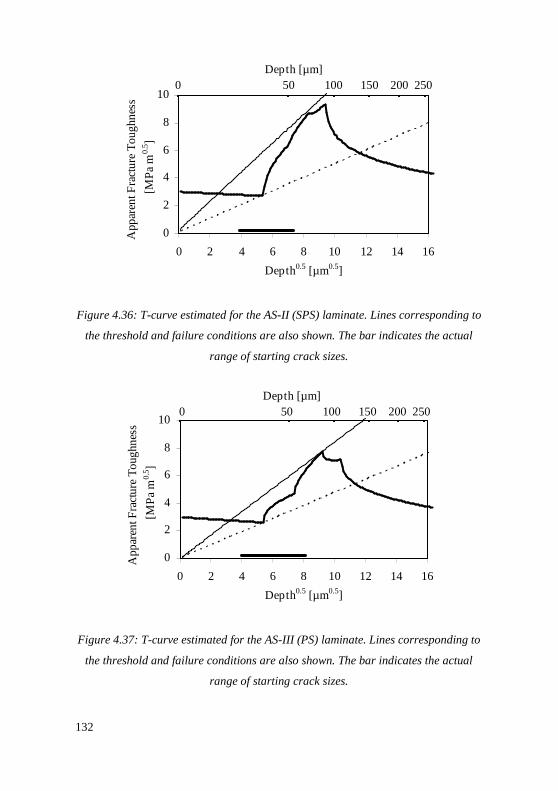
132
0
2
4
6
8
10
0 2 4 6 8 10 12 14 16
Depth0.5 [µm0.5]
App
aren
t Fra
ctu
re T
oug
hnes
s
[MP
a m
0.5 ]
Depth [µm] 0 50 100 150 200 250
Figure 4.36: T-curve estimated for the AS-II (SPS) laminate. Lines corresponding to
the threshold and failure conditions are also shown. The bar indicates the actual
range of starting crack sizes.
0
2
4
6
8
10
0 2 4 6 8 10 12 14 16
Depth0.5 [µm0.5]
App
aren
t Fra
ctu
re T
oug
hnes
s
[MP
a m
0.5 ]
Depth [µm]0 50 100 150 200 250
Figure 4.37: T-curve estimated for the AS-III (PS) laminate. Lines corresponding to
the threshold and failure conditions are also shown. The bar indicates the actual
range of starting crack sizes.
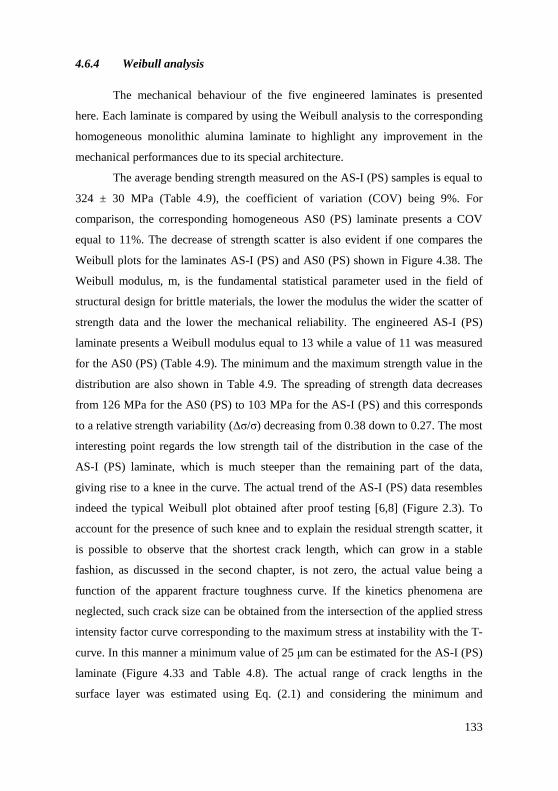
133
4.6.4 Weibull analysis
The mechanical behaviour of the five engineered laminates is presented
here. Each laminate is compared by using the Weibull analysis to the corresponding
homogeneous monolithic alumina laminate to highlight any improvement in the
mechanical performances due to its special architecture.
The average bending strength measured on the AS-I (PS) samples is equal to
324 ± 30 MPa (Table 4.9), the coefficient of variation (COV) being 9%. For
comparison, the corresponding homogeneous AS0 (PS) laminate presents a COV
equal to 11%. The decrease of strength scatter is also evident if one compares the
Weibull plots for the laminates AS-I (PS) and AS0 (PS) shown in Figure 4.38. The
Weibull modulus, m, is the fundamental statistical parameter used in the field of
structural design for brittle materials, the lower the modulus the wider the scatter of
strength data and the lower the mechanical reliability. The engineered AS-I (PS)
laminate presents a Weibull modulus equal to 13 while a value of 11 was measured
for the AS0 (PS) (Table 4.9). The minimum and the maximum strength value in the
distribution are also shown in Table 4.9. The spreading of strength data decreases
from 126 MPa for the AS0 (PS) to 103 MPa for the AS-I (PS) and this corresponds
to a relative strength variability (∆σ/σ) decreasing from 0.38 down to 0.27. The most
interesting point regards the low strength tail of the distribution in the case of the
AS-I (PS) laminate, which is much steeper than the remaining part of the data,
giving rise to a knee in the curve. The actual trend of the AS-I (PS) data resembles
indeed the typical Weibull plot obtained after proof testing [6,8] (Figure 2.3). To
account for the presence of such knee and to explain the residual strength scatter, it
is possible to observe that the shortest crack length, which can grow in a stable
fashion, as discussed in the second chapter, is not zero, the actual value being a
function of the apparent fracture toughness curve. If the kinetics phenomena are
neglected, such crack size can be obtained from the intersection of the applied stress
intensity factor curve corresponding to the maximum stress at instability with the T-
curve. In this manner a minimum value of 25 µm can be estimated for the AS-I (PS)
laminate (Figure 4.33 and Table 4.8). The actual range of crack lengths in the
surface layer was estimated using Eq. (2.1) and considering the minimum and
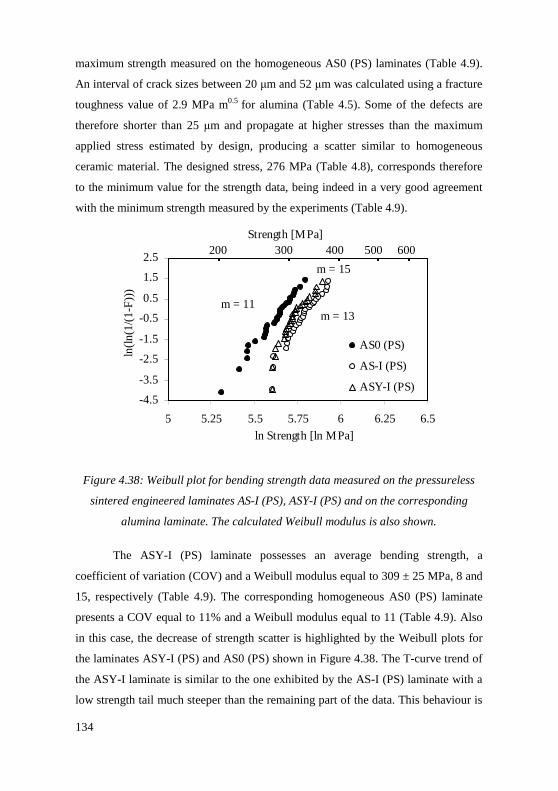
134
maximum strength measured on the homogeneous AS0 (PS) laminates (Table 4.9).
An interval of crack sizes between 20 µm and 52 µm was calculated using a fracture
toughness value of 2.9 MPa m0.5 for alumina (Table 4.5). Some of the defects are
therefore shorter than 25 µm and propagate at higher stresses than the maximum
applied stress estimated by design, producing a scatter similar to homogeneous
ceramic material. The designed stress, 276 MPa (Table 4.8), corresponds therefore
to the minimum value for the strength data, being indeed in a very good agreement
with the minimum strength measured by the experiments (Table 4.9).
-4.5
-3.5
-2.5
-1.5
-0.5
0.5
1.5
2.5
5 5.25 5.5 5.75 6 6.25 6.5
ln Strength [ln MPa]
ln(ln
(1/(
1-F
)))
AS0 (PS)
AS-I (PS)
ASY-I (PS)
m = 11m = 13
m = 15
Strength [MPa]200 300 400 500 600
Figure 4.38: Weibull plot for bending strength data measured on the pressureless
sintered engineered laminates AS-I (PS), ASY-I (PS) and on the corresponding
alumina laminate. The calculated Weibull modulus is also shown.
The ASY-I (PS) laminate possesses an average bending strength, a
coefficient of variation (COV) and a Weibull modulus equal to 309 ± 25 MPa, 8 and
15, respectively (Table 4.9). The corresponding homogeneous AS0 (PS) laminate
presents a COV equal to 11% and a Weibull modulus equal to 11 (Table 4.9). Also
in this case, the decrease of strength scatter is highlighted by the Weibull plots for
the laminates ASY-I (PS) and AS0 (PS) shown in Figure 4.38. The T-curve trend of
the ASY-I laminate is similar to the one exhibited by the AS-I (PS) laminate with a
low strength tail much steeper than the remaining part of the data. This behaviour is
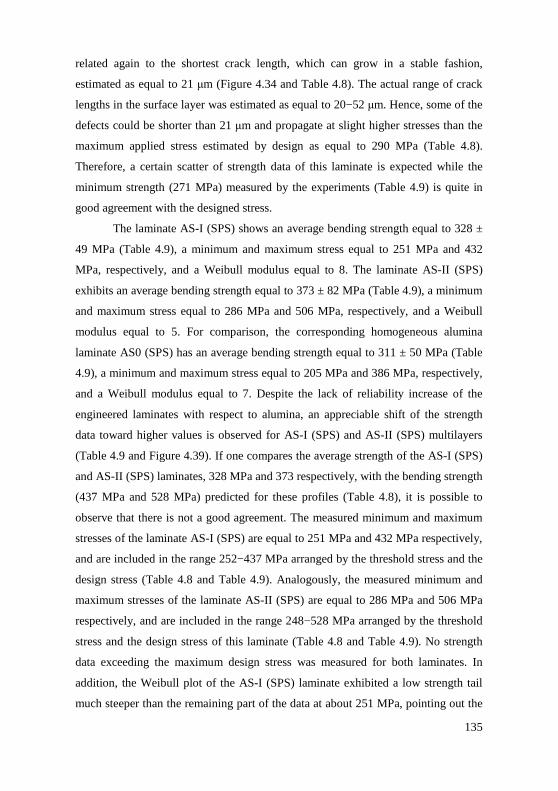
135
related again to the shortest crack length, which can grow in a stable fashion,
estimated as equal to 21 µm (Figure 4.34 and Table 4.8). The actual range of crack
lengths in the surface layer was estimated as equal to 20−52 µm. Hence, some of the
defects could be shorter than 21 µm and propagate at slight higher stresses than the
maximum applied stress estimated by design as equal to 290 MPa (Table 4.8).
Therefore, a certain scatter of strength data of this laminate is expected while the
minimum strength (271 MPa) measured by the experiments (Table 4.9) is quite in
good agreement with the designed stress.
The laminate AS-I (SPS) shows an average bending strength equal to 328 ±
49 MPa (Table 4.9), a minimum and maximum stress equal to 251 MPa and 432
MPa, respectively, and a Weibull modulus equal to 8. The laminate AS-II (SPS)
exhibits an average bending strength equal to 373 ± 82 MPa (Table 4.9), a minimum
and maximum stress equal to 286 MPa and 506 MPa, respectively, and a Weibull
modulus equal to 5. For comparison, the corresponding homogeneous alumina
laminate AS0 (SPS) has an average bending strength equal to 311 ± 50 MPa (Table
4.9), a minimum and maximum stress equal to 205 MPa and 386 MPa, respectively,
and a Weibull modulus equal to 7. Despite the lack of reliability increase of the
engineered laminates with respect to alumina, an appreciable shift of the strength
data toward higher values is observed for AS-I (SPS) and AS-II (SPS) multilayers
(Table 4.9 and Figure 4.39). If one compares the average strength of the AS-I (SPS)
and AS-II (SPS) laminates, 328 MPa and 373 respectively, with the bending strength
(437 MPa and 528 MPa) predicted for these profiles (Table 4.8), it is possible to
observe that there is not a good agreement. The measured minimum and maximum
stresses of the laminate AS-I (SPS) are equal to 251 MPa and 432 MPa respectively,
and are included in the range 252−437 MPa arranged by the threshold stress and the
design stress (Table 4.8 and Table 4.9). Analogously, the measured minimum and
maximum stresses of the laminate AS-II (SPS) are equal to 286 MPa and 506 MPa
respectively, and are included in the range 248−528 MPa arranged by the threshold
stress and the design stress of this laminate (Table 4.8 and Table 4.9). No strength
data exceeding the maximum design stress was measured for both laminates. In
addition, the Weibull plot of the AS-I (SPS) laminate exhibited a low strength tail
much steeper than the remaining part of the data at about 251 MPa, pointing out the
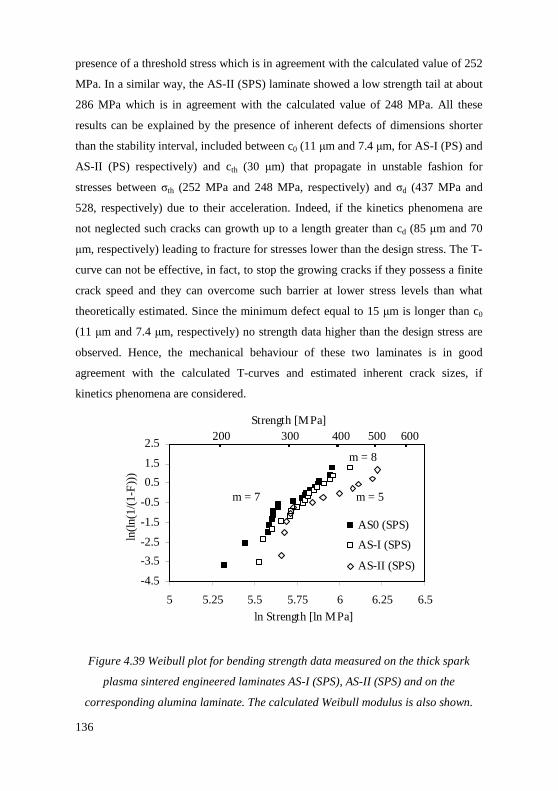
136
presence of a threshold stress which is in agreement with the calculated value of 252
MPa. In a similar way, the AS-II (SPS) laminate showed a low strength tail at about
286 MPa which is in agreement with the calculated value of 248 MPa. All these
results can be explained by the presence of inherent defects of dimensions shorter
than the stability interval, included between c0 (11 µm and 7.4 µm, for AS-I (PS) and
AS-II (PS) respectively) and cth (30 µm) that propagate in unstable fashion for
stresses between σth (252 MPa and 248 MPa, respectively) and σd (437 MPa and
528, respectively) due to their acceleration. Indeed, if the kinetics phenomena are
not neglected such cracks can growth up to a length greater than cd (85 µm and 70
µm, respectively) leading to fracture for stresses lower than the design stress. The T-
curve can not be effective, in fact, to stop the growing cracks if they possess a finite
crack speed and they can overcome such barrier at lower stress levels than what
theoretically estimated. Since the minimum defect equal to 15 µm is longer than c0
(11 µm and 7.4 µm, respectively) no strength data higher than the design stress are
observed. Hence, the mechanical behaviour of these two laminates is in good
agreement with the calculated T-curves and estimated inherent crack sizes, if
kinetics phenomena are considered.
-4.5
-3.5
-2.5
-1.5
-0.5
0.5
1.5
2.5
5 5.25 5.5 5.75 6 6.25 6.5
ln Strength [ln MPa]
ln(ln
(1/(
1-F
)))
AS0 (SPS)
AS-I (SPS)
AS-II (SPS)
m = 8
m = 5m = 7
Strength [MPa] 200 300 400 500 600
Figure 4.39 Weibull plot for bending strength data measured on the thick spark
plasma sintered engineered laminates AS-I (SPS), AS-II (SPS) and on the
corresponding alumina laminate. The calculated Weibull modulus is also shown.
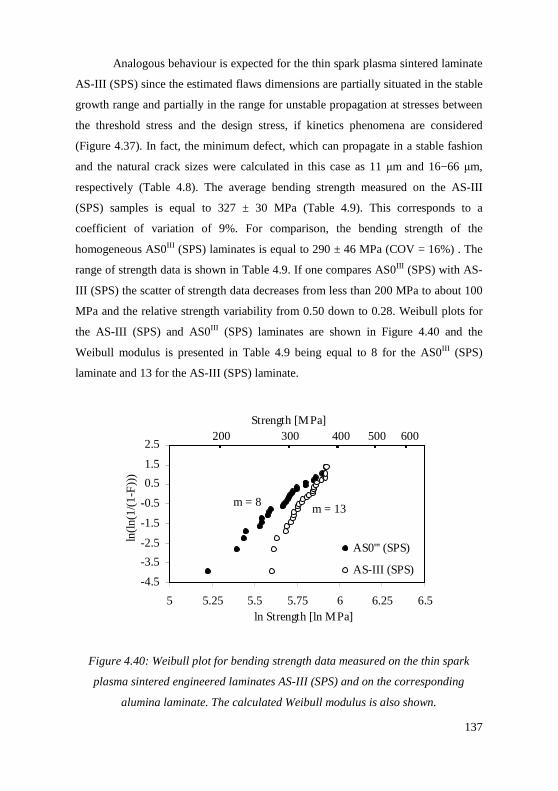
137
Analogous behaviour is expected for the thin spark plasma sintered laminate
AS-III (SPS) since the estimated flaws dimensions are partially situated in the stable
growth range and partially in the range for unstable propagation at stresses between
the threshold stress and the design stress, if kinetics phenomena are considered
(Figure 4.37). In fact, the minimum defect, which can propagate in a stable fashion
and the natural crack sizes were calculated in this case as 11 µm and 16−66 µm,
respectively (Table 4.8). The average bending strength measured on the AS-III
(SPS) samples is equal to 327 ± 30 MPa (Table 4.9). This corresponds to a
coefficient of variation of 9%. For comparison, the bending strength of the
homogeneous AS0III (SPS) laminates is equal to 290 ± 46 MPa (COV = 16%) . The
range of strength data is shown in Table 4.9. If one compares AS0III (SPS) with AS-
III (SPS) the scatter of strength data decreases from less than 200 MPa to about 100
MPa and the relative strength variability from 0.50 down to 0.28. Weibull plots for
the AS-III (SPS) and AS0III (SPS) laminates are shown in Figure 4.40 and the
Weibull modulus is presented in Table 4.9 being equal to 8 for the AS0III (SPS)
laminate and 13 for the AS-III (SPS) laminate.
-4.5
-3.5
-2.5
-1.5
-0.5
0.5
1.5
2.5
5 5.25 5.5 5.75 6 6.25 6.5ln Strength [ln MPa]
ln(ln
(1/(
1-F
)))
AS0''' (SPS)
AS-III (SPS)
m = 13m = 8
Strength [MPa] 200 300 400 500 600
Figure 4.40: Weibull plot for bending strength data measured on the thin spark
plasma sintered engineered laminates AS-III (SPS) and on the corresponding
alumina laminate. The calculated Weibull modulus is also shown.
138
Such difference represents an improvement in the mechanical reliability of
the material. Therefore, despite the presence of defects smaller than the stability
range, most defects are supposed to undergo to stable growth before the laminate
failure and increased reliability can be observed. Indeed, the mechanical strength
trend of this laminate is again well explained by the design.
The differences between the actual and calculated strength values can be
related to errors in the evaluation of layer thickness or lamina properties, particularly
for the thermal expansion coefficient. This parameter is the actual driving force for
the development of a residual stress profile and it exerts a direct influence on the
amplitude of the layer residual stresses. The layer thickness also influences the
bending strength, its effect being twofold: both single residual stress amplitude and
depth of internal layers are function of the actual thickness of the sintered laminas,
the apparent fracture toughness changing accordingly.
Table 4.9: Number of strength data (N), average strength (σb), coefficient of
variation (COV), minimum (σmin) and maximum (σmax) stress, relative strength
variability (∆σ/σ) and Weibull modulus (m) observed for the engineered laminates
and the corresponding alumina laminates considered in this work.
N σb [MPa] COV [%]
σmin [MPa]
σmax [MPa]
∆σ/σ m
Pressureless sintered laminates
AS0 (PS) 30 276 ± 30 11 203 329 0.38 11
AS-I (PS) 27 324 ± 30 9 272 375 0.27 13
ASY-I (PS) 27 309 ± 25 8 271 364 0.25 15
Thick spark plasma sintered laminates
AS0 (SPS) 20 311 ± 50 16 205 386 0.47 7
AS-I (SPS) 17 328 ± 49 15 251 432 0.42 8
AS-II (SPS) 12 373 ± 82 22 286 506 0.43 5
Thin spark plasma sintered laminates
AS0III (SPS) 26 290 ± 46 16 186 373 0.50 8
AS-III (SPS) 26 327 ± 30 9 271 375 0.28 13
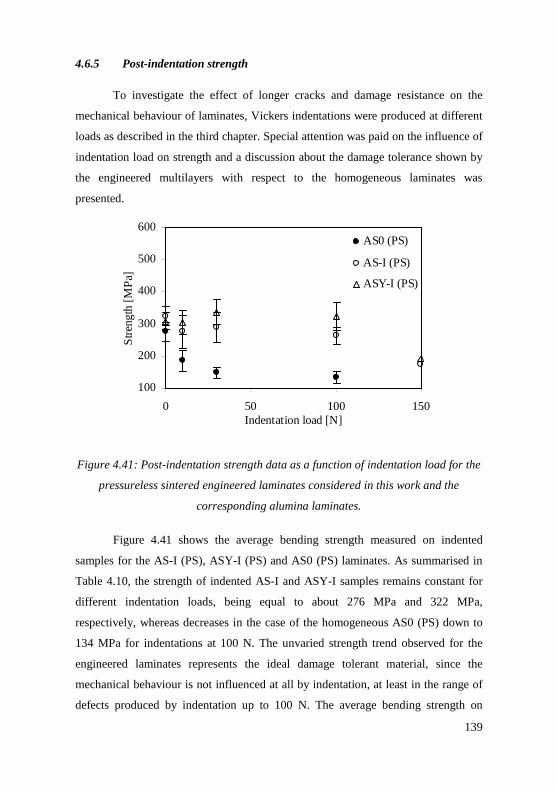
139
4.6.5 Post-indentation strength
To investigate the effect of longer cracks and damage resistance on the
mechanical behaviour of laminates, Vickers indentations were produced at different
loads as described in the third chapter. Special attention was paid on the influence of
indentation load on strength and a discussion about the damage tolerance shown by
the engineered multilayers with respect to the homogeneous laminates was
presented.
100
200
300
400
500
600
0 50 100 150Indentation load [N]
Str
eng
th [M
Pa]
AS0 (PS)
AS-I (PS)
ASY-I (PS)
Figure 4.41: Post-indentation strength data as a function of indentation load for the
pressureless sintered engineered laminates considered in this work and the
corresponding alumina laminates.
Figure 4.41 shows the average bending strength measured on indented
samples for the AS-I (PS), ASY-I (PS) and AS0 (PS) laminates. As summarised in
Table 4.10, the strength of indented AS-I and ASY-I samples remains constant for
different indentation loads, being equal to about 276 MPa and 322 MPa,
respectively, whereas decreases in the case of the homogeneous AS0 (PS) down to
134 MPa for indentations at 100 N. The unvaried strength trend observed for the
engineered laminates represents the ideal damage tolerant material, since the
mechanical behaviour is not influenced at all by indentation, at least in the range of
defects produced by indentation up to 100 N. The average bending strength on
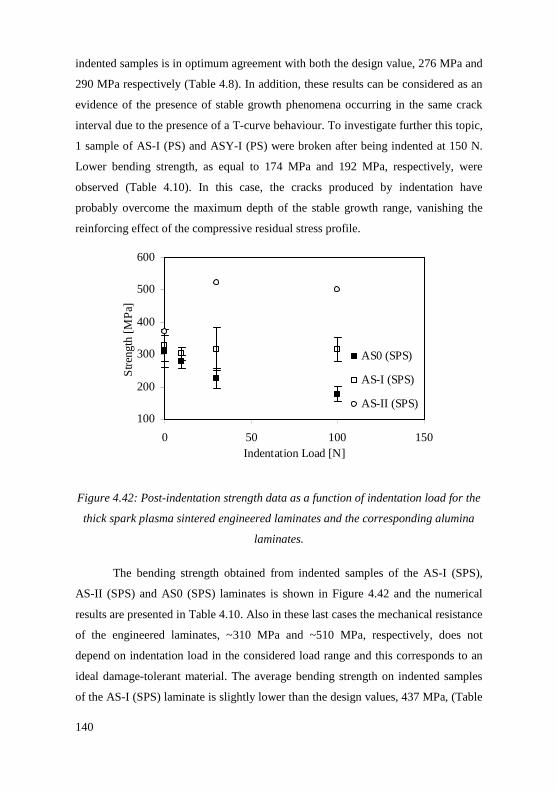
140
indented samples is in optimum agreement with both the design value, 276 MPa and
290 MPa respectively (Table 4.8). In addition, these results can be considered as an
evidence of the presence of stable growth phenomena occurring in the same crack
interval due to the presence of a T-curve behaviour. To investigate further this topic,
1 sample of AS-I (PS) and ASY-I (PS) were broken after being indented at 150 N.
Lower bending strength, as equal to 174 MPa and 192 MPa, respectively, were
observed (Table 4.10). In this case, the cracks produced by indentation have
probably overcome the maximum depth of the stable growth range, vanishing the
reinforcing effect of the compressive residual stress profile.
100
200
300
400
500
600
0 50 100 150Indentation Load [N]
Str
engt
h [M
Pa]
AS0 (SPS)
AS-I (SPS)
AS-II (SPS)
Figure 4.42: Post-indentation strength data as a function of indentation load for the
thick spark plasma sintered engineered laminates and the corresponding alumina
laminates.
The bending strength obtained from indented samples of the AS-I (SPS),
AS-II (SPS) and AS0 (SPS) laminates is shown in Figure 4.42 and the numerical
results are presented in Table 4.10. Also in these last cases the mechanical resistance
of the engineered laminates, ~310 MPa and ~510 MPa, respectively, does not
depend on indentation load in the considered load range and this corresponds to an
ideal damage-tolerant material. The average bending strength on indented samples
of the AS-I (SPS) laminate is slightly lower than the design values, 437 MPa, (Table
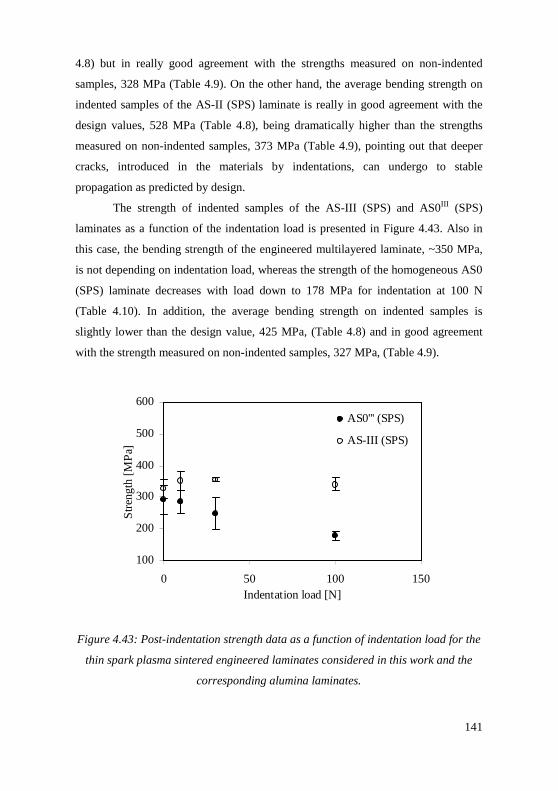
141
4.8) but in really good agreement with the strengths measured on non-indented
samples, 328 MPa (Table 4.9). On the other hand, the average bending strength on
indented samples of the AS-II (SPS) laminate is really in good agreement with the
design values, 528 MPa (Table 4.8), being dramatically higher than the strengths
measured on non-indented samples, 373 MPa (Table 4.9), pointing out that deeper
cracks, introduced in the materials by indentations, can undergo to stable
propagation as predicted by design.
The strength of indented samples of the AS-III (SPS) and AS0III (SPS)
laminates as a function of the indentation load is presented in Figure 4.43. Also in
this case, the bending strength of the engineered multilayered laminate, ~350 MPa,
is not depending on indentation load, whereas the strength of the homogeneous AS0
(SPS) laminate decreases with load down to 178 MPa for indentation at 100 N
(Table 4.10). In addition, the average bending strength on indented samples is
slightly lower than the design value, 425 MPa, (Table 4.8) and in good agreement
with the strength measured on non-indented samples, 327 MPa, (Table 4.9).
100
200
300
400
500
600
0 50 100 150Indentation load [N]
Str
eng
th [
MP
a]
AS0''' (SPS)
AS-III (SPS)
Figure 4.43: Post-indentation strength data as a function of indentation load for the
thin spark plasma sintered engineered laminates considered in this work and the
corresponding alumina laminates.
142
The zero-slope behaviour is therefore shown by all the laminates, being
more evident for the AS-II (SPS) multilayer, and the damage tolerance is confirmed
in the considered load range. Differences between the calculated strengths and the
strengths measured on indented samples can be related again to errors in the
evaluation of layer thickness or lamina properties that change the apparent fracture
toughness curve respect to the one calculated. In addition, some cracks grew from
inherent flaws and not from indentation sites, hindering the measure of the
maximum design stress. Despite these observable differences between the post
indentation strengths and the design stresses, the mechanical behaviour of the
engineered laminates is well explained by the design used in this work and the
related considerations.
Table 4.10: Post-indentation strength of the engineered multilayers and of the
corresponding alumina homogeneous laminates considered in this work.
Indentation loads 0 N 10 N 30 N 100 N 150 N
Pressureless sintered laminates
AS0 (PS) 276 ± 30 186 ± 32 148 ± 16 134 ± 18 -
AS-I (PS) 324 ± 30 276 ± 52 288 ± 47 264 ± 26 174
ASY-I (PS) 309 ± 25 305 ± 38 336 ± 39 325 ± 44 192
Thick spark plasma sintered laminates
AS0 (SPS) 311 ± 50 278 ± 20 228 ± 31 177 ± 23 -
AS-I (SPS) 328 ± 49 302 ± 20 317 ± 66 316 ±36 -
AS-II (SPS) 373 ± 82 - 523 501 -
Thin spark plasma sintered laminates
AS0III (SPS) 290 ± 46 284 ± 35 248 ± 49 178 ± 14 -
AS-III (SPS) 327 ± 30 352 ± 32 355 ± 5 340 ± 20 -
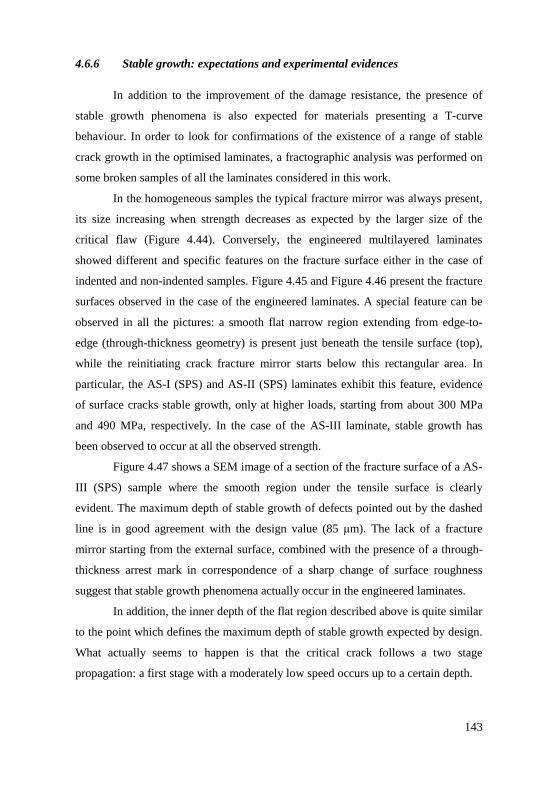
143
4.6.6 Stable growth: expectations and experimental evidences
In addition to the improvement of the damage resistance, the presence of
stable growth phenomena is also expected for materials presenting a T-curve
behaviour. In order to look for confirmations of the existence of a range of stable
crack growth in the optimised laminates, a fractographic analysis was performed on
some broken samples of all the laminates considered in this work.
In the homogeneous samples the typical fracture mirror was always present,
its size increasing when strength decreases as expected by the larger size of the
critical flaw (Figure 4.44). Conversely, the engineered multilayered laminates
showed different and specific features on the fracture surface either in the case of
indented and non-indented samples. Figure 4.45 and Figure 4.46 present the fracture
surfaces observed in the case of the engineered laminates. A special feature can be
observed in all the pictures: a smooth flat narrow region extending from edge-to-
edge (through-thickness geometry) is present just beneath the tensile surface (top),
while the reinitiating crack fracture mirror starts below this rectangular area. In
particular, the AS-I (SPS) and AS-II (SPS) laminates exhibit this feature, evidence
of surface cracks stable growth, only at higher loads, starting from about 300 MPa
and 490 MPa, respectively. In the case of the AS-III laminate, stable growth has
been observed to occur at all the observed strength.
Figure 4.47 shows a SEM image of a section of the fracture surface of a AS-
III (SPS) sample where the smooth region under the tensile surface is clearly
evident. The maximum depth of stable growth of defects pointed out by the dashed
line is in good agreement with the design value (85 µm). The lack of a fracture
mirror starting from the external surface, combined with the presence of a through-
thickness arrest mark in correspondence of a sharp change of surface roughness
suggest that stable growth phenomena actually occur in the engineered laminates.
In addition, the inner depth of the flat region described above is quite similar
to the point which defines the maximum depth of stable growth expected by design.
What actually seems to happen is that the critical crack follows a two stage
propagation: a first stage with a moderately low speed occurs up to a certain depth.
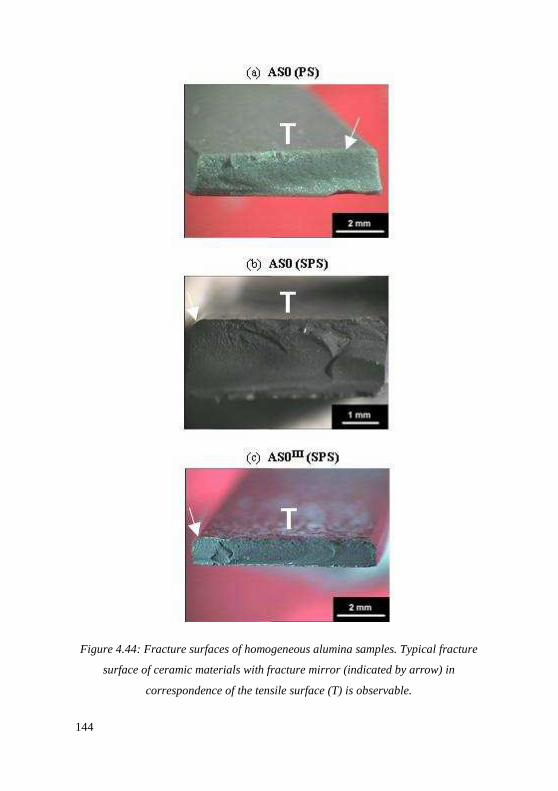
144
Figure 4.44: Fracture surfaces of homogeneous alumina samples. Typical fracture
surface of ceramic materials with fracture mirror (indicated by arrow) in
correspondence of the tensile surface (T) is observable.
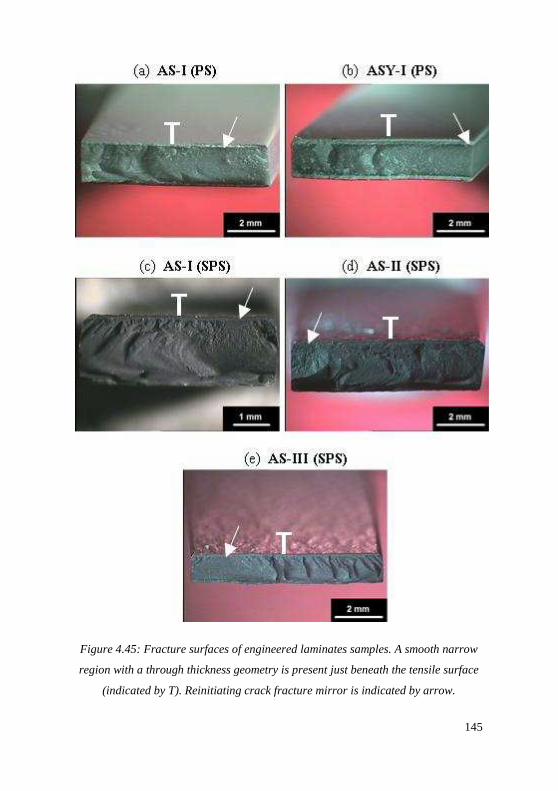
145
Figure 4.45: Fracture surfaces of engineered laminates samples. A smooth narrow
region with a through thickness geometry is present just beneath the tensile surface
(indicated by T). Reinitiating crack fracture mirror is indicated by arrow.
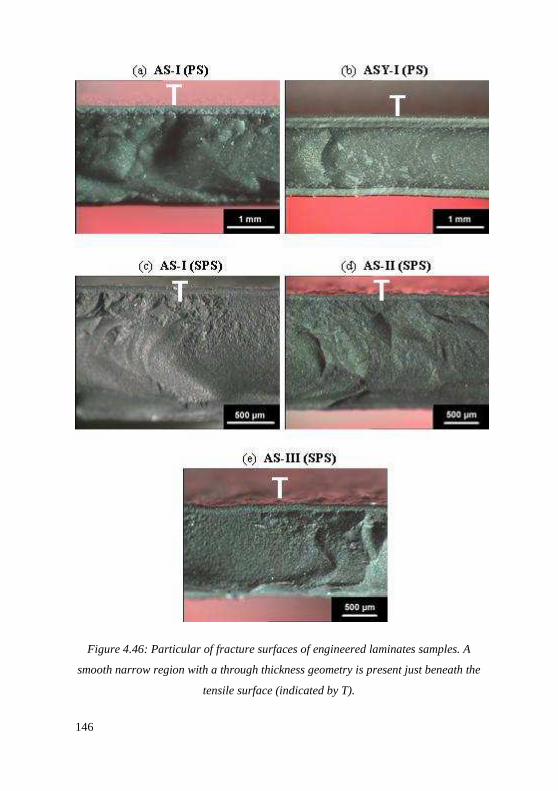
146
Figure 4.46: Particular of fracture surfaces of engineered laminates samples. A
smooth narrow region with a through thickness geometry is present just beneath the
tensile surface (indicated by T).
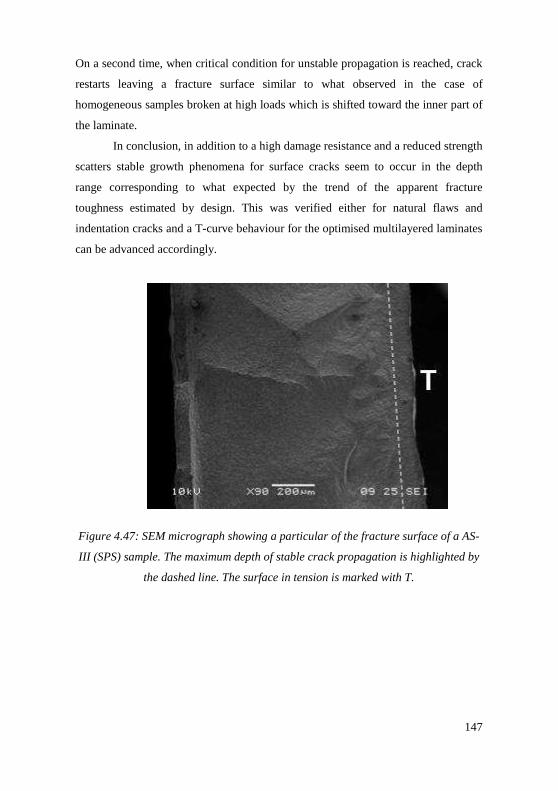
147
On a second time, when critical condition for unstable propagation is reached, crack
restarts leaving a fracture surface similar to what observed in the case of
homogeneous samples broken at high loads which is shifted toward the inner part of
the laminate.
In conclusion, in addition to a high damage resistance and a reduced strength
scatters stable growth phenomena for surface cracks seem to occur in the depth
range corresponding to what expected by the trend of the apparent fracture
toughness estimated by design. This was verified either for natural flaws and
indentation cracks and a T-curve behaviour for the optimised multilayered laminates
can be advanced accordingly.
Figure 4.47: SEM micrograph showing a particular of the fracture surface of a AS-
III (SPS) sample. The maximum depth of stable crack propagation is highlighted by
the dashed line. The surface in tension is marked with T.

149
Conclusion and future perspectives
In the present work two routes to prepare layered structures with strong
interfaces in the system Al2O3/SiC have been shown. A processing method, which
utilizes conventional techniques like tape casting, lamination and pressureless
sintering has been developed for fabricating Al2O3/SiC laminates with SiC content
up to 20 vol%, also by using yttria as sintering aid. The weight loss generally
observed in pressureless sintering these composites was minimized by optimizing
the sintering conditions and by using a 50 mol% Al2O3/SiC powder bed. In addition,
Spark Plasma Sintering of tape casted composite laminae has been used as
innovative sintering technology to produce fully dense and thin Al2O3/SiC laminates
with SiC load up to 30 vol%.
By modifying the composition and the architecture of Al 2O3/SiC composite
laminae, five engineered multilayers characterized by tailored residual stress profiles
have been produced by pressureless sintering or Spark Plasma Sintering. The
engineered laminates have been designed and fabricated to support bending loads
and to promote the propagation of surface defects in a stable manner thanks to a T-
curve behaviour. The results of the mechanical characterization of the engineered
laminates compared to the behaviour of simple homogeneous materials, proved that
the arising of residual stresses influences the multilayers fracture resistance. Indeed,
the engineered laminates are stronger than parent monolithic alumina and are
characterized by a minimum mechanical resistance and surface damage insensitivity,
also when macroscopic cracks are introduced by Vickers indentations at loads as
high as 100 N. Some laminates exhibit reduced scatter and higher Weibull modulus,
which implies superior reliability.
Examination of fractographic features in the engineered laminates showed a
constant depth smooth area just beneath the tensile surface which can be attributed
to the stable growth of surface cracks within the surface layers in residual
compressive stress. Such peculiar crack propagation, correlated to the laminate
architecture, could be associated to the mechanical performances of the engineered
laminates and is responsible for the observed damage tolerance.

150
The results of this study are likely to find practical applications in the field
of mechanical behaviour of advanced ceramic composites. Among the future
perspectives originated by this work, one point concerns with the tailoring of proper
laminates architectures able to force most of inherent surface flaws to stable growth.
A future challenge could be the study of rupture behaviour of these materials at high
temperatures. The production of components of complex shape as shells or tubes,
with such microstructural architecture could be also investigated.
151
References
[1] Van Vlack LH. Elements of materials science and engineering. VIth Edit.
Addison-Wesley Publishing Company; 1989. [2] Callister W. Materials Science and Engineering: An Introduction. Vth Edit.
John Wiley& Sons; 2000. [3] Kingery WD, Bowen HK, Uhlmann DR. Introduction to ceramics. New
York: John Wiley& Sons; 1976. [4] Rödel J, Kounga ABN, Weissenberger-Eibl M, Koch D, Bierwisch A,
Rossner W, et al. Development of a roadmap for advanced ceramics: 2010–2025. J Eur Ceram Soc 2009;29:1549–60.
[5] W R. Modern ceramic engineering, properties, processing and use in design. New York: Marcel Dekker; 1982.
[6] Green DJ. An Introduction to the Mechanical Properties of Ceramics. Cambridge University Press; 1998.
[7] Wachtman JB. Mechanical properties of ceramics. New York: J. Wiley & Sons; 1996.
[8] Lawn BR. Fracture of brittle solids. IInd Edit. Cambridge: Cambridge University Press; 1993.
[9] Ono M, Nakao W, Takahashi K, Nakatani M, Ando K. A new methodology to guarantee the structural integrity of Al2O3/SiC composite using crack healing and a proof test. Fatigue Fract Eng Mater Struct 2007;30:599–607.
[10] Lange F. Powder processing science and technology for increased reliability. J Am Ceram Soc 1989;72:3–15.
[11] Peters edt. SY. Handbook of composites. London: Chapman & Hall; 1998. [12] Lee WE, Rainforth M. Ceramic Microstructures - Property control by
processing. London: Chapman & Hall; 1994. [13] Mekky W, Nicholson PS. R-curve modeling for Ni/Al2O3 laminates.
Compos Part B Eng 2007;38:35–43. [14] She J, Inoue T, Ueno K. Multilayer Al2O3/ SiC ceramics with improved
mechanical behavior 2000;20:1771–5. [15] She J, Inoue T, Ueno K. Damage resistance and R-curve behavior of
multilayer Al2O3/ SiC ceramics 2000;26:801–5. [16] Davis JB, Kristoffersson A, Carlstro E, Clegg WJ. Fabrication and Crack
Deflection in Ceramic Laminates with Porous Interlayers 2000;74:2369–74. [17] Virkar A V, Huang JL, Cutler RA. Strengthening of Oxide Ceramics by
Transformation‐Induced Stress. J Am Ceram Soc 1987;70:164–70. [18] Rao MP. Laminar Ceramics That Exhibit a Threshold Strength. Science
(80- ) 1999;286:102–5. [19] De Portu G, Micele L, Pezzotti G. Laminated ceramic structures from oxide
systems. Compos Part B Eng 2006;37:556–67. [20] Sglavo VM, Larentis L, Trento I-, Green DJ. Flaw-Insensitive Ion-
Exchanged Glass: I , Theoretical Aspects 2001;31:1827–31. [21] Sglavo VM, Prezzi A, Green DJ. In situ observation of crack propagation in
152
ESP (engineered stress profile) glass. Eng Fract Mech 2007;74:1383–98. [22] Sglavo VM, Paternoster M, Bertoldi M. Tailored Residual Stresses in High
Reliability Alumina-Mullite Ceramic Laminates. J Am Ceram Soc 2005;88:2826–32.
[23] Sglavo V, Bertoldi M. Design and production of ceramic laminates with high mechanical resistance and reliability. Acta Mater 2006;54:4929–37.
[24] Sglavo VM, Bertoldi M. Design and production of ceramic laminates with high mechanical reliability. Compos Part B Eng 2006;37:481–9.
[25] Sglavo VM, Green DJ. Flaw-Insensitive Ion-Exchanged Glass: II, Production and Mechanical Performance. J Am Ceram Soc 2004;84:1832–8.
[26] Sternitzke M. Structural ceramic nanocomposites. J Eur Ceram Soc 1997;17:1061–82.
[27] Quinn GD, Morrell R. Design data for engineering ceramics: a review of the flexure test. J Am Ceram Soc 1991;74:2037–66.
[28] Basu B, Balani K. Advanced structural ceramics. John Wiley& Sons; 2011. [29] Quinn GD. NIST Recommended Practice Guide: fractography of ceramics
and glasses. 2006. [30] Chantikul P. Role of grain size in the strength and R-curve properties of
alumina. J Am … 1990;73:2419–27. [31] lio S, Watanabe M, Matsubara M, Matsuo Y. Mechanical Properties of
Alumina/Silicon Carbide Whisker Composites. J Am Ceram Soc 1989;72:1880–4.
[32] Homeny J, Vaughn WL. R-Curve Behavior in a Silicon Carbide Whisker/Alumina Matrix Composite. J Am Ceram Soc 1990;73:2060–2.
[33] Chou Y-S, Green DJ. Silicon Carbide Platelet/Alumina Composites: III, Toughening Mechanisms. J Am Ceram Soc 1993;76:1985–92.
[34] Belmonte M, Moya JS, Miranzo P, Nguyen D, Dubois J, Fantozzi G. Fracture behavior of Al2O3/SiC-platelet composites. J Mater Res 2011;11:2528–35.
[35] Niihara K. New design concept of structural ceramics―ceramic nanocomposites. Nippon Seramikkusu Kyokai Gakujutsu Ronbunshi n.d.;99:974–82.
[36] Chae JH, Kim KH, Choa YH, Matsushita J, Yoon J-W, Shim KB. Microstructural evolution of Al2O3–SiC nanocomposites during spark plasma sintering. J Alloys Compd 2006;413:259–64.
[37] Deng Z-Y, Kobayashi T. Microstructure and R-Curve Behavior of Al2O3–SiC Ceramic Matrix Composites. J Mater Sci Lett 1999;18:489–92.
[38] Levin I, Kaplan WD, Brandon DG, Layyous AA. Effect of SiC Submicrometer Particle Size and Content on Fracture Toughness of Alumina-SiC “Nanocomposites.” J Am Ceram Soc 1995;78:254–6.
[39] Pérez-Rigueiro J, Pastor J., Llorca J, Elices M, Miranzo P, Moya J. Revisiting the mechanical behavior of alumina/silicon carbide nanocomposites. Acta Mater 1998;46:5399–411.
[40] Stearns LC, Zhao J, Harmer MP. Processing and microstructure development in Al2O3-SiC “nanocomposites.” J Eur Ceram Soc 1992;10:473–7.
[41] Tomaszewski H, Boniecki M, Weglarz H. Effect of grain size and residual
153
stresses on R-curve behaviour of alumina based composites. J Eur Ceram Soc 2001;21:1021–6.
[42] Zhang Y-F, Deng Z-Y, Shi J-L, Mao Y-Q, Guo J-K. Microstructure and mechanical properties of SiC particle reinforced Al2O3 matrix composites. J Mater Sci Lett 1996;15:1927–31.
[43] Y.-H. Choa AN. Microstructure and mechanical properties of SiC-platelet reinforced Al2O3/SiC-particle hybrid composites 2000;35:3143 – 3149.
[44] Cock AM, Shapiro IP, Todd RI, Roberts SG. Effects of Yttrium on the Sintering and Microstructure of Alumina-Silicon Carbide “Nanocomposites.” J Am Ceram Soc 2005;88:2354–61.
[45] Jeong Y-K, Nakahira A, Niihara K. Effects of Additives on Microstructure and Properties of Alumina-Silicon Carbide Nanocomposites. J Am Ceram Soc 2004;82:3609–12.
[46] Pillai SKC, Baron B, Pomeroy MJ, Hampshire S. Effect of oxide dopants on densification, microstructure and mechanical properties of alumina-silicon carbide nanocomposite ceramics prepared by pressureless sintering. J Eur Ceram Soc 2004;24:3317–26.
[47] Shapiro IP, Todd RI, Titchmarsh JM, Roberts SG. Effects of Y2O3 additives and powder purity on the densification and grain boundary composition of Al2O3/SiC nanocomposites. J Eur Ceram Soc 2009;29:1613–24.
[48] Coble RL. Sintering Crystalline Solids. I. Intermediate and Final State Diffusion Models. J Appl Phys 1961;32:787.
[49] Hirata Y, Hidaka K. Surface characteristics and colloidal processing of silicon carbide. In: Yanagida H, Yoshimura M, editors. Proc. Int. Symp. Environ. Issue Ceram., Tokyo, Japan: The Ceramic Society of Japan; 1995, p. 264–72.
[50] Barclay SJ, Fox JR, Bowen HK. Processing of pressureless-sintered SiC whisker-reinforced Al2O3 composites. J Mater Sci 1987;22:4403–6.
[51] Gadalla A, Elmasry M, Kongkachuichay P. High temperature reactions within SiC–Al2O3 composites. J Mater Res 2011;7:2585–92.
[52] Hue F, Jorand Y, Dubois J, Fantozzi G. Analysis of the weight loss during sintering of silicon-carbide whisker-reinforced alumina composites. J Eur Ceram Soc 1997;17:557–63.
[53] Jackson T, Hurford A, Bruner S, Cutler R. SiC-based ceramics with improved strength. Silicon Carbide 1987 1987.
[54] Misra AK. Thermochemical Analysis of the Silicon Carbide-Alumina Reaction with Reference to Liquid-Phase Sintering of Silicon Carbide. J Am Ceram Soc 1991;74:345–51.
[55] Urretavizcaya G, Porto López JM, Cavalieri AL. Pressureless sintering of Al2O3/SiCw materials: Effect of the reducing atmosphere. J Eur Ceram Soc 1997;17:1555–63.
[56] Assmann S, Eisele U, Böder H. Processing of composites in aqueous media. J Eur Ceram Soc 1997;17:309–17.
[57] Baud S, Thévenot F, Pisch A, Chatillon C. High temperature sintering of SiC with oxide additives: I. Analysis in the SiC–Al2O3 and SiC–Al2O3–Y2O3 systems. J Eur Ceram Soc 2003;23:1–8.
[58] Russo CJ, Harmer MP, Chan HM, Miller GA. Design of a Laminated
154
Ceramic Composite for Improved Strength and Toughness. J Am Ceram Soc 1992;75:3396–400.
[59] Cho K. R-curve behavior of layered silicon carbide ceramics with surface fine microstructure 2001;6:2189–93.
[60] Kandhil FA, Lord JD, Fry AT, Grant P V. Review of residual stress measurement methods - a guide to technique selection. Teddigton, UK: NPL Report MATC(a)04, NPL Materials Centre; 2001.
[61] Halpin JC. Primer on composite materials analysis. IInd Edit. USA: Technomic Publishing Company; 1992.
[62] Rao MP, Rödel J, Lange FF. Residual Stress Induced R -Curves in Laminar Ceramics That Exhibit a Threshold Strength. J Am Ceram Soc 2001;84:2722–4.
[63] Chartier T, Merle D, Besson JL. Laminar ceramic composites. J Eur Ceram Soc 1995;15:101–7.
[64] Green D, Tandon R, Sglavo V. Crack Arrest and Multiple Cracking in Glass Through the Use of Designed Residual Stress Profiles. Science 1999;283:1295–7.
[65] Sbaizero O, Lucchini E. Influence of residual stresses on the mechanical properties of a layered ceramic composite. J Eur Ceram Soc 1996;16:813–8.
[66] Orlovskaya N, Lugovy M, Subbotin V, Radchenko O, Adams J, Chheda M, et al. Robust design and manufacturing of ceramic laminates with controlled thermal residual stresses for enhanced toughness. J Mater Sci 2005;40:5483–90.
[67] Gurauskis J, Sánchez-Herencia a. J, Baudín C. Alumina–zirconia layered ceramics fabricated by stacking water processed green ceramic tapes. J Eur Ceram Soc 2007;27:1389–94.
[68] Cai PZ, Green DJ, Messing GL. Constrained Densification of Alumina/Zirconia Hybrid Laminates, I: Experimental Observations of Processing Defects. J Am Ceram Soc 2005;80:1929–39.
[69] Ho S, Hillman C, Lange FF, Suo Z. Surface Cracking in Layers Under Biaxial, Residual Compressive Stress. J Am Ceram Soc 1995;78:2353–9.
[70] Suresh S, Mortensen A. Functionally graded metals and metal-ceramic composites .1. Processing. Int Mater Rev 1995;40:239–65.
[71] Mortensen A, Suresh S. Functionally graded metals and metal-ceramic composites .2. Thermomechanical behaviour. Int Mater Rev 1997;42:85–116.
[72] Kaysser WA, editor. Functionally gradient materials. Proc. 5th Int. Symp. FGM, Zuerich, Switzerland: Trans Tech Publications Ltd.; 1998.
[73] Reed JS. Principles of ceramic processing. New York: John Wiley& Sons; 1995.
[74] Wachtman JB. 1994 Ceramic Manufacturers and Suppliers Worskhop: Ceramic Engineering and Science Proceedings, Volume 16, Issue 3. John Wiley & Sons; 2009.
[75] Zhan G-D, Kuntz JD, Duan R-G, Mukherjee AK. Spark-Plasma Sintering of Silicon Carbide Whiskers (SiCw) Reinforced Nanocrystalline Alumina. J Am Ceram Soc 2004;87:2297–300.
[76] Gao L, Wang H., Hong J., Miyamoto H, Miyamoto K, Nishikawa Y, et al.
155
Mechanical Properties and Microstructure of Nano-SiC–Al2O3 Composites Densified by Spark Plasma Sintering. J Eur Ceram Soc 1999;19:609–13.
[77] Guo H, Khor KA, Boey YC, Miao X. Laminated and functionally graded hydroxyapatite/yttria stabilized tetragonal zirconia composites fabricated by spark plasma sintering. Biomaterials 2003;24:667–75.
[78] Munir ZA, Anselmi-Tamburini U, Ohyanagi M. The effect of electric field and pressure on the synthesis and consolidation of materials: A review of the spark plasma sintering method. J Mater Sci 2006;41:763–77.
[79] Nygren M, Shen Z. On the preparation of bio-, nano- and structural ceramics and composites by spark plasma sintering. Solid State Sci 2003;5:125–31.
[80] Mistler RE, Twiname ER. Tape Casting - Theory and Practice. Westerville, OH: The American Ceramic Society; 2000.
[81] Hotza D, Greil P. Review: aqueous tape casting of ceramic powders. Mater Sci Eng A 1995;202:206–17.
[82] Messing GL, Fuller jr ER, Hausner H. Ceramic powder science II. Westerville, OH, USA: The American Ceramic Society; 1988.
[83] Moya JS, Sánchez-Herencia AJ, Requena J, Moreno R. Functionally gradient ceramics by sequential slip casting. Mater Lett 1992;14:333–5.
[84] Tuffe S, Marple BR. Graded Casting: Process Control for Producing Tailored Profiles. J Am Ceram Soc 1995;78:3297–303.
[85] Munro M. Evaluated Material Properties for a Sintered alpha-Alumina. J Am Ceram Soc 2005;80:1919–28.
[86] Munro RG. Material properties of a sintered alpha-SiC. J Phys Chem Ref Data 1997;26:1195–203.
[87] Bayer G. Thermal Expansion Anisotropy of Oxide Compounds. Proc. Br. Ceram. Soc., British Ceramic Society; 1973, p. 39–53.
[88] Manning WR, Hunter O, Powell BR. Elastic Properties of Polycrystalline Yttrium Oxide, Dysprosium Oxide, Holmium Oxide, and Erbium Oxide: Room Temperature Measurements. J Am Ceram Soc 1969;52:436–42.
[89] Reynaud C, Thevenot F, Chartier T. Processing and microstructure of SiC laminar composites 2001;19.
[90] Boufi S, Baklouti S, Pagnoux C, Baumard J-F. Interaction of cationic and anionic polyelectrolyte with SiO2 and Al2O3 powders. J Eur Ceram Soc 2002;22:1493–500.
[91] Santhiya D, Subramanian S, Natarajan KA, Malghan SG. Surface chemical studies on alumina suspensions using ammonium poly(methacrylate). Colloids Surfaces A Physicochem Eng Asp 2000;164:143–54.
[92] Singh BP, Bhattacharjee S, Besra L, Sengupta DK. Evaluation of dispersibility of aqueous alumina suspension in presence of Darvan C. Ceram Int 2004;30:939–46.
[93] Heyrman M, Chatillon C. Thermodynamics of the Al–C–O Ternary System. J Electrochem Soc 2006;153:E119.
[94] Lefort P, Tetard D, Tristant P. Formation of aluminium carbide by carbothermal reduction of alumina: Role of the gaseous aluminium phase. J Eur Ceram Soc 1993;12:123–9.
[95] Lee H-W, Sacks MD. Pressureless Sintering of SiC-Whisker-Reinforced Al2O3 Composites: II, Effects of Sintering Additives and Green Body
156
Infiltration. J Am Ceram Soc 1990;73:1894–900. [96] Plucknett KP, Caceres CH, Hughes C, Wilkinson DS. Processing of Tape-
Cast Laminates Prepared from Fine Alumina/Zirconia Powders. J Am Ceram Soc 1994;77:2145–53.
[97] Lutterotti L, Bortolotti M. Object oriented programming and fast computation techniques in Maud, a program for powder diffraction analysis written in java. IUCr Compcomm Newsl 2003;1:43–50.
[98] Mendelson MI. Average Grain Size in Polycrystalline Ceramics. J Am Ceram Soc 1969;52:443–6.
[99] Wurst JC, Nelson JA. Lineal Intercept Technique for measuring Grain Size in Two-Phase Polycrystalline Ceramics. J Am Ceram Soc 1972;55:109.
[100] Roberts AP, Garboczi EJ. Elastic Properties of Model Porous Ceramics. J Am Ceram Soc 2000;83:3041–8.
[101] Anstis GR, Chantikul P, Lawn BR, Marshall DB. A Critical Evaluation of Indentation Techniques for Measuring Fracture Toughness: I, Direct Crack Measurements. J Am Ceram Soc 1981;64:533–8.
[102] Coble RL. Sintering Alumina: Effect of Atmospheres. J Am Ceram Soc 1962;45:123–7.
[103] Winn EJ, Clegg WJ. Role of the Powder Bed in the Densification of Silicon Carbide Sintered with Yttria and Alumina Additives. J Am Ceram Soc 2004;82:3466–70.
[104] Luo J, Stevens R. Porosity-dependence of elastic moduli and hardness of 3Y-TZP ceramics. Ceram Int 1999;25:281–6.
[105] Coble RL, Kingery WD. Effect of Porosity on Physical Properties of Sintered Alumina. J Am Ceram Soc 1956;39:377–85.
{Bibliography}
157
Appendix: Code of the numerical algorithm
The code of the numerical algorithm implemented in Mathematica® and
used in this work is listed in the present Appendix. The code regards the estimation
of the T-curve produced by a given step-wise residual stress profile for a sharp edge
crack under bending loading and the calculation of the maximum and threshold
stress for stable crack propagation. To make the identification of variables and flags
meaning easier, the instructions list is reported here with the input numerical values
used in this work for the AS-III (SPS) T-curve. Fracture toughness, stress and length
dimensions are reported in MPa m0.5, MPa and µm, respectively.
T-CURVE BY STEP-WISE RESIDUAL STRESS PROFILE
LAMINATE IMPUT DATA
layer=5
KIC={3.0,3.3,3.3,3.3,3.0}
EMod={398,394,366,394,398}
NuMod={0.23,0.224,0.217,0.224,0.23}
alpha={8.8,8.45,8.03,8.45,8.8}
laythick={30,25,30,25,525}
DeltaT=-1175
YFac=1.12147
depth={0,0,0,0,0}
lasttens=1
mostcomp=3
delta={0,0,0,0,0}
STRESS PROFILE CALCULATION
EModStar=EMod/(1-NuMod)
i=1;While[i<layer+1,
158
depth=ReplacePart[depth,Sum[Extract[laythick,k],{k,1,i}],i];i++]
depth
EModStar*laythick*alpha
EModStar*laythick
i=1;While[i<layer+1,
alphaAvNom=Sum[Extract[EModStar*laythick*alpha,k],{k,1,i}];i++]
i=1;While[i<layer+1,alphaAvDen=Sum[Extract[EModStar*laythick,k],{k,1,i}];i++]
alphaAv=alphaAvNom/alphaAvDen
stress=EModStar*1000*(alphaAv-alpha)*10^-6*DeltaT
depth=Prepend[depth,0]
stress=Prepend[stress,0]
d2=depth^0.5
T-CURVE CALCULATION
i=1;While[
i<layer+1,{delta=
ReplacePart[delta,Extract[stress,i+1]-Extract[stress,i],i]};i++]
delta
M=IdentityMatrix[layer]
i=1;While[
i<layer+1,{M=
ReplacePart[M,
2*YFac*(x/Pi)^0.5/1000*
Extract[delta,i]*(Pi/2-ArcSin[Extract[depth,i]/x]),i];
Print[Extract[M,i]]};i++]
M2=M
i=1;While[i<layer+1,M2=ReplacePart[M2,Sum[Extract[M,k],{k,1,i}],i];i++]
x=g^2
M2
apparentK=Table[{0,0}, {j,0,Extract[d2,layer+1]*10}]
i=1
k=1
159
w=0.1;While[
w<Extract[d2,layer+1],{If[w>Extract[d2,i+1],i=i+1];g=w;
apparentK=ReplacePart[apparentK,{w,Extract[KIC,i]-N[Extract[M2,i]]},k];
Print[Extract[apparentK,k]];k=k+1};w=w+0.1]
Clear[g]
MAXIMUM STRESS CALCULATION
g=Extract[d2,mostcomp+1]
Kmax=Max[{Extract[KIC,mostcomp]-Extract[M2,mostcomp],
Extract[KIC,mostcomp+1]-Extract[M2,mostcomp+1]}]
stressmaxapprox=Kmax/(YFac*Pi^0.5*g)*1000
stressmaxtrue=FindRoot[YFac*Pi^0.5*s/1000*g-
Kmax\[Equal]0,{s,stressmaxapprox}]
THRESHOLD STRESS CALCULATION
g=Extract[d2,lasttens+1]
Kmin=Min[{Extract[KIC,lasttens]-Extract[M2,lasttens],
Extract[KIC,lasttens+1]-Extract[M2,lasttens+1]}]
stressminapprox=Kmin/(YFac*Pi^0.5*g)*1000
stressmintrue=FindRoot[YFac*Pi^0.5*s/1000*g-
Kmin\[Equal]0,{s,stressminapprox}]
Clear[g]
PRINT CORRESPONDING APPLIED STRESS INTENSITY FACTORS
appliedKmax=N[YFac*Pi^0.5*s/1000*g/.stressmaxtrue]
Clear[s]
appliedKmin=N[YFac*Pi^0.5*s/1000*g/.stressmintrue]
PRINT MAXIMUM AND THRESHOLD STRESS VALUES
stressmaxtrue
stressmintrue
160
GRAPHICS
<<"Graphics`FilledPlot`"
p=IdentityMatrix[layer]
i=1;While[i<layer+1,
p=ReplacePart[p,
FilledPlot[
Evaluate[Extract[KIC,i]-Extract[M2,i]],{g,Extract[d2,i],
Extract[d2,i+1]},PlotRange->{0,25},Fills\[Rule]{GrayLevel[.8]},
Curves\[Rule]Front,DisplayFunction->Identity,
PlotStyle \[Rule]Hue[0.6]],i];i++]
p=Append[p,
Plot[appliedKmax,{g,0,Max[d2]},DisplayFunction\[Rule]Identity,
PlotStyle\[Rule]Hue[1.0]]]
p=Append[p,
Plot[appliedKmin,{g,0,Max[d2]},DisplayFunction\[Rule]Identity,
PlotStyle\[Rule]Hue[1.0]]]
Show[p,DisplayFunction\[Rule]$DisplayFunction,GridLines\[Rule]Automatic,
Background\[Rule]GrayLevel[0.85]]
p2=IdentityMatrix[layer]
i=1;While[i<layer+1,
p2=ReplacePart[p2,
FilledPlot[
Evaluate[Extract[stress,i+1]],{g,Extract[d2,i],Extract[d2,i+1]},
PlotRange\[Rule]{Min[stress]*1.5,-Min[stress]*1.5},
DisplayFunction\[Rule]Identity,
PlotStyle\[Rule]{Hue[0.6],Dashing[{0.01,0.01}]}],i];i++]
Show[p2,DisplayFunction\[Rule]$DisplayFunction,GridLines\[Rule]Automatic,
Background\[Rule]GrayLevel[0.85],AxesOrigin\[Rule]{0,Min[stress]*1.5}]
Clear[g,x,i]
161
Scientific Production
F. De Genua, V. M. Sglavo, “High strength engineered alumina-silicon
carbide laminated composites by Spark Plasma Sintering” in Procedia Engineering,
10 2621-2626 (2011).
V. M. Sglavo, F. De Genua, A. Conci, R. Ceccato, R. Cavallini, “Influence
of curing temperature on the evolution of magnesium oxychloride cement” in
Journal of Material Science, 46 [20] 6726-6733 (2011).
V. M. Sglavo, F. De Genua, “High reliability alumina – silicon carbide
laminated composites by Spark Plasma Sintering”, in “Properties and Applications
of Silicon Carbide”, Edited by R. Gerhardt, INTECH, Croatia, April 2011, p. 427-
444.
Sglavo V. M., De Genua F., Conci A., “Influenza della temperatura di
maturazione sulla struttura del cemento Sorel" in Atti del 10° Convegno Nazionale
AIMAT, Rende (CS) - Italy: Centro editoriale e librario - Università della Calabria,
2010, p. 585-589. Atti di: 10° Convegno Nazionale AIMAT, Capo Vaticano (VV),
5th - 8th September 2010.
Sglavo V. M., De Genua F., “Laminati Compositi in Allumina e Carburo di
Silicio mediante Spark Plasma Sintering”, in Atti del 10° Convegno Nazionale
AIMAT, Rende (CS) - Italy: Centro editoriale e librario - Università della Calabria,
2010, p. 581-584. Atti di: 10° Convegno Nazionale AIMAT, Capo Vaticano (VV),
5th - 8th September 2010.
De Genua F., Sglavo V. M., “High Mechanical Reliability Alumina/Silicon
Carbide Laminated Composites“, in 18th European Conference on Fracture Fracture
of Materials and Structures from Micro to Macro Scale, Berlin, D: DVM, 2010, p.
136-136. Atti di: 18th European Conference on Fracture, Fracture of Materials and
162
Structures from Micro to Macro Scale, Dresden, D, 30th August-3rd September
2010.
V. M. Sglavo, F. De Genua, A. Molinari, F. Casari, “Alumina – silicon
carbide laminated composites by spark plasma sintering”, J. Am. Ceram. Soc., 92
[11] 2693-2697 (2009).
V. M. Sglavo, F. De Genua, A. Molinari, F. Casari, “Alumina – silicon
carbide laminated composites by spark plasma sintering”, Litografica Faenza, 2008.
Conference Acts: “ICC2”, Verona, Italia, 29 giugno - 4 luglio, 2008.
163
Participation to Congresses
De Genua F., Sglavo V. M., “High mechanical reliability alumina-silicon
carbide laminated composites”, VIII Convegno nazionale sulla Scienza e Tecnologia
dei Materiali (Consorzio INSTM), Aci Castello, Catania, Italy, 26th-29th June,
2011. Poster.
De Genua F., Sglavo V. M., “High mechanical reliability alumina-silicon
carbide laminated composites”, 12th Conference of the European Ceramic Society
(ECerS XII), Stockholm, Sweden, 19th-23th June, 2011. Poster.
De Genua F., Sglavo V. M., “High strength alumina-silicon carbide
laminated composites by Spark Plasma Sintering”, International Conference on the
Mechanical Behaviour of Materials (ICM11), Lake Como, Italy, 5th-9th June, 2011.
Oral presentation.
Sglavo V. M., De Genua F., Conci A., “Influenza della temperatura di
maturazione sulla struttura del cemento Sorel" 10° Convegno Nazionale AIMAT,
Capo Vaticano (VV), Italy, 5th - 8th September 2010. Oral presentation.
Sglavo V. M., De Genua F., “Laminati Compositi in Allumina e Carburo di
Silicio mediante Spark Plasma Sintering”, 10° Convegno Nazionale AIMAT, Capo
Vaticano (VV), Italy, 5th - 8th September 2010. Poster.
De Genua F., Sglavo V. M., “High Mechanical Reliability Alumina/Silicon
Carbide Laminated Composites“, in 18th European Conference on Fracture, Fracture
of Materials and Structures from Micro to Macro Scale, Dresden, Germany, 30th
August – 3rd September, 2010. Oral presentation.
V. M. Sglavo, F. De Genua, “High reliability alumina – silicon carbide
laminated composites”, CIMTEC 2010, Montecatini Terme, Italy, 6th -11th June,
164
2010. Oral presentation.
V. M. Sglavo, F. De Genua, A. Molinari, F. Casari, “Alumina – silicon
carbide laminated composites by spark plasma sintering”, ICACC33, Daytona
Beach, Florida, USA, 18th -23th January, 2009. Oral presentation.
165
Other activities
Teaching assistant. Ceramics Engineering. University of Trento, (2010).
Teaching assistant. Ceramics Engineering. University of Trento, (2009).
Research contract. Physical and mechanical characterization of magnesium
oxychloride (Sorel) cements. University of Trento, (2009).
Teaching assistant. Materials Science and Technology. University of Trento,
(2008).

167
Acknowledgments
I wish to express my deep gratitude to my supervisor, prof. Vincenzo M.
Sglavo, for giving me the great opportunity to work in the ceramics field and the
possibility to present my results to international audiences. I appreciated the constant
trust, support and confidence.
I wish to acknowledge Ing. Francesco Casari and Ing. Mario Zadra of K4sint
S.r.l – start-up of the University of Trento, Pergine Valsugana, Italy – who were
involved in laminates Spark Plasma Sintering and gave me some important
suggestion for my work. A genuine gratitude to you.
I want to thank all the people I met and I worked with, during my doctorate
activities, for being an important part of my life during the last years. You are too
many to be reminded. I thank, wherever you are, Lorenzo, Dario, Anna Rita, Amaia,
Marzio, Ricardo, Michele, Erica, Marta, Alberto, Tatiane, André, Aylin, Vincenzo,
Alessandro, Emanuele, Enzo, Valeria, Aravind, Predeep, Elisa, Mirko, a long time is
passed but you’re still in my mind. I thank also Andrea, John, Claudia, Kiran,
Anshu, Rahul, Prandyesh, Emanuele, Niccolò, Mattia. I leave you in a place I love,
also because of you. Special thanks goes to Livio for the valuable support and
advices.
A special acknowledgment is due to my friend Alexia, for all the support as
a technician and all the talks on life and motherhood.
I am grateful to my parents in law for helping me during these months and
for being lovely grandparents. This work would have not been finished without you.
Grazie nonni! And thank you, Chiara, for your love, for being the greatest challenge
in my life, I hope one day I will have my PhD title as a mother. Finally, as for
everything in my life, I am grateful to my husband Emilio, you know, you are the
Shadow in my Dark.