engaging new voters (pdf) - nonprofit vote · senior consultant and lindsey hodel, national field...
TRANSCRIPT
www.nonprofitvote.org
Engaging New Voters:The Impact of Nonprofit Voter Outreach on Client and Community Turnout

33
Leadership Council
Catherine Beane, YWCA
Martina Bouey, South Africa Partners
Kyle Caldwell, Johnson Center for Philanthropy
Cheryl Crawford, Mass VOTE
Tim Delaney, National Council of Nonprofi ts
Rachid Elabed, ACCESS
Jatrice Martel Gaiter, Volunteers of America
David Heinen, N.C. Center for Nonprofi ts
Kei Kawashima-Ginsberg, CIRCLE
Amanda Pears Kelly, National Association of Community Health Centers (NACHC)
Geoff Plague, Independent Sector
Jessica Reeves, Voto Latino
Laura Walling, Goodwill Industries International
Michael Weekes, Massachusetts Council of Human Service Providers
National Advisory Board
www.nonprofitvote.org
Founded in 2005, Nonprofi t VOTE partners with America’s nonprofi ts
to help the people they serve participate and vote. We are the
leading source of nonpartisan resources to help nonprofi ts integrate
voter engagement into their ongoing activities and services.
2464 Massachusetts Avenue Suite 210, Cambridge MA 02140 617-357-8683
Harriet Barlow, Blue Mountain Center
Gary Bass, Bauman Family Foundation
Jeffrey Berry, Tufts University
Elizabeth Boris, Center on Nonprofi ts and Philanthropy
John Bridgeland, Civic Enterprises, LLC
Kari Dunn Saratovsky, KDS Strategies
Kathay Feng, California Common Cause
Seth Flaxman, Democracy Works / TurboVote
Cynthia M. Gibson, Cynthesis Consulting
Hon. Joan Growe, Former Secretary of State MN
Alexander Keyssar, Kennedy School of Government
Maria Teresa Kumar, Voto Latino
Kelly LeRoux, University of Illinois Chicago
Abby R. Levine, Alliance for Justice
Peter Levine, Tisch College of Citizenship, Tufts University
Daniella Levine Cava, Catalyst Miami
Dr. Michael McDonald, University of Florida
Michael McGrath, National Civic League
Norman Ornstein, American Enterprise Institute
Jon Pratt, Minnesota Council of Nonprofi ts
Miles Rapoport, Common Cause
Hon. Mark Ritchie, Former Secretary of State MN
Mark Rosenman, The Union Institute
Nancy Tate, League of Women Voters
Steven S. Taylor, United Way Worldwide
Tracy Westen, Center for Governmental Studies
1 Introduction
2 ExecutiveSummary
4 ComparingVoterTurnoutandDemographics:QuantitativeDataAnalysis
16 ExaminingTactics,ChallengesandSuccessFactors:QualitativeAnalysis
24 Appendices
Acknowledgements
We wish to thank The Ford Foundation, NEO Philanthropy, the George Gund Foundation, the Minneapolis
Foundation, the New York Community Trust, and our other supporters for their resources, guidance and
encouragement to produce this report. This evaluation was made possible by the dedication and active
participation of the 129 nonprofits (Appendix C) who conducted voter engagement activities and the state
and national nonprofit partners (Appendix B) who worked with them. Catalist and the Tools for All program of
State Voices provided invaluable help matching records of voters engaged by the nonprofits to state voter
files to obtain voting histories and demographics. We are deeply grateful to Kei Kawashima-Ginsberg
and her staff at the Center for Information and Research on Civic Learning and Engagement (CIRCLE) at
Tufts University for their assistance in the analysis of the voter turnout of voters contacted by the nonprofits
and survey research.
The report was prepared by Julian Johannesen, Director of Research and Training, George Pillsbury,
Senior Consultant and Lindsey Hodel, National Field Director.
Design: Robert Calmer, Adgraphics911.com
Contents

1
American democracy is challenged by wide gaps in voter participation tied to income, age, and other
factors. Those without a college degree, lower-income earners, newer citizens, and younger voters
are significantly less likely to vote than others. Debates on issues of equity and justice, the role of
government, and other matters are diminished when these voices are absent from the discussion.
While policy environs of states and the relative ease of voting clearly impact voter turnout, substantial
differences in turnout by demographic groups are present even in the most voter-friendly states. That’s
because these participation gaps, in part, reflect mobilization gaps. They follow significant disparities
in who is personally contacted about voting and who is not. In 2014, 55% of Latinos and 56% of Asian
Americans were not contacted about voting or registering to vote.1 Similar patterns hold for younger
and lower income populations.
As this report shows, nonprofit human service providers and community-based organizations are poised
to play a significant role in narrowing these troubling gaps in mobilization and participation. Taken
together, these organizations have personal contact with over 100 million people annually, including their
clients, staff, and local communities – the very same communities that have been passed over by other
mobilization efforts. Furthermore, when they engage the clients and communities they serve in voting
and elections, they can have a significant impact on voter turnout.
In order to narrow and ultimately close gaps in voter turnout, we must invest in the social infrastructure
and organizational tools necessary to ensure that all are meaningfully engaged in the democratic
process. We hope this report gives nonprofit leaders, and the foundations that support them, the hard
evidence they need to justify making that organizational commitment.
Brian Miller
Executive Director
Nonprofit VOTE
Introduction
1. Latino Decisions. “2014 Election Eve Poll,” 2014. Asian American Decisions. “2014 Election Eve Poll,” 2014.
2
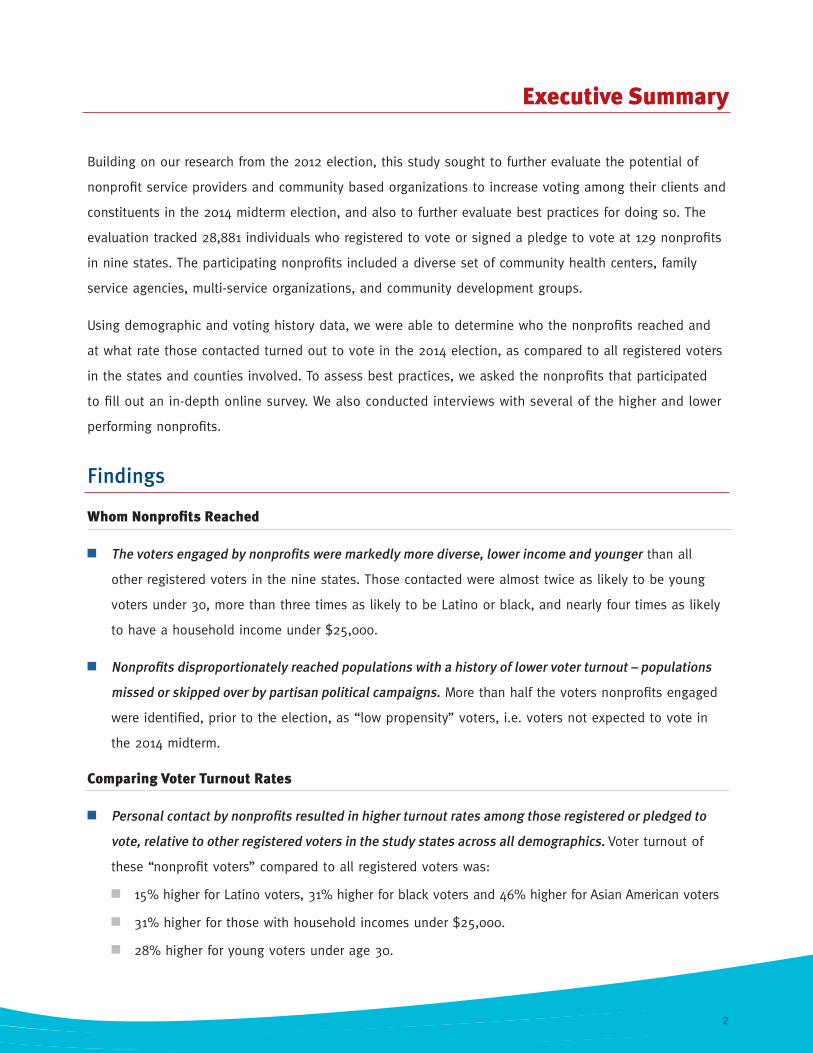
Building on our research from the 2012 election, this study sought to further evaluate the potential of
nonprofit service providers and community based organizations to increase voting among their clients and
constituents in the 2014 midterm election, and also to further evaluate best practices for doing so. The
evaluation tracked 28,881 individuals who registered to vote or signed a pledge to vote at 129 nonprofits
in nine states. The participating nonprofits included a diverse set of community health centers, family
service agencies, multi-service organizations, and community development groups.
Using demographic and voting history data, we were able to determine who the nonprofits reached and
at what rate those contacted turned out to vote in the 2014 election, as compared to all registered voters
in the states and counties involved. To assess best practices, we asked the nonprofits that participated
to fill out an in-depth online survey. We also conducted interviews with several of the higher and lower
performing nonprofits.
Findings
Whom Nonprofits Reached
The voters engaged by nonprofits were markedly more diverse, lower income and younger than all
other registered voters in the nine states. Those contacted were almost twice as likely to be young
voters under 30, more than three times as likely to be Latino or black, and nearly four times as likely
to have a household income under $25,000.
Nonprofits disproportionately reached populations with a history of lower voter turnout – populations
missed or skipped over by partisan political campaigns. More than half the voters nonprofits engaged
were identified, prior to the election, as “low propensity” voters, i.e. voters not expected to vote in
the 2014 midterm.
Comparing Voter Turnout Rates
Personal contact by nonprofits resulted in higher turnout rates among those registered or pledged to
vote, relative to other registered voters in the study states across all demographics. Voter turnout of
these “nonprofit voters” compared to all registered voters was:
15% higher for Latino voters, 31% higher for black voters and 46% higher for Asian American voters
31% higher for those with household incomes under $25,000.
28% higher for young voters under age 30.
Executive Summary

3
The intervention by nonprofits had its biggest impact on turnout of the least-likely voters – those that
campaigns typically disregard based on low “voter propensity” scores assigned before the election
to predict their likelihood to vote. The nonprofit voters with the lowest propensity scores were more
than twice as likely to cast ballots compared to their counterparts among all registered voters in
the study states.
Asking already registered voters to sign pledge to vote cards was a powerful tool to raise turnout among
voters who otherwise may not have participated in the midterm. In spite of demographic backgrounds
that indicated a low likelihood of voting in a non-presidential year, the average turnout for nonprofit
pledge card voters was 11 points higher than that of all registered voters (59% vs. 48%).
The turnout results mirrored those of the study by Nonprofit VOTE and CIRCLE of a similar cohort of
nonprofits and voters in the 2012 presidential election where the outreach of nonprofits resulted in
above average turnout rates across all demographics, most strikingly among young and low propensity
voters not expected to turn out.
Tactics and Success Factors
Nonprofits that collected the highest number of voter registrations and voter pledges –
Had a motivated staff that understood the connection of voter engagement to their mission and their
broader work serving and supporting clients. In the same vein, a lack of broad buy-in among all levels
of staff was cited by less successful organizations as the most common challenge.
Set goals and started earlier with planning and initiating voter engagement work, at least on a pilot
basis, in July and increasing efforts in August and September as the election got closer.
Collected the most registrations and pledges doing “active tabling” on a regular schedule at the agency,
as well as at events such as agency-sponsored farmers markets, health fairs, advocacy days or weeks,
and National Voter Registration Day – in addition to integrating it into targeted services.
Made sure their staff and volunteers were registered to vote as well.

4
Comparing Voter Turnout and DemographicsQuantitative Data Analysis
In this section, we analyze the demographic profiles and voting
histories of individuals who, with the assistance of nonprofit staff or
volunteers, either registered to vote or signed a pledge to vote in the
2014 general election. We then compare these “nonprofit voters” with
all other registered voters in the same states, examining turnout of
various demographic groups.1
The analysis seeks to answer the following questions:
Whom did our nonprofits reach? Do those who register to vote or
pledge to vote at a nonprofit or with the assistance of nonprofit
staff or volunteers differ substantially from other registered voters
by gender, age, race, income or propensity to vote?
Did nonprofit voters turn out to vote at rates comparable with other
registered voters? Do nonprofits have a particular impact on turnout
among specific constituencies?
More broadly, what do the answers to these questions tell us about
the potential of agency-based voter engagement to mobilize citizens
with a history of low turnout who are overlooked by traditional
campaigns?
Whom Nonprofits Reach
In short, the study reveals that nonprofits reach precisely those least likely to be contacted by political
campaigns and most in need of assistance and encouragement to vote. Compared to other registered voters
in the states and counties included in our analysis, nonprofit voters were much more likely to be young,
lower-income, recent citizens and newer to the political process. This is consistent with similar findings in
our 2012 study, “Can Nonprofits Increase Voting among Their Clients, Constituents, and Staff.”2
Definitions
Nonprofit Voters: These individuals were contacted by a nonprofit to register to vote or sign a pledge to vote and were registered to vote at the time of the 2014 general election. This term covers anyone who successfully completed a voter registration or pledge to vote with a nonprofit, regardless of whether they voted.
All Voters: This group is comprised of all registered voters in the states and counties in the study, both those who did and did not vote in 2014. In the case of demographic comparisons, “All Voters” refers to all registered voters in the study states and counties within that demographic.
Voter Turnout: In this report, voter turnout is the number of people who voted in the 2014 general election divided by the total number of registered voters.
2. Nonprofit VOTE. Can Nonprofits Increase Voting Among Their Clients, Constituents, and Staff? 2013.
5
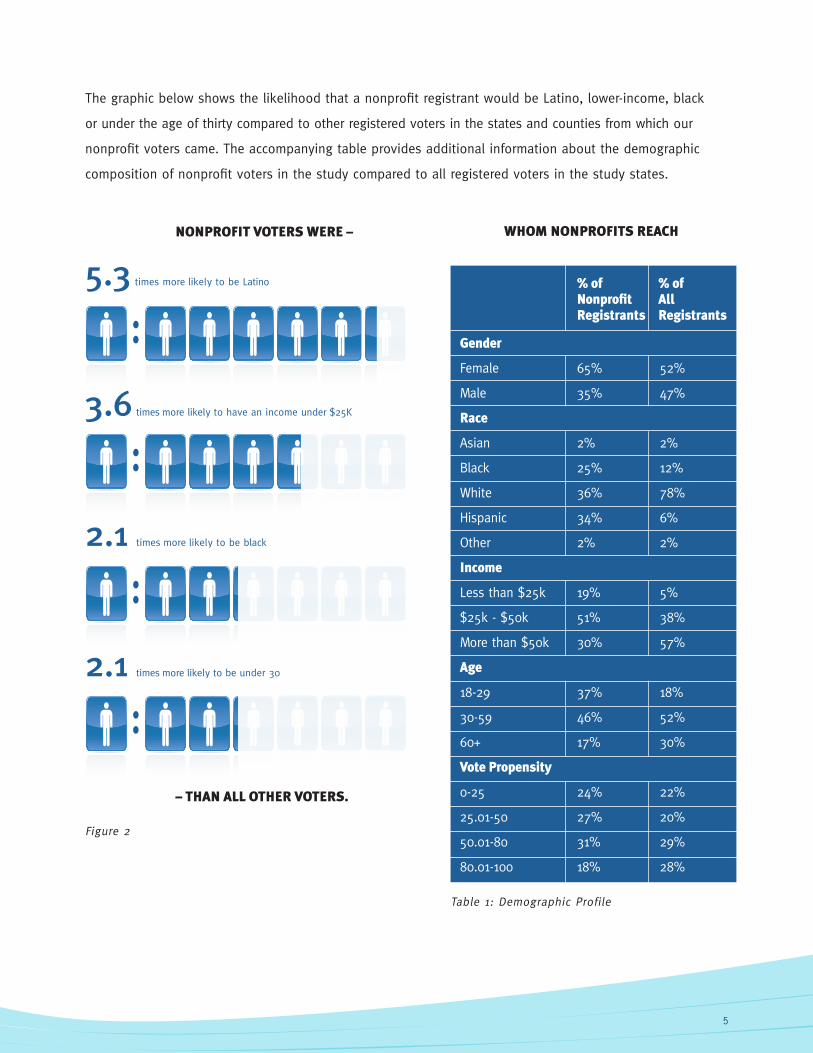
The graphic below shows the likelihood that a nonprofit registrant would be Latino, lower-income, black
or under the age of thirty compared to other registered voters in the states and counties from which our
nonprofit voters came. The accompanying table provides additional information about the demographic
composition of nonprofit voters in the study compared to all registered voters in the study states.
Table 1: Demographic Profile
Figure 2
WHOM NONPROFITS REACH
– THAN ALL OTHER VOTERS.
% of % of Nonprofit All Registrants Registrants
Gender
Female 65% 52%
Male 35% 47%
Race
Asian 2% 2%
Black 25% 12%
White 36% 78%
Hispanic 34% 6%
Other 2% 2%
Income
Less than $25k 19% 5%
$25k - $50k 51% 38%
More than $50k 30% 57%
Age
18-29 37% 18%
30-59 46% 52%
60+ 17% 30%
Vote Propensity Score
0-25 24% 22%
25.01-50 27% 20%
50.01-80 31% 29%
80.01-100 18% 28%
NONPROFIT VOTERS WERE –
5.3 times more likely to be Latino
3.6 times more likely to have an income under $25K
2.1 times more likely to be black
2.1 times more likely to be under 30
6
Comparing Voter Turnout
Nonprofit voters in the study turned out at increased rates when compared to other registered voters across
all demographic groups. This is in spite of the factors, discussed below, that would ordinarily lead one to
expect lower turnout in 2014 among those served by nonprofits.
By way of background, turnout in midterm election years is significantly lower than in presidential election
years. For example, turnout in the 2012 presidential election was 59%, compared to just 37% in the 2014
general election.3
Midterm elections are frequently lower visibility contests with less
meaningful political competition. In 2014 in particular, the large number
of races decided by wide margins provided little incentive to voters to
turn out on Election Day. In fact, the 2014 midterm featured the fewest
competitive races for Congressional seats in at least four decades.4
This leads to lower voter interest, less media coverage of the candidates
and campaigns, and limited and highly targeted voter registration and
get-out-the-vote efforts by candidates, the parties and other groups.5
Though these factors affect all voters, they have an outsized impact on populations that already vote at
lower rates – populations like those served by nonprofits.
As alluded to in the previous section, the study’s nonprofit voters come from populations that turn out to
vote at much lower rates than other groups. In the 2014 midterm election, for example, turnout among
AAPI and Latino voters was 19 percentage points behind that of non-Hispanic whites.6 Similarly large turnout
disparities exist by income, educational attainment, age, and length of residency in one’s home, with
lower-income, less educated, younger and more transient populations turning out at much lower rates than
higher-income, college educated, older and more established populations. Moreover, nonprofit voters often
fall into several of these categories, e.g. young Latinos earning less than $50,000 annually. In fact, 28%
of the study’s nonprofit voters were young Latinos with incomes under $50,000.
Thus in a context of lower voter enthusiasm, limited media coverage, little effort to get out the vote, and
lack of competition, all of which disproportionately impact those served by nonprofits, and coming from
groups that are already challenged by low turnout, the study’s nonprofit voters defied expectations by
turning out at rates higher than other voters across all demographics. In the sections below, we examine in
detail the increases in voter turnout seen by nonprofit voters, first by race and ethnicity, then income, age
and propensity to vote. We finish with a discussion of the implications of these findings.
3. Turnout figures are calculated as a percent of registered voters. 4. Cook Political Report. “2014 House Race Ratings,” November 3, 2014.5. Mark N. Franklin. Voter Turnout and the Dynamics of Electoral Competition in Established Democracies since 1945, 2004. and others.6. Nonprofit VOTE analysis of data from the U.S. Census Bureau’s Current Population Survey, “Voting and Registration in the Election of November 2014,” Table 4b. Note that these numbers refer to the percentage of voting age citizens who cast a ballot, not registered voters who cast a ballot.
Unweighted vs. Weighted Results
As in our 2012 report, the voter
turnout figures reported here
are unweighted for demographic
factors like age or ethnicity.
See Appendix A.
7
Turnout by Race and Ethnicity
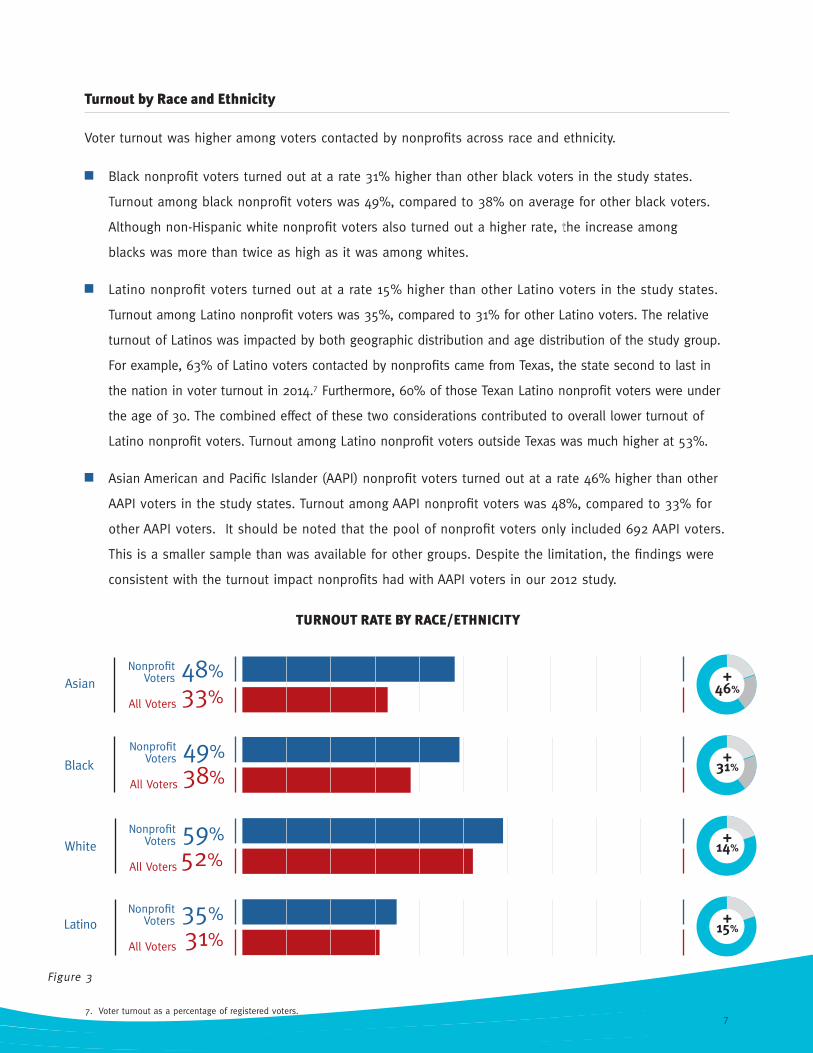
Voter turnout was higher among voters contacted by nonprofits across race and ethnicity.
Black nonprofit voters turned out at a rate 31% higher than other black voters in the study states.
Turnout among black nonprofit voters was 49%, compared to 38% on average for other black voters.
Although non-Hispanic white nonprofit voters also turned out a higher rate, the increase among
blacks was more than twice as high as it was among whites.
Latino nonprofit voters turned out at a rate 15% higher than other Latino voters in the study states.
Turnout among Latino nonprofit voters was 35%, compared to 31% for other Latino voters. The relative
turnout of Latinos was impacted by both geographic distribution and age distribution of the study group.
For example, 63% of Latino voters contacted by nonprofits came from Texas, the state second to last in
the nation in voter turnout in 2014.7 Furthermore, 60% of those Texan Latino nonprofit voters were under
the age of 30. The combined effect of these two considerations contributed to overall lower turnout of
Latino nonprofit voters. Turnout among Latino nonprofit voters outside Texas was much higher at 53%.
Asian American and Pacific Islander (AAPI) nonprofit voters turned out at a rate 46% higher than other
AAPI voters in the study states. Turnout among AAPI nonprofit voters was 48%, compared to 33% for
other AAPI voters. It should be noted that the pool of nonprofit voters only included 692 AAPI voters.
This is a smaller sample than was available for other groups. Despite the limitation, the findings were
consistent with the turnout impact nonprofits had with AAPI voters in our 2012 study.
7. Voter turnout as a percentage of registered voters.
TURNOUT RATE BY RACE/ETHNICITY
Black
White
Latino
Asian
Figure 3
48%33%
Nonprofit Voters
All Voters
49%38%
Nonprofit Voters
All Voters
59%52%
Nonprofit Voters
All Voters
35%31%
Nonprofit Voters
All Voters
+14%
+15%
+46%
+31%

8
Turnout by Income
Nonprofit voters outperformed other voters in the study states in each of our three income categories,
having the largest impact on the lowest-income voters.
The lowest-income nonprofit voters, those making less than $25,000 annually, saw the highest increase
in turnout compared to their counterparts among other voters in the study states. They turned out at a
rate 31% higher than other lowest-income voters in the study states. Turnout among the lowest-income
nonprofit voters was 39%, compared to 30% on average for other lowest-income voters.
The disparity in turnout between the highest and lowest-income earners shrank to a gap of only 16
points among nonprofit voters compared to a gap of 23 points among all registered voters.
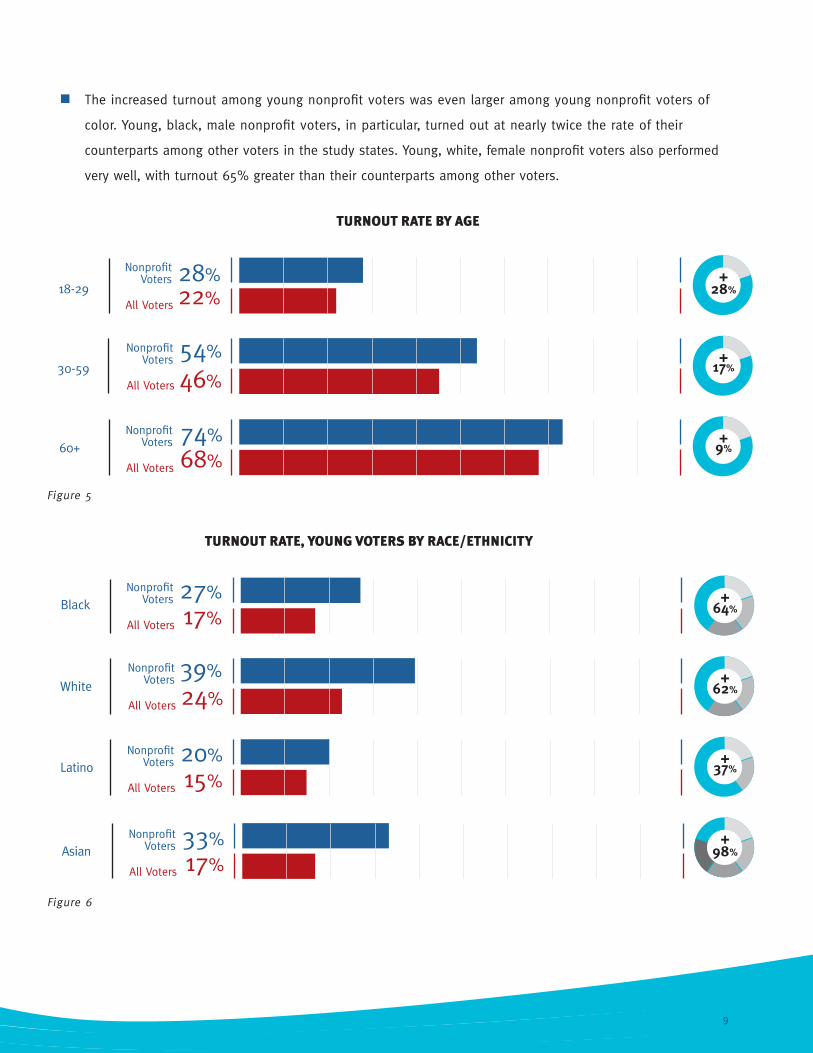
Turnout by Age
Of the three age categories, nonprofits had their largest impact on the turnout of young voters.
The youngest voters contacted by nonprofits, those under 30, saw the highest increase in turnout
compared to other young voters in the study states. They turned out at a rate 28% higher than their
counterparts. Turnout among young nonprofit voters was 28%, compared to 22% on average for
other young voters.
Nonprofit voters aged 30-59 and those over 60 also saw large increases in turnout compared to their
counterparts among other registered voters. This increase was 17% for those aged 30-59 and 9% for
those over 60. This speaks to both the need for and the value of voter engagement aimed at older
voters who receive services from nonprofits, who may be lower-income or otherwise deemed lower
propensity voters.
TURNOUT RATE BY INCOME
Less than$25k
$25k-$50k
More than$50k
Figure 4
39%30%
Nonprofit Voters
All Voters
46%43%
Nonprofit Voters
All Voters
55%53%
Nonprofit Voters
All Voters
+3%
+31%
+7%
9
Figure 6
TURNOUT RATE, YOUNG VOTERS BY RACE/ETHNICITY
White
Latino
Black27%17%
Nonprofit Voters
All Voters
39%
24%
Nonprofit Voters
All Voters
20%15%
Nonprofit Voters
All Voters
Asian33%17%
Nonprofit Voters
All Voters
+37%
+98%
+64%
+62%
18-29
30-59
60+
TURNOUT RATE BY AGE
Figure 5
28%22%
Nonprofit Voters
All Voters
54%
46%
Nonprofit Voters
All Voters
74%68%
Nonprofit Voters
All Voters
+9%
+28%
+17%
The increased turnout among young nonprofit voters was even larger among young nonprofit voters of
color. Young, black, male nonprofit voters, in particular, turned out at nearly twice the rate of their
counterparts among other voters in the study states. Young, white, female nonprofit voters also performed
very well, with turnout 65% greater than their counterparts among other voters.

10
Turnout by Propensity to Vote
Catalist, a major vendor of voting data, uses a proprietary model to assign every registered voter in the
country a “propensity score” between 0 and 100, with higher scores indicating greater propensity to vote in
a given election. Scores are calculated based on individual voting history and demographics, using information
from state voter files, the U.S. Census and commercial sources. Political campaigns use propensity scores
to target their get-out-the-vote efforts, avoiding a wide range of lower-propensity voters on the assumption
that their limited resources would be better spent on voters with higher (but not too high) scores. In the
2014 midterm campaigns focused on voters with propensity scores in the 50-80 range.
As in our 2012 evaluation, this study demonstrated face-to-face contact between nonprofit staff or volunteers
and voters leads to substantial increases in turnout, especially, among the lowest-propensity voters.
The intervention by nonprofits had its biggest impact on the lowest-propensity voters. Nonprofit voters
with scores under 25 were more than twice as likely to vote as their counterparts among other voters
in the study states. Turnout among these voters was 18%, compared to 8% for their counterparts – an
increase of 132%.
Nonprofit voters with propensity scores between 25 and 50 also turned out at a rate much higher than
their counterparts among other voters in the study states. Here the increase was 33%, with nonprofit
voters turning out at 35%, compared to 27% for their counterparts.
Propensity<25
Propensity26 – 50
TURNOUT RATE BY PROPENSITY TO VOTE
Figure 7
18%
8%
Nonprofit Voters
All Voters
35%
27%
Nonprofit Voters
All Voters
Propensity51 – 80
65%
57%
Nonprofit Voters
All Voters
Propensity81 – 100
90%
86%
Nonprofit Voters
All Voters
+14%
+4%
+132%
+33%

11
Using Pledge to Vote Cards to Increase Turnout among Already Registered Voters
About three out of five of the people nonprofits
contacted were already registered. These
individuals were asked to fill out a pledge to
vote card. Those who did so turned out at almost
twice the rate of the people nonprofits registered
to vote. Pledge to vote cards were particularly
effective at boosting the turnout rate of voters
rated least likely to vote in the 2014 midterm.
The first chart shows that nonprofit voters
who signed a pledge to vote turned out on
average 29 points higher than those who
nonprofit staff or volunteers helped register
to vote. The two likely strongest reasons for
the difference were demographic factors and
experience with voter engagement programs.
Those who were registered by nonprofits,
not surprisingly, were much younger.
Young voters are far less likely to vote,
particularly in a midterm. More than half (54%) of those registered were young voters under 30.
Whereas the large majority (74%) of those signing pledges where over 30.
Many voters who already registered have experience with the voting process and are inherently
more likely to vote.
VOTER TURNOUT BY PLEDGE AND REGISTRATION
59%
30%
Pledge to Vote
Voter Registration
Figure 8
T U E S D A Y
NOV. 4
IS ELECT ION
D A Y !
ALL REGISTERED VOTERS WILL BE SENT MAIL BALLOTS BEGINNING OCTOBER 15TH
TO VOTE IN PERSON OR DROP OFF YOUR BALLOT, FIND YOUR VOTER SERVICE CENTER & POLLING LOCATION
AT WWW.VOTE411.ORG
CALL 1-866-OUR-VOTE (687-8683) OR 1-888-VE-Y-VOTA (839-8682) IF YOU NEED HELP CASTING YOUR BALLOT ON ELECTION DAY.
First Middle Last
Street Address Apt. or Unit
City State Zip
Phone Number
Email Address
Type: Mobile Home Work( )
ALL REGISTERED VOTERS WILL BE SENT MAIL BALLOTS BEGINNING OCTOBER 15TH
I
P
L
E
D
G
E
T
O
VOTE
NOVEMBER 4
E
D
G
E
T
O
Visit www.govotecolorado.com
to:• Check your registration • Find a ballot drop off location • Other voting assistance

12
The second chart shows that nonprofit voters who signed a pledge to vote turned out to vote at
higher rates than other registered voters. In particular, pledge signers in the lowest propensity range
– those with a propensity score under 25 – showed a 144% increase in turnout compared to other
registered voters in the same range. Pledge signers in the 25–50 propensity range saw an increase of
53% compared to other registered voters in that range. The effect was still present in the two higher
propensity ranges, though to a lesser degree. The dramatic increase in turnout among those least
expected to vote is a promising finding. These lowest propensity voters would not have been reached
about voting, were it not for the intervention of a trusted nonprofit messenger. And while it is
difficult to identify exactly what accounts for the increase, it is fair to say that intervention by a
nonprofit was a significant factor.
TURNOUT RATE BY PROPENSITY TO VOTE FOR PLEDGESNonprofit Registrants Who Pledged to Vote vs. Other Registrants
Figure 9
Propensity<25
Propensity26 – 50
19%
8%
Pledged to Vote
All Other Registrants
41%
27%
Pledged to Vote
All Other Registrants
Propensity51 – 80
67%
57%
Pledged to Vote
All Other Registrants
Propensity81 – 100
90%
86%
Pledged to Vote
All Other Registrants
+18%
+5%
+144%
+53%
13
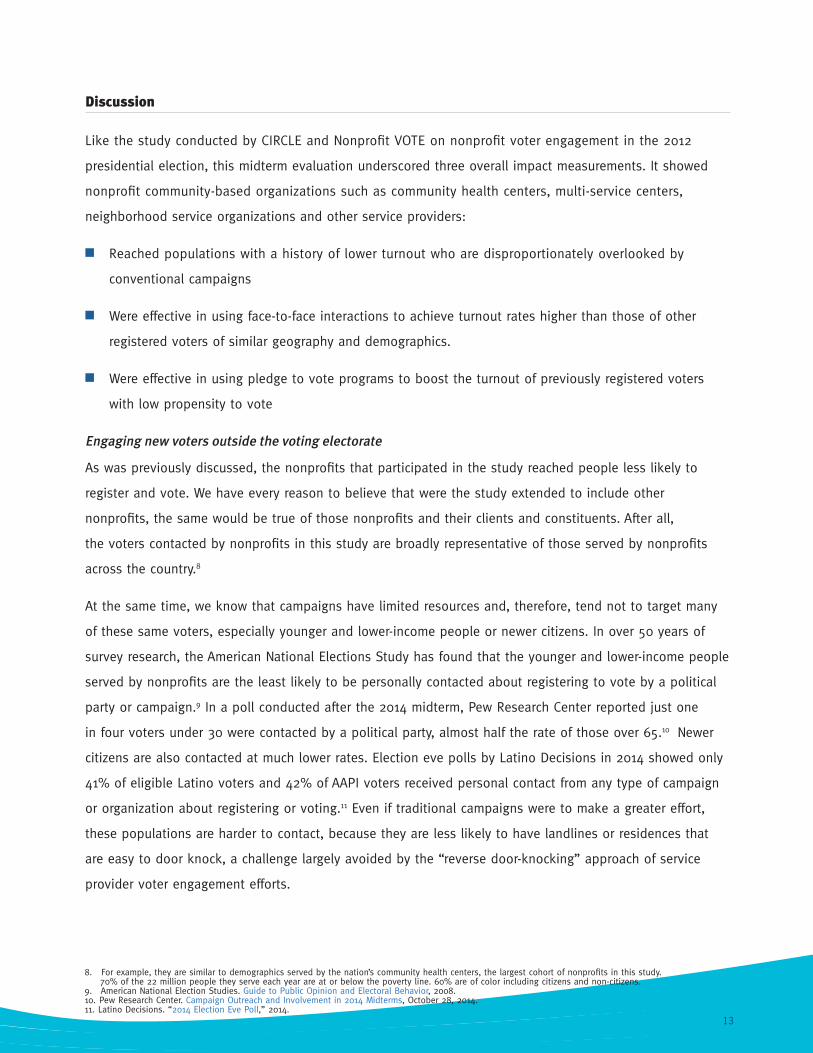
Discussion
Like the study conducted by CIRCLE and Nonprofit VOTE on nonprofit voter engagement in the 2012
presidential election, this midterm evaluation underscored three overall impact measurements. It showed
nonprofit community-based organizations such as community health centers, multi-service centers,
neighborhood service organizations and other service providers:
Reached populations with a history of lower turnout who are disproportionately overlooked by
conventional campaigns
Were effective in using face-to-face interactions to achieve turnout rates higher than those of other
registered voters of similar geography and demographics.
Were effective in using pledge to vote programs to boost the turnout of previously registered voters
with low propensity to vote
Engaging new voters outside the voting electorate
As was previously discussed, the nonprofits that participated in the study reached people less likely to
register and vote. We have every reason to believe that were the study extended to include other
nonprofits, the same would be true of those nonprofits and their clients and constituents. After all,
the voters contacted by nonprofits in this study are broadly representative of those served by nonprofits
across the country.8
At the same time, we know that campaigns have limited resources and, therefore, tend not to target many
of these same voters, especially younger and lower-income people or newer citizens. In over 50 years of
survey research, the American National Elections Study has found that the younger and lower-income people
served by nonprofits are the least likely to be personally contacted about registering to vote by a political
party or campaign.9 In a poll conducted after the 2014 midterm, Pew Research Center reported just one
in four voters under 30 were contacted by a political party, almost half the rate of those over 65.10 Newer
citizens are also contacted at much lower rates. Election eve polls by Latino Decisions in 2014 showed only
41% of eligible Latino voters and 42% of AAPI voters received personal contact from any type of campaign
or organization about registering or voting.11 Even if traditional campaigns were to make a greater effort,
these populations are harder to contact, because they are less likely to have landlines or residences that
are easy to door knock, a challenge largely avoided by the “reverse door-knocking” approach of service
provider voter engagement efforts.
8. For example, they are similar to demographics served by the nation’s community health centers, the largest cohort of nonprofits in this study. 70% of the 22 million people they serve each year are at or below the poverty line. 60% are of color including citizens and non-citizens. 9. American National Election Studies. Guide to Public Opinion and Electoral Behavior, 2008. 10. Pew Research Center. Campaign Outreach and Involvement in 2014 Midterms, October 28, 2014.11. Latino Decisions. “2014 Election Eve Poll,” 2014.
14
Achieving above average turnout rates in a midterm
Everyone contacted by a nonprofit had a face-to-face conversation with someone they knew or someone
from their community – be it a staff member, volunteer or trained canvasser brought in to help with
nonpartisan voter outreach. This inherently yields higher turnout rates. Among all mobilization factors
influencing voter turnout, the most powerful for voter or other civic outreach is personal contact by a
trusted messenger.12 This finding was evident in this study as well, where the turnout boost was strongest
among newer voters and those least expected to participate. The lowest-propensity voters showed the
greatest gains in voter turnout. In fact, nonprofit voters with a Catalist propensity score under 25 were
more than twice as likely to vote as their counterparts outside of the study.
Turnout rates were achieved with more limited and less formal get out the vote programs, reinforcing the
mobilization power of the initial engagement by a trusted messenger at a community based agency in the lead
up to an election.13 A separate analysis found a similar boost in turnout rates of voters contacted on National
Voter Registration Day, a national civic event similarly carried out in local communities and peer-driven.14
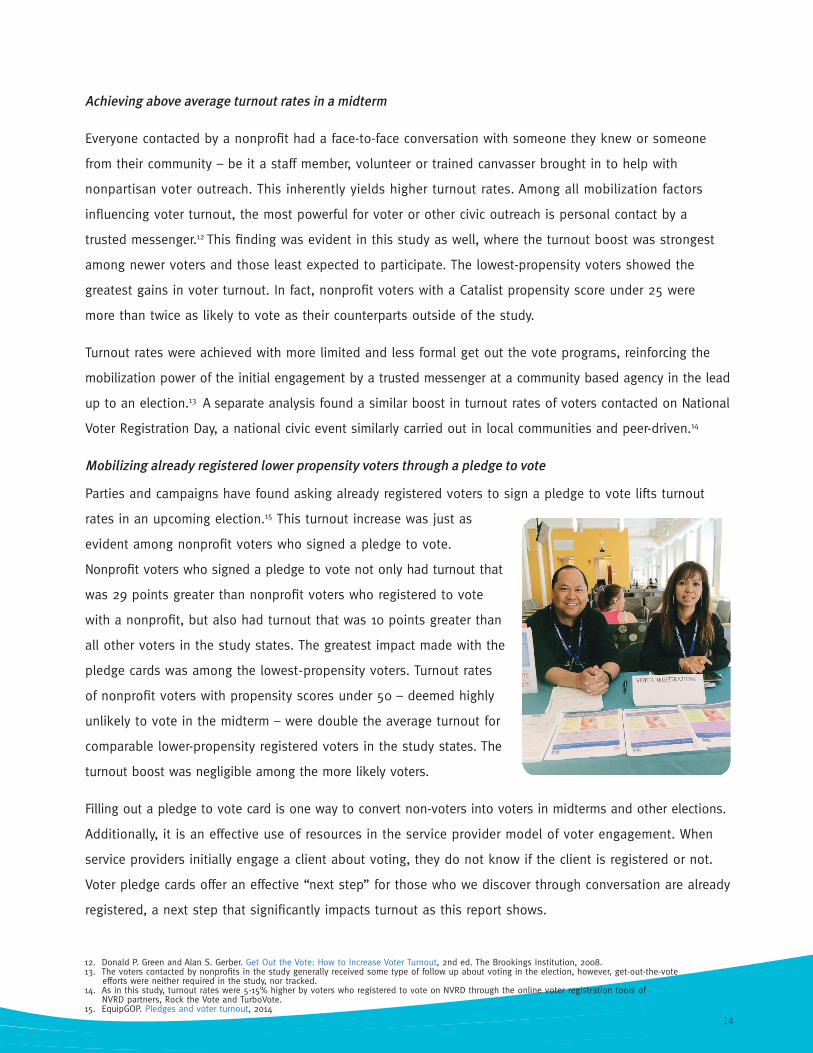
Mobilizing already registered lower propensity voters through a pledge to vote
Parties and campaigns have found asking already registered voters to sign a pledge to vote lifts turnout
rates in an upcoming election.15 This turnout increase was just as
evident among nonprofit voters who signed a pledge to vote.
Nonprofit voters who signed a pledge to vote not only had turnout that
was 29 points greater than nonprofit voters who registered to vote
with a nonprofit, but also had turnout that was 10 points greater than
all other voters in the study states. The greatest impact made with the
pledge cards was among the lowest-propensity voters. Turnout rates
of nonprofit voters with propensity scores under 50 – deemed highly
unlikely to vote in the midterm – were double the average turnout for
comparable lower-propensity registered voters in the study states. The
turnout boost was negligible among the more likely voters.
Filling out a pledge to vote card is one way to convert non-voters into voters in midterms and other elections.
Additionally, it is an effective use of resources in the service provider model of voter engagement. When
service providers initially engage a client about voting, they do not know if the client is registered or not.
Voter pledge cards offer an effective “next step” for those who we discover through conversation are already
registered, a next step that significantly impacts turnout as this report shows.
12. Donald P. Green and Alan S. Gerber. Get Out the Vote: How to Increase Voter Turnout, 2nd ed. The Brookings Institution, 2008.13. The voters contacted by nonprofits in the study generally received some type of follow up about voting in the election, however, get-out-the-vote efforts were neither required in the study, nor tracked.14. As in this study, turnout rates were 5-15% higher by voters who registered to vote on NVRD through the online voter registration tools of NVRD partners, Rock the Vote and TurboVote.15. EquipGOP. Pledges and voter turnout, 2014
15
Conclusion
On the 50th Anniversary of the Voting Rights Act, we are reminded of the importance that election laws and
voter education have on the ability and likelihood of eligible citizens to vote. However, voter mobilization,
as the President noted in talking about the 50th Anniversary, will always be critical to ensuring broad
participation in the democratic process. Significant gaps in voter turnout along the lines of income, age,
and race exist even in the most voter-friendly states. To truly close these gaps in participation and ensure a
robust democracy where all are represented, we must build the social infrastructure for election mobilization,
especially among populations with a history of low turnout. That is the only way to ensure that all
Americans are engaged in this central act of democracy: voting.
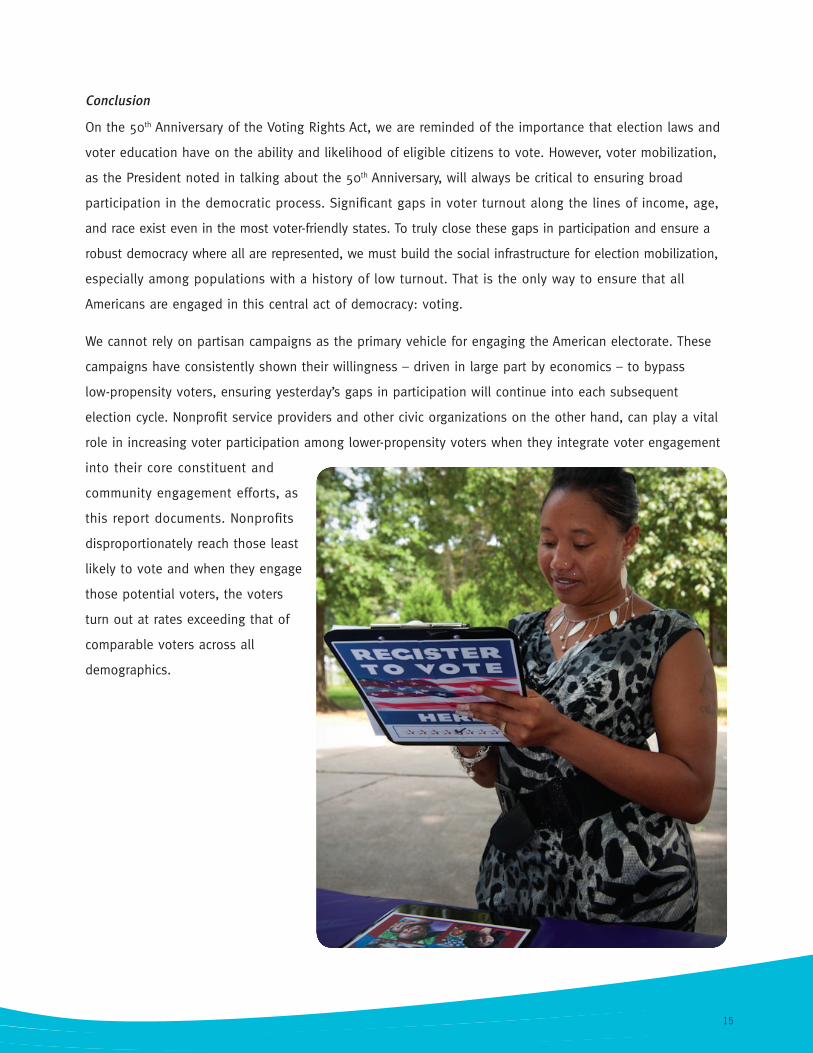
We cannot rely on partisan campaigns as the primary vehicle for engaging the American electorate. These
campaigns have consistently shown their willingness – driven in large part by economics – to bypass
low-propensity voters, ensuring yesterday’s gaps in participation will continue into each subsequent
election cycle. Nonprofit service providers and other civic organizations on the other hand, can play a vital
role in increasing voter participation among lower-propensity voters when they integrate voter engagement
into their core constituent and
community engagement efforts, as
this report documents. Nonprofits
disproportionately reach those least
likely to vote and when they engage
those potential voters, the voters
turn out at rates exceeding that of
comparable voters across all
demographics.

16
Examining Tactics, Challenges and Success FactorsQualitative Analysis
Nonprofit VOTE was in the field six weeks after the November 2014 elections to collect qualitative
information from participating agency staff, volunteers, and leaders on the tactics, challenges and success
factors in their voter outreach activities.
Our research partner, CIRCLE at Tufts University, administered an online survey to lead staff of 109 of
the agencies collecting data for the study. Eighty-six agencies or 79% completed the online survey. The
survey results were enhanced with field interviews with the state partners who coordinated the work
of the participating agencies in their state or metro area.
The analysis also took into account the difference between groups who were successful – i.e. came close
to or exceeded their goal of collecting at least 250 voter registrations and voter pledges – compared to
those who fell well short of these goals
Key Findings
Key Finding #1: Staffing Success
Enthusiasm from senior leadership as well as broader agency staff buy-in was the single most noted
contributor to agencies’ success. Four considerations for staffing emerged as critical for successfully
implementing voter engagement programs:
Leadership and support from the CEO or Executive Director and senior staff was reported as a “major
factor” contributing to success among the majority of participating agencies.
A voter engagement coordinator assigned to lead the activities, coordinate training opportunities,
collect forms and supply materials was a staffing strategy commonly implemented among successful
agencies. This was particularly helpful for coordinating voter engagement efforts across multiple sites
or departments.
Program staff and volunteers most commonly spoke to clients and individuals about voting within their
agency. Ninety-six percent of high performers engaged program staff in voter engagement activities.
On the other hand, a lack of enthusiasm or buy-in from the front-line staff was a key challenge. It’s
important to recognize the limitations of relying on busy and often less motivated and experienced
front-line staff for taking on voter engagement. However, both training and knowing that it’s an
expectation from the agency CEO and senior staff can make a difference.

17
Key Finding #2: Importance of Effective Training
All respondents reported receiving some level of support through in-person training sessions, check in
calls and site visits, and free materials. Training topics included information on state and local voting
procedures, tips on “making the ask”, responses to common questions, and active tabling.
Almost all respondents, 99%, reported the training they received was adequate.
The most successful organizations were 1.6 times more likely to have received “a lot” of support from a
state partner – a local or state-based organization with voter engagement expertise.
However, only two-thirds of participants responded
their staff felt “very comfortable” helping voters with
pledge and registration forms. This indicates more
education is needed among staff handling voter
registration forms and pledge cards, namely,
front-line program staff and volunteers. Indeed,
several coordinators with community health centers
noted the majority of participating staff were new
to voter engagement efforts and had lower levels of
knowledge about the voting process.
Key Finding #3: Starting Early and Increasing Efforts in Last 6–8 Weeks
Successful organizations started early, hands down. 72% of organizations that met their voter
engagement goals reported starting their voter engagement activities in July, with planning often
beginning in June or earlier. Organizations that started activities later in the cycle were not as likely
to meet their goals.
80% of respondents said they garnered the most registrations and pledges in the months of
September and October. (See Table 2, page 19)
Most organizations collected registrations and pledges up through their state’s registration deadline.
While some continued doing voter pledges after the registration deadline, the majority switched their
focus to voter education and get out the vote.

18
AACT Now
Texas has a long history
of low voter turnout, and
nowhere is this more evident
than in the Rio Grande Valley. Traditional political
campaigns have done little to improve the
situation, a challenge the Advocacy Alliance Center
of Texas (AACT Now) started in 2011 to address.
Using a community-based, nonpartisan approach,
AACT partnered with local media outlets,
community groups, hospitals, businesses,
schools, and county election boards in an effort
to empower voters in south Texas. In the Valley’s
Hidalgo, Cameron and Starr counties, it provides
a support network for organizations seeking to
register, mobilize and engage new voters. In the
2012 and 2014 elections, AACT’s work pushed
turnout growth in the region to among the
highest growth in the state.
AACT has a special focus on youth. Working with
local independent school districts, it created a
curriculum called “Advocating Awareness through
the Collaboration of Teachers.” With buy-in from
superintendents, the curriculum has been
implemented by high school government teachers
in the counties’ schools. As result, last year
AACT registered more than 4,000 students and
another ten thousand through its other partners.
AACT builds off of circles of influence, whether
through the workplace, at school, or at home.
For example, their “Touch 10 Card” encourages
individuals to see if they can refer ten people to
AACT to register or receive information about
the election. AACT capitalizes on the fact that
personal contact from someone you already
know is a powerful motivator.
How does AACT compare to other civic
engagement efforts around the country? Last
year they ranked number one in the country
among the one thousand local groups
participating on National Voter Registration Day,
registering 4,521 voters in a single day.
“Given the history of low turnout in our region,
and knowing how important civic participation is
in shaping public policy, holding office holders
accountable, and so on, our partners were very
motivated to do this work,” says the group’s
director, Alberto Morales. “Their enthusiasm
from the CEO down to the front line workers and
back up again made them powerful and effective
advocates for civic engagement.”
PROFILE
THINK BIG
AA
CT LOCAL
THINK BIG
AA
CT LOCAL
I, pledge to vote in the upcoming
election becauseI care about:
Entity:
JobsHealthcareEducationVeteransEconomy
Immigration
AdVOCACy ALLIANCECENTEr Of TExAs
612 Nolana Ave, Suite 430,McAllen, Texas 78504
Tel: (956) 664-AACT
fax: (956) 664-2231
Toll free: 1-855-411-AACT
www.aactnow.org
This Card Belongs To:
(Name)
Name: _________________________________________________
Address: _______________________________________________
Cell Phone: ____________________________________________
E-mail: ________________________________________________
Disclaimer: All information given will be used for the purposes of The Advocacy Alliance Center of Texas’ GOTV efforts. Any information submitted will be kept confidential and will not be sold or distributed to any 3rd party.

19
Key Finding #4: Tabling at Agency or Events the Most Successful Tactic
The nonprofits had their most success tabling at or around their agency or at an event sponsored by
themselves or a community partner.
79% had success tabling at events and 69% tabling in a lobby or in or around their location. Success
ratings for tabling jumped to 94% and 79% respectively for the higher performers. This could be
explained by higher performers being more skilled at “active tabling” – using a table as base but using
clipboards to move around and more actively pursue registrations and pledges in the room or area.
While integrating voter engagement into services had some success, it was lower. Only seven percent
of high performers called this tactic “very successful” while 53% did rate it “somewhat successful.”
In other words, integrating voter engagement into services is worth doing, but should be combined with
the tabling activities described above.
WHERE WERE YOU MOST SUCCESSFUL?
Figure 10
47% Not Successful
53% Successful
Table 2
IN WHAT MONTH DID YOU START YOUR ACTIVITIES?
July Aug. Sept.
High Performers 72% 11% 17%
Low Performers 28% 61% 11%Canvassing Your
Community
43% Not Successful
58% Successful
During Services or
Intake
Tabling at Your Agency At an Event
31% Not Successful
69% Successful
21% Not Successful
79% Successful
20
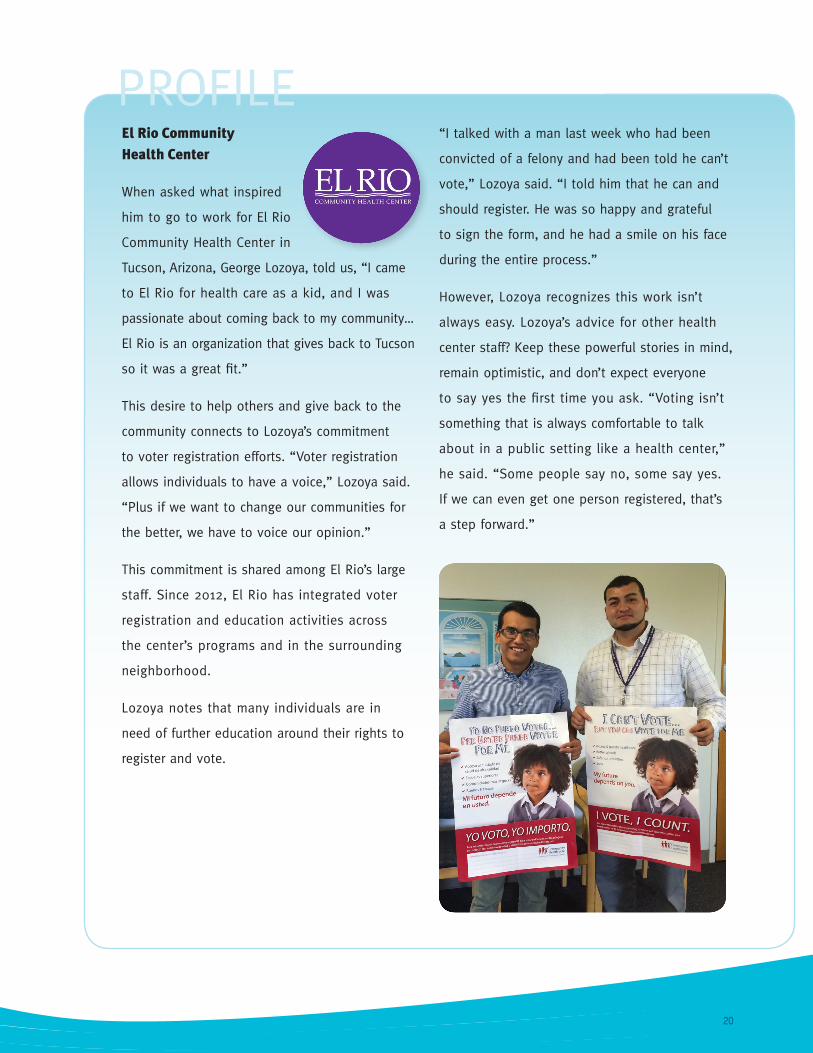
El Rio Community Health Center
When asked what inspired
him to go to work for El Rio
Community Health Center in
Tucson, Arizona, George Lozoya, told us, “I came
to El Rio for health care as a kid, and I was
passionate about coming back to my community…
El Rio is an organization that gives back to Tucson
so it was a great fit.”
This desire to help others and give back to the
community connects to Lozoya’s commitment
to voter registration efforts. “Voter registration
allows individuals to have a voice,” Lozoya said.
“Plus if we want to change our communities for
the better, we have to voice our opinion.”
This commitment is shared among El Rio’s large
staff. Since 2012, El Rio has integrated voter
registration and education activities across
the center’s programs and in the surrounding
neighborhood.
Lozoya notes that many individuals are in
need of further education around their rights to
register and vote.
“I talked with a man last week who had been
convicted of a felony and had been told he can’t
vote,” Lozoya said. “I told him that he can and
should register. He was so happy and grateful
to sign the form, and he had a smile on his face
during the entire process.”
However, Lozoya recognizes this work isn’t
always easy. Lozoya’s advice for other health
center staff? Keep these powerful stories in mind,
remain optimistic, and don’t expect everyone
to say yes the first time you ask. “Voting isn’t
something that is always comfortable to talk
about in a public setting like a health center,”
he said. “Some people say no, some say yes.
If we can even get one person registered, that’s
a step forward.”
PROFILE
21
Key Finding #5: Establishing Effective Partnerships
The majority of participants cited partnerships with other nonpartisan civic and voter engagement
organizations who provided guidance, support and training as a success factor.
High performers were more likely to value partnerships as a top success factor.
Most respondents cited the assistance received from their state partner who signed them up for the
project or a local Board of Election. Others cited a church, another nonprofit partner, or a community
coalition made up of others conducting nonpartisan voter activities.
Key Finding #6: Organizational Culture Matters
Survey results demonstrate frequent previous advocacy and voter engagement activity among
participating agencies. A majority (85 percent) of the participating organizations had previous voter
engagement experience including voter outreach, sponsoring candidate forums, or working on ballot
measures. Two-thirds had previous issue advocacy experience.
This finding reflects a successful and common recruitment strategy among the coordinating state
partners, inviting previous participating agencies to again participate in 2014.
The success with recruiting existing partners with previous advocacy and election experience points
to one aspect of the program’s long-term impact. This implies that despite challenges, agencies that
participated in the past saw the value of continuing voter engagement work and had positive enough
experiences to join the program again.
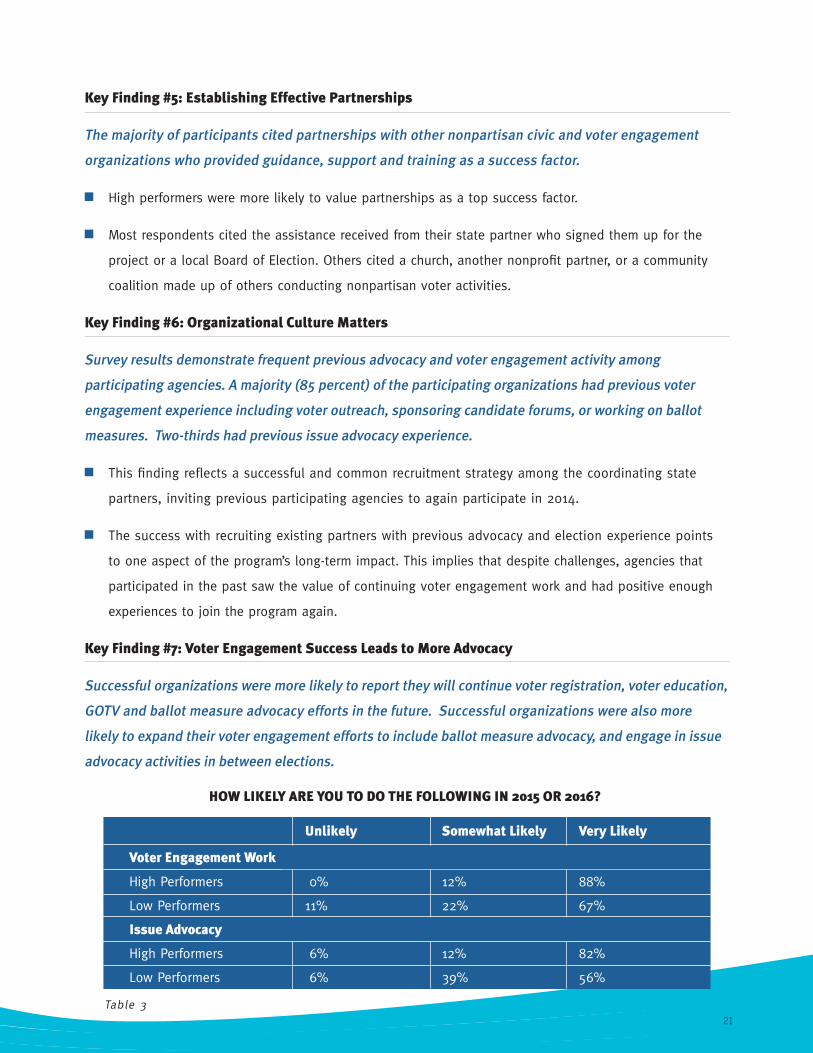
Key Finding #7: Voter Engagement Success Leads to More Advocacy
Successful organizations were more likely to report they will continue voter registration, voter education,
GOTV and ballot measure advocacy efforts in the future. Successful organizations were also more
likely to expand their voter engagement efforts to include ballot measure advocacy, and engage in issue
advocacy activities in between elections.
HOW LIKELY ARE YOU TO DO THE FOLLOWING IN 2015 OR 2016?
Unlikely Somewhat Likely Very Likely
Voter Engagement Work
High Performers 0% 12% 88%
Low Performers 11% 22% 67%
Issue Advocacy
High Performers 6% 12% 82%
Low Performers 6% 39% 56%
Table 3

22
Other Success Factors
Beyond the data in the surveys, the one success factor that emerged anecdotally in interviews was the
importance of a motivating election such as a relatively high visibility race or ballot measure that was
competitive. Or, in the case of ballot measures on which nonprofits can take sides, an outcome that was
important to the nonprofit was also highly motivating. High visibility races or ballot measures can motivate
staff doing voter engagement and potential voters alike. Another motivating issue among new or lower
propensity voters often is the presence of a candidate known to the community or who shares the
background of the community being mobilized.
However, some of the most successful nonprofits were located in states like Texas or Ohio that lacked a
marquee race in 2014. This speaks to the importance of the mobilization capacity, experience and skills of
agencies cited above.
Summary
The most important success factor for the highest
performing agencies was a motivated staff that
understood the connection of voter engagement to
their mission and their broader work serving and
supporting clients. In the same vein, a lack of broad
buy-in among all levels of staff was cited as the
most common challenge. It suggests that much can be
done in between elections to help staff of nonprofits
understand the importance of voter engagement,
and gain skills in voter registration, education, and
get-out-the-vote conversations.
The higher performers started earlier and didn’t wait
until late August or September. They had a plan and
began voter engagement work – at least on a pilot
basis – in July and increased efforts as the election got
closer. They garnered most of their registrations and
pledges doing active and regular tabling at the agency,
at events and in the local community – beyond any
additional effort to engage voters during services.
23
More research can be done on ways to address challenges to integrating voter engagement conversations into
ongoing program delivery, such as enrollment in public services like Medicaid and WIC. This research is
particularly relevant for larger community health centers that enroll many patients into these programs annually.
Nonprofit service providers can engage voters through registration and voter pledge efforts, but have less
capacity closer to the election for traditional get-out-the-vote activities. More research is needed on effective
“GOTV” tactics to encourage voting that are suitable for nonprofit agencies like the ones that participated
in this study. Traditional phone banking and canvassing efforts often pose challenges for agencies not
specifically created to do this kind of work. Future research could help to address this question and provide
lower-cost, sustainable tactics for educating and turning out voters agencies engage whether partnering with
another nonprofit to do so or doing it themselves – in particular in local “off-year” elections and midterm
elections when nonpartisan voter turnout efforts are most impactful.

24
Nonprofit Partners and Participants
Nonprofit VOTE partners in nine states recruited 109 local nonprofit service providers and community-
based organizations to participate in the study. An additional 20 nonprofits in 12 other states tracked
voter engagement data and participated in the post-election survey. The study measured the impact
of nonprofits on voter turnout of those typically not reached by conventional campaigns and least
expected to vote in the 2014 midterm.
The state partners were state or regional nonprofit networks such as the North Carolina Center for
Nonprofits and Neighborhood Centers, Inc. of Houston who worked on policy or civic engagement issues
affecting their nonprofits and their communities. The demographic compositions of the nine states were
similar to those nationally. The study includes both high turnout (Minnesota, Colorado) and low turnout
(Texas, New York) states.1 The local nonprofits
who conducted the voter outreach were a cross
section of service providers and community-
based organizations from health centers to
multi-service centers or community development
organizations. In the case of the Advocacy
Alliance of Texas (AACT), in south Texas, their
site based voter outreach also included voter
engagement at local high schools, hospitals
and businesses as well as local nonprofits.
(See list of participants in Appendix C).
Each participant agreed to a goal of engaging at least 250 of their clients or constituents through voter
registration or, if already registered, through filling out a pledge to vote card for the November election.
Nonprofits received a small partnership stipend of $1,000 for participating. In return, partners were required
to track voter registration and pledge to vote data and participate in a post-election survey on their activities.
1. Nonprofit VOTE. America Goes to the Polls 2014: A Report on Voter Turnout in the 2014 Midterm Election, 2015. In 2014 Colorado, Minnesota, New York and Texas ranked 3rd, 5th, 49th and 50th in voter turnout of eligible voters, respectively.
Appendix AMethodology

25
The study did not have a specific get-out-the-vote component following up with the people who registered
or signed a pledge. Many of those people likely received at least one communication reminding them to vote
from one source or another. The voter turnout results in this study only measure the possible impact of
nonprofits engaging harder to reach populations through a voter registration or voter pledge ask.
Quantitative Analysis: Assessing demographic composition and voter turnout
The name, voting address and, if available, phone number of everyone who registered or signed a pledge to
vote was recorded in a database for evaluation purposes.
To obtain the demographic backgrounds of voters contacted by the program and to find out whether they
voted in the 2014 election, we matched their names and addresses to their state voter file maintained in the
Catalist database.2 Catalist is a national data management firm specializing in state-level political data. Catalist
obtains monthly updates of state voter files from election officials. The voter file lists the name of every
registered voter in the state, their voting and mailing address, age, voting history, and political jurisdictions.3
Catalist enhances the voter file with information on gender, race/ethnicity, estimated household income and
other demographic data taken from voter registration forms or from government and commercial sources.
Only valid matches who were listed as active registered voters eligible to vote in the 2014 election,
according to the Catalist database, were included in our final tally of voters contacted. 81% of the 35,766
records submitted by participating nonprofits in the nine study states were successfully matched. Failure
to match a record was most frequently due to incomplete address information, misspelled names and
addresses, or mistakes made during data entry. Many voters had moved, changed names, or were dropped
from their state voter file between the time they were contacted and when the match took place, six months
after the election when states had updated their voter files with who voted in the 2014 election.
Comparison Dataset
For comparison data, CIRCLE obtained counts and turnout rates from the Catalist
database of all registered voters in the nine states broken down by the same
demographics of gender, age, race/ethnicity and income. In Texas and New York, because of state size and
regional focus of nonprofits in specific counties, we only used comparison data from the counties we worked
in. In each state or county, voter turnout, as reported by Catalist, matched closely with turnout, as reported
by state election officials. The advantage of the Catalist data is that it provides demographic information
about voters and Catalist’s own voter propensity score, not available from state election offices.4
2. The match was performed with the assistance of State Voices, whose state affiliates manage state voter files based on Catalist data. 3. States covered by Section 5 of the Voting Rights Act also have the race/ethnicity of the voter as part of their voter registration process. 4. A voter propensity score is a score assigned to each voter in advance of an election indicating the person’s likelihood of voting in that election, based on past voting history, demographics and other factors.
26
Qualitative Analysis: Examining tactics, challenges and success factors
With the goal of learning more about the tactics used and specific success factors and challenges nonprofits
face when doing voter engagement work, CIRCLE distributed an online survey to the 129 nonprofit
participants. It included 36 yes/no or multiple choice questions. Several questions asked the nonprofit to
rank on a scale of 1-5 the relative impact of a key voter engagement factor or success of a tactic used.
79% of the nonprofits completed the survey. CIRCLE provided technical assistance in analyzing the results
reported in the qualitative section on (page 16). CIRCLE provided an analysis of all responses together
and a separate analysis comparing high and low performers.5
The results were further informed by responses from standardized interviews conducted by Nonprofit
VOTE staff with 10 community health centers who participated in the study but who were not sent the
online survey.
Weighting Data and Demographic Factors
Weighting is a research methodology used to compensate for the over- or under-representation of various
demographic groups within a sample. In this report, we chose to present the analysis in its unaltered form
without weighting. As such, our sample of nonprofit voters sometimes differs from the comparison group of
other registered voters in the same states, though impact is usually modest.
One place where this difference is pronounced is within the Latino sample. The Latino voters contact by
nonprofits were disproportionately young and mostly from Texas. 46% of Latino voters contacted by
nonprofits were under 30, compared to just 24% of Latinos voters in the comparison states. Younger voters
have, even with mobilization, comparatively much lower voter turnout rates. According to the US Census,
in the last five midterm elections, citizen, voting eligible 18-29 years olds turned out to vote on average
at a rate 29 percentage points lower than voters 30 and above.6, 7 Additionally, 63% of Latino nonprofit
voters came from Texas, a state that is perennially last among states in voter turnout.8
While turnout among Latino nonprofit voters was 15% higher than other registered Latinos, if weighted
by age and location, turnout among Latino nonprofit voters would have been even higher relative to
Latinos in general. However, using weighted data would not have fundamentally changed the core message
of this report: Nonprofit voters would still have voted at higher rates than comparable voters across
all demographic groupings. The only difference would have been the size of the increase. Nonprofit VOTE
will assess the impact of weighting data by demographics and other factors in future research.
5. Highest performers collected more than 200 voter registrations and pledges. Lowest performers collected at least 40 but less than 90 VRs and VPs indicating an effort was made but fell short of initial goals of 250.6. Nonprofit VOTE analysis of data from the U.S. Census Bureau’s Current Population Survey, Voting and Registration Supplements 1998 - 2014.7. For more, see Nonprofit VOTE’s series of reports on voter turnout disparities between demographic groups. 8. Nonprofit VOTE. America Goes to the Polls 2014: A Report on Voter Turnout in the 2014 Midterm Election, 2015. Texas was second to last. The rankings include the District of Columbia. Perennially at the bottom of state rankings, Texas voter turnout is low due to its cumbersome voter registration system, history of noncompetitive elections, high percentage of lower turnout Latino population, and a culture of non-voting.
27
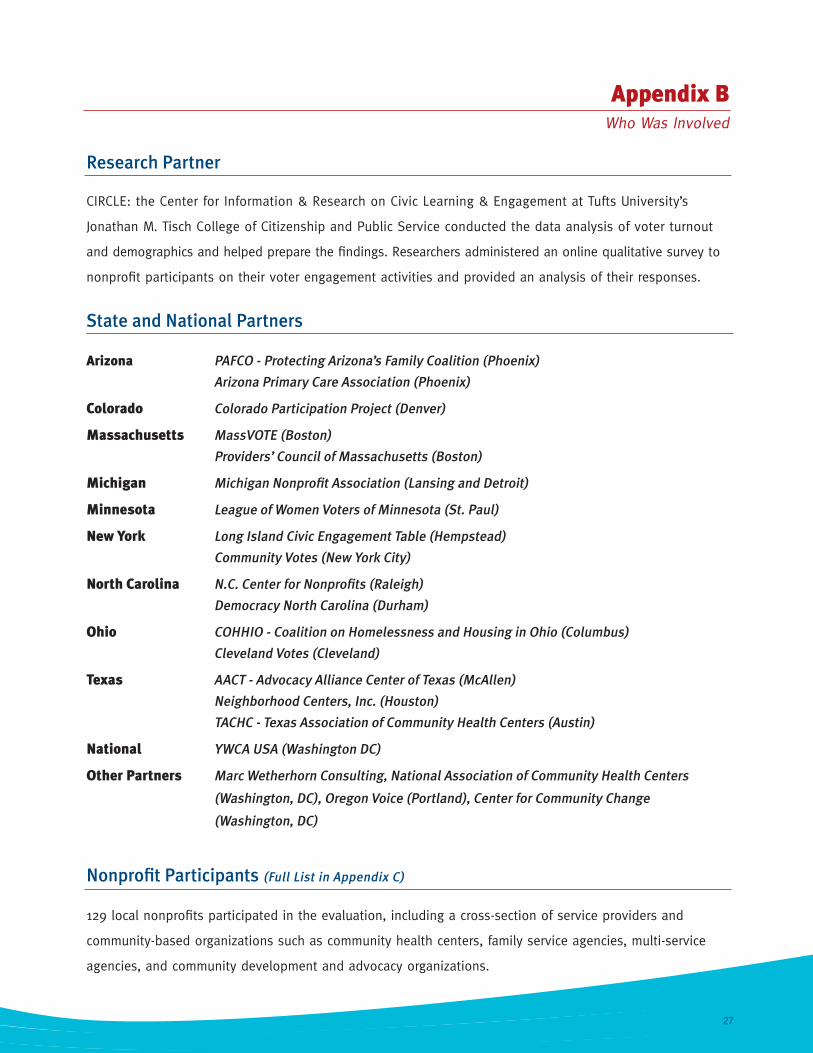
Research Partner
CIRCLE: the Center for Information & Research on Civic Learning & Engagement at Tufts University’s
Jonathan M. Tisch College of Citizenship and Public Service conducted the data analysis of voter turnout
and demographics and helped prepare the findings. Researchers administered an online qualitative survey to
nonprofit participants on their voter engagement activities and provided an analysis of their responses.
State and National Partners
Arizona PAFCO - Protecting Arizona’s Family Coalition (Phoenix)
Arizona Primary Care Association (Phoenix)
Colorado Colorado Participation Project (Denver)
Massachusetts MassVOTE (Boston)
Providers’ Council of Massachusetts (Boston)
Michigan Michigan Nonprofit Association (Lansing and Detroit)
Minnesota League of Women Voters of Minnesota (St. Paul)
New York Long Island Civic Engagement Table (Hempstead)
Community Votes (New York City)
North Carolina N.C. Center for Nonprofits (Raleigh)
Democracy North Carolina (Durham)
Ohio COHHIO - Coalition on Homelessness and Housing in Ohio (Columbus)
Cleveland Votes (Cleveland)
Texas AACT - Advocacy Alliance Center of Texas (McAllen)
Neighborhood Centers, Inc. (Houston)
TACHC - Texas Association of Community Health Centers (Austin)
National YWCA USA (Washington DC)
Other Partners Marc Wetherhorn Consulting, National Association of Community Health Centers
(Washington, DC), Oregon Voice (Portland), Center for Community Change
(Washington, DC)
Nonprofit Participants (Full List in Appendix C)
129 local nonprofits participated in the evaluation, including a cross-section of service providers and
community-based organizations such as community health centers, family service agencies, multi-service
agencies, and community development and advocacy organizations.
Appendix BWho Was Involved

28
Arizona Canyon Athletic Association, AZ
Arizona Commission for the Deaf and Hard of Hearing, AZ
Arizona Community Action, AZ
Arizona Independent Living Center, AZ
Arizona’s Children Association, AZ
Association for Supportive Child Care, AZ
El Rio Health Center, AZ
Human Services Consultants of Arizona, AZ
National Alliance on Mental Illness, So. Arizona, AZ
National Association of Social Workers, Arizona, AZ
North Country Healthcare, AZ
Pima Council on Aging, AZ
Primavera Foundation of Tucson, AZ
Sojourner Center, AZ
Southwest Human Development, AZ
Association for Community Living, CO
Boulder County AIDS Project, CO
Denver Urban Ministries, CO
GLBT Center of Colorado, CO
Harm Reduction Action Center, CO
Planned Parenthood of the Rocky Mountains, CO
Sister Carmen Community Center, CO
ABCD-Action for Boston Community Development, MA
Advocates, MA
Bay Cove Human Services, MA
Center for Human Development, MA
North Shore CDC, MA
Northeast Arc, MA
Nuestra Communidad Development Corporation, MA
Seven Hills Foundation, MA
Urban Edge Housing Corporation, MA
YWCA of Southeastern Massachusetts, MA
A. Philip Randolph - Detroit, Flint, Kalamazoo, MI
ACCESS social services, MI
Detroit Action Commonwealth/City Connect Detroit, MI
Floyd J. McCree Theatre, MI
Fresh Start Clubhouse, MI
Hispanic Center of Western Michigan, MI
Joy Community Association, MI
Kalamazoo Eastside Neighborhood Association, MI
Kalamazoo Gay Lesbian Resource Center, MI
Matrix Human Services, MI
Mentoring and Providing Scholarships Program (MAPS), MI
Michigan Citizens Education Fund, MI
Michigan Muslim Community Council, MI
Mothering Justice, MI
National Council for Community Empowerment, MI
Neighborhood Services Organization, MI
The Disability Network, MI
YWCA of Kalamazoo, MI
Catholic Charities of St. Paul and Minneapolis, MN
Home Line, MN
Keystone Community Services, MN
Lutheran Social Service of MN, MN
North Point Health and Wellness Center, MN
Outfront MN Community Services, MN
Planned Parenthood of MN, ND and SD, MN
YWCA of Minneapolis, MN
Community Outreach Assistance Services, NC
Crisis Assistance Ministry, NC
Driven 2 Destiny Outreach Center Inc., NC
Kinston Community Health Center, NC
Piedmont Health Services, Inc., NC
River City CDC, NC
Rural Health Group, Inc., NC
Smart Start of Forsyth County, NC
United Way of Asheville and Buncombe County, NC
YWCA of Asheville and Western North Carolina, NC
Cypress Hills LDC, NY
Family and Children’s Association, NY
Health and Welfare Council of Long Island, NY
Jacob Riis Neighborhood Settlement House, Inc., NY
Appendix CList of Nonprofit Participants

29
Long Island Women’s Empowerment Network, NY
Phipps House, NY
Planned Parenthood Hudson Peconic, NY
Planned Parenthood Nassau County, NY
Cleveland Young Professional Senate, OH
Contact Center of Cincinnati, OH
Neighborhood Family Practice, OH
Neighborhood House, OH
Northeast Ohio Coalition for the Homeless, OH
Northeast Ohio Voter Advocates, OH
Southeast Healthcare Services, OH
YWCA Greater Cleveland, OH
Avenue CDC of Houston, TX
Big Brothers Big Sisters Houston, TX
Brownsville Community Health Center, TX
Centro San Vicente, TX
Cross Timbers Community Health Center, TX
Doctors Hospital at Renaissance, TX
Frontera Healthcare Network, TX
Hidalgo Medical Center, TX
High School Seniors and Families, TX
Legacy Community Health Center, TX
Lubbock Community Health Center, TX
Move San Antonio, TX
Neighborhood Centers, Inc., TX
Planned Parenthood Gulf Coast, TX
Planned Parenthood Houston, TX
South Texas College, TX
South Texas Health Systems Hospitals, TX
Su Clinica, TX
Texans Together Education Fund, TX
University of Texas at Brownsville, TX
University of Texas Pan American, TX
University of Houston – Downtown Student Government
Assn, TX
Volunteer Houston, TX
YWCA Greater Austin, TX
Additional Research Participants
YWCA Central Alabama, AL
YWCA of Berkeley/Oakland, CA
YWCA of National Capitol Area, DC
YWCA Elgin, IL
YWCA McLean County, IL
YWCA Northeast Indiana, IN
Excelth Inc., LA
La Clinica De Familia, NM
YWCA of Tulsa, OK
Care Oregon, OR
Central City Concern, OR
Coalition of Community Health Clinics, OR
Disability Rights Oregon, OR
Multonomah County Health Center, OR
Outside In, OR
YWCA of Greater Portland, OR
YWCA Gettysbury and Adams County, PA
YWCA Lancaster, PA
YWCA of Nashville and Middle Tennessee, TN
YWCA Seattle/King/Snohomish, WA

30
* “Nonprofit Registrants” refers to those contacted by a nonprofit to register to vote or sign a pledge to vote and who were registered to vote at the time the 2014 election.** “All Registrants” refers to all voters registered to vote at the time of the 2014 election in the nine states referenced in the report.
DEMOGRAPHIC PROFILE OF NONPROFIT REGISTRANTS COMPARED TO ALL REGISTRANTS
Appendix DSummary Tables
Demographic Nonprofit Registrants*
% of Total All Registrants** % of Total Odds Ratio
Gender
Female 18,499 65% 19,958,304 53% 1.24
Male 9,931 35% 17,721,886 47% 0.75
Total 28,430 100% 37,680,190 100%
Race
Asian 692 2% 661,423 2% 1.38
Black 7,218 25% 4,545,934 12% 2.09
White 10,513 36% 29,831,603 78% 0.46
Hispanic 9,838 34% 2,432,148 6% 5.32
Other 648 2% 573,393 2% 1.49
Total 28,909 100% 38,044,501 100%
Income
Less than $25k 5,534 19% 2,055,937 5% 3.55
$25k - $50k 14,612 51% 14,363,977 38% 1.34
More than $50k 8,713 30% 21,600,951 57% 0.53
Total 28,859 100% 38,020,865 100%
Age
18-29 10,710 37% 6,779,343 18% 2.08
30-59 13,206 46% 19,910,237 52% 0.87
60+ 4,941 17% 11,265,131 30% 0.58
Total 28,857 100% 37,954,711 100%
Vote Propensity Score
0-25 6,411 24% 8,197,569 22% 1.11
25.01-50 7,068 27% 7,411,514 20% 1.36
50.01-80 8,174 31% 10,940,337 29% 1.06
80.01-100 4,725 18% 10,709,986 29% 0.63
Total 26,378 100% 37,259,406 100%
31
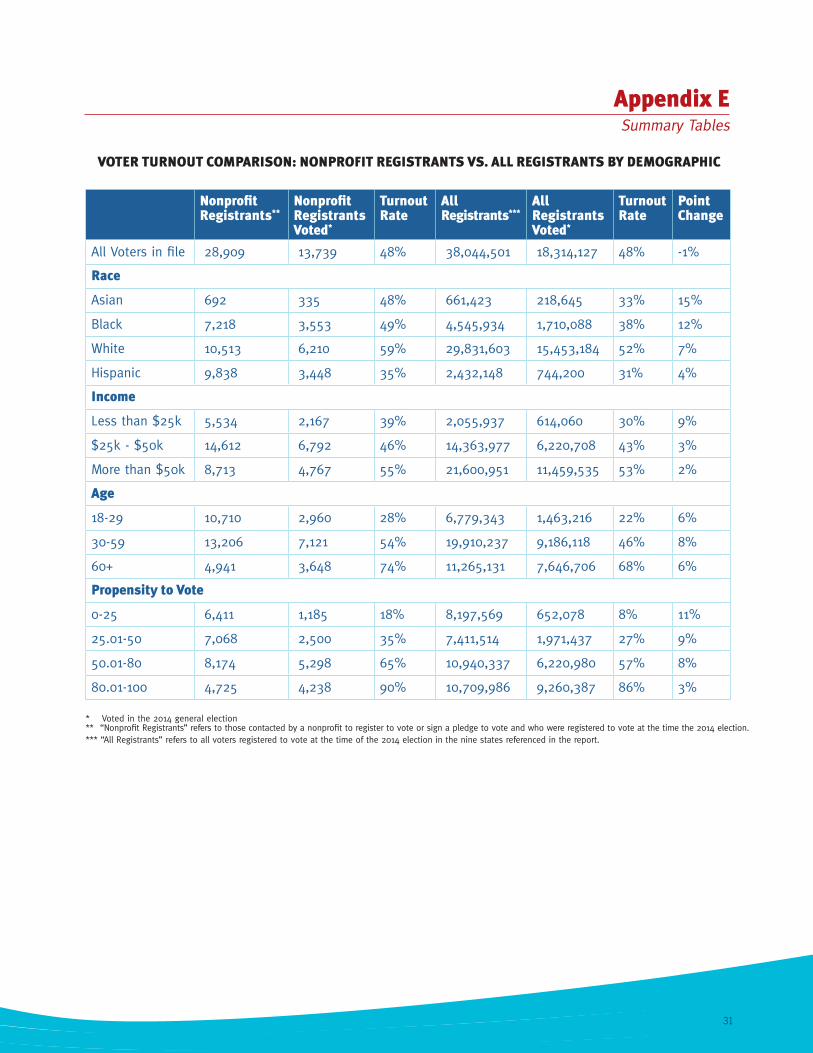
VOTER TURNOUT COMPARISON: NONPROFIT REGISTRANTS VS. ALL REGISTRANTS BY DEMOGRAPHIC
Nonprofit Registrants**
Nonprofit Registrants Voted*
Turnout Rate
All Registrants***
All Registrants Voted*
Turnout Rate
Point Change
All Voters in file 28,909 13,739 48% 38,044,501 18,314,127 48% -1%
Race
Asian 692 335 48% 661,423 218,645 33% 15%
Black 7,218 3,553 49% 4,545,934 1,710,088 38% 12%
White 10,513 6,210 59% 29,831,603 15,453,184 52% 7%
Hispanic 9,838 3,448 35% 2,432,148 744,200 31% 4%
Income
Less than $25k 5,534 2,167 39% 2,055,937 614,060 30% 9%
$25k - $50k 14,612 6,792 46% 14,363,977 6,220,708 43% 3%
More than $50k 8,713 4,767 55% 21,600,951 11,459,535 53% 2%
Age
18-29 10,710 2,960 28% 6,779,343 1,463,216 22% 6%
30-59 13,206 7,121 54% 19,910,237 9,186,118 46% 8%
60+ 4,941 3,648 74% 11,265,131 7,646,706 68% 6%
Propensity to Vote
0-25 6,411 1,185 18% 8,197,569 652,078 8% 11%
25.01-50 7,068 2,500 35% 7,411,514 1,971,437 27% 9%
50.01-80 8,174 5,298 65% 10,940,337 6,220,980 57% 8%
80.01-100 4,725 4,238 90% 10,709,986 9,260,387 86% 3%
* Voted in the 2014 general election ** “Nonprofit Registrants” refers to those contacted by a nonprofit to register to vote or sign a pledge to vote and who were registered to vote at the time the 2014 election.*** “All Registrants” refers to all voters registered to vote at the time of the 2014 election in the nine states referenced in the report.
Appendix ESummary Tables

32
VOTER TURNOUT COMPARISON: YOUNG NONPROFIT REGISTRANTS VS. ALL YOUNG REGISTRANTS
Nonprofit Registrants**
Nonprofit Registrants Voted*
Turnout Rate
All Registrants***
All Registrants Voted*
Turnout Rate
PointChange
Male
Asian 98 26 27% 58,178 9,091 16% 11%
Black 583 155 27% 465,619 63,063 14% 13%
White 990 354 36% 2,353,539 558,874 24% 12%
Hispanic 1,805 326 18% 287,983 39,026 14% 5%
Female
Asian 123 47 38% 65,641 11,600 18% 21%
Black 1,270 354 28% 576,068 111,145 19% 9%
White 2,368 944 40% 2,404,398 579,486 24% 16%
Hispanic 2,841 618 22% 323,958 51,807 16% 6%
Both
Asian 221 73 33% 123,819 20,691 17% 16%
Black 1,853 509 27% 1,041,687 174,208 17% 11%
White 3,358 1,298 39% 4,757,937 1,138,360 24% 15%
Hispanic 4,646 944 20% 611,941 90,833 15% 5%
* Voted in the 2014 general election ** “Nonprofit Registrants” refers to those contacted by a nonprofit to register to vote or sign a pledge to vote and who were registered to vote at the time the 2014 election.*** “All Registrants” refers to all voters registered to vote at the time of the 2014 election in the nine states referenced in the report.
Appendix FSummary Tables

33
PERCENTAGE INCREASE IN TURNOUT OF NONPROFIT VOTERS OVER ALL OTHER VOTERS IN 2012 VS. 2014
Appendix GSummary Tables
Demographic 2012 2014
Race / Ethnicity
Asian 31% 46%
Black 11% 31%
White 12% 14%
Hispanic 33% 15%
Income
Less than $25k 29% 31%
$25k - $50k 12% 7%
More than $50k 12% 3%
Age
18-29 30% 28%
30-59 8% 17%
60 and over 7% 9%
NOTE: 2012 figures were calculated using our 2012 report “Can Nonprofits Increase Voting.” These figures are for the purposes of rough comparison only. The term “nonprofit voters” refers both in 2012 and 2014 to voters who registered or signed a pledge to vote at a nonprofit or with the assistance of a nonprofit staff person or volunteer. The term “all voters” refers to all other registered voters in the same set of states.