enforcing mean reversion in state space models for prawn
TRANSCRIPT
Enforcing Mean Reversion in State Space Models for Prawn Pond WaterQuality Forecasting
Joel Janek Dabrowskia,∗, Ashfaqur Rahmanb, Daniel Edward Pagendamc, Andrew Georgec
aData61, CSIRO, St Lucia, QLD, AustraliabData61, CSIRO, Sandy Bay, TAS, Australia
cData61, CSIRO, Dutton Park, QLD, Australia
Abstract
The contribution of this study is a novel approach to introduce mean reversion in multi-step-ahead forecasts
of state-space models. This approach is demonstrated in a prawn pond water quality forecasting application.
The mean reversion constrains forecasts by gradually drawing them to an average of previously observed
dynamics. This corrects deviations in forecasts caused by irregularities such as chaotic, non-linear, and
stochastic trends. The key features of the approach include (1) it enforces mean reversion, (2) it provides a
means to model both short and long-term dynamics, (3) it is able to apply mean reversion to select structural
state-space components, and (4) it is simple to implement. Our mean reversion approach is demonstrated
on various state-space models and compared with several time-series models on a prawn pond water quality
dataset. Results show that mean reversion reduces long-term forecast errors by over 60% to produce the
most accurate models in the comparison.
Keywords:
Long term forecasting, Multi-step ahead forecasting, Mean reversion, Forecast constraint, Kalman filter
1. Introduction
In aquaculture prawn farming, managing water
quality is key for maximising quantity, quality, and
health of the stock. For example, high levels of
prawn mortality can occur due to anoxia and hy-
∗Corresponding author; St Lucia, QLD, 4067, Australia.
Email addresses: [email protected]
(Joel Janek Dabrowski ),
[email protected] (Ashfaqur Rahman),
[email protected] (Daniel Edward
Pagendam), [email protected] (Andrew
George)
poxia if dissolved oxygen (DO) drop to extreme val-
ues (Robertson, 2006). By forecasting important
water quality variables, farmers are provided with
the tools to take preemptive measures that encour-
age favourable pond conditions.
Long-term forecasting can be a challenging task
with complex environmental processes such as
prawn ponds. In this study, we take advantage
of the fact that many natural processes exhibit
some form of mean reversion. This is commonly
found where the process seeks a state of equilib-
rium. For example, the long-term trend (a week or
Preprint submitted to Computers and Electronics in Agriculture February 27, 2020
arX
iv:2
002.
1122
8v1
[st
at.A
P] 2
6 Fe
b 20
20
more) of pond water temperature typically varies
within some bounds. These bounds are main-
tained as the underlying process seeks thermody-
namic equilibrium within a changing environment.
Without knowledge of the underlying process, the
longer-term dynamics can appear as a slowly vary-
ing stochastic trend.
Forecasting such processes can be challenging
when stochastic trends cause forecasts to deviate.
Models should realistically incorporate some form
of constraint or bounds. Our hypothesis is that
such a constraint can be imposed by modelling the
stochastic variations with a fixed attractor distribu-
tion that long-term trends are drawn towards. In
this form, the long-term behaviour of the process
may have some stable, marginal distribution when
integrated over time (long periods of time or just
the recent past).
In this study we propose a novel approach to in-
troduce an attractor distribution in non-stationary
state-space models. The attractor distribution
models previously observed dynamics. Mean re-
version is enforced through introducing pseudo-
observations into the Kalman filter during forecast-
ing. These pseudo-observations are samples of the
attractor distribution mean. The result is that
the filtering operation during forecasting naturally
draws the forecasts towards the mean of the previ-
ously observed dynamics.
The proposed approach can model both short and
long-term dynamics and it allows for the selection
of which state space components should be mean
reverting. Furthermore, the approach is easily im-
plemented using the standard Kalman filter and it
has broad appeal as it addresses problems that are
found in many domains other than aquaculture.
Our contributions are: (1) we provide an ap-
proach to enforcing mean reversion in state-space
models (to our knowledge, no other studies have
introduced any form of mean reversion into state
space models for constraining forecasts), (2) we
demonstrate this approach on several state-space
models in a real-world aquaculture application, and
(3) we compare our approach with several time se-
ries models.
This paper is organised as follows: In section 2,
we review related forecasting literature. Section 3,
provides an overview of the linear dynamic system
(LDS) and the Kalman filter with the purpose of
introducing our mean reversion approach described
in section 4. The aquaculture problem and datasets
used in this study are presented in section 5. In sec-
tion 6 we demonstrate how our approach is applied
to state space forecasting models and results are
provided in section 7. In section 8 a comparison
of our approach with several forecasting methods is
provided. The study is concluded in section 9.
2. Related Work
2.1. Forecasting Models
Many industries and disciplines rely multi-step-
ahead forecasting. A wide range of forecasting
methods exist in the literature (Gooijer & Hynd-
man, 2006). Statistical models include state-space
models, regression models, exponential smooth-
ing, Box-Jenkins models (such as the autoregres-
sive moving average (ARMA) model), long memory
models, autoregressive conditional heteroscedastic
(ARCH), and generalised ARCH (GARCH) mod-
2
els. Nonlinear machine learning models have also
been extensively explored for forecasting. Neural
networks in particular have a relatively large body
of literature (Zhang & Qi, 2005; Zhang et al., 1998;
Ruiz et al., 2018).
State-space models are generative, probabilistic,
interpretable, and flexible (Durbin & Koopman,
2012). As generative models, they are able to han-
dle missing data and forecasting functionality is
inherent. As probabilistic models, they provide a
natural representation of uncertainty in a forecast.
State-space models are interpretable as they are de-
signed based on structural analysis of a problem
and naturally incorporate explanatory variables.
This is in contrast with data driven models such
as neural networks and ARMA models, which are
considered as black-box models.
2.2. Multi-Step-Ahead Forecasting
Multi-step-ahead forecasting is a challenging task
as it requires a complete model of the short and
longer-term dynamics. Short-term modelling is re-
quired to model the dynamics between the forecast
time-steps. Longer-term modelling is required to
model the dynamics across the several time-step
forecasts.
The general approach to long-term forecasting
is to model the long-term trend of the time se-
ries and ignore short term dynamics. Such models
can be obtained using time series analysis meth-
ods such as regression models, state-space models,
Box-Jenkins models, and recurrent neural networks
(Kandil et al., 2001; Soman et al., 2010; Granger &
Jeon, 2007). It is however possible to combine long
and short-term forecasts as discussed in the review
presented by Andrawis et al. (2011). The authors
note that there seems to be little work in the lit-
erature relating to such combinations, despite their
effectiveness.
The approach we present in this study does
not require combining long and short term-models.
Rather, it provides a means to naturally include
both short-term and long-term dynamics in a sin-
gle model. The short-term dynamics are modelled
directly in the state-space model. The long-term
dynamics are modelled using mean reversion and
the attractor distribution.
2.3. Mean Reversion
Many phenomena should realistically be mod-
elled with some form of limiting distribution for
long-term forecasts. For example, interest rates
are often modelled through the use of mean-
reverting stochastic processes, such as the Ornstein-
Uhlenbeck process (e.g. the Vasicek model (Va-
sicek, 1977) or the CIR model (Cox et al., 1985)).
The dynamics are limited to Brownian motion with
a tendency towards the origin (Pavliotis, 2014).
Though Brownian motion is not stationary, a linear
damping term in the Ornstein-Uhlenbeck process
can cause the process to become stationary. The
generalised Ornstein-Uhlenbeck process is a natu-
ral continuous time analogue of the AR(1) process
with random i.i.d. components (Rao et al., 2012).
The ARMA model also exhibits mean reversion,
but the moving-average allows for mean-reversion
to occur more gradually. In general, AR and
ARMA models are limited to modelling only sta-
tionary sequences Box et al. (2015). Non-stationary
components such as trend and seasonality are re-
3

moved from the time series through differencing
such as in the Autoregressive Integrated Moving
Average (ARIMA) model.
The ARMA and ARIMA models may be framed
as state-space models (Durbin & Koopman, 2012).
In general, state-space models are not limited
to stationary series and provide expressive power
through latent variables. State-space models are
however not necessarily mean reverting. Our pro-
posed approach provides the means to enforce mean
reversion in state-space models.
2.4. Water Quality Modelling
In water quality modelling applications, several
ecosystem-based models have been proposed for
variables such as DO (Ginot & Herve, 1994; Lu &
Piedrahita, 1996; Madsen et al., 2007; Xu & Xu,
2016). These are complex multivariable models
that require precisely determined parameters per-
taining to biological and physical processes. Vari-
ous data-driven approaches have also been used for
modelling and forecasting water quality variables.
These include neural networks (Zhang et al., 2019;
Ta & Wei, 2018; Ren et al., 2018; Dabrowski et al.,
2018a; de Canete et al., 2016; Schmid & Koskiaho,
2006; Dogan et al., 2009; Rankovic et al., 2010; Bas-
ant et al., 2010; He et al., 2011; Ahmed, 2017) and
other machine learning models (Shi et al., 2019; Xu
et al., 2017; Olyaie et al., 2017; Duan et al., 2016).
Dabrowski et al. (2018b) describe two data-
driven state-space models for modelling DO, pH,
and temperature in prawn ponds. These mod-
els provide a compromise between ecosystem mod-
els and machine learning models. They are data-
driven unlike ecosystem models, and are not black-
· · · ht−1 ht ht+1 · · ·
· · · vt−1 vt vt+1 · · ·
p(ht|ht−1)
p(vt|ht)
Figure 1: Graphical model representation of the latent dy-
namic model such as the linear dynamic system.
box models like many machine learning models.
The proposed mean reversion approach is tested
on these models in the context of forecasting wa-
ter quality variables.
3. The Linear Dynamic System and Filter-
ing
3.1. The Linear Dynamic System
The linear dynamic system (LDS) is a state-
space model that assumes linear-Gaussian dynam-
ics (Barber, 2012; Thrun et al., 2005; Murphy,
2012). Consider a system comprising a latent or
hidden variable ht that evolves over time, t =
1, . . . , T . The system provides an observable vari-
able vt from which measurements can be made. The
observable variable is considered to have been emit-
ted from the latent variable ht. Assuming a first
order Markov process, the graphical model describ-
ing this system is illustrated in Figure 1. The edges
between the latent variables describe the transition
distribution p(ht|ht−1). The edges between the la-
tent and observable variables describe the emission
distribution p(vt|ht).
Linear-Gaussian assumptions in the LDS result
in the following state-space equations (Petris et al.,
4
2009; Grewal & Andrews, 2015)
ht = Aht−1 + ηht (1)
vt = Bht + ηvt (2)
The variable ht is the state vector, A is the state
transition matrix, and ηht ∼ N (0,Σh) is the state
noise vector (where Σ denotes a covariance ma-
trix). The variable vt is the observation vector,
B is the emission or measurement matrix, and
ηvt ∼ N (0,Σv) is the measurement noise vector.
In continuous time, state-space equations are given
by (Grewal & Andrews, 2015; Zarchan & Musoff,
2000; Durbin & Koopman, 2012)
h(t) = Ah(t) + ηh(t) (3)
v(t) = Bh(t) + ηv(t) (4)
where A and B denote the continuous time state
and emission matrices.
3.2. The Kalman Filter (KF)
Inference in the LDS involves calculating
p(ht|v1:t), which is the probability distribution over
the current latent variable given all past observa-
tions (Barber, 2012; Murphy, 2012). The linear-
Gaussian assumption allows for a closed-form in-
ference algorithm known as the Kalman filter (KF)
(Kalman, 1960). The filtered distribution is repre-
sented as a Gaussian with mean ft and covariance
Ft. The KF algorithm recursively repeats a predic-
tion and update step. In the prediction step, the
Gaussian distributions p(ht|v1:t−1) and p(vt|v1:t−1)
are computed. The mean and covariance relating
to p(ht|v1:t−1) distributions are given by
µht = Aft−1 (5)
Σhht = AFt−1AT + Σh (6)
The mean and covariance relating to p(vt|v1:t−1)
are given by
µvt = Bµht (7)
Σvvt = BΣhht BT + Σv (8)
Additionally, the cross-covariance between the la-
tent and observed variables is given by
Σhvt = Σhht BT (9)
The predictions are updated with the latest ob-
servations to provide the parameters for the filtered
distribution. These parameters are given by
ft = µht +Kt(vt − µvt ) (10)
Ft = (I −KtB)Σhht (11)
where I is the identity matrix and Kt is the Kalman
gain given by
Kt = Σhvt (Σvvt )−1 (12)
= (Σhht BT )(BΣhht BT + Σv)−1 (13)
3.3. Forecasting with the LDS
The filtered distribution is computed at each time
using equations (10) and (11) with observations vt.
During forecasting, the prediction equations (5),
(6), (7), and (8) are used with no observations. For
multiple forecasts into the future, ft−1 and Ft−1
in equations (5) and (6) can be replaced with µt−1
and Σhht−1 respectively. Multiple forecasts are thus
generated by sequentially sampling from the model.
Any forecasts made for times t + i, i > 0 are
calculated based on the dynamics of the model at
time t. These dynamics are contained in the filtered
distribution at time t. If the filtered distribution at
time t is not representative of the long-term trend,
long-term forecasts may be inaccurate.
5
3.4. Nonlinear and Non-Gaussian Filtering
The Kalman filter is a closed form solution for
a linear-Gaussian model. If a system is nonlin-
ear or non-Gaussian, approximate filtering methods
such as the extended Kalman filter (EKF), the un-
scented Kalman filter (UKF) (Julier & Uhlmann,
1997), or Monte Carlo methods such as the particle
filter (Gordon et al., 1993) and ensemble Kalman
filter (enKF) (Evensen, 1994) are required. In this
study the EKF is used. The EKF approximates a
nonlinear function by linearising around the current
state mean estimate (Zarchan & Musoff, 2000).
4. Mean Reversion and the Attractor Distri-
bution
4.1. Forecast Deviation In State-Space Models
State-space time series models are comprised of
several distinct components such as trend, sea-
sonal, and noise (disturbances) (Durbin & Koop-
man, 2012; Commandeur & Koopman, 2007; West
& Harrison, 1997; Hyndman et al., 2008; Harvey,
1990; Petris et al., 2009). The trend component
is often represented in the form of a polynomial
model. Especially models such as the first-order-
polynomial Dynamic Linear Model (DLM) per-
form well for relatively short-term forecasting but
can fail in longer term forecasts (West & Harri-
son, 1997). Irregularities such as slowly varying
stochastic trends can shift the forecast trajectory
off course. Mean reversion corrects the deviant fore-
cast by drawing it back towards the attractor dis-
tribution mean.
4.2. Attractor Distribution and the Central Limit
The proposed approach is to use an attractor dis-
tribution to draw the forecasts to the mean of a dis-
tribution that approximates the central limit. Spall
& Wall (1984) proved the central limit theorem for
the Kalman filter under certain conditions. These
conditions include the standard Kalman filter as-
sumptions as well as uniform complete observability
and controllability. The intention of the study was
to investigate the asymptotic nature of the Kalman
filter. Aliev & Ozbek (1999) furthered this study
by investigating the convergence rate of the central
limit theorem for the Kalman filter.
To approximate the mean of the central limit dis-
tribution, the average over all filtered posterior dis-
tributions (see Section 3.2) is computed up to time
t. That is
f∞ ≈1
t
t∑i=1
fi. (14)
This approximation is used as the mean of the at-
tractor distribution.
It is also possible to compute a weighted average
where more emphasis is given to recent dynamics.
A geometric progression can be used to obtain an
exponential weighted average as follows1
f∞ ≈∑ti=1 fi(1− λ)t−i∑ti=1(1− λ)t−i
, (15)
where λ is some constant in the range 0 < λ ≤
1. This provides a form of exponential smooth-
ing (Brown, 1959; Holt, 1957; Winters, 1960) in the
mean reversion.
1Note that the form f∞ ≈ λ∑t
i=1 fi(1 − λ)t−i can be
used if λ and t are chosen such that λ∑t
i=1(1− λ)t−i ≈ 1.
6

4.3. Mean Reversion Through Filtering
To draw the forecast to the attractor distribu-
tion mean, it is proposed that the forecasts be fil-
tered with the attractor distribution as an observ-
able variable. That is, set vt = f∞ as a pseudo-
observation during forecasting. The filtered distri-
bution can be written as (Thrun et al., 2005)
p(ht|v1:t) ∝ p(vt|ht)p(ht|v1:t−1) (16)
The first term can be viewed as a likelihood of
the observation given the model state. The second
term can be viewed as a prior describing the pre-
dicted model state given previous observations. By
using the attractor distribution as the observable
variable, the likelihood describes the probability of
the attractor distribution given the current model
state. If this likelihood is low, it implies a mismatch
between what the model is forecasting and what is
expected asymptotically.
To understand how filtering draws the forecast
to the attractor distribution, consider the Kalman
filter update equation (10). The filtered mean is
the current prediction µht , that is updated with a
weighted difference between observation vt and the
prediction µvt . The weighting factor for the error is
the Kalman gain. Equation (10) provides a mech-
anism to correct the model prediction with an ob-
servable variable vt. If vt is the attractor distribu-
tion, the forecast will be corrected according to the
attractor distribution.
4.4. Parameters
To define the emission matrix B for the attrac-
tor distribution pseudo-observations, consider that
B provides a mapping from the space of ht to the
space of vt. The matrix B can be manipulated
to map only certain components from the latent
variable space. Non-zero values can be placed in
B corresponding to components which should be
mean reverting in nature. For example, non-zero
values could be placed in B corresponding to trend
components that should exhibit mean reversion be-
haviour. Zeros can be placed in B corresponding
to components which should not be mean revert-
ing in nature. For example, seasonal components
may be left to oscillate throughout a forecast. A
demonstration of this is presented in Section 6.
To define the measurement noise covariance Σv
for the attractor distribution pseudo-observations,
consider that Σv represents a form of uncertainty
of the observation. By adjusting the uncertainty,
the rate of convergence of the forecast to the at-
tractor distribution mean can be manipulated. The
Kalman gain defines the level of correction. Con-
sider the representation of the Kalman gain in (13).
The expression comprises B, Σhht , and Σv. B is de-
fined as discussed above and Σhht is computed from
the prediction. With these defined, the Kalman
gain can thus be adjusted by manipulating Σv. If
Σv is set to zeros, indicating the extreme level of
certainty of vt, the Kalman gain reduces as follows
Kt = (Σhht BT )(BΣhht BT + 0)−1
= (Σhht BT )(B−T (Σhht )−1B−1)
= B−1 (17)
If Kt = B−1, the filtered mean in (10) reduces to
ft = vt, which is the attractor distribution mean.
If Σv is set to infinite values along its diagonal to
indicate an extreme level of uncertainty of vt, (10)
reduces to ft = µht , which is mean proposed by
7
the model. That is, with infinite values in Σv, the
attractor distribution will be ignored.
By manipulating the uncertainty represented by
Σv, the level of correction of the forecasts is con-
trolled. This correction is performed over multiple
steps during filtering. The result is that the rate of
convergence of a forecast to the attractor distribu-
tion mean is determined by Σv.
5. Datasets
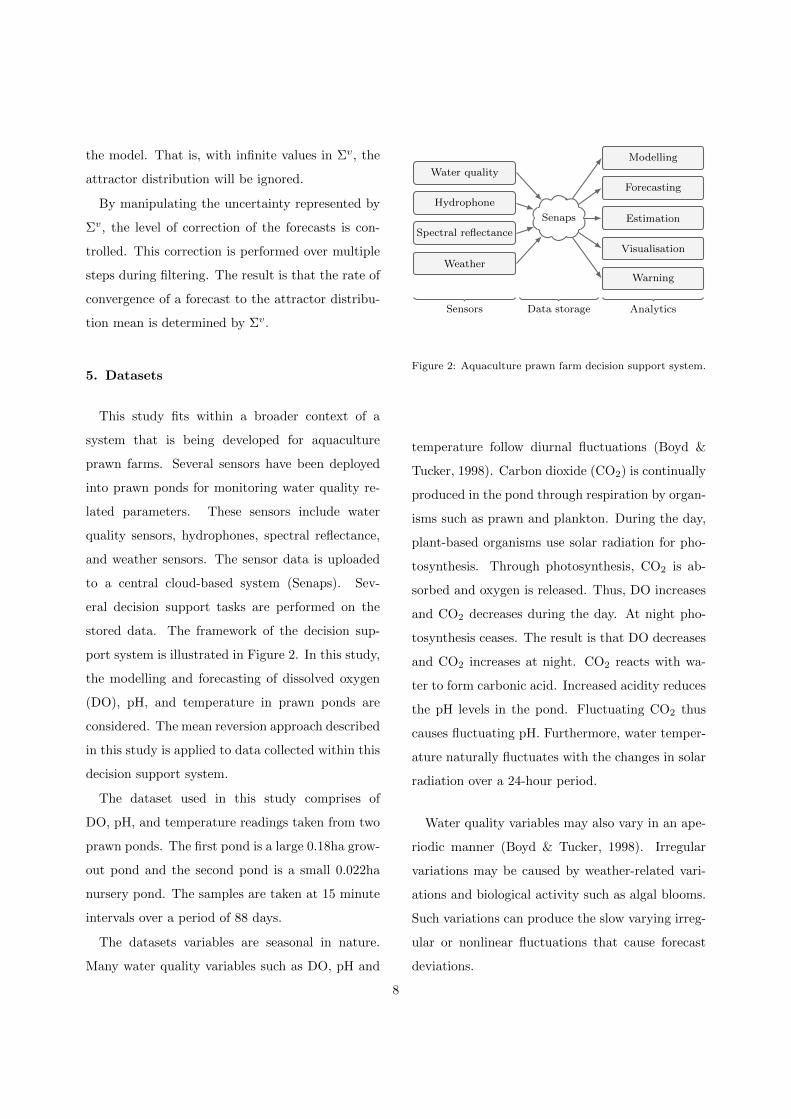
This study fits within a broader context of a
system that is being developed for aquaculture
prawn farms. Several sensors have been deployed
into prawn ponds for monitoring water quality re-
lated parameters. These sensors include water
quality sensors, hydrophones, spectral reflectance,
and weather sensors. The sensor data is uploaded
to a central cloud-based system (Senaps). Sev-
eral decision support tasks are performed on the
stored data. The framework of the decision sup-
port system is illustrated in Figure 2. In this study,
the modelling and forecasting of dissolved oxygen
(DO), pH, and temperature in prawn ponds are
considered. The mean reversion approach described
in this study is applied to data collected within this
decision support system.
The dataset used in this study comprises of
DO, pH, and temperature readings taken from two
prawn ponds. The first pond is a large 0.18ha grow-
out pond and the second pond is a small 0.022ha
nursery pond. The samples are taken at 15 minute
intervals over a period of 88 days.
The datasets variables are seasonal in nature.
Many water quality variables such as DO, pH and
Water quality
Hydrophone
Spectral reflectance
Weather
Senaps
Modelling
Forecasting
Estimation
Visualisation
Warning
Sensors Data storage Analytics
Figure 2: Aquaculture prawn farm decision support system.
temperature follow diurnal fluctuations (Boyd &
Tucker, 1998). Carbon dioxide (CO2) is continually
produced in the pond through respiration by organ-
isms such as prawn and plankton. During the day,
plant-based organisms use solar radiation for pho-
tosynthesis. Through photosynthesis, CO2 is ab-
sorbed and oxygen is released. Thus, DO increases
and CO2 decreases during the day. At night pho-
tosynthesis ceases. The result is that DO decreases
and CO2 increases at night. CO2 reacts with wa-
ter to form carbonic acid. Increased acidity reduces
the pH levels in the pond. Fluctuating CO2 thus
causes fluctuating pH. Furthermore, water temper-
ature naturally fluctuates with the changes in solar
radiation over a 24-hour period.
Water quality variables may also vary in an ape-
riodic manner (Boyd & Tucker, 1998). Irregular
variations may be caused by weather-related vari-
ations and biological activity such as algal blooms.
Such variations can produce the slow varying irreg-
ular or nonlinear fluctuations that cause forecast
deviations.
8

6. Applied State-Space Models
Dabrowski et al. (2018b) presented two models
for modelling water quality parameters in prawn
ponds. The first model is a LDS with a local linear
trend component (constant velocity process) and a
seasonal component. The second model is a non-
linear model that provides a means to model the
seasonal amplitude using a local linear trend com-
ponent. The UKF was used for inference in this
non-linear model. These models will be used in this
study, however the EKF algorithm will be used in-
stead of the UKF algorithm. The intention is to
improve the long-term (a week or more) forecasting
capability of these models using the proposed mean
reversion approach.
6.1. Linear Model
The observations of the linear model are mod-
elled with a seasonal, trend and noise component
as follows
vt = αt sin(ωt) + γt + ηvt (18)
The seasonal component αt sin(ωt) is modelled with
a sinusoid with amplitude αt, the trend γt is mod-
elled with as a continuous local linear trend model,
and the noise ηvt is white Gaussian noise. The Let
ψt = αt sin(ωt) such that (Dabrowski et al., 2018b)
h(t) =[γt γt ψt ψt
]TThe state transition matrix in continuous time, de-
noted by A is then given by
A =
0 1 0 0
0 0 0 0
0 0 0 1
0 0 ω2 0
This matrix is converted to discrete time using a
Laplace transform or the Taylor series expansion
(Zarchan & Musoff, 2000)
A = eA∆t = I + A∆t+(A∆t)2
2!+
(A∆t)3
3!+ · · ·
(19)
where ∆t is the sample rate.
The emission matrix maps the elements from the
latent variable space to the observed variable space
according to (18). The emission matrix is thus
given by
B =[1 0 1 0
]The attractor distribution is defined to draw the
forecasts to a fixed mean of previously observed dy-
namics. For the linear model, mean reversion is ap-
plied to the trend component. Thus, the attractor
distribution is defined to approximate the central
limit of γt. The following emission matrix for the
attractor distribution can thus be used
B =[1 0 0 0
].
In this form, mean reversion is only enforced on γt
and not on the seasonal component ψt.
With the attractor distribution having a single
dimension, the variance Σvt is a real number. The
value is manually set to provide reasonable uncer-
tainty bounds and to match the mean reversion set-
tling time with the slowly varying irregular compo-
nent of the data. As discussed in Section 4, smaller
values provide quicker settling times and narrower
uncertainty bounds. Larger values provide slower
settling times and wider uncertainty bounds. Suit-
able values can generally be found with a brief
search over the sequence 10i, i ∈ Z and further re-
fined if necessary. A search can also be conducted
9
using repeated random subsampling validation ap-
proaches.
6.2. Nonlinear Model
The linear model is independent of the sinusoidal
amplitude αt in (18) (Dabrowski et al., 2018b). In-
cluding the amplitude as a component in the state-
space representation results in a nonlinear model.
The amplitude is modelled as a latent variable with
a constant velocity process such that
h(t) =[γt γt αt αt sin(ωt) cos(ωt)
]TThe state transition matrix in continuous time is
given by
A =
0 1 0 0 0 0
0 0 0 0 0 0
0 0 0 1 0 0
0 0 0 0 0 0
0 0 0 0 0 1
0 0 0 0 −ω2 0
This matrix is converted to discrete time using (19)
The trend element is added to a product of the
amplitude and sinusoidal elements as indicated in
(18). This results in a nonlinear emission model.
Let b(ht) = αt sin(ωt) + γt such that
vt = b(ht) + ηvt
The EKF approach is to approximate the nonlin-
ear function b(ht) as a linearisation around the cur-
rent state estimate. This linear approximation is
the tangent to b(ht) at the current state estimate.
Thus, the emission matrix is given by (Zarchan &
Musoff, 2000)
B =∂b(h)
∂h
∣∣∣∣h=ft
That is, B is given by the Jacobian
B =[∂b(h)∂γt
∂b(h)∂γt
∂b(h)∂αt
∂b(h)∂αt
∂b(h)∂ sin(ωt)
∂b(h)∂ cos(ωt)
]=[1 0 sin(ωt) 0 αt 0
]With this approximation to B, the standard
Kalman filter equations given in Section 3.2 can
be used. The proposed mean reversion approach is
thus directly applicable.
For the nonlinear model, the datasets are as-
sumed to approach a fixed mean offset and a fixed
mean seasonal amplitude. The attractor distribu-
tion thus approximates the central limit of γt as
well as αt. The emission matrix for the attractor
distribution is given by
B =
1 0 0 0 0 0
0 0 1 0 0 0
.With a two-dimensional attractor distribution,
the variance Σvt is a two-dimensional matrix. This
matrix is configured for an isotropic Gaussian
with elements along the diagonal. These elements
are manually chosen according to the uncertainty
bounds and the slowly varying irregular component
of the data.
7. State-Space Models Results
7.1. Methodology
The datasets are resampled to three samples per
day according to (Dabrowski et al., 2018b). Re-
sampling simulates handheld sensor readings taken
by farmers, where samples are extracted at 05h00,
12h00, and 20h30. Although only 3 of the 96 sam-
ples per day are available, the sample rate in the
models remains at 96 samples. The remaining 93
10

Dataset Samples Time Frequency
DO 1200 12.5 days 15 min
pH 1000 10.4 days 15 min
Temperature 1100 11.5 days 15 min
Table 1: Forecast horizon in number of samples as well as
time for the datasets used in this demonstration. The last
column provides the sample rate of the sensor used to gather
the dataset. Forecast horizons are determined by the selected
inflection point in the data.
samples are treated as missing values that are esti-
mated through filtering and smoothing in the state
space models. Forecasts are performed and evalu-
ated over all 96 samples per day.
The time series dataset is split into a training and
test set. Filtering is performed on the training set.
The attractor distributions are obtained from these
filtered results. Forecasts are evaluated on the test
set. The location of the split between the train-
ing and test sets is specifically chosen around some
form of inflection point. At these inflection points,
a model without mean reversion is more likely to
deviate from the global trend.
The forecasts are made over multiple steps to pro-
vide long-term forecasts. The number of samples
over which the forecasts are made are provided in
Table 1.
The normalised root mean squared error is used
to provide an evaluation of the error between the
forecast result and the measured data. Let yt de-
note the forecast and let yt denote the true value
of some time series at time t. For a forecast over
N samples, the normalised root mean squared error
(NRMSE) is given by
εnrmse =
√1N
∑Ni=1(yi − yi)2
ymax − ymin× 100% (20)
where ymax and ymin are the maximum and mini-
mum dataset values respectively. The NMSE for a
single sample i is given by
εnrmse =
√(yi − yi)2
ymax − ymin× 100% (21)
7.2. Linear Model Results
Plots of the forecasts for the linear model are
presented in Figure 3. The horizontal axes describe
the sample number. Without mean reversion, the
forecast trends deviate from the ground truth as il-
lustrated in Figure 3a. These deviations are due the
inflection point in the long-term trend from which
the forecasts extend. Reasonable forecasts are ob-
tained up to the end of the first seasonal cycle where
variations in the true trend are minimal. After the
first cycle, the forecasts begin to deviate as the true
trend changes in a non-linear or stochastic manner.
As indicated in Figure 3b, enforcing mean rever-
sion provides significant improvements to long term
forecasts. Mean reversion draws the deviant fore-
casts back towards the average of the previously
observed dynamics.
The blue filled regions plot the standard devi-
ation of the posterior filtered distribution. This
represents the uncertainty in the forecast. As ex-
pected, the mean reversion reduces magnitude of
the standard deviation through the pseudo obser-
vations from the attractor distribution. The level to
which the pseudo-observations affect the standard
deviation depends on the attractor distribution co-
variance Σv.
11
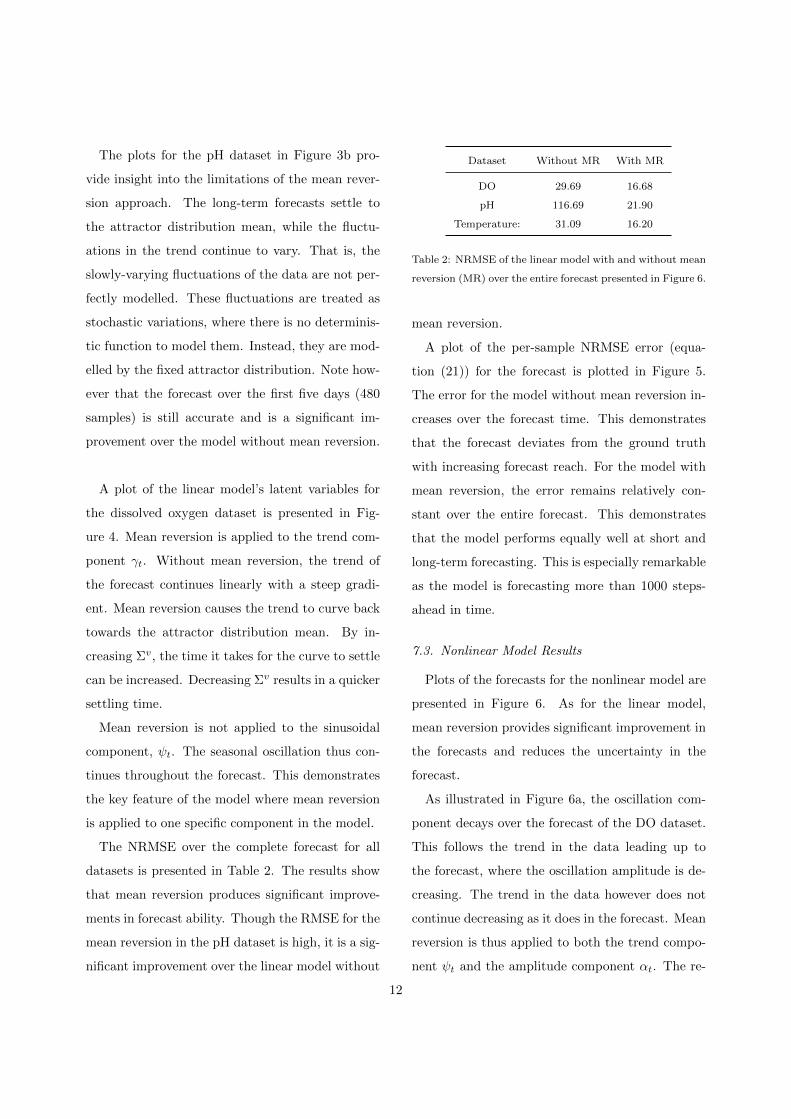
The plots for the pH dataset in Figure 3b pro-
vide insight into the limitations of the mean rever-
sion approach. The long-term forecasts settle to
the attractor distribution mean, while the fluctu-
ations in the trend continue to vary. That is, the
slowly-varying fluctuations of the data are not per-
fectly modelled. These fluctuations are treated as
stochastic variations, where there is no determinis-
tic function to model them. Instead, they are mod-
elled by the fixed attractor distribution. Note how-
ever that the forecast over the first five days (480
samples) is still accurate and is a significant im-
provement over the model without mean reversion.
A plot of the linear model’s latent variables for
the dissolved oxygen dataset is presented in Fig-
ure 4. Mean reversion is applied to the trend com-
ponent γt. Without mean reversion, the trend of
the forecast continues linearly with a steep gradi-
ent. Mean reversion causes the trend to curve back
towards the attractor distribution mean. By in-
creasing Σv, the time it takes for the curve to settle
can be increased. Decreasing Σv results in a quicker
settling time.
Mean reversion is not applied to the sinusoidal
component, ψt. The seasonal oscillation thus con-
tinues throughout the forecast. This demonstrates
the key feature of the model where mean reversion
is applied to one specific component in the model.
The NRMSE over the complete forecast for all
datasets is presented in Table 2. The results show
that mean reversion produces significant improve-
ments in forecast ability. Though the RMSE for the
mean reversion in the pH dataset is high, it is a sig-
nificant improvement over the linear model without
Dataset Without MR With MR
DO 29.69 16.68
pH 116.69 21.90
Temperature: 31.09 16.20
Table 2: NRMSE of the linear model with and without mean
reversion (MR) over the entire forecast presented in Figure 6.
mean reversion.
A plot of the per-sample NRMSE error (equa-
tion (21)) for the forecast is plotted in Figure 5.
The error for the model without mean reversion in-
creases over the forecast time. This demonstrates
that the forecast deviates from the ground truth
with increasing forecast reach. For the model with
mean reversion, the error remains relatively con-
stant over the entire forecast. This demonstrates
that the model performs equally well at short and
long-term forecasting. This is especially remarkable
as the model is forecasting more than 1000 steps-
ahead in time.
7.3. Nonlinear Model Results
Plots of the forecasts for the nonlinear model are
presented in Figure 6. As for the linear model,
mean reversion provides significant improvement in
the forecasts and reduces the uncertainty in the
forecast.
As illustrated in Figure 6a, the oscillation com-
ponent decays over the forecast of the DO dataset.
This follows the trend in the data leading up to
the forecast, where the oscillation amplitude is de-
creasing. The trend in the data however does not
continue decreasing as it does in the forecast. Mean
reversion is thus applied to both the trend compo-
nent ψt and the amplitude component αt. The re-
12

6000 6500 7000 7500 8000 8500
0
10
DO
(mg/l)
6500 7000 7500 8000 8500
4
6
8
pH
6500 7000 7500 8000 8500
24
30
36
Tem
p.(◦C
)
(a) Linear model forecasts without mean reversion
6000 6500 7000 7500 8000 8500
0
5
10
DO
(mg/l)
6500 7000 7500 8000 8500
7.8
8.4
9.0
pH
6500 7000 7500 8000 8500
27
30
Tem
p.(◦C
)
(b) Linear model forecasts with mean reversion
Figure 3: Linear model forecasts of the dissolved oxygen (mg/l), pH, and temperature (◦C) over sample indexes. The red line
is a plot of the forecast and the blue filled region is a plot of the forecast standard deviation. The dark grey line is a plot of the
sensor data sampled at 15 minute intervals, and the light grey markers indicate sub-samples extracted at 05h00, 12h00, and
20h30. The vertical grey dotted line indicates the start of the forecast. Only the last portion of the historical data are shown.
5
10data
5
10ft
4
6
γt
0 2000 4000 6000 8000
−5
0
5 sin(ωt)
(a) Latent variables for the linear model without mean
reversion.
5
10data
5
10ft
5
6
7γt
0 2000 4000 6000 8000
−5
0
5sin(ωt)
(b) Latent variables for the linear model with mean
reversion.
Figure 4: Plots of the data, filtered mean ft, the trend component γt, and the sinusoidal component sin(ωt) for the linear
model on the dissolved oxygen dataset over the sample index. The gaps in the data plots are due to missing data.
13

7250 7500 7750 8000 8250 8500
0
50
DO
(%)
7600 7800 8000 8200 84000
50
100
150
pH(%
)
7400 7600 7800 8000 8200 8400
0
50
Tem
p.(%
)
(a) NRMSE for the linear model without mean rever-
sion.
7250 7500 7750 8000 8250 8500
0
50
DO
(%)
7600 7800 8000 8200 8400
0
50
pH(%
)
7400 7600 7800 8000 8200 8400
0
25
50
Tem
p.(%
)
(b) NRMSE for the linear model with mean reversion.
Figure 5: Per-sample NRMSE (equation (21)) for the linear model forecasts on the DO dataset presented in Figure 3.
6000 6500 7000 7500 8000 8500
0
15
DO
(mg/l)
6500 7000 7500 8000 8500
5.0
7.5
10.0
pH
6500 7000 7500 8000 8500
15
30
45
Tem
p.(◦C
)
(a) Nonlinear model forecasts without mean reversion
6000 6500 7000 7500 8000 8500
4
8
12
DO
(mg/l)
6500 7000 7500 8000 8500
8.0
8.8
pH
6500 7000 7500 8000 8500
27
30
33
Tem
p.(◦C
)
(b) Nonlinear model forecasts with mean reversion
Figure 6: Nonlinear model forecasts of dissolved oxygen (mg/l), pH, and temperature (◦C) over sample indexes. The red line
is a plot of the forecast and the blue filled region is a plot of the forecast standard deviation. The dark grey line is a plot of the
sensor data sampled at 15 minute intervals, and the light grey markers indicate sub-samples extracted at 05h00, 12h00, and
20h30. The vertical grey dotted line indicates the start of the forecast. Only the last portion of the historical data are shown.
sult is that both of these components are corrected
to provide a more accurate forecast.
A plot of the latent variables for the DO dataset
are presented in Figure 7. The amplitude of the
sin(ωt) component remains fairly constant when
compared to the linear model. This is expected as
αt and sin(ωt) are separated in the nonlinear model,
whereas in the linear model, they are combined into
a single component. Both the trend γt and ampli-
tude αt components are affected by the inflection
14
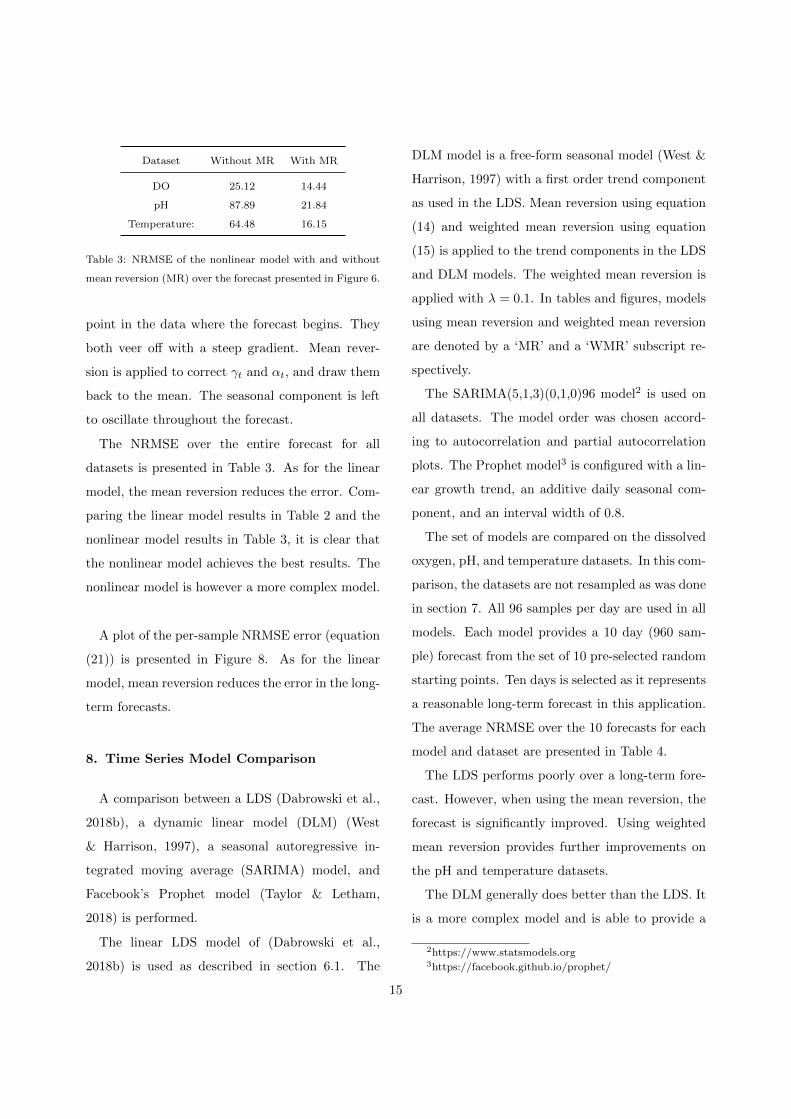
Dataset Without MR With MR
DO 25.12 14.44
pH 87.89 21.84
Temperature: 64.48 16.15
Table 3: NRMSE of the nonlinear model with and without
mean reversion (MR) over the forecast presented in Figure 6.
point in the data where the forecast begins. They
both veer off with a steep gradient. Mean rever-
sion is applied to correct γt and αt, and draw them
back to the mean. The seasonal component is left
to oscillate throughout the forecast.
The NRMSE over the entire forecast for all
datasets is presented in Table 3. As for the linear
model, the mean reversion reduces the error. Com-
paring the linear model results in Table 2 and the
nonlinear model results in Table 3, it is clear that
the nonlinear model achieves the best results. The
nonlinear model is however a more complex model.
A plot of the per-sample NRMSE error (equation
(21)) is presented in Figure 8. As for the linear
model, mean reversion reduces the error in the long-
term forecasts.
8. Time Series Model Comparison
A comparison between a LDS (Dabrowski et al.,
2018b), a dynamic linear model (DLM) (West
& Harrison, 1997), a seasonal autoregressive in-
tegrated moving average (SARIMA) model, and
Facebook’s Prophet model (Taylor & Letham,
2018) is performed.
The linear LDS model of (Dabrowski et al.,
2018b) is used as described in section 6.1. The
DLM model is a free-form seasonal model (West &
Harrison, 1997) with a first order trend component
as used in the LDS. Mean reversion using equation
(14) and weighted mean reversion using equation
(15) is applied to the trend components in the LDS
and DLM models. The weighted mean reversion is
applied with λ = 0.1. In tables and figures, models
using mean reversion and weighted mean reversion
are denoted by a ‘MR’ and a ‘WMR’ subscript re-
spectively.
The SARIMA(5,1,3)(0,1,0)96 model2 is used on
all datasets. The model order was chosen accord-
ing to autocorrelation and partial autocorrelation
plots. The Prophet model3 is configured with a lin-
ear growth trend, an additive daily seasonal com-
ponent, and an interval width of 0.8.
The set of models are compared on the dissolved
oxygen, pH, and temperature datasets. In this com-
parison, the datasets are not resampled as was done
in section 7. All 96 samples per day are used in all
models. Each model provides a 10 day (960 sam-
ple) forecast from the set of 10 pre-selected random
starting points. Ten days is selected as it represents
a reasonable long-term forecast in this application.
The average NRMSE over the 10 forecasts for each
model and dataset are presented in Table 4.
The LDS performs poorly over a long-term fore-
cast. However, when using the mean reversion, the
forecast is significantly improved. Using weighted
mean reversion provides further improvements on
the pH and temperature datasets.
The DLM generally does better than the LDS. It
is a more complex model and is able to provide a
2https://www.statsmodels.org3https://facebook.github.io/prophet/
15

5
10 data
5
10ft
5.0
7.5 γt
0
10αt
0 2000 4000 6000 8000
−0.5
0.0
0.5 sin(ωt)
(a) Latent variables for the nonlinear model without
mean reversion.
5
10 data
5
10 ft
5.0
7.5 γt
2.5
5.0
7.5 αt
0 2000 4000 6000 8000
−0.5
0.0
0.5 sin(ωt)
(b) Latent variables for the nonlinear model with mean
reversion.
Figure 7: Plots of the data, filtered mean ft, the trend component γt, the sinusoidal component sin(ωt), and the amplitude
component αt for the nonlinear model over the sample index. The gaps in the data plots are due to missing data.
7250 7500 7750 8000 8250 8500
0
50
DO
(%)
7600 7800 8000 8200 8400
0
100
pH(%
)
7400 7600 7800 8000 8200 8400
0
100
Tem
p.(%
)
(a) NRMSE for the nonlinear model without mean re-
version.
7250 7500 7750 8000 8250 8500
0
50
DO
(%)
7600 7800 8000 8200 8400
0
50
pH(%
)
7400 7600 7800 8000 8200 8400
0
25
Tem
p.(%
)
(b) NRMSE for the nonlinear model with mean rever-
sion.
Figure 8: Per-sample NRMSE (equation (21)) for the nonlinear model forecasts on the DO dataset presented in Figure 6.
16
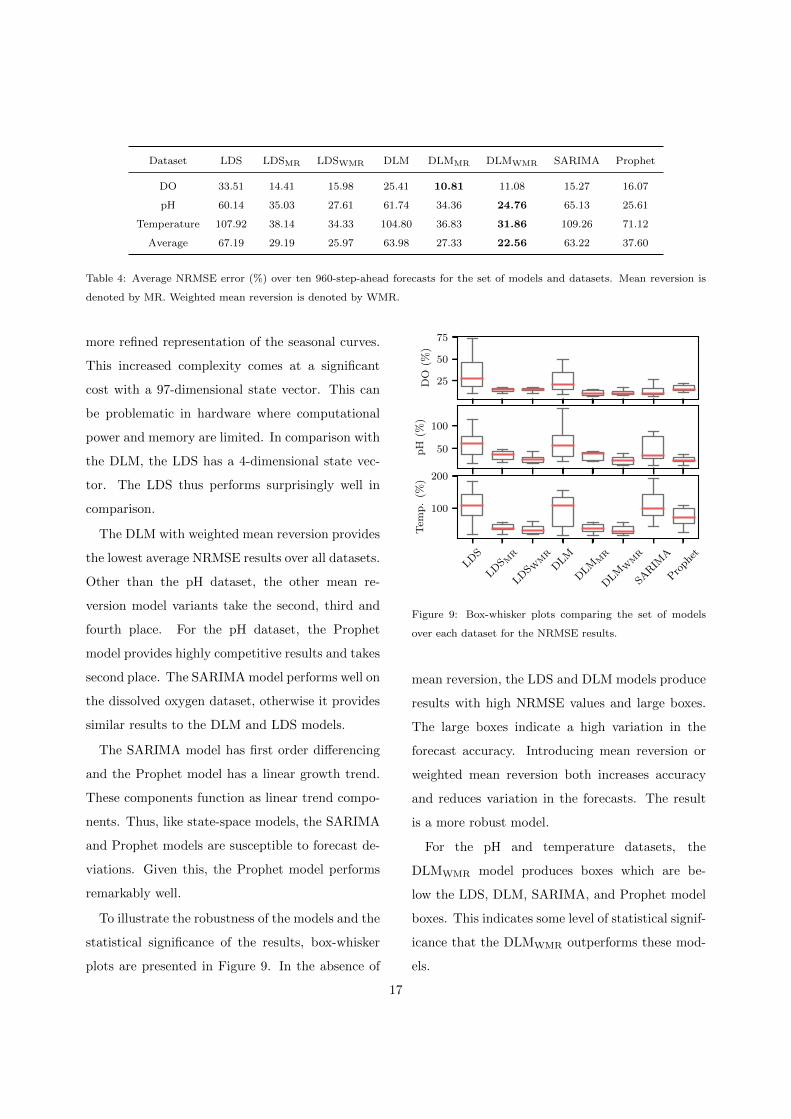
Dataset LDS LDSMR LDSWMR DLM DLMMR DLMWMR SARIMA Prophet
DO 33.51 14.41 15.98 25.41 10.81 11.08 15.27 16.07
pH 60.14 35.03 27.61 61.74 34.36 24.76 65.13 25.61
Temperature 107.92 38.14 34.33 104.80 36.83 31.86 109.26 71.12
Average 67.19 29.19 25.97 63.98 27.33 22.56 63.22 37.60
Table 4: Average NRMSE error (%) over ten 960-step-ahead forecasts for the set of models and datasets. Mean reversion is
denoted by MR. Weighted mean reversion is denoted by WMR.
more refined representation of the seasonal curves.
This increased complexity comes at a significant
cost with a 97-dimensional state vector. This can
be problematic in hardware where computational
power and memory are limited. In comparison with
the DLM, the LDS has a 4-dimensional state vec-
tor. The LDS thus performs surprisingly well in
comparison.
The DLM with weighted mean reversion provides
the lowest average NRMSE results over all datasets.
Other than the pH dataset, the other mean re-
version model variants take the second, third and
fourth place. For the pH dataset, the Prophet
model provides highly competitive results and takes
second place. The SARIMA model performs well on
the dissolved oxygen dataset, otherwise it provides
similar results to the DLM and LDS models.
The SARIMA model has first order differencing
and the Prophet model has a linear growth trend.
These components function as linear trend compo-
nents. Thus, like state-space models, the SARIMA
and Prophet models are susceptible to forecast de-
viations. Given this, the Prophet model performs
remarkably well.
To illustrate the robustness of the models and the
statistical significance of the results, box-whisker
plots are presented in Figure 9. In the absence of
25
50
75
DO
(%)
50
100pH
(%)
LDS
LDSM
R
LDSW
MR
DLM
DLMM
R
DLMW
MR
SARIMA
Prophet
100
200
Tem
p.(%
)
Figure 9: Box-whisker plots comparing the set of models
over each dataset for the NRMSE results.
mean reversion, the LDS and DLM models produce
results with high NRMSE values and large boxes.
The large boxes indicate a high variation in the
forecast accuracy. Introducing mean reversion or
weighted mean reversion both increases accuracy
and reduces variation in the forecasts. The result
is a more robust model.
For the pH and temperature datasets, the
DLMWMR model produces boxes which are be-
low the LDS, DLM, SARIMA, and Prophet model
boxes. This indicates some level of statistical signif-
icance that the DLMWMR outperforms these mod-
els.
17
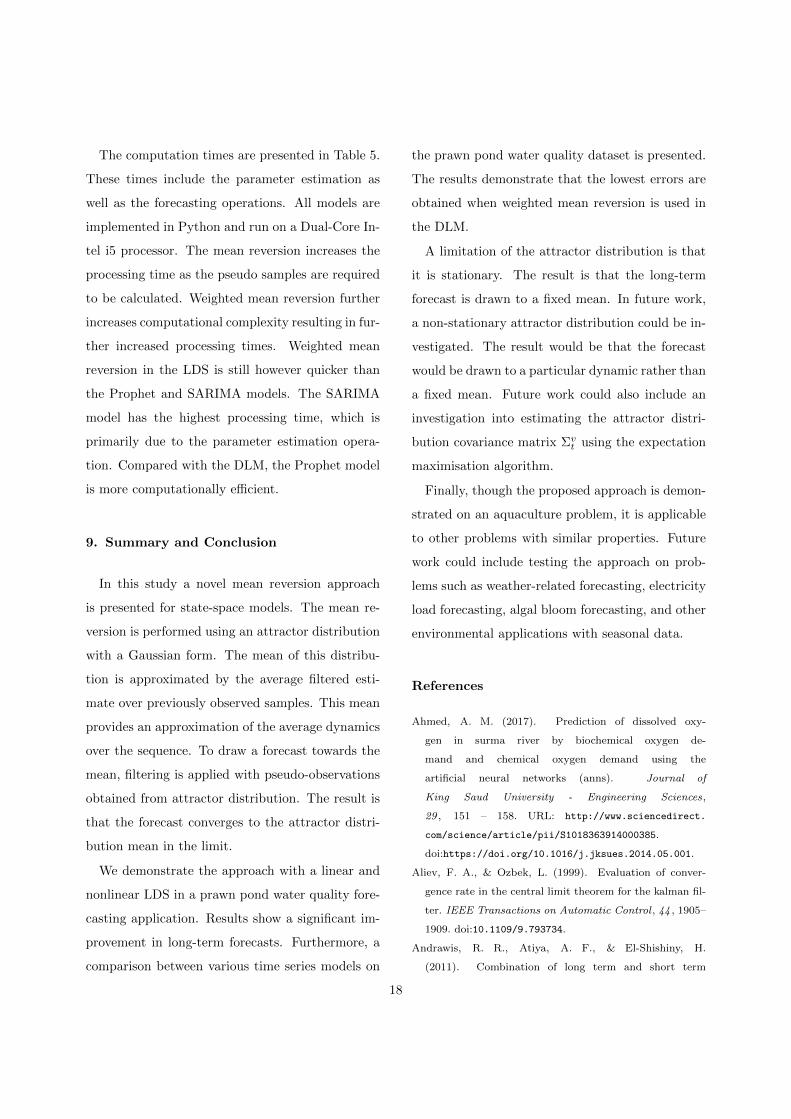
The computation times are presented in Table 5.
These times include the parameter estimation as
well as the forecasting operations. All models are
implemented in Python and run on a Dual-Core In-
tel i5 processor. The mean reversion increases the
processing time as the pseudo samples are required
to be calculated. Weighted mean reversion further
increases computational complexity resulting in fur-
ther increased processing times. Weighted mean
reversion in the LDS is still however quicker than
the Prophet and SARIMA models. The SARIMA
model has the highest processing time, which is
primarily due to the parameter estimation opera-
tion. Compared with the DLM, the Prophet model
is more computationally efficient.
9. Summary and Conclusion
In this study a novel mean reversion approach
is presented for state-space models. The mean re-
version is performed using an attractor distribution
with a Gaussian form. The mean of this distribu-
tion is approximated by the average filtered esti-
mate over previously observed samples. This mean
provides an approximation of the average dynamics
over the sequence. To draw a forecast towards the
mean, filtering is applied with pseudo-observations
obtained from attractor distribution. The result is
that the forecast converges to the attractor distri-
bution mean in the limit.
We demonstrate the approach with a linear and
nonlinear LDS in a prawn pond water quality fore-
casting application. Results show a significant im-
provement in long-term forecasts. Furthermore, a
comparison between various time series models on
the prawn pond water quality dataset is presented.
The results demonstrate that the lowest errors are
obtained when weighted mean reversion is used in
the DLM.
A limitation of the attractor distribution is that
it is stationary. The result is that the long-term
forecast is drawn to a fixed mean. In future work,
a non-stationary attractor distribution could be in-
vestigated. The result would be that the forecast
would be drawn to a particular dynamic rather than
a fixed mean. Future work could also include an
investigation into estimating the attractor distri-
bution covariance matrix Σvt using the expectation
maximisation algorithm.
Finally, though the proposed approach is demon-
strated on an aquaculture problem, it is applicable
to other problems with similar properties. Future
work could include testing the approach on prob-
lems such as weather-related forecasting, electricity
load forecasting, algal bloom forecasting, and other
environmental applications with seasonal data.
References
Ahmed, A. M. (2017). Prediction of dissolved oxy-
gen in surma river by biochemical oxygen de-
mand and chemical oxygen demand using the
artificial neural networks (anns). Journal of
King Saud University - Engineering Sciences,
29 , 151 – 158. URL: http://www.sciencedirect.
com/science/article/pii/S1018363914000385.
doi:https://doi.org/10.1016/j.jksues.2014.05.001.
Aliev, F. A., & Ozbek, L. (1999). Evaluation of conver-
gence rate in the central limit theorem for the kalman fil-
ter. IEEE Transactions on Automatic Control , 44 , 1905–
1909. doi:10.1109/9.793734.
Andrawis, R. R., Atiya, A. F., & El-Shishiny, H.
(2011). Combination of long term and short term
18
Dataset LDS LDSMR LDSWMR DLM DLMMR DLMWMR SARIMA Prophet
DO 1.96 3.61 5.12 31.83 64.38 97.17 556.43 15.22
pH 1.85 3.47 5.18 32.1 64.38 97.22 87.85 17.73
Temperature 2.16 3.95 5.61 31.6 64.53 96.46 190.23 17.51
Table 5: Average processing time in seconds over ten 960-step-ahead forecasts for the set of models and datasets. Mean
reversion is denoted by MR. Weighted mean reversion is denoted by WMR.
forecasts, with application to tourism demand forecast-
ing. International Journal of Forecasting, 27 , 870
– 886. URL: http://www.sciencedirect.com/science/
article/pii/S0169207010001147. doi:https://doi.org/
10.1016/j.ijforecast.2010.05.019. Special Section 1:
Forecasting with Artificial Neural Networks and Compu-
tational Intelligence Special Section 2: Tourism Forecast-
ing.
Barber, D. (2012). Bayesian Reasoning and Machine Learn-
ing. Bayesian Reasoning and Machine Learning. Cam-
bridge University Press.
Basant, N., Gupta, S., Malik, A., & Singh, K. P. (2010).
Linear and nonlinear modeling for simultaneous predic-
tion of dissolved oxygen and biochemical oxygen de-
mand of the surface water a case study. Chemo-
metrics and Intelligent Laboratory Systems, 104 , 172
– 180. URL: http://www.sciencedirect.com/science/
article/pii/S0169743910001449. doi:https://doi.org/
10.1016/j.chemolab.2010.08.005.
Box, G., Jenkins, G., Reinsel, G., & Ljung, G. (2015). Time
Series Analysis: Forecasting and Control . Wiley Series
in Probability and Statistics. Wiley.
Boyd, C. E., & Tucker, C. S. (1998). Pond aquaculture water
quality management . Springer US. doi:https://doi.org/
10.1007/978-1-4615-5407-3.
Brown, R. (1959). Statistical Forecasting for Inventory Con-
trol . McGraw-Hill. URL: https://books.google.com.au/
books?id=QSYnAAAAMAAJ. doi:https://doi.org/10.1016/
j.ijforecast.2003.09.015.
de Canete, J. F., Saz-Orozco, P. D., Baratti, R., Mu-
las, M., Ruano, A., & Garcia-Cerezo, A. (2016). Soft-
sensing estimation of plant effluent concentrations in a
biological wastewater treatment plant using an optimal
neural network. Expert Systems with Applications, 63 ,
8 – 19. URL: http://www.sciencedirect.com/science/
article/pii/S0957417416303098. doi:https://doi.org/
10.1016/j.eswa.2016.06.028.
Commandeur, J. J., & Koopman, S. J. (2007). An Intro-
duction to State Space Time Series Analysis. Practical
Econometrics. Oxford University Press.
Cox, J. C., Ingersoll, J. E., & Ross, S. A. (1985). A theory
of the term structure of interest rates. Econometrica, 53 ,
385–407. URL: http://www.jstor.org/stable/1911242.
Dabrowski, J. J., Rahman, A., & George, A. (2018a).
Prediction of dissolved oxygen from ph and water tem-
perature in aquaculture prawn ponds. In Proceedings
of the Australasian Joint Conference on Artificial In-
telligence - Workshops AIW’18 (pp. 2–6). New York,
NY, USA: ACM. URL: http://doi.acm.org/10.1145/
3314487.3314488. doi:10.1145/3314487.3314488.
Dabrowski, J. J., Rahman, A., George, A., Arnold, S., &
McCulloch, J. (2018b). State space models for forecast-
ing water quality variables: An application in aquacul-
ture prawn farming. In Proceedings of the 24th ACM
SIGKDD International Conference on Knowledge Dis-
covery & Data Mining KDD ’18 (pp. 177–185). New
York, NY, USA: ACM. URL: http://doi.acm.org/10.
1145/3219819.3219841. doi:10.1145/3219819.3219841.
Dogan, E., Sengorur, B., & Koklu, R. (2009). Mod-
eling biological oxygen demand of the melen river
in turkey using an artificial neural network tech-
nique. Journal of Environmental Management , 90 , 1229
– 1235. URL: http://www.sciencedirect.com/science/
article/pii/S0301479708001588. doi:https://doi.org/
10.1016/j.jenvman.2008.06.004.
Duan, W., He, B., Nover, D., Yang, G., Chen, W., Meng, H.,
Zou, S., & Liu, C. (2016). Water quality assessment and
pollution source identification of the eastern poyang lake
basin using multivariate statistical methods. Sustainabil-
ity, 8 . URL: https://www.mdpi.com/2071-1050/8/2/133.
19

doi:10.3390/su8020133.
Durbin, J., & Koopman, S. (2012). Time Series Analysis
by State Space Methods volume 38 of Oxford Statistical
Science Series. (2nd ed.). Oxford University Press.
Evensen, G. (1994). Sequential data assimilation with
a nonlinear quasi-geostrophic model using monte
carlo methods to forecast error statistics. Journal
of Geophysical Research: Oceans, 99 , 10143–10162.
URL: https://agupubs.onlinelibrary.wiley.com/
doi/abs/10.1029/94JC00572. doi:10.1029/94JC00572.
arXiv:https://agupubs.onlinelibrary.wiley.com/doi/pdf/10.1029/94JC00572.
Ginot, V., & Herve, J.-C. (1994). Estimating
the parameters of dissolved oxygen dynamics in
shallow ponds. Ecological Modelling, 73 , 169
– 187. URL: http://www.sciencedirect.com/
science/article/pii/0304380094900612. doi:https:
//doi.org/10.1016/0304-3800(94)90061-2.
Gooijer, J. G. D., & Hyndman, R. J. (2006). 25 years of time
series forecasting. International Journal of Forecasting,
22 , 443 – 473. URL: http://www.sciencedirect.com/
science/article/pii/S0169207006000021. doi:https://
doi.org/10.1016/j.ijforecast.2006.01.001. Twenty
five years of forecasting.
Gordon, N. J., Salmond, D. J., & Smith, A. F. M. (1993).
Novel approach to nonlinear/non-gaussian bayesian state
estimation. IEE Proceedings F - Radar and Signal Pro-
cessing, 140 , 107–113. doi:10.1049/ip-f-2.1993.0015.
Granger, C. W., & Jeon, Y. (2007). Long-term forecast-
ing and evaluation. International Journal of Forecasting,
23 , 539 – 551. URL: http://www.sciencedirect.com/
science/article/pii/S0169207007000908. doi:https://
doi.org/10.1016/j.ijforecast.2007.07.002.
Grewal, M., & Andrews, A. (2015). Kalman Filtering: The-
ory and Practice with MATLAB . John Wiley & Sons,
Inc. doi:10.1002/9781118984987.
Harvey, A. C. (1990). Forecasting, Structural Time Series
Models and the Kalman Filter . Cambridge University
Press. doi:10.1017/CBO9781107049994.
He, J., Chu, A., Ryan, M. C., Valeo, C., & Zaitlin, B.
(2011). Abiotic influences on dissolved oxygen in a
riverine environment. Ecological Engineering, 37 , 1804
– 1814. URL: http://www.sciencedirect.com/science/
article/pii/S0925857411002096. doi:https://doi.org/
10.1016/j.ecoleng.2011.06.022.
Holt, C. (1957). Forecasting seasonals and trends by expo-
nentially weighted averages (onr memorandum 52/1957).
Carnegie Institute of Technology, .
Hyndman, R., Koehler, A., Ord, J., & Snyder, R.
(2008). Forecasting with Exponential Smoothing: The
State Space Approach. Springer Series in Statistics.
Berlin, Heidelberg: Springer Berlin Heidelberg. URL:
https://doi.org/10.1007/978-3-540-71918-2. doi:10.
1007/978-3-540-71918-2.
Julier, S. J., & Uhlmann, J. K. (1997). New extension of the
kalman filter to nonlinear systems. In Signal processing,
sensor fusion, and target recognition VI (pp. 182–194).
SPIE volume 3068. URL: http://dx.doi.org/10.1117/
12.280797. doi:10.1117/12.280797.
Kalman, R. E. (1960). A new approach to linear filtering
and prediction problems. Journal of basic Engineering,
82 , 35–45.
Kandil, M., El-Debeiky, S., & Hasanien, N. (2001). Overview
and comparison of long-term forecasting techniques for
a fast developing utility: part i. Electric Power Systems
Research, 58 , 11 – 17. URL: http://www.sciencedirect.
com/science/article/pii/S0378779601000979.
doi:https://doi.org/10.1016/S0378-7796(01)00097-9.
Lu, Z., & Piedrahita, R. H. (1996). Stochastic Modeling of
temperature and dissolved oxygen in stratified fish ponds.
Technical Report Department of Biological and Agricul-
tural Engineering University of California, Davis, USA.
Thirteenth Annual Technical Report.
Madsen, H. I., Vollertsen, J., & Hvitved-Jacobsen, T. (2007).
Modelling the oxygen mass balance of wet detention ponds
receiving highway runoff. In G. M. Morrison, & S. Rauch
(Eds.), Highway and Urban Environment (pp. 487–497).
Dordrecht: Springer Netherlands.
Murphy, K. P. (2012). Machine learning: a probabilistic
perspective. MIT press.
Olyaie, E., Abyaneh, H. Z., & Mehr, A. D. (2017).
A comparative analysis among computational intel-
ligence techniques for dissolved oxygen prediction
in delaware river. Geoscience Frontiers, 8 , 517
– 527. URL: http://www.sciencedirect.com/science/
article/pii/S1674987116300469. doi:https://doi.org/
10.1016/j.gsf.2016.04.007.
20
Pavliotis, G. A. (2014). The fokker–planck equation. In
Stochastic Processes and Applications: Diffusion Pro-
cesses, the Fokker-Planck and Langevin Equations (pp.
87–137). New York, NY: Springer New York. URL: https:
//doi.org/10.1007/978-1-4939-1323-7_4. doi:10.1007/
978-1-4939-1323-7_4.
Petris, G., Petrone, S., & Campagnoli, P. (2009). Dynamic
Linear Models with R. Use R! New York, NY: Springer
New York. URL: https://doi.org/10.1007/b135794_1.
doi:10.1007/b135794_1.
Rankovic, V., Radulovic, J., Radojevic, I., Ostojic, A., &
Comic, L. (2010). Neural network modeling of dissolved
oxygen in the grua reservoir, serbia. Ecological Modelling,
221 , 1239 – 1244. URL: http://www.sciencedirect.com/
science/article/pii/S0304380009008692. doi:https://
doi.org/10.1016/j.ecolmodel.2009.12.023.
Rao, T., Rao, S., & Rao, C. (2012). Time Se-
ries Analysis: Methods and Applications vol-
ume 30 of Handbook of Statistics. Else-
vier. URL: https://www.elsevier.com/books/
time-series-analysis-methods-and-applications/
rao/978-0-444-53858-1.
Ren, Q., Zhang, L., Wei, Y., & Li, D. (2018).
A method for predicting dissolved oxygen in aqua-
culture water in an aquaponics system. Com-
puters and Electronics in Agriculture, 151 , 384
– 391. URL: http://www.sciencedirect.com/science/
article/pii/S0168169918303181. doi:https://doi.org/
10.1016/j.compag.2018.06.013.
Robertson, C. (Ed.) (2006). Australian prawn farming man-
ual: health management for profit . Queensland Depart-
ment of Primary Industries and Fisheries (QDPI&F).
Ruiz, L., Rueda, R., Cullar, M., & Pegalajar, M.
(2018). Energy consumption forecasting based
on elman neural networks with evolutive opti-
mization. Expert Systems with Applications, 92 ,
380 – 389. URL: http://www.sciencedirect.
com/science/article/pii/S0957417417306565.
doi:https://doi.org/10.1016/j.eswa.2017.09.059.
Schmid, B. H., & Koskiaho, J. (2006). Artificial neural
network modeling of dissolved oxygen in a wetland pond:
The case of hovi, finland. Journal of Hydrologic Engi-
neering, 11 , 188–192. URL: https://ascelibrary.org/
doi/abs/10.1061/(ASCE)1084-0699(2006)11:2(188).
doi:10.1061/(ASCE)1084-0699(2006)11:2(188).
arXiv:https://ascelibrary.org/doi/pdf/10.1061/(ASCE)1084-0699(2006)11:2(188).
Shi, P., Li, G., Yuan, Y., Huang, G., & Kuang, L. (2019).
Prediction of dissolved oxygen content in aquaculture us-
ing clustering-based softplus extreme learning machine.
Computers and Electronics in Agriculture, 157 , 329
– 338. URL: http://www.sciencedirect.com/science/
article/pii/S0168169918310421. doi:https://doi.org/
10.1016/j.compag.2019.01.004.
Soman, S. S., Zareipour, H., Malik, O., & Mandal, P. (2010).
A review of wind power and wind speed forecasting meth-
ods with different time horizons. In North American
Power Symposium 2010 (pp. 1–8). doi:10.1109/NAPS.
2010.5619586.
Spall, J. C., & Wall, K. D. (1984). Asymptotic distri-
bution theory for the kalman filter state estimator.
Communications in Statistics - Theory and Meth-
ods, 13 , 1981–2003. URL: https://doi.org/10.1080/
03610928408828808. doi:10.1080/03610928408828808.
arXiv:https://doi.org/10.1080/03610928408828808.
Ta, X., & Wei, Y. (2018). Research on a dissolved
oxygen prediction method for recirculating aquacul-
ture systems based on a convolution neural network.
Computers and Electronics in Agriculture, 145 , 302
– 310. URL: http://www.sciencedirect.com/science/
article/pii/S016816991730786X. doi:https://doi.org/
10.1016/j.compag.2017.12.037.
Taylor, S. J., & Letham, B. (2018). Forecasting
at scale. The American Statistician, 72 , 37–
45. URL: https://doi.org/10.1080/00031305.
2017.1380080. doi:10.1080/00031305.2017.1380080.
arXiv:https://doi.org/10.1080/00031305.2017.1380080.
Thrun, S., Burgard, W., & Fox, D. (2005). Probabilistic
Robotics. Intelligent robotics and autonomous agents.
MIT Press.
Vasicek, O. (1977). An equilibrium characterization of the
term structure. Journal of Financial Economics, 5 , 177
– 188. URL: http://www.sciencedirect.com/science/
article/pii/0304405X77900162. doi:https://doi.org/
10.1016/0304-405X(77)90016-2.
West, M., & Harrison, J. (1997). Bayesian Forecast-
ing and Dynamic Models. Springer Series in Statistics.
21

Springer New York. URL: https://doi.org/10.1007/
0-387-22777-6. doi:10.1007/0-387-22777-6.
Winters, P. R. (1960). Forecasting sales by ex-
ponentially weighted moving averages. Manage-
ment Science, 6 , 324–342. URL: https://doi.org/
10.1287/mnsc.6.3.324. doi:10.1287/mnsc.6.3.324.
arXiv:https://doi.org/10.1287/mnsc.6.3.324.
Xu, L., Liu, S., & Li, D. (2017). Prediction of water
temperature in prawn cultures based on a mechanism
model optimized by an improved artificial bee colony.
Computers and Electronics in Agriculture, 140 , 397
– 408. URL: http://www.sciencedirect.com/science/
article/pii/S0168169916305191. doi:https://doi.org/
10.1016/j.compag.2017.05.034.
Xu, Z., & Xu, Y. J. (2016). A deterministic model for
predicting hourly dissolved oxygen change: Development
and application to a shallow eutrophic lake. Water , 8 .
URL: http://www.mdpi.com/2073-4441/8/2/41. doi:10.
3390/w8020041.
Zarchan, P., & Musoff, H. (2000). Fundamentals of Kalman
Filtering: A Practical Approach. Number v. 190, pt. 1
in Fundamentals of Kalman Filtering: A Practical Ap-
proach. American Institute of Aeronautics and Astronau-
tics, Incorporated.
Zhang, G., Patuwo, B. E., & Hu, M. Y. (1998). Fore-
casting with artificial neural networks: The state of
the art. International Journal of Forecasting, 14 ,
35 – 62. URL: http://www.sciencedirect.com/science/
article/pii/S0169207097000447. doi:https://doi.org/
10.1016/S0169-2070(97)00044-7.
Zhang, G., & Qi, M. (2005). Neural network fore-
casting for seasonal and trend time series. Eu-
ropean Journal of Operational Research, 160 , 501
– 514. URL: http://www.sciencedirect.com/science/
article/pii/S0377221703005484. doi:https://doi.org/
10.1016/j.ejor.2003.08.037. Decision Support Systems
in the Internet Age.
Zhang, Y., Fitch, P., Vilas, M. P., & Thorburn, P. J.
(2019). Applying multi-layer artificial neural network
and mutual information to the prediction of trends in
dissolved oxygen. Frontiers in Environmental Science,
7 , 46. URL: https://www.frontiersin.org/article/10.
3389/fenvs.2019.00046. doi:10.3389/fenvs.2019.00046.
22