energydesign design brief - energy design resources : home · page 4 air conditioning &...
TRANSCRIPT
Summary
Air-conditioning and ventilation systems have a large impact on
building profitability. Not only do they consume about 33 percent
of an office building’s electricity, but they have a large influence
on worker productivity. Nonetheless, considerable evidence indi-
cates that air-conditioning systems receive less attention than they
deserve. Opportunities to cost-effectively improve the energy effi-
ciency of these systems frequently are overlooked, and surveys of
office workers have shown that one-third to one-half of those
questioned find their offices too hot or too cold.
This state of affairs is both unnecessary and uneconomical.
Using a whole-systems approach, designers around the world
have succeeded in crafting highly efficient air-conditioning sys-
tems that also provide excellent workspace comfort. Designers
begin by minimizing unwanted heat gains to reduce cooling
loads. Next, they design air-distribution systems and cooling
plants to meet those reduced cooling loads, taking advantage of
both capital and operating cost savings. Finally, they specify
highly efficient cooling plants.
In one exemplary building that benefited from this approach,
worker productivity improved by 16 percent, while electricity
consumption decreased by 40 percent. Another building’s clever
design made it possible to maintain thermal comfort in a hot cli-
mate without any electrically powered air-conditioning and ven-
tilation system. Designers need not feel pressured, however, to
produce such extraordinary results. Virtually any air-conditioning
and ventilation design can be incrementally improved through
the use of a whole-systems problem-solving approach.
design briefenergydesignresources
A WHOLE-SYSTEMS
APPROACH TO
INCREASING EFFICIENCY
air conditioning & ventilation
conte nts
Introduction 2
Reducing Cooling Loads 5
Improving the Efficiency of Air-Distribution Systems 8
Choosing High-Efficiency Unitary Equipment 11
Designing High-Efficiency Chilled Water Systems 15
Replacing Refrigerative Cooling with Evaporative Cooling 20
Air-Conditioning, Ventilation, and LEED 24
For More Information 26
Notes 28

page 2 air conditioning & ventilation
Introduction
Air-conditioning and ventilation systems have a tough assignment.
Although they work tirelessly to make buildings comfortable and
healthy, they are rarely noticed unless they aren’t working well.
That’s a shame, because these systems have a huge impact on the
bottom line for building owners and operators. For example, air-
conditioning and ventilation systems consume approximately 33
percent of the electricity used in commercial buildings nationally.1
Although the minimum efficiency of these systems is prescribed by
local and national codes and standards—such as the California
Energy Commission’s Title 24 (“Energy Efficiency Standards for
Residential and Nonresidential Buildings”)—there are often many
economically justifiable opportunities for reducing air-conditioning
energy costs that are overlooked.
The impact that air-conditioning systems have on worker pro-
ductivity is also frequently overlooked by owners and operators.
As Figure 1 shows, in a single year, office-workers’ salaries
$/square foot0 20 40 60 80 100 120 140
Office-workers salaries 130
Cost of building 87
Gross office rent 21
Total energy use 1.81
Electricity use 1.53
Repair and maintenance 1.37
Space cooling and air- handling electricity 0.61
Space cooling and air-handlingelectricity and maintenance
Total building operations andmanagement salaries
0.82
0.58
Annual operating costs in dollars per square foot for amedium-size office building
Figure 1:
In a midsize office building, one year’s worth of office-worker salaries is roughlyequivalent to one-and-one-half times the entire cost of constructing the building.
Courtesy: Platts
page 3air conditioning & ventilation
equal about $130 per square foot (ft2). That is about one-and-
one-half times the cost of constructing the building, nearly 100
times the annual electric bill, and about 160 times the operating
cost of the building’s space-cooling and air-handling system.2
Is it worthwhile to spend more money on a high-quality air-
conditioning and ventilation design that yields a more comfort-
able building and improved worker productivity? Judging from
studies showing that one-third to one-half of office workers
questioned find their offices to be too hot or too cold, the
answer would appear to be yes.3 Productivity gains need not
be large to quickly pay for the additional design and construc-
tion costs of improving these systems. For example, let’s
assume that a new commercial air-conditioning system costs
about $10 per ft2 to design and install. If a 10 percent increase
in the cost of that system resulted in only a 1 percent increase
in productivity, the additional cost would be paid back some-
time during the first year of operation. A 2004 study by Cornell
University indicates that the payback could be even quicker.
This study found that raising the office temperature from 68° to
77° Fahrenheit (F) increased typing performance and decreased
errors. This saved about $2.00 per hour per worker in lost pro-
ductivity. The productivity savings amount to over 12 percent.4
Because productivity improvements have the potential to yield
far greater returns than energy-efficiency improvements would,
we also need to ask whether it might make sense to improve
productivity at the cost of increased energy consumption. If one
had to choose between these two attributes, the obvious choice
would be productivity. Fortunately, building designers do not
have to settle for that kind of trade-off. It is possible to design
highly efficient air-conditioning systems that also provide excel-
lent workspace comfort, yielding lifetime economic benefits for
owners and well-modulated temperatures for occupants.
For example, when the West Bend Mutual Insurance Co. built its
new 150,000-ft2 headquarters in West Bend, Wisconsin, several
If you were forced to choose between
improving productivity and improving
energy efficiency, the obvious bottom-
line choice would be productivity.
Fortunately, designers do not have to
settle for that kind of trade-off.

page 4 air conditioning & ventilation
years ago, the building design incorporated many energy-efficient
features, such as upgrades to lighting and window systems. The
finished, all-electric building uses 40 percent less electricity than
West Bend’s old building, which was heated by gas.5
But the savings don’t end there. The advanced air-conditioning
system designed for the building also includes “personal envi-
ronment modules” for 430 of West Bend’s 500 employees. The
modules feature adjustable desktop diffusers that allow employ-
ees to control both the airflow and the temperature right at their
desktops (Figure 2).6 Before and after the move, researchers
monitored the performance of West Bend’s workers. Overall
productivity improved by 16 percent after workers moved into
the new building. To determine what portion of that improve-
ment was due to the personal environment modules,
researchers turned off some of the modules at random and con-
tinued monitoring. The results indicated that the personal envi-
ronment modules were responsible for a 2.8 percent gain in
productivity, worth about $364,000 per year to West Bend—
which was enough to pay for the modules in just 18 months.
Desktop diffuser(direction
adjustable)Task lamp
Desktopcontroller Occupancy
sensor
Speakers
Mixing dampers
Cool air fromsupply system
Raised floor plenum
Radiantheat panel
Electrostatic filterCoarse filter
Warmrecirculated air
Flex ductVariable-speed fan
A personal environment moduleFigure 2:
Johnson Controls Personal Environment Module allows users to adjust desktop air temperature and airflow by way of a fan-poweredmixing box located beneath the desk. The box draws chilled air from the floor plenum or from a vertical chase and passes it throughan optional electrostatic filter to adjustable desktop diffusers. An optional electric radiant panel provides heating when needed, andan infrared occupancy sensor mounted on the desktop controller turns off the module s task lighting and other functions after thespace has been unoccupied for 10 minutes.
Courtesy: Johnson Controls [6]

page 5air conditioning & ventilation
Building designers can achieve high levels of comfort and energy
efficiency with or without such modular environments. However,
to get the best results designers must be willing to start with the
objective—in this case, a comfortable and efficient workspace—
and then move upstream through the possible systems, selecting
the best technologies for reaching that goal. For example, a
designer might first reduce cooling loads by minimizing unwant-
ed heat gains. Next, the efficiency of air-distribution systems
might be improved, and last, the designer might specify highly
efficient cooling plants—or achieve even greater savings by
replacing refrigerative cooling with evaporative cooling.
Although this whole-systems integrated design approach is a
departure from business as usual, it is not so complicated; any
designer could benefit from approaching problem-solving in
this way. Once mastered, the whole-systems integrated design
approach gives designers an edge that will clearly distinguish
them from more conventional competitors who seek only to meet
minimum standards and who follow conventional rules of thumb.
Reducing Cooling Loads
The least expensive way to cut cooling costs for a building may
be to not introduce unwanted heat into it in the first place. During
the cooling season in many commercial buildings, most of the
electricity used to power lights generates heat that must ultimate-
ly be carried away by the air-conditioning and ventilation system.
If ordinary lighting systems are replaced with more-efficient ones,
less electricity is needed to power the lighting system, and therefore
less heat is given off, lightening the load for the cooling system.
Once cooling loads have been reduced, an air-conditioning
designer may be able to specify a smaller, less-expensive cool-
ing system, reducing operating costs even further. Such a system
would feature a smaller cooling plant, but often the designer can
also specify smaller pipes, fans, and pumps. These savings may,
in turn, offset any additional costs associated with installing the
technologies that lightened the cooling load.
Although the whole-systems integrated
design approach is a departure from
business as usual, it is not so complicat-
ed; any designer could benefit from
approaching problem-solving in this
way.
page 6 air conditioning & ventilation
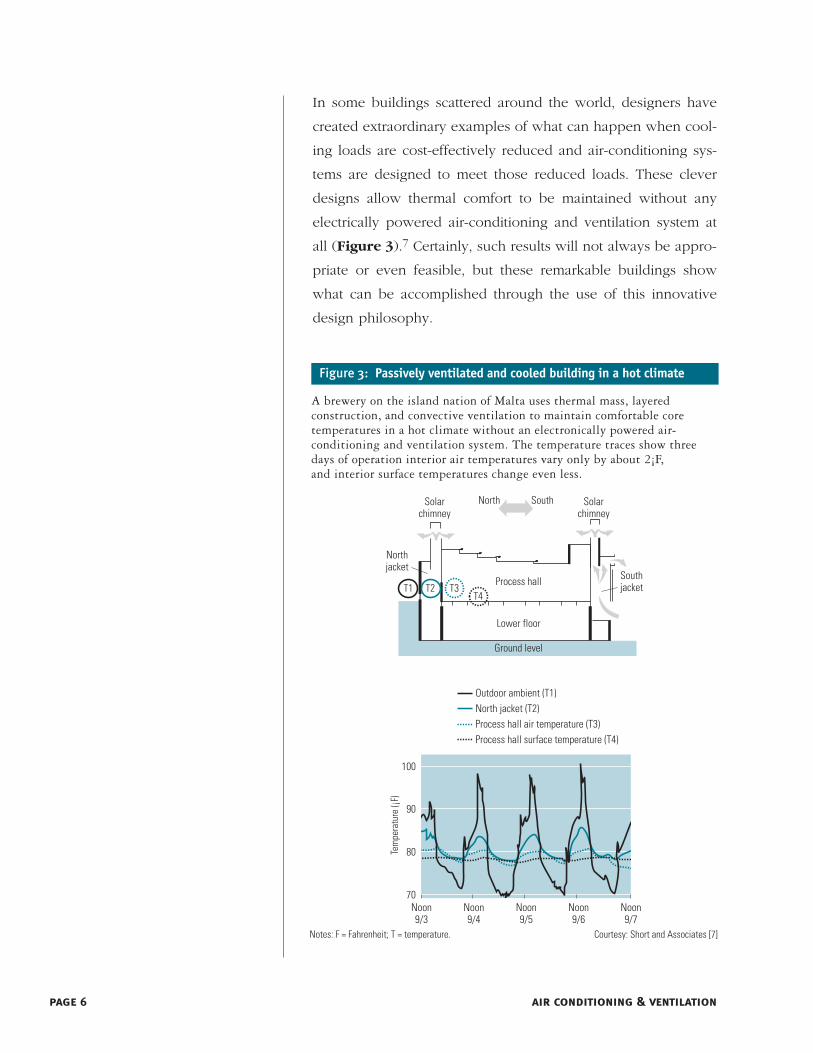
In some buildings scattered around the world, designers have
created extraordinary examples of what can happen when cool-
ing loads are cost-effectively reduced and air-conditioning sys-
tems are designed to meet those reduced loads. These clever
designs allow thermal comfort to be maintained without any
electrically powered air-conditioning and ventilation system at
all (Figure 3).7 Certainly, such results will not always be appro-
priate or even feasible, but these remarkable buildings show
what can be accomplished through the use of this innovative
design philosophy.
80
90
100
Notes: F = Fahrenheit; T = temperature.
Tem
pera
ture
(¡F)
Passively ventilated and cooled building in a hot climateFigure 3:
Noon9/6
Noon9/7
Noon9/5
Noon9/4
Noon9/3
70
Outdoor ambient (T1)North jacket (T2)Process hall air temperature (T3)Process hall surface temperature (T4)
A brewery on the island nation of Malta uses thermal mass, layeredconstruction, and convective ventilation to maintain comfortable coretemperatures in a hot climate without an electronically powered air-conditioning and ventilation system. The temperature traces show threedays of operation interior air temperatures vary only by about 2¡F,and interior surface temperatures change even less.
Courtesy: Short and Associates [7]
Ground level
Lower floor
Process hall
Northjacket
Southjacket
Solarchimney
Solarchimney
T1 T2 T3T4
North South

page 7air conditioning & ventilation
In addition to improving the efficiency of lighting systems, other
strategies that might be employed to reduce cooling loads
include (see Figure 4):
■ Carefully designing the building’s form and orientation to max-
imize daylighting and natural ventilation while minimizing
unwanted solar gain and reducing the use of electric lighting.
Light-colored roof coatingsreflect solar radiation andreduce conduction potential
Spectrally selectiveglazings let light in butkeep heat out
Smaller cooling plant,accurately sized to meetthe reduced cooling load
Roof-wetting lowers rooftemperature by evaporativeand radiative cooling
Trees block solar radiation andprovide cooling benefit throughevapotranspiration
Automatic louvers, fixedlouvers, and solar screensblock solar radiation
Movable awningsprovide shade
Window films reduce solargain without sacrificingdaylight or aesthetics
Insulating the roof helpsdecrease heat conduction tothe inside of the building
Structural overhangs,lightshelves reducesolar gain
South
Courtesy: Platts
Strategies for reducing cooling loadsFigure 4:
This representative commercial building displays a variety of techniques for reducing cooling loads, including roof-wetting to lowertemperatures through evaporative and radiative cooling.

page 8 air conditioning & ventilation
■ Selecting heat-reflecting envelope materials, including win-
dow shading, advanced solar-control glazings, insulation,
venting, louvers, and light-colored facades and roofs.
■ Planting trees and other vegetation to block unwanted sunlight.
To gain the full benefits of these strategies, designers must accu-
rately size the cooling systems of any building in which these
strategies are to be implemented.
How much impact can reducing cooling loads and accurately
sizing air-conditioning systems have? For the Harmony Library,
built in the late 1990s at the Front Range Community College
campus in northern Colorado, demand charges were cut in half
and energy costs were reduced by 35 percent compared to sim-
ilar buildings by using many of the methods mentioned above.
Diffuse daylight is brought into the building and focused on the
ceiling to provide interior lighting without a lot of direct solar
heat gain during the cooling season. In addition, windows that
provide views to occupants have low-transmittance glazings to
reduce glare and heating loads and to strike a visual balance
between indoor and outdoor lighting levels (a bright exterior
will often cause people to turn up indoor lighting to reduce con-
trast levels, even when interior light levels are adequate).
Overhangs are also used to fully or partially block high-angle
sunlight. Because these measures reduce cooling loads, the
chiller was able to be downsized, and the building cost no more
to build than a conventional one.8
Improving the Efficiency of Air-Distribution Systems
Air-distribution systems bring in fresh outside air to disperse con-
taminants, to provide free cooling, to transport heat generated or
removed by space-conditioning equipment, and to create air
movement in the space being conditioned. About 30 percent of
the energy consumed by air-conditioning systems is used to power
the fans that drive air distribution.9 In California, Title 24 sets max-
imum limits for the amount of power that can be consumed by
For the Harmony Library, built in the late
1990s at the Front Range Community
College campus in northern Colorado,
demand charges were cut in half and
energy costs were reduced by 35 percent
compared to similar buildings by manag-
ing cooling loads.
page 9air conditioning & ventilation
air-distribution fans, but it is entirely possible to design systems
that consume far less power. Again, a designer following the
whole-system integrated design approach would begin down-
stream and work through the system, in the following sequence:
1. Minimize airflows. Accurately determine cooling and outside
air requirements, and specify variable air volume (VAV) controls
that continuously adjust the volume of supply air to building
loads. Also, buildings that have long operating hours, widely
varying and unpredictable occupancy, and at least moderate
heating or cooling loads can benefit from demand-controlled
ventilation. Minimizing airflows links the amount of outside air
drawn in to the actual occupancy of the building at any given
time. This can reduce both the fan energy needed to ventilate
and also the energy used to heat or cool outside air.
2. Minimize the friction of distribution system components.
Mechanically delivered air must cover a lot of territory
before it reaches a building occupant, winding its way
through filters, cooling coils, silencers, ducts, dampers, and
diffusers. Select components that offer low pressure drop
wherever it will be cost-effective. For example, doubling the
diameter of a duct reduces its friction by a factor of 25, so
that the friction becomes one-32nd of its original value.
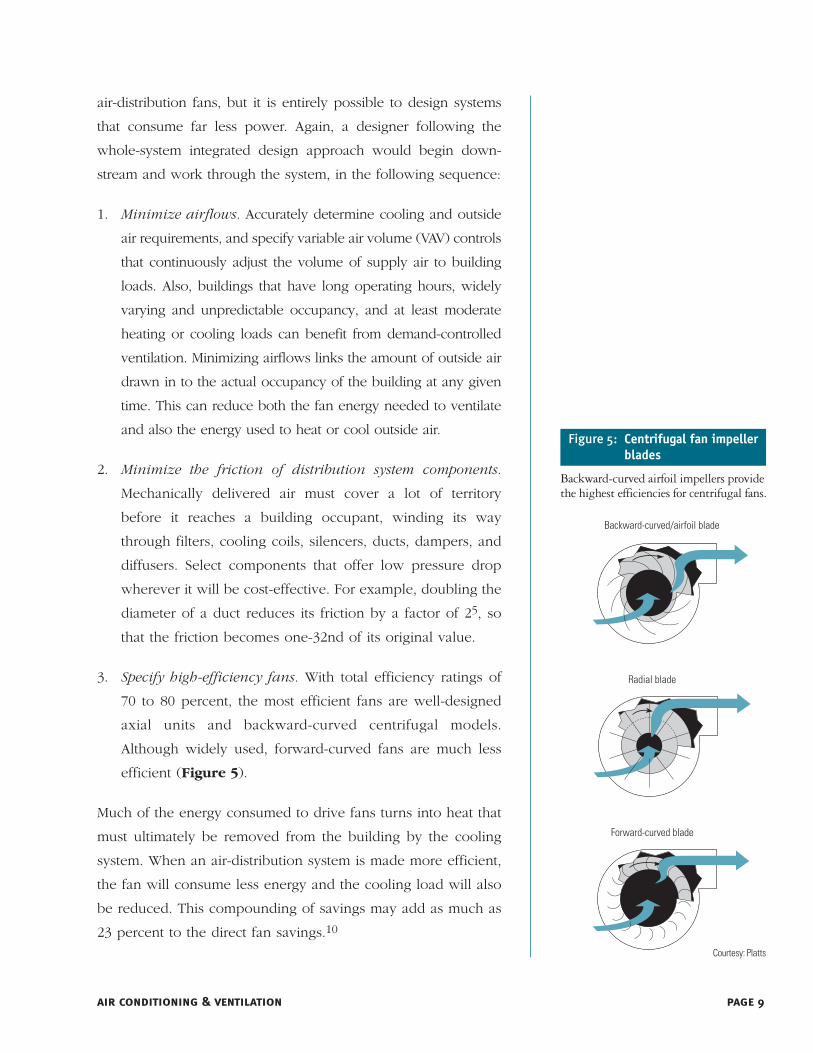
3. Specify high-efficiency fans. With total efficiency ratings of
70 to 80 percent, the most efficient fans are well-designed
axial units and backward-curved centrifugal models.
Although widely used, forward-curved fans are much less
efficient (Figure 5).
Much of the energy consumed to drive fans turns into heat that
must ultimately be removed from the building by the cooling
system. When an air-distribution system is made more efficient,
the fan will consume less energy and the cooling load will also
be reduced. This compounding of savings may add as much as
23 percent to the direct fan savings.10
Courtesy: Platts
Radial blade
Backward-curved/airfoil blade
Forward-curved blade
Centrifugal fan impellerblades
Figure 5:
Backward-curved airfoil impellers providethe highest efficiencies for centrifugal fans.

page 10 air conditioning & ventilation
When the Sacramento Municipal Utility District (SMUD) began
designing a new 175,000-ft2 customer service center in the mid-
1990s, the district applied the whole-systems integrated design
approach. The designers selected an underfloor air-distribution
system, which uses a 12-inch gap below raised flooring through-
out the office space as the supply-air plenum (Figure 6).
Underfloor systems offer six major benefits:
■ Reduced fan power. Although more air flows through under-
floor systems, the floor plenum presents far less resistance
than ductwork, so the fan doesn’t have to work as hard.
■ Higher chiller efficiency. Underfloor systems use warmer
supply air (about 60° to 65°F), allowing for a warmer evap-
orator temperature, which boosts chiller efficiency.
■ Extended economizer range. Using warmer supply air sig-
nificantly extends conditions for free cooling (using outside
air directly for cooling, with no chiller operation), especial-
ly in mild climates.
■ Better heat removal. Because underfloor systems provide
floor-to-ceiling airflow, most of the heat from ceiling-mounted
lights is carried away before it can enter a conditioned space.
This reduces the effective cooling load in the conditioned
space, allowing warmer air to condition the area.
■ More-effective pollutant removal. The vertical airflow elimi-
nates lateral air mixing. Pollutants are drawn up in a vertical
plume to the ceiling rather than being swirled around with
room air.
■ Flexible space arrangements. The raised floor, with its modu-
lar panels, makes it easy to relocate diffusers, wiring, and
even plumbing to accommodate changes in occupancy.
Dollar savings from this benefit can be more than those from
the reduction in energy usage that underfloor systems can pro-
vide, depending on how often workspaces are reconfigured. Courtesy: Platts
Raised flooringFigure 6:
Raised floors look conventional from above,but there is plenty of space for cablingand airflow beneath the 2-by-2-footstructural squares.
page 11air conditioning & ventilation
Given these benefits, one might expect underfloor systems to be
considerably more expensive than conventional air-distribution
systems, but evidence suggests they are not. A comparison of
floor and duct costs from four projects shows construction costs
for the two types of systems to be nearly equal. In general, the
costs of the raised floor cancel out the savings from not having
to build a duct system.11
The underfloor system at the SMUD Customer Service Center has
paid off. Employees report that the air feels cleaner, and absen-
teeism has been cut by 30 percent. The utility also saves significant
amounts of money every time it reconfigures the workspace. The
marginal cost for the system was recouped after the first few moves
and, with at least half of SMUD’s employees moving once per year,
the savings continue to grow. The underfloor air system was also
projected to cut the building’s cooling energy requirements by
about 10 percent and fan energy requirements by about 5 percent,
but the organization has not tracked the energy savings.12
For buildings that use VAV systems, a free design guide is avail-
able that can help capture energy savings. The Advanced
Variable Air Volume Design Guide (http://energydesignre-
sources.com/Resources/Publications/DesignGuidelines/tabid/73
/articleType/ArticleView/articleId/331/Default.aspx), sponsored
by the California Energy Commission Public Interest Energy
Research program, was written for HVAC designers and focuses
on VAV systems in multistory office buildings. It includes best
practices for many system components and provides guidance
on integrating the entire air-distribution system.
Choosing High-Efficiency Unitary Equipment
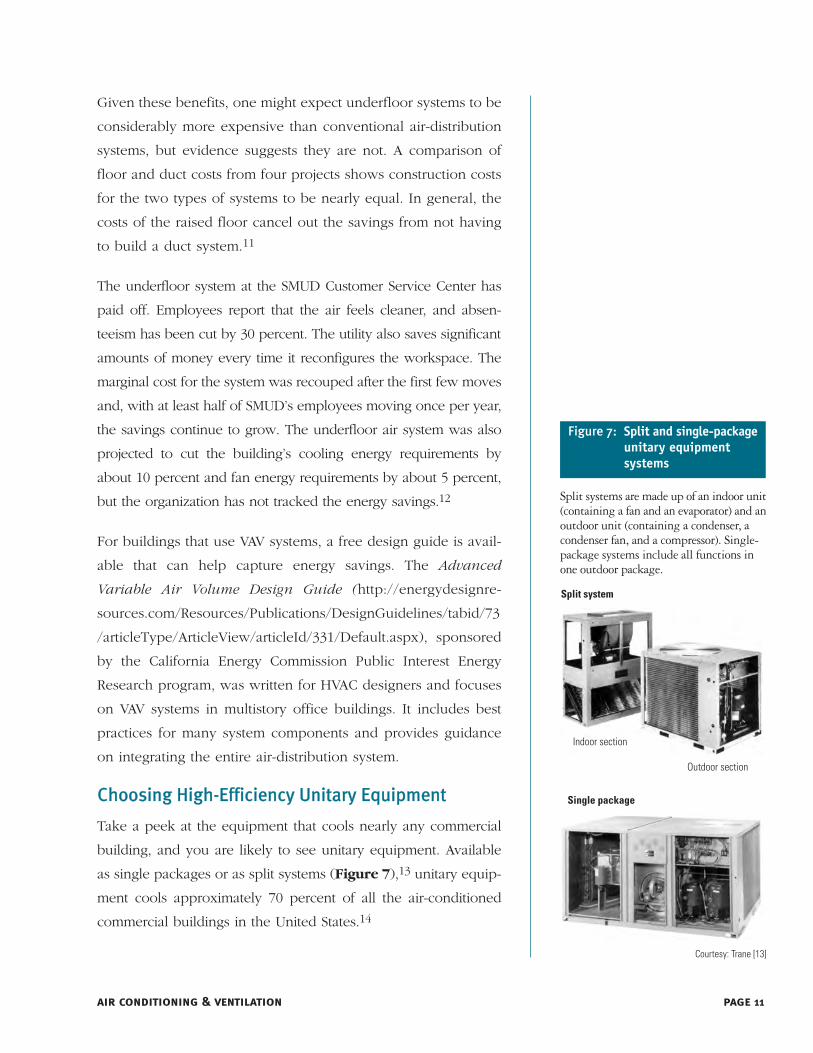
Take a peek at the equipment that cools nearly any commercial
building, and you are likely to see unitary equipment. Available
as single packages or as split systems (Figure 7),13 unitary equip-
ment cools approximately 70 percent of all the air-conditioned
commercial buildings in the United States.14
Courtesy: Trane [13]
Single package
Split system
Outdoor section
Indoor section
Split and single-packageunitary equipmentsystems
Figure 7:
Split systems are made up of an indoor unit(containing a fan and an evaporator) and anoutdoor unit (containing a condenser, acondenser fan, and a compressor). Single-package systems include all functions inone outdoor package.
page 12 air conditioning & ventilation
The cooling efficiencies of both single-package and split-system
unitary air conditioners under 250,000 Btu per hour (Btu/h) are
certified according to standards published by the Air-Conditioning
and Refrigeration Institute (ARI). ARI standards also apply to units
of 250,000 Btu/h and over, but ARI has no certification program
and does not publish efficiency data for this size range.
The three cooling-efficiency measurements defined in the ARI stan-
dards are EER (the energy-efficiency ratio), SEER (the seasonal
energy-efficiency ratio), and IPLV (the integrated part-load value).
EER is a ratio of the rate of cooling (Btu/h) to the power input (in
watts) at full-load conditions. The power input includes all inputs
to compressors, fan motors, and controls. SEER and IPLV are esti-
mated or calculated ratios of annual cooling (in Btu) to the annu-
al energy consumption (in watt-hours [Wh]). SEER is a seasonally
adjusted rating based on representative residential loads that
applies only to units with a cooling capacity of less than 65,000
Btu/h. IPLV, a seasonal efficiency rating method based on repre-
sentative commercial loads, applies to units with cooling capacities
at or greater than 65,000 Btu per hour. EER is the rating of choice
when determining which unit will operate most efficiently during
full-load conditions. SEER and IPLV are better than EER for deter-
mining which unit will use less energy over the course of an entire
cooling season.
Standards set by the federal government require that manufactur-
ers produce equipment at minimum efficiency levels. In addition,
the California Energy Commission, via Title 24, establishes mini-
mum efficiency levels for equipment used in California buildings.
Table 1 and Table 2 summarize these minimum efficiencies.
When trying to minimize operating costs, the design challenge is
to specify the most efficient unit that will fit within a client’s cost-
effectiveness limits. There is a lot of choice—manufacturers offer
units with a wide range of efficiencies that exceed the minimum
efficiency ratings across the different sizes of cooling plants.
There is a lot of choice—manufacturers
offer units with a wide range of efficiencies.
page 13air conditioning & ventilation
Two main sources of information are available to help designers
identify units that exceed the minimum efficiency ratings: ARI
and the California Energy Commission. The most widely used
references are directories maintained by ARI, which include
products from all ARI member-manufacturers. These directories
are available in both print and electronic formats. Although the
California Energy Commission also maintains a database on its
web site, only units with up to 65,000 Btu per hour cooling
capacity are listed there.
The Pacific Northwest National Laboratory offers a free web-
based life-cycle cost estimation tool that can be used to compare
high-efficiency unitary air-conditioning equipment to standard
equipment. After a user enters data for a specific unit along with
Notes: EER = energy-efficiency ratio; EPAct = Energy Policy Act of 2005; IPLV = integrated part-load value;kBtu/h = thousand Btu per hour; T 24 = California Title 24 Building Energy Efficiency Standards;NA = not applicable.
Courtesy: Platts
65 to <135 kBtu/h(5.40 to <11.25 tons)
135 to <240 kBtu/h(11.25 to <20.00 tons)
240 to <760 kBtu/h(20.00 to <63.33 tons)
≥ 760 kBtu/h(≥63.33 tons)
Standard Effective date
1992 U.S. federal standard
T 24: air conditioners
T 24: heat pumps (cooling mode)
EPAct: Air conditioners
January 1, 1994
January 1, 2010
January 1, 2010
January 1, 2010
EER
8.5
11.0
10.6
11.0
IPLV
7.5
NA
NA
NA
EER
NA
IPLV
NA
9.7
9.2
NA
EER
NA
9.7
9.5
NA
IPLV
NA
9.4
9.2
NA
EER
8.9
11.2
11.0
11.2
IPLV
8.3
NA
NA
NA
EPAct: Heat pumps (cooling mode) January 1, 2010 10. 6 NA
10.0
9.5
10.0
9.5 NA NA NA11.0 NA
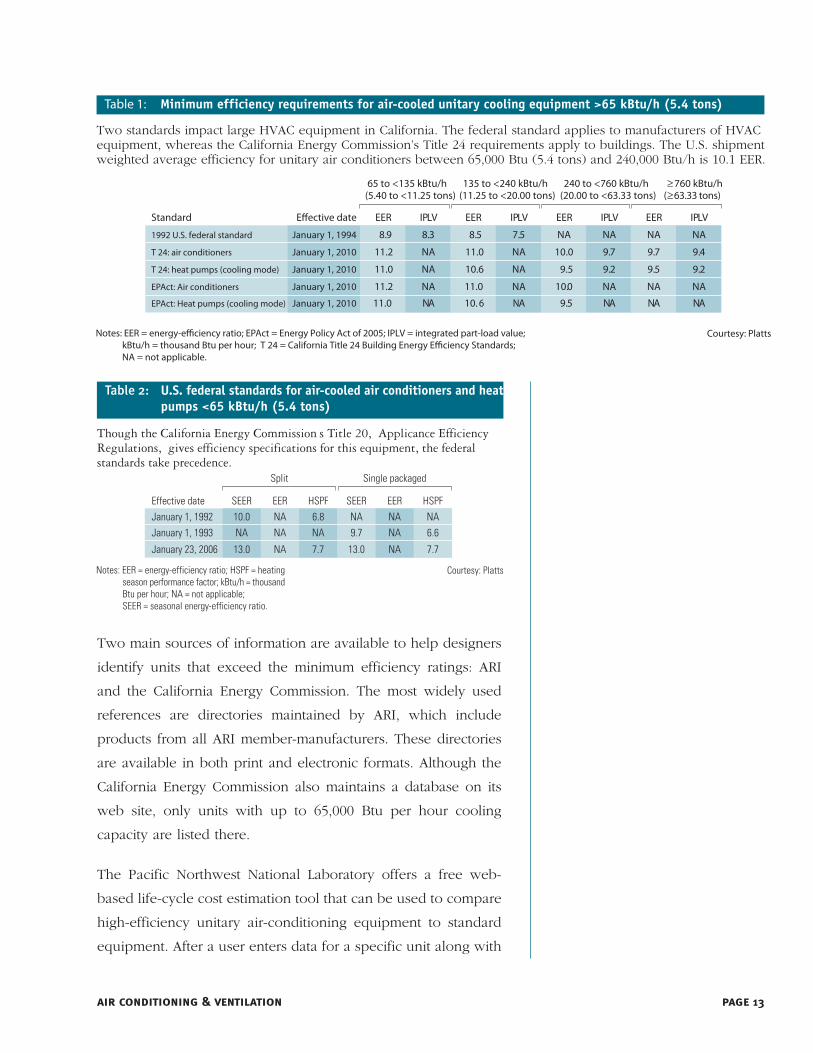
Minimum efficiency requirements for air-cooled unitary cooling equipment >65 kBtu/h (5.4 tons)Table 1:
Two standards impact large HVAC equipment in California. The federal standard applies to manufacturers of HVACequipment, whereas the California Energy Commission’s Title 24 requirements apply to buildings. The U.S. shipmentweighted average efficiency for unitary air conditioners between 65,000 Btu (5.4 tons) and 240,000 Btu/h is 10.1 EER.
Notes: EER = energy-efficiency ratio; HSPF = heatingseason performance factor; kBtu/h = thousandBtu per hour; NA = not applicable;SEER = seasonal energy-efficiency ratio.
Courtesy: Platts
Effective date
Split Single packaged
January 1, 1992January 1, 1993 NA
January 23, 2006
EERNANA
NA
HSPF
NA6.8
7.7
SEERNA9.7
13.0
EERNANA
NA
HSPFNA6.6
7.7
SEER10.0
13.0
U.S. federal standards for air-cooled air conditioners and heatpumps <65 kBtu/h (5.4 tons)
Table 2:
Though the California Energy Commission s Title 20, Applicance EfficiencyRegulations, gives efficiency specifications for this equipment, the federalstandards take precedence.
location information, the tool estimates life-cycle cost, simple
payback, and other metrics as compared to a standard unit
(which is also user-definable).
To manually calculate the potential savings that might be real-
ized with a unit that exceeds minimum efficiency, the designer
starts by determining the demand savings that would occur dur-
ing a peak cooling moment, using the following equation:
kWsavings = tons x (12/EERminimum – 12/EERimproved)
where:
kW = kilowatt
kWsavings = demand savings
tons = capacity (12,000 Btu/h = 1 ton)
EERminimum = rating of minimum-efficiency unit (Btu/Wh)
EERimproved = rating of improved-efficiency units (Btu/Wh)
To estimate annual electric energy savings, you will need an esti-
mate of the “annual equivalent full-load cooling hours” (AEFLCH).
That’s the number of hours an air conditioner would run at full
load to consume the same amount of electric energy it consumes
on average over the course of an entire year. Annual equivalent
full-load hours are listed in a variety of engineering manuals,
including those published by ASHRAE (the American Society of
Heating, Refrigerating, and Air-Conditioning Engineers).15 In
southern California, the AEFLCH generally range from about
1,000 to 1,500 hours per year. With an estimate of AEFLCH in
hand, annual savings may then be calculated as follows:
kWhsavings = kWsavings x AEFLCH
where:
kWh = kilowatt-hour
kWhsavings = annual electric energy savings (kWh)
The costs and efficiency ratings of individual unitary air condi-
tioners vary so widely that the economics of purchasing a high-
efficiency unit must be analyzed on a case-by-case basis. Take, for
example, a choice between a 15-ton rooftop unit rated at 9.7 EER
page 14 air conditioning & ventilation
The costs and efficiency ratings of indi-
vidual unitary air conditioners vary so
widely that the economics of purchasing
a high-efficiency unit must be analyzed
on a case-by-case basis.
and another rated at 10.8 EER. Let’s say that the high-efficiency unit
costs about $725 more than the minimum-efficiency unit. During
peak cooling conditions, the high-efficiency unit would draw
1.9 kW less power, and assuming 1,500 AEFLCH, it would save
about 2,850 kilowatt-hours (kWh). At an average electricity cost of
8.2¢/kWh, annual savings would be, on average, about $234 per
year, yielding a simple annual payback period of three years.
Designing High-Efficiency Chilled Water Systems
Chilled water systems feature separate central chillers and air
handlers, with a network of pipes and pumps to connect them.
These systems are mainly found in large buildings. Although
only 19 percent of all commercial building floorspace in U.S.
buildings is cooled by chillers, at least in part, approximately
44 percent of all buildings larger than 100,000 ft2 contain
chilled water systems.16
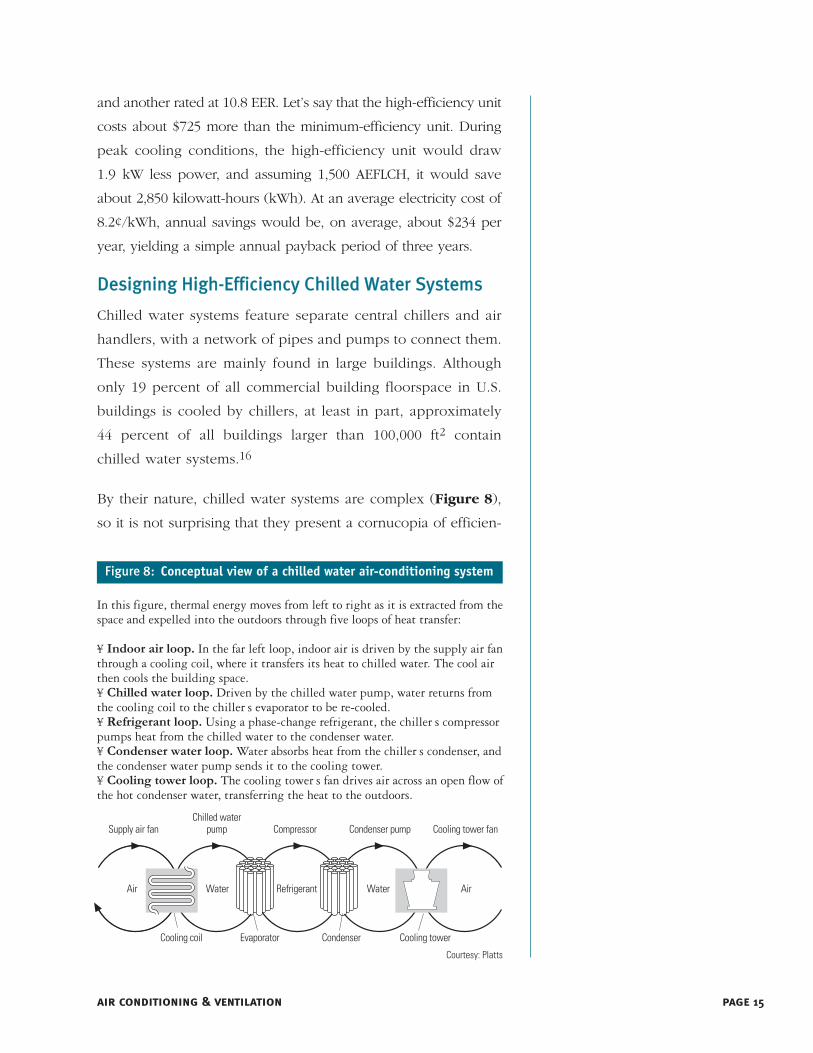
By their nature, chilled water systems are complex (Figure 8),
so it is not surprising that they present a cornucopia of efficien-
page 15air conditioning & ventilation
Courtesy: Platts
Supply air fanChilled water
pump Compressor Condenser pump Cooling tower fan
Cooling coil CondenserEvaporator Cooling tower
Air AirWater Refrigerant Water
Conceptual view of a chilled water air-conditioning systemFigure 8:
In this figure, thermal energy moves from left to right as it is extracted from thespace and expelled into the outdoors through five loops of heat transfer:
¥ �������������� In the far left loop, indoor air is driven by the supply air fanthrough a cooling coil, where it transfers its heat to chilled water. The cool airthen cools the building space.¥ �������������� Driven by the chilled water pump, water returns fromthe cooling coil to the chiller s evaporator to be re-cooled.¥ ��������������� Using a phase-change refrigerant, the chiller s compressorpumps heat from the chilled water to the condenser water.¥ ������������������� Water absorbs heat from the chiller s condenser, andthe condenser water pump sends it to the cooling tower.¥ ��������������� The cooling tower s fan drives air across an open flow ofthe hot condenser water, transferring the heat to the outdoors.
cy opportunities. Designers who think their way upstream
through these systems, starting at the cooling coil and ending at
the cooling tower fan, are likely to find opportunities to improve
efficiency while taking advantage of capital cost savings for
upstream components. For example, by reducing resistance
within the piping system, a designer might be able to reduce
capital costs by specifying a smaller pump and a smaller chiller.
The following list presents efficiency opportunities for chilled
water systems that should be balanced against capital costs for
implementing them, in downstream-to-upstream order:
■ Select cooling coils for low air-side and water-side flow resis-
tance and for low cooling-water flow rates.
■ Increase pipe diameters and specify low-friction valves to
reduce flow resistance for the chilled water.
■ Specify highly efficient pumps with highly efficient motors.
■ Control chilled water pumps with adjustable-speed drives.
However, do take precautions to ensure that flow rates
through chillers are maintained at safe levels.
■ Specify high-efficiency water-cooled chillers. Although Title
24 sets minimums for chillers, a lot of equipment is available
with higher efficiency ratings. For example, the Title 24 min-
imum for water-cooled centrifugal chillers that are 300 tons or
greater is 0.576 kW per ton at standard full-load conditions,
but some of the centrifugal chillers now available operate at
0.470 kW per ton. Given that annual energy costs for a chiller
may amount to as much as one-third of their purchase price,
even a modest improvement in efficiency can yield substan-
tial energy savings and attractive paybacks. For example, pay-
ing an extra $6 per ton for each 0.01-kW-per-ton improve-
ment to raise the efficiency of a 500-ton chiller from 0.6 kW
per ton to 0.56 kW per ton would increase that machine’s first
cost by $12,000. But that change would reduce operating
costs by $3,000 per year, yielding a four-year simple payback.17
page 16 air conditioning & ventilation
Although Title 24 sets minimums for
chillers, a lot of equipment is available
with higher efficiency ratings.

■ Select a chiller that will be most efficient under the conditions
it is likely to experience. Even though chiller performance
can vary dramatically depending on loading and other
conditions, designers frequently select chillers based on
full-load, standard-condition efficiency. However, chillers
spend most hours at 40 to 70 percent load, under condi-
tions that are often considerably different from standard
conditions. To select the chiller that will have the lowest
operating costs, designers need to determine what the
actual operating conditions are likely to be and then eval-
uate the efficiency with which candidate chillers are like-
ly to operate under those conditions.
■ Select unequally sized machines for multiple chiller instal-
lations. Chillers operate more efficiently when they are
loaded close to their full rating than when they are only
lightly loaded. Under most operating conditions, if one
chiller in a two-machine installation is smaller than the other,
one or the other of the two chillers should be able to run
close to full load. This will result in more-efficient operation
than if one or two chillers of the same size were operating
at a lighter load.
■ Install a variable-speed drive (VSD) on the chiller compressor.
The VSD will allow the compressor to run at lower speed
under part-load conditions, thereby yielding a lower com-
pressor kilowatt-per-ton rating under those conditions than
is typically achieved by ordinary centrifugal chillers that con-
trol part-load operation with inlet vanes.
■ Specify an induced-draft cooling tower. Although it requires
more space than a forced-draft tower, the induced-draft
tower is more efficient.
■ Oversize the cooling tower so that it returns condenser water
to the chiller closer to wetbulb temperature.
page 17air conditioning & ventilation
Chillers spend most hours at 40 to 70
percent load, under conditions that are
often considerably different from stan-
dard conditions.
■ Install VSDs to control cooling-tower fans on chilled water sys-
tems with multiple manifolded towers or multicell towers.
■ Install heat exchangers and controls to allow cooling towers to
produce chilled water when weather conditions permit.
There is a pair of serious challenges inherent in a design
approach that considers these opportunities. First, it is difficult to
generalize about their cost-effectiveness. Selecting the most cost-
effective chiller for a particular building often requires a designer
to take into account energy and demand prices, building load
characteristics, local climate, building construction, operating
schedules, and the part-load operating characteristics of the avail-
able chillers. Accounting for all these variables can be a daunting
task, especially because some of them change on an hourly basis.
Second, although it is tempting to improve the efficiency of
chilled water systems by minimizing the energy consumption of
each individual component, that approach does not necessarily
lead to the most efficient system. The pieces of a chilled water
system interact in complex ways that make such general pre-
scriptions difficult. For example, the efficiency of a chiller can
be improved by increasing chilled water flow. However, that
will necessitate more pumping power, which may exceed the
saved chiller power, resulting in a net loss of system efficiency.
To illustrate these challenges, consider the case of a designer
who switched a chiller condenser-tube bundle from two-pass
flow to four-pass flow in order to improve chiller efficiency.
That change improved chiller efficiency from 0.62 kW per ton
to 0.60 kW per ton, but it also added 28 feet of pressure drop
to the chilled water flow stream and increased the required
pumping power by 8.6 kW. At full load, the new tube bundle
reduced chiller power by 8.8 kW, but when the increased
pumping power was added, overall system power was cut by
0.2 kW. At 75 percent load, which was typical in this building,
the new tube bundle reduced chiller power by 6.6 kW. But
page 18 air conditioning & ventilation
because this particular building featured a constant-flow system,
the pumping power increase of 8.6 kW led to an overall system
power-demand increase of 2 kW. The net effect was even worse
at lower loads. Although this designer had intended to reduce
energy consumption by improving chiller efficiency, he wound
up increasing overall building energy consumption.
In the face of such complexity, how can building designers
determine the combination of strategies that will produce an
optimal chilled water system? One of the best options is to turn
to a building energy performance simulation package. These
computer programs perform the numerous and complex equa-
tions needed to evaluate how buildings use energy. The most
sophisticated programs are capable of calculating building
energy consumption hour by hour for an entire year. That
allows designers to see how modifications to any of the build-
ing’s systems—including the chilled water system—will affect
the building’s annual energy consumption. Furthermore, these
packages account for interactions between building compo-
nents. As a result, building designers can experiment with a
variety of combinations of efficiency strategies and determine
which ones produce the most cost-effective building.
The best-known hourly simulation software is DOE-2 (developed
by the Simulation Research Group at Lawrence Berkeley National
Laboratory), but there are several other packages available on
the market, a few of which are produced by HVAC equipment
manufacturers. It does takes some practice to become adept at
using these building energy performance simulations, and run-
ning a variety of scenarios can be quite time-consuming.
Therefore, some designers may prefer to hire consultants who
specialize in performing these evaluations. Either way, designers
and their clients may seek to amortize the cost of simulating
building performance by using simulations after the building is
occupied in order to verify savings, optimize HVAC system con-
trol, and identify malfunctions in building systems.
page 19air conditioning & ventilation
One of the best options to produce an
optimal chilled water system is to turn to
a building energy performance simula-
tion package.

As part of the Saving by Design incentive program offered by
California utilities, a free software package is also available that
makes it easier to model chiller systems. It is a “window- and
wizard-driven” front end to DOE-2 called eQUEST that is used
for the “Whole Building Approach” of Savings by Design. It is
easier to use than DOE-2, yet it allows users to access DOE-2’s
full capabilities to model many variables that will affect a
chiller’s performance. It can also be used to assess and help
minimize building cooling loads. Savings achieved from the pro-
posed cooling system are compared with a modeled baseline
chiller plant set to conform with local building codes.
Also, to provide support for the chiller plant design process, Pacific
Gas and Electric sponsored CoolTools (http://energydesignre-
sources.com/Resources/SoftwareTools/CoolToolstrade.aspx), a
project that creates free educational materials and software tools.
One of those products, “The CoolTools Chilled Water Plant Design
and Specification Guide,” (http://www.energydesignresources.
com/Technology/HVACDesign/tabid/97/articleType/ArticleView/ar
ticleId/422/Default.aspx), was written for the technical design audi-
ence. It offers direction on many of the options available in design-
ing a chilled water plant.
Replacing Refrigerative Cooling withEvaporative Cooling
All cooling systems currently produced for commercial buildings
are based on the principle of evaporation. As molecules are
energized from the liquid to gas state, they carry away from the
liquid the heat of vaporization. In most cooling systems, a refrig-
erant evaporates within a sealed heat exchanger. In another,
albeit less-popular, technology, water simply evaporates into air
to produce a cooling effect. Known by the moniker “evapora-
tive cooling,” water-based systems employing this technology
typically use less than one-fourth the energy of refrigerative air-
conditioning systems. The reason evaporative systems use less
energy is that, unlike refrigerative systems, they do not have to
compress vapor and condense it back into liquid to repeat the
page 20 air conditioning & ventilation

cooling cycle. Instead, evaporative coolers continually introduce
fresh supplies of air and water.
Despite such favorable energy-consumption characteristics, evap-
orative coolers are rarely found in commercial buildings. In fact,
only about 3 percent of all floor space for commercial buildings
in the U.S. is cooled, at least in part, by this technology.18 Why is
that so? It may be because evaporative cooling applications are
limited by local climate, many HVAC designers are unfamiliar with
evaporative technologies, and evaporative cooling systems typi-
cally have a higher first cost than refrigerative cooling systems.
However, in southern California evaporative cooling is feasible in
most inland locations, the technology is rapidly becoming more
popular, and any additional first costs are usually returned quick-
ly in the form of energy savings.
There are four types of evaporative cooling systems, and they
are listed here in order of complexity and cost:
1. Direct. Long used to cool homes and small commercial build-
ings in the arid American West, direct evaporative coolers (also
known as swamp coolers) use a fan to blow hot, relatively dry
outside air across a wetted pad (Figure 9). The water evapo-
rates directly into the incoming airstream. To keep the process
page 21air conditioning & ventilation
Direct evaporative coolerFigure 9:
Wet-surface direct evaporative coolers typically use pumped recirculating watersystems to keep the media wet and use a fan that blows air through the media,thereby cooling it and increasing its humidity. The arrow indicates that moisture hasbeen added to the airstream.
Supply fan
Conditioned air
Wetted pad or other direct evaporative media
Outdoorair
ReservoirPump(to keep pad wet)
Courtesy: Platts

going, an equal quantity of air must constantly be exhausted
from the building to offset the inflow. The chief drawback of
direct coolers, at least in moist climates, is that they increase
the humidity of the conditioned space.
2. Indirect. These coolers feature an impermeable heat-
exchange surface such as a thin plastic plate or tube. A direct
evaporative process cools air or water on one side of the
exchanger so that air passing by the other side of the
exchange surface is cooled without any moisture being added
(Figure 10). Because the cooling capacity of these units is not
as great as that of direct evaporative coolers, indirect coolers
have traditionally been used only occasionally as stand-alone
systems to cool outside-air ventilation intake flows. However,
a new indirect technology made by Coolerado, a spin-off of
thermodynamic research company Idalex, provides more
capacity than standard indirect systems, so it may see more
usage as a stand-alone cooler. The water-side economizer is
another form of indirect evaporative cooler.
3. Two-stage. By placing an indirect cooler upstream from a direct
cooler, lower-temperature air can be supplied than is possible
with either of these technologies alone (Figure 11). Two-stage
page 22 air conditioning & ventilation
Air-to-air indirect evaporative coolerFigure 10:
In a typical indirect evaporative air cooler, the essential element is a heat exchangerin which dry air contacts heat exchange surfaces whose other sides are cooledevaporatively. The darker-colored arrow indicates that moisture has been added tothe airstream.
Conditioned air
Supply fan
Courtesy: Platts
Working air
Wetted pad or otherdirect evaporative media
Outdoorair
Pump
Working air fan
Heat exchanger
Reservoir
Outdoorair
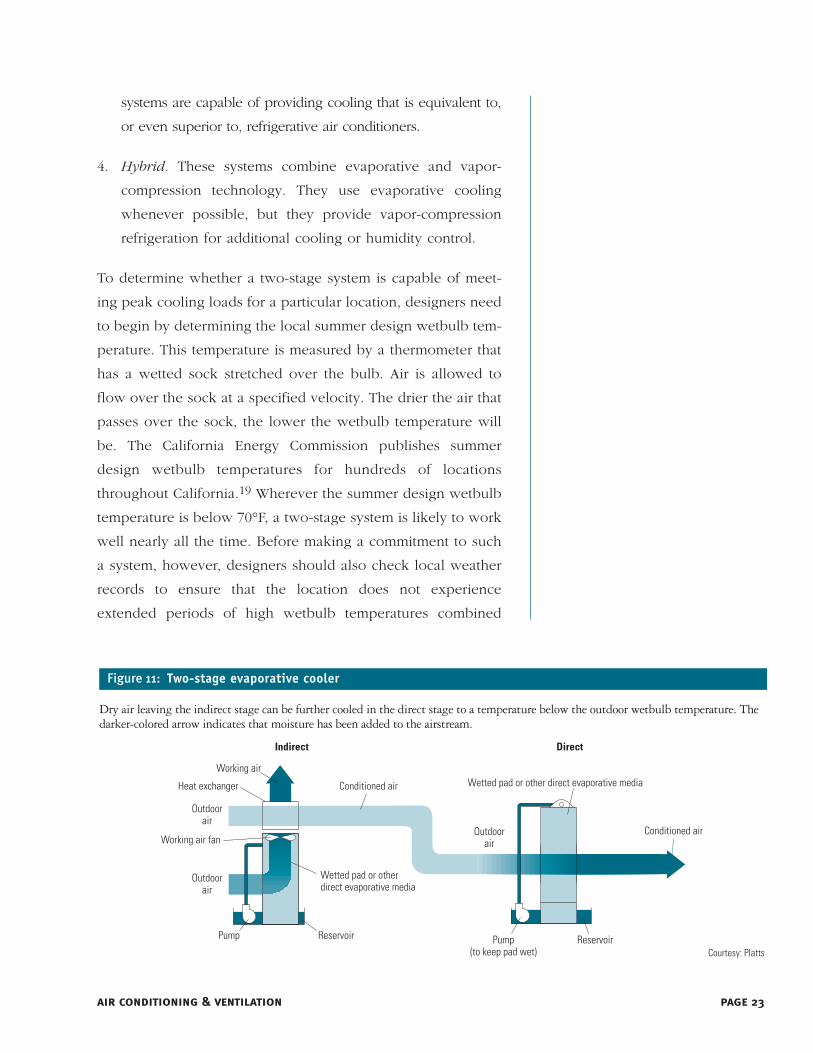
systems are capable of providing cooling that is equivalent to,
or even superior to, refrigerative air conditioners.
4. Hybrid. These systems combine evaporative and vapor-
compression technology. They use evaporative cooling
whenever possible, but they provide vapor-compression
refrigeration for additional cooling or humidity control.
To determine whether a two-stage system is capable of meet-
ing peak cooling loads for a particular location, designers need
to begin by determining the local summer design wetbulb tem-
perature. This temperature is measured by a thermometer that
has a wetted sock stretched over the bulb. Air is allowed to
flow over the sock at a specified velocity. The drier the air that
passes over the sock, the lower the wetbulb temperature will
be. The California Energy Commission publishes summer
design wetbulb temperatures for hundreds of locations
throughout California.19 Wherever the summer design wetbulb
temperature is below 70°F, a two-stage system is likely to work
well nearly all the time. Before making a commitment to such
a system, however, designers should also check local weather
records to ensure that the location does not experience
extended periods of high wetbulb temperatures combined
page 23air conditioning & ventilation
Two-stage evaporative coolerFigure 11:
Dry air leaving the indirect stage can be further cooled in the direct stage to a temperature below the outdoor wetbulb temperature. Thedarker-colored arrow indicates that moisture has been added to the airstream.
Courtesy: Platts
Indirect
Conditioned air
Working air
Wetted pad or otherdirect evaporative media
Outdoorair
Pump
Working air fan
Heat exchanger
Reservoir
Outdoorair
Conditioned air
Wetted pad or other direct evaporative media
Outdoorair
ReservoirPump(to keep pad wet)
Direct

with high drybulb temperatures. A hybrid system may well be
the most cost-effective option for locations that experience
conditions exceeding the capabilities of two-stage coolers.
Evaporative cooling systems range widely in cost, depending on
the complexity of the design and the materials of construction. It is
difficult to compare their costs to those of refrigerative cooling sys-
tems, because the cost of evaporative systems is expressed in dol-
lars per cubic feet per minute rather than in dollars per ton. Another
complication is that the amount of cooling an evaporative system
provides can vary widely depending on local climate. There are,
however, numerous examples of systems that have been indepen-
dently studied and shown to be cost-effective. Take, for example,
One Utah Center, a 419,000-ft2 office tower in the Salt Lake City
area. This building features a hybrid system with a two-stage evap-
orative cooler, oversized cooling towers, refrigerative chillers, econ-
omizer ventilation, thermal storage tanks, and variable-flow pump-
ing. Computer models predict annual savings of about 1,700,000
kWh that can be attributed directly to the evaporative cooling sys-
tem. At the local electric rate of only 3¢/kWh, annual savings would
be $51,000 against an initial added cost for the evaporative cooling
system of $180,000—for a simple payback period of 3.5 years.20 An
equivalent system in a location where electricity cost 9 cents per
kWh would pay for itself in just over one year.
Air-Conditioning, Ventilation, and LEED
Air-conditioning and ventilation play a role in the Leadership in
Energy and Environmental Design (LEED) system. LEED is a rat-
ing system created by the U.S. Green Building Council (USGBC)
to accelerate the development and implementation of green build-
ing practices. The USGBC is a nonprofit organization founded to
promote the construction of environmentally responsible build-
ings. It established LEED to serve as a brand for high-performance
buildings and to provide a common standard for measuring the
sustainability, or “greenness,” of a building.
page 24 air conditioning & ventilation

A building earns a LEED rating (certified, silver, gold, or platinum)
based on how many points it earns in the following categories:
sustainable sites, water efficiency, energy and atmosphere, mate-
rials and resources, indoor environmental quality, and innovation
and design process. Air-conditioning and ventilation play a role
in LEED for a number of the following two categories.
Energy and Atmosphere (E&A)
■ Prerequisite 1—fundamental building systems commissioning.
Air-conditioning and ventilation systems must be commis-
sioned to function properly.
■ Prerequisite 2—minimum energy performance. All LEED
buildings must meet either the local energy code require-
ments or the provisions of ASHRAE/IESNA (Illuminating
Engineering Society of North America) 90.1-2007. In addi-
tion, the more efficient a building is, the more points it will
be awarded, up to an additional 19 points. Although air-con-
ditioning and ventilation are not called out specifically, they
are crucial to the energy performance of the whole building.
■ Prerequisite 3—Fundamental Refrigerant Management. For
new buildings, specify air-conditioning equipment that uses
no chlorofluorocarbon (CFC) refrigerants. For existing build-
ings, complete a comprehensive CFC phase-out conversion.
■ Credits. Credits are given for air-conditioning and ventilation
systems that help achieve higher building efficiency (credit
1), that are a part of additional commissioning efforts (cred-
it 3), that do not contain HCFCs (hydrochlorofluorocarbons)
or halon (credit 4), that use continuous metering equipment
(credit 5), and that use green power (credit 6).
Indoor Environmental Quality
■ Prerequisite 1—minimum IAQ performance. All LEED
buildings must meet the minimum requirements of ASHRAE
62.1-2007: “Ventilation for Acceptable Indoor Air Quality
[IAQ]” and approved addenda.
page 25air conditioning & ventilation
Air-conditioning and ventilation play a
role in LEED.

■ Prerequisite 2—environmental tobacco smoke control.
Ventilation systems must prevent exposure of building occu-
pants and systems to tobacco smoke.
■ Credits. Credits are given for air-conditioning and ventilation
systems that use carbon dioxide monitoring (credit 1), that
provide for a specified minimum air change effectiveness
(credit 2), that prevent IAQ problems resulting from con-
struction or renovation (credit 3), that prevent chemicals that
adversely impact air quality from reaching occupants (credit
5), that provide for a high level of individual control by occu-
pants (credits 6.1 and 6.2), that provide a thermally comfort-
able environment for occupants (credits 7.1 and 7.2), and that
for using Daylighting and Views (credits 8.1 and 8.2).
Air Conditioning and Refrigeration Institute (ARI)
Arlington, Virginia
tel 703-524-8800
web www.ari.org
ARI publishes efficiency ratings in print and on CD-ROM for all certified air con-
ditioners, heat pumps, and chillers. Efficiency ratings for selected products can
be searched for on ARI’s web site.
California Energy Commission
Energy Efficiency Division
Sacramento, California
tel 916-654-5106
web www.energy.ca.gov/efficiency/index.html
The California Energy Commission publishes standards regulating commercial
building efficiency and maintains on its web site a list of unitary HVAC equip-
ment that meets these standards.
page 26 air conditioning & ventilation
For More Information

Lawrence Berkeley National Laboratory
Simulation Research Group
Berkeley, California
tel 510-486-5711
web http://gundog.lbl.gov
Lawrence Berkeley National Laboratory’s Simulation Research Group is the
leading national organization researching and developing simulation tools for
evaluating building energy performance. The group distributes a free newsletter
for simulation users and operates a DOE-2 telephone help line.
Platts
Boulder, Colorado
tel 303-444-7788
web www.esource.platts.com
Platts publishes E SOURCE Technology Atlas Series, Volume II: Commercial Space Cooling
and Air Handling a comprehensive and definitive reference book that combines up-to-
date technical information with practical case studies and application guidelines.
Pacific Energy Center
San Francisco, California
tel 415-973-2277
web http://www.pge.com/myhome/edusafety/workshopstraining/pec/
The Pacific Energy Center is largely focused on central and northern California,
and it provides a variety of services, including educational programs, design and
measurement tools, technical advice, and energy information resources. It also
offers several software tools for analyzing chillers and chilled water systems.
Southern California Edison
Customer Technology Applications Center
Irwindale, California
tel 800-336-2822
web http://www.sce.com/b-sb/energy-centers/ctac/
At this 45,000-ft2 conference facility, visitors can learn about HVAC technolo-
gies by attending workshops, seminars, and product demonstrations.

Notes1 U.S. Department of Energy (DOE), Energy Information
Administration, “Commercial Building Energy ConsumptionSurvey” (1999), Table 1: End-Use Consumption for Natural Gas,Electricity and Fuel Oil (Preliminary Estimates),” fromwww.eia.doe.gov/emeu/cbecs/enduse_consumption/intro.html(accessed August 2005).
2 Gary Cler et al., E SOURCE Technology Atlas Series, Volume II:Commercial Space Cooling and Air Handling (Boulder, CO:Platts, 1997), pp. 17–18.
3 W. Kempton and L. Lutzenhiser, “Introduction,” Energy andBuildings, v. 18, no. 3 (1992), pp. 171–176.
4 Alan Hedge, “Linking Environmental Conditions toProductivity,” abbreviated slideshow based on a presenta-tion at the Eastern Ergonomics Conference and Exposition,New York (June 2004), from http://ergo.human.cornell.edu/CUEHnews.html (accessed July 2005).
5 Joseph Romm and William Browning, “Greening the BottomLine,” Rocky Mountain Institute (1994), Old Snowmass, CO,970-927-3851; “Get Comfortable,” Facility Issues (June 15,1994); and Johnson Controls case study X95-241.
6 Terry Pederson (September 2005), Associate ProductManager, Johnson Controls, Milwaukee, WI, 414-524-4915,[email protected].
7 Alan Short (September 2005), Short and Associates, London,UK, +44-0-20-7407 8885, e-mail [email protected].
8 Susan Reily, Ira Krepchin, and Larry Kinney, “High-Performance Glazing in Commercial Buildings, Growing butStill Underused,” E SOURCE Report, ER-01-16 (November2001).
9 DOE, Energy Information Administration, “CommercialBuilding Energy Use Survey” (1995), Table 3: ElectricityConsumption by End Use, from www.eia.doe.gov/emeu/cbecs/cbec-eu3.html (accessed July 2005).
10 Jay Stein, “Low-Cost/No-Cost Efficiency Retrofits forChilled Water Systems,” E SOURCE Tech Update, TU-97-9(September 1997).
page 28 air conditioning & ventilation
11 Gary Cler et al. [2], p. 98.
12 Ira Krepchin, “Underfloor Air Systems Gain Foothold inNorth America,” E SOURCE Report, ER-01-1 (January 2001).
13 Sharon Brogdon (September 2005), Trane, Tyler, TX, 903-581-3568, [email protected].
14 DOE, Energy Information Administration, “CommercialBuilding Energy Use Survey” (1999), Table B29: Percent ofFloorspace Cooled, Number of Buildings and Floorspace, fromwww.eia.doe.gov/emeu/cbecs/pdf/alltables.pdf (accessedJuly 2005).
15 ASHRAE (American Society of Heating, Refrigerating, andAir-Conditioning Engineers), 2007 ASHRAE Handbook:HVAC Applications, Chapter 32 (Table 8), p. 32.17
16 DOE, Energy Information Administration, “CommercialBuilding Energy Use Survey” (1999) Table B7: BuildingSize, Floorspace, from www.eia.doe.gov/emeu/cbecs/pdf/alltables.pdf (accessed July 2005).
17 Assuming 1,500 annual equivalent full-load cooling hoursand an electric rate of 10¢ per kilowatt hour.
18 DOE [16].
19 "2008 Joint Appendix JA2: Reference Weather / Climate Data,"Title 24 Energy Efficiency Standards for Residential andNonresidential Buildings (2008)
20 Tom Colvin, “Office Tower Reduces Operating Costs withTwo-Stage Evaporative Cooling System,” ASHRAE Journal,v. 37, no. 3 (March 1994), pp. 23–24.
page 29air conditioning & ventilation

Energy Design Resources provides information and design tools to
architects, engineers, lighting designers, and building owners and
developers. Energy Design Resources is funded by California utility
customers and administered by Pacific Gas and Electric Co.,
Sacramento Municipal Utilities District, San Diego Gas and Electric,
Southern California Edison, and Southern California Gas, under the
auspices of the California Public Utilities Commission. To learn more
about Energy Design Resources, please visit our web site at
www.energydesignresources.com.
The first edition of this design brief was prepared for Energy Design
Resources by the E SOURCE Technology Assessment Group at Platts, a
Division of The McGraw-Hill Companies, Inc. Between January and April of
2010, an engineering review of this document was conducted to update
passages affected by recent changes in the California Building Energy
Efficiency Standards (Title 24 2008). The original content creator was not
actively involved in this engineering review, and therefore is not
responsible for the updates to the affected passages.