energy-using product group analysis - lot 5 · 2015-09-16 · energy-using product group analysis -...
TRANSCRIPT

Energy-Using Product Group Analysis - Lot 5 Machine tools and related machinery
Task 2 Report – Economic and Market Analy-sis
Sustainable Industrial Policy - Building on the Ecodesign Directive - Energy-using Product Group Analysis/2
Contact: Fraunhofer Institute for Reliability and Microintegration, IZM
Department Environmental and Reliability Engineering Dipl.-Ing. Karsten Schischke Gustav-Meyer-Allee 25, 13355 Berlin, Germany Tel: +49 (0)30 46403-156 Fax: +49 (0)30 46403-131 Email: [email protected] URL: http://www.ecomachinetools.eu
Berlin, August 1, 2012

EuP_Lot5_Task2_August2012.doc
Authors: Karsten Schischke Eckhard Hohwieler Roberto Feitscher Jens König Sebastian Kreuschner Paul Wilpert Nils F. Nissen

Final Report: Task 2 DG ENTR Lot 5
Page 1
Content Page
Executive Summary – Task 2 ....................................................................................... 3
2 Task 2 – Economic and Market Analysis ............................................................... 5
2.1 Generic economic data ................................................................................... 5
2.1.1 Metal working machine tools ................................................................... 5
2.1.2 Wood working machine tools ................................................................. 17
2.1.3 Welding, soldering and brazing equipment ............................................ 21
2.1.4 Other machine tools .............................................................................. 23
2.1.5 Summary ............................................................................................... 25
2.2 Market and stock data .................................................................................. 26
2.2.1 Base Data for the Stock Model .............................................................. 26
2.2.1.1 Metal working machine tools .......................................................... 26
2.2.1.2 Wood working machine tools .......................................................... 33
2.2.1.3 Welding, soldering and brazing equipment ..................................... 33
2.2.1.4 Other machine tools ....................................................................... 34
2.2.2 Installed base (EU-27 stock) .................................................................. 34
2.2.2.1 Metal working machine tools .......................................................... 34
2.2.2.2 Wood working machine tools .......................................................... 54
2.2.2.3 Welding, soldering and brazing equipment ..................................... 59
2.2.2.4 Other machine tools ....................................................................... 65
2.2.3 Summary ............................................................................................... 68
2.3 Market channels and production structures .................................................. 69
2.3.1 Market Players and Production .............................................................. 69

Final Report: Task 2 DG ENTR Lot 5
Page 2
2.3.1.1 Metal working machine tools ........................................................... 69
2.3.1.2 Wood working machine tools .......................................................... 73
2.3.1.3 Welding, soldering and brazing equipment ..................................... 73
2.3.2 Target markets: Countries and Sectors .................................................. 75
2.3.2.1 Metal working machine tools ........................................................... 77
2.3.2.2 Wood working machine tools .......................................................... 79
2.3.2.3 Welding, soldering and brazing equipment ..................................... 80
2.3.3 Production Structures and Trends .......................................................... 81
2.3.3.1 Metal working machine tools ........................................................... 81
2.3.3.2 Wood working machine tools .......................................................... 83
2.3.3.3 Welding, soldering and brazing equipment ..................................... 85
2.3.4 Suppliers ................................................................................................ 87
2.4 User expenditure base data .......................................................................... 89
2.4.1 Electricity, fuel and interest and inflation rates ....................................... 91
2.4.2 Purchase Price ...................................................................................... 93
2.4.3 Consumables ......................................................................................... 94
2.4.3.1 Cooling lubricants ........................................................................... 94
2.4.3.2 Welding, soldering and brazing consumables ................................. 96
2.4.4 Tools, Work Holders, Spare Parts .......................................................... 97
3 Annex I – Stock model methodology .................................................................. 100
3.1 Production ................................................................................................... 100
3.2 Import and Export – Installed New Stock..................................................... 101
3.3 New Stock Totals ........................................................................................ 106

Final Report: Task 2 DG ENTR Lot 5
Page 3
Executive Summary – Task 2 The machine tools market is subject to huge fluctuations, depending on economic cy-cles. Due to the long lifetime the stock (installed base) of machine tools shows much less fluctuation than the sales figures. PRODCOM figures were subject to an extensive plausibility check and revisions accordingly with the support of associations CECIMO (and member associations), EPTA and EWA in particular. Whereas EuroStat states a production volume of nearly 600.000 metal working machine tools for 2009, our plausi-bility check unveils, that a figure of 216.000 metal working machine tools falling un-der the definition provided in task 1 i s a much more likely figure. Similarly for wood working machinery instead of 3.4 million units sold production as stated by EuroStat for wood working machine tools a more reasonable figure according to the plausibility check by Fraunhofer is 130.000 units, sold production in 2009 for larger machinery, which overlaps with a market of 220.000 light stationary wood working tools (sales within EU 27). The market of welding, soldering, and brazing equipment covers roughly 1.400.000 units sold EU production, falling under the definition provided above.
A stock model for the major market segments covered by the definition of “machine tools” set up by Fraunhofer and c ross-checked by industry representatives indicates that currently in the EU 27 there are in operation
• 3,5 million metal working machine tools, thereof 750.000 CNC machine tools
• 5,8 million wood working machine tools, thereof 1,4 million larger stationary ma-chinery
• 7,1 million units of welding, soldering and brazing equipment, thereof 1,5 million stationary units
Due to the long lifetime of the stationary machine tools the stock remains very stable for wood working machine tools and no major changes are to be expected regarding the installed base in the mid-term future. The metal working machine tools market sees an ongoing shift from non-CNC machine tools to CNC: In 2025 a total stock of 2.8 mil-lion metal working machine tools is forecasted, thereof 800.000 CNC machine tools with an increasing complexity and functionality.
The Life Cycle Cost model for machine tools is subject to the broad variety of machine tools and the fact, that many more factors than only purchase price, consumables and spare parts play a r ole. Actually, running costs over the lifetime in almost all cases

Final Report: Task 2 DG ENTR Lot 5
Page 4
seem to be higher than initial investment, costs for electricity and ( where applicable) consumables are very relevant, but even more maintenance costs.
Reflecting the regions where machine tools are most prominently used, size of compa-nies using them and regional electricity costs, roughly the “typical” electricity price for use of metal working machine tools is 0,11 Euro/kWh, for wood working machine tools 0,14 Euro/kWh, but which a broad spread across EU-27.
Total sales volume for EU-27 for mineral oil based non-water miscible and water misci-ble cooling lubricants was roughly 800 million Euros in 2008, indicating the high eco-nomic relevancy of coolants.
The value of tools, work holders and spare parts in total for EU 27 production in 2008 was 7,6 billion Euros, compared to a sales volume (sold production) of 26,4 billion Eu-ros for machine tools in the same year.

Final Report: Task 2 DG ENTR Lot 5
Page 5
2 Task 2 – Economic and Market Analysis
The objective of task 2 is the assessment of trade and sales volumes for machine tools within the EU-27. A clear picture of the product stock available on t he EU market should be provided and its growth and replacement rate be forecasted. Insight in the latest market trends so as to indicate the place of possible ecodesign measures in the context of the market structures and ongoing trends in product design should be given. A practical data set of prices and rates to be used in a Life Cycle Cost (LCC) calcula-tion should be provided.
The economic analysis is structured according to the distinctions made in Task 1:
• Metal working machine tools,
• Wood working machine tools,
• Welding, soldering and brazing equipment, and
• Other machine tools.
For “related machinery” no dedicated analysis is provided in this task, as potentially a large variety from numerous sub-sectors falls under “related machinery”. As a robust market analysis for all kind of industrial equipment is not feasible due to time and re-source constraints, the effects of later findings on “related machinery” will be estimated on a case-by-case basis where relevant.
2.1 Generic economic data
2.1.1 Metal working machine tools
The machine tools market is an explicitly cyclical market, making any predictions for future developments a challenge. Figure 2-1 depicts the the machine tool production in the 15 CECIMO member countries1 since 1980, showing a downturn nearly every ten years. Due to the economic crisis a sharp decline in production volume by 30% is stated for 2009. From the 2009 figures different scenarios are possible:
Taking the 2009 figures into account, the average annual growth rate since 1980 is 1,4% per year. A conservative scenario is to extrapolate now from the
1 Austria, Belgium, Czech Republic, Denmark, Finland, France, Germany, Italy, The Nether-
lands, Portugal, Spain, Sweden, Switzerland, Turkey, UK

Final Report: Task 2 DG ENTR Lot 5
Page 6
low 2009 l evel with a f urther growth rate of 1,4%. This scenario reflects a situation of a long term impact of the economic crisis on the European production industry and a shift of production to low cost countries.
Excluding the 2009 crisis from the statistics results in a 3,0% average annual growth rate for the years 1980-2008. A possible scenario therefore is to extrapolate from the 2009 level with such a 3,0% annual growth rate now for the coming years until 2025. This scenario reflects a situation, where the economic crisis has got a long term impact, but coming from a low level the EU sees steady economic growth.
An optimistic scenario is as follows: The machine tools market sees a rapid recovery from the current status – and as machine tools orders increase significantly again since 4th quarter 20092 this is not too unlikely to happen -, reaching the 2008 l evel again in 2012, followed by a 3, 0% average annual growth rates for the years thereafter, just as it was in the years 1980-2008. This scenario is based on the assumption that the European industry can compete with other regions on the globe and due to cutting edge technology remaining in Europe the economic industrial growth is stable in the EU.
Depending on w hich scenario is applied (and taking an ex trapolation with average growth rates as a basis does not reflect the economic cycles at all), the production volume reached by 2020 might be 22.4 billion, 28.7 billion or even 36.1 billion Euros, i.e. with a spread of a factor of 1.5.
2 CECIMO Statistical Toolbox - Updated: November 2010

Final Report: Task 2 DG ENTR Lot 5
Page 7
Figure 2-1: Machine tool production in CECIMO countries – totals 1980 - 20253
This model with stable growth rates is a simplified one, due to the inherent dynamics of the machine tools industry: There is a pheno menon called "investment accelerator effect" which in particular is relevant for this industry, just as described by Kouvelis et al.4: “For machine tools, there is a fairly stable demand for replacement units, but when durable goods producers invest in anticipation of even a small surge in their demand, this often shows itself as a hug e increase in the orders placed with machine tool manufacturers. For example, a plant may use 100 m achine tools and r eplace 5% of them in a typical year. If this firm anticipates a 5% increase in sales, it may plan to buy 10 machine tools this period; 5 new and 5 replacements. Thus, a 5% surge in expected sales at one level becomes a 100% surge for the supplier. This is particularly problematic for machine tools because this pattern is correlated across the entire customer base.” This effect results in a high level of uncertainty for any prediction of future machine tools market developments. Same applies for the scenarios provided above.
3 Years 1980-2008 based on CECIMO: Last trends in the European Machine Tool industry,
http://www.cecimo.eu/index.php/machine-tools/dataastatistics/latesttrend.html, accessed December 17, 2010; 2009: EuroStat data for EU-27, scenarios 2009-2025: own assump-tions by Fraunhofer
4 Kouvelis, P.; Chambers, C.; Wang, H.; Supply Chain Management Research and Production and Operations Management: Review, Trends, and Opportunities; Production and Opera-tions Management, October 1, 2006
Final Report: Task 2 DG ENTR Lot 5
Page 8
It should be no ted, that the statistics and scenarios on machine tools production outlined above refer to the economic value of the market. As there is a trend towards highly integrated, high value machine tools the economic growth does not mean necessarily a growths in terms of units.
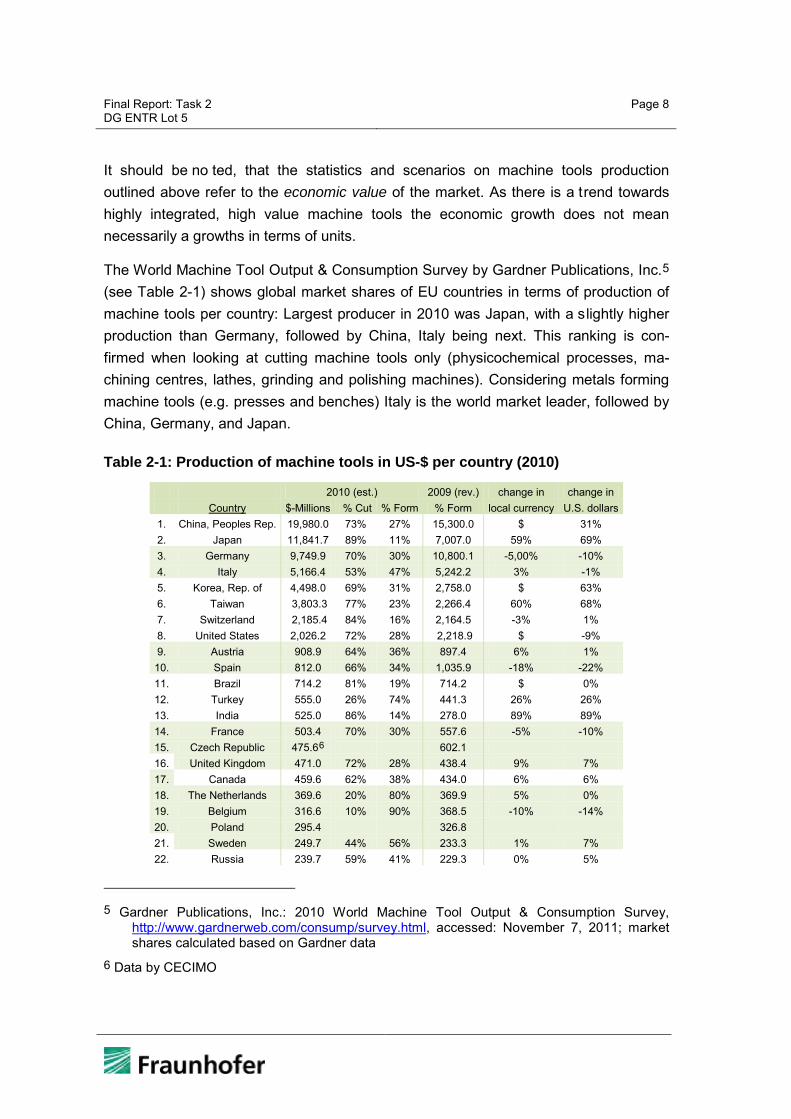
The World Machine Tool Output & Consumption Survey by Gardner Publications, Inc.5 (see Table 2-1) shows global market shares of EU countries in terms of production of machine tools per country: Largest producer in 2010 was Japan, with a slightly higher production than Germany, followed by China, Italy being next. This ranking is con-firmed when looking at cutting machine tools only (physicochemical processes, ma-chining centres, lathes, grinding and polishing machines). Considering metals forming machine tools (e.g. presses and benches) Italy is the world market leader, followed by China, Germany, and Japan.
Table 2-1: Production of machine tools in US-$ per country (2010)
2010 (est.) 2009 (rev.) change in change in Country $-Millions % Cut % Form % Form local currency U.S. dollars
1. China, Peoples Rep. 19,980.0 73% 27% 15,300.0 $ 31% 2. Japan 11,841.7 89% 11% 7,007.0 59% 69% 3. Germany 9,749.9 70% 30% 10,800.1 -5,00% -10% 4. Italy 5,166.4 53% 47% 5,242.2 3% -1% 5. Korea, Rep. of 4,498.0 69% 31% 2,758.0 $ 63% 6. Taiwan 3,803.3 77% 23% 2,266.4 60% 68% 7. Switzerland 2,185.4 84% 16% 2,164.5 -3% 1% 8. United States 2,026.2 72% 28% 2,218.9 $ -9% 9. Austria 908.9 64% 36% 897.4 6% 1% 10. Spain 812.0 66% 34% 1,035.9 -18% -22% 11. Brazil 714.2 81% 19% 714.2 $ 0% 12. Turkey 555.0 26% 74% 441.3 26% 26% 13. India 525.0 86% 14% 278.0 89% 89% 14. France 503.4 70% 30% 557.6 -5% -10% 15. Czech Republic 475.66 602.1 16. United Kingdom 471.0 72% 28% 438.4 9% 7% 17. Canada 459.6 62% 38% 434.0 6% 6% 18. The Netherlands 369.6 20% 80% 369.9 5% 0% 19. Belgium 316.6 10% 90% 368.5 -10% -14% 20. Poland 295.4
326.8
21. Sweden 249.7 44% 56% 233.3 1% 7% 22. Russia 239.7 59% 41% 229.3 0% 5%
5 Gardner Publications, Inc.: 2010 World Machine Tool Output & Consumption Survey,
http://www.gardnerweb.com/consump/survey.html, accessed: November 7, 2011; market shares calculated based on Gardner data
6 Data by CECIMO

Final Report: Task 2 DG ENTR Lot 5
Page 9
23. Finland 151.0 10% 90% 153.0 4% -1% 24. Mexico 132.5 52% 48% 132.5 $ 0% 25. Australia 129.9 96% 4% 32.0 $ 306% 26. Denmark 76.8 40% 60% 80.6 0% -5% 27. Portugal 49.0 8% 92% 62.6 -18% -22% 28. Romania 34.7 71% 29% 36.4 0% -5% 29. Argentina 33.3 43% 57% 26.7 $ 25%
Total 66,753.9
55,207.6
21%
These market statistics indicate the importance of the European machine tool industry and specifically of Germany and Italy as main machine tool producing, but also using countries: Table 2-2 lists the consumption of metal working machine tools in the vari-ous countries, the EU-27 market being slightly larger than China7.
Table 2-2: Consumption of machine tools in US-$ per country (2010)
Country US-$-Millions 1. China, Peoples Rep. 27,280.0 2. Germany 5,033.9 3. Japan 4,445.3 4. Korea, Rep. of 4,264.0 5. Italy 2768,7 6. United States 2,752.3 7. India 1,740.0 8. Taiwan 1,505.5 9. Brazil 1,488.3
10. Russia 1,246.0 11. Mexico 1,012.6 12. Turkey 834.0 13. Switzerland 824.3 14. Canada 783.2 15. France 680.9 16. Poland 545.8 17. Spain 494.1 18. Austria 487.9 19. United Kingdom 401.5 20. Netherlands 314.0 21. Belgium 266.3 22. Sweden 254.1 23. Australia 250.8
24. Romania 204.1 25. Czech Republic 196.1 26. Argentina 141.1 27. Finland 98.0 28. Portugal 96.7 29. Denmark 82.1
7 Gardner Publications, Inc.: 2010 World Machine Tool Output & Consumption Survey,
http://www.gardnerweb.com/consump/survey.html, accessed: November 07, 2011

Final Report: Task 2 DG ENTR Lot 5
Page 10
Looking at the production and consumption data for metal processing machine tools for the years 2001-2008 confirms the long-term dominating role of Germany and I taly in Europe for both, production and consumption of machine tools: Production in Germany and Italy since 2002 has been stable at nearly exactly 75% (+/- 1%) of the countries listed, share of consumption of these two countries ranges between 60 and 65% (see Figure 2-2). Germany consumes 41% of all metal working machine tools in the EU 27 (according to 2008 economic figures, Table 2-2).
Figure 2-2: Machine tool production and consumption in CECIMO countries – per country 2000 - 20088
Table 2-3: Update data for 2008 to 2011 by CECIMO
2008 2009 2010 2011 Production (million EUR) 24425 16867 16638 21161 Apparent consumption (million EUR) 17798 10283 9719 n.a.
For the purpose of this study it is essential to provide market data in terms of units, not only economic values. The only publicly available database for such a market study is EuroStat. Fraunhofer analysed the EuroStat/PRODCOM data material in detail and applies a methodological approach to verify and consolidate EuroStat data. The meth-odology in detail is described in Annex I – Stock model methodology.
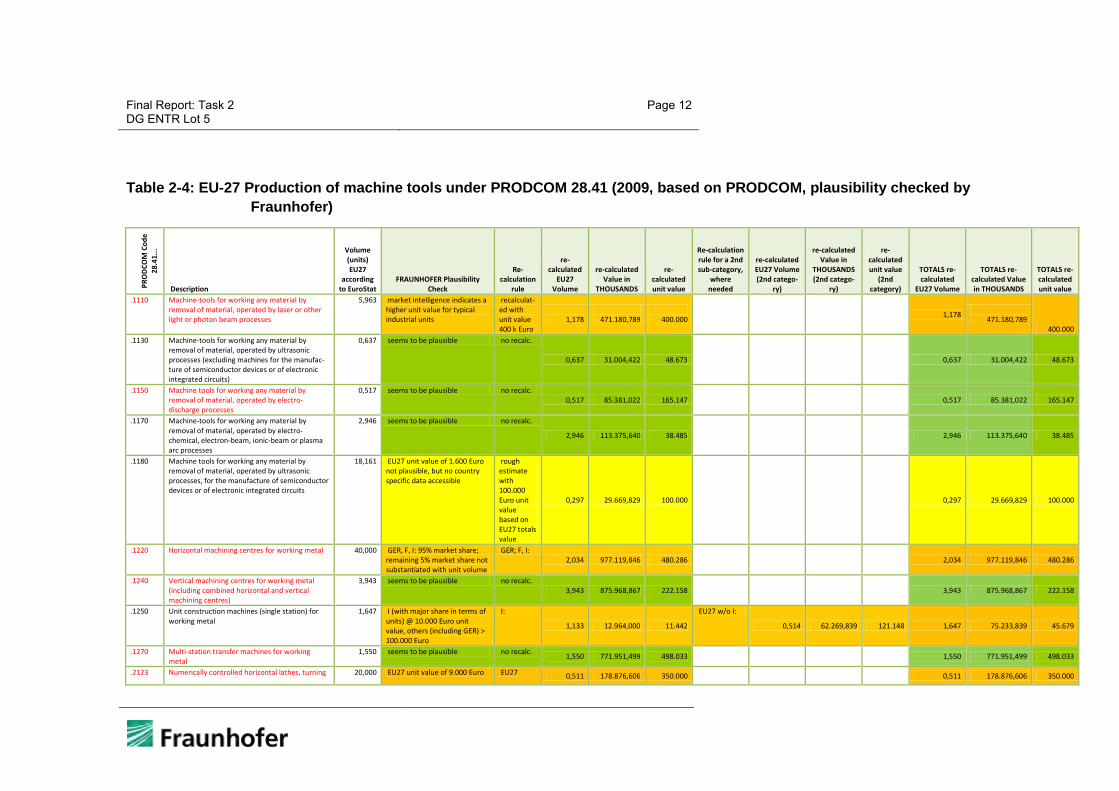
The revised PRODCOM 2009 production data for metal working machine tools is pro-vided in Table 2-4. Those machine tools categories marked in red are dominated by CNC machine tools.
8 based on C ECIMO: Last trends in the European Machine Tool industry,
http://www.cecimo.eu/index.php/machine-tools/dataastatistics/latesttrend.html, accessed March 11, 2010

Final Report: Task 2 DG ENTR Lot 5
Page 11
Whereas EuroStat states a pr oduction volume of nearly 600.000 units for 2009, our plausibility check unveils, that a figure of 220.000 machine tools falling under the defini-tion provided in task 1 is a much more likely figure.
For the UK, SKM Enviros cross-checked the plausibility-checked EU-27 sales figures against estimates for the UK, based on data provided by the Manufacturing Technolo-gies Association (MTA). Total sales in the UK in 2009 according to these figures com-prised 8.059 units, which corresponds to 3.5% of all EU-27 sales. SKM Enviros con-cluded: “In other industrial product areas, such as non-domestic electric motors, the UK market has traditionally been gauged at around 10% of the EU market; an equivalent comparison would suggest that the MTA estimation might be slightly low (or the Pre-paratory Study data is slightly high).”9 This indicates that in turn our EU-27 figures still might be slightly overestimated.
9 SKM Enviros: Estimating the Energy Saving Potential from Small Motors and Machine Tools,
Report on Machine Tools Research & Modelling, 11 July 2011, p.15
Final Report: Task 2 DG ENTR Lot 5
Page 12
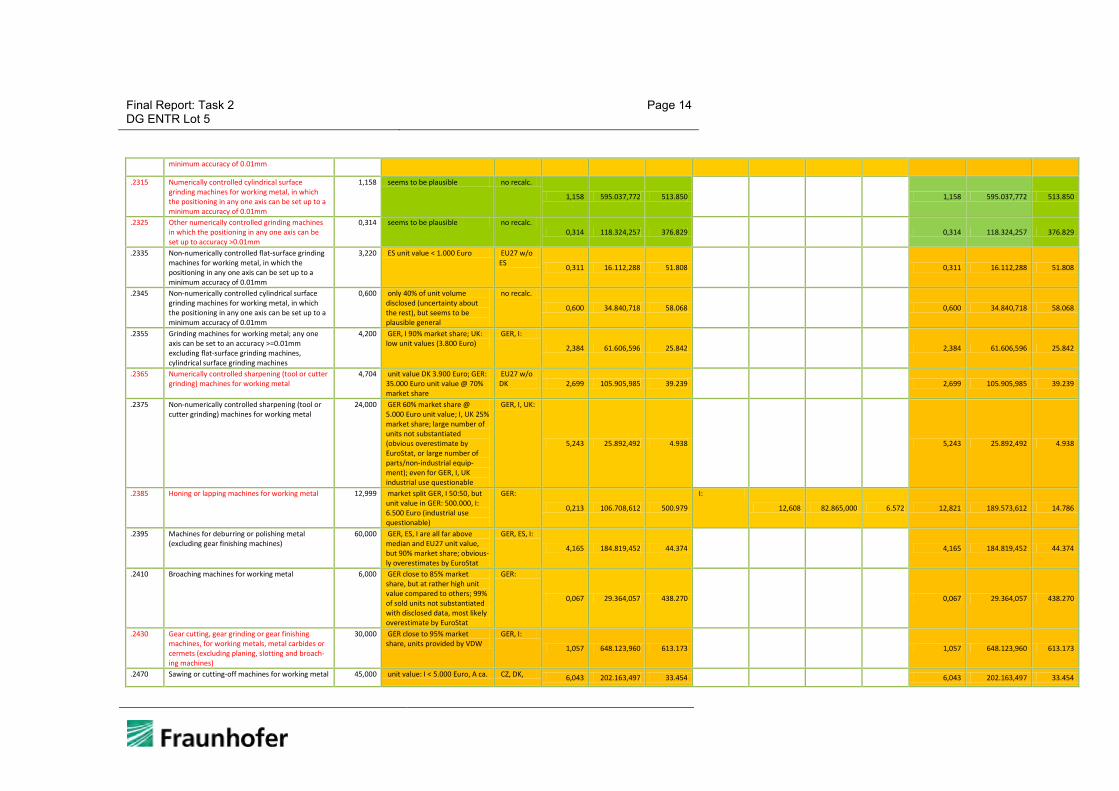
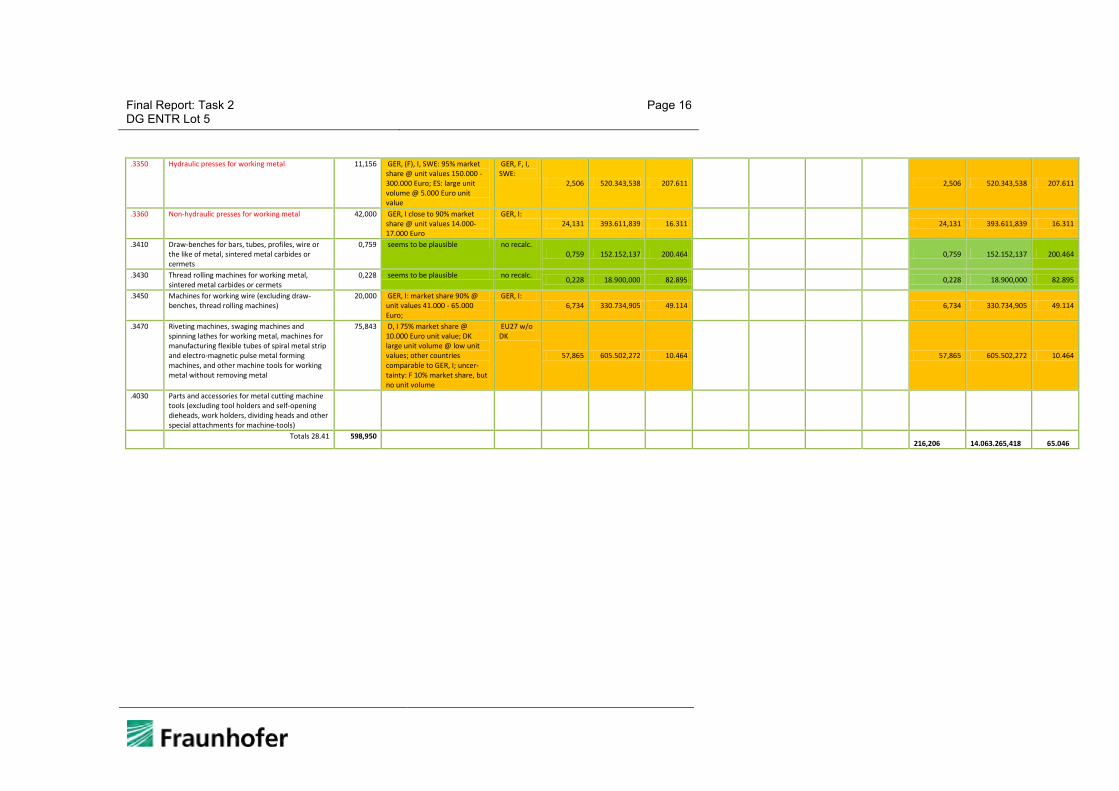
Table 2-4: EU-27 Production of machine tools under PRODCOM 28.41 (2009, based on PRODCOM, plausibility checked by Fraunhofer)
PRO
DCO
M C
ode
28.4
1...
Description
Volume (units) EU27
according to EuroStat
FRAUNHOFER Plausibility Check
Re-calculation
rule
re-calculated
EU27 Volume
re-calculated Value in
THOUSANDS
re-calculated unit value
Re-calculation rule for a 2nd sub-category,
where needed
re-calculated EU27 Volume (2nd catego-
ry)
re-calculated Value in
THOUSANDS (2nd catego-
ry)
re-calculated unit value
(2nd category)
TOTALS re-calculated
EU27 Volume
TOTALS re-calculated Value in THOUSANDS
TOTALS re-calculated unit value
.1110 Machine-tools for working any material by removal of material, operated by laser or other light or photon beam processes
5,963 market intelligence indicates a higher unit value for typical industrial units
recalculat-ed with unit value 400 k Euro
1,178
471.180,789
400.000 1,178
471.180,789 400.000
.1130 Machine-tools for working any material by removal of material, operated by ultrasonic processes (excluding machines for the manufac-ture of semiconductor devices or of electronic integrated circuits)
0,637 seems to be plausible no recalc.
0,637 31.004,422 48.673
0,637 31.004,422 48.673
.1150 Machine tools for working any material by removal of material, operated by electro-discharge processes
0,517 seems to be plausible no recalc. 0,517 85.381,022 165.147
0,517 85.381,022 165.147
.1170 Machine-tools for working any material by removal of material, operated by electro-chemical, electron-beam, ionic-beam or plasma arc processes
2,946 seems to be plausible no recalc.
2,946 113.375,640 38.485
2,946 113.375,640 38.485
.1180 Machine tools for working any material by removal of material, operated by ultrasonic processes, for the manufacture of semiconductor devices or of electronic integrated circuits
18,161 EU27 unit value of 1.600 Euro not plausible, but no country specific data accessible
rough estimate with 100.000 Euro unit value based on EU27 totals value
0,297 29.669,829 100.000
0,297 29.669,829 100.000
.1220 Horizontal machining centres for working metal 40,000 GER, F, I: 95% market share; remaining 5% market share not substantiated with unit volume
GER; F, I: 2,034 977.119,846 480.286
2,034 977.119,846 480.286
.1240 Vertical machining centres for working metal (including combined horizontal and vertical machining centres)
3,943 seems to be plausible no recalc. 3,943 875.968,867 222.158
3,943 875.968,867 222.158
.1250 Unit construction machines (single station) for working metal
1,647 I (with major share in terms of units) @ 10.000 Euro unit value, others (including GER) > 100.000 Euro
I:
1,133 12.964,000 11.442
EU27 w/o I:
0,514 62.269,839 121.148 1,647 75.233,839 45.679
.1270 Multi-station transfer machines for working metal
1,550 seems to be plausible no recalc. 1,550 771.951,499 498.033 1,550 771.951,499 498.033
.2123 Numerically controlled horizontal lathes, turning 20,000 EU27 unit value of 9.000 Euro EU27 0,511 178.876,606 350.000 0,511 178.876,606 350.000

Final Report: Task 2 DG ENTR Lot 5
Page 13
centres, for removing metal is not plausible; corrected GER data provided by VDW with unit value of 354.000 Euro
totals value divided by 350.000 Euro assumed unit value
.2127 Numerically controlled horizontal lathes, automatic lathes, for removing metal (excluding turning centres)
2,525 seems to be plausible no recalc. 2,525 432.386,856 171.242
2,525 432.386,856 171.242
.2129 Numerically controlled horizontal lathes, for removing metal (excluding turning centres, automatic lathes)
1,879 seems to be plausible no recalc. 1,879 413.042,333 219.820
1,879 413.042,333 219.820
.2140 Non-numerically controlled horizontal lathes, for removing metal
5,990 seems to be plausible no recalc. 5,990 143.325,496 23.927 5,990 143.325,496 23.927
.2160 Lathes, including turning centres, for removing metal (excluding horizontal lathes)
2,026 seems to be plausible no recalc. 2,026 765.408,664 377.793 2,026 765.408,664 377.793
.2213 Numerically controlled drilling machines for working metal (excluding way-type unit head machines)
0,560 seems to be plausible no recalc. 0,560 103.850,627 185.448
0,560 103.850,627 185.448
.2217 Numerically controlled knee-type milling machines for working metal (excluding boring-milling machines)
0,385 seems to be plausible despite a mis-match of EU27 unit value and median
no recalc. 0,385 84.980,847 220.729
0,385 84.980,847 220.729
.2223 Numerically controlled tool-milling machines for working metal (excluding boring-milling ma-chines, knee-type machines)
22,021 value for GER corrected no recalc. 2,538 475.751,005 187.451
2,538 475.751,005 187.451
.2225 Numerically controlled milling machines for working metal (including plano-milling machines) (excluding boring-milling machines, knee-type, tool-milling machines)
1,321 seems to be plausible, large variance, but all in the range of several 100.000 Euros unit value
no recalc.
1,321 518.450,002 392.468
1,321 518.450,002 392.468
.2233 Way-type unit heads for working metal by drilling, boring, milling, threading or tapping
9,760 Considered components
.2235 Non-numerically controlled drilling machines for working metal (excluding way-type unit head machines)
9,720 unit values for most countries @ 2.000 - 7.000 Euro; industrial use questionable
no recalc. 9,720 44.770,133 4.606
9,720 44.770,133 4.606
.2240 Numerically controlled boring and boring-milling machines for working metal (excluding drilling machines)
0,778 seems to be plausible no recalc. 0,778 488.636,573 628.068
0,778 488.636,573 628.068
.2260 Non-numerically controlled boring and boring-milling machines for working metal (excluding drilling machines)
0,338 units not disclosed for most important countries, but due to overall small number of units and high unit value it is unlikely, that a significant share of non-industrial equipment is covered
no recalc.
0,338 37.080,380 109.705
0,338 37.080,380 109.705
.2270 Non-numerically controlled milling machines for working metal (excluding boring-milling ma-chines)
12,965 unit value I: 1.800 Euro; all others > 7.000 Euro
EU27 w/o I 4,716 53.029,715 11.245
4,716 53.029,715 11.245
.2280 Threading or tapping machines for working metal (excluding drilling machines)
16,349 unit value < 1.000 Euro not relevant -
- - 0
.2305 Numerically controlled flat-surface grinding machines for working metal, in which the positioning in any one axis can be set up to a
1,061 UK unit value 30.000 Euro; GER, I: 175.000 and 290.000 Euro
UK: 0,432 13.153,523 30.448
EU27 w/o UK: 0,629 115.353,923 183.393 1,061 128.507,446 121.119
Final Report: Task 2 DG ENTR Lot 5
Page 14
minimum accuracy of 0.01mm
.2315 Numerically controlled cylindrical surface grinding machines for working metal, in which the positioning in any one axis can be set up to a minimum accuracy of 0.01mm
1,158 seems to be plausible no recalc.
1,158 595.037,772 513.850
1,158 595.037,772 513.850
.2325 Other numerically controlled grinding machines in which the positioning in any one axis can be set up to accuracy >0.01mm
0,314 seems to be plausible no recalc. 0,314 118.324,257 376.829
0,314 118.324,257 376.829
.2335 Non-numerically controlled flat-surface grinding machines for working metal, in which the positioning in any one axis can be set up to a minimum accuracy of 0.01mm
3,220 ES unit value < 1.000 Euro EU27 w/o ES 0,311 16.112,288 51.808
0,311 16.112,288 51.808
.2345 Non-numerically controlled cylindrical surface grinding machines for working metal, in which the positioning in any one axis can be set up to a minimum accuracy of 0.01mm
0,600 only 40% of unit volume disclosed (uncertainty about the rest), but seems to be plausible general
no recalc.
0,600 34.840,718 58.068
0,600 34.840,718 58.068
.2355 Grinding machines for working metal; any one axis can be set to an accuracy >=0.01mm excluding flat-surface grinding machines, cylindrical surface grinding machines
4,200 GER, I 90% market share; UK: low unit values (3.800 Euro)
GER, I:
2,384 61.606,596 25.842
2,384 61.606,596 25.842
.2365 Numerically controlled sharpening (tool or cutter grinding) machines for working metal
4,704 unit value DK 3.900 Euro; GER: 35.000 Euro unit value @ 70% market share
EU27 w/o DK 2,699 105.905,985 39.239
2,699 105.905,985 39.239
.2375 Non-numerically controlled sharpening (tool or cutter grinding) machines for working metal
24,000 GER 60% market share @ 5.000 Euro unit value; I, UK 25% market share; large number of units not substantiated (obvious overestimate by EuroStat, or large number of parts/non-industrial equip-ment); even for GER, I, UK industrial use questionable
GER, I, UK:
5,243 25.892,492 4.938
5,243 25.892,492 4.938
.2385 Honing or lapping machines for working metal 12,999 market split GER, I 50:50, but unit value in GER: 500.000, I: 6.500 Euro (industrial use questionable)
GER:
0,213 106.708,612 500.979
I:
12,608 82.865,000 6.572 12,821 189.573,612 14.786
.2395 Machines for deburring or polishing metal (excluding gear finishing machines)
60,000 GER, ES, I are all far above median and EU27 unit value, but 90% market share; obvious-ly overestimates by EuroStat
GER, ES, I:
4,165 184.819,452 44.374
4,165 184.819,452 44.374
.2410 Broaching machines for working metal 6,000 GER close to 85% market share, but at rather high unit value compared to others; 99% of sold units not substantiated with disclosed data, most likely overestimate by EuroStat
GER:
0,067 29.364,057 438.270
0,067 29.364,057 438.270
.2430 Gear cutting, gear grinding or gear finishing machines, for working metals, metal carbides or cermets (excluding planing, slotting and broach-ing machines)
30,000 GER close to 95% market share, units provided by VDW
GER, I:
1,057 648.123,960 613.173
1,057 648.123,960 613.173
.2470 Sawing or cutting-off machines for working metal 45,000 unit value: I < 5.000 Euro, A ca. CZ, DK, 6,043 202.163,497 33.454 6,043 202.163,497 33.454

Final Report: Task 2 DG ENTR Lot 5
Page 15
380.000 Euro; GER data provided by VDW
GER, A, P, FIN:
.2490 Planing, shaping or slotting machines and other machine-tools working by removing metal or cermets, n.e.c.
0,657 market dominated by GER, F (both with high unit values) and I (unit value = median; signifi-cant unit volumes); "n.e.c." category = high level of uncertainty
GER, F:
0,083 29.166,659 353.287
I:
0,548 5.849,000 10.673 0,631 35.015,659 55.531
.3120 Numerically controlled bending, folding, straight-ening or flattening machines for working flat metal products (including presses)
6,146 huge differences regarding unit values, even among countries with large market share; 50% of unit volume not disclosed on country level; severe uncertain-ty, but EU27 unit value is plausible
no recalc.
6,146 740.826,950 120.538
6,146 740.826,950 120.538
.3140 Numerically controlled bending, folding, straight-ening or flattening machines for working metal (including presses) (excluding those for working flat metal products)
5,579 seems to be plausible no recalc.
5,579 265.297,649 47.553
5,579 265.297,649 47.553
.3160 Non-numerically controlled bending, folding, straightening or flattening machines for working flat metal products (including presses)
12,000 GER, ES, I, FIN: 85% market share @ unit values 18.000 - 53.000 Euro; F, PL with relevant unit volumes, but unit value 4.000 Euro
GER, ES, I, FIN, BUL, CZ, DK, P: 5,676 203.540,780 35.860
5,676 203.540,780 35.860
.3180 Non-numerically controlled bending, folding, straightening or flattening machines for working metal (including presses) (excluding those for working flat metal products)
14,617 GER, I: market share 70% @ unit values 15-20.000 Euros, other countries: unit values < 5.000 Euro; UK: high unit value @ 320.000 Euro (but only 20 units)
GER, I, P, FIN:
4,827 78.041,565 16.168
4,827 78.041,565 16.168
.3220 Numerically controlled shearing machines for working metal (including presses) (excluding combined punching and shearing machines)
1,979 ES: unit value 850.000 Euro (40% market share); GER, I: 75.000/70.000 Euro unit value (50% market share)
ES:
0,084 71.698,091 853.549
EU27 w/o ES
1,895 113.316,383 59.798 1,979 185.014,474 93.489
.3240 Numerically controlled punching or notching machines for working metal (including presses, combined punching and shearing machines)
2,371 P: unit value 700 Euro; ES, SWE: rather low 30.000 Euro (NC!), others with unit values > 160.000 Euro
ES, SWE:
0,699 19.643,926 28.103
EU27 w/o ES, SWE, P 1,398 383.812,706 274.544 2,097 403.456,632 192.397
.3260 Non-numerically controlled shearing machines for working metal (including presses) (excluding combined punching and shearing machines)
11,589 PL: large unit volume @ unit value 250,- Euro
EU27 w/o PL: 10,457 234.296,871 22.406
10,457 234.296,871 22.406
.3280 Non-numerically controlled punching or notching machines for working metal (including presses, combined punching and shearing machines)
11,618 GER, ES, I: 90% market share, unit values 2.800 - 4.200 Euro; non-industrial use
not relevant -
- - 0
.3310 Numerically controlled forging or die-stamping machines and hammers for working metal (including presses)
1,971 GER 65% market share (with only 47 units); units for other relevant countries not disclosed
GER: 0,047 170.182,721 3.620.909
EU27 w/o GER; based on median value
0,295 93.915,002 318.063 0,342 264.097,723 771.602
.3320 Non-numerically controlled forging or die-stamping machines and hammers for working metal (including presses)
5,200 GER, I: 93% market share @ large unit values (320.000 / 620.000 Euro); others: few 1.000 Euro unit values
GER, I:
0,290 121.685,302 419.604
0,290 121.685,302 419.604
Final Report: Task 2 DG ENTR Lot 5
Page 16
.3350 Hydraulic presses for working metal 11,156 GER, (F), I, SWE: 95% market share @ unit values 150.000 - 300.000 Euro; ES: large unit volume @ 5.000 Euro unit value
GER, F, I, SWE:
2,506 520.343,538 207.611
2,506 520.343,538 207.611
.3360 Non-hydraulic presses for working metal 42,000 GER, I close to 90% market share @ unit values 14.000-17.000 Euro
GER, I: 24,131 393.611,839 16.311
24,131 393.611,839 16.311
.3410 Draw-benches for bars, tubes, profiles, wire or the like of metal, sintered metal carbides or cermets
0,759 seems to be plausible no recalc. 0,759 152.152,137 200.464
0,759 152.152,137 200.464
.3430 Thread rolling machines for working metal, sintered metal carbides or cermets
0,228 seems to be plausible no recalc. 0,228 18.900,000 82.895 0,228 18.900,000 82.895
.3450 Machines for working wire (excluding draw-benches, thread rolling machines)
20,000 GER, I: market share 90% @ unit values 41.000 - 65.000 Euro;
GER, I: 6,734 330.734,905 49.114
6,734 330.734,905 49.114
.3470 Riveting machines, swaging machines and spinning lathes for working metal, machines for manufacturing flexible tubes of spiral metal strip and electro-magnetic pulse metal forming machines, and other machine tools for working metal without removing metal
75,843 D, I 75% market share @ 10.000 Euro unit value; DK large unit volume @ low unit values; other countries comparable to GER, I; uncer-tainty: F 10% market share, but no unit volume
EU27 w/o DK
57,865 605.502,272 10.464
57,865 605.502,272 10.464
.4030 Parts and accessories for metal cutting machine tools (excluding tool holders and self-opening dieheads, work holders, dividing heads and other special attachments for machine-tools)
Totals 28.41 598,950 216,206 14.063.265,418 65.046

Final Report: Task 2 DG ENTR Lot 5
Page 17
2.1.2 Wood working machine tools
The market of wood working machinery saw a major drop in sales figures in 2009: VDMA states for the German market a 42% decrease in turnover for 2009 compared to 200810. However, from quarter to quarter, most significantly in the 4th quarter there was a tendency towards a r ecovery of the market, so a further drop is unlikely. Actually, manufacturers expect for 2010 a g rowth rate of 10 to 15% compared to the low 2009 level. It is worthwhile noticing, that the 2009 drop in revenue was less dramatic on the domestic market (Germany in this case), as major customers are crafts enterprises, which are less affected by the global crisis, partly even benefit from infrastructure in-vestment programmes.
Table 2-5 lists the verified 2009 PRODCOM production figures for wood working ma-chine tools anticipated to fall under the definition outlined in Task 1. For details of the methodology see 3 Annex I – Stock model methodology. The approach followed here was discussed with VDMA and EPTA, but figures as such were not verified by VDMA and ACIMALL.
10 Press release: VDMA Holzbearbeitungsmaschinen: Umsatzeinbruch von 42 Prozent, Frank-
furt am Main, February 17, 2010

Final Report: Task 2 DG ENTR Lot 5
Page 18
Table 2-5: EU-27 Production of machine tools under PRODCOM 28.49 (2009, based on PRODCOM, plausibility checked by Fraunhofer, wood working only)
PRO
DCO
M
Code
28
.49.
..
Description
Volume (units) EU27
according to EuroStat
FRAUNHOFER Plausibility Check
Re-calculation
rule
re-calculated
EU27 Volume
re-calculated Value in
THOUSANDS
re-calculated unit value
Re-calculation rule for a 2nd sub-category,
where needed
re-calculated EU27 Volume (2nd catego-
ry)
re-calculated Value in
THOUSANDS (2nd catego-
ry)
re-calculated unit value
(2nd category)
TOTALS re-calculated
EU27 Volume
TOTALS re-calculated Value in THOUSANDS
TOTALS re-calculated unit value
.1210 Multi-purpose machines where the workpiece is manually transferred between operations, for working wood, cork, bone, hard rubber, hard plastics or similar hard materials
15,438 GER, ES, I, A: 90% market share; but at large variation of unit prices (A: 10.000, ES: 82.000); others with lower unit values
GER, ES, I, A:
5,270 90.791,003 17.228
5,270 90.791,003 17.228
.1220 Multi-purpose machines where the workpiece is automatically transferred between operations for working wood, cork, bone, hard rubber, hard plastics or similar hard materials
9,858 unit value for all market dominating countries @ 38.000 - 160.000 Euro
no recalc.
9,858 484.977,240 49.196
9,858 484.977,240 49.196
.1233 Band saws for working wood, cork, bone and hard rubber, hard plastics or similar hard materials
2.000,000 figure not substantiated by figures of individual countries: GER, ES, F, I, P with 80% market share @ 4.000+ Euro unit value (I only slightly above 4.000); no unit volume for PL (10% market share)
GER, ES, F, I, P:
7,858 62.525,401 7.957
7,858 62.525,401 7.957
.1235 Circular saws for working wood, cork, bone, hard rubber, hard plastics or similar hard materials
39,677 ES, F, A, FIN unit values @ 20.000-160.000 Euro (25% market share); D + I @ < 6.000 Euro unit value (70% market share)
ES, F, A, FIN:
0,852 54.420,268 63.847
0,852 54.420,268 63.847
.1237 Sawing machines for working wood, cork, bone, hard rubber, hard plastics or similar hard materials (excluding band saws, circular saws)
300,000 GER close to 40% market share, but no unit volume (confiden-tial) for 2009; 2008 unit value GER: 1850 Euro (GER 2009 volume recalculated with 1850 Euro); I, A, FIN, SWE comprise another 50% market share with plausible volume. 300.000 units by far over-estimated
I, A, FIN, SWE
3,532 70.300,928 19.904
GER:
26,051 48.193,566 1.850 29,583 118.494,494 4.006
.1250 Planing, milling or moulding (by cutting) ma-chines for working wood, cork, bone, hard rubber, hard plastics or similar hard materials
39,889 GER, ES, P unit values > 20.000 Euro (60% market share); I (+ PL) < 3.000 Euro (25% market share) - considered non-industrial use; FIN 7% market share with 21 units @ 1,7 mio each
GER, ES, P
3,568 168.041,369 47.097
3,568 168.041,369 47.097
.1263 Grinding, sanding or polishing machines for working wood, cork, bone, hard rubber, hard plastics or similar hard materials
784,566 GER, I: 90% market share, but huge difference in unit value (9.000 vs. 55.000 Euro); DK @ unit value of 75 Euro
GER
5,490 49.157,049 8.954
I:
0,885 48.509,000
54.812 6,375 97.666,049 15.320

Final Report: Task 2 DG ENTR Lot 5
Page 19
.1265 Bending or assembling machines for working wood, cork, bone, hard rubber, hard plastics or similar hard materials
2,319 GER + I + ES 70% market share @ 19.000 - 26.000 Euro unit value; FIN 15% market share with 6 units @ 1,5 mio Euro each
GER, ES, I:
2,194 51.400,465 23.428
2,194 51.400,465 23.428
.1267 Drilling or morticing machines for working wood, cork, bone, hard rubber, hard plastics or similar hard materials
10,548 includes countries with unit values down to few 1.000 Euros; GER, I: 90% market share at unit values 19.000 and 9.000 Euro. Figures are plausible, but covers most likely also some non-industrial equipment
no recalc.
10,548 126.004,066 11.946
10,548 126.004,066 11.946
.1275 Splitting, slicing or paring machines for working wood, cork, bone, hard rubber, hard plastics or similar hard materials
16,448 GER, I, FIN cover 95% market share with unit values of 19.000 down to 6.600 Euros; figures are plausible, but cover also likely non-industrial equipment
no recalc.
16,448 218.972,083 13.313
16,448 218.972,083 13.313
.1279 Machine tools for working wood, cork, bone, hard rubber, hard plastics or similar hard materials, n.e.c.
200,000 nearly 90% of the market share covered by GER, ES, F, I (I = 60%), A, PL, FIN, but large spread: I @ 6.600 Euro unit value, FIN @ 260.000 Euro; most units to be assessed as close to non-industrial use
GER, ES, F, I , A, PL, FIN:
31,330 288.817,730 9.219
31,330 288.817,730 9.219
.1287 Presses for the manufacture of particle board or fibre building board of wood or other ligneous materials, and other machines with individual functions for treating wood or cork
17,149 DK irrelevant at unit values of 1.600 Euro; others frequently in the 40.000 Euro range; D @ 500.000 Euro, FIN @ 1.500.000 Euro;
GER, FIN:
1,209 605.691,250 500.985
EU27 w/o DK, GER, FIN:
5,747 185.073,900 32.204 6,956 790.765,150 113.681
Totals 28.49 wood working 3.435,892
130,840 2.552.875,318 19.511

Final Report: Task 2 DG ENTR Lot 5
Page 20
Instead of 3.4 million units sold production as stated by EuroStat for wood working ma-chine tools under 28.49 a more reasonable figure according to the plausibility check by Fraunhofer is 130,000 units sold production in 200911. The categories saws and plan-ing equipment, for which the recalculated number of industrial units is 42,000 there is an overlap with so-called light stationary wood working tools, which are at a rather low unit value of up to 1,000 Euro:
Light Stationary Wood working Tools
EPTA, the European Power Tools Association, provided market insights for light stationary wood working tools: This sub-sector accounts for approximate-ly € 135 million sales and 220,000 units per annum. The products fall broadly into three categories as listed in Table 2-6.
Table 2-6: EU sales of light stationary wood working tools (source EPTA)
Table and Radial Arm Saws
Band Saws Planer Thick-nessers
EU sales value € 80 million € 30 million € 25 million
EU sales volume 110,000 units 80,000 units 30,000 units
Calculated unit value 730 Euros 375 Euros 833 Euros
Only 30% of sales in this sector are attributable to EPTA members. There are an unknown number of small independent suppliers, mostly Asian.
This market segment, according to EPTA, can be differentiated from heavier wood working stationary products by three factors:
Duty – Light Stationary products are typically used intermittently and are almost always manually fed. Heavier duty machines are typically used continuously and are usually automatically fed.
Motor power – Light Stationary products use induction motors rated mainly between 750 and 3000 watts input power. Heavier duty products are powered by motors usually in excess of 3000 watts.
11 Given the fact, that the wood working market sees a much higher share of low cost units e.g.
for DIY-ers, there is a higher uncertainty regarding the number of units used by profession-als, than for the metal working machine tools market.

Final Report: Task 2 DG ENTR Lot 5
Page 21
Cutting capacity – Light Stationary table and radial arm saws have maximum blade diameters of 350 mm. Light stationary bandsaws have a maximum cutting height / passage width of 280 x 440 m m. Light stationary planer thicknessers have a maximum passage height / width of 180 x 307 whereas heavier duty products have capacities in excess of that.
Typically, because they are light duty, these tools do not have feed systems, hydraulic units or cooling lubricant facilities.
The life cycle of these products is relatively long. It is estimated that 50% of these products will be used longer than 25 years because they are used intermittently – which would result roughly in an installed stock of 5 million units in EU-27. According to EPTA and their members the majority of users use the products no more than once per day.
Consequently, there were roughly between 90,000 and 130,000 larger, industrial type units produced in EU-27, and 70,000 (30% of EU-27 sales) of light stationary wood working tools.
2.1.3 Welding, soldering and brazing equipment
Table 2-7 lists the verified 2009 PRODCOM production figures for welding, soldering and brazing equipment anticipated to fall under the definition outlined in Task 1. For details of the methodology see 3 Annex I – Stock model methodology. The figures and classifications were discussed with representatives of EWA. The column “plausibility check” also lists further explanations regarding the likely allocation of equipment to a given category. For example, “fully or partly automatic electric machines” is a category to which typically equipment is reported, which is equipped with an automatic welding wire feed, but not highly complex full-automatic welding machines12. Those machinery categories, which – after revision – covers mainly CNC m achinery is marked in red. Two categories cover equipment in the below 1,000 Euro unit value range, which is smaller transportable equipment. Misallocation of components and parts in this catego-ry might have happened, but overall order of magnitude seems to be plausible accord-ing to industry experts. 12 As the data has to be reported individually by manufacturers to the national statistics authori-
ties a j udgement by manufacturers and t he association to which categories they report which type of equipment is the best indication available to facilitate the interpretation of the data – although naming of PRODCOM codes might be misleading in some cases.

Final Report: Task 2 DG ENTR Lot 5
Page 22
Table 2-7: EU-27 Production of welding, soldering and brazing equipment (2009, based on PRODCOM, plausibility checked by Fraunhofer)
PRO
DCO
M C
ode
Description
Volume (units) EU27 according
to EuroStat FRAUNHOFER Plausibility Check Re-calculation
rule re-calculated EU27 Volume
re-calculated Value in THOUSANDS
re-calculated unit value
27903118 Electric brazing or soldering machines and apparatus (excluding soldering irons and guns) 2,713
seems to be plausible, likely to be electronics soldering ma-chines etc., covering solder pots to flow solder machines
no recalcu-lation 2,713 71.483,300 26.348
27903145 Electric machines and apparatus for resistance welding of metal 224,563 volume is not plausible; CZ, GER, ES, SWE, UK: 75% market share
at minimum 5000 Euro unit value CZ, GER, ES, SWE, UK: 43,656 558.596,000 12.795
27903154 Fully or partly automatic electric machines for arc welding of metals (including plasma arc) 277,321
seems to be plausible: transportable equipment for manual welding with automatic feed of welding wire; GER 25% market share @ 20.000 Euro unit value, all others in the 500 - 2.000 Euro range
no recalcu-lation 277,321 329.375,815 1.188
27903163 Other for manual welding with coated electrodes 630,299
seems to be plausible: transportable equipment for manual welding, low unit values < 400 Euro
no recalcu-lation 630,299 136.152,471 216
27903172 Other shielded arc welding 326,963
seems to be plausible: transportable equipment for manual welding, low unit value 700 Euro
no recalcu-lation 326,963 194.935,172 596
27903181 Machines and apparatus for welding or spraying of metals, n.e.c. 17,367
seems to be plausible, covers automatic machinery, i.e. mostly stationary welding units; UK with 5% market share at low 2.500 Euro unit value, others in the 10.000 Euro range
no recalcu-lation 17,367 163.760,510 9.429
27903190 Machines and apparatus for resistance welding of plastics
1.111,507
number and category questionable, not covered by "welding" sector, presumably packaging machines to seal plastic packages; some large units for the automotive sector might be covered here as well; I 35% market share (< 2.000 Euro unit value), F 10% market share(13 Euro unit value - laminating devices?), GER 50% market share (10.000 Euro unit value)
EU-27 w/o F:
47,323 123.569,842 2.611
27903199 Machines and apparatus for welding (excluding for resistance welding of plastics, for arc and plasma arc welding, for treating metals)
41,999 GER, UK, DK 85% market share GER, UK,
DK: 8,911 222.451,139 24.964
28297090 Machinery and apparatus for soldering, brazing, welding or surface tempering (excluding hand-held blow pipes and electric machines and apparatus)
672,909 covers inter alia industrial cutting equipment, but number of units is way too high for this; I, FIN with unit values below 100 Euro, F at 1.000 Euro, GER+UK 70% market share
GER, UK: 4,727 136.797,305 28.940
Totals 3.305,641 1359,280 1.937.121,554

Final Report: Task 2 DG ENTR Lot 5
Page 23
The figures above include soldering equipment, which can be c onsidered industrial ovens (e.g. reflow soldering ovens for printed circuit board assembly), which fall under the scope of Product Group Study Lot 4 - Industrial and Laboratory Furnaces and Ov-ens13.
2.1.4 Other machine tools
It is not possible to provide a comprehensive verification of all kinds of other machine tools. Therefore the following figures are restricted to the important sub-segment of stone and c eramics working machine tools. Table 2-8 lists the verified 2009 PRODCOM production figures. For details of the methodology see 3 Annex I – Stock model methodology.
The plausibility check unveiled, that the EuroStat figures are much higher than the ac-tual plausible number of stone and c eramics working machine tools for professional use, parts and components and non-energy related tools excluded. In total the produc-tion volume in the EU-27 in 2009 was close to 60,000 units (instead of 430,000 units as listed by EuroStat).
For grinding and polishing machines a distinction of the German, Italian, Spanish and UK market, reporting rather high-value machinery with an average unit value of 85,000 Euros and Fr ance and Portugal reporting unit values slightly below 10,000 Euros is provided.
13 See http://www.eco-furnace.org/

Final Report: Task 2 DG ENTR Lot 5
Page 24
Table 2-8: EU-27 Production of stone and ceramics working machine tools (2009, based on PRODCOM, plausibility checked by Fraunhofer)
PRO
DCO
M
Code
28
.49.
..
Description
Volume (units) EU27
according to EuroStat
FRAUNHOFER Plausibility Check
Re-calculation
rule
re-calculated
EU27 Volume
re-calculated Value in
THOUSANDS
re-calculated unit value
Re-calculation rule for a 2nd sub-category,
where needed
re-calculated EU27 Volume (2nd catego-
ry)
re-calculated Value in
THOUSANDS (2nd catego-
ry)
re-calculated unit value
(2nd category)
TOTALS re-calculated
EU27 Volume
TOTALS re-calculated Value in THOUSANDS
TOTALS re-calculated unit value
.1130 Sawing machines for working stone, ceramics, concrete, asbestos-cement or like mineral materials or for cold working glass
143,531 EU27 unit value below 2.000 Euro, GER: below 600 Euro; I: 8.500 Euro at 60% market share
EU27 w/o GER 30,344 203.942,051 6.721
30,344 203.942,051 6.721
.1150 Grinding or polishing machines for working stone, ceramics, concrete, asbestos-cement or like mineral materials or for cold working glass
9,948 GER, I: unit values 90.000 Euro (65% market share); F unit value 9.000 Euro (25% market share); others < 1.000 Euro unit value
GER, I, ES, UK:
2,022 172.682,451 85.402
F, P:
6,720 61.390,391 9.135 8,742 234.072,842 26.776
.1170 Machine-tools for working stone, ceramics, concrete, asbestos-cement or like mineral materials or for cold working glass (excluding sawing machines, grinding or polishing machines)
276,626 ES unit value 150 Euro; GER @ 25.000 Euro; I @ 35.000 Euro; GER + I > 85% market share
GER, I:
20,054 612.630,883 30.549
20,054 612.630,883 30.549
Totals 430,105 59,140 1.050.645,776 17.765

Final Report: Task 2 DG ENTR Lot 5
Page 25
2.1.5 Summary
The production figures from the Eurostat PRODCOM statistics, which underwent a plausibility check by Fraunhofer, were discussed with market experts at the industry associations and with market leaders for some segments, and were subject to revision based on the findings are summarised in the table below.
Grand totals of the EU 27 production market of machine tools according to these fig-ures is 19.6 billion Euros, and 1. 77 million units (but largely dominated by welding equipment).
Table 2-9: EU-27 Production of machine tools – Summary (2009, based on PRODCOM, plausibility checked by Fraunhofer)
Category Initial PRODCOM production figures
(units, 2009)
TOTALS re-calculated
EU27 Produc-tion Volume
TOTALS re-calculated Value in Euro
TOTALS re-calculated unit value
Metal working machine tools 598.950 216.206 14.063.265.418 65.046 Wood working machine tools 3.435.892 130.840 2.552.875.318 19.511
Light stationary woodworking tools n.a. 70.000 n.a. < 1.000
Welding, soldering and brazing equipment
3.305.641 1.359.280 1.937.121.554
Stone and ceramics working machine tools
430.105 59.140 1.050.645.776 17.765
Totals (w/o light stationary wood working machine tools) 7.770.588 1.765.466 19.603.908.066

Final Report: Task 2 DG ENTR Lot 5
Page 26
2.2 Market and stock data
2.2.1 Base Data for the Stock Model
2.2.1.1 Metal working machine tools
As there are no dedicated statistics available regarding the installed stock of machine tools, such figures have to be derived from sales figures with qualified assumptions. Average technical and economic product life is one of these key parameters:
The large Japanese machine tool manufacturer Mori Seiki Co. estimates an average lifetime of 15 years for machine tools14.
According to a VDMA index, average lifetime of NC-controlled machine tools is 9.5 years, average lifetime of non-NC controlled machine tools 18.6 years15.
An indication about age of machine tools being still in use or at least considered usable is the market for used machine tools. An evaluation of more than 3,400 machine tools offered mid-March 2010 at one of the leading internet platforms MM Maschinenmarkt Börse online unveils the broad age spread of machine tools offered for reuse: Actually reuse starts right from day zero. These very early reuse cases obviously stem from companies cancelling orders or facing bankruptcy after having ordered machinery. The huge fluctuations in the design year16 of offered machine tools reflects nearly exactly the economic cycles: If in a certain year less machine tools have been manufactured, rather logically a lower number of machine tools from that respective year is offered now as used machinery. The design year with most used machine tools traded is 1989, indicating that a machine tools’ lifetime of more than 20 years is not uncommon at all. There is a remarkable number of machine tools build in the 1960s and 1970s still of-fered on this trade platform.
This platform is particularly popular for metal working machine tools.
14 See Interview with Dr. Rüdiger Kapitza, CEO Gildemeister AG, and Dr. Masahiko Mori,CEO
Mori Seiki Co., Ltd., in: Die Zukunft der Werkzeugmaschinen-Industrie, Produktion Nr. 24, 2007
15 VDMA-Kennzahlen Fertigung und Montage 2006 16 For clarification of terminology: “design year” refers to the year when an individual machine
tool is produced, not the year when the layout of a certain model series of machine tools was designed for the first time

Final Report: Task 2 DG ENTR Lot 5
Page 27
Figure 2-3: Year of Design of Second Hand Machine Tools – Absolute Numbers (as of March 2010)
Looking at those machine tools traded at MM Maschinenmarkt Börse online, which bear in the category name a reference to numerical controlled or machining centre gives an indication about the age of numerical controlled machine tools specifically.

Final Report: Task 2 DG ENTR Lot 5
Page 28
Figure 2-4: Year of Design of Second Hand Machine Tools – Percentage – numer-ical-controlled and machining centres highlighted17
17 Not that the distinction of NC / non-NC is not that clear in the statistics and categories of this
second hand platform as it seems to be in this graphical illustration; there are NC-controlled machine tools also included occasionally in the greyed categories

Final Report: Task 2 DG ENTR Lot 5
Page 29
In Figure 2-4 all categories are greyed out, which do not bear CNC or machining centre in the category name: It is confirmed, that as a tendency, numerical-controlled machine tools traded as second hand machinery have a higher representation in the reuse mar-ket of younger machines. The figure of 9.5 years average lifetime of NC-controlled ma-chine tools stated by VDMA (see above) nevertheless is likely to underestimate the real lifetime when looking at the second hand statistics provided below. On the other hand it should be not ed, that the market share of new machine tools shifted from non-numerical controlled machine tools to CNC machine tools anyway, so the statistics of second hand machinery provided in the figure below might rather be a reflection of the market situation of the given year of design (more non-NC controlled machine tools available from earlier years, more NC-controlled machinery available from more recent years).
Table 2-10 lists the average age of machine tools traded at MM Maschinenmarkt Börse online. Only categories with more than 40 units offered as of March 2010 (and stating a year of design) are listed. At minimum the average age of machine tools showing up on this platform is 11 years in case of universal machining centres, and at maximum in the range of 30 years for table type boring and milling machines, centre lathes, and con-ventional milling machines.
Table 2-10: Average Age of Machine Tools offered as Second Hand Equipment
Units offered (Totals)
Avrg. age (years)
Machining Centres - Horizontal 149 15 Machining Centre - Universal 77 11 Machining Centres - Vertical 422 12 Round bending machine 42 20 Radial Drilling Machine 89 29 Pillar Drilling Machine 63 29 Table Type Boring and Milling Machine 111 30 Lathe - CNC 475 13 Vertical Turret Lathe 73 28 Centre Lathe 158 31 turning lathe 83 25 Wire Erosion Machine 42 14 Bed-type milling machines 132 20 Milling Machine - Universal 140 24 Milling machines (conventional) 67 30 Milling machines CNC 97 19

Final Report: Task 2 DG ENTR Lot 5
Page 30
Units offered (Totals)
Avrg. age (years)
Knee-and-Column Milling Machine 41 25 Tool Room Milling Machine - Universal 129 25 Honing Machines 48 29
According to a recent survey by VDW18 the age of machine tools at end-of-life is fre-quently above 25 years (43% of the replies), the remaining machine tools reach their end-of-life mostly between 16 and 20 y ears of age, some already at 10 to 15 years (see Task 3.3 for more details).
An inquiry among market experts through CECIMO at their member associations lead to experts’ estimates regarding average lifetimes of metal working machine tools. Esti-mates were made by experts from Italy and France, the German data on average age was taken with the assumption, that the lifetime is roughly twice the average age of the machine tools found in operation.
Table 2-11: Estimates of Average Lifetime of Metal Working Machine Tools
PRODCOM Description Average lifetime (years)
Italy France Germany average
Estimate Estimate VDMA, 2006
28411110 Machine-tools for working any material by re-moval of material, operated by laser or other light or photon beam processes
10 17 9,5 12
28411130 Machine-tools for working any material by re-moval of material, operated by ultrasonic pro-cesses (excluding machines for the manufacture of semiconductor devices or of electronic inte-grated circuits)
17 18,6 18
28411150 Machine tools for working any material by re-moval of material, operated by electro-discharge processes
14 17 9,5 14
28411170 Machine-tools for working any material by re-moval of material, operated by electro-chemical, electron-beam, ionic-beam or plasma arc pro-cesses
17 18,6 18
28411180 Machine tools for working any material by re-moval of material, operated by ultrasonic pro-cesses, for the manufacture of semiconductor devices or of electronic integrated circuits
17 18,6 18
28411220 Horizontal machining centres for working metal 8 17 9,5 12
18 Verein Deutscher Werkzeugmaschinenfabriken e.V.: Art und Umfang von Retrofit-
/Refurbishing-Maßnahmen (R/R) an Werkzeugmaschinen, survey, February 2010
Final Report: Task 2 DG ENTR Lot 5
Page 31
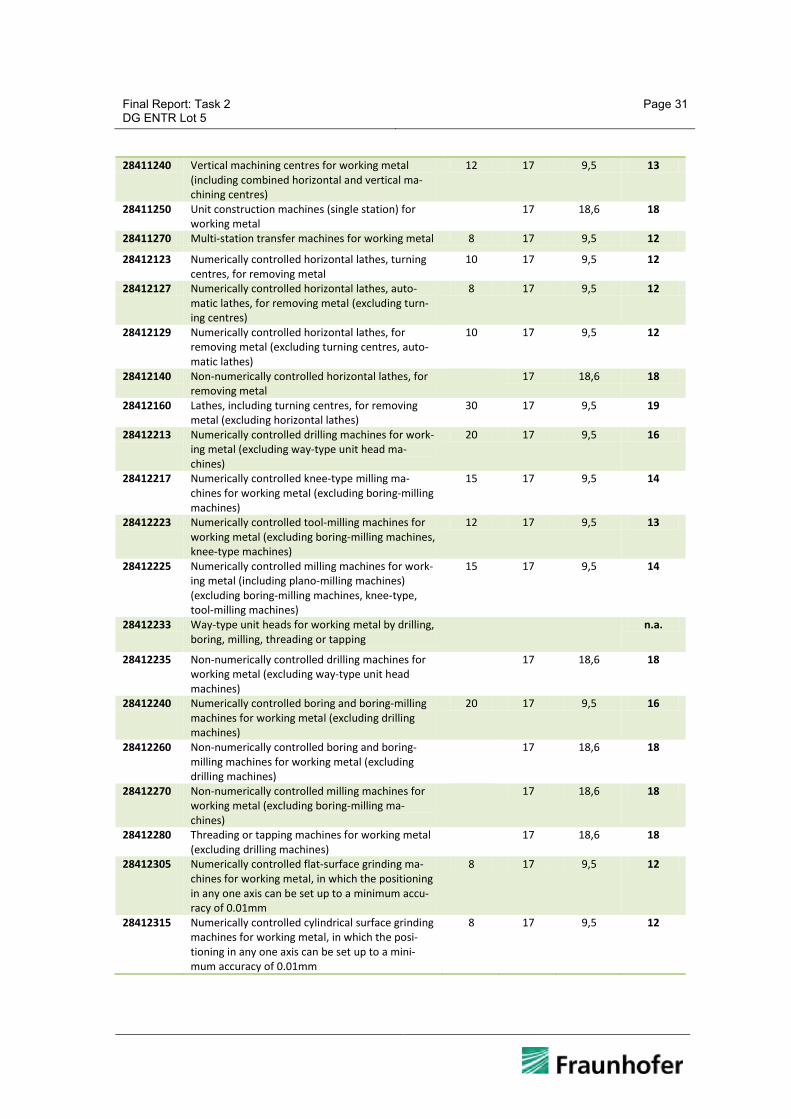
28411240 Vertical machining centres for working metal (including combined horizontal and vertical ma-chining centres)
12 17 9,5 13
28411250 Unit construction machines (single station) for working metal
17 18,6 18
28411270 Multi-station transfer machines for working metal 8 17 9,5 12
28412123 Numerically controlled horizontal lathes, turning centres, for removing metal
10 17 9,5 12
28412127 Numerically controlled horizontal lathes, auto-matic lathes, for removing metal (excluding turn-ing centres)
8 17 9,5 12
28412129 Numerically controlled horizontal lathes, for removing metal (excluding turning centres, auto-matic lathes)
10 17 9,5 12
28412140 Non-numerically controlled horizontal lathes, for removing metal
17 18,6 18
28412160 Lathes, including turning centres, for removing metal (excluding horizontal lathes)
30 17 9,5 19
28412213 Numerically controlled drilling machines for work-ing metal (excluding way-type unit head ma-chines)
20 17 9,5 16
28412217 Numerically controlled knee-type milling ma-chines for working metal (excluding boring-milling machines)
15 17 9,5 14
28412223 Numerically controlled tool-milling machines for working metal (excluding boring-milling machines, knee-type machines)
12 17 9,5 13
28412225 Numerically controlled milling machines for work-ing metal (including plano-milling machines) (excluding boring-milling machines, knee-type, tool-milling machines)
15 17 9,5 14
28412233 Way-type unit heads for working metal by drilling, boring, milling, threading or tapping
n.a.
28412235 Non-numerically controlled drilling machines for working metal (excluding way-type unit head machines)
17 18,6 18
28412240 Numerically controlled boring and boring-milling machines for working metal (excluding drilling machines)
20 17 9,5 16
28412260 Non-numerically controlled boring and boring-milling machines for working metal (excluding drilling machines)
17 18,6 18
28412270 Non-numerically controlled milling machines for working metal (excluding boring-milling ma-chines)
17 18,6 18
28412280 Threading or tapping machines for working metal (excluding drilling machines)
17 18,6 18
28412305 Numerically controlled flat-surface grinding ma-chines for working metal, in which the positioning in any one axis can be set up to a minimum accu-racy of 0.01mm
8 17 9,5 12
28412315 Numerically controlled cylindrical surface grinding machines for working metal, in which the posi-tioning in any one axis can be set up to a mini-mum accuracy of 0.01mm
8 17 9,5 12
Final Report: Task 2 DG ENTR Lot 5
Page 32
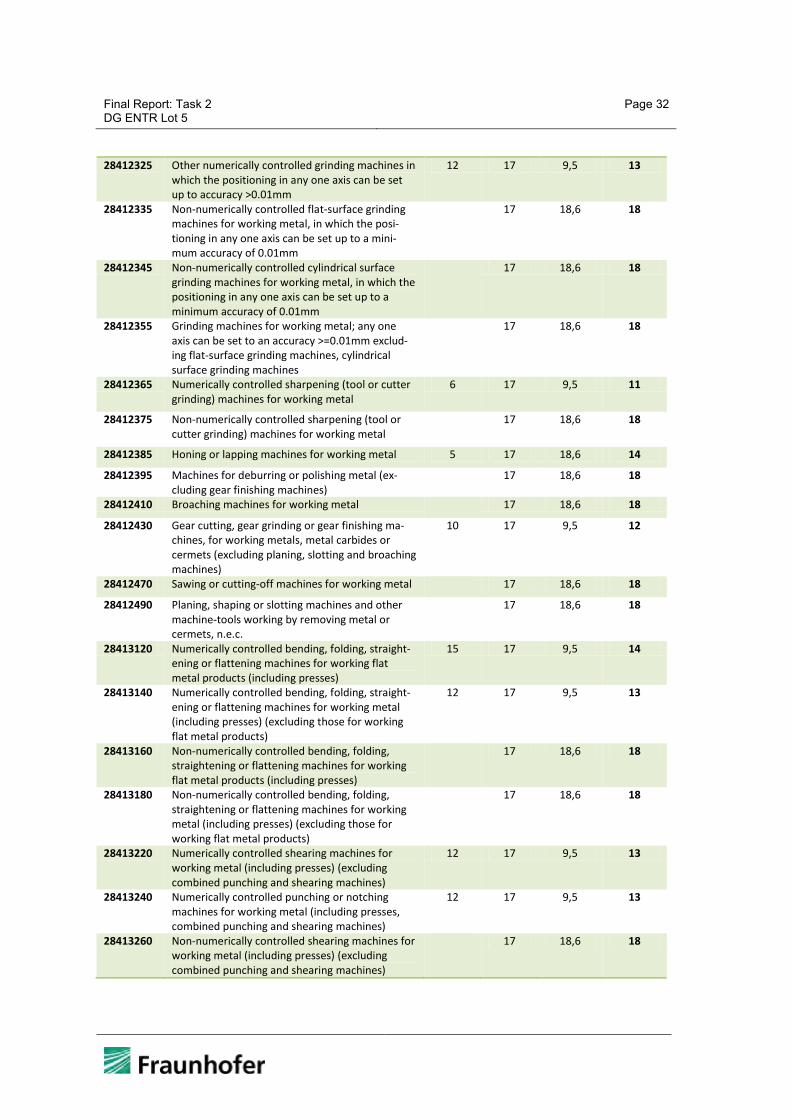
28412325 Other numerically controlled grinding machines in which the positioning in any one axis can be set up to accuracy >0.01mm
12 17 9,5 13
28412335 Non-numerically controlled flat-surface grinding machines for working metal, in which the posi-tioning in any one axis can be set up to a mini-mum accuracy of 0.01mm
17 18,6 18
28412345 Non-numerically controlled cylindrical surface grinding machines for working metal, in which the positioning in any one axis can be set up to a minimum accuracy of 0.01mm
17 18,6 18
28412355 Grinding machines for working metal; any one axis can be set to an accuracy >=0.01mm exclud-ing flat-surface grinding machines, cylindrical surface grinding machines
17 18,6 18
28412365 Numerically controlled sharpening (tool or cutter grinding) machines for working metal
6 17 9,5 11
28412375 Non-numerically controlled sharpening (tool or cutter grinding) machines for working metal
17 18,6 18
28412385 Honing or lapping machines for working metal 5 17 18,6 14
28412395 Machines for deburring or polishing metal (ex-cluding gear finishing machines)
17 18,6 18
28412410 Broaching machines for working metal 17 18,6 18
28412430 Gear cutting, gear grinding or gear finishing ma-chines, for working metals, metal carbides or cermets (excluding planing, slotting and broaching machines)
10 17 9,5 12
28412470 Sawing or cutting-off machines for working metal 17 18,6 18
28412490 Planing, shaping or slotting machines and other machine-tools working by removing metal or cermets, n.e.c.
17 18,6 18
28413120 Numerically controlled bending, folding, straight-ening or flattening machines for working flat metal products (including presses)
15 17 9,5 14
28413140 Numerically controlled bending, folding, straight-ening or flattening machines for working metal (including presses) (excluding those for working flat metal products)
12 17 9,5 13
28413160 Non-numerically controlled bending, folding, straightening or flattening machines for working flat metal products (including presses)
17 18,6 18
28413180 Non-numerically controlled bending, folding, straightening or flattening machines for working metal (including presses) (excluding those for working flat metal products)
17 18,6 18
28413220 Numerically controlled shearing machines for working metal (including presses) (excluding combined punching and shearing machines)
12 17 9,5 13
28413240 Numerically controlled punching or notching machines for working metal (including presses, combined punching and shearing machines)
12 17 9,5 13
28413260 Non-numerically controlled shearing machines for working metal (including presses) (excluding combined punching and shearing machines)
17 18,6 18

Final Report: Task 2 DG ENTR Lot 5
Page 33
28413280 Non-numerically controlled punching or notching machines for working metal (including presses, combined punching and shearing machines)
17 18,6 18
28413310 Numerically controlled forging or die-stamping machines and hammers for working metal (includ-ing presses)
30 17 9,5 19
28413320 Non-numerically controlled forging or die-stamping machines and hammers for working metal (including presses)
17 18,6 18
28413350 Hydraulic presses for working metal 25 17 9,5 17
28413360 Non-hydraulic presses for working metal 25 17 18,6 20
28413410 Draw-benches for bars, tubes, profiles, wire or the like of metal, sintered metal carbides or cermets
15
28413430 Thread rolling machines for working metal, sin-tered metal carbides or cermets
15
28413450 Machines for working wire (excluding draw-benches, thread rolling machines)
15
28413470 Riveting machines, swaging machines and spin-ning lathes for working metal, machines for man-ufacturing flexible tubes of spiral metal strip and electro-magnetic pulse metal forming machines, and other machine tools for working metal with-out removing metal
15
The huge spread in estimated and calculated lifetimes indicates that machine lifetime (and thus the stock calculated on this basis) is subject to a high level of uncertainty.
2.2.1.2 Wood working machine tools
There is no lifetime data available for wood working machine tools. Taking the stated lifetime for other larger machinery of indicatively 15 - 25 years as an a pproximation, and noticing the EPTA statement that 50% of light stationary products will be used longer than 25 years it is considered appropriate to calculate with roughly 20 years lifetime for wood working machinery, but this is subject to a high level of uncertainty.
2.2.1.3 Welding, soldering and brazing equipment
As there is no r obust statistic the average lifetime of welding, soldering and br azing equipment was estimated by an industry expert19, and confirmed at an EWA associa-tion meeting.
19 P. Couderc, Air Liquide

Final Report: Task 2 DG ENTR Lot 5
Page 34
Table 2-12: Estimates of Average Lifetime of Welding, Soldering and Brazing Equipment
PRODCOM Description Average lifetime (years)
27903118 Electric brazing or soldering machines and apparatus (excluding solder-ing irons and guns) 20
27903145 Electric machines and apparatus for resistance welding of metal 15 27903154 Fully or partly automatic electric machines for arc welding of metals
(including plasma arc) 7
27903163 Other for manual welding with coated electrodes 5 27903172 Other shielded arc welding 5 27903181 Machines and apparatus for welding or spraying of metals, n.e.c. 20 27903190 Machines and apparatus for resistance welding of plastics 20 27903199 Machines and apparatus for welding (excluding for resistance welding of
plastics, for arc and plasma arc welding, for treating metals) 20
28297090 Machinery and apparatus for soldering, brazing, welding or surface tempering (excluding hand-held blow pipes and electric machines and apparatus)
20
The low cost units in particular are estimated to be at a rather short lifetime of 5 years, whereas the larger production equipment, being high value investment goods are typi-cally used much longer, indicatively 20 years.
2.2.1.4 Other machine tools
For the large variety of other machine tools and application fields no robust figures re-garding average lifetime can be stated. The only statement that can be made, is that the lifetime as for other investment goods is in the range of several years to few dec-ades. For the segment of stone and ceramics working machine tools similar lifetimes as for metal and wood working can be ant icipated in the range of 10-25 years. Esti-mates below will be based on 20 years lifetime.
2.2.2 Installed base (EU-27 stock)
2.2.2.1 Metal working machine tools Actually, it has to be noticed that average machine tool lifetime changes with the eco-nomic cycle and does not keep stable over time. However, these dynamics in detail are not known.
Having said this, the stock model for metal working machine tool product categories (NACE codes) is as listed in the table below for 1995 a s Kyoto reference year and 2009 as most recent year, for which Eurostat data is available20. 20 as of early 2010

Final Report: Task 2 DG ENTR Lot 5
Page 35
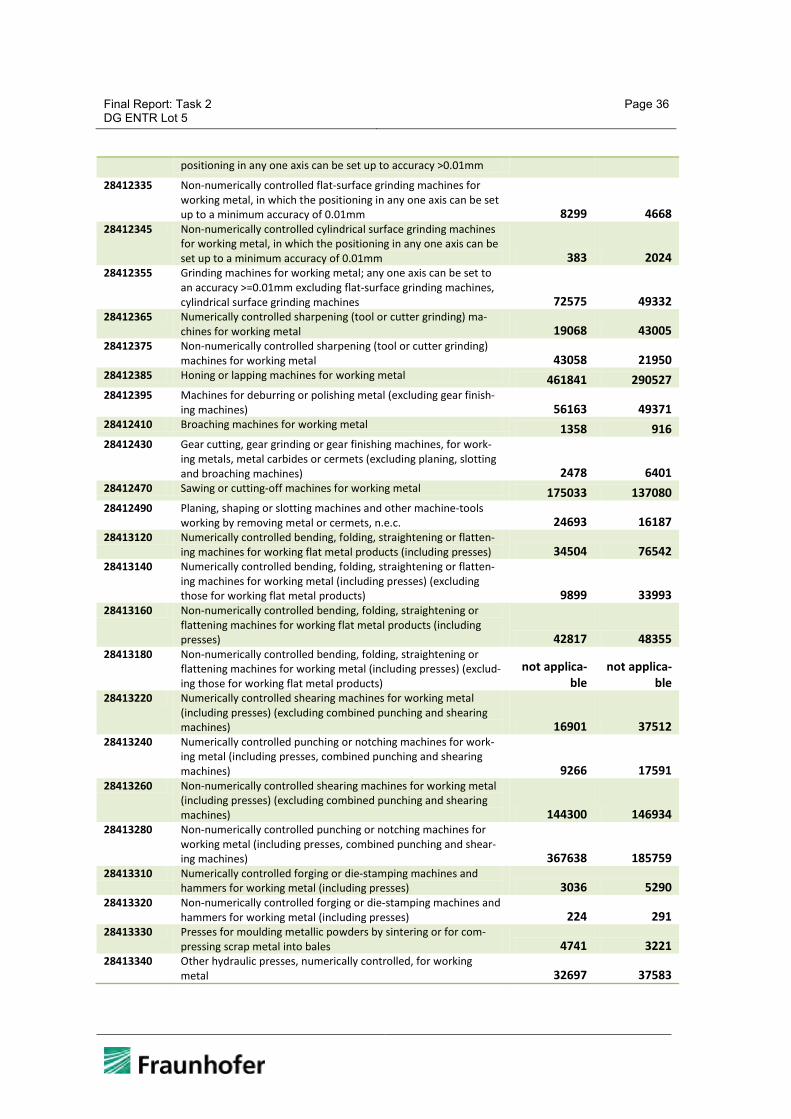
Table 2-13: Metal working machine tools - Installed stock 1995 and 2009
PRODCOM Description 1995 2009 28411110 Machine-tools for working any material by removal of material,
operated by laser or other light or photon beam processes
4.818
18.978 28411130 Machine-tools for working any material by removal of material,
operated by ultrasonic processes (excluding machines for the manufacture of semiconductor devices or of electronic integrated circuits) 3312 8762
28411150 Machine tools for working any material by removal of material, operated by electro-discharge processes 22964 33246
28411170 Machine-tools for working any material by removal of material, operated by electro-chemical, electron-beam, ionic-beam or plasma arc processes 64263 114266
28411220 Horizontal machining centres for working metal 17137 33965 28411240 Vertical machining centres for working metal (including combined
horizontal and vertical machining centres) 34986 99614 28411250 Unit construction machines (single station) for working metal 13862 40955 28411270 Multi-station transfer machines for working metal 11949 22828 28412123 Numerically controlled horizontal lathes, turning centres, for
removing metal 15104 34214 28412127 Numerically controlled horizontal lathes, automatic lathes, for
removing metal (excluding turning centres) 18451 38005 28412129 Numerically controlled horizontal lathes, for removing metal
(excluding turning centres, automatic lathes) 27577 44347 28412140 Non-numerically controlled horizontal lathes, for removing metal 148116 100104 28412160 Lathes, including turning centres, for removing metal (excluding
horizontal lathes) 21708 53745 28412213 Numerically controlled drilling machines for working metal (ex-
cluding way-type unit head machines) 17673 34743 28412217 Numerically controlled knee-type milling machines for working
metal (excluding boring-milling machines) 4891 6859 28412223 Numerically controlled tool-milling machines for working metal
(excluding boring-milling machines, knee-type machines) 12886 36197 28412225 Numerically controlled milling machines for working metal (in-
cluding plano-milling machines) (excluding boring-milling ma-chines, knee-type, tool-milling machines) 11030 23858
28412235 Non-numerically controlled drilling machines for working metal (excluding way-type unit head machines) 408178 320900
28412240 Numerically controlled boring and boring-milling machines for working metal (excluding drilling machines) 8420 23136
28412260 Non-numerically controlled boring and boring-milling machines for working metal (excluding drilling machines) 6393 3636
28412270 Non-numerically controlled milling machines for working metal (excluding boring-milling machines) 49576 36325
28412280 Threading or tapping machines for working metal (excluding drilling machines) 200661 141190
28412305 Numerically controlled flat-surface grinding machines for working metal, in which the positioning in any one axis can be set up to a minimum accuracy of 0.01mm 3823 11152
28412315 Numerically controlled cylindrical surface grinding machines for working metal, in which the positioning in any one axis can be set up to a minimum accuracy of 0.01mm 5209 10852
28412325 Other numerically controlled grinding machines in which the 2680 5987
Final Report: Task 2 DG ENTR Lot 5
Page 36
positioning in any one axis can be set up to accuracy >0.01mm
28412335 Non-numerically controlled flat-surface grinding machines for working metal, in which the positioning in any one axis can be set up to a minimum accuracy of 0.01mm 8299 4668
28412345 Non-numerically controlled cylindrical surface grinding machines for working metal, in which the positioning in any one axis can be set up to a minimum accuracy of 0.01mm 383 2024
28412355 Grinding machines for working metal; any one axis can be set to an accuracy >=0.01mm excluding flat-surface grinding machines, cylindrical surface grinding machines 72575 49332
28412365 Numerically controlled sharpening (tool or cutter grinding) ma-chines for working metal 19068 43005
28412375 Non-numerically controlled sharpening (tool or cutter grinding) machines for working metal 43058 21950
28412385 Honing or lapping machines for working metal 461841 290527 28412395 Machines for deburring or polishing metal (excluding gear finish-
ing machines) 56163 49371 28412410 Broaching machines for working metal 1358 916 28412430 Gear cutting, gear grinding or gear finishing machines, for work-
ing metals, metal carbides or cermets (excluding planing, slotting and broaching machines) 2478 6401
28412470 Sawing or cutting-off machines for working metal 175033 137080 28412490 Planing, shaping or slotting machines and other machine-tools
working by removing metal or cermets, n.e.c. 24693 16187 28413120 Numerically controlled bending, folding, straightening or flatten-
ing machines for working flat metal products (including presses) 34504 76542 28413140 Numerically controlled bending, folding, straightening or flatten-
ing machines for working metal (including presses) (excluding those for working flat metal products) 9899 33993
28413160 Non-numerically controlled bending, folding, straightening or flattening machines for working flat metal products (including presses) 42817 48355
28413180 Non-numerically controlled bending, folding, straightening or flattening machines for working metal (including presses) (exclud-ing those for working flat metal products)
not applica-ble
not applica-ble
28413220 Numerically controlled shearing machines for working metal (including presses) (excluding combined punching and shearing machines) 16901 37512
28413240 Numerically controlled punching or notching machines for work-ing metal (including presses, combined punching and shearing machines) 9266 17591
28413260 Non-numerically controlled shearing machines for working metal (including presses) (excluding combined punching and shearing machines) 144300 146934
28413280 Non-numerically controlled punching or notching machines for working metal (including presses, combined punching and shear-ing machines) 367638 185759
28413310 Numerically controlled forging or die-stamping machines and hammers for working metal (including presses) 3036 5290
28413320 Non-numerically controlled forging or die-stamping machines and hammers for working metal (including presses) 224 291
28413330 Presses for moulding metallic powders by sintering or for com-pressing scrap metal into bales 4741 3221
28413340 Other hydraulic presses, numerically controlled, for working metal 32697 37583

Final Report: Task 2 DG ENTR Lot 5
Page 37
2841335021 Hydraulic presses for working metal not applica-ble 1869
28413360 Non-hydraulic presses for working metal not applica-ble 17658
28413370 Other non-hydraulic presses, numerically controlled, for working metal 2553 5823
28413380 Other non-numerically controlled presses for working metal 638271 395426 28413410 Draw-benches for bars, tubes, profiles, wire or the like of metal,
sintered metal carbides or cermets 9287 7570 28413430 Thread rolling machines for working metal, sintered metal car-
bides or cermets 19753 14334 28413450 Machines for working wire (excluding draw-benches, thread
rolling machines) 187144 187384 28413470 Riveting machines, swaging machines and spinning lathes for
working metal, machines for manufacturing flexible tubes of spiral metal strip and electro-magnetic pulse metal forming ma-chines, and other machine tools for working metal without re-moving metal 345445 319683
0
Totals 3.871.087 3.464.152
Total installed stock of metal working machine tools is depicted in Figure 2-5.
21 In 2009 PRODCOM codes 28413340 and 28413370 were replaced by codes 28413350 and
28413360, which explains why no data is reported for 1995, as these were covered by oth-er categories at that time
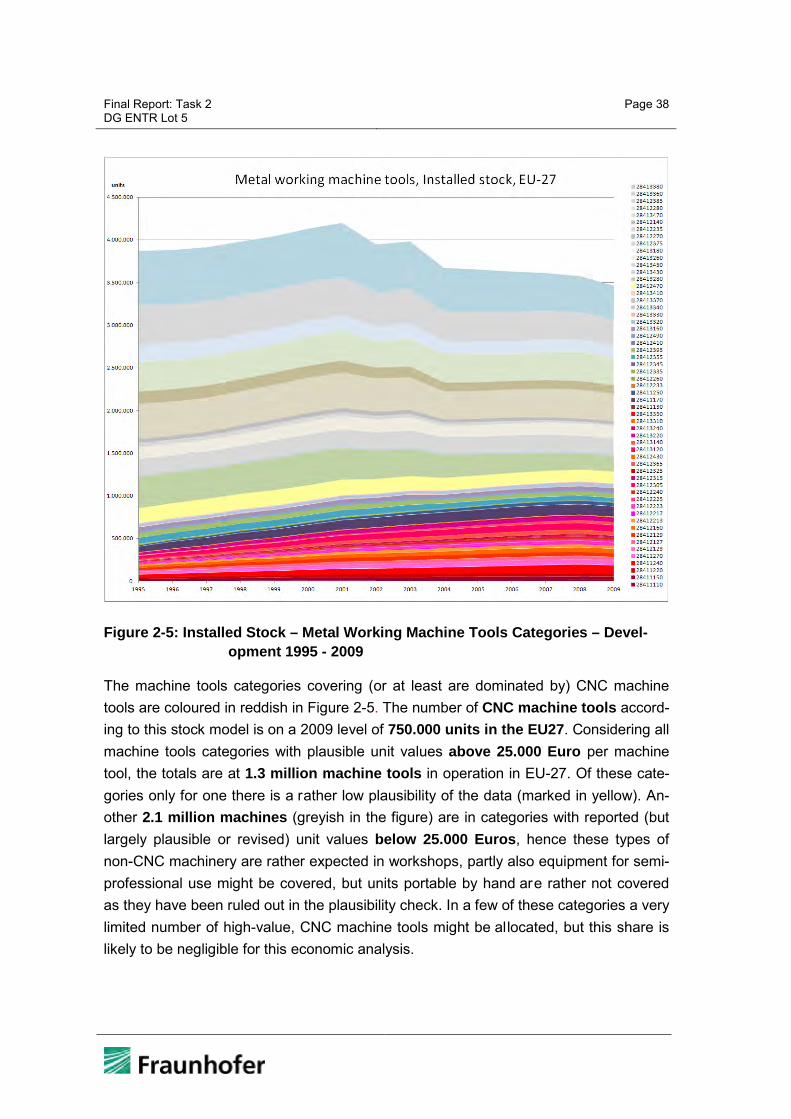
Final Report: Task 2 DG ENTR Lot 5
Page 38
Figure 2-5: Installed Stock – Metal Working Machine Tools Categories – Devel-opment 1995 - 2009
The machine tools categories covering (or at least are dominated by) CNC machine tools are coloured in reddish in Figure 2-5. The number of CNC machine tools accord-ing to this stock model is on a 2009 level of 750.000 units in the EU27. Considering all machine tools categories with plausible unit values above 25.000 Euro per machine tool, the totals are at 1.3 million machine tools in operation in EU-27. Of these cate-gories only for one there is a rather low plausibility of the data (marked in yellow). An-other 2.1 million machines (greyish in the figure) are in categories with reported (but largely plausible or revised) unit values below 25.000 Euros, hence these types of non-CNC machinery are rather expected in workshops, partly also equipment for semi-professional use might be covered, but units portable by hand are rather not covered as they have been ruled out in the plausibility check. In a few of these categories a very limited number of high-value, CNC machine tools might be allocated, but this share is likely to be negligible for this economic analysis.
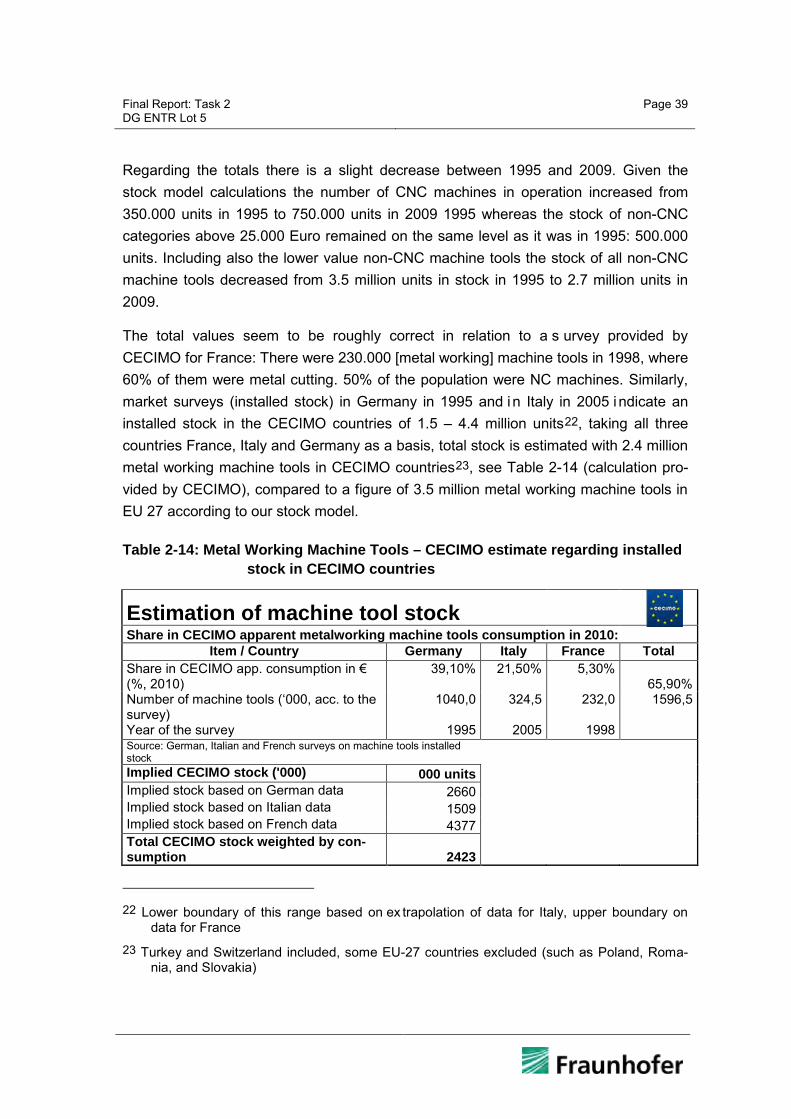
Final Report: Task 2 DG ENTR Lot 5
Page 39
Regarding the totals there is a slight decrease between 1995 and 2009. Given the stock model calculations the number of CNC machines in operation increased from 350.000 units in 1995 to 750.000 units in 2009 1995 whereas the stock of non-CNC categories above 25.000 Euro remained on the same level as it was in 1995: 500.000 units. Including also the lower value non-CNC machine tools the stock of all non-CNC machine tools decreased from 3.5 million units in stock in 1995 to 2.7 million units in 2009.
The total values seem to be roughly correct in relation to a s urvey provided by CECIMO for France: There were 230.000 [metal working] machine tools in 1998, where 60% of them were metal cutting. 50% of the population were NC machines. Similarly, market surveys (installed stock) in Germany in 1995 and i n Italy in 2005 i ndicate an installed stock in the CECIMO countries of 1.5 – 4.4 million units22, taking all three countries France, Italy and Germany as a basis, total stock is estimated with 2.4 million metal working machine tools in CECIMO countries23, see Table 2-14 (calculation pro-vided by CECIMO), compared to a figure of 3.5 million metal working machine tools in EU 27 according to our stock model.
Table 2-14: Metal Working Machine Tools – CECIMO estimate regarding installed stock in CECIMO countries
Estimation of machine tool stock
Share in CECIMO apparent metalworking machine tools consumption in 2010:
Item / Country Germany Italy France Total Share in CECIMO app. consumption in € (%, 2010)
39,10% 21,50% 5,30% 65,90%
Number of machine tools (‘000, acc. to the survey)
1040,0 324,5 232,0 1596,5
Year of the survey 1995 2005 1998 Source: German, Italian and French surveys on machine tools installed stock
Implied CECIMO stock ('000) 000 units
Implied stock based on German data 2660
Implied stock based on Italian data 1509
Implied stock based on French data 4377
Total CECIMO stock weighted by con-sumption 2423
22 Lower boundary of this range based on ex trapolation of data for Italy, upper boundary on
data for France 23 Turkey and Switzerland included, some EU-27 countries excluded (such as Poland, Roma-
nia, and Slovakia)

Final Report: Task 2 DG ENTR Lot 5
Page 40
CECIMO provided also historic survey data regarding the installed stock as outlined and analysed in Table 2-15. As this data spotlights only the situation in two countries and for selected years on a hi ghly aggregated level our stock model cannot directly build on these figures, but was adapted to reflect the change in total units and distinct for CNC / non-CNC: The annual growth rate in CNC stock for Germany was applied for the EU-27 to extrapolate from the calculated 1995 s tock backwards (new stock in-stalled in former years).
Table 2-15: Metal Working Machine Tools – Stock survey in selected years and countries
Germany Italy 1985 1995 1985 2005 Total stock 1.238.095 1.040.000 550.000 324.500 CNC share 6% 21% 4% 27% 74.286 218.400 22.000 87.615 annual increase 11,4% 7,2% Non-CNC machine tools 1.163.810 821.600 528.000 236.885 annual decrease -3,42% -3,93% Theoretical replacement rate non-CNC by CNC (number of CNC entering the stock for each non-CNC leaving the stock)
0,4211 0,2254
(Data in italics as provided by CECIMO, all other calculated by Fraunhofer)
Given the fact, that the stock model demonstrates a rather stable level of installed met-al working machine tools24, the forecasts and scenarios presented in 2.1.1, which are based on economic figures and not on a unit basis, do not have much influence on the installed stock.
Based on historical data and surveys – which only provide snapshots of the situation in individual years in individual countries it is evident that the total stock of metal working machine tools is decreasing significantly. This is confirmed by our revised stock model.
A closer look at the EuroStat data unveils the fact that the unit value of CNC machine tools under most PRODCOM codes raised significantly since 1995. This trend is de-picted in Figure 2-6. These data make clear indirectly, that CNC machine tools became more and more complex over time, which means, that not only the stock of CNC ma- 24 Which, however, is in contradiction to a statement of CECIMO: According to some national
market surveys in Germany (1985/1995) and Italy (1985/2005) the total stock decreased in the last few decades. Although this trend is plausible (trend towards more complex ma-chine tools replacing a multitude of simpler ones), the EuroStat data, even after a plausibil-ity check, did not confirm this trend. As there is no other robust data on the EU-27 level in-cluding robust historic figures, the stock model cannot be adjusted.

Final Report: Task 2 DG ENTR Lot 5
Page 41
chine tools grew, but is composed today of machine tools of much higher complexity than years ago.
Figure 2-6: Unit values (Production) of CNC machine tools– Development 1995 - 2009
Given these trends in the market the stock model forecast is based on following as-sumptions:
• For each PRODCOM code the growth rate of “new stock”25 of the periods 1995-1999 and 2005-2009 is compared and applied as an annual (positive or negative) growth rate for future “new stock”, starting with the average of 2007-2009.
• PRODCOM categories with an annual growth rate of more than 5% (2005-09 vs.1995-99) are calculated with max. 5% growth rate to take into account inher-
25 i.e., production + imports - exports
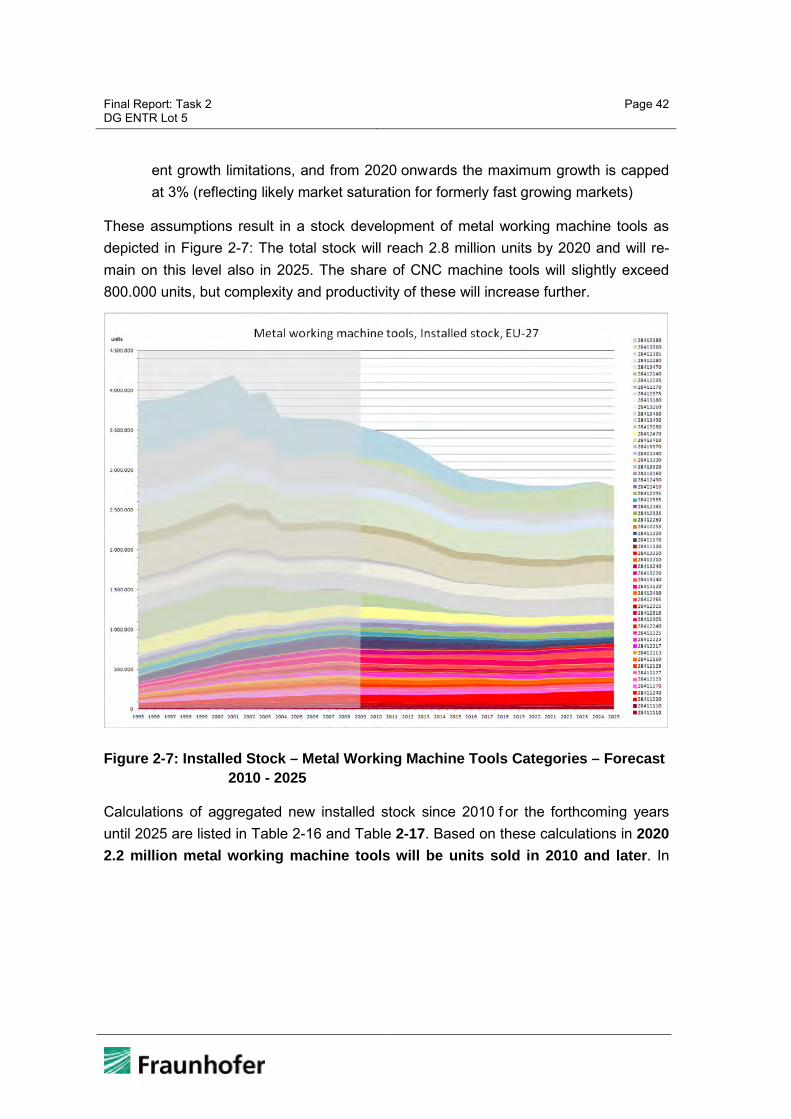
Final Report: Task 2 DG ENTR Lot 5
Page 42
ent growth limitations, and from 2020 onwards the maximum growth is capped at 3% (reflecting likely market saturation for formerly fast growing markets)
These assumptions result in a stock development of metal working machine tools as depicted in Figure 2-7: The total stock will reach 2.8 million units by 2020 and will re-main on this level also in 2025. The share of CNC machine tools will slightly exceed 800.000 units, but complexity and productivity of these will increase further.
Figure 2-7: Installed Stock – Metal Working Machine Tools Categories – Forecast 2010 - 2025
Calculations of aggregated new installed stock since 2010 f or the forthcoming years until 2025 are listed in Table 2-16 and Table 2-17. Based on these calculations in 2020 2.2 million metal working machine tools will be units sold in 2010 and later. In

Final Report: Task 2 DG ENTR Lot 5
Page 43
2025 2.8 million metal working machine tools will have been replaced since 2010, and only 20.000 units in stock will be those constructed before 201026.
26 These figures are subject to the above disclaimers regarding plausibility of the stock model:
Figures are appropriate for CNC machine tools, but might overestimate non-CNC machine tools
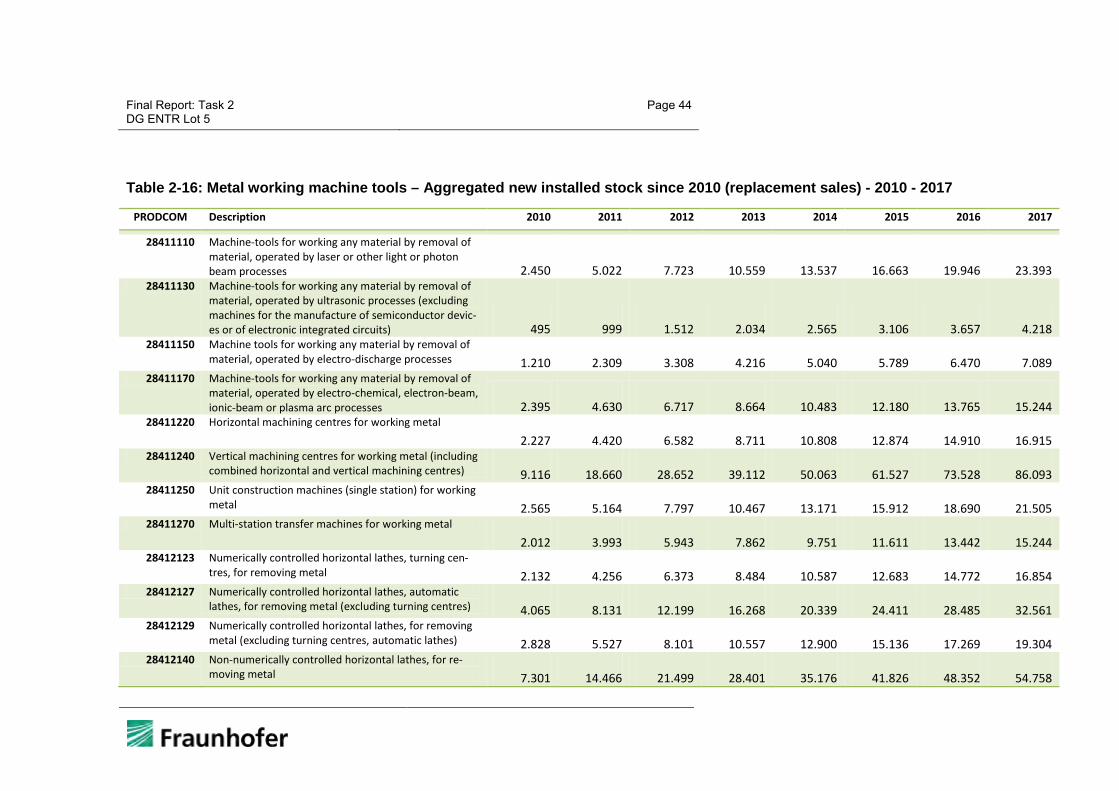
Final Report: Task 2 DG ENTR Lot 5
Page 44
Table 2-16: Metal working machine tools – Aggregated new installed stock since 2010 (replacement sales) - 2010 - 2017
PRODCOM Description 2010 2011 2012 2013 2014 2015 2016 2017
28411110 Machine-tools for working any material by removal of material, operated by laser or other light or photon beam processes 2.450 5.022 7.723 10.559 13.537 16.663 19.946 23.393
28411130 Machine-tools for working any material by removal of material, operated by ultrasonic processes (excluding machines for the manufacture of semiconductor devic-es or of electronic integrated circuits) 495 999 1.512 2.034 2.565 3.106 3.657 4.218
28411150 Machine tools for working any material by removal of material, operated by electro-discharge processes 1.210 2.309 3.308 4.216 5.040 5.789 6.470 7.089
28411170 Machine-tools for working any material by removal of material, operated by electro-chemical, electron-beam, ionic-beam or plasma arc processes 2.395 4.630 6.717 8.664 10.483 12.180 13.765 15.244
28411220 Horizontal machining centres for working metal
2.227 4.420 6.582 8.711 10.808 12.874 14.910 16.915 28411240 Vertical machining centres for working metal (including
combined horizontal and vertical machining centres) 9.116 18.660 28.652 39.112 50.063 61.527 73.528 86.093 28411250 Unit construction machines (single station) for working
metal 2.565 5.164 7.797 10.467 13.171 15.912 18.690 21.505 28411270 Multi-station transfer machines for working metal
2.012 3.993 5.943 7.862 9.751 11.611 13.442 15.244 28412123 Numerically controlled horizontal lathes, turning cen-
tres, for removing metal 2.132 4.256 6.373 8.484 10.587 12.683 14.772 16.854 28412127 Numerically controlled horizontal lathes, automatic
lathes, for removing metal (excluding turning centres) 4.065 8.131 12.199 16.268 20.339 24.411 28.485 32.561 28412129 Numerically controlled horizontal lathes, for removing
metal (excluding turning centres, automatic lathes) 2.828 5.527 8.101 10.557 12.900 15.136 17.269 19.304 28412140 Non-numerically controlled horizontal lathes, for re-
moving metal 7.301 14.466 21.499 28.401 35.176 41.826 48.352 54.758

Final Report: Task 2 DG ENTR Lot 5
Page 45
28412160 Lathes, including turning centres, for removing metal (excluding horizontal lathes) 2.964 5.918 8.863 11.798 14.724 17.640 20.546 23.443
28412213 Numerically controlled drilling machines for working metal (excluding way-type unit head machines) 832 1.607 2.330 3.005 3.633 4.220 4.767 5.277
28412217 Numerically controlled knee-type milling machines for working metal (excluding boring-milling machines) 394 760 1.100 1.416 1.709 1.981 2.233 2.468
28412223 Numerically controlled tool-milling machines for work-ing metal (excluding boring-milling machines, knee-type machines) 3.064 6.237 9.521 12.922 16.442 20.087 23.860 27.766
28412225 Numerically controlled milling machines for working metal (including plano-milling machines) (excluding boring-milling machines, knee-type, tool-milling ma-chines) 1.432 2.822 4.173 5.485 6.759 7.996 9.198 10.366
28412235 Non-numerically controlled drilling machines for work-ing metal (excluding way-type unit head machines) 18.675 37.327 55.958 74.567 93.153 111.718 130.261 148.782
28412240 Numerically controlled boring and boring-milling ma-chines for working metal (excluding drilling machines) 1.026 2.071 3.137 4.224 5.331 6.461 7.612 8.785
28412260 Non-numerically controlled boring and boring-milling machines for working metal (excluding drilling ma-chines) 133 249 349 436 511 576 633 682
28412270 Non-numerically controlled milling machines for work-ing metal (excluding boring-milling machines) 596 1.159 1.690 2.191 2.663 3.109 3.530 3.927
28412280 Threading or tapping machines for working metal (excluding drilling machines) 10.187 20.325 30.414 40.453 50.444 60.386 70.279 80.125
28412305 Numerically controlled flat-surface grinding machines for working metal, in which the positioning in any one axis can be set up to a minimum accuracy of 0.01mm 1.052 2.156 3.316 4.533 5.812 7.154 8.563 10.043
28412315 Numerically controlled cylindrical surface grinding machines for working metal, in which the positioning in any one axis can be set up to a minimum accuracy of 0.01mm 995 1.989 2.982 3.975 4.967 5.958 6.948 7.937
28412325 Other numerically controlled grinding machines in which the positioning in any one axis can be set up to 293 578 855 1.126 1.389 1.645 1.895 2.138

Final Report: Task 2 DG ENTR Lot 5
Page 46
accuracy >0.01mm
28412335 Non-numerically controlled flat-surface grinding ma-chines for working metal, in which the positioning in any one axis can be set up to a minimum accuracy of 0.01mm 0 0 0 0 0 0 0 0
28412345 Non-numerically controlled cylindrical surface grinding machines for working metal, in which the positioning in any one axis can be set up to a minimum accuracy of 0.01mm 332 663 995 1.327 1.658 1.990 2.322 2.653
28412355 Grinding machines for working metal; any one axis can be set to an accuracy >=0.01mm excluding flat-surface grinding machines, cylindrical surface grinding ma-chines 1.869 3.605 5.217 6.716 8.107 9.401 10.602 11.718
28412365 Numerically controlled sharpening (tool or cutter grind-ing) machines for working metal 4.423 8.912 13.468 18.093 22.788 27.553 32.390 37.299
28412375 Non-numerically controlled sharpening (tool or cutter grinding) machines for working metal 0 0 0 0 0 0 0 0
28412385 Honing or lapping machines for working metal
15.878 31.152 45.844 59.976 73.570 86.646 99.225 111.324 28412395 Machines for deburring or polishing metal (excluding
gear finishing machines) 4.446 9.007 13.688 18.492 23.420 28.478 33.667 38.992 28412410 Broaching machines for working metal
53 105 156 206 256 304 352 399 28412430 Gear cutting, gear grinding or gear finishing machines,
for working metals, metal carbides or cermets (exclud-ing planing, slotting and broaching machines) 626 1.270 1.932 2.614 3.314 4.035 4.776 5.539
28412470 Sawing or cutting-off machines for working metal
7.275 14.353 21.239 27.937 34.455 40.795 46.964 52.965 28412490 Planing, shaping or slotting machines and other ma-
chine-tools working by removing metal or cermets, n.e.c. 577 1.130 1.660 2.168 2.656 3.123 3.571 4.001
28413120 Numerically controlled bending, folding, straightening or flattening machines for working flat metal products 5.428 10.821 16.179 21.502 26.792 32.047 37.269 42.457

Final Report: Task 2 DG ENTR Lot 5
Page 47
(including presses)
28413140 Numerically controlled bending, folding, straightening or flattening machines for working metal (including presses) (excluding those for working flat metal prod-ucts) 4.825 9.891 15.211 20.796 26.661 32.819 39.285 46.074
28413160 Non-numerically controlled bending, folding, straight-ening or flattening machines for working flat metal products (including presses) 4.257 8.726 13.419 18.346 23.520 28.953 34.657 40.647
28413180 Non-numerically controlled bending, folding, straight-ening or flattening machines for working metal (includ-ing presses) (excluding those for working flat metal products) 0 0 0 0 0 0 0 0
28413220 Numerically controlled shearing machines for working metal (including presses) (excluding combined punch-ing and shearing machines) 2.272 4.508 6.707 8.870 10.998 13.091 15.151 17.177
28413240 Numerically controlled punching or notching machines for working metal (including presses, combined punch-ing and shearing machines) 1.516 3.011 4.484 5.936 7.366 8.776 10.166 11.535
28413260 Non-numerically controlled shearing machines for working metal (including presses) (excluding combined punching and shearing machines) 9.411 19.138 29.191 39.583 50.324 61.425 72.900 84.759
28413280 Non-numerically controlled punching or notching machines for working metal (including presses, com-bined punching and shearing machines) 827 1.494 2.034 2.469 2.821 3.106 3.335 3.521
28413310 Numerically controlled forging or die-stamping ma-chines and hammers for working metal (including presses) 139 264 376 476 566 646 718 783
28413320 Non-numerically controlled forging or die-stamping machines and hammers for working metal (including presses) 18 37 55 74 92 111 129 148
28413330 Presses for moulding metallic powders by sintering or for compressing scrap metal into bales 241 476 706 930 1.150 1.365 1.574 1.779
28413340 Other hydraulic presses, numerically controlled, for working metal 0 0 0 0 0 0 0 0

Final Report: Task 2 DG ENTR Lot 5
Page 48
28413350 Hydraulic presses for working metal
1.869 3.737 5.606 7.475 9.343 11.212 13.080 14.949 28413360 Non-hydraulic presses for working metal
17.658 35.316 52.974 70.632 88.289 105.947 123.605 141.263 28413370 Other non-hydraulic presses, numerically controlled,
for working metal 0 0 0 0 0 0 0 0 28413380 Other non-numerically controlled presses for working
metal 0 0 0 0 0 0 0 0 28413410 Draw-benches for bars, tubes, profiles, wire or the like
of metal, sintered metal carbides or cermets 685 1.359 2.024 2.679 3.324 3.960 4.586 5.204 28413430 Thread rolling machines for working metal, sintered
metal carbides or cermets 198 378 541 689 824 946 1.056 1.157 28413450 Machines for working wire (excluding draw-benches,
thread rolling machines) 12.774 25.813 39.124 52.712 66.583 80.743 95.198 109.953 28413470 Riveting machines, swaging machines and spinning
lathes for working metal, machines for manufacturing flexible tubes of spiral metal strip and electro-magnetic pulse metal forming machines, and other machine tools for working metal without removing metal 21.381 43.508 66.408 90.107 114.634 140.017 166.287 193.473
Totals 199.417 399.449 600.332 802.271 1.005.468 1.210.138 1.416.476 1.624.686
Updated data for 2010 based on PRODCOM production, import and export figures for 2010 are reported in in the Annex.

Final Report: Task 2 DG ENTR Lot 5
Page 49
Table 2-17: Metal working machine tools – Aggregated new installed stock since 2010 (replacement sales) - 2018 - 2025
PRODCOM Description 2018 2019 2020 2021 2022 2023 2024 2025
28411110 Machine-tools for working any material by removal of material, operated by laser or other light or photon beam processes 27.013 30.813 34.728 38.760 40.463 42.168 43.873 45.575
28411130 Machine-tools for working any material by removal of material, operated by ultrasonic processes (excluding machines for the manufacture of semiconductor devices or of electronic integrated circuits) 4.789 5.370 5.962 6.564 7.177 7.802 8.437 9.084
28411150 Machine tools for working any material by removal of material, operated by electro-discharge processes 7.651 8.162 8.626 9.047 9.430 8.568 7.785 7.074
28411170 Machine-tools for working any material by removal of material, operated by electro-chemical, electron-beam, ionic-beam or plasma arc processes 16.624 17.913 19.116 20.240 21.288 22.267 23.180 24.033
28411220 Horizontal machining centres for working metal
18.890 20.836 22.754 22.415 22.082 21.754 21.431 21.113 28411240 Vertical machining centres for working metal (including
combined horizontal and vertical machining centres) 99.246 113.017 127.200 141.809 147.740 153.695 159.667 165.649 28411250 Unit construction machines (single station) for working
metal 24.358 27.248 30.178 33.147 36.155 39.204 42.293 45.424 28411270 Multi-station transfer machines for working metal
17.018 18.764 20.483 20.163 19.848 19.538 19.232 18.932 28412123 Numerically controlled horizontal lathes, turning centres,
for removing metal 18.929 20.998 23.059 25.113 25.029 24.945 24.862 24.778 28412127 Numerically controlled horizontal lathes, automatic lathes,
for removing metal (excluding turning centres) 36.638 40.717 44.797 44.814 44.831 44.849 44.866 44.883 28412129 Numerically controlled horizontal lathes, for removing
metal (excluding turning centres, automatic lathes) 21.246 23.098 24.865 26.551 25.332 24.168 23.058 21.998 28412140 Non-numerically controlled horizontal lathes, for removing
metal 61.045 67.215 73.272 79.216 85.050 90.777 89.096 87.447
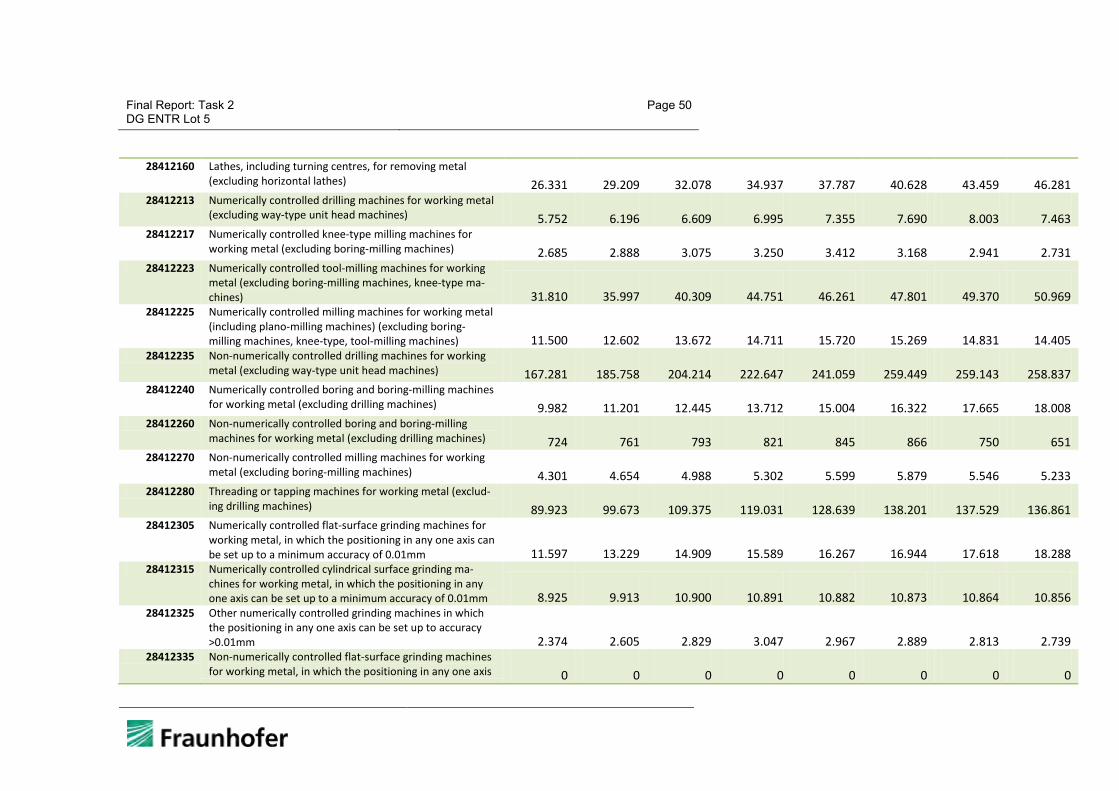
Final Report: Task 2 DG ENTR Lot 5
Page 50
28412160 Lathes, including turning centres, for removing metal (excluding horizontal lathes) 26.331 29.209 32.078 34.937 37.787 40.628 43.459 46.281
28412213 Numerically controlled drilling machines for working metal (excluding way-type unit head machines) 5.752 6.196 6.609 6.995 7.355 7.690 8.003 7.463
28412217 Numerically controlled knee-type milling machines for working metal (excluding boring-milling machines) 2.685 2.888 3.075 3.250 3.412 3.168 2.941 2.731
28412223 Numerically controlled tool-milling machines for working metal (excluding boring-milling machines, knee-type ma-chines) 31.810 35.997 40.309 44.751 46.261 47.801 49.370 50.969
28412225 Numerically controlled milling machines for working metal (including plano-milling machines) (excluding boring-milling machines, knee-type, tool-milling machines) 11.500 12.602 13.672 14.711 15.720 15.269 14.831 14.405
28412235 Non-numerically controlled drilling machines for working metal (excluding way-type unit head machines) 167.281 185.758 204.214 222.647 241.059 259.449 259.143 258.837
28412240 Numerically controlled boring and boring-milling machines for working metal (excluding drilling machines) 9.982 11.201 12.445 13.712 15.004 16.322 17.665 18.008
28412260 Non-numerically controlled boring and boring-milling machines for working metal (excluding drilling machines) 724 761 793 821 845 866 750 651
28412270 Non-numerically controlled milling machines for working metal (excluding boring-milling machines) 4.301 4.654 4.988 5.302 5.599 5.879 5.546 5.233
28412280 Threading or tapping machines for working metal (exclud-ing drilling machines) 89.923 99.673 109.375 119.031 128.639 138.201 137.529 136.861
28412305 Numerically controlled flat-surface grinding machines for working metal, in which the positioning in any one axis can be set up to a minimum accuracy of 0.01mm 11.597 13.229 14.909 15.589 16.267 16.944 17.618 18.288
28412315 Numerically controlled cylindrical surface grinding ma-chines for working metal, in which the positioning in any one axis can be set up to a minimum accuracy of 0.01mm 8.925 9.913 10.900 10.891 10.882 10.873 10.864 10.856
28412325 Other numerically controlled grinding machines in which the positioning in any one axis can be set up to accuracy >0.01mm 2.374 2.605 2.829 3.047 2.967 2.889 2.813 2.739
28412335 Non-numerically controlled flat-surface grinding machines for working metal, in which the positioning in any one axis 0 0 0 0 0 0 0 0
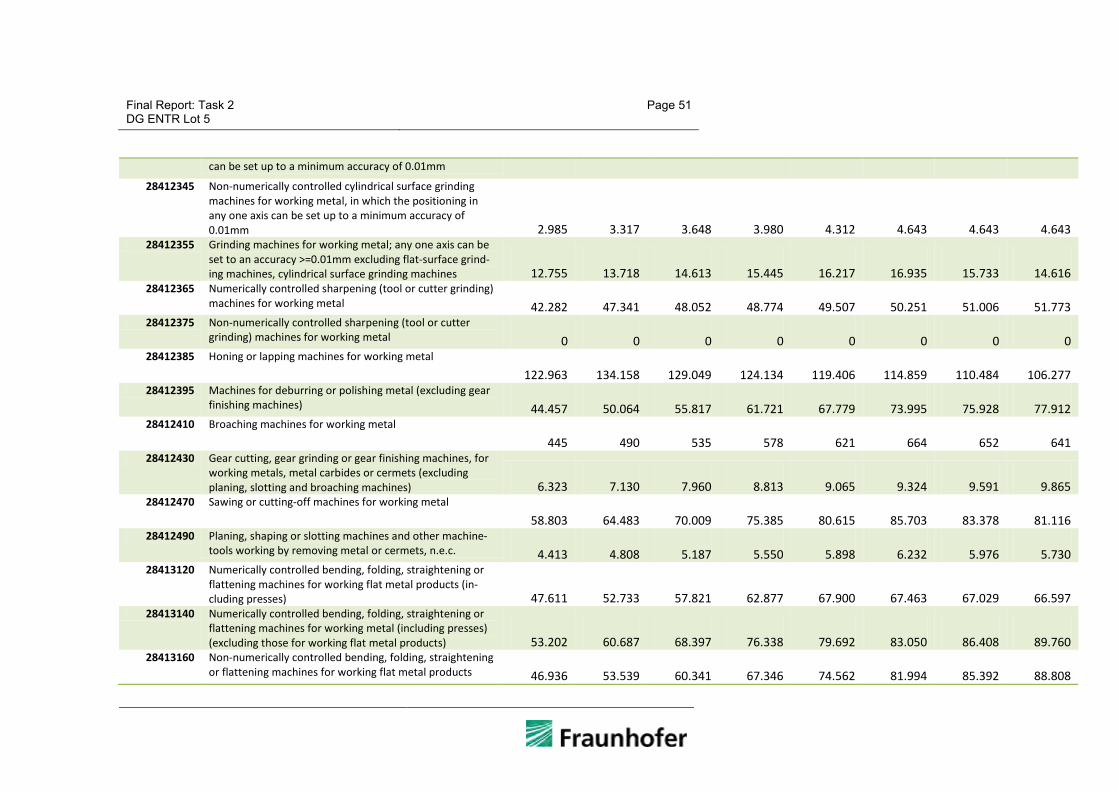
Final Report: Task 2 DG ENTR Lot 5
Page 51
can be set up to a minimum accuracy of 0.01mm
28412345 Non-numerically controlled cylindrical surface grinding machines for working metal, in which the positioning in any one axis can be set up to a minimum accuracy of 0.01mm 2.985 3.317 3.648 3.980 4.312 4.643 4.643 4.643
28412355 Grinding machines for working metal; any one axis can be set to an accuracy >=0.01mm excluding flat-surface grind-ing machines, cylindrical surface grinding machines 12.755 13.718 14.613 15.445 16.217 16.935 15.733 14.616
28412365 Numerically controlled sharpening (tool or cutter grinding) machines for working metal 42.282 47.341 48.052 48.774 49.507 50.251 51.006 51.773
28412375 Non-numerically controlled sharpening (tool or cutter grinding) machines for working metal 0 0 0 0 0 0 0 0
28412385 Honing or lapping machines for working metal
122.963 134.158 129.049 124.134 119.406 114.859 110.484 106.277 28412395 Machines for deburring or polishing metal (excluding gear
finishing machines) 44.457 50.064 55.817 61.721 67.779 73.995 75.928 77.912 28412410 Broaching machines for working metal
445 490 535 578 621 664 652 641 28412430 Gear cutting, gear grinding or gear finishing machines, for
working metals, metal carbides or cermets (excluding planing, slotting and broaching machines) 6.323 7.130 7.960 8.813 9.065 9.324 9.591 9.865
28412470 Sawing or cutting-off machines for working metal
58.803 64.483 70.009 75.385 80.615 85.703 83.378 81.116 28412490 Planing, shaping or slotting machines and other machine-
tools working by removing metal or cermets, n.e.c. 4.413 4.808 5.187 5.550 5.898 6.232 5.976 5.730 28413120 Numerically controlled bending, folding, straightening or
flattening machines for working flat metal products (in-cluding presses) 47.611 52.733 57.821 62.877 67.900 67.463 67.029 66.597
28413140 Numerically controlled bending, folding, straightening or flattening machines for working metal (including presses) (excluding those for working flat metal products) 53.202 60.687 68.397 76.338 79.692 83.050 86.408 89.760
28413160 Non-numerically controlled bending, folding, straightening or flattening machines for working flat metal products 46.936 53.539 60.341 67.346 74.562 81.994 85.392 88.808
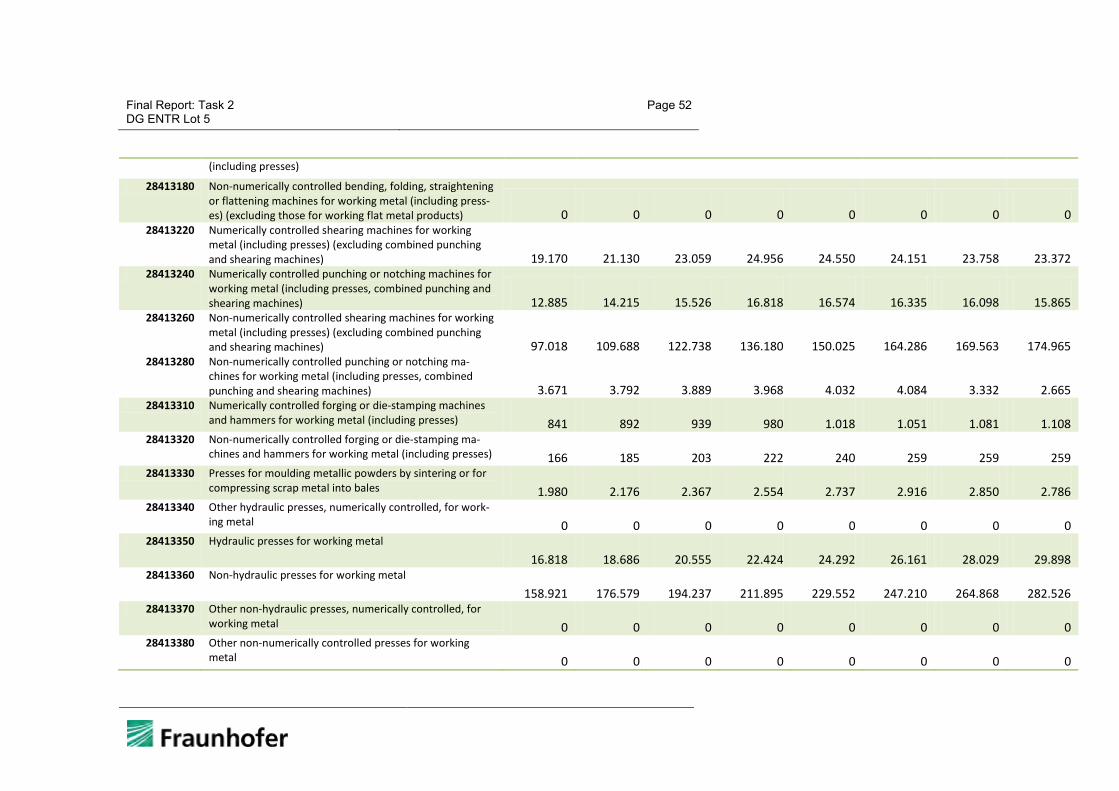
Final Report: Task 2 DG ENTR Lot 5
Page 52
(including presses)
28413180 Non-numerically controlled bending, folding, straightening or flattening machines for working metal (including press-es) (excluding those for working flat metal products) 0 0 0 0 0 0 0 0
28413220 Numerically controlled shearing machines for working metal (including presses) (excluding combined punching and shearing machines) 19.170 21.130 23.059 24.956 24.550 24.151 23.758 23.372
28413240 Numerically controlled punching or notching machines for working metal (including presses, combined punching and shearing machines) 12.885 14.215 15.526 16.818 16.574 16.335 16.098 15.865
28413260 Non-numerically controlled shearing machines for working metal (including presses) (excluding combined punching and shearing machines) 97.018 109.688 122.738 136.180 150.025 164.286 169.563 174.965
28413280 Non-numerically controlled punching or notching ma-chines for working metal (including presses, combined punching and shearing machines) 3.671 3.792 3.889 3.968 4.032 4.084 3.332 2.665
28413310 Numerically controlled forging or die-stamping machines and hammers for working metal (including presses) 841 892 939 980 1.018 1.051 1.081 1.108
28413320 Non-numerically controlled forging or die-stamping ma-chines and hammers for working metal (including presses) 166 185 203 222 240 259 259 259
28413330 Presses for moulding metallic powders by sintering or for compressing scrap metal into bales 1.980 2.176 2.367 2.554 2.737 2.916 2.850 2.786
28413340 Other hydraulic presses, numerically controlled, for work-ing metal 0 0 0 0 0 0 0 0
28413350 Hydraulic presses for working metal
16.818 18.686 20.555 22.424 24.292 26.161 28.029 29.898 28413360 Non-hydraulic presses for working metal
158.921 176.579 194.237 211.895 229.552 247.210 264.868 282.526 28413370 Other non-hydraulic presses, numerically controlled, for
working metal 0 0 0 0 0 0 0 0 28413380 Other non-numerically controlled presses for working
metal 0 0 0 0 0 0 0 0

Final Report: Task 2 DG ENTR Lot 5
Page 53
28413410 Draw-benches for bars, tubes, profiles, wire or the like of metal, sintered metal carbides or cermets 5.812 6.412 7.002 7.584 8.158 8.723 9.144 8.470
28413430 Thread rolling machines for working metal, sintered metal carbides or cermets 1.249 1.332 1.407 1.475 1.537 1.594 1.493 1.314
28413450 Machines for working wire (excluding draw-benches, thread rolling machines) 125.016 140.393 156.089 172.113 188.470 205.167 222.212 213.799
28413470 Riveting machines, swaging machines and spinning lathes for working metal, machines for manufacturing flexible tubes of spiral metal strip and electro-magnetic pulse metal forming machines, and other machine tools for working metal without removing metal 221.609 250.727 280.718 311.610 332.692 343.548 354.617 330.090
Totals 1.834.963 2.047.512 2.241.394 2.427.243 2.575.673 2.706.312 2.771.836 2.774.167
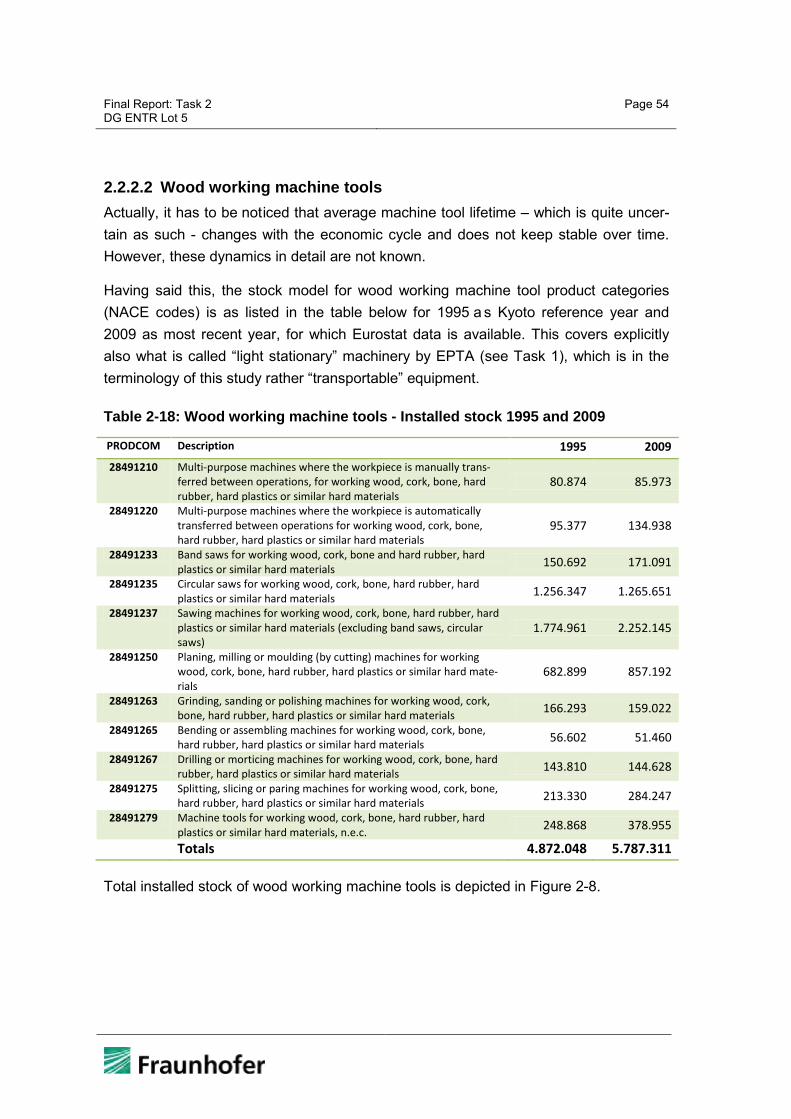
Final Report: Task 2 DG ENTR Lot 5
Page 54
2.2.2.2 Wood working machine tools Actually, it has to be noticed that average machine tool lifetime – which is quite uncer-tain as such - changes with the economic cycle and does not keep stable over time. However, these dynamics in detail are not known.
Having said this, the stock model for wood working machine tool product categories (NACE codes) is as listed in the table below for 1995 a s Kyoto reference year and 2009 as most recent year, for which Eurostat data is available. This covers explicitly also what is called “light stationary” machinery by EPTA (see Task 1), which is in the terminology of this study rather “transportable” equipment.
Table 2-18: Wood working machine tools - Installed stock 1995 and 2009
PRODCOM Description 1995 2009 28491210 Multi-purpose machines where the workpiece is manually trans-
ferred between operations, for working wood, cork, bone, hard rubber, hard plastics or similar hard materials
80.874 85.973
28491220 Multi-purpose machines where the workpiece is automatically transferred between operations for working wood, cork, bone, hard rubber, hard plastics or similar hard materials
95.377 134.938
28491233 Band saws for working wood, cork, bone and hard rubber, hard plastics or similar hard materials 150.692 171.091
28491235 Circular saws for working wood, cork, bone, hard rubber, hard plastics or similar hard materials 1.256.347 1.265.651
28491237 Sawing machines for working wood, cork, bone, hard rubber, hard plastics or similar hard materials (excluding band saws, circular saws)
1.774.961 2.252.145
28491250 Planing, milling or moulding (by cutting) machines for working wood, cork, bone, hard rubber, hard plastics or similar hard mate-rials
682.899 857.192
28491263 Grinding, sanding or polishing machines for working wood, cork, bone, hard rubber, hard plastics or similar hard materials 166.293 159.022
28491265 Bending or assembling machines for working wood, cork, bone, hard rubber, hard plastics or similar hard materials 56.602 51.460
28491267 Drilling or morticing machines for working wood, cork, bone, hard rubber, hard plastics or similar hard materials 143.810 144.628
28491275 Splitting, slicing or paring machines for working wood, cork, bone, hard rubber, hard plastics or similar hard materials 213.330 284.247
28491279 Machine tools for working wood, cork, bone, hard rubber, hard plastics or similar hard materials, n.e.c. 248.868 378.955
Totals 4.872.048 5.787.311
Total installed stock of wood working machine tools is depicted in Figure 2-8.
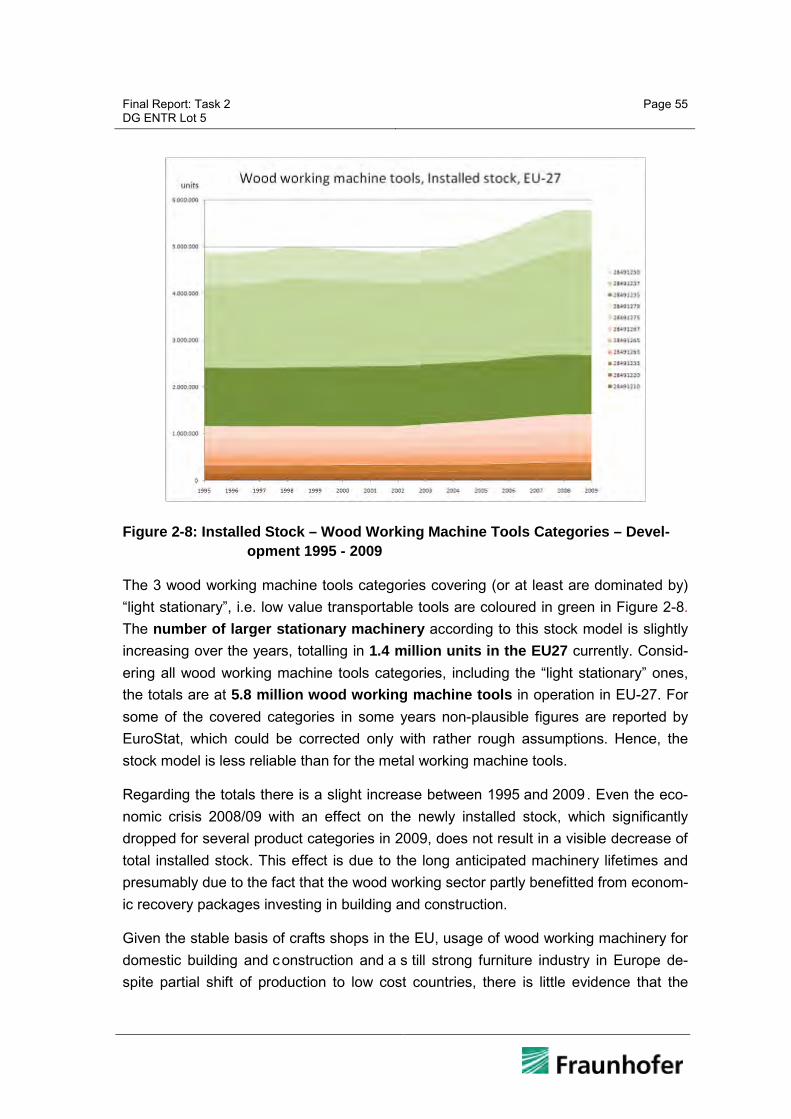
Final Report: Task 2 DG ENTR Lot 5
Page 55
Figure 2-8: Installed Stock – Wood Working Machine Tools Categories – Devel-opment 1995 - 2009
The 3 wood working machine tools categories covering (or at least are dominated by) “light stationary”, i.e. low value transportable tools are coloured in green in Figure 2-8. The number of larger stationary machinery according to this stock model is slightly increasing over the years, totalling in 1.4 million units in the EU27 currently. Consid-ering all wood working machine tools categories, including the “light stationary” ones, the totals are at 5.8 million wood working machine tools in operation in EU-27. For some of the covered categories in some years non-plausible figures are reported by EuroStat, which could be corrected only with rather rough assumptions. Hence, the stock model is less reliable than for the metal working machine tools.
Regarding the totals there is a slight increase between 1995 and 2009. Even the eco-nomic crisis 2008/09 with an effect on the newly installed stock, which significantly dropped for several product categories in 2009, does not result in a visible decrease of total installed stock. This effect is due to the long anticipated machinery lifetimes and presumably due to the fact that the wood working sector partly benefitted from econom-ic recovery packages investing in building and construction.
Given the stable basis of crafts shops in the EU, usage of wood working machinery for domestic building and construction and a s till strong furniture industry in Europe de-spite partial shift of production to low cost countries, there is little evidence that the

Final Report: Task 2 DG ENTR Lot 5
Page 56
trend in installed units will change drastically in coming years. Hence, in 2025 as a rough estimation the installed stock of wood working machinery is likely to be on the same level as today.
For later calculations of achievable improvements on the EU-27 level the future stock is assumed to remain on the same level as calculated for 2009, and all new wood work-ing machine tools installed are replacement sales. Consequently, depending on the estimated lifetime a certain share of machine tools will be newly installed. The resulting annual replacement rate is listed in Table 2-19 and applied in the following stock fore-casts.
Table 2-19: Wood Working Machine Tools – Replacement rate for stock forecasts
PRODCOM Description annual re-placement
rate 28491210 Multi-purpose machines where the workpiece is manually transferred be-
tween operations, for working wood, cork, bone, hard rubber, hard plastics or similar hard materials
5%
28491220 Multi-purpose machines where the workpiece is automatically transferred between operations for working wood, cork, bone, hard rubber, hard plastics or similar hard materials
5%
28491233 Band saws for working wood, cork, bone and hard rubber, hard plastics or similar hard materials
5%
28491235 Circular saws for working wood, cork, bone, hard rubber, hard plastics or similar hard materials
5%
28491237 Sawing machines for working wood, cork, bone, hard rubber, hard plastics or similar hard materials (excluding band saws, circular saws)
5%
28491250 Planing, milling or moulding (by cutting) machines for working wood, cork, bone, hard rubber, hard plastics or similar hard materials
5%
28491263 Grinding, sanding or polishing machines for working wood, cork, bone, hard rubber, hard plastics or similar hard materials
5%
28491265 Bending or assembling machines for working wood, cork, bone, hard rubber, hard plastics or similar hard materials
5%
28491267 Drilling or morticing machines for working wood, cork, bone, hard rubber, hard plastics or similar hard materials
5%
28491275 Splitting, slicing or paring machines for working wood, cork, bone, hard rub-ber, hard plastics or similar hard materials
5%
28491279 Machine tools for working wood, cork, bone, hard rubber, hard plastics or similar hard materials, n.e.c.
5%
Calculations of aggregated new installed stock since 2010 f or the forthcoming years until 2025 are listed in Table 2-20 and Table 2-21. Based on these calculations in 2020 3.2 million wood working machine tools will be units sold in 2010 and later. In 2025 4.6 million wood working machine tools will have been replaced since 2010, and the remaining 1.2 million units in stock will be those constructed before 2010.
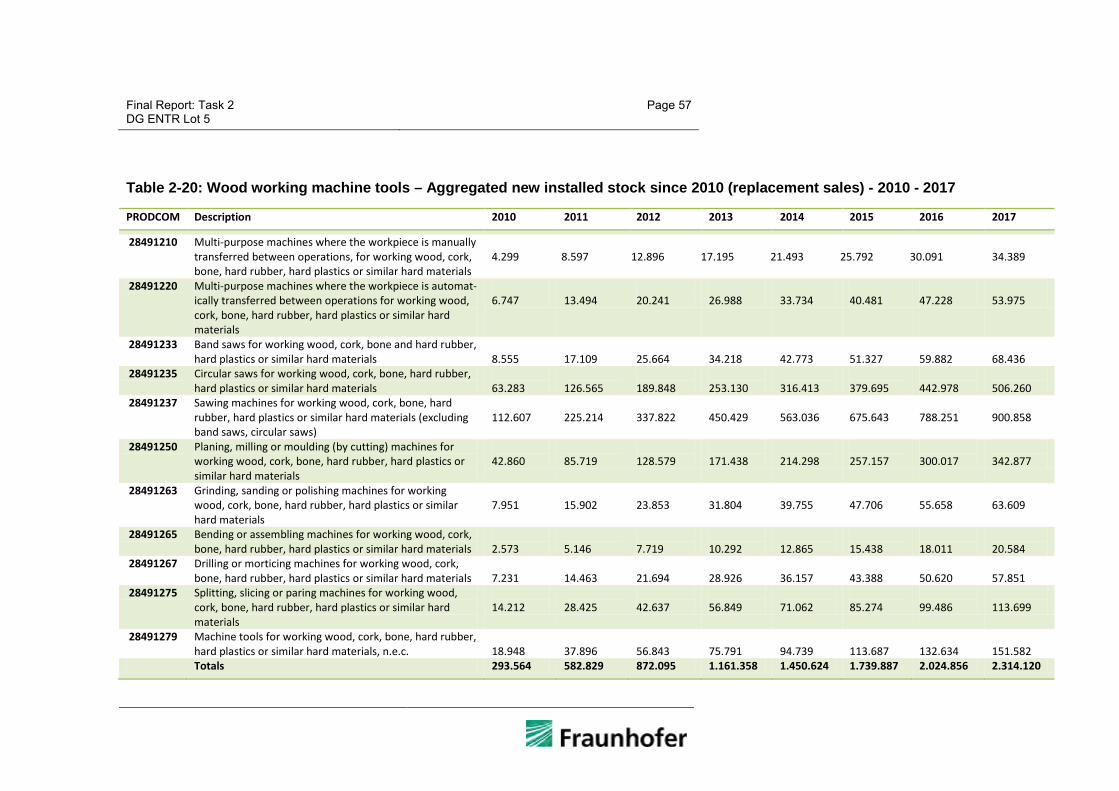
Final Report: Task 2 DG ENTR Lot 5
Page 57
Table 2-20: Wood working machine tools – Aggregated new installed stock since 2010 (replacement sales) - 2010 - 2017
PRODCOM Description 2010 2011 2012 2013 2014 2015 2016 2017
28491210 Multi-purpose machines where the workpiece is manually transferred between operations, for working wood, cork, bone, hard rubber, hard plastics or similar hard materials
4.299
8.597
12.896
17.195
21.493
25.792
30.091
34.389
28491220 Multi-purpose machines where the workpiece is automat-ically transferred between operations for working wood, cork, bone, hard rubber, hard plastics or similar hard materials
6.747
13.494
20.241
26.988
33.734
40.481
47.228
53.975
28491233 Band saws for working wood, cork, bone and hard rubber, hard plastics or similar hard materials
8.555
17.109
25.664
34.218
42.773
51.327
59.882
68.436
28491235 Circular saws for working wood, cork, bone, hard rubber, hard plastics or similar hard materials
63.283
126.565
189.848
253.130
316.413
379.695
442.978
506.260
28491237 Sawing machines for working wood, cork, bone, hard rubber, hard plastics or similar hard materials (excluding band saws, circular saws)
112.607
225.214
337.822
450.429
563.036
675.643
788.251
900.858
28491250 Planing, milling or moulding (by cutting) machines for working wood, cork, bone, hard rubber, hard plastics or similar hard materials
42.860
85.719
128.579
171.438
214.298
257.157
300.017
342.877
28491263 Grinding, sanding or polishing machines for working wood, cork, bone, hard rubber, hard plastics or similar hard materials
7.951
15.902
23.853
31.804
39.755
47.706
55.658
63.609
28491265 Bending or assembling machines for working wood, cork, bone, hard rubber, hard plastics or similar hard materials
2.573
5.146
7.719
10.292
12.865
15.438
18.011
20.584
28491267 Drilling or morticing machines for working wood, cork, bone, hard rubber, hard plastics or similar hard materials
7.231
14.463
21.694
28.926
36.157
43.388
50.620
57.851
28491275 Splitting, slicing or paring machines for working wood, cork, bone, hard rubber, hard plastics or similar hard materials
14.212
28.425
42.637
56.849
71.062
85.274
99.486
113.699
28491279 Machine tools for working wood, cork, bone, hard rubber, hard plastics or similar hard materials, n.e.c.
18.948
37.896
56.843
75.791
94.739
113.687
132.634
151.582
Totals 293.564 582.829 872.095 1.161.358 1.450.624 1.739.887 2.024.856 2.314.120

Final Report: Task 2 DG ENTR Lot 5
Page 58
Table 2-21: Wood working machine tools – Aggregated new installed stock since 2010 (replacement sales) - 2018 - 2025
PRODCOM Description 2018 2019 2020 2021 2022 2023 2024 2025
28491210 Multi-purpose machines where the workpiece is manually transferred between operations, for working wood, cork, bone, hard rubber, hard plastics or similar hard materials
38.688
42.987
47.285
51.584
55.883
60.181
64.480
68.779
28491220 Multi-purpose machines where the workpiece is automat-ically transferred between operations for working wood, cork, bone, hard rubber, hard plastics or similar hard materials
60.722
67.469
74.216
80.963
87.709
94.456
101.203
107.950
28491233 Band saws for working wood, cork, bone and hard rubber, hard plastics or similar hard materials
76.991
85.545
94.100
102.654
111.209
119.763
128.318
136.872
28491235 Circular saws for working wood, cork, bone, hard rubber, hard plastics or similar hard materials
569.543
632.826
696.108
759.391
822.673
885.956
949.238
1.012.521
28491237 Sawing machines for working wood, cork, bone, hard rubber, hard plastics or similar hard materials (excluding band saws, circular saws)
1.013.465
1.126.072
1.238.680
1.351.287
1.463.894
1.576.501
1.689.109
1.801.716
28491250 Planing, milling or moulding (by cutting) machines for working wood, cork, bone, hard rubber, hard plastics or similar hard materials
385.736
428.596
471.455
514.315
557.174
600.034
642.894
685.753
28491263 Grinding, sanding or polishing machines for working wood, cork, bone, hard rubber, hard plastics or similar hard materials
71.560
79.511
87.462
95.413
103.364
111.315
119.266
127.217
28491265 Bending or assembling machines for working wood, cork, bone, hard rubber, hard plastics or similar hard materials
23.157
25.730
28.303
30.876
33.449
36.022
38.595
41.168
28491267 Drilling or morticing machines for working wood, cork, bone, hard rubber, hard plastics or similar hard materials
65.083
72.314
79.545
86.777
94.008
101.240
108.471
115.702
28491275 Splitting, slicing or paring machines for working wood, cork, bone, hard rubber, hard plastics or similar hard materials
127.911
142.123
156.336
170.548
184.760
198.973
213.185
227.397
28491279 Machine tools for working wood, cork, bone, hard rubber, hard plastics or similar hard materials, n.e.c.
170.530
189.478
208.426
227.373
246.321
265.269
284.217
303.164
Totals 2.603.386 2.892.651 3.181.916 3.471.181 3.760.444 4.049.710 4.338.976 4.628.239
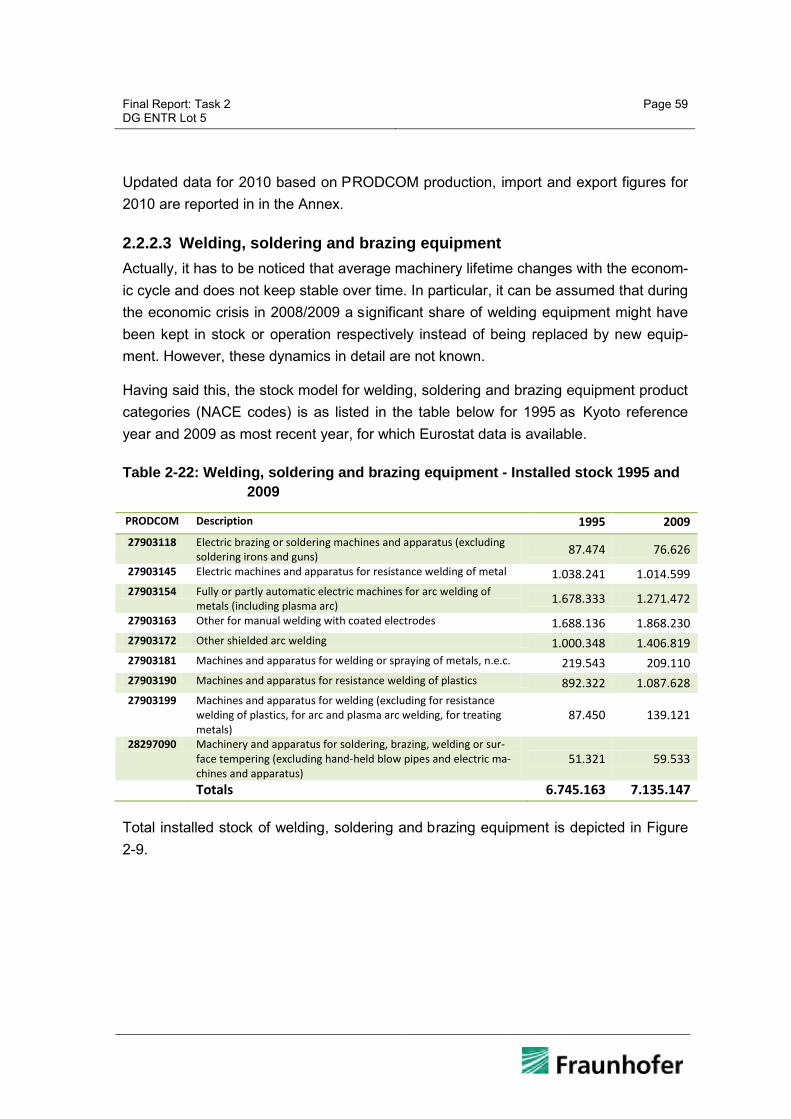
Final Report: Task 2 DG ENTR Lot 5
Page 59
Updated data for 2010 based on PRODCOM production, import and export figures for 2010 are reported in in the Annex.
2.2.2.3 Welding, soldering and brazing equipment Actually, it has to be noticed that average machinery lifetime changes with the econom-ic cycle and does not keep stable over time. In particular, it can be assumed that during the economic crisis in 2008/2009 a significant share of welding equipment might have been kept in stock or operation respectively instead of being replaced by new equip-ment. However, these dynamics in detail are not known.
Having said this, the stock model for welding, soldering and brazing equipment product categories (NACE codes) is as listed in the table below for 1995 as Kyoto reference year and 2009 as most recent year, for which Eurostat data is available.
Table 2-22: Welding, soldering and brazing equipment - Installed stock 1995 and 2009
PRODCOM Description 1995 2009 27903118 Electric brazing or soldering machines and apparatus (excluding
soldering irons and guns) 87.474 76.626
27903145 Electric machines and apparatus for resistance welding of metal 1.038.241 1.014.599 27903154 Fully or partly automatic electric machines for arc welding of
metals (including plasma arc) 1.678.333 1.271.472
27903163 Other for manual welding with coated electrodes 1.688.136 1.868.230 27903172 Other shielded arc welding 1.000.348 1.406.819 27903181 Machines and apparatus for welding or spraying of metals, n.e.c. 219.543 209.110 27903190 Machines and apparatus for resistance welding of plastics 892.322 1.087.628 27903199 Machines and apparatus for welding (excluding for resistance
welding of plastics, for arc and plasma arc welding, for treating metals)
87.450 139.121
28297090 Machinery and apparatus for soldering, brazing, welding or sur-face tempering (excluding hand-held blow pipes and electric ma-chines and apparatus)
51.321 59.533
Totals 6.745.163 7.135.147
Total installed stock of welding, soldering and brazing equipment is depicted in Figure 2-9.

Final Report: Task 2 DG ENTR Lot 5
Page 60
Figure 2-9: Installed Stock – Welding, Soldering and Brazing Equipment Catego-ries – Development 1995 - 2009
The categories covering (or at least are dominated by) rather stationary equipment (indication is a unit value of 10.000 Euro and above) are coloured in blue in Figure 2-9. Smaller, transportable units are those coloured in green. As the transportable units have a shorter lifetime than the installed stationary ones fluctuations in the economic cycles and production figures result also in much higher year-to-year variations accord-ing to the simplified stock model. The number of stationary units according to this stock model is on a stable level at roughly 1.5 million units in the EU27. This includes roughly 60.000 soldering machines (PRODCOM 28297090), which are likely to be cov-ered by the scope of the Product Group Study Lot 4 - Industrial and Laboratory Fur-naces and Ovens. There are another estimated 5.5 – 7 million smaller transportable units, frequently in the range of a few 100 Euros unit value.
Despite the year-to-year fluctuation there is nearly no difference between 1995 and 2009.
Future developments of the stock are subject to the long-term effect of the 2008/2009 economic crisis and t he general trend to shift production to low cost countries – the latter being irrelevant for the consumption of welding equipment to be used on-site (construction sites). A closer look at the newly installed stationary units per year gives the impression, that there was a peak in 2003 and thereafter a downward trend in terms of new equipment installed (unit based), and even the economic growth years

Final Report: Task 2 DG ENTR Lot 5
Page 61
2006-2008 do not fully reverse this trend (Figure 2-10). In particular electric machines and apparatus for resistance welding of metal (PRODCOM 27903145) determine this tendency. The trend observed for metal working machine tools, that there is a shift from lower value industrial machines to rather high value automated (but fewer) machines, is not confirmed for the welding sector by EuroStat figures. In case the observed trend continues this might reduce the number of installed stationary units from 1.5 million units currently to roughly 1 - 1.2 million units in 2025 in EU-27.
Figure 2-10: Newly Installed Stock per Year – Welding, Soldering and Brazing Equipment (Stationary Units) – Development 1995 - 2009
In developed economies, such as the EU-27, growth of the welding industry and thus consumption of welding equipment is closely related to industrial production. Consump-tion sectors of particular growth are the energy sector including wind turbine construc-tions as well as repairs and maintenance of machinery. According to a recent report by Global Industry Analysts, Inc. adopting newer technologies has emerged as the single-most significant trend in the market, whereby numerous segments have given up tradi-tional welding methodologies in favour of modern ones. There has been a sharp de-cline in the demand for metal welding equipment, with a shift to plastics and other syn-thetic materials27. Furthermore, advancements in welding technology and greater au-tomation will set the momentum for future growth in the industry. 27 Global Industry Analysts, Inc.: Welding Machinery: A Global Strategic Business Report, Oc-
tober 25, 2010, San Jose
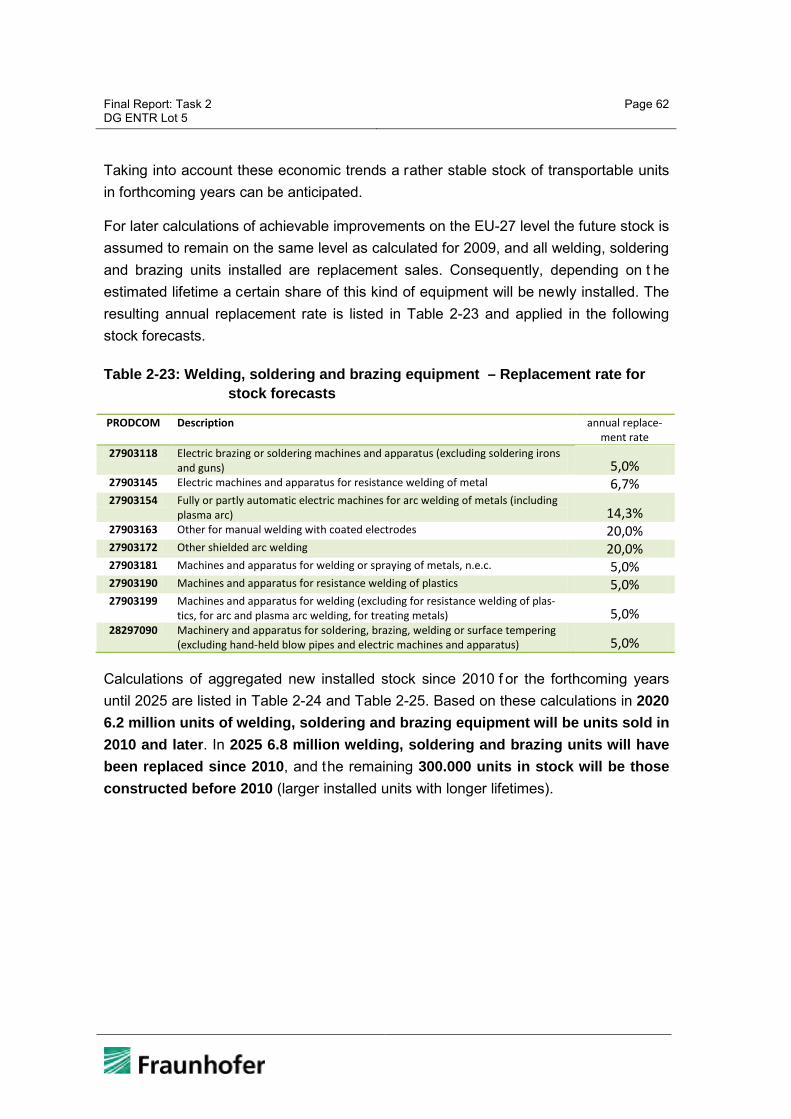
Final Report: Task 2 DG ENTR Lot 5
Page 62
Taking into account these economic trends a rather stable stock of transportable units in forthcoming years can be anticipated.
For later calculations of achievable improvements on the EU-27 level the future stock is assumed to remain on the same level as calculated for 2009, and all welding, soldering and brazing units installed are replacement sales. Consequently, depending on t he estimated lifetime a certain share of this kind of equipment will be newly installed. The resulting annual replacement rate is listed in Table 2-23 and applied in the following stock forecasts.
Table 2-23: Welding, soldering and brazing equipment – Replacement rate for stock forecasts
PRODCOM Description annual replace-ment rate
27903118 Electric brazing or soldering machines and apparatus (excluding soldering irons and guns) 5,0%
27903145 Electric machines and apparatus for resistance welding of metal 6,7% 27903154 Fully or partly automatic electric machines for arc welding of metals (including
plasma arc) 14,3% 27903163 Other for manual welding with coated electrodes 20,0% 27903172 Other shielded arc welding 20,0% 27903181 Machines and apparatus for welding or spraying of metals, n.e.c. 5,0% 27903190 Machines and apparatus for resistance welding of plastics 5,0% 27903199 Machines and apparatus for welding (excluding for resistance welding of plas-
tics, for arc and plasma arc welding, for treating metals) 5,0% 28297090 Machinery and apparatus for soldering, brazing, welding or surface tempering
(excluding hand-held blow pipes and electric machines and apparatus) 5,0%
Calculations of aggregated new installed stock since 2010 f or the forthcoming years until 2025 are listed in Table 2-24 and Table 2-25. Based on these calculations in 2020 6.2 million units of welding, soldering and brazing equipment will be units sold in 2010 and later. In 2025 6.8 million welding, soldering and brazing units will have been replaced since 2010, and the remaining 300.000 units in stock will be those constructed before 2010 (larger installed units with longer lifetimes).
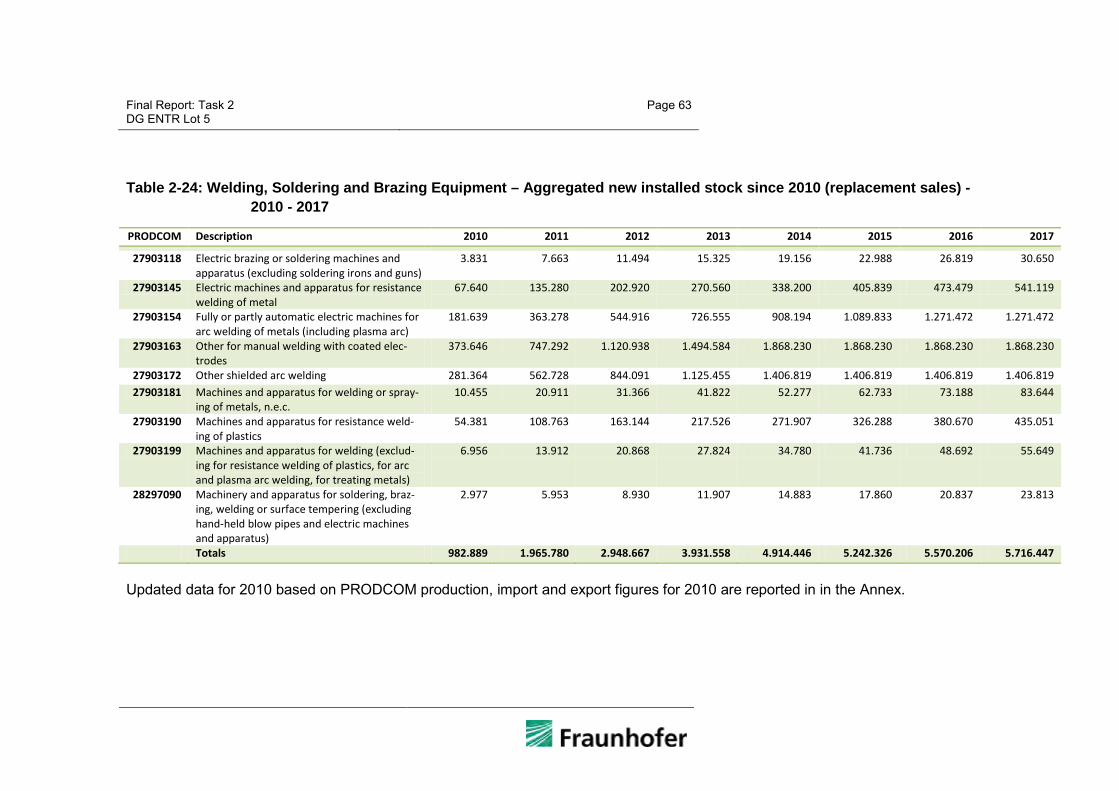
Final Report: Task 2 DG ENTR Lot 5
Page 63
Table 2-24: Welding, Soldering and Brazing Equipment – Aggregated new installed stock since 2010 (replacement sales) - 2010 - 2017
PRODCOM Description 2010 2011 2012 2013 2014 2015 2016 2017
27903118 Electric brazing or soldering machines and apparatus (excluding soldering irons and guns)
3.831 7.663 11.494 15.325 19.156 22.988 26.819 30.650
27903145 Electric machines and apparatus for resistance welding of metal
67.640 135.280 202.920 270.560 338.200 405.839 473.479 541.119
27903154 Fully or partly automatic electric machines for arc welding of metals (including plasma arc)
181.639 363.278 544.916 726.555 908.194 1.089.833 1.271.472 1.271.472
27903163 Other for manual welding with coated elec-trodes
373.646 747.292 1.120.938 1.494.584 1.868.230 1.868.230 1.868.230 1.868.230
27903172 Other shielded arc welding 281.364 562.728 844.091 1.125.455 1.406.819 1.406.819 1.406.819 1.406.819 27903181 Machines and apparatus for welding or spray-
ing of metals, n.e.c. 10.455 20.911 31.366 41.822 52.277 62.733 73.188 83.644
27903190 Machines and apparatus for resistance weld-ing of plastics
54.381 108.763 163.144 217.526 271.907 326.288 380.670 435.051
27903199 Machines and apparatus for welding (exclud-ing for resistance welding of plastics, for arc and plasma arc welding, for treating metals)
6.956 13.912 20.868 27.824 34.780 41.736 48.692 55.649
28297090 Machinery and apparatus for soldering, braz-ing, welding or surface tempering (excluding hand-held blow pipes and electric machines and apparatus)
2.977 5.953 8.930 11.907 14.883 17.860 20.837 23.813
Totals 982.889 1.965.780 2.948.667 3.931.558 4.914.446 5.242.326 5.570.206 5.716.447
Updated data for 2010 based on PRODCOM production, import and export figures for 2010 are reported in in the Annex.
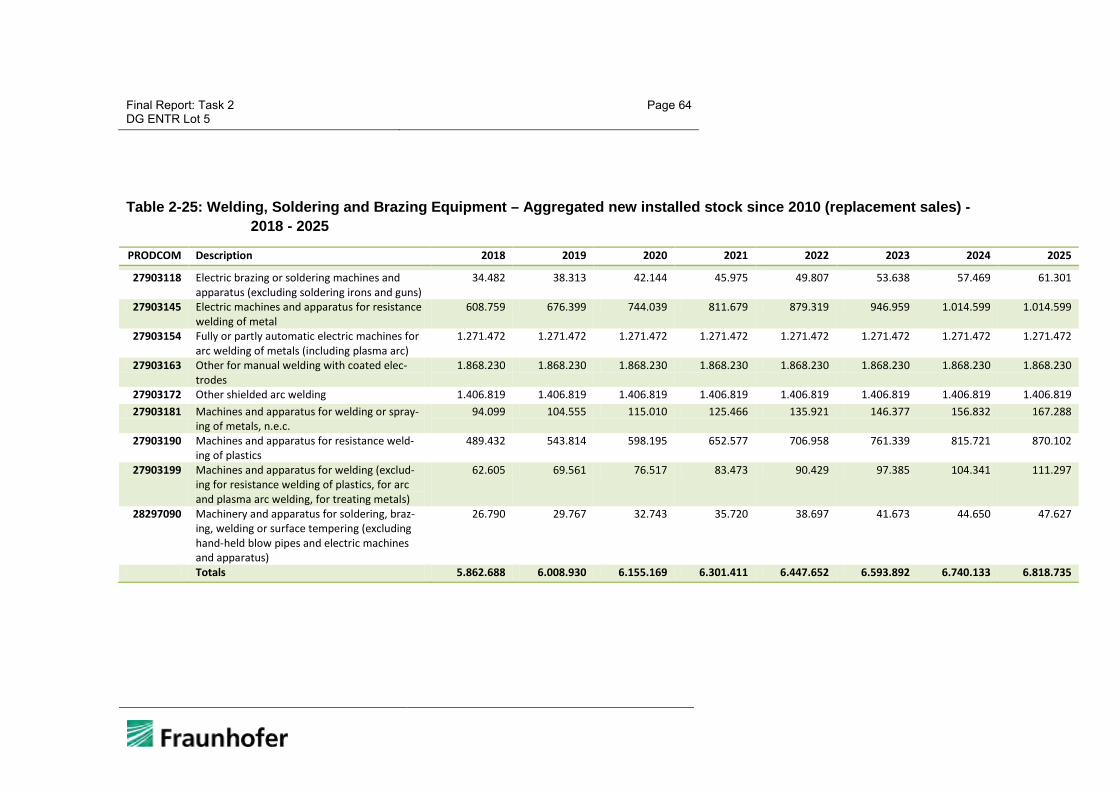
Final Report: Task 2 DG ENTR Lot 5
Page 64
Table 2-25: Welding, Soldering and Brazing Equipment – Aggregated new installed stock since 2010 (replacement sales) - 2018 - 2025
PRODCOM Description 2018 2019 2020 2021 2022 2023 2024 2025
27903118 Electric brazing or soldering machines and apparatus (excluding soldering irons and guns)
34.482 38.313 42.144 45.975 49.807 53.638 57.469 61.301
27903145 Electric machines and apparatus for resistance welding of metal
608.759 676.399 744.039 811.679 879.319 946.959 1.014.599 1.014.599
27903154 Fully or partly automatic electric machines for arc welding of metals (including plasma arc)
1.271.472 1.271.472 1.271.472 1.271.472 1.271.472 1.271.472 1.271.472 1.271.472
27903163 Other for manual welding with coated elec-trodes
1.868.230 1.868.230 1.868.230 1.868.230 1.868.230 1.868.230 1.868.230 1.868.230
27903172 Other shielded arc welding 1.406.819 1.406.819 1.406.819 1.406.819 1.406.819 1.406.819 1.406.819 1.406.819 27903181 Machines and apparatus for welding or spray-
ing of metals, n.e.c. 94.099 104.555 115.010 125.466 135.921 146.377 156.832 167.288
27903190 Machines and apparatus for resistance weld-ing of plastics
489.432 543.814 598.195 652.577 706.958 761.339 815.721 870.102
27903199 Machines and apparatus for welding (exclud-ing for resistance welding of plastics, for arc and plasma arc welding, for treating metals)
62.605 69.561 76.517 83.473 90.429 97.385 104.341 111.297
28297090 Machinery and apparatus for soldering, braz-ing, welding or surface tempering (excluding hand-held blow pipes and electric machines and apparatus)
26.790 29.767 32.743 35.720 38.697 41.673 44.650 47.627
Totals 5.862.688 6.008.930 6.155.169 6.301.411 6.447.652 6.593.892 6.740.133 6.818.735

Final Report: Task 2 DG ENTR Lot 5
Page 65
2.2.2.4 Other machine tools
EuroStat figures for other machine tools are of limited accuracy. For the segment stone and ceramics working machine tools the export value in some years exceeded the pro-duction value (PRODCOM code 28491150), which could be the case, if imports are re-exported, but is rather unlikely and leads to the assumption, that systematically export statistics cover more machinery types than the production statistics. These inconsist-encies could not be verified, and the resulting stock figures are subject to a high level of uncertainty.
Having said this, the stock model for stone and ceramics working machine tools and the like product categories (NACE codes) is as listed in the table below for 1995 as Kyoto reference year and 2009.
Table 2-26: Stone and ceramics working machine tools - Installed stock 1995 and 2009
PRODCOM Description 1995 2009 28491130 Sawing machines for working stone, ceramics, concrete, asbestos-
cement or like mineral materials or for cold working glass 488.852 656.877
28491150 Grinding or polishing machines for working stone, ceramics, con-crete, asbestos-cement or like mineral materials or for cold work-ing glass
105.601 108.832
28491170 Machine-tools for working stone, ceramics, concrete, asbestos-cement or like mineral materials or for cold working glass (exclud-ing sawing machines, grinding or polishing machines)
127.710 178.201
Totals 724.158 945.919
Total installed stock of stone and ceramics working machine tools as one major seg-ment of “other machine tools” is depicted in Figure 2-11. The number of installed ma-chine tools rose from 720.000 units in 1995 to nearly 950.000 units in 2009 according to this stock model. The economic crisis of 2009 is not visible in this stock model: Alt-hough sales volume went down significantly the newly installed stock was in a similar range as 20 years before (the anticipated average lifetime) which leads to a stable stock according to the simplified model.

Final Report: Task 2 DG ENTR Lot 5
Page 66
Figure 2-11: Installed Stock – Stone and Ceramics Working Machine Tools Cate-gories – Development 1995 - 2009
For future years it is assumed, that the installed stock remains on a stable level.
Calculations of aggregated new installed stock since 2010 f or the forthcoming years until 2025 are listed in Table 2-27 and Table 2-28. Based on these calculations in 2020 520.000 stone and ceramics working machine tools will be units sold in 2010 and later. In 2025 750.000 stone and ceramics working machine tools will have been replaced since 2010, and the remaining 200.000 units in stock will be those con-structed before 2010.
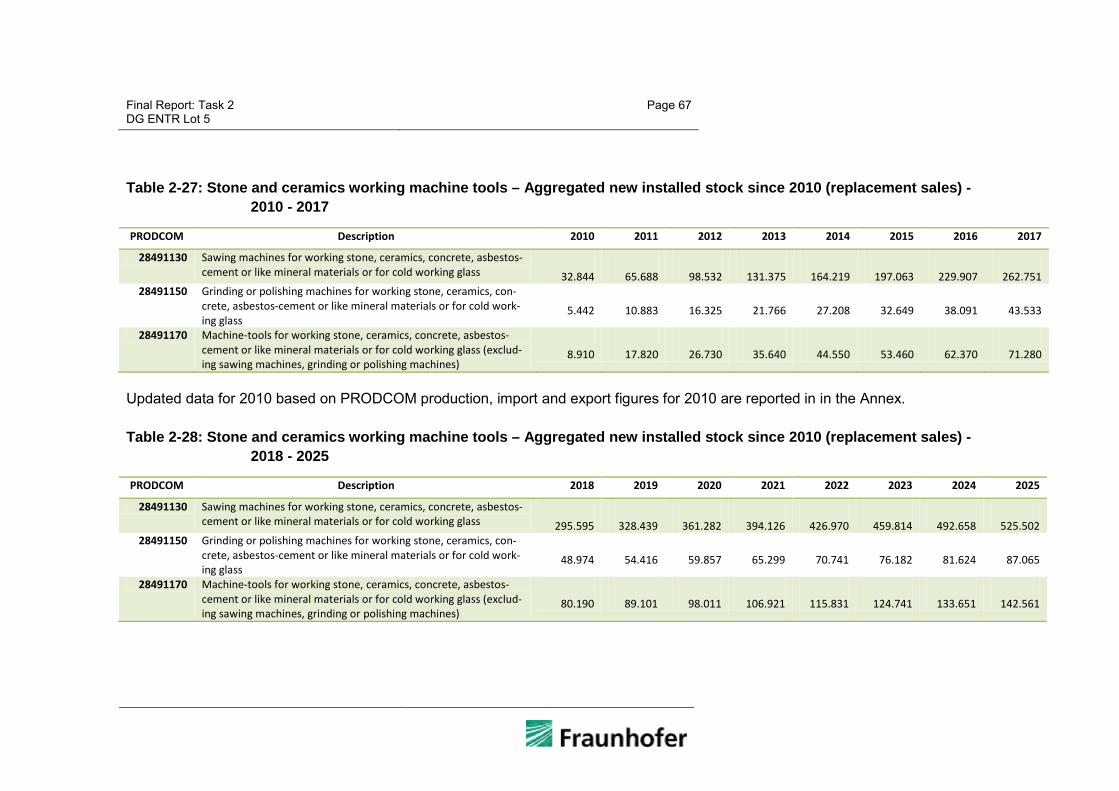
Final Report: Task 2 DG ENTR Lot 5
Page 67
Table 2-27: Stone and ceramics working machine tools – Aggregated new installed stock since 2010 (replacement sales) - 2010 - 2017
PRODCOM Description 2010 2011 2012 2013 2014 2015 2016 2017
28491130 Sawing machines for working stone, ceramics, concrete, asbestos-cement or like mineral materials or for cold working glass 32.844 65.688 98.532 131.375 164.219 197.063 229.907 262.751
28491150 Grinding or polishing machines for working stone, ceramics, con-crete, asbestos-cement or like mineral materials or for cold work-ing glass
5.442 10.883 16.325 21.766 27.208 32.649 38.091 43.533
28491170 Machine-tools for working stone, ceramics, concrete, asbestos-cement or like mineral materials or for cold working glass (exclud-ing sawing machines, grinding or polishing machines)
8.910 17.820 26.730 35.640 44.550 53.460 62.370 71.280
Updated data for 2010 based on PRODCOM production, import and export figures for 2010 are reported in in the Annex.
Table 2-28: Stone and ceramics working machine tools – Aggregated new installed stock since 2010 (replacement sales) - 2018 - 2025
PRODCOM Description 2018 2019 2020 2021 2022 2023 2024 2025
28491130 Sawing machines for working stone, ceramics, concrete, asbestos-cement or like mineral materials or for cold working glass 295.595 328.439 361.282 394.126 426.970 459.814 492.658 525.502
28491150 Grinding or polishing machines for working stone, ceramics, con-crete, asbestos-cement or like mineral materials or for cold work-ing glass
48.974 54.416 59.857 65.299 70.741 76.182 81.624 87.065
28491170 Machine-tools for working stone, ceramics, concrete, asbestos-cement or like mineral materials or for cold working glass (exclud-ing sawing machines, grinding or polishing machines)
80.190 89.101 98.011 106.921 115.831 124.741 133.651 142.561
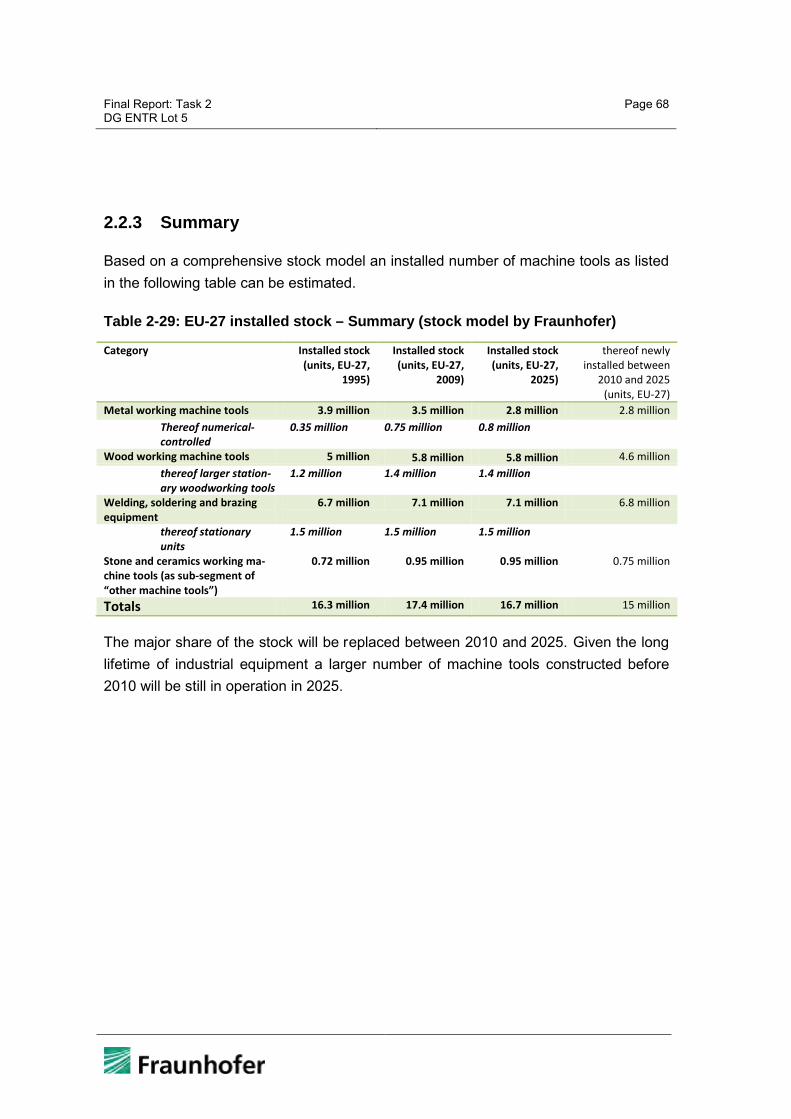
Final Report: Task 2 DG ENTR Lot 5
Page 68
2.2.3 Summary
Based on a comprehensive stock model an installed number of machine tools as listed in the following table can be estimated.
Table 2-29: EU-27 installed stock – Summary (stock model by Fraunhofer)
Category Installed stock (units, EU-27,
1995)
Installed stock (units, EU-27,
2009)
Installed stock (units, EU-27,
2025)
thereof newly installed between
2010 and 2025 (units, EU-27)
Metal working machine tools 3.9 million 3.5 million 2.8 million 2.8 million Thereof numerical-controlled
0.35 million 0.75 million 0.8 million
Wood working machine tools 5 million 5.8 million 5.8 million 4.6 million thereof larger station-ary woodworking tools
1.2 million 1.4 million 1.4 million
Welding, soldering and brazing equipment
6.7 million 7.1 million 7.1 million 6.8 million
thereof stationary units
1.5 million 1.5 million 1.5 million
Stone and ceramics working ma-chine tools (as sub-segment of “other machine tools”)
0.72 million 0.95 million 0.95 million 0.75 million
Totals 16.3 million 17.4 million 16.7 million 15 million
The major share of the stock will be replaced between 2010 and 2025. Given the long lifetime of industrial equipment a larger number of machine tools constructed before 2010 will be still in operation in 2025.

Final Report: Task 2 DG ENTR Lot 5
Page 69
2.3 Market channels and production structures
The objective of the task 2.3 is the analysis of general market structure and respective trends.
2.3.1 Market Players and Production
2.3.1.1 Metal working machine tools
The main producers of machine tools in Europe are Germany (with a share of almost 50%) and Italy (26%), see Figure 2-1228. All other European countries are much less important. Similarly, within the European Union 41% of all machine tools were sold within or to Germany, 24% within or to Italy (see Figure 2-17).
Figure 2-12: Machine tool production share of most relevant EU countries (2008, in monetary units)
Table 2-30 lists the major companies relevant for the machine tool market and the country, where these companies are based. This shows again the strong position of the European machine tool market. Among the top 50 there are 19 manufacturers from the EU-27, thereof 13 from Germany.
There is a trend towards market concentration in the machine tools business, which is driven by the general trend towards globally distributed industrial production: Setting up a production at various locations requires from machine tool providers also a g lobal representation, and customers want a broad spectrum of machine tools they can
28 Based on: Gardner Publications, Inc.: 2009 World Machine Tool Output & Consumption Sur-
vey, http://www.gardnerweb.com/consump/survey.html, accessed: March 11, 2010
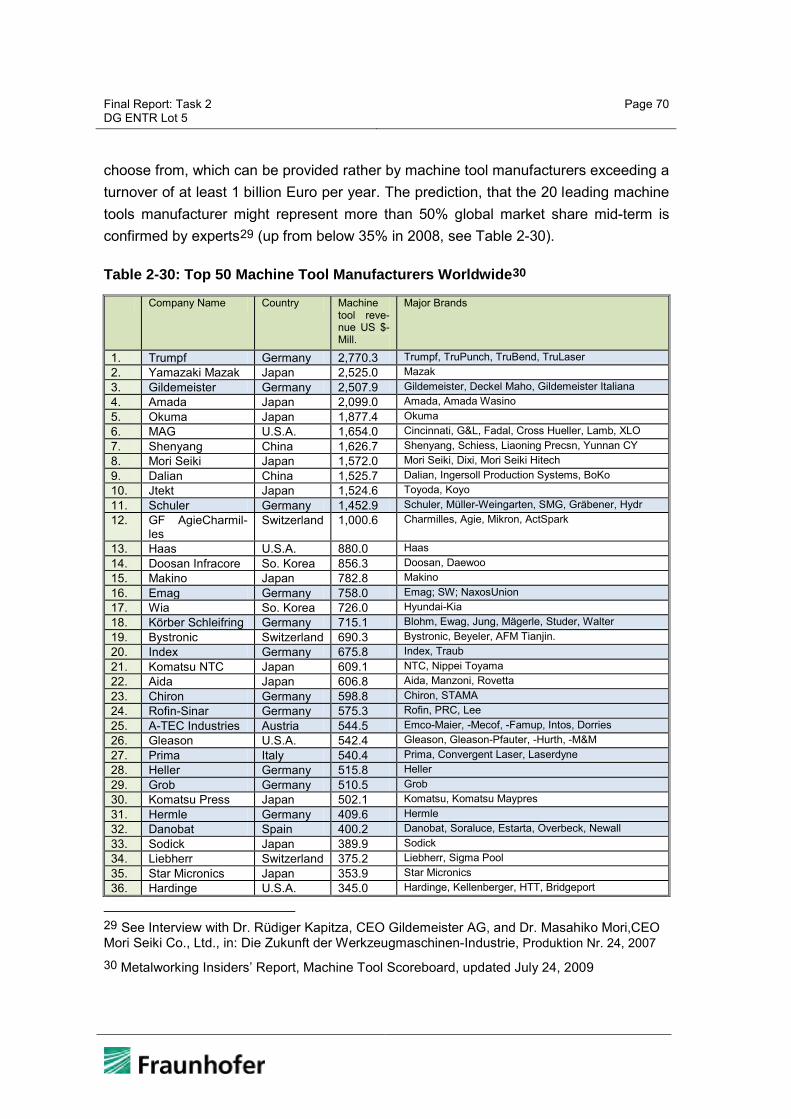
Final Report: Task 2 DG ENTR Lot 5
Page 70
choose from, which can be provided rather by machine tool manufacturers exceeding a turnover of at least 1 billion Euro per year. The prediction, that the 20 leading machine tools manufacturer might represent more than 50% global market share mid-term is confirmed by experts29 (up from below 35% in 2008, see Table 2-30).
Table 2-30: Top 50 Machine Tool Manufacturers Worldwide30
Company Name Country Machine tool reve-nue US $-Mill.
Major Brands
1. Trumpf Germany 2,770.3 Trumpf, TruPunch, TruBend, TruLaser 2. Yamazaki Mazak Japan 2,525.0 Mazak 3. Gildemeister Germany 2,507.9 Gildemeister, Deckel Maho, Gildemeister Italiana 4. Amada Japan 2,099.0 Amada, Amada Wasino 5. Okuma Japan 1,877.4 Okuma 6. MAG U.S.A. 1,654.0 Cincinnati, G&L, Fadal, Cross Hueller, Lamb, XLO 7. Shenyang China 1,626.7 Shenyang, Schiess, Liaoning Precsn, Yunnan CY 8. Mori Seiki Japan 1,572.0 Mori Seiki, Dixi, Mori Seiki Hitech 9. Dalian China 1,525.7 Dalian, Ingersoll Production Systems, BoKo 10. Jtekt Japan 1,524.6 Toyoda, Koyo 11. Schuler Germany 1,452.9 Schuler, Müller-Weingarten, SMG, Gräbener, Hydr 12. GF AgieCharmil-
les Switzerland 1,000.6 Charmilles, Agie, Mikron, ActSpark
13. Haas U.S.A. 880.0 Haas 14. Doosan Infracore So. Korea 856.3 Doosan, Daewoo 15. Makino Japan 782.8 Makino 16. Emag Germany 758.0 Emag; SW; NaxosUnion 17. Wia So. Korea 726.0 Hyundai-Kia 18. Körber Schleifring Germany 715.1 Blohm, Ewag, Jung, Mägerle, Studer, Walter 19. Bystronic Switzerland 690.3 Bystronic, Beyeler, AFM Tianjin. 20. Index Germany 675.8 Index, Traub 21. Komatsu NTC Japan 609.1 NTC, Nippei Toyama 22. Aida Japan 606.8 Aida, Manzoni, Rovetta 23. Chiron Germany 598.8 Chiron, STAMA 24. Rofin-Sinar Germany 575.3 Rofin, PRC, Lee 25. A-TEC Industries Austria 544.5 Emco-Maier, -Mecof, -Famup, Intos, Dorries 26. Gleason U.S.A. 542.4 Gleason, Gleason-Pfauter, -Hurth, -M&M 27. Prima Italy 540.4 Prima, Convergent Laser, Laserdyne 28. Heller Germany 515.8 Heller 29. Grob Germany 510.5 Grob 30. Komatsu Press Japan 502.1 Komatsu, Komatsu Maypres 31. Hermle Germany 409.6 Hermle 32. Danobat Spain 400.2 Danobat, Soraluce, Estarta, Overbeck, Newall 33. Sodick Japan 389.9 Sodick 34. Liebherr Switzerland 375.2 Liebherr, Sigma Pool 35. Star Micronics Japan 353.9 Star Micronics 36. Hardinge U.S.A. 345.0 Hardinge, Kellenberger, HTT, Bridgeport
29 See Interview with Dr. Rüdiger Kapitza, CEO Gildemeister AG, and Dr. Masahiko Mori,CEO Mori Seiki Co., Ltd., in: Die Zukunft der Werkzeugmaschinen-Industrie, Produktion Nr. 24, 2007 30 Metalworking Insiders’ Report, Machine Tool Scoreboard, updated July 24, 2009

Final Report: Task 2 DG ENTR Lot 5
Page 71
Company Name Country Machine tool reve-nue US $-Mill.
Major Brands
37. Feintool Switzerland 341.0 Feintool, Schmid, Hydrel 38. Citizen Japan 332.3 Citizen Cincom 39. Nachi-Fujikoshi Japan 312.0 Nachi 40. Finn-Power Finland 306.3 Finn-Power 41. Comau Italy 298.5 Comau, PICO, Renault Automation 42. Mitsubishi H.I. Japan 292.8 Mitsubishi 43. Niles-Simmons Germany 291.0 Niles-Simmons, Hegenscheidt-MFD 44. StarragHeckert Switzerland 284.3 Starrag (Rigid), Heckert, SIP 45. Fagor Arrasate Spain 270.7 Fagor Arrasate, Ona Pres 46. Toshiba Japan 252.9 Shibaura, Toshiba 47. Autania Germany 251.1 Elb, WFL Millturn, Profiroll, Wirth & Gruffat, Sieber 48. OKK Japan 247.7 OKK 49. Romi Brazil 245.1 Romi 50. Tornos Switzerland 243.6 Tornos
Table 2-31: Machine tool production in Germany, 2008
Segment Million Euro Laser-, ion beam-, ultrasonic machines 473,0 Electrical discharge machines 74,2 Machining centres, flexible systems 1.913,4 Unit construction machines, transfer machines 566,4 Turning machines, turning centres 1.561,9 Drilling machines, boring machines, boring-milling machines 208,6 Milling machines 1.090,2 Grinding, honing, lapping and polishing machines 1.225,6 Gear cutting and finishing machines 748,3 Sawing and cutting-off machines 267,6 Other metal cutting machine tools 85,6 Metal cutting machine tools 8.214,8 Forging machines and hammers (incl. presses) 148,7 Bending, folding and straightening machines (incl. presses) 542,6 Shearing, punching, notching machines (incl. presses) 432,9 Other presses 615,8 Wire working machines 299,4 Other metal forming machine tools 462,1 Metal forming machine tools 2.501,5 Total machine tools 10.716,2 Parts, accessories 2.537,4 Installation, repairs etc. 925,1 Machine tools incl. parts and accessories, installation, repair, maintenance 14.178,8
The economic structure of one of the major producing countries for machine tools in Europe – Germany – is listed in Table 2-3131. 31 Verein Deutscher Werkzeugmaschinenfabriken: Werkzeugmaschinen-Produktion Deutsch-
land nach Maschinengruppen, 2009
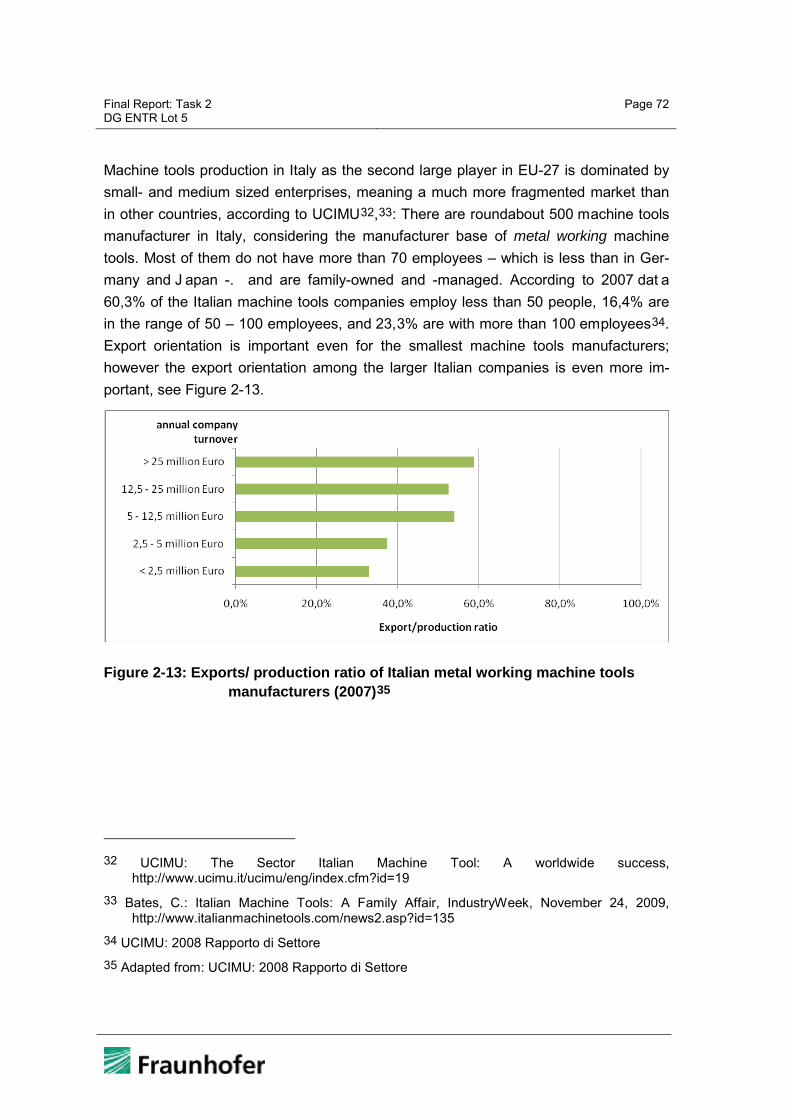
Final Report: Task 2 DG ENTR Lot 5
Page 72
Machine tools production in Italy as the second large player in EU-27 is dominated by small- and medium sized enterprises, meaning a much more fragmented market than in other countries, according to UCIMU32,33: There are roundabout 500 machine tools manufacturer in Italy, considering the manufacturer base of metal working machine tools. Most of them do not have more than 70 employees – which is less than in Ger-many and J apan -. and are family-owned and -managed. According to 2007 dat a 60,3% of the Italian machine tools companies employ less than 50 people, 16,4% are in the range of 50 – 100 employees, and 23,3% are with more than 100 employees34. Export orientation is important even for the smallest machine tools manufacturers; however the export orientation among the larger Italian companies is even more im-portant, see Figure 2-13.
Figure 2-13: Exports/ production ratio of Italian metal working machine tools manufacturers (2007)35
32 UCIMU: The Sector Italian Machine Tool: A worldwide success,
http://www.ucimu.it/ucimu/eng/index.cfm?id=19 33 Bates, C.: Italian Machine Tools: A Family Affair, IndustryWeek, November 24, 2009,
http://www.italianmachinetools.com/news2.asp?id=135 34 UCIMU: 2008 Rapporto di Settore 35 Adapted from: UCIMU: 2008 Rapporto di Settore
Final Report: Task 2 DG ENTR Lot 5
Page 73
2.3.1.2 Wood working machine tools
Wood working machine tools manufacturing is dominated by a multitude of SMEs, ex-emplarily the situation in Italy and Spain is as follows:
The Italian sector of wood working machinery and tools comprises 300 companies with 40 employees in average36.
In Spain over 600 companies manufactured wood working machines in 2006 in which SMEs represent 90% of this business sector37. Major products of the Spanish market are machine tools like milling machines, classic CNC lathes, production lines for pel-lets, UV production lines and CNC turning lathes. The industry is concentrated in the three major regions Catalonia (30%), Basque region (23%) and Valencia (22%).
2.3.1.3 Welding, soldering and brazing equipment
According to 2009 PRODCOM figures Germany has a monetary market share in weld-ing, soldering and br azing equipment production of about 55%. As shown in Figure 2-1438 Germany, Italy, Sweden and Fr ance produce more than three quarter of this type of equipment in EU. Other countries in EU27 have no significant relevance.
36 According to ACIMALL Italian Woodworking Machinery and Tool Manufacturers Association 37 Instituto Español de C omercio Exterior: Branchenreport – Spanien: Maschinen und Werk-
zeuge für die Holz- und Möbelbearbeitung, May 2007 38 Eurostat: PRODCOM 2009 released 12.07.2010

Final Report: Task 2 DG ENTR Lot 5
Page 74
Figure 2-15: Welding, soldering, brazing equipment production share of most relevant EU countries (2009, in monetary units)
France and I taly hold two third of market value of production in category “Other for manual welding with coated electrodes”. In terms of units – not economically - this cat-egory stands for half of the welding machines.
There is a limited number of companies manufacturing this type of equipment: In Ger-many for example maximum 10 t o 15 c ompanies report into each of the relevant 9 PRODCOM categories39.
According to EuroStat figures40 there is an EU-27 production value of roughly 3 billion Euros per year, thereof a value of 1.26 billion exported to non-EU countries and anoth-er 360 million Euros value in welding, soldering and brazing equipment imported from non-EU countries.
DVS Deutscher Verband für Schweißen und verwandte Verfahren e.V. (German Weld-ing Society) regularly surveys the market for joining technologies, and states higher production values for the EU, based on 2007 data, than what is identified by our Euro-Stat evaluation. DVS covers devices, machines and systems41: Around one third of the European production of joining technology devices originates from Germany. In 2007, goods with a production value of € 7.5 billion were manufactured in Europe,
39 Statistisches Bundesamt: Produzierendes Gewerbe - Produktion des Verarbeitenden Ge-
werbes sowie des Bergbaus und der Gewinnung von Steinen und Erden - 2009, Fachserie 4 Reihe 3.1, May 11, 2010
40 years 2005-2009 in average 41 Middeldorf, K.: The Economic Importance of Welding and Joining in Europe Production Val-
ues, Values Added and Employees, DVS, July 24, 2009
Final Report: Task 2 DG ENTR Lot 5
Page 75
thereof almost € 2. 6 billion in Germany. Other important manufacturers of these devices are Italy with a production value of nearly € 1.2 billion and France with € 320 million, but no i nformation about the laser production in these countries was available. Therefore, their actual production could turn out to be e ven somewhat higher. In Europe, welding technology devices account for around € 3.9 billion of the production values amounting to € 7.5 billion. This corresponds to a proportion of 52 %. Germany is also the most important welding technology producer in Europe. Almost 43 % o f the European welding technology production originates from Ger-many, 18 % from Italy and 6 % from France.
2.3.2 Target markets: Countries and Sectors
In terms of numbers of enterprises using (potentially) machine tools the target market is very diverse: Machine tools constitute an important part of the production processes in the following sectors:
DD20: Manufacture of wood and of products of wood and cork, except furniture; manufacture of articles of straw and plaiting materials
DH252: Manufacture of plastic products
DI2612: Shaping and processing of flat glass
DI2615: Manufacture and processing of other glass, including technical glass-ware
DI262: Manufacture of non-refractory ceramic goods other than for construction purposes; manufacture of refractory ceramic products
DI267: Cutting, shaping and finishing of ornamental and building stone
DJ28: Manufacture of fabricated metal products, except machinery and equip-ment
DK29: Manufacture of machinery and equipment n.e.c.
DL31: Manufacture of electrical machinery and apparatus n.e.c.
DL32: Manufacture of radio, television and communication equipment and ap-paratus

Final Report: Task 2 DG ENTR Lot 5
Page 76
DL33: Manufacture of medical, precision and optical instruments, watches and clocks
DM34: Manufacture of motor vehicles, trailers and semi-trailers
DM35: Manufacture of other transport equipment
DN36: Manufacture of furniture; manufacturing n.e.c.
These sectors in total represent 1.373 million enterprises in the EU-27 (Eurostat, 2007), see below.
Figure 2-16: Number of enterprises in the target sectors for machine tools (EU-27, 2007)
In some of these sectors almost all companies use machine tools as a core part of the process chain. These sectors alone comprise 640,000 companies in EU-27 (DJ28, DK29, DM34, DM35), most of them small and m edium-size enterprises, partly even micro-enterprises. For the other sectors the penetration rate with machine tools is much more uncertain, but widespread use of machine tools can be assumed, although in most enterprises only for few process steps among many other processes. Having this in mind, the number of machine tools using companies in EU-27 can be esti-mated at roughly 800,000 – 1,200,000 enterprises.
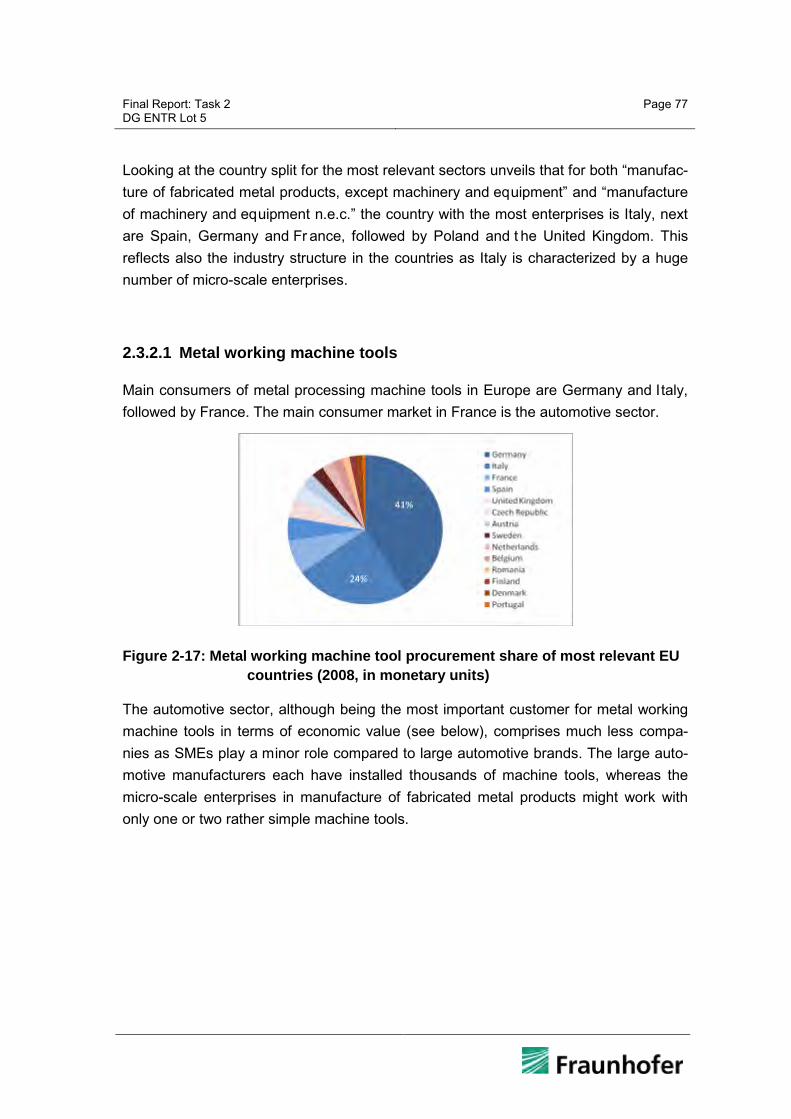
Final Report: Task 2 DG ENTR Lot 5
Page 77
Looking at the country split for the most relevant sectors unveils that for both “manufac-ture of fabricated metal products, except machinery and equipment” and “manufacture of machinery and equipment n.e.c.” the country with the most enterprises is Italy, next are Spain, Germany and Fr ance, followed by Poland and t he United Kingdom. This reflects also the industry structure in the countries as Italy is characterized by a huge number of micro-scale enterprises.
2.3.2.1 Metal working machine tools
Main consumers of metal processing machine tools in Europe are Germany and Italy, followed by France. The main consumer market in France is the automotive sector.
Figure 2-17: Metal working machine tool procurement share of most relevant EU countries (2008, in monetary units)
The automotive sector, although being the most important customer for metal working machine tools in terms of economic value (see below), comprises much less compa-nies as SMEs play a minor role compared to large automotive brands. The large auto-motive manufacturers each have installed thousands of machine tools, whereas the micro-scale enterprises in manufacture of fabricated metal products might work with only one or two rather simple machine tools.

Final Report: Task 2 DG ENTR Lot 5
Page 78
Figure 2-18: Number of enterprises in most relevant sectors for machine tools, per country (2007)
The German project “Werkzeugmaschinen-Initiative 20XX” researched in detail the market for machine tools in Germany, having in mind the metal processing machine tools, and classified the user groups of machine tools as structured in the matrix be-low42. Clearly, the automotive sector is the most important customer for the machine tools industry. Furthermore, the machine tools industry itself actually is in both posi-tions, supplying machine tools, but also being a very important customer. The market segment of manufacturing products of limited complexity as single parts or maximum in small batches is dominated by tool and mould construction. Automotive suppliers clear-ly dominate the segment of producing less complex products in mass production.
42 Gausemeier, J.; Kinkel, S.: Strategische Technologieplanung mit Zukunftsszenarien - Me-
thoden, Hilfsmittel, Beispiele, VDMA Verlag GmbH, 2008, p. 12
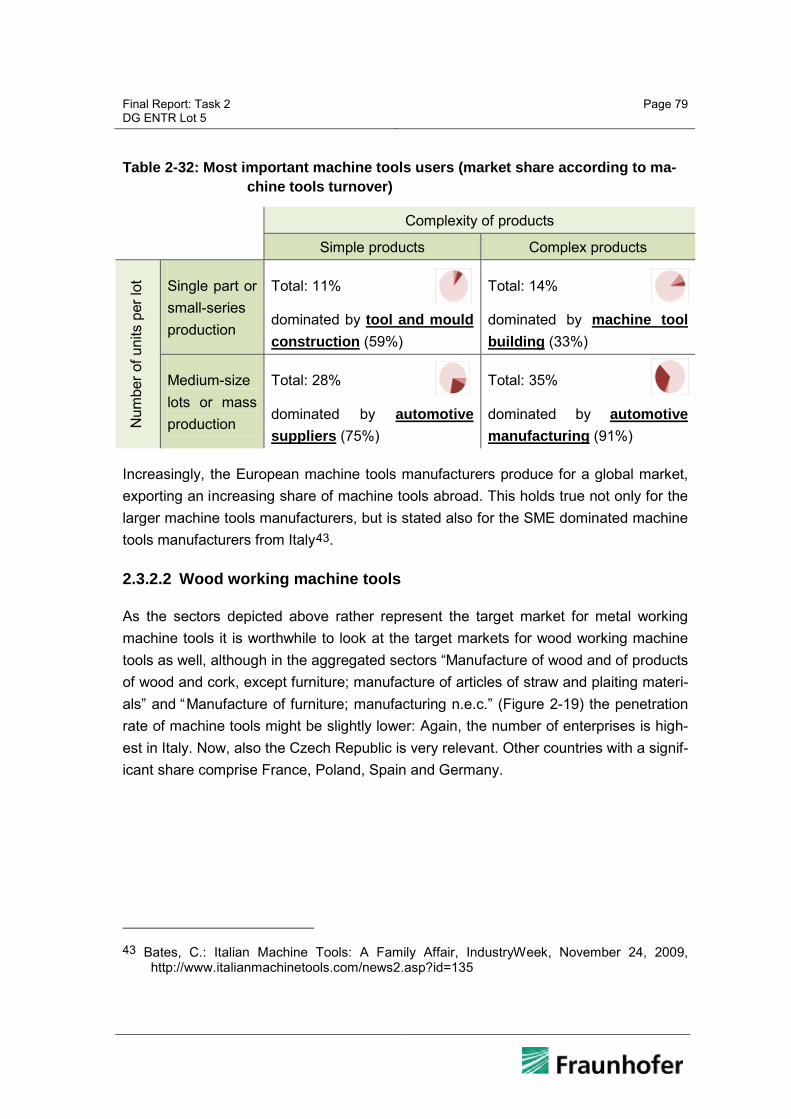
Final Report: Task 2 DG ENTR Lot 5
Page 79
Table 2-32: Most important machine tools users (market share according to ma-chine tools turnover)
Complexity of products
Simple products Complex products
Num
ber o
f uni
ts p
er lo
t Single part or small-series production
Total: 11%
dominated by tool and mould construction (59%)
Total: 14%
dominated by machine tool building (33%)
Medium-size lots or mass production
Total: 28%
dominated by automotive suppliers (75%)
Total: 35%
dominated by automotive manufacturing (91%)
Increasingly, the European machine tools manufacturers produce for a global market, exporting an increasing share of machine tools abroad. This holds true not only for the larger machine tools manufacturers, but is stated also for the SME dominated machine tools manufacturers from Italy43.
2.3.2.2 Wood working machine tools
As the sectors depicted above rather represent the target market for metal working machine tools it is worthwhile to look at the target markets for wood working machine tools as well, although in the aggregated sectors “Manufacture of wood and of products of wood and cork, except furniture; manufacture of articles of straw and plaiting materi-als” and “Manufacture of furniture; manufacturing n.e.c.” (Figure 2-19) the penetration rate of machine tools might be slightly lower: Again, the number of enterprises is high-est in Italy. Now, also the Czech Republic is very relevant. Other countries with a signif-icant share comprise France, Poland, Spain and Germany.
43 Bates, C.: Italian Machine Tools: A Family Affair, IndustryWeek, November 24, 2009,
http://www.italianmachinetools.com/news2.asp?id=135
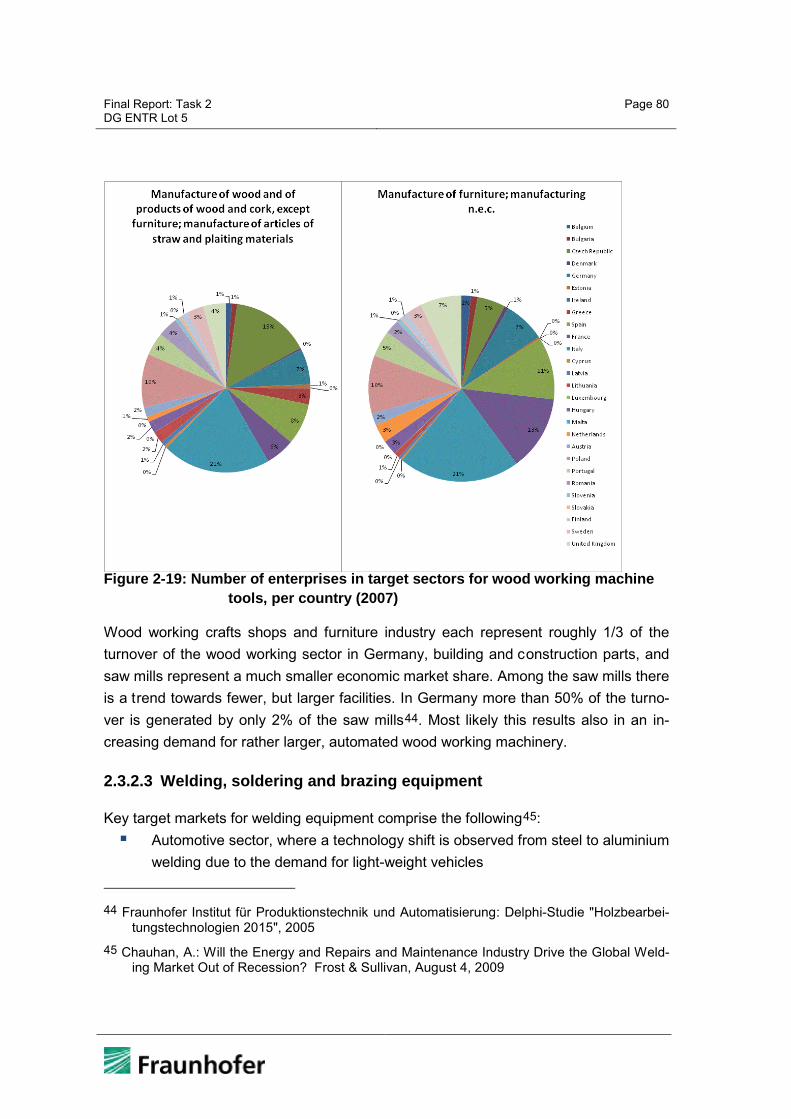
Final Report: Task 2 DG ENTR Lot 5
Page 80
Figure 2-19: Number of enterprises in target sectors for wood working machine tools, per country (2007)
Wood working crafts shops and furniture industry each represent roughly 1/3 of the turnover of the wood working sector in Germany, building and construction parts, and saw mills represent a much smaller economic market share. Among the saw mills there is a trend towards fewer, but larger facilities. In Germany more than 50% of the turno-ver is generated by only 2% of the saw mills44. Most likely this results also in an in-creasing demand for rather larger, automated wood working machinery.
2.3.2.3 Welding, soldering and brazing equipment
Key target markets for welding equipment comprise the following45: Automotive sector, where a technology shift is observed from steel to aluminium
welding due to the demand for light-weight vehicles
44 Fraunhofer Institut für Produktionstechnik und Automatisierung: Delphi-Studie "Holzbearbei-
tungstechnologien 2015", 2005 45 Chauhan, A.: Will the Energy and Repairs and Maintenance Industry Drive the Global Weld-
ing Market Out of Recession? Frost & Sullivan, August 4, 2009

Final Report: Task 2 DG ENTR Lot 5
Page 81
Aerospace industry, including building new aircrafts and maintenance of existing ones.
Shipbuilding Heavy machinery building Energy and power industry, in particular manufacturing of wind turbines, which
sees a steady and stable growth against the trend of the economic crisis. (the energy generation market currently occupies a share of 11 per cent in the total global welding market)
Repair and m aintenance in various sectors, frequently done by small enterprises.
2.3.3 Production Structures and Trends
2.3.3.1 Metal working machine tools
There are a c ouple of indicators and t rends with potentially important effects for the machine tools industry, influencing the specifications and market conditions: Batch size Product size Precision requirements Product cycles
The batch size is a very important factor for configuration and use patterns regarding machine tools and frequently there is a t rend mentioned towards “one piece flow”, which has been confirmed as being relevant in a comprehensive survey of Fraunhofer ISI, Heinrich-Nixdorf Institut and VDW among German users of machine tools back in 2003 (covering 1,450 companies) 46, but not as a dramatic change: In total 24% of the companies from the metalworking and electrical industry stated, that the number of variants required by their customers increased significantly, 51% stated a s light in-crease in number of variants, 22% stated no changes. The sub-sector with the strong-est trend towards an increased number of variants is the vehicle construction (i.e. dom-inated by the automotive manufacturing industry; 32% - significant increase, 55% - slight increase). Whether an i ncreased spectrum of variants also results in smaller batches produced depends on further conditions, e.g. process planning and order management. The survey revealed, that actually at 10% of the companies in the met-alworking and el ectrical industry the manufactured lot size shrunk significantly, 24% 46 Gausemeier, J.; Kinkel, S.: Strategische Technologieplanung mit Zukunftsszenarien - Me-
thoden, Hilfsmittel, Beispiele, VDMA Verlag GmbH, 2008, p. 18-21

Final Report: Task 2 DG ENTR Lot 5
Page 82
stated a slightly shrinking lot size in average, whereas among 42% of the companies lot sizes remained the same, 20% and 5 % even stating a trend towards larger and much larger lot sizes. Gausemeier and K inkel conclude, that industry did not (yet) broadly implement a “one piece flow”, nor is it likely to happen short- to mid-term; us-age of machine tools is likely to remain dominated by mid-size lots and mass pro-duction, although more flexible machine tools configurations are required for a couple of applications. Recently the VDW published another survey among member companies regarding lot sizes of machine tools production47: At maximum 150 m a-chine tools of a given model are produced per year, stated by one of the large manu-facturers, whereas most models are produced in less than 50 units per year, frequently even below 10 units per year, indicating the high level of customisation among metal working machine tools.
Product size matters for the dimension of machine tools. Both developments are ob-served, the trend towards smaller, miniaturised objects and processing of larger units the survey of “Werkzeugmaschinen-Initiative 20XX” identified, that product dimensions have been considered to remain roughly the same by 63% of the users of machine tools, and from the remaining, more state a trend towards larger products than smaller ones. The trend towards smaller product dimensions is clearly dominating in the sector “manufacturing of electrical machinery and appar atus” (10% report a significantly re-duced size, 18% a s light size reduction), whereas the adverse trend towards larger objects is most significant in vehicles construction (15% report significantly increased product sizes, 23% a slight increase) 48.
Precision requirements are an important quality criterion for machine tools, but also for process stability, and thus influence the use patterns for machine tools in the produc-tion environment. More than one quarter of those machine tools users replying to the survey under the “Werkzeugmaschinen-Initiative 20XX” stated, that precision require-ments increased significantly, another 44% state a slight increase49. In particular those sectors which are major consumers of machine tools (tool and mould construction, au-tomotive manufacturing) are characterized by increasing precision requirements. 47 Hagemann, D.: Die energieeffiziente Werkzeugmaschine – Rahmenbedingungen und Lö-
sungen für eine nachhaltige Fertigungstechnik, Symposium „Energieeffiziente Werkzeug-maschinen“, Düsseldorf, February 24, 2010
48 Gausemeier, J.; Kinkel, S.: Strategische Technologieplanung mit Zukunftsszenarien - Me-thoden, Hilfsmittel, Beispiele, VDMA Verlag GmbH, 2008, p. 24-25
49 Gausemeier, J.; Kinkel, S.: Strategische Technologieplanung mit Zukunftsszenarien - Me-thoden, Hilfsmittel, Beispiele, VDMA Verlag GmbH, 2008, p. 26

Final Report: Task 2 DG ENTR Lot 5
Page 83
Product cycles have an impact on investment decisions: The more frequently a produc-tion line has to be changed to produce new products, the shorter the return on invest-ment time span has to be. Changing product portfolios might also require more flexibil-ity for machine tools configurations, i.e. modularity and adaptability. However, a survey regarding the product cycles of products manufactured with machine tools revealed, that in the metalworking and el ectrical industry only 13% of the revenue stems from products introduced within the last 3 years, another 53% from products introduced first up to 10 years ago and nearly one-third of the product revenue is even from products introduced more than 10 years ago50.
The sub-segment of special purpose machinery manufacture lost market shares in the past despite the increasing demand for customized solutions: 72% of the machinery investment of the metalworking and electrical industry is spent for machinery, which is based on standard equipment. 14% of investments is spent for machinery developed specifically for a given application, and 13% is spent for internal machinery develop-ments51. Obviously, the market of “standard” machine tools became more diverse, more flexible to address specific customer requirements with a given machinery plat-form.
The production structures of Gildemeister are somewhat typical for the European mar-ket52: Material is sourced inter alia in Russia, Romania and Poland. Due to the high wages in Germany, only the machining of key components and high-quality assembling takes place there. Actually Gildemeister manufactures high-tech machine tools in Ger-many, so-called “entry” machine tools are manufactured in Poland and China, machine tools according to specific customer requirements in Italy.
2.3.3.2 Wood working machine tools
The wood working machine industry is currently undergoing a major change, which focuses on fully automated equipment and the topic of sustainability and energy effi-ciency gains importance. The furniture production sector represents the most important
50 Gausemeier, J.; Kinkel, S.: Strategische Technologieplanung mit Zukunftsszenarien - Me-
thoden, Hilfsmittel, Beispiele, VDMA Verlag GmbH, 2008, p. 28-29 51 Gausemeier, J.; Kinkel, S.: Strategische Technologieplanung mit Zukunftsszenarien - Me-
thoden, Hilfsmittel, Beispiele, VDMA Verlag GmbH, 2008, p. 40 52 See Interview with Dr. Rüdiger Kapitza, CEO Gildemeister AG, and Dr. Masahiko Mori,CEO
Mori Seiki Co., Ltd., in: Die Zukunft der Werkzeugmaschinen-Industrie, Produktion Nr. 24, 2007

Final Report: Task 2 DG ENTR Lot 5
Page 84
driver for those changes. Even the international market describes a trend to fully auto-mated equipment with the furniture industry as major driver for mass production. Con-ferences and industry fairs in the business sector recently integrate topics like sustain-able production and energy efficient products. Medium sized and large-scale enterpris-es drive those topics.
Technology trends
Regarding the general trend of higher automated products a 2005 r eport on future technology trends in the woodworking machine sector identified a growing usage of industrial robots for load and unloads operations.53 The industry estimated that wood as raw material is more and more industrial produced with improved material proper-ties. This means that there is a change to improved raw materials with chipped wood as basis and the development of new surface treatment and finish treatment for solid wood. Those trends of new and improved raw materials require new and adapted ma-chines for transforming processes. In Europe, particularly in Germany or Spain there is an upcoming trend for “one piece flow” production in the furniture sector. Concerning this changed user demand the traditional use of single machines switch to the use of modular systems with a central control system. Existing machines gets upgraded with computer controlled information systems to integrate them into a new central controlled system. The advantage of this system trend is a better integration of power manage-ment for all connected machine modules. It is possible to send each module individual-ly into a standby mode after the defined task is finished. A manual power on and –off becomes obsolete. The potential disadvantage of the additional power consumption by the integrated ICT components could be disregarded related to the energy savings of a well-integrated power management system.
The growing use of laser technology for improved differentiation and positioning of ma-chine tools stands for a potential aspect for increased energy consumption. Laser technology in woodworking is used increasingly for edge gluing, where laser technolo-gy could save energy compared to usage of conventional hot melt adhesives54, or en-graving, but also for wood cutting of finely wrought workpieces. Compared to pro-cessing other types of materials, laser applications for wood working are a rather minor
53 Fraunhofer Institut für Produktionstechnik und Automatisierung: Delphi-Studie "Holzbearbei-
tungstechnologien 2015", 2005 54 HOMAG Group: ecoPlus – Technology that really pays off, Schopfloch

Final Report: Task 2 DG ENTR Lot 5
Page 85
segment of the whole laser market55. No information is available regarding market growth of laser processing for wood in particular.
The use of nanotechnology is an innovation that affects the wood industry in two differ-ent aspects. First, the development of wood coatings particular for UV absorbing and penetration requires new machines for coating processes. Second, the increased du-rability of both, machine parts and tools with the application of nano-modified materials will have effects on the configuration and sustainability of wood working machines. To-day nano technologies affect are widely present in research activities. In 2005 experts expected the implementation into the product design for woodworking machines by 201056.
2.3.3.3 Welding, soldering and brazing equipment
Given the fact, that joining technologies are cross-sectorial technologies, which are applied in multiple sectors, large industry and small enterprises, as well as for infra-structure, this industry is considered relatively resistant to economic cycles.
Technology Trends
Important changes in the welding branch are related with emerging new and advanced technologies and changes regarding materials to be processed – which are closely related to technology changes: The trend towards lightweight construction, joining of coated sheets and in general modularization of fabrication among other trends leads to a competition between joining technologies. The dominating thermal joining processes are challenged by low-heat and cold joining processes, such as adhesive bonding57. This might result in a general power consumption reduction for joining processes, but this is a q uestion of proper technology choice, not of the equipment as such. Com-bined, hybrid technologies such as the combination of gas-shielded metal-arc welding
55 LaserFocusWorld: Annual Review and Forecast: Skies may be clearing, but fog still lingers,
January 1, 2011, http://www.laserfocusworld.com 56 Fraunhofer Institut für Produktionstechnik und Automatisierung: Delphi-Studie "Holzbearbei-
tungstechnologien 2015", 2005 57 Grote, K.-H.; Antonsson, E. K. (Eds.): Springer Handbook of Mechanical Engineering,
Springer, 2009, pp. 660-662

Final Report: Task 2 DG ENTR Lot 5
Page 86
and laser welding gain ground and are subject to intensive research work. Miniaturiza-tion drives the trend towards micro joining technologies. Research in joining technolo-gies currently focuses on highest-strength steel, light metals (aluminium and magnesi-um alloys) and mixed joints. Grote et al. state the following major trends regarding indi-vidual technologies:
• Gas-shielded arc welding retains a dominant position, but is likely not to grow as quickly as in the past years
• Resistance welding processes will hold a dominant position among joining pro-cesses given the high productivity and pr ocess performance, but will be re-placed for certain applications by mechanical joining technologies and adhesive bonding
• Laser beam welding processes are likely to gain increasing importance
Expectations for future technology development and application stated by companies surveyed by the German DVS are depicted in Figure 2-20, confirming the trends stated above.
Figure 2-20: Prospective development of joining processes
The forecasted increase in laser beam welding stems from improvements of the laser beam source: With an increase in the maximum power output, and improvements in the ability to focus the laser beam, new applications emerged in particular in the auto-motive sector, shipbuilding, and apparatus construction58.
58 Grote, K.-H.; Antonsson, E. K. (Eds.): Springer Handbook of Mechanical Engineering,
Springer, 2009, pp. 668

Final Report: Task 2 DG ENTR Lot 5
Page 87
2.3.4 Suppliers
System components for machine tools are of importance when investigating the indus-try structure of the machine tools industry. Key technology components comprise con-trol technology, pneumatic and hydraulic systems, spindles, drives, motors, bearings, gears, pumps, compressors, taps and valves. Iron and steel are typically the most rele-vant supply materials.
As most machine tools manufacturers are small and m edium sized enterprises, they are not capable of having all the technology know-how in-house for all the components and have to rely on numerous suppliers for key components and modules. Some ma-chine tools manufacturers even rather operate as a type of engineering company, as-sembling customized machines from components sourced from suppliers.
There are only a very limited number of relevant hardware suppliers for control tech-nology, i.e. Computer Numerical Controller (CNC): The market is dominated by Sie-mens, with global market share of 33,3 % in 2006, followed by Fanuc and Mitsubishi Electric with 32 % and 12,4 % respectively. Total global market size is 4,5 billion US-$59. A couple of smaller companies are also act ive in some market niches as sup-pliers of CNC technology, but their number and market share is rather limited60. A survey among CNC users in Germany revealed in 2007 the current usage of CNC systems: Being asked, w hat is the CNC system you are working most frequently w ith, 40,5% gave Heidenhain as a r eply, another 28,8% Siemens61, see Figure 2-21.
59 Tsakiridou, E.: The Buzz About Automation, Pictures of the Future, Fall 2007, p. 19 60 The leading German directory of suppliers „wer liefert was?“ lists as suppliers of control tech-
nology for machine tools in total 23 companies (as of March 2010) 61 Strutzke, A.: CNC-Marktstudie zeigt Anwenderwünsche, Marktstudie: MM Maschinenmarkt,
Internetforum CNC-Arena, Whitepaper, October 8, 2007, 1338 respondents covered with this survey, http://www.maschinenmarkt.vogel.de/index.cfm?pid=1610&pk=95048&icmp=aut-artikel-artikel-80

Final Report: Task 2 DG ENTR Lot 5
Page 88
Figure 2-21: CNC Systems in Use in Germany (2007) according to recent surveys
In the broader programmable logic controllers (PLCs) business with a size of 8,9 billion US-$ globally the hardware, software, and services market share of Siemens is 31,3 %, followed by Rockwell with 22,1 % and Mitsubishi with 12,7 %62,63, see Figure 2-22: 8 companies cover nearly 90% of the global market.
Figure 2-22: PLC Global market shares (2007)
The market for cooling lubricants is also dominated by few companies, among them Rhenus Lub with a 2009 production volume of 14.000 t (compare to totals of consump-tion as stated below), Fuchs, Henkel, SKF. Many of the manufacturers of cooling lubri-cants are based in the EU-27.
62 ARC Advisory Group, referenced in Rick Zabel: State of Manufacturing & Automation in the
U.S. Looks Good, July 30, 2008, automation.com, http://www.automation.com/content/state-of-manufacturing-and-automation
63 These figures refer to the PLC market in general, not only the machine tools market
Final Report: Task 2 DG ENTR Lot 5
Page 89
The machine tools industry furthermore is a supplier of its own: Machine tools are key to the manufacture of machine tools and components. The broad spectrum of special-ized machine tool manufacturers constitutes therefore also the base of investment good suppliers to this branch.
2.4 User expenditure base data
The objective of this subtask is to gather base data about user expenditure which will be used to calculate Life Cycle Costs (LCC).
There is no robust, comprehensive single source on life cycle costs for machine tools, but some exemplary calculations, indicating cost relations for some metal working ma-chine tools (but not to be considered as representative for the whole range of machine tools). LCC of a vertical machining-centre (3 axes) The CO$TRA project by PTW published an exemplary LCC calculation for a machining centre with following settings and assumptions64:
• Initial investment (purchase price, installation, start-up, initial set of tools and spare parts, training of operators): 198,000 Euro
• 2-shifts operation at 224 days/year (3,584 h/year) • Product: simple milled part, processing time 145 s, annual output 85,000 units • Assumed yield 99,99%, resulting in a m achine running time of 2,928 h/year,
remaining time (656 h/year) in standby • Power consumption (average, including cooling lubricant supply, exhaust sys-
tem): 22kW during operation, 11kW in standby. • Free warranty: 12 months, response time of service personnel: 12 hours • Unscheduled down times calculated with 75 Euro/hour (corresponding to the
hourly rate of an operator) • The calculation covers a period of 10 years
Total life cycle costs under these conditions are stated at 582,000 Euro, thereof 34% initial investment, 20% maintenance and planned overhauling, 15% unscheduled over-hauling, 17% energy costs, 5% pressurized air, 5% occupancy costs (building), 4% expenses for capital commitment. Costs for yield losses, tools and setup time are ex-plicitly not taken into account, furthermore the calculation does not state costs for mate-rial, personnel costs during operation and for cooling lubricants. 64 Dervisopoulos, M.: CO$TRA – Life Cycle Costs Transparent, Abschlussbericht, Kurzfassung,
PTW, Technische Universität Darmstadt, 2008, p. 26-27

Final Report: Task 2 DG ENTR Lot 5
Page 90
Life cycle costs are largely dependent on the individual use patterns. As a first approx-imation Abele et al.65 consider initial investment representing roughly 30% of total life cycle costs for a machine tool as appropriate, 10 years lifetime assumed. Another exemplary cost calculation by PTW for a machine tool states the following cost relations66:
• Initial investment: 100,000 Euro • Annual running costs: 39,000 Euro, thereof
o 8% expenses for capital commitment o 37% planned maintenance o 8% unscheduled overhaul o 6% occupancy costs o 21% electricity costs o 3% pressurized air o 16% cooling lubricant
Failure reasons for downtimes of machine tools have been analysed by Fleischer67: An analysis of representative field data unveiled, that that there are basically four main component groups responsible for most downtimes, in declining order of importance:
o drive axes, o spindle and tool changer, o electronics and o fluidics
As every downtime is a cost issue, maintenance and repair of these assemblies consti-tutes a major cost factor in terms of life cycle costs of machine tools.
65 Abele, E.; Dervisopoulos, M.; Kuhrke, B.: Bedeutung und Anwendung von Lebenszyklusana-
lysen bei Werkzeugmaschinen, in: Schweiger, S. (Edt.): Lebenszykluskosten optimieren – Paradigmenwechsel für Anbieter und Nutzer von Investitionsgütern, Gabler, Wiesbaden, 2009
66 Abele, E.: Begrüßung und Einstimmung, Symposium „Energieeffiziente Werkzeugmaschi-nen“, Düsseldorf, Germany, February 24, 2010; remark by Abele: 21% electricity costs ra-ther to be seen as a maximum value, not average
67 Fleischer, J.; Broos, A.; Schopp, M.; Wieser, J.; Hennrich, H.: Lifecycle-oriented component selection for machine tools based on multibody simulation and component life prediction, CIRP Journal of Manufacturing Science and Technology, Volume 1, Issue 3, 2009, p.179-184

Final Report: Task 2 DG ENTR Lot 5
Page 91
In the welding business workpiece related costs are determined by multiple factors. Some of these are related to investment and consumables, but in addition for the user it is important to consider other process related costs as listed in 68.
Table 2-33: Welding cost parameters
Preparatory costs Process and equipment related costs
Post-core-process costs
■ Time for joint prepa-ration.
■ Time to prepare the material for welding (blasting, removal of oils, etc.).
■ Time for assembly. ■ Time to preheat the
joint (when re-quired).
■ Time for tack-up. ■ Time for positioning.
■ Welding equipment invest. ■ Time for welding. ■ Time for changing electrodes. ■ Time to move the welder from
one location to another. ■ Time to change welding ma-
chine settings. ■ Cost of electrodes. ■ Cost of shielding materials. ■ Cost of electric power. ■ Cost of fuel gas for pre-heat
(when required).
■ Time to remove slag (when appli-cable).
■ Time to remove spatter.
■ Time for inspec-tion.
■ Time to repair or re-work defective welds.
■ Costs associated with any required stress relief.
2.4.1 Electricity, fuel and interest and inflation rates Eurostat provides data on electricity prices. Most recent ones for industrial customers are compiled for the second half of 2009 by EU-27 member state in Table 2-34. The EU-27 average electricity price for industrial customers was 0.0952 Euro/kWh in 2009. Electricity prices in the no. 2 machine tools consuming country Italy are significantly above the EU-27 average, partly by 30% and more, in Germany as no. 1 machine tools consuming country electricity tariffs are roughly 10% above average, similarly in Spain (no. 4), in Italy by even more than 30%. In the number 3 machine tools consuming country France the electricity tariffs are well below the EU-27 average. Between France and Italy there is a factor of more than 2, demonstrating the significant spread of elec-tricity prices across Europe. Smaller crafts enterprises for wood working (carpenter’s shops and the like) are in the 20 – 500 MWh/a range, the large brand name automotive manufacturers consume typ- 68 adapted from D.K. Miller: Determining the Cost of Welding, Welding Design & Fabrication,
March 1, 2004

Final Report: Task 2 DG ENTR Lot 5
Page 92
ically more than 150 000 MWh in their main production countries. A larger metal-working company such as Heidenhain with 3,000 employees and a production facility in Traunreut, Germany – actually also an important supplier for the machine tools industry itself – is in the 20 – 70 GWh range. The majority of small and medium sized metal and wood working companies can be assumed to be in the range of 500 – 2 000 MWh. In the case of Italy, there is a tendency towards even smaller companies, and thus an even lower power consumption range.
Table 2-34: Electricity Prices for Industrial Customers in EU-27, 2nd half 2009
Band IA
: < 20 M
Wh
Band IB
: 20 - 500 M
Wh
Band IC
: 500 - 2 000 M
Wh
Band ID
: 2 000 - 20 000 M
Wh
Band IE :
20 000 - 70 000 M
Wh
Band IF :
70 000 - 150 000 M
Wh
Band IG
: > 150 000 M
Wh
EU-27 0,1632 0,1198 0,1023 0,0911 0,0833 0,0758 : Belgium : : : : : : : Bulgaria 0,0767 0,0721 0,0639 0,0583 0,0516 0,0476 0,0476 Czech Republic 0,1720 0,1398 0,1122 0,0978 0,0912 0,0916 : Denmark 0,1800 0,0967 0,0927 0,0900 0,0820 0,0806 : Germany 0,1888 0,1323 0,1134 0,1007 0,0901 0,0861 : Estonia 0,0815 0,0693 0,0645 0,0572 0,0460 0,0461 : Ireland 0,1688 0,1406 0,1175 0,0971 0,0888 0,0788 : Greece 0,1540 0,1159 0,0936 0,0811 0,0729 0,0636 0,0595 Spain 0,1770 0,1335 0,1120 0,0934 0,0823 0,0709 0,0499 France 0,1158 0,0824 0,0656 0,0621 0,0628 0,0532 : Italy 0,2384 0,1530 0,1370 0,1224 0,1081 0,0888 0,0845 Cyprus 0,1563 0,1574 0,1494 0,1362 0,1221 0,1217 : Latvia 0,1161 0,0967 0,0893 0,0835 0,0767 0,0712 : Lithuania 0,1057 0,0921 0,0790 0,0666 0,0622 : : Luxembourg 0,1986 0,1312 0,1158 0,0936 0,0655 : : Hungary 0,1271 0,1226 0,1297 0,1146 0,1055 0,0877 0,0952 Malta 0,1460 0,1425 0,1291 0,0860 0,0860 0,0860 0,0860 Netherlands 0,2010 0,1450 0,1110 0,1010 0,0940 0,0920 0,0740 Austria : : : : : : : Poland 0,1455 0,1115 0,0933 0,0842 0,0803 0,0731 0,0779 Portugal 0,1613 0,1148 0,0944 0,0827 0,0692 0,0544 : Romania 0,1020 0,0970 0,0828 0,0714 0,0625 0,0571 : Slovenia 0,1641 0,1276 0,0962 0,0798 0,0748 0,0758 : Slovakia 0,2180 0,1673 0,1403 0,1263 0,1094 0,1011 0,0903 Finland 0,0837 0,0773 0,0683 0,0664 0,0552 0,0525 : Sweden 0,1166 0,0780 0,0689 0,0601 0,0560 0,0502 : United Kingdom 0,1379 0,1160 0,1012 0,0900 0,0867 0,0869 0,0781

Final Report: Task 2 DG ENTR Lot 5
Page 93
In Table 2-34 the most important countries / segments are market in bold for metal working companies and in italics for wood working companies. Roughly the “typical” electricity price for use of metal working machine tools is 0,11 Euro/kWh, for wood working machine tools 0,14 Euro/kWh.
For welding, soldering and brazing equipment a typical electricity price is much more difficult to state as the target sectors and enterprises cover an ev en broader spectrum from small-size to large industrial. Hence, the EU-27 average can be taken as an approximation with rounded 0,10 Euro/kWh.
Interest minus inflation is given as the discount rate, for which (currently) the value 4% is applied in line with Commission impact assessment practice.
2.4.2 Purchase Price
As a distinction of purchase prices for the various machine tools types the unit values as stated by EuroStat in the PRODCOM statistics and c hecked for plausibility by Fraunhofer are the best available approximation for “typical” purchase prices of ma-chine tools.
These unit values are listed in 2.1 Generic economic data:
• Metal working machine tools: Table 2-4, p. 12
• Wood working machine tools: Table 2-5, p. 18, and Table 2-6, p. 20
• Welding, soldering and brazing equipment: Table 2-7, p. 22
Despite all uncertainties of the EuroStat data this approach at least allows to estimate the order of magnitude for average purchase prices in each category. The unit values for some important product categories, indicating also the broad spread of machine tools and equipment, are as follows:
• Horizontal machining centres for working metal: 480,000 Euro
• Lathes, including turning centres: 380,000 Euro
• Hydraulic presses for working metal: 210,000 Euro
• Non-numerically controlled horizontal lathes for working metal: 24,000 Euro
• Multi-purpose machines where the workpiece is automatically transferred be-tween operations for working wood: 50,000 Euro
Final Report: Task 2 DG ENTR Lot 5
Page 94
• Band saws for working wood: 8,000 Euro
• Machinery for soldering, brazing, welding or surface tempering: 30,000 Euro
• (Other) shielded arc welding equipment: 600 Euro
For the various major branches, average unit values for machine tools (revision after plausibility check) are as follows:
• Metal working machine tools (NACE 28.41): 64,000 Euro
• Wood working machine tools (industrial stationary ones, NACE 28.49): 20,000 Euro
• Wood working machine tools (“light stationary”, i.e. transportable, NACE 28.49): 600 Euro
• Welding, soldering and brazing equipment (NACE 27.90, 28.29): 1,400 Euro
• Stone and ceramics working machine tools (NACE 28.49.11): 18,000 Euro
2.4.3 Consumables
2.4.3.1 Cooling lubricants
Consumption of cooling lubricants constitutes a major share of life cycle costs of many machine tools. Following a top-down-approach consumption is derived national from sales statistics: Table 2-35 lists the use of cooling lubricants in Germany in tonnes, based on data by the German BAFA69. These data show a high impact of the econom-ic cycles, specifically of the drastically reduced number of productive hours in 2009, resulting in a decreasing amount of cooling lubricant usage by 35-40% compared to 2008, although the stock of installed machine tools did not decrease in a similar way. Therefore, the 2008 data is closer to representativeness for consumption and costs of cooling lubricant use (and machine tools usage in industry in general) than the more recent year 2009.
69 Bundesamt für Wirtschaft und Ausfuhrkontrolle: Amtliche Mineralöldaten, BAFA Ref. 423

Final Report: Task 2 DG ENTR Lot 5
Page 95
Table 2-35: Use of Cooling Lubricants in Germany – BAFA data – mineral oil based
2009 2008 2007 2006 2005 2004 all lubricants [t] 862.381 1.109.383 1.149.432 1.173.850 1.023.044 1.039.680 of those, cooling lubri-cants [t]
42.029 65.777 72.308 67.821 75.701 73.856
non-water miscible CL [t]
24.779 38.370 41.532 38.339 45.094 46.846
water miscible CL (con-centrate) [t]
17.250 27.407 30.776 29.482 30.607 27.010
emulsions and solutions created from water-miscible CL [t]70
790.000 1.260.000 1.410.000
total amount of cooling lubricants used [t]
815.000 1.300.000 1.450.000
Given the fact that cooling lubricants are mainly used for metal working machine tools71 and that Germany consumes 41% of all metal working machine tools in EU 27, the consumption for EU 27 can be estimated based on the assumption, that the ratio of cooling lubricant usage in other EU 27 c ountries correlates in a similar way with the installed value of machine tools72. In 2009 the EU-27 usage of cooling lubricants for metal working machine tools is estimated at 161.000 t, thereof 94.000 t non-water mis-cible cooling lubricants and 67.000 t water-miscible cooling lubricants. The latter total roughly 3.1 million tonnes of emulsions and solutions.
Table 2-36: Use of Cooling Lubricants in EU-27 - estimate – mineral oil based
2009 2008 2007 2006 2005 2004 all lubricants [t] n.a. n.a. n.a. n.a. n.a. n.a. of those, cooling lubricants [t] 102.000 161.000 176.000 165.000 185.000 180.000 non-water miscible CL [t] 60.000 94.000 101.000 94.000 110.000 114.000 water miscible CL (concen-trate) [t]
42.000 67.000 75.000 72.000 75.000 66.000
emulsions and solutions cre-ated from water-miscible CL [t]
1.900.000 3.100.000 3.400.000
total amount of cooling lubri-cants used [t]
2.000.000 3.200.000 3.500.000
70 Domrös, R.; Spieß, G.; Mehr, G.: Sustainable Production – using minimal quantity lubrication,
SKF Evolution online, 2009; estimate for 2007, figures extrapolated for other years 71 Ratio of cooling lubricants usage per type of processed material is unknown, use for metal
processing is widespread, usage for processing of other hard materials, such as stone, ce-ramics, glass is relevant as well
72 i.e. multiplying the German consumption figures with 1/0,41. This approach neglects the economic differences in the various EU countries regarding degree of capacity utilization, types of production (e.g. volume production vs. single-part production, types of metals pro-cessed etc.), and the actual differences in distinct machinery installed.

Final Report: Task 2 DG ENTR Lot 5
Page 96
Typical prices for cooling lubricants (concentrates) are in the range of 3 – 8 Euro/l, de-pending on type, specification and order volume, package size. Assuming a price of 5 Euro/kg, the total sales volume for EU-27 for non-water miscible cooling lubricants was 470 million Euros in 2008, and for water miscible cooling lubricants another 330 million Euros. As cooling lubricants are typically used for processing of hard materials, such as met-als, stone, ceramics, the related costs are relevant for these two segments only. The total value of these machine tools categories for the 2009 sales (not stock), is 15 billion Euro. Compared to this figure a total sales volume of 800 million Euro for mineral oil based cooling lubricants seems reasonable. This also corresponds to industry sources73, stating that the proportion of costs in production for conventional cooling lubricants is in the range of 14-18% depending on the complexity of the components and that on average 10 % of workpiece-related costs are cooling lubricant costs re-spectively. A survey by Astakhov74 revealed, that metal working fluids (including the handling of these, such as supply system and disposal of residues etc.) are correlated with 8-10% of the manufacturing costs in such sectors as the automotive industry.
A typical CNC machine may use 10 to 10,000 l/h of cooling lubricant or related emul-sion depending on application. Whilst much is reconditioned and recycled, due to natu-ral wastage as aerosol spray into the atmosphere and adher ence to swarf, overall losses can amount to between 3 and 15 l/h75.
Other auxiliary substances, such as deep drawing lubricants and hydraulic oil for ma-chine tools are not yet considered, and so are the additional costs of lubricant man-agement (logistics, OHS measures, and disposal).
2.4.3.2 Welding, soldering and brazing consumables
Supplies, consumables and services for the joining industry, including welding filler materials, adjuvants, gases, protective clothing, testing machines and training services
73 See e.g: BILZ: General Information MQL, http://www.bilz.de/MMS_Vorteile.pdf; Domrös, R.;
Spieß, G.; Mehr, G.: Sustainable Production – using minimal quantity lubrication, SKF Evo-lution online, 2009
74 Astakhov, V.P.: Ecological Machining: Near-dry machining, in: Davim, J.P. (Edt.): Machining: Fundamentals and Recent Advances, Band 10, Springer, 2008
75 Hughes, J.: Minimum quantity cooling lubricants for CNC machinery, November 6, 2009, TheDailyEngineer.com

Final Report: Task 2 DG ENTR Lot 5
Page 97
constitute a 12.5 billion Euros production value in the EU-27 as of 200776. Germa-ny has the highest production value (€ 2.1 billion) closely followed by Italy (€ 1.8 billion) and France (€ 1.5 billion). Germany, France and Italy stand out with high production values for the manufacture of welding consumables (€ 576 million in Germany, € 312 million in France and € 303 million in Italy). The production values of welding gases are in the same order of magnitude in these countries.
Comparing the production value of devices and complementary joining technology goods for welding, soldering and brazing there is a relation of 12,5 billion Euros for consumables and the like to 7.5 billion Euros for devices, indicating also the fact, that in terms of total life cycle costs consumables for joining technologies are signif-icantly higher than the actual initial investment in equipment.
Welding gases comprise helium, argon, oxygen, nitrogen, hydrogen, carbon dioxide and hydrocarbons, such as acetylene, ethene, propene, propane, butane, methane. These constitute a relevant share of welding equipment usage costs, but vary broadly depending on type of gas and amount purchased.
Electrodes and welding wires respectively can be considered consumables, but it should be noted, that the material makes it into the final product. Depending on process, technology and application the deposition efficiency is a cost relevant fac-tor: The deposition efficiency is the relationship of the electrode used to the amount of the weld metal deposited.
2.4.4 Tools, Work Holders, Spare Parts EuroStat provides data for production of tools and parts for machine tools, which can be considered basically as initial sets of tools, spare parts and replacement parts. Not all of these parts are relevant for all types of machine tools. Table 2-37 provides a ma-trix where some major machine tool categories are correlated with the potentially cor-responded parts according to NACE nomenclature. The value of these parts and components in total for EU 27 production in 2008 is 7,6 billion Euros, compared to a sales volume (sold production) of 26,4 billion Euros for machine tools in the same year. This sounds reasonable, but it is clear, that costs for tools vary broadly, depending on the complexity of the product: Astakhov77 states a 76 Middeldorf, K.: The Economic Importance of Welding and Joining in Europe Production Val-
ues, Values Added and Employees, DVS, July 24, 2009 77 Astakhov, V.P.: Ecological Machining: Near-dry machining, in: Davim, J.P. (Edt.): Machining:
Fundamentals and Recent Advances, Band 10, Springer, 2008
Final Report: Task 2 DG ENTR Lot 5
Page 98
share of the tool costs for advanced power train plants to be in the range of 12-15% related to the high cost of gear manufacturing, and for simpler automotive plants domi-nated by turning and milling processes, such as shaft production, a cost range of direct tooling of 5-7% of manufacturing costs. For welding equipment the nozzles are relevant in particular as these are subject to wear and tear.

Final Report: Task 2 DG ENTR Lot 5
Page 99
Table 2-37: Major Machine Tools Categories and Corresponding Parts
EU27 Value in EUR (Production,
2008)
Selection of Machine Tools categories 28.41 / 28.49
28491233 28951140 28491263 28491279 28491237 28491170 28491130 28412233 28412235 28413470 28412470 28411220 28491235 28491250 28412223 28412395 28412375 28412490 28413160 28491287
28414030 Parts and accessories for metal cutting machine tools (excluding tool holders and self-opening dieheads, work holders, dividing heads and other special attachments for machine-tools)
2.728.072.081 x x x x x x x x
28414050 Parts and accessories for metal forming machine-tools (excluding tool holders and self-opening dieheads, work holders, dividing heads and other special attachments for machine-tools)
1.650.000.000 x x
28414070 Parts and accessories for machine-tools operated by ultrasonic processes 125.789.508
28492110 Arbors, collets and sleeves for machine-tools and hand tools 334.364.885 x x x x x x x x x x x x x x x x x x x
28492130 Tool holders for lathes (excluding arbors, collets and sleeves) 206.806.155 x x x x
28492140 Tool holders, self-opening dieheads and workholders of a kind used solely or principally for the manufacture of semiconductor boules or wafers, semiconductor devices, electronic integrated circuits or flat panel displays
58.264.769
28492150 Tool holders, n.e.c. 415.006.839 x x x x x x x x x x x x x x x x x x x
28492170 Self-opening dieheads for machine-tools and hand tools 6.183.170 x x
28492230 Jigs and fixtures for specific applications, and sets of standard jig and fixture components for machine-tools and hand tools
660.585.706 x x x x x x x x x x x x x x x x x x x
28492250 Work holders for lathes (excluding jigs and fixtures for specific applications, and sets of standard jig and fixture components)
321.898.858 x x x x
28492270 Work holders for machine-tools and hand tools (excluding jigs and fixtures for specific applications, and sets of standard jig and fixture components, those for lathes)
156.539.954 x x x x x x x x x x x x x x x x x x x
28492350 Dividing heads and other special attachments for machine-tools and hand tools 380.874.896 x x x x x x x x x x x x x x x x x x x
28492450 Parts and accessories for machines of HS 84.65 561.542.384 x x x x x x x x x
Totals 7.605.929.205

Final Report: Task 2 DG ENTR Lot 5
Page 100
3 Annex I – Stock model methodology
As no robust, detailed data on installed stock of machine tools, reflecting the definition of “machine tools” as provided in Task 1, for the relevant reference years 1995, 2009 and 2025 i s available, the stock model has to be based on available statistical data regarding production, sales, imports and exports, verified with additional evidence, and checked for plausibility.
3.1 Production
Starting point for the stock model are the PRODCOM production figures for 2009 as published by EuroStat.
• The plausibility check intends to identify the number of sold units, which are stationary or transportable units falling under the definition of “machine tools” as stated in Task 1 and to rule out all consumer products, misallo-cated parts and cases, where estimates by EuroStat result in non-plausible amounts of units
• A similar unit value for different countries serves as indication, that there is a similar understanding of the machinery grouped in this product class.
• In case the unit value differs among the countries, those market shares (eco-nomic value, not unit based) with a very low unit value (indicatively below 4.000 Euro for metal working machine tools) are not taken into account, as they pre-sumably do not represent industrial, stationary or transportable types of ma-chinery (but DIY, handheld, mobile units, parts). This approach does not allow for distinctions within one country, where possibly a huge diversity of machinery types are allocated to the same product class. In case there are larger differ-ences regarding the unit value among the market leading countries (indicatively difference of a factor of 4 or more) this is taken as an indication, that in these countries different types of machinery are allocated to this product class, and it might be needed t o subdivide this product class in two, reflecting the specifics of the different manufacturing markets. This split is depicted in the production figures only, but not subject to distinction in the stock model.
• If the EU-27 totals - in terms of units sold - are based on EuroStat estimates, it is checked whether non-confidential data from those countries with highest market shares justify roughly the EU-totals. Where the EU-27 totals are signifi-cantly higher than the aggregated value of the market leading countries, only the market share of these market leading countries is taken into consideration.

Final Report: Task 2 DG ENTR Lot 5
Page 101
This should result in a market coverage of at least 80% (economic value) for any given machine category.
• It is checked, whether the unit value (corrected, non-plausible market shares ruled out) reflects the likely sales prices of the machine tools likely to be cov-ered in this group. For this check, common understanding of the machine tools category and the indication numerically controlled / non-numerically controlled is the basis.
• Largest uncertainties remain, where major market shares are confidential (no economic value, no sold volume for important countries stated). The approach for these cases is to divide the EU27-total sold volume by estimated typical price (experts estimate or median value or similar). This approach works well for product categories, which are economically dominated by high value ma-chines, but is critical, if only a few high value machines are reported by the companies to these categories and the majority of total economic value is made up by low value units. Following the above approach of dividing the total eco-nomic volume by likely sales prices of “machine tools in scope” leads to an overestimate of total machine tools in the scope, neglecting that this total cate-gory leads to an underestimate of the total machine tools in scope.
• The resulting “level of plausibility” for each category is listed in the revised pro-duction tables and for clarity marked with the following colour code:
EU27-totals plausible as is adjustments of EU27-totals made or data uncertainties are obvious, but data base does not allow for a correction additional estimates required to fill data gaps / to rule out inappropriate data
This plausibility check by Fraunhofer was communicated with the relevant associations, inviting their market experts to counter-check the revised figures and to provide clarifi-cations on specific categories and country figures.
3.2 Import and Export – Installed New Stock
The calculation of installed new stock intends to quantify, how many machine tools in any given year are taken in operation in the EU-27.
Import and ex port figures are derived from the EU-27 figures provided by EuroStat. Data following NACE Rev. 2 are available for years since 1995. However, the figures for number of units of imported and ex ported are frequently implausible and t hus in general not suitable to calculate the installed new stock in EU-27. For several catego-
Final Report: Task 2 DG ENTR Lot 5
Page 102
ries reported exports (in terms of units) are much higher than imports and production, which is not logic at all. Hence, the new stock installed is re-calculated as follows:
• For the years 1995 – 2002 only EU-15 figures are reported. No extrapolation to EU-27 is applied for these years.
• Import and ex port figures are likely to include also larger numbers of used equipment, but this cannot be verified and is not taken into account.
• Production value plus import value minus export value is the anticipated eco-nomic value of newly installed machine tools in the EU-27
• For each year 1995-2009 the calculated economic value of newly installed ma-chine tools is divided by the production unit value. This approach neglects that exported machine tools are likely to be of a higher average value than imported ones, thus leading rather to an underestimate of installed new stock. Referring to a c alculated production unit value individually for each year takes into ac-count, that the production unit value is not constant, but subject to a trend to-wards more complex machine tools of higher value
• Following criteria are checked to verify, whether the resulting newly installed stock is plausible:
o Export value (significantly) smaller than production and import value for most years
o Overall low export and i mport figures, which means the more reliable production figures constitute the major share of newly installed stock, thus overall results are more robust
o Production quantity figures changes from year to year are plausible
o Resulting new stock value corresponds with economic cycles without major inconsistencies, new stock value year to year changes are not subject to excessive fluctuations
o New stock quantity roughly plausible in most years in relation to verified 2009 production data
o Production unit values plausible for most years (i.e. in the range of the 2009 figures, potentially with a tendency towards increasing unit values from year to year)

Final Report: Task 2 DG ENTR Lot 5
Page 103
• Due to a check against these criteria, occasionally adaptations where made to enhance plausibility of the data. These corrections include
o taking a plausible unit value also for years where reported unit values are implausible,
o taking a plausible production quantity where reported quantity does not match with data from other years
o for remaining cases approximation of newly installed stock with data from other years (potentially with an correction reflecting economic cy-cles)
For illustration, Table 3-1 provides the data subject to the plausibility check and verifi-cation for “28.41.21.40 Non-numerically controlled horizontal lathes, for removing met-al”.
Further adaptations have been made to approximate the economic conditions:
• EuroStat data is available on the EU15 level only up to 2002. Based on the data provided for 2003 and c onsecutive years for EU 15 and EU 27 correction fac-tors are introduced for some categories, where a major additional production, export to or import from the new member countries is evident.

Final Report: Task 2 DG ENTR Lot 5
Page 104
Figure 3-1: Metal working machine tools – newly installed stock 1995 - 2009
The newly installed stock of metal working machine tools exemplarily is depicted in Figure 3-1: The number of newly installed machine tools roughly remains stable, with a sharp decline in 2009 due to the economic crisis. The economic down-turn years 2002-2004 are also visible with this model. The particularly low values in 1995-1997 can partly be related to the economic situation, but even more to the fact, that 2 major product categories are not reported for these years (28.41.33.80 in greyish-blue, 28.41.23.85 in grey), thus not covered by the statistics. These findings confirm that the model for newly-installed stock is plausible and fluctuations are explainable.

Final Report: Task 2 DG ENTR Lot 5
Page 105
Table 3-1: Plausibility Check New Installed Stock “28.41.21.40 Non-numerically controlled horizontal lathes, for removing metal”
PRODCOM EuroStat data „as is“ Calculation and plausibility check Fraunhofer Data quality check Fraunhofer
PERIOD_LAB
EXPQN
T
EXPVAL
IMPQ
NT
IMPVAL
PRODQ
NT
PRODVAL
PROD unit value
new STO
CK quantity
new STO
CK value
new STO
CK quantity based on Production unit values
Correction
Quota IM
PVAL/PRODVAL
Quota EXPVAL/PRO
DVAL
2009 PROD plausible
EXPVAL < 60% in 12 years
EXPVAL < 45% in all years
IMPVAL < 40%
in 12 years IM
PVAL < 25% in all years
new STO
CK value corresponds with
economic cycles
new STO
CK value year to year changes w
/o major inconsistencies
new STO
CK quantity roughly plau-sible in several years
PROD unit values plausible in 12
no adjustments required
TOTAL data quality
1995 7995 73933000 31384 69508380 10609 181489039 17107 33.998 177.064.419 10.350 38% 41%
1 1 0 0 0 1 1 0 1 0 5
1996 6437 75129130 14213 72534220 7397 206477431 27914 15.173 203.882.521 7.304 35% 36% 1997 26646 69072900 22408 80535710 7147 173260692 24242 2.909 184.723.502 7.620 46% 40% 1998 4465 69949930 23982 102327040 7552 192074680 25434 27.069 224.451.790 8.825 53% 36% 1999 5158 58444290 18289 87277100 6631 213378397 32179 19.762 242.211.207 7.527 41% 27% 2000 4305 68819040 4019276 88987900 5793 204780910 35350 4.020.764 224.949.770 6.364 43% 34% 2001 9261 68304830 18433 94918010 17649 169561922 9607 26.821 196.175.102 6.942 PRODQNT
estimate: 6,000
56% 40%
2002 4331 58608280 17001 73712500 6047 140633821 23257 18.717 155.738.041 6.696 52% 42% 2003 10891 77799740 30530 48305250 9171 164184678 17903 28.810 134.690.188 7.524 29% 47% 2004 37216 65925900 22883 57745490 10508 147865481 14072 -3.825 139.685.071 9.927 39% 45% 2005 20293 69589130 27851 62309510 8460 149976369 17728 16.018 142.696.749 8.049 42% 46% 2006 9236 69762720 25430 56723430 8957 187925710 20981 25.151 174.886.420 8.336 30% 37% 2007 19743 78057640 73561 73115780 10027 227085195 22647 63.845 222.143.335 9.809 32% 34% 2008 59866 69736080 31369 83281410 10060 224730386 22339 -18.437 238.275.716 10.666 37% 31% 2009 3732 36611660 20365 34187170 5990 143325496 23927 22.623 140.901.006 5.889 24% 26%
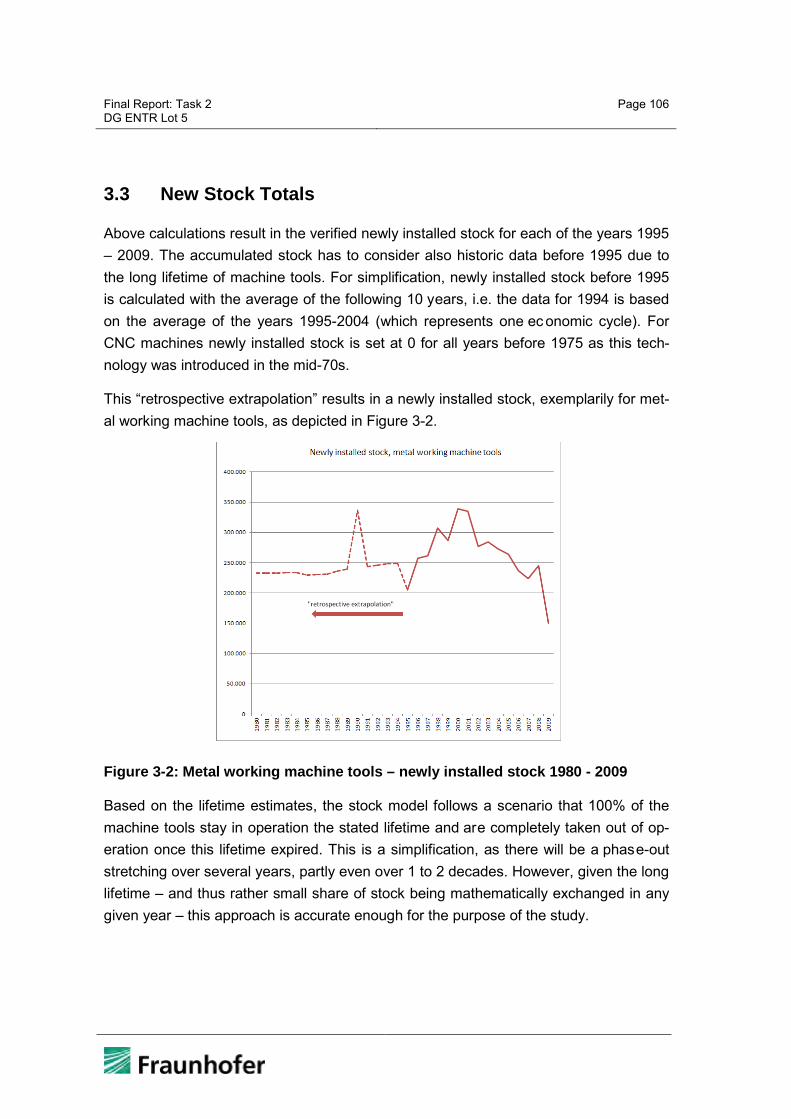
Final Report: Task 2 DG ENTR Lot 5
Page 106
3.3 New Stock Totals
Above calculations result in the verified newly installed stock for each of the years 1995 – 2009. The accumulated stock has to consider also historic data before 1995 due to the long lifetime of machine tools. For simplification, newly installed stock before 1995 is calculated with the average of the following 10 years, i.e. the data for 1994 is based on the average of the years 1995-2004 (which represents one ec onomic cycle). For CNC machines newly installed stock is set at 0 for all years before 1975 as this tech-nology was introduced in the mid-70s.
This “retrospective extrapolation” results in a newly installed stock, exemplarily for met-al working machine tools, as depicted in Figure 3-2.
Figure 3-2: Metal working machine tools – newly installed stock 1980 - 2009
Based on the lifetime estimates, the stock model follows a scenario that 100% of the machine tools stay in operation the stated lifetime and are completely taken out of op-eration once this lifetime expired. This is a simplification, as there will be a phase-out stretching over several years, partly even over 1 to 2 decades. However, given the long lifetime – and thus rather small share of stock being mathematically exchanged in any given year – this approach is accurate enough for the purpose of the study.

Final Report: Task 2 DG ENTR Lot 5
Page 107
The results of this stock model show a rather stable number of installed units, which leads vice versa to the conclusion, that a more distinct phase-out model stretching of several years phase-out time would not add any value to the findings.
Further adaptations have been made to approximate the economic conditions:
• Given the steady replacement of non-CNC machine tools by CNC machine tools in recent decades it was assumed, that the lifetime of non-CNC machine tools in the economic recession 2002-2004 was reduced by 3 years (by taking over capacity machine tools out of operation)
• As an approximation of the historic development of installed CNC machine tools before 1995, for which no EuroStat data was extracted, an annual growth rate of 11,4% (according to German machine tools surveys in 1985 and 1995) was anticipated
• The economic boom of the late 1980s / early 1990s is addressed with a factor of 1,5 applied to the new stock installed in 1990 (adaptation of the retrospective extrapolation of stock data)
3.4 PRODCOM 2010 update
In the course of the study, new PRODCOM data became available for 2010 production, imports and exports. Table 3-2 lists in the right column the new calculated stock for 2010 based on t he aforementioned stock model, which takes into account real PRODCOM data until 2009, and the 2010 data based on recently reported PRODCOM figures (calculating new stock based on reported 2010 production, import and export data; rules for plausibility checks apply). It is obvious that there are major deviations due to the inherent limitations of the Eurostat data, but in general the order of magni-tude is confirmed. For metal working machine tools in most categories the PRODCOM based figures are 20-60% lower, which is not surprising, as 2010 has been affected by the economic crisis. Hence, new stock is logically lower than the estimation based on the Fraunhofer stock model, which does not consider the economic cycles (as these cycles cannot be predicted with a 2025 horizon, in any case).
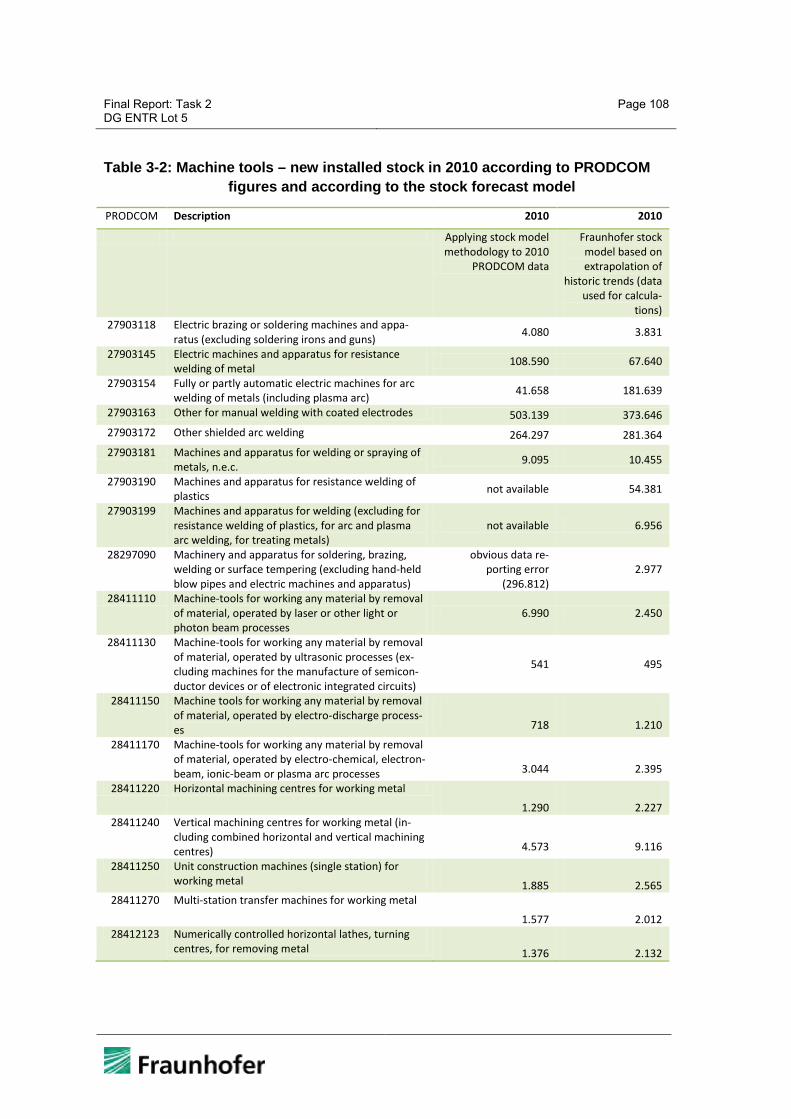
Final Report: Task 2 DG ENTR Lot 5
Page 108
Table 3-2: Machine tools – new installed stock in 2010 according to PRODCOM figures and according to the stock forecast model
PRODCOM Description 2010 2010
Applying stock model methodology to 2010
PRODCOM data
Fraunhofer stock model based on extrapolation of
historic trends (data used for calcula-
tions) 27903118 Electric brazing or soldering machines and appa-
ratus (excluding soldering irons and guns) 4.080 3.831
27903145 Electric machines and apparatus for resistance welding of metal 108.590 67.640
27903154 Fully or partly automatic electric machines for arc welding of metals (including plasma arc) 41.658 181.639
27903163 Other for manual welding with coated electrodes 503.139 373.646 27903172 Other shielded arc welding 264.297 281.364 27903181 Machines and apparatus for welding or spraying of
metals, n.e.c. 9.095 10.455
27903190 Machines and apparatus for resistance welding of plastics not available 54.381
27903199 Machines and apparatus for welding (excluding for resistance welding of plastics, for arc and plasma arc welding, for treating metals)
not available 6.956
28297090 Machinery and apparatus for soldering, brazing, welding or surface tempering (excluding hand-held blow pipes and electric machines and apparatus)
obvious data re-porting error
(296.812) 2.977
28411110 Machine-tools for working any material by removal of material, operated by laser or other light or photon beam processes
6.990 2.450
28411130 Machine-tools for working any material by removal of material, operated by ultrasonic processes (ex-cluding machines for the manufacture of semicon-ductor devices or of electronic integrated circuits)
541 495
28411150 Machine tools for working any material by removal of material, operated by electro-discharge process-es
718 1.210
28411170 Machine-tools for working any material by removal of material, operated by electro-chemical, electron-beam, ionic-beam or plasma arc processes 3.044 2.395
28411220 Horizontal machining centres for working metal
1.290 2.227 28411240 Vertical machining centres for working metal (in-
cluding combined horizontal and vertical machining centres) 4.573 9.116
28411250 Unit construction machines (single station) for working metal 1.885 2.565
28411270 Multi-station transfer machines for working metal
1.577 2.012 28412123 Numerically controlled horizontal lathes, turning
centres, for removing metal 1.376 2.132

Final Report: Task 2 DG ENTR Lot 5
Page 109
28412127 Numerically controlled horizontal lathes, automatic lathes, for removing metal (excluding turning cen-tres) 2.837 4.065
28412129 Numerically controlled horizontal lathes, for remov-ing metal (excluding turning centres, automatic lathes) 1.032 2.828
28412140 Non-numerically controlled horizontal lathes, for removing metal 4.442 7.301
28412160 Lathes, including turning centres, for removing metal (excluding horizontal lathes) 1.580 2.964
28412213 Numerically controlled drilling machines for work-ing metal (excluding way-type unit head machines) 456 832
28412217 Numerically controlled knee-type milling machines for working metal (excluding boring-milling ma-chines) 210 394
28412223 Numerically controlled tool-milling machines for working metal (excluding boring-milling machines, knee-type machines) 1.708 3.064
28412225 Numerically controlled milling machines for work-ing metal (including plano-milling machines) (ex-cluding boring-milling machines, knee-type, tool-milling machines)
1.644 1.432
28412235 Non-numerically controlled drilling machines for working metal (excluding way-type unit head ma-chines) 5.454 18.675
28412240 Numerically controlled boring and boring-milling machines for working metal (excluding drilling machines) 272 1.026
28412260 Non-numerically controlled boring and boring-milling machines for working metal (excluding drilling machines) 60 133
28412270 Non-numerically controlled milling machines for working metal (excluding boring-milling machines) 3.548 596
28412280 Threading or tapping machines for working metal (excluding drilling machines) 10.237 10.187
28412305 Numerically controlled flat-surface grinding ma-chines for working metal, in which the positioning in any one axis can be set up to a minimum accura-cy of 0.01mm
540 1.052
28412315 Numerically controlled cylindrical surface grinding machines for working metal, in which the position-ing in any one axis can be set up to a minimum accuracy of 0.01mm
437 995
28412325 Other numerically controlled grinding machines in which the positioning in any one axis can be set up to accuracy >0.01mm 42 293
28412345 Non-numerically controlled cylindrical surface grinding machines for working metal, in which the positioning in any one axis can be set up to a mini-mum accuracy of 0.01mm
256 332
28412355 Grinding machines for working metal; any one axis can be set to an accuracy >=0.01mm excluding flat-surface grinding machines, cylindrical surface grind-ing machines
2.087 1.869
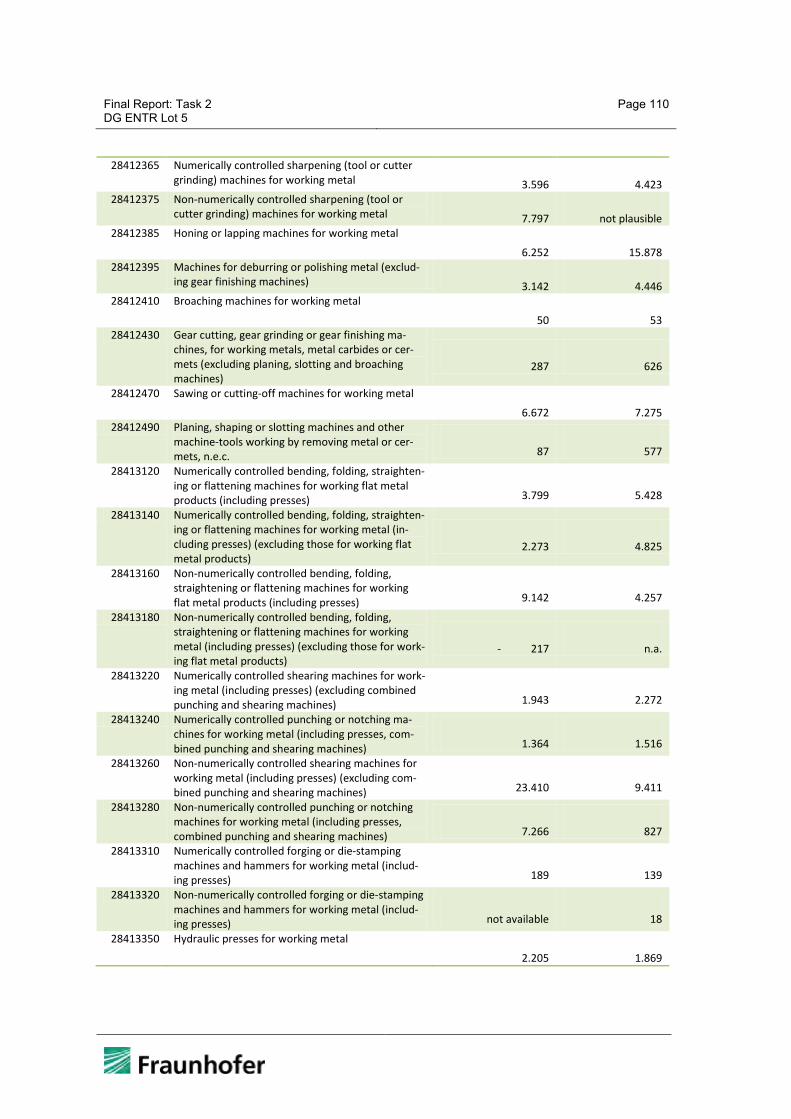
Final Report: Task 2 DG ENTR Lot 5
Page 110
28412365 Numerically controlled sharpening (tool or cutter grinding) machines for working metal 3.596 4.423
28412375 Non-numerically controlled sharpening (tool or cutter grinding) machines for working metal 7.797 not plausible
28412385 Honing or lapping machines for working metal
6.252 15.878 28412395 Machines for deburring or polishing metal (exclud-
ing gear finishing machines) 3.142 4.446 28412410 Broaching machines for working metal
50 53 28412430 Gear cutting, gear grinding or gear finishing ma-
chines, for working metals, metal carbides or cer-mets (excluding planing, slotting and broaching machines)
287 626
28412470 Sawing or cutting-off machines for working metal
6.672 7.275 28412490 Planing, shaping or slotting machines and other
machine-tools working by removing metal or cer-mets, n.e.c. 87 577
28413120 Numerically controlled bending, folding, straighten-ing or flattening machines for working flat metal products (including presses) 3.799 5.428
28413140 Numerically controlled bending, folding, straighten-ing or flattening machines for working metal (in-cluding presses) (excluding those for working flat metal products)
2.273 4.825
28413160 Non-numerically controlled bending, folding, straightening or flattening machines for working flat metal products (including presses) 9.142 4.257
28413180 Non-numerically controlled bending, folding, straightening or flattening machines for working metal (including presses) (excluding those for work-ing flat metal products)
- 217 n.a.
28413220 Numerically controlled shearing machines for work-ing metal (including presses) (excluding combined punching and shearing machines) 1.943 2.272
28413240 Numerically controlled punching or notching ma-chines for working metal (including presses, com-bined punching and shearing machines) 1.364 1.516
28413260 Non-numerically controlled shearing machines for working metal (including presses) (excluding com-bined punching and shearing machines) 23.410 9.411
28413280 Non-numerically controlled punching or notching machines for working metal (including presses, combined punching and shearing machines) 7.266 827
28413310 Numerically controlled forging or die-stamping machines and hammers for working metal (includ-ing presses) 189 139
28413320 Non-numerically controlled forging or die-stamping machines and hammers for working metal (includ-ing presses) not available 18
28413350 Hydraulic presses for working metal
2.205 1.869
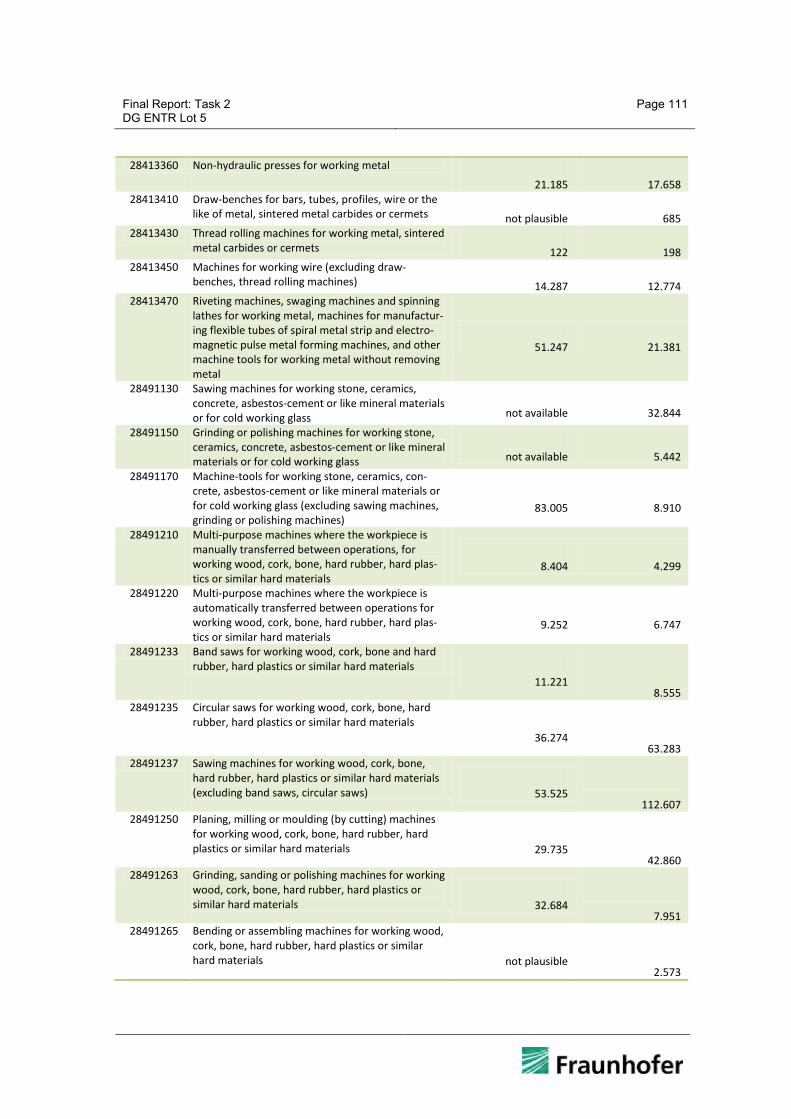
Final Report: Task 2 DG ENTR Lot 5
Page 111
28413360 Non-hydraulic presses for working metal
21.185 17.658 28413410 Draw-benches for bars, tubes, profiles, wire or the
like of metal, sintered metal carbides or cermets not plausible 685 28413430 Thread rolling machines for working metal, sintered
metal carbides or cermets 122 198 28413450 Machines for working wire (excluding draw-
benches, thread rolling machines) 14.287 12.774 28413470 Riveting machines, swaging machines and spinning
lathes for working metal, machines for manufactur-ing flexible tubes of spiral metal strip and electro-magnetic pulse metal forming machines, and other machine tools for working metal without removing metal
51.247 21.381
28491130 Sawing machines for working stone, ceramics, concrete, asbestos-cement or like mineral materials or for cold working glass not available 32.844
28491150 Grinding or polishing machines for working stone, ceramics, concrete, asbestos-cement or like mineral materials or for cold working glass not available 5.442
28491170 Machine-tools for working stone, ceramics, con-crete, asbestos-cement or like mineral materials or for cold working glass (excluding sawing machines, grinding or polishing machines)
83.005 8.910
28491210 Multi-purpose machines where the workpiece is manually transferred between operations, for working wood, cork, bone, hard rubber, hard plas-tics or similar hard materials
8.404 4.299
28491220 Multi-purpose machines where the workpiece is automatically transferred between operations for working wood, cork, bone, hard rubber, hard plas-tics or similar hard materials
9.252 6.747
28491233 Band saws for working wood, cork, bone and hard rubber, hard plastics or similar hard materials
11.221
8.555 28491235 Circular saws for working wood, cork, bone, hard
rubber, hard plastics or similar hard materials 36.274
63.283 28491237 Sawing machines for working wood, cork, bone,
hard rubber, hard plastics or similar hard materials (excluding band saws, circular saws) 53.525
112.607 28491250 Planing, milling or moulding (by cutting) machines
for working wood, cork, bone, hard rubber, hard plastics or similar hard materials 29.735
42.860 28491263 Grinding, sanding or polishing machines for working
wood, cork, bone, hard rubber, hard plastics or similar hard materials 32.684
7.951 28491265 Bending or assembling machines for working wood,
cork, bone, hard rubber, hard plastics or similar hard materials not plausible
2.573
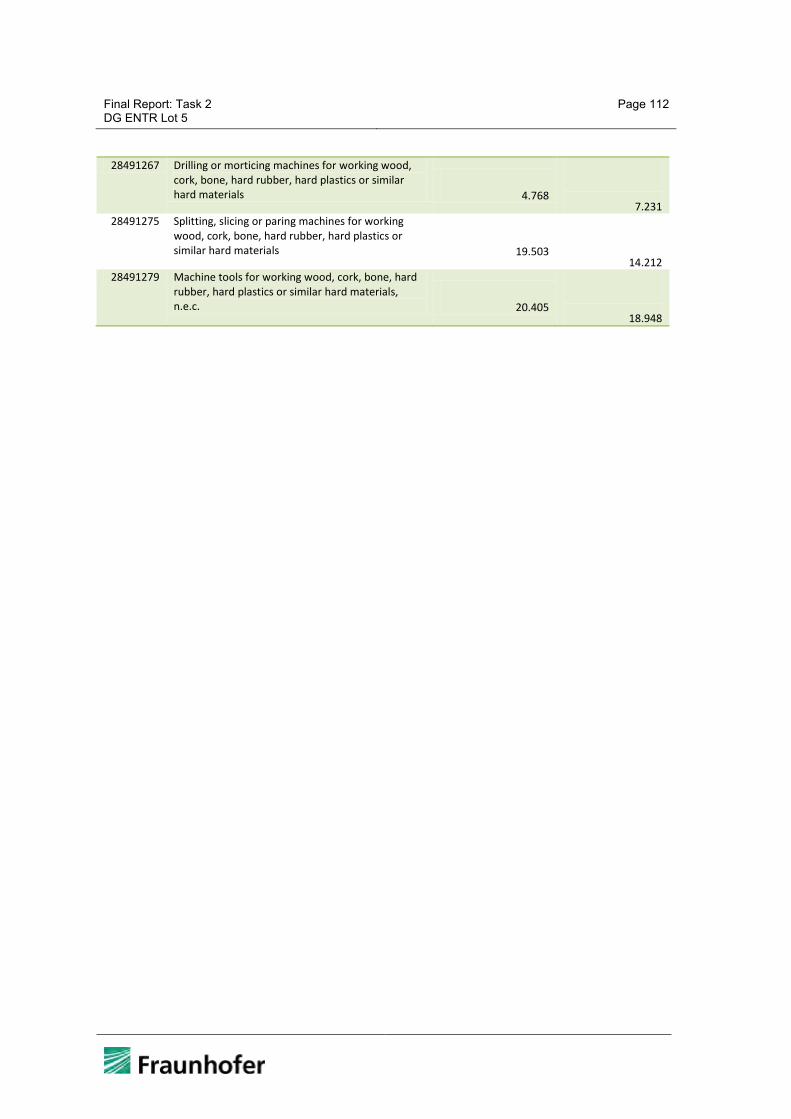
Final Report: Task 2 DG ENTR Lot 5
Page 112
28491267 Drilling or morticing machines for working wood, cork, bone, hard rubber, hard plastics or similar hard materials 4.768
7.231 28491275 Splitting, slicing or paring machines for working
wood, cork, bone, hard rubber, hard plastics or similar hard materials 19.503
14.212 28491279 Machine tools for working wood, cork, bone, hard
rubber, hard plastics or similar hard materials, n.e.c. 20.405
18.948