energy use of integral refrigerated containers in maritime
TRANSCRIPT

Personal revised version of:
Fitzgerald et al. (2011), Energy use of integral refrigerated containers in maritime
transportation. Paper to appear in Energy Policy 39(4):1885-1896. NOTE: Final official
version can be found using the Digital Object Identifier (DOI) listed here:
doi:10.1016/j.enpol.2010.12.015
1
Energy use of integral refrigerated containers in
maritime transportation
Warren B. Fitzgerald1, Oliver J. A. Howitt
1, Inga J. Smith
1*, Anthony Hume
2.
1. Department of Physics, University of Otago, P.O. Box 56, Dunedin, New Zealand
2. Landcare Research, P. O. Box 40, Lincoln, 7640, New Zealand.
* Corresponding author
Tel.: +64 3 479 7755
Fax: +64 3 479 0964
E-mail address: [email protected]
Abstract
The global trading of perishable goods is possible through the application of product
refrigeration and atmospheric control during transportation. A mean energy consumption rate
of 2.7 kW/TEU was assumed in this study, but was found to have potential variations of
around ± 60%. New Zealand‘s maritime trade was considered as a case study for the year
2007 to place the effect of refrigerated transport in context. For individual refrigerated
containers, approximately 19% of the energy use related to its journey is used for refrigeration
purposes. In 2007, approximately 18% and 61% of New Zealand‘s imported and exported
food products by mass, respectively, required some form of refrigeration during
transportation. Maintaining the refrigerated state of imports and exports to and from New
Zealand during maritime transportation consumed approximately 280 GWh of electricity.
Assuming all this electricity was generated onboard vessels using auxiliary engines,
approximately 61 kt of fuel was consumed and 190 kt of CO2 produced. Refrigeration is of
particular importance to the many greenhouse gas or carbon footprinting studies conducted
around the world. Implications are discussed in the context of greenhouse gas emissions from
the transport of apples from NZ to the UK and long-term storage of UK apples.
Keywords
Refrigerated shipping containers; carbon footprinting; greenhouse gas emissions.
1. Introduction
1.1 Policy Context
The electricity used to power refrigerated containers in the maritime transport industry
is generated mainly through the combustion of fossil fuels, which produces emissions that

Personal revised version of:
Fitzgerald et al. (2011), Energy use of integral refrigerated containers in maritime
transportation. Paper to appear in Energy Policy 39(4):1885-1896. NOTE: Final official
version can be found using the Digital Object Identifier (DOI) listed here:
doi:10.1016/j.enpol.2010.12.015
2
contribute to anthropogenic climate change (Buhaug et al., 2009; Corbett and Koehler, 2003).
These greenhouse gas emissions include carbon dioxide (CO2), sulphur dioxide (SO2),
nitrogen oxides (NOX), hydrocarbons (HCs) and particulate matter (PM). During their
lifetime, refrigerated containers also release refrigerants that can act as greenhouse gases.
Greenhouse gas footprinting, which is more commonly known as carbon footprinting,
has come to prominence in recent years as large retail chains, mostly in Europe, have sought
to verify the environmental attributes of the products sold, in the face of heightened consumer
interest. Carbon footprinting studies involve quantifying the amount of greenhouse gas
emissions produced throughout the lifecycle of individual products and are often presented in
terms of CO2-equivalent emissions. Carbon footprinting studies, among other things,
therefore provide a major reason to ensure that the effects of refrigeration during
transportation are well understood and quantified.
Refrigeration is used to maintain the integrity of perishable goods for extended periods
of time, thereby allowing them to be transported further. In general, the less processed certain
commodities are, the more rapidly they are likely to spoil, and therefore the greater benefit
they would receive from refrigeration during transportation. According to Jolly et al. (2000),
approximately 31% of the world‘s food supply chain requires refrigerated transport.
Understanding refrigeration and its impacts is therefore an important part of research into
present day world food supplies. Work by Landcare Research in the course of completing
carbon footprinting studies suggests there are several market reasons when refrigeration of
processed food chains is significant. For example, delivery of frozen and chilled products is
an important part in the reassurance of customers of product quality within a number of
processed food product supply chains. In 2007, 98% of all New Zealand‘s refrigerated
maritime imports and exports by mass were food products fit for human consumption, with
much of the remainder being medical supplies.
As a case study, refrigerated cargo transported by sea to or from New Zealand during
2007 has been analysed to place refrigeration energy consumption in context. Because of New
Zealand‘s geographical isolation, all commodities that are traded internationally must be
transported by either air or sea to reach their destination. In 2007, 99.5% of all products by
mass were imported to or exported from New Zealand by sea (Statistics New Zealand, 2007).
According to the Statistics New Zealand figures, four of the top seven New Zealand exports
by value in 2009 required some degree of refrigeration during transportation. These
refrigerated commodities, in order of decreasing export value, were: dairy, meat, fruit, and
fish and together totalled NZ$17.4 billion in value, 40% of New Zealand‘s total export value
in 2009 (Statistics New Zealand, 2010a). This shows the importance of refrigerated transport
in maintaining New Zealand‘s international trade and economy.
The main objective of this study was therefore to quantify the energy consumption, and
associated greenhouse gas emissions, resulting from maintaining the refrigerated condition of
various products during their transportation. New Zealand shipping was used as a case study
due to the importance of both refrigerated and maritime transport on New Zealand‘s
international trade and economy.

Personal revised version of:
Fitzgerald et al. (2011), Energy use of integral refrigerated containers in maritime
transportation. Paper to appear in Energy Policy 39(4):1885-1896. NOTE: Final official
version can be found using the Digital Object Identifier (DOI) listed here:
doi:10.1016/j.enpol.2010.12.015
3
1.2 Refrigerated Maritime Transport
The majority of international maritime cargo, by mass, is currently transported around
the world in standardised containers due to their versatility and intermodal capability. There is
a standardised unit for measuring the size of these containers, as well as the facilities
equipped to handle them. The containers are known as twenty-foot equivalent units (TEUs),
and measure 6.1 m (20 ft) long, 2.4 m (8 ft) wide and have an internal volume of
approximately 27 m3.
One of the main non-motive energy loads that may be experienced when transporting
cargo is that required to maintain the refrigerated state of certain products. Refrigerated cargo
can either be transported in specialised containers, or in the bulk holds of dedicated
refrigerated cargo ships. In the year 2000, approximately half of the world‘s maritime
refrigerated goods were transported by each method, although there is currently a clear trend
towards increased containerisation (Wild, 2009). For this reason, very few refrigerated cargo
ships are currently being built, and efforts are instead being focused towards increasing
container vessels‘ ability to carry refrigerated containers. As an initial approximation, the
current study into refrigerated transport therefore assumes that all refrigerated cargo is
shipped in refrigerated containers. This approximation will be discussed later with respect to
the results of this study.
Refrigerated containers are known as ―reefers‖ and are mostly integral units (self-
contained) which means that they incorporate a mechanical vapour compression refrigeration
unit into an insulated container. These reefers only require an external source of electricity to
run the refrigeration system and remove heat from the internal environment of the container.
Another type of reefer is known as a porthole container, which are standard insulated
containers with two openings (portholes) in one end. The vessels on which these porthole
reefers are transported have large centralised refrigeration units that produce cooled air which
is circulated through the containers via the openings. In the late 1990s, it was decided to phase
out porthole containers in favour of the more convenient, but higher maintenance and more
energy intensive, integral containers (Wild, 2009). The last vessel to be built with porthole
capabilities was completed in 1995. New Zealand was one of the first countries to be affected
by this transition, with most porthole services being removed by 2002, and global porthole
services being converted by 2008 (Port Otago, pers. comm. 1 May 2009; Wild, 2009).
During transportation, fresh fruits and vegetables tend to be stored at around 10°C;
chilled fruits and vegetables, as well as fresh meats and fish products, are stored around 0°C;
and frozen meats and fish are stored at around -20°C (Maersk Line, n.d; CMA CGM, n.d).
The amount of energy which is consumed by a reefer will change depending on many
external variables. These include the ambient air temperature and humidity, the location of the
reefer onboard the ship, the age of the container, the refrigerant being used, and any new or
specific refrigeration technologies being used. Reefers have the potential to operate in
different modes depending on whether they contain frozen goods (below approximately
minus 10°C) or chilled goods (above approximately minus 10°C). In frozen mode, small

Personal revised version of:
Fitzgerald et al. (2011), Energy use of integral refrigerated containers in maritime
transportation. Paper to appear in Energy Policy 39(4):1885-1896. NOTE: Final official
version can be found using the Digital Object Identifier (DOI) listed here:
doi:10.1016/j.enpol.2010.12.015
4
fluctuations in temperature are insignificant and therefore the cooling compressor can be
switched on and off to regulate the internal temperature (Wild, 2009). This process is known
as a duty cycle and helps to save energy as well as control the temperature. Internal air
circulation fans are also operated at half speed in frozen mode, which can reduce the power
consumption of the fans by a factor of eight (Wild, 2009). In chilled mode however, precise
temperature regulation is needed to ensure the contained goods are not damaged or ripen too
quickly. Circulating fans are consequently operated at full speed to improve the heat
distribution within the container, and the cooling compressor runs continuously. Refrigeration
performance is therefore regulated by a hot gas bypass or by varying the refrigerant
compression through means such as throttling the gas suction line or opening the scroll spiral
(Wild, 2009). Biotic activity in certain chilled cargo also results in the production of CO2 and
ethylene from the respiring products. These are removed from the internal environment by
exchanging air with the external environment and introducing fresh air through specific vents.
It is generally observed that the higher the internal set-temperature of the container, the higher
the electrical power consumption of the reefer (Wild, 2009; Wild et al., 1999; Jolly et al.,
2000). Operating containers in either chilled or frozen mode requires regular defrosting of the
refrigerant evaporator. Defrosting is done because built up ice inhibits heat transfer in the unit
(Wild, 2009). The process for removing the ice involves shutting down both the compressor
and circulating fan, and electrically heating the evaporator and drip tray. This process can also
be undertaken with the circulation fans operating to increase the internal temperature of the
container if required. These factors, along with the mechanical set-up of the refrigeration unit,
will alter the rate at which reefers consume energy.
Several studies have investigated the energy consumed by refrigerated containers under
given conditions for a fixed time, however, these studies are not easily extrapolated to a large
scale (Jolly et al., 2000; Wild et al., 1999; Wild, 2009). Manufacturer‘s data for a Thermo
King Smart Reefer states that at an ambient temperature of 37.8°C, power consumption will
vary from 5.3 kW to 10.7 kW with a variation in set point temperature of -29°C to +21°C,
respectively (as cited in Wild et al., 1999; Wild, 2009). A detailed performance simulation
conducted by Jolly et al. (2000) reveals the complexity of modelling the energy consumption
of a refrigeration unit which is subject to dynamic conditions. The simulation involved
maintaining the ambient temperature at a fixed 38°C while varying the internal set
temperature and evaporator fan speed. The results of this experiment and the associated model
gave power consumption values of between 4.42 kW and 8.63 kW for temperatures ranging
from -18°C to +13.4°C, respectively (Jolly et al., 2000). One cautionary issue associated with
this study, as well as the Thermo King data, are that the results represent instantaneous values
and do not take into account the reefer‘s duty cycle. These tests have also been conducted in
controlled environments and therefore neglect several important variables of real world use,
such as stacking configurations of containers and variations in the ambient weather
conditions.
Average electrical energy consumption values were calculated in Wild et al. (1999) by
conducting a statistical analysis on the energy usage of approximately 2300 TEUs. Results

Personal revised version of:
Fitzgerald et al. (2011), Energy use of integral refrigerated containers in maritime
transportation. Paper to appear in Energy Policy 39(4):1885-1896. NOTE: Final official
version can be found using the Digital Object Identifier (DOI) listed here:
doi:10.1016/j.enpol.2010.12.015
5
showed that the mean energy consumption values were around 4 kW in twenty-foot
containers and 7 kW in forty-foot containers (equivalent to two TEU). Due to the combination
of 20 ft and 40 ft containers, the overall mean rate of energy consumption was around 3.6 kW
per TEU (Wild et al., 1999). This mean energy consumption rate was revised by Wild (2008)
to 2.7 kW/TEU. The absolute energy required to power reefers is, amongst other things, a
function of the duration of their journeys, which depends on both the distance between origin
and destination and the vessel‘s cruising speed.
Creating a generic model to estimate the rate of energy consumed by refrigerated
containers is extremely difficult due to the large range of inputs which affect their overall
performance. These factors include mechanical and thermal performances (related to
container age and manufacturer), ambient air temperature and humidity, internal set point
temperature and humidity, fresh air exchange, maintenance regime and duty cycle. Most of
these variables are related to specific containers and user-selected set points, for which there
are no industry standards. Variations in the set point conditions of similar commodities exist
even within a single exporting company, depending on the maturity of the products (Harvest
Fresh, pers. comm. 15 June 2009; Zespri, pers. comm. 16 June 2009; Maersk Line, n.d; CMA
CGM, n.d). James et al. (2006) details other factors that would affect a container‘s energy
consumption and would be difficult to model. These include the amount of solar radiation
incident on the outside of a container and accounting for the heat produced by other
refrigerated containers in various stacking configurations.
2. Methodology
2.1 Equations
In order to place the effects of refrigeration in context, a comparison has been made
between the energy consumed by refrigeration and that required for motive power during
product transportation. A full discussion of the methodology and results for all New Zealand‘s
imports and exports is beyond the scope of the current paper, but will appear in the peer-
reviewed literature as Fitzgerald et al. (in press).
In this particular study, Eq. (1) was used to calculate the fuel consumption estimates for
both main and auxiliary engines for each individual product‘s journey for all plant, animal,
and food products. This equation was adapted from the methodology used in Buhaug et al.
(2009).
Um
mSFOCMCR
v
DPFC
Total
NZ% (1)
Where:
Personal revised version of:
Fitzgerald et al. (2011), Energy use of integral refrigerated containers in maritime
transportation. Paper to appear in Energy Policy 39(4):1885-1896. NOTE: Final official
version can be found using the Digital Object Identifier (DOI) listed here:
doi:10.1016/j.enpol.2010.12.015
6
FC is the fuel consumption in grams (g);
P is the maximum installed engine power of the main or auxiliary engine(s) in kilowatts
(kW);
D is the distance travelled by the vessel in nautical miles (nm);
v is the mean cruise speed of the vessel in knots (nm/hr);
%MCR is the mean load on the main or auxiliary engine(s) as a fraction of the engines‘
maximum installed engine power, where MCR stands for ‗Maximum Continuous Rate‘;
SFOC is the specific fuel-oil consumption rate, in grams of fuel consumed per kilowatt-hour
of engine output (g/kWh);
mNZ is the mass of individual products imported to or exported from New Zealand onboard
each vessel voyage in tonnes (t);
mTotal is the maximum cargo capacity of each vessel in tonnes (t);
U is the mean utilisation fraction of each vessel‘s cargo capacity, which Buhaug et al. (2009)
calculated by dividing the mean total mass of all cargo onboard a vessel by its maximum
cargo capacity (i.e., how heavily loaded the vessel was).
The fuel consumption for each product‘s journey was summed over all journeys. From
this, the emissions of each pollutant could be calculated by using Eq. (2), below.
XTotalX EFFCE (2)
Where:
EX is the total emission of pollutant X in grams (g);
FCTotal is the total fuel consumption in grams (g);
EFX is the emissions factor for pollutant X in grams of pollutant per grams of fuel
consumed (g/g).
2.2 Data sources and derived information of ships and cargo
Details of all plant, animal, and food products that were imported to, or exported from,
New Zealand by sea in 2007 were sourced from product declarations (PD) lodged with the
New Zealand Customs Service. Based on the harmonised system code chapter descriptions
(Statistics New Zealand, 2010b) and a preliminary investigation of refrigerated products, it
was considered that all refrigerated items were contained within the first 21 chapters (see
Appendix). Amongst other things, the data included the origin and destination of products,
and the vessel used to transport them to or from New Zealand.
Information derived from the ‗Advance Notice of Arrival‘ (ANA) forms lodged with
the New Zealand Customs Service gave each vessel‘s previous/next overseas country and port
visited before/after entering New Zealand. Combining these datasets allowed a distance to be
calculated between the origin and destination of each commodity via the previous/next
overseas port.
Data obtained from Statistics New Zealand included a summary of all maritime imports
and exports during 2007, where each entry was categorised by a ten-digit harmonised system
code (HS10). HS10 data is also derived from the Customs PD data, although commercially

Personal revised version of:
Fitzgerald et al. (2011), Energy use of integral refrigerated containers in maritime
transportation. Paper to appear in Energy Policy 39(4):1885-1896. NOTE: Final official
version can be found using the Digital Object Identifier (DOI) listed here:
doi:10.1016/j.enpol.2010.12.015
7
sensitive information is removed and the data is quality controlled by Statistics New Zealand
to correct any identified anomalies (Statistics New Zealand, pers. comm., 2 February 2010).
Main engine sizes, auxiliary engine sizes, cruise speeds and deadweight tonnage (DWT)
were obtained directly from Lloyd‘s Register-Fairplay Ltd. (2009) for each individual vessel.
Further details on how these data were used will appear in the peer-reviewed literature in
Fitzgerald et al. (in press), and are therefore not repeated here.
The Dataloy Distance Table (Dataloy Systems A.S., n.d.), an online maritime distance
calculator, was used to calculate the distances between each unique port-to-port pair. This was
considered to produce an extremely accurate measure of the most direct path between each
port-to-port pair due to the large number of waypoints and logical relations between
waypoints the Dataloy Distance Table uses. The uncertainty in the total distance that each of
New Zealand‘s imported or exported goods travels is due to not knowing the full global
rotations of vessels. If the transported product deviated from the predicted route considered to
be the most direct, this would serve to increase the overall distance a commodity travels and,
therefore, the duration of the journey, and energy consumed.
The two types of engines that maritime vessels have are main engines, which are used
predominantly for the ships‘ motive power, and auxiliary engines, which are used to generate
the vessels‘ electricity requirements. The fuel consumed by a vessel‘s main engines during
voyages was calculated for all refrigerated products. This is considered to be an
approximation of the amount of fuel required for the physical transportation of commodities
only. It is known that this assumption is not particularly accurate as vessels require auxiliary
generated electricity to run basic ship electronics and control systems. It does, however,
provide a good relative method of comparing the transportation and refrigeration components
of refrigerated products during international maritime shipping.
Assuming that all of the energy required by reefers was generated by the vessels‘
auxiliary engines allowed vessel-specific fuel oil consumption (SFOC) rates to be applied and
the subsequent fuel use to be calculated. This assumption may not always be correct as some
vessels may use shaft generators which can produce electricity from the main engine shaft.
However, this should not greatly affect the total amount of fuel consumed by the reefers, as a
shaft generator would simply transfer fuel consumption from the auxiliary engine to the main
engine. The difference in fuel consumption arises due to the fact that the larger main engines
are generally slightly more efficient than the smaller auxiliary engines. This is shown by
Buhaug et al. (2009) who generally present lower SFOC rates for main engines compared to
the auxiliary engines for the same vessel category. Because there was no method of
determining if shaft generators were used by vessels, the effect of these efficiency differences
has been neglected.
2.3 Data on refrigerated containers
This study has assumed a mean refrigerated container energy consumption rate of 2.7
kW/TEU, as taken from a conference paper presented by Wild (2008), to provide preliminary

Personal revised version of:
Fitzgerald et al. (2011), Energy use of integral refrigerated containers in maritime
transportation. Paper to appear in Energy Policy 39(4):1885-1896. NOTE: Final official
version can be found using the Digital Object Identifier (DOI) listed here:
doi:10.1016/j.enpol.2010.12.015
8
estimates of reefer energy consumption. This assumption was also used by McLaren et al.
(2009) in the carbon footprinting lifecycle assessment of New Zealand‘s apple supply chain to
the United Kingdom. Datasets were also obtained from Port Otago which detailed reefer
numbers onsite everyday as well as the total energy consumed by all refrigerated containers.
The refrigerated containers studied were a range of ages and manufacturers/operators. The
data were used to calculate a mean energy consumption rate per container, and provided a
comparison to the value presented by Wild (2008). There is very little publicly available
information on energy use by containers whilst they are plugged in at ports, so this data will
also be useful for life cycle assessment practitioners looking at the wider context of product
footprinting.
All PD data entries are categorised by the first four-digits of the harmonised system
code (―tariff heading‖), which is sufficient to identify refrigerated products. Data was
obtained from Port Otago on refrigerated containers which appeared in the PD data and had
also passed through the port during 2007. Container information included unique
identification numbers, tare and gross masses, container sizes, internal set-point temperatures,
and a description of the contained product. Each commodity contained in the PD data was
searched on the Port Otago database, which allowed the mean container size (twenty-foot or
forty-foot) to be calculated for each commodity. The mean of the maximum net masses of
several thousand containers was taken, which resulted in a mean capacity of 15.5 tonnes for
twenty-foot containers and 19.4 tonnes for forty-foot containers (Port Otago, pers. comm., 14
July 2009). This is an area where exact information is often difficult to establish for product
life cycle assessment-based carbon studies in New Zealand and therefore these figures may be
useful for establishing greenhouse gas emissions. A specific number of containers were
assigned to each product based on its mass and the mean capacity of the containers. This
container number was converted to twenty-foot equivalent units (TEU) and the duration that
each container was at sea was calculated by dividing the total distance transported by the
average vessel speed. The number of TEUs was multiplied by the duration of the voyage, and
by 2.7 kW/TEU (Wild, 2008), to generate an approximation of the energy consumed by the
refrigerated containers.
3. Results and Discussion
3.1. Energy use by refrigerated containers at a port
Several datasets were obtained from Port Otago Ltd. which detailed the number of
refrigerated containers being measured onsite and their collective electricity consumption.
These were analysed and used to identify if any assumptions could be drawn around the
average energy usage per TEU.
Energy measurements were taken over a 40 hour period by Port Otago from 19 to 21
August 2009 for the power consumption of six frozen twenty-foot containers set to -20°C
(Port Otago, pers. comm. 26 August 2009). In addition to this, energy measurements were
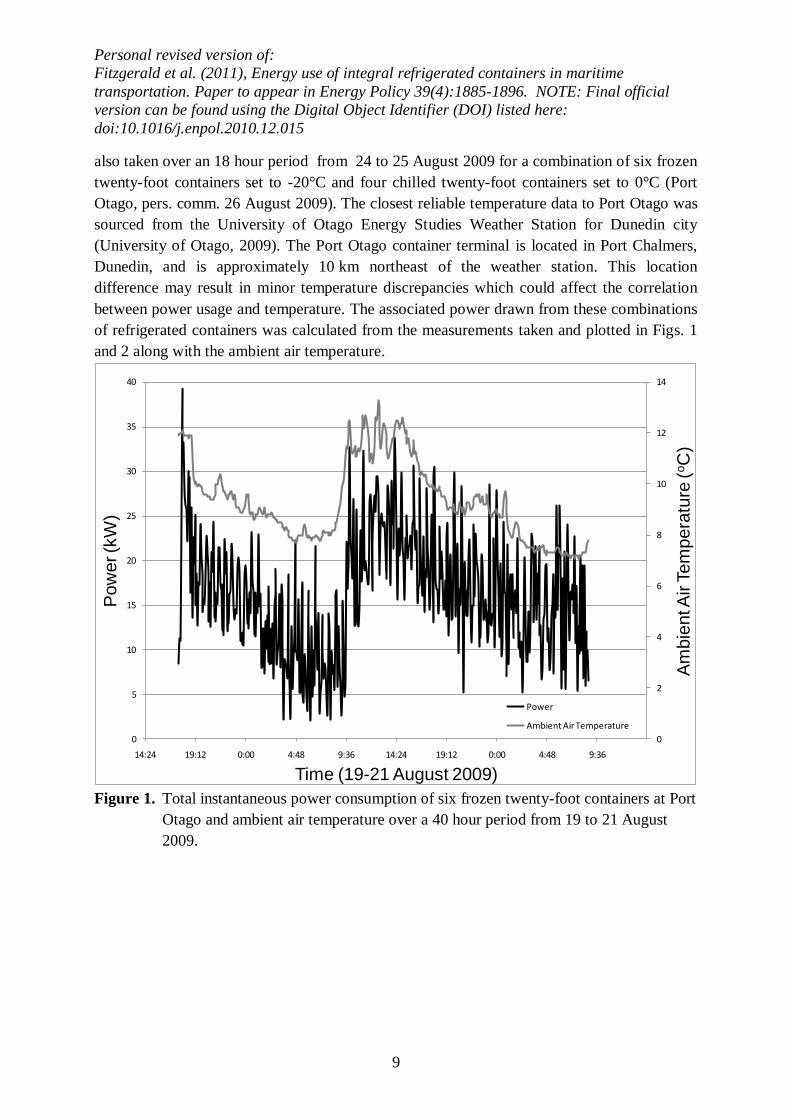
Personal revised version of:
Fitzgerald et al. (2011), Energy use of integral refrigerated containers in maritime
transportation. Paper to appear in Energy Policy 39(4):1885-1896. NOTE: Final official
version can be found using the Digital Object Identifier (DOI) listed here:
doi:10.1016/j.enpol.2010.12.015
9
also taken over an 18 hour period from 24 to 25 August 2009 for a combination of six frozen
twenty-foot containers set to -20°C and four chilled twenty-foot containers set to 0°C (Port
Otago, pers. comm. 26 August 2009). The closest reliable temperature data to Port Otago was
sourced from the University of Otago Energy Studies Weather Station for Dunedin city
(University of Otago, 2009). The Port Otago container terminal is located in Port Chalmers,
Dunedin, and is approximately 10 km northeast of the weather station. This location
difference may result in minor temperature discrepancies which could affect the correlation
between power usage and temperature. The associated power drawn from these combinations
of refrigerated containers was calculated from the measurements taken and plotted in Figs. 1
and 2 along with the ambient air temperature.
0
2
4
6
8
10
12
14
0
5
10
15
20
25
30
35
40
14:24 19:12 0:00 4:48 9:36 14:24 19:12 0:00 4:48 9:36
Am
bie
nt A
ir T
em
pe
ratu
re (
oC
)
Po
we
r (k
W)
Time (19-21 August 2009)
Power
Ambient Air Temperature
Figure 1. Total instantaneous power consumption of six frozen twenty-foot containers at Port
Otago and ambient air temperature over a 40 hour period from 19 to 21 August
2009.
Personal revised version of:
Fitzgerald et al. (2011), Energy use of integral refrigerated containers in maritime
transportation. Paper to appear in Energy Policy 39(4):1885-1896. NOTE: Final official
version can be found using the Digital Object Identifier (DOI) listed here:
doi:10.1016/j.enpol.2010.12.015
10
0
2
4
6
8
10
12
14
16
0
10
20
30
40
50
60
14:24 16:48 19:12 21:36 0:00 2:24 4:48 7:12 9:36
Am
bie
nt A
ir T
em
pe
ratu
re (
oC
)
Po
we
r (k
W)
Time (24-25 August 2009)
Power
Ambient Air Temperature
Figure 2. Total instantaneous power consumption of six frozen and four chilled twenty-foot
containers at Port Otago and ambient air temperature over an 18 hour period from
24 to 25 August 2009.
Fig. 1 shows a clear correlation between instantaneous power consumption and ambient
air temperature, whereas Fig. 2 shows no such clear correlation, possibly due to the shorter
duration of the measurements. The mean rate of power consumption by the six frozen
containers (Fig. 1) was 16 kW, which equates to a mean of 2.7 kW/TEU. The mean rate of
power consumption of the ten frozen and chilled containers (Fig. 2) was 44 kW, a mean of
4.4 kW/TEU.
Monthly electricity meter readings were also provided by Port Otago for the year from
July 2008 to June 2009. Meter readings could be separated by end use, which allowed the
energy consumed exclusively by refrigerated containers to be quantified. This was compared
to the total number of reefers on site, to calculate an average energy consumption value for
each month, as shown in Table 1.

Personal revised version of:
Fitzgerald et al. (2011), Energy use of integral refrigerated containers in maritime
transportation. Paper to appear in Energy Policy 39(4):1885-1896. NOTE: Final official
version can be found using the Digital Object Identifier (DOI) listed here:
doi:10.1016/j.enpol.2010.12.015
11
Table 1. Mean monthly power consumption rates per twenty-foot equivalent unit (TEU) at
the Port Otago Container Terminal, Dunedin, New Zealand.
Month Jul Aug Sep Oct Nov Dec Jan Feb Mar Apr May Jun
Mean Power
(kW/TEU) 1.29 1.47 1.50 1.72 2.28 1.97 1.99 1.93 1.87 1.33 1.82 1.26
y = 0.0696x + 0.9406
0.0
0.5
1.0
1.5
2.0
2.5
0 2 4 6 8 10 12 14 16 18
Avera
ge P
ow
er
Consum
ption R
ate
(kW
/TE
U)
Temperature ( C)
Figure 3. Correlation test between reefer energy use (per TEU) at Port Otago Container
Terminal, Dunedin, New Zealand and ambient temperature.
Table 1 shows an annual cycle with maximum rates of energy consumption over
summer months and minimum values during winter months. These values have been plotted
against the mean monthly temperatures in Dunedin for the corresponding month (University
of Otago, 2009) to provide a correlation test between reefer energy use and ambient
temperature (Fig. 3). The linear line of best fit has an R2-value of 0.43, and its gradient
indicates that power usage increases by approximately 70 W/TEU per degree Celsius of
ambient air temperature increase. In order to generate a more representative model and
improve this correlation, additional data would be required about the proportion, and energy
consumption, of containers with different internal set-point temperatures. However, based on
the Pearson's Correlation Coefficient (r(10) = 0.6557), the correlation between reefer energy
consumption and ambient air temperature shown in Fig. 3, is significant at a 95% confidence
level.
°

Personal revised version of:
Fitzgerald et al. (2011), Energy use of integral refrigerated containers in maritime
transportation. Paper to appear in Energy Policy 39(4):1885-1896. NOTE: Final official
version can be found using the Digital Object Identifier (DOI) listed here:
doi:10.1016/j.enpol.2010.12.015
12
Taking the mean of all values in Table 1 produces a mean annual power consumption
rate of 1.7 kW/TEU. The 2007 mean annual temperature in Dunedin was 11°C (University of
Otago, 2009), so it is therefore assumed that most cargo will be transported to/from a climate
warmer than Dunedin‘s. Given this assumption, the mean power consumed by refrigerated
containers should also be greater than 1.7 kW/TEU. Applying the mean value of 2.7 kW/TEU
(Wild, 2008) to the linear model, results in a plausible effective mean temperature of 25°C.
Due to the inherent uncertainties and assumptions included in this linear relationship,
calculated values are intended to provide an indication only and do not represent actual
conditions. In particular, Wild (2008) did not state the set-point temperatures of the containers
in that study, but if they were significantly different to those in the case of New Zealand
cargo, the mean value of 2.7 kW/TEU may not be representative of New Zealand‘s
refrigerated cargo.
3.2. Energy use and fuel use by refrigerated transport
Table 2. Cited reefer energy consumption rates per twenty-foot equivalent unit (TEU) and
their consumption proportions and differences relative to 2.7 kW/TEU.
Energy Consumption
Rate (kW/TEU) Source
Proportion Relative to
2.7 kW/TEU
2.7 Wild (2008) 1.00
1.3 Port Otago monthly minimum 0.48
2.3 Port Otago monthly maximum 0.85
1.7 Port Otago monthly mean 0.63
2.7 Port Otago 40 hr, 6 frozen TEU mean 1.00
4.4 Port Otago 18hr, 10 TEU mean 1.63
An energy consumption rate of 2.7 kW/TEU has been used in the current study to
provide a preliminary estimate of the absolute amount of energy used by New Zealand‘s
refrigerated maritime transportation. Table 2 shows all the different reefer energy
consumption rates per TEU which have been calculated in this study and their consumption
proportion relative to the value of 2.7 kW/TEU. This suggests that the actual energy
consumed by reefers, as well as the subsequent fuel consumption and greenhouse gas
emissions, may be between 63% greater and 52% less than values calculated in this study.
This represents an area of uncertainty in which there exists little peer-reviewed journal
literature available, as most cited values are sourced from the ―grey‖ literature (reports and
other non-journal or non-peer-reviewed literature). The information included in Table 2 is
useful for product greenhouse gas footprinting and can be used in planning reduction
measures for shipping emissions. McLaren et al. (2009) state that efficient production
Personal revised version of:
Fitzgerald et al. (2011), Energy use of integral refrigerated containers in maritime
transportation. Paper to appear in Energy Policy 39(4):1885-1896. NOTE: Final official
version can be found using the Digital Object Identifier (DOI) listed here:
doi:10.1016/j.enpol.2010.12.015
13
systems in New Zealand can result in shipping emissions forming a relatively large proportion
of the product‘s carbon footprint. Shipping emissions should therefore also be given adequate
consideration in sensitivity analysis of assumptions used within the product carbon footprint.
This is therefore an area that requires additional research to validate carbon footprinting
methods and other studies which require accurate information about the amount of energy
required to refrigerate products during transportation.
All refrigerated cargo was assumed to be transported by refrigerated containers. This
assumption may produce different estimations of the absolute energy consumption for cargo
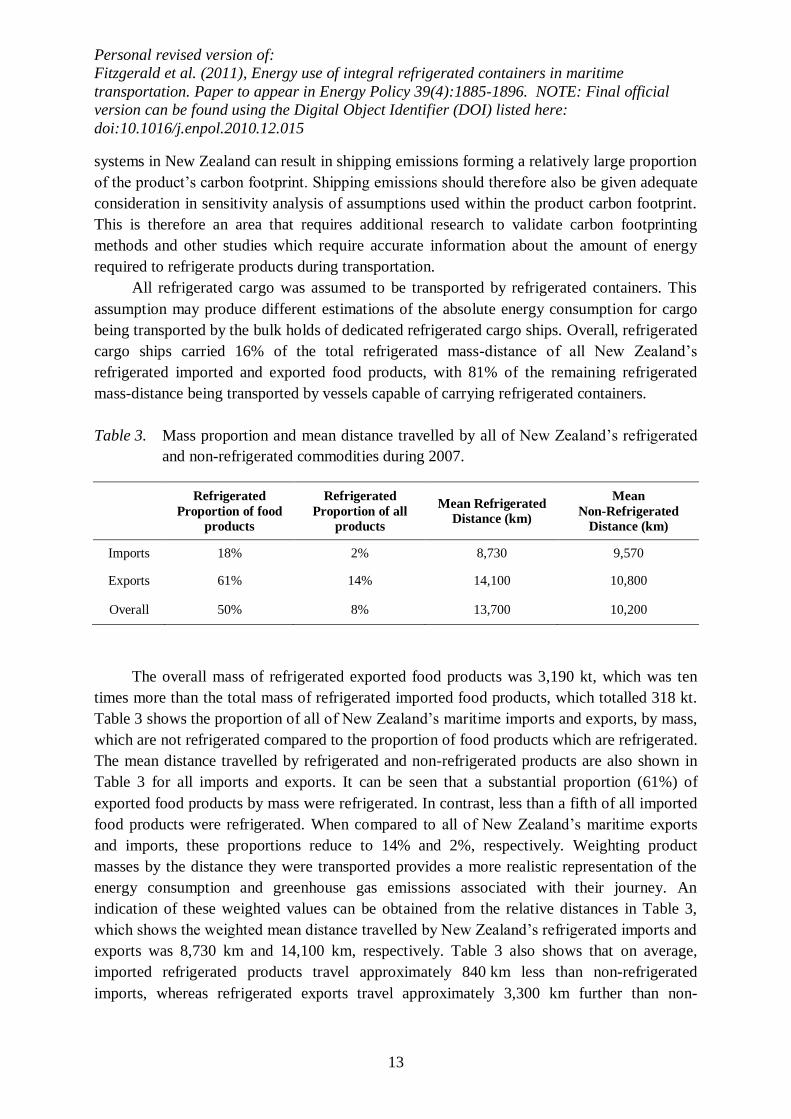
being transported by the bulk holds of dedicated refrigerated cargo ships. Overall, refrigerated
cargo ships carried 16% of the total refrigerated mass-distance of all New Zealand‘s
refrigerated imported and exported food products, with 81% of the remaining refrigerated
mass-distance being transported by vessels capable of carrying refrigerated containers.
Table 3. Mass proportion and mean distance travelled by all of New Zealand‘s refrigerated
and non-refrigerated commodities during 2007.
Refrigerated
Proportion of food
products
Refrigerated
Proportion of all
products
Mean Refrigerated
Distance (km)
Mean
Non-Refrigerated
Distance (km)
Imports 18% 2% 8,730 9,570
Exports 61% 14% 14,100 10,800
Overall 50% 8% 13,700 10,200
The overall mass of refrigerated exported food products was 3,190 kt, which was ten
times more than the total mass of refrigerated imported food products, which totalled 318 kt.
Table 3 shows the proportion of all of New Zealand‘s maritime imports and exports, by mass,
which are not refrigerated compared to the proportion of food products which are refrigerated.
The mean distance travelled by refrigerated and non-refrigerated products are also shown in
Table 3 for all imports and exports. It can be seen that a substantial proportion (61%) of
exported food products by mass were refrigerated. In contrast, less than a fifth of all imported
food products were refrigerated. When compared to all of New Zealand‘s maritime exports
and imports, these proportions reduce to 14% and 2%, respectively. Weighting product
masses by the distance they were transported provides a more realistic representation of the
energy consumption and greenhouse gas emissions associated with their journey. An
indication of these weighted values can be obtained from the relative distances in Table 3,
which shows the weighted mean distance travelled by New Zealand‘s refrigerated imports and
exports was 8,730 km and 14,100 km, respectively. Table 3 also shows that on average,
imported refrigerated products travel approximately 840 km less than non-refrigerated
imports, whereas refrigerated exports travel approximately 3,300 km further than non-
Personal revised version of:
Fitzgerald et al. (2011), Energy use of integral refrigerated containers in maritime
transportation. Paper to appear in Energy Policy 39(4):1885-1896. NOTE: Final official
version can be found using the Digital Object Identifier (DOI) listed here:
doi:10.1016/j.enpol.2010.12.015
14
refrigerated exports. These characteristics strongly influence the energy and fuel use estimates
shown in Table 4, below.
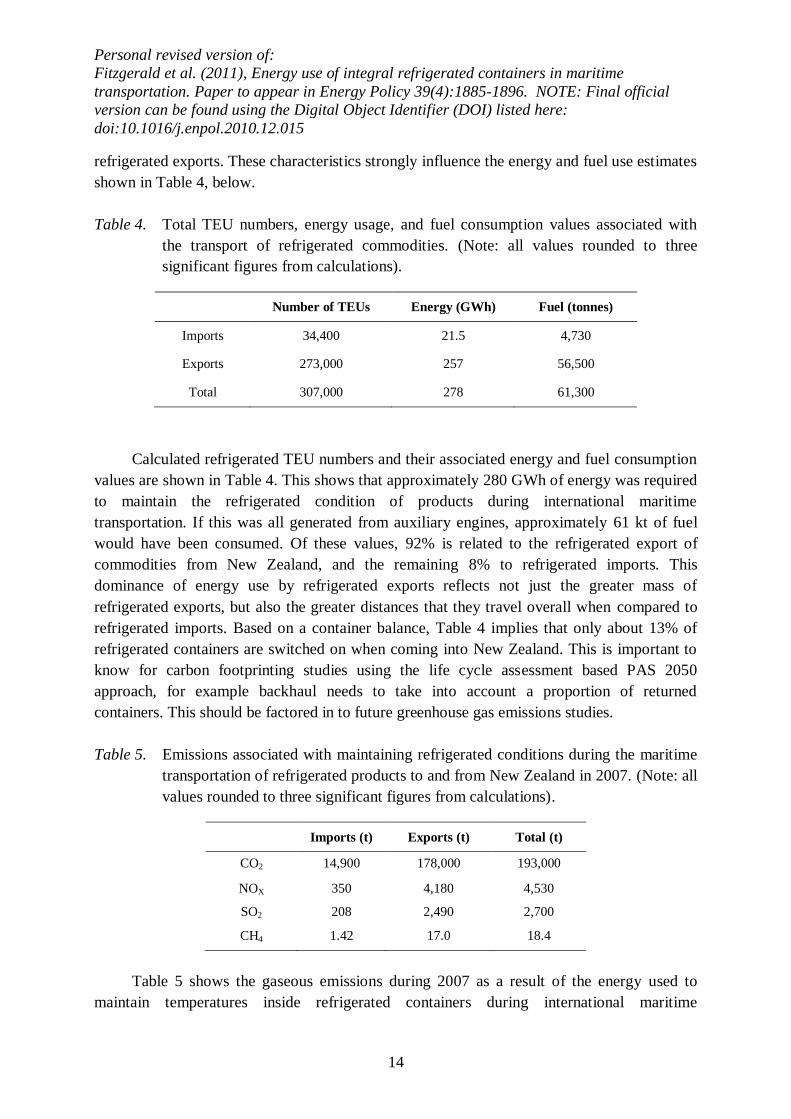
Table 4. Total TEU numbers, energy usage, and fuel consumption values associated with
the transport of refrigerated commodities. (Note: all values rounded to three
significant figures from calculations).
Number of TEUs Energy (GWh) Fuel (tonnes)
Imports 34,400 21.5 4,730
Exports 273,000 257 56,500
Total 307,000 278 61,300
Calculated refrigerated TEU numbers and their associated energy and fuel consumption
values are shown in Table 4. This shows that approximately 280 GWh of energy was required
to maintain the refrigerated condition of products during international maritime
transportation. If this was all generated from auxiliary engines, approximately 61 kt of fuel
would have been consumed. Of these values, 92% is related to the refrigerated export of
commodities from New Zealand, and the remaining 8% to refrigerated imports. This
dominance of energy use by refrigerated exports reflects not just the greater mass of
refrigerated exports, but also the greater distances that they travel overall when compared to
refrigerated imports. Based on a container balance, Table 4 implies that only about 13% of
refrigerated containers are switched on when coming into New Zealand. This is important to
know for carbon footprinting studies using the life cycle assessment based PAS 2050
approach, for example backhaul needs to take into account a proportion of returned
containers. This should be factored in to future greenhouse gas emissions studies.
Table 5. Emissions associated with maintaining refrigerated conditions during the maritime
transportation of refrigerated products to and from New Zealand in 2007. (Note: all
values rounded to three significant figures from calculations).
Imports (t) Exports (t) Total (t)
CO2 14,900 178,000 193,000
NOX 350 4,180 4,530
SO2 208 2,490 2,700
CH4 1.42 17.0 18.4
Table 5 shows the gaseous emissions during 2007 as a result of the energy used to
maintain temperatures inside refrigerated containers during international maritime
Personal revised version of:
Fitzgerald et al. (2011), Energy use of integral refrigerated containers in maritime
transportation. Paper to appear in Energy Policy 39(4):1885-1896. NOTE: Final official
version can be found using the Digital Object Identifier (DOI) listed here:
doi:10.1016/j.enpol.2010.12.015
15
transportation to and from New Zealand. The calculations were based on auxiliary engine
emissions factors presented in Buhaug et al. (2009). Differences in the totals are due to
rounding. The total amount of CO2 produced was approximately 190 kt. All current methods
of calculating fuel consumption and emissions from maritime vessels include inbuilt
assumptions about the total energy requirements of the vessels, including that of reefers. For
this reason, the effects of reefers cannot be considered as additional to the totals calculated for
vessels. Attempting to separate emissions attributed to motive power from those created in the
generation of electricity for reefers is a more representative approach to compare the effects
of each. It was found that the majority of the energy consumed during the maritime
transportation of refrigerated products is related to the motive power required to physically
move the cargo from origin to destination. For a single reefer, a mean of 19% of the total
energy consumption associated with its journey was used to refrigerate the cargo within, with
the remaining 81% attributed to the energy required to physically transport the container. The
percentages of the total fuel used by reefers compared with the total fuel used by the
transportation of food products for imports and exports were also calculated. The refrigeration
of imports and exports contributed to 7% and 15%, respectively, of the total fuel use during
international maritime transportation of ―food fit for human consumption‖, with the remainder
(i.e., 93% and 85% in each case) being due to direct transportation energy requirements.
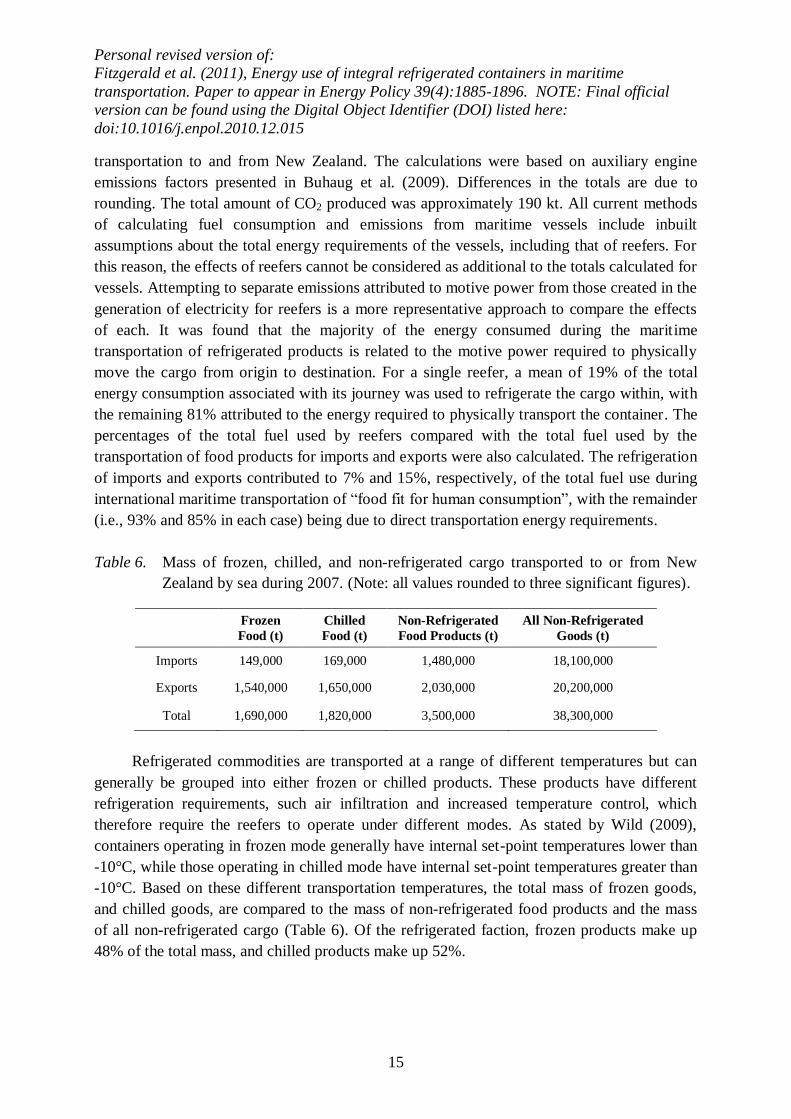
Table 6. Mass of frozen, chilled, and non-refrigerated cargo transported to or from New
Zealand by sea during 2007. (Note: all values rounded to three significant figures).
Frozen
Food (t)
Chilled
Food (t)
Non-Refrigerated
Food Products (t)
All Non-Refrigerated
Goods (t)
Imports 149,000 169,000 1,480,000 18,100,000
Exports 1,540,000 1,650,000 2,030,000 20,200,000
Total 1,690,000 1,820,000 3,500,000 38,300,000
Refrigerated commodities are transported at a range of different temperatures but can
generally be grouped into either frozen or chilled products. These products have different
refrigeration requirements, such air infiltration and increased temperature control, which
therefore require the reefers to operate under different modes. As stated by Wild (2009),
containers operating in frozen mode generally have internal set-point temperatures lower than
-10°C, while those operating in chilled mode have internal set-point temperatures greater than
-10°C. Based on these different transportation temperatures, the total mass of frozen goods,
and chilled goods, are compared to the mass of non-refrigerated food products and the mass
of all non-refrigerated cargo (Table 6). Of the refrigerated faction, frozen products make up
48% of the total mass, and chilled products make up 52%.

Personal revised version of:
Fitzgerald et al. (2011), Energy use of integral refrigerated containers in maritime
transportation. Paper to appear in Energy Policy 39(4):1885-1896. NOTE: Final official
version can be found using the Digital Object Identifier (DOI) listed here:
doi:10.1016/j.enpol.2010.12.015
16
3.3. Products and their destinations
Figure 4. Proportion of overall fuel consumption, and subsequently greenhouse gas
emissions, separated by commodity type for the international maritime
transportation of New Zealand‘s (a) imported and (b) exported food products
during 2007. Shaded sections represent products which require refrigeration
during transportation.
The cargo-based approach used in the current study also allows the fuel use and
greenhouse gas emissions of individual product journeys to be calculated for different
commodities and trading partners. The fuel use and emissions profiles for New Zealand‘s top
six imported and top eight exported food products are shown in Fig. 4, where the shaded
sections represent products that require some sort of refrigeration during transport. Wheat and
molasses, which do not require refrigeration, are associated with 22% of the total fuel
consumption for all New Zealand‘s imported food products (Fig. 4a). Bananas are the only
product out of the top six imported food commodities that requires refrigeration. In terms of
New Zealand‘s exported food products (Fig. 4b), miscellaneous fruits, which includes
kiwifruit and strawberries, are associated with the largest proportion of fuel use (15%). Only
one product of the top eight exported food products by fuel use, concentrated dairy, which is
predominantly milk solids, does not require refrigeration during transportation. In a policy
context, this breakdown of the products‘ emissions allows government agencies to determine
which industries to target with data collection and investigation prior to applying policy
measures. The New Zealand Ministry of Agriculture and Forestry has targeted 13 product
categories within the primary sector for their initial greenhouse gas footprinting project, and
this research suggests that this approach is the correct one to take.
a b

Personal revised version of:
Fitzgerald et al. (2011), Energy use of integral refrigerated containers in maritime
transportation. Paper to appear in Energy Policy 39(4):1885-1896. NOTE: Final official
version can be found using the Digital Object Identifier (DOI) listed here:
doi:10.1016/j.enpol.2010.12.015
17
Figure 5. Proportion of energy consumption, and subsequently greenhouse gas emissions,
compiled by country for the international maritime transportation of New
Zealand‘s (a) imported and (b) exported food products during 2007.
The overall proportion of fuel use, and subsequent emissions, for the top six import and
export countries for all food products are shown by Fig. 5. The countries represent the country
of origin for imports and the country of final destination for exports. Fig. 5a shows that the
largest proportion (33%) of fuel use and emissions are associated with food products imported
from Australia, with the United States of America and the Philippines contributing the next
highest amounts (10% and 8% respectively). Fig. 5b shows that Malaysia (14%) and Belgium
(13%) contribute the two largest proportions of the fuel use from New Zealand‘s exported
food products. Malaysia and the United States of America are the only countries appearing in
the top six for both imports and exports. The emissions profiles shown by Fig. 5 are a
function of product masses and distances transported, and reveal the differences in
commodity types and main trading partners between New Zealand‘s imported and exported
food products. There is international debate on production versus consumption related
emissions and where the responsibility for action lies across the supply chain. In a New
Zealand context, Andrew and Forgie (2008) have quantified the implications of the ―shared
responsibility‖ (between producers and consumers) formulation introduced by Lenzen et al.
(2007). Andrew and Forgie (2008) acknowledge that their analysis ―is for New Zealand's
domestic emissions and, critically, has excluded imports‖. Within that context, the
information presented in the current paper is useful for determining which countries are
generating demand for refrigerated products.
3.4. Case study: apple transport
International negotiations have still not settled on climate change mitigation measures in
general (United Nations Framework Convention on Climate Change), for international air
transport (International Civil Aviation Organization), nor for maritime transport (International
Maritime Organization). Somewhat independently of such negotiations, there has been
increasing implementation of greenhouse gas labelling of particular products. As documented
a b

Personal revised version of:
Fitzgerald et al. (2011), Energy use of integral refrigerated containers in maritime
transportation. Paper to appear in Energy Policy 39(4):1885-1896. NOTE: Final official
version can be found using the Digital Object Identifier (DOI) listed here:
doi:10.1016/j.enpol.2010.12.015
18
by researchers such as Brenton et al. (2009), such labelling has usually been under voluntary
standards, but mandatory requirements such as those of the Commission of European
Communities for biofuels have started to appear. Many countries have been working towards
broader labelling schemes that would be mandatory (for example, France) or voluntary (for
example, Germany, Taiwan, South Korea, Japan, Sweden, and the UK). All such schemes
have issues with uncertainties due to a lack of accessible data, as outlined in Brenton et al.
(2009). Apples are discussed in this paper as an example of where uncertainties in transport
and refrigeration data can make significant differences to final results for greenhouse gas
footprinting calculations. Accurate footprinting values are needed before the effectiveness of
reduction options can be assessed. Brenton et al. (2009) outline the issues in the calculation
and implementation of greenhouse gas labelling schemes for low-income countries such as
Kenya. The tendency so far in the UK has been for greenhouse gas footprinting to be focussed
on food products. This focus was partly attributed by Brenton et al. (2009) to the fact that
many foods have undergone less processing than other types of goods, which therefore makes
the calculation of embodied emissions "relatively tractable". Policy makers in higher-income
countries with a large export earnings dependency on agricultural and horticultural products
are therefore also concerned with the implications of greenhouse gas labelling. New Zealand
is such a country, with 42% by value of exported products in the year ended June 2007 being
dairy products, meat, fruit, vegetables, nuts, and fish (Statistics New Zealand, 2008).
Due to the different growing seasons between the northern and southern hemispheres,
there has often been a flow of food internationally from producer countries to locations that
cannot grow the products themselves at that time of year. ―Food-miles‖ have been used in the
past to promote locally-grown products, with the implication that products transported long
distances were automatically worse for the environment than their local equivalents.
However, with the development of PAS 2050 and carbon labelling of products, a more in-
depth discussion of these issues has resulted, particularly in the UK.
As part of these evolving discussions, a number of papers have examined the energy
used and greenhouse gas emissions associated with the production, transport and storage of
apples. A popular intercomparison is of the energy required for storing European-grown
apples for five to six months for local consumption out of the growing season, versus the
energy required for the shipping of Southern Hemisphere apples to Europe for consumption.
Such studies have often yielded apparently contradictory results. Saunders and Barber (2008)
using a life cycle assessment methodology concluded that 2,980 MJ per tonne of apples was
used for the production of New Zealand apples and their transport to the United Kingdom,
compared with 5,030 MJ per tonne of apples for the production and storage of UK apples
stored for six months. In contrast, Blanke (2008), updating work from Blanke and Burdick
(2005), concluded that New Zealand apples required 6,090 MJ per tonne of apples, and
German apples required 4,090 MJ per tonne of apples (stored for five months). The Blanke
(2008) figures include local transport, local distribution, and ―consumer shopping‖. When
Personal revised version of:
Fitzgerald et al. (2011), Energy use of integral refrigerated containers in maritime
transportation. Paper to appear in Energy Policy 39(4):1885-1896. NOTE: Final official
version can be found using the Digital Object Identifier (DOI) listed here:
doi:10.1016/j.enpol.2010.12.015
19
these factors are excluded to allow a more meaningful intercomparison with Saunders and
Barber (2008), values of 3,530 MJ per tonne of apples for New Zealand and 1,810 MJ per
tonne of apples for Germany are obtained from the Blanke (2008) results. A report by AEA
Technology (2008) that compared emissions from New Zealand apples shipped to the UK
with apples stored in the UK calculated the international shipping emissions to be 0.7 tonnes
of CO2-equivalent per tonne of apples. This is significantly more than the figure of 0.1249
tonnes of CO2 per tonne of apples calculated by Saunders and Barber (2008).
A recent study conducted by Landcare Research calculated the carbon footprint of the
life-cycle for Royal Gala and Braeburn apples exported from New Zealand (McLaren et al.,
2009). McLaren et al. (2009) found that the international maritime transport of apples from
New Zealand to the United Kingdom resulted in approximately 0.5 kg CO2-equivalent (CO2-
e) per kg of apples exported.
As a comparison with these other studies, which have all chosen apples are a reference
product, a greenhouse gas emissions analysis was conducted for the international maritime
transport of New Zealand‘s apple exports to the United Kingdom using the methodology
outlined in this paper. The results were then compared with the emissions that would be
associated with preserving United Kingdom grown apples to supply the United Kingdom
market out-of-season.
The tariff heading for imported and exported apples is ―0808: Apples, pears and
quinces; fresh‖. HS10 data from Statistics New Zealand indicates that 98% of all New
Zealand‘s 0808 exported goods by mass in 2007 were apples, with the remaining 2% being
pears. It was therefore assumed that all the 0808 goods appearing in the Customs PD dataset
were apples for the purpose of the following calculation. The total mass of apples exported
from a New Zealand port to a port in the United Kingdom in 2007 was 79,700 tonnes and the
total mass distance was 1,890 Mt-km, resulting in a weighted mean distance travelled of
23,800 km. This distance represents the mean distance travelled from a given New Zealand
port, to the next overseas port visited by the vessel, then directly to the port of discharge in the
United Kingdom. While the distance travelled by apples not discharged at either the first or
second port of call after departing New Zealand will be underestimated by this methodology,
it provides a more accurate representation of the distance travelled than by assuming a direct
path between New Zealand and the United Kingdom, as in McLaren et al. (2009). From the
combination of the Advance Notice of Arrival and Customs PD datasets, it was ascertained
that for 13% of all exported apples, the next overseas port of call was also the port of
discharge. 35% of the total t-km of apples exported to the United Kingdom were exported
from Port Chalmers and discharged at the Port of Felixtowe, the mean distance of this journey
was 25,000 km, when compared to the direct route given by Dataloy Systems A.S. (n.d.) of
21,300 km.

Personal revised version of:
Fitzgerald et al. (2011), Energy use of integral refrigerated containers in maritime
transportation. Paper to appear in Energy Policy 39(4):1885-1896. NOTE: Final official
version can be found using the Digital Object Identifier (DOI) listed here:
doi:10.1016/j.enpol.2010.12.015
20
Table 7. Intercomparison of shipping emissions for NZ apples to Europe from a range of
studies. (Note: values are quoted to the same number of significant figures given in
the original papers).
Study Shipping route
Emissions from
shipping (tonnes of
CO2-e per tonne of
apples)
Conversion applied?
Saunders and Barber
(2008) NZ-UK 0.1249 (CO2 only) No
Blanke (2008) NZ-Belgium (Antwerp) 0.174 (CO2 only) Yes (0.0615 kg
CO2/MJ from Saunders
and Barber (2008))
AEA Technology
(2008) NZ-UK 0.7 No
McLaren et al. (2009) NZ-UK (Full LCA and PAS
2050) 0.5 No
This research NZ-UK (dock-to-dock only) 0.43 No
Apples are generally refrigerated at between -1°C and +4°C during transportation
(Maersk Line, n.d), and refrigeration was estimated to consume 1,950 tonnes of fuel for all
apple exports to the United Kingdom, based on 2.7 kW/TEU and SFOC rates for auxiliary
engines. This fuel consumption represents 19% of the total fuel use and the mean duration
that the apples were refrigerated was 570 hours (23 days 18 hours). The total energy
attributable to the export of apples to the United Kingdom was therefore estimated at 57.6
GWh, which used 10,900 tonnes of fuel. This fuel use resulted in the emission of 34,300
tonnes of CO2, 3.27 tonnes of CH4 and 872 kg of N2O. Using global warming potentials from
the New Zealand Ministry of Economic Development (2008), the total emissions were 34,600
tonnes of CO2-e, or 0.43 kg CO2-e per kg of apples exported from New Zealand to the United
Kingdom.
Table 7 summarises the emissions from just the shipping component for apples
transported between New Zealand and Europe from recent studies on this topic. The
differences between the results of Saunders and Barber (2008) and those of Blanke (2008)
arise primarily because of differences in the treatment of emissions from refrigeration.
Shipping emissions, on the other hand, were dealt with in a very similar way by both of those
papers; Saunders and Barber (2008) explicitly state that shipping emissions were calculated
using 0.007 kg CO2/t-km, and it can be calculated that Blanke (2008) used 0.00757 kg CO2/t-
km. There is now more data available on such emissions, and for a wider range of gases than
CO2, than at the time of the research of Saunders and Barber (2008) and Blanke (2008). AEA
Technology (2008), for example, state that they used 0.0178 kg CO2/t-km, and that they then
added another 20% for refrigeration energy use, as well as embodied energy from the ship
manufacture and other factors, with their final calculations in CO2-e. Buhaug et al. (2009)
gives a comprehensive list of CO2 emissions in g CO2/t-km for different ship types and TEU

Personal revised version of:
Fitzgerald et al. (2011), Energy use of integral refrigerated containers in maritime
transportation. Paper to appear in Energy Policy 39(4):1885-1896. NOTE: Final official
version can be found using the Digital Object Identifier (DOI) listed here:
doi:10.1016/j.enpol.2010.12.015
21
capacities; for the range of container ship capacities that transported apples from New
Zealand in 2007, the Buhaug et al. (2009) total efficiencies are approximately 0.017 kg CO2/t-
km to 0.036 kg CO2/t-km. The contribution of non-CO2 gases to overall CO2-e figures is
small when assessing maritime transport contributions, but such gases can be very important
in full life cycle assessment studies. It can be seen that the closest agreement with the
research reported in this paper is with McLaren et al. (2009), being within 14%. McLaren et
al. (2009) used a full life cycle assessment, including allowing for cumulative losses of fruit
due to spoilage prior to arrival at the port of export in New Zealand, and allowed for the
backhaul of empty refrigerated containers. Such factors were not taken into account in the
present study, which used a port-to-port analysis. The methodology outlined in this paper is
therefore more in keeping with that used by national and corporate greenhouse gas accounting
methodologies than by product life cycle assessments. More case studies comparing these
approaches would be informative for both the research community and life cycle assessment
practitioners. McLaren et al. (2009) found variation in CO2-e per t-km values for direction of
travel, due to their inclusion of backhaul. In the research presented in the current study, 0.018
kg CO2-e per t-km was calculated. It should be noted that the current study used activity-
based calculations, and so this figure is not an underlying assumption, in contrast to some
earlier studies. In addition, it should be noted that this value is only for the example of apples
exported to the UK. Due to vessel-specific inputs, the overall value for all internationally
traded plant, animal and food products was 0.017 kg CO2-e per t-km. Separating imported and
exported plant, animal and food products yields values of 0.016 kg CO2-e per t-km and
0.018 kg CO2-e per t-km, respectively.
The apple season in New Zealand occurs approximately between early February and
early August (ENZA, 2010). This agrees well with the export dates from the Customs PD data
which showed the first export of apples on 22 February 2007 and the last export of apples on
23 August 2007. An important assumption of this analysis is that New Zealand apples are not
stored in the UK for a significant period before being distributed to supermarkets and sold to
consumers. Therefore the situation described in this study represents the best case scenario for
New Zealand apples. The apple season in the United Kingdom is approximately between
August and February, the opposite of the New Zealand apple season. In this study, it was
assumed that if the United Kingdom were to supply its own apples out-of-season instead of
importing New Zealand apples, the apples from the United Kingdom would have to be stored
and refrigerated (to prevent ripening and spoiling) for a mean time of approximately 6
months. Apples have a refrigerated shelf-life of between 90-350 days (Ezeike and Hung,
2009), therefore maintaining a supply for 6 months of the off-season is feasible. The total
mass of stored United Kingdom apples was assumed to be equal to the mass of imported New
Zealand apples, which was 79,700 tonnes in 2007. As mentioned earlier, there is a lack of
robust quantitative data in published literature on energy use by (and emissions from)
refrigerated storage, particularly in land-based warehouses. As a worst-case scenario, we
have therefore assumed the same storage conditions and energy consumption rates as standard
refrigerated containers used in the current research, which results in a total energy use of

Personal revised version of:
Fitzgerald et al. (2011), Energy use of integral refrigerated containers in maritime
transportation. Paper to appear in Energy Policy 39(4):1885-1896. NOTE: Final official
version can be found using the Digital Object Identifier (DOI) listed here:
doi:10.1016/j.enpol.2010.12.015
22
67.9 GWh for the storage of apples for off-season consumption in the United Kingdom. This
amount of energy is 18% more than the total energy required to transport the same mass of
apples from New Zealand to the United Kingdom.
In order to estimate the total CO2-e emissions generated from the refrigerated storage of
United Kingdom-grown apples, a mean emissions factor of CO2-e was derived specifically for
the United Kingdom‘s electricity sector. Digest of UK Energy Statistics (DUKES) data on the
supply profile for the United Kingdom‘s electricity sector showed that coal, oil and natural
gas based electricity generation comprised of 79% of the total gross electricity supply in 2007
and the remaining 21% of electricity generation was from non-fossil fuel based sources, the
majority of which was nuclear generation (Department of Energy and Climate Change, 2009).
DUKES data also provided the total amount of each fossil fuel consumed in 2007 (in the unit
of GWh) used to generate the given amount of electricity. The unit of GWh was converted
into tonnes by using mean gross calorific energy values from the Ministry of Economic
Development (2009) for each fossil fuel used. The derived masses were combined with the
associated emissions factors and global warming potentials (Ministry of Economic
Development, 2008) to calculate a United Kingdom specific emission factor of 0.523 kg CO2-
e/kWh electricity supplied. Multiplying the amount of hypothetical electricity consumed in
the refrigeration of United Kingdom grown apples for off-season consumption (67.9 GWh) by
this emissions factor corresponded to a total of 35,500 tonnes of CO2-e being emitted. This
value is about 3% higher than the total CO2-e emitted from exporting the same mass of apples
from New Zealand to the United Kingdom. Given the assumptions made in the calculations, a
3% difference means that the figures are essentially indistinguishable. However, a much
larger difference between the figures is found if a more realistic representation of refrigerated
storage energy use is assumed. For example, if instead of using the refrigerated container
energy use as a default for the storage, a value of 5.4 kJ/kg/day is used (based on an
unreferenced entry in Table 2 of Blanke and Burdick (2005)), then emissions of 11,400 tonnes
of CO2-e are calculated, around a third of the value above. It should be noted that this is not a
life cycle assessment approach, as the emissions associated with the construction,
maintenance of the electricity supply system and distribution losses are ignored. It should
also be noted that this study has ignored other aspects of the full life cycle of the product, for
example the energy used to cultivate apples in either country is not accounted for, and nor is
the energy needed for land transport to and from international ports. Although all such
intercomparison calculations have many uncertainties and simplifying assumptions built into
them, the most significant contributions to the final values are shipping and refrigeration. For
products such as horticultural produce, refrigeration is a critical factor in ensuring that the
product is delivered in a fresh condition to the market to minimise losses within the supply
chain. Accurate greenhouse gas calculations are important for assessing emission reduction
options. In particular, it is important to assess the extent of emissions in both the production
side (including international transport) and the consumption side (for example, individual
consumer transport of the product to the home). There has been a great deal of debate about
whether storage of apples in the UK for long periods emits emissions that are greater or lesser
Personal revised version of:
Fitzgerald et al. (2011), Energy use of integral refrigerated containers in maritime
transportation. Paper to appear in Energy Policy 39(4):1885-1896. NOTE: Final official
version can be found using the Digital Object Identifier (DOI) listed here:
doi:10.1016/j.enpol.2010.12.015
23
than the emissions associated with the transport of apples from the Southern Hemisphere.
This study has shown the range of values that can be obtained in the absence of specific
refrigeration information, and explains the often conflicting results from many other studies,
even if the shipping contribution is calculated using a standardised methodology. This
analysis therefore should also not be extrapolated to other countries, as there is wide variation
in each country‘s electrical generation mix, and therefore each country would have different
specific emissions factors for their electricity supply. More comprehensive studies such as
McLaren et al. (2009) are needed to account more fully for the emissions across the whole life
cycle of the product than this desk-top example.
4. Conclusions
In the broad context of climate change mitigation measures, discussions have evolved
from rudimentary product ―food miles‖ discussions to CO2 evaluations, and more recently to
full life cycle assessments and CO2-e carbon labelling. Although labelling has developed
mostly under voluntary standards, mandatory requirements are starting to appear. However,
there are significant issues with uncertainties in the calculations that go into such labels.
Without robust data and methodologies, comparisons between products are rendered
meaningless. Similarly, evaluation of emission reduction options requires accurate
quantification of baseline emissions. In this paper, apples were discussed as an example of
where uncertainties in transport and refrigeration data can make significant differences to
final results for greenhouse gas footprinting calculations.
In 2007, the volume of refrigerated cargo transported internationally to and from New
Zealand was equivalent to 307,000 refrigerated twenty-foot containers. A constant energy
consumption rate of 2.7 kW/TEU derived by Wild (2008) was applied in the current study.
Based on these values, an annual energy usage of 280 GWh was required to maintain the
refrigerated state of New Zealand‘s imports and exports. Assuming this was all generated
from auxiliary engines onboard vessels, a total of 61 kt of fuel would have been consumed,
resulting in the production of 190 kt of CO2. For individual reefers, approximately 19% of the
fuel consumption which is related to its journey is used for refrigeration purposes. The
remaining 81% is used for the transportation of the goods between origin and destination.
Based on the total fuel consumed by the maritime transportation of all New Zealand‘s
imported and exported food products, 7% and 15%, respectively, is used to maintain the
refrigerated state of products onboard.
Data collected from Port Otago on the power consumption of refrigerated containers on
site showed that the amount of energy consumed by reefers may vary by approximately ±60%
compared to the base value of 2.7 kW/TEU (Wild, 2008) used in this study. The actual
refrigerated energy proportions, as well as the absolute fuel use and greenhouse gas emissions
from refrigerated maritime transportation, may therefore also vary by a similar percentage.

Personal revised version of:
Fitzgerald et al. (2011), Energy use of integral refrigerated containers in maritime
transportation. Paper to appear in Energy Policy 39(4):1885-1896. NOTE: Final official
version can be found using the Digital Object Identifier (DOI) listed here:
doi:10.1016/j.enpol.2010.12.015
24
These results give an overall value for the maritime transportation of all internationally
traded plant, animal and food products of 0.017 kg CO2-e per t-km. Separating imported and
exported plant, animal and food products yields values of 0.016 kg CO2-e per t-km and
0.018 kg CO2-e per t-km, respectively. For apples exported from New Zealand to the UK in
2007, a maritime emissions value of 0.018 kg CO2-e per t-km was calculated, although it
should be noted that unlike McLaren et al. (2009), for example, this is not a full life-cycle
value. This value was calculated using an activity-based method, and therefore is not an
underlying assumption, in contrast to some earlier studies.
This paper adds to the sparse data that is available on energy use by integral refrigerated
containers that are used in maritime transportation, and on the greenhouse gas emissions that
result from that energy use. Additional research is required in order to provide greater
confidence in the mean energy use of refrigerated containers; such data are important to the
many carbon footprinting studies that are conducted around the world.
Acknowledgements
The authors wish to acknowledge the significant contribution of Port Otago, Dunedin,
New Zealand for the data and support they provided for this study. Thanks also to the
University of Otago Department of Physics, the New Zealand Customs Service, Statistics
New Zealand, the Ministry of Transport, Transport Research and Educational Trust (TRET),
and Landcare Research. In addition, the authors wish to acknowledge the 2010 University of
Otago Matched Funding Summer Scholarship scheme and the Otago Energy Research Centre
2010 Summer Research Bursary Scheme, which provided funding to later complete this
paper. Whilst acknowledging the contribution of these external organisations, the results
presented in this paper are solely the responsibility of the authors. Finally, the authors wish to
thank the two anonymous reviewers who provided constructive suggestions to improve the
manuscript.
Personal revised version of:
Fitzgerald et al. (2011), Energy use of integral refrigerated containers in maritime
transportation. Paper to appear in Energy Policy 39(4):1885-1896. NOTE: Final official
version can be found using the Digital Object Identifier (DOI) listed here:
doi:10.1016/j.enpol.2010.12.015
25
References
AEA Technology, 2008. Comparative Life Cycle Assessment of Food Commodities
Procured for UK Consumption through a Diversity of Supply Chains, final research
report for DEFRA 30 September 2008, downloaded from
http://randd.defra.gov.uk/Document.aspx?Document=FO0103_7898_FRP.doc, 29
April 2010.
Andrew, R., and Forgie, V., 2008. A three-perspective view of greenhouse gas emission
responsibilities in New Zealand. Ecological Economics, 68, 194-204,
doi:10.1016/j.ecolecon.2008.02.016.
Blanke, M. M., 2008. Life cycle assessment (LCA) and food miles – an energy balance for
fruit imports versus home-grown apples. In: (Prange, R. K., Weibel, F., and Bishop,
S. D. (Eds.), International Society for Horticultural Science, Commission on
Sustainability Through Intergrated and Organic Horticulture) Proceedings of the 27th
International Symposium on Sustainability Through Integrated and Organic
Horticulture, Acta horticulturae, 0567-7572(767), 59-64.
Blanke, M. M., and Burdick, B., 2005. Food (miles) for thought: energy balance for locally-
grown versus imported apple fruit. Environmental Science and Pollution Research,
12(3), 125-127, doi: 10.1065/espr2005.05.252.
Brenton, P., Edwards-Jones, G., Jensen, M. F., 2009. Carbon labelling and low-income
country exports: a review of the development issues. Development Policy Review,
27(3), 243-267, doi: 10.1111/j.1467-7679.2009.00445.x.
Buhaug, Ø., Corbett, J.J., Endresen, Ø., Eyring, V., Faber, J., Hanayama, S., Lee, D.S., Lee,
D., Lindstad, H., Markowska, A.Z., Mjelde, A., Nelissen, D., Nilsen, J., Pålsson, C.,
Winebrake, J.J., Wu, W. Q., Yoshida, K., 2009. Second IMO GHG study 2009.
International Maritime Organization, London.
CMA CGM, n.d. Conservation Guide. CMA CGM. Downloaded from < http://www.cma-
cgm.com/en/Images/ContentManagement/ProductsServices/RefrigeratedContainers/D
ocs/GuideConservation.pdf>, 25 November 2009.
Corbett, J. J., Koehler, H. W, 2003. Updated emissions from ocean shipping. Journal of
Geophysical Research, 108(D20), 4650, doi:10.1029/ 2003JD003751.
Dataloy Systems A.S., n.d. Dataloy Distance Table, Dataloy Systems A.S. Last accessed from
<http://dataloy.com/>, 11 February 2010.
Department of Energy and Climate Change, 2009. Annual Tables: ‗Digest of UK Energy
Statistics‘ (DUKES), Electricity supply, electricity supplied (net), electricity available,
electricity consumption and electricity sales (DUKES 5.5). Downloaded from
Personal revised version of:
Fitzgerald et al. (2011), Energy use of integral refrigerated containers in maritime
transportation. Paper to appear in Energy Policy 39(4):1885-1896. NOTE: Final official
version can be found using the Digital Object Identifier (DOI) listed here:
doi:10.1016/j.enpol.2010.12.015
26
<http://www.decc.gov.uk/en/content/cms/statistics/source/electricity/electricity.aspx>,
12 February 2010.
ENZA, 2010. New Zealand Apple and Pear Marketing Board – Seasonal Calendar. Accessed
online from: <http://www.enza.co.nz/templates/Enza/pagewide____755.aspx>, 11
February 2010.
Ezeike, G., Hung, Y-C., 2009. Postharvest Handling (2nd
Ed.) – A Systems Approach,
Chapter 19 – Refrigeration of Fresh Produce from Field to Home: Refrigeration
Systems and Logistics. Elsevier Inc., doi:10.1016/B978-0-12-374112-7.00027-5.
Fitzgerald, W. B., Howitt, O. J. A., and Smith, I. J., Submitted. Greenhouse gas emissions
from the international maritime transport of New Zealand‘s imports and exports.
Energy Policy, in press, doi:10.1016/j.enpol.2010.12.026.
James, S., James, C., Evans, J., 2006. Modelling of food transportation systems – a review.
International Journal of Refrigeration, 29, 947-957.
Jolly, P., Tso, C., Wong, Y., Ng, S., 2000. Simulation and measurement on full-load
performance of a refrigeration system in a shipping container. International Journal of
Refrigeration, 23, 112-126.
Lenzen, M., Murray, J., Sack, F., Wiedmann, T., 2007. Shared producer and consumer
responsibility — theory and practice. Ecological Economics, 61, 27–42, doi:
10.1016/j.ecolecon.2006.05.018.
Lloyd‘s Register–Fairplay Ltd., 2009. World Shipping Encyclopaedia: The complete marine
information system. DVD-ROM, version 10.03, October 2009.
Maersk Line, n.d. Commodity Temperature Guide. Maersk Line. Downloaded from
<http://www.maerskline.com/globalfile/?path=/pdf/comguide_en>, 30 July 2009.
McLaren, S., Hume, A., Barber, A., Clothier, B., Deurer, M., East, A., Greenhalgh, S.,
McDonald, R., Palmer, J., Sinclair, R., 2009. Carbon Footprinting for the Apple
Supply Chain Project Summary. Landcare Research Contract Report: LC0809/175,
contracted for the Ministry of Agriculture and Forestry.
Ministry of Economic Development, 2008. New Zealand Energy Greenhouse Gas Emissions
1990-2007. Ministry of Economic Development. Downloaded from
<http://www.med.govt.nz/upload/63349/GHG%20Report.pdf>, 5 May 2009.
Ministry of Economic Development, 2009. New Zealand Energy Data File 2009, Section K.
Fuel Properties. Accessed online from
<http://www.med.govt.nz/templates/MultipageDocumentTOC____41143.aspx>, 12
February 2010.
Personal revised version of:
Fitzgerald et al. (2011), Energy use of integral refrigerated containers in maritime
transportation. Paper to appear in Energy Policy 39(4):1885-1896. NOTE: Final official
version can be found using the Digital Object Identifier (DOI) listed here:
doi:10.1016/j.enpol.2010.12.015
27
Saunders, C., and Barber, A., 2008. Carbon footprints, life cycle analysis, food miles: global
trade trends and market issues. Political Science, 60(1), 73-88, doi:
10.1177/003231870806000107.
Statistics New Zealand, 2007. Overseas Cargo Statistics: Year ended June 2007. Statistics
New
Zealand. Last accessed from <http://www.stats.govt.nz/browse_for_stats/imports_and
_exports/goods/overseascargo_mryejun07.aspx>, 24 November 2009.
Statistics New Zealand, 2008. New Zealand Official Yearbook 2008 (Te Pukapuka Houanga
Whaimana o Aotearoa 2008), 106th Edition, David Bateman Ltd, North Shore City,
New Zealand.
Statistics New Zealand, 2010a. New Zealand in Profile: 2010 - Exports. Statistics New
Zealand. Downloaded from <http://www.stats.govt.nz/Publications/Product-
Development-and-Publishing/nz-in-profile-2010/exports.aspx>, 5 February 2010.
Statistics New Zealand, 2010b. Infoshare: Harmonised Trade – Exports. Accessed from
<http://www.stats.govt.nz/infoshare/ViewTable.aspx?pxID=66f1d928-e289-4f30-
aea0-c26cc655dd30>, 11 February 2010.
University of Otago, 2009. Monthly Summaries, Energy Studies Weather Station,
University of Otago. Last accessed from <www.physics.otago.ac.nz/eman/weather_sta
tion>, 11 September 2009.
Wild, Y., 2008. Carbon Footprint Workshop, Environmental Aspects of the Transport of
Reefer Containers, 3rd Reefer Logistic Conference. Antwerp, 26 June 2008. Received
from Anthony Hume, Landcare Research, 9 September 2009.
Wild, Y., 2009. Refrigerated containers and CA technology. Container Handbook. The
German Insurance Association. Berlin, Germany.
Wild, Y., Mechsner, A., Raschle, H., Horn. R., 1999. Transport of Refrigerated Containers in
Cargo Holds. 20th International Congress of Refrigeration, Sydney, Australia.

Personal revised version of:
Fitzgerald et al. (2011), Energy use of integral refrigerated containers in maritime
transportation. Paper to appear in Energy Policy 39(4):1885-1896. NOTE: Final official
version can be found using the Digital Object Identifier (DOI) listed here:
doi:10.1016/j.enpol.2010.12.015
28
Appendix – Titles of the first 21 chapters of the Harmonised System code.
01; Live animals.
02; Meat and edible meat offal.
03; Fish and crustaceans, molluscs and other aquatic invertebrates.
04; Dairy produce; birds' eggs; natural honey; edible products of animal origin, not elsewhere
specified or included.
05; Products of animal origin, not elsewhere specified or included.
06; Live trees and other plants; bulbs, roots and the like; cut flowers and ornamental foliage.
07; Edible vegetables and certain roots and tubers.
08; Edible fruit and nuts; peel of citrus fruit or melons.
09; Coffee, tea, maté and spices.
10; Cereals.
11; Products of the milling industry; malt; starches; inulin; wheat gluten.
12; Oil seeds and oleaginous fruits; miscellaneous grains, seeds and fruit; industrial or
medicinal plants; straw and fodder.
13; Lac; gums, resins and other vegetable saps and extracts.
14; Vegetable plaiting materials; vegetable products not elsewhere specified or included.
15; Animal or vegetable fats and oils and their cleavage products; prepared edible fats;
animal or vegetable waxes.
16; Preparations of meat, of fish or of crustaceans, molluscs or other aquatic invertebrates.
17; Sugars and sugar confectionery.
18; Cocoa and cocoa preparations.
19; Preparations of cereals, flour, starch or milk; pastrycooks' products.
20; Preparations of vegetables, fruit, nuts or other parts of plants.
21; Miscellaneous edible preparations.