energy use in homes - bre : home & water heating 3 1.5 detached houses are most likely to have...
TRANSCRIPT

Energy Use in Homes
A series of reports on domestic energy use in England
Space and Water Heating
Energy Use in Homes
A series of reports on domestic energy use in England
Space and Water Heating
This is one of a series of five reports on the energy characteristics of the stock as observed by the 2001 English House Condition Survey.
The reports in this series are:
1. Energy Summary Report 2. Space and Water Heating
3. Thermal Insulation 4. Fuel Consumption 5. Energy Efficiency
The English House Condition Survey is funded and provided courtesy of the Office of the Deputy Prime Minister. More information about this survey can be found at www.odpm.gov.uk/ehcs
This analysis has been prepared by BRE with the funding and support of the Sustainable Energy Policy Division of the Department for Environment, Food and Rural Affairs (Defra) through a contract managed by the Energy Saving Trust. This publication is Crown Copyright. For any further information please contact [email protected]
© Crown Copyright. 2005.

Space & Water Heating – Executive Summary
Space & Water Heating Executive Summary
The period 1996-2001 shows increasing levels of central heating throughout the English housing stock. 86% of dwellings in 2001 have central heating as their primary heating provision (up from 80% in 1996), 8% have programmable heating (approximately the same level as in 1996), while only 6% have fixed heating (down from 12% in 1996). All tenures show increased levels of central heating, although they continue to show considerable differences in its overall incidence – the lowest levels of central heating are seen in the private rented sector (70%), and the highest in the owner occupied sector (89%). Houses, and in particular detached houses, are more likely to have central heating systems than flats. Households with older HRPs are less likely to have central heating. In addition, there is a strong correlation between the combined income of the HRP and their partner and the presence of central heating - households with a higher income are more likely to have central heating installed. Over 90% of central heating systems are gas-fired, approximately the same proportion as in 1996. However, since 1996 there has been a shift within these systems from ducted air and back-boiler appliances to those using a single purpose boiler. Gas fired combination boilers are found in around a quarter of dwellings with central heating, and are particularly prevalent in private rented dwellings. Where central heating is not available , the favoured form of space heating is the programmable electric storage radiator. These systems are heavily concentrated in dwellings with no gas supply (74% of storage radiators are found in the 14% of the stock without mains gas). The proportion of dwellings for which programmable appliances such as these form the primary heating system is approximately the same as in 1996 (8%). Almost all dwellings have some means of heating water - most commonly this is in a combined central heating / hot water boiler. The proportion of households able to heat water by this method has increased from 74% in 1996 to 84% in 2001. The second most common form of water heating appliance is the electric immersion heater, three quarters of which are used as a backup to a combined central heating / hot water systems. The number of dwellings with an immersion heater (either as the main method of heating water or as a supplementary method) has dropped slightly , from 64% in 1996 to 59% in 2001. Households with an older HRP are more likely to rely on an immersion heater for their hot water, as are households on lower incomes. 40% of all dwellings rely on a single fuel for all their space and water heating needs (30% mains gas, 9% electricity, <1% other). Among the private rented and RSL tenures a disproportionately high percentage of dwellings rely on electricity for their space and water heating. Dwellings in the South West are less likely to use gas as their primary heating fuel (74%) than the rest of the country and more likely to use electricity (16%). Relatively high levels of fuel oil use are seen in the Eastern region (9% of dwellings).

Space & Water Heating
1
Space & Water Heating INTRODUCTION This report is concerned with the provision of space and water heating facilities within the English housing stock in 2001, as described by the 2001 English House Condition Survey (EHCS). It presents a general overview of the provision within the stock as a whole, and considers how space and water heating provision vary by physical and socio-economic factors. It also considers the fuels used to provide space and water heating. The EHCS is a five yearly survey undertaken in order to assess the condition of the housing stock in England. The results presented here are from the sections of the survey that provide information on both the dwelling characteristics and the occupants. The survey results are based upon a sample of approximately 17,500 dwellings.
Space Heating Dwellings may be heated by utilising one or more heating systems. Where several appliances are available the situation can become complex and difficult to interpret. However, for the majority of dwellings it is possible to define a primary heating system (i.e. the heating system which is of most importance within a dwelling). If a dwelling has central heating then this is assumed to be the primary heating system. Otherwise the appliance that heats the main living area is assumed to be the primary heating system. There are three methods of space heating which are defined within the context of the EHCS.
Central Heating: A system which is able to distribute heat to at least one room other than that which contains the boiler – an example of this is a gas boiler which heats water to be distributed around a dwelling. All central heating systems can be fitted with some method of temperature control but the sensitivity and flexibility of these controls can vary. The two main types of control relate to the timing of the system and the adaptability of the system to room temperature. Programmable Heating: Individual room-heaters that may be automatically operated by timers – for example a storage radiator.
Other Heating: Individual room-heaters that may not be automatically operated by timers – an example is a portable electric heater. Other heating is subdivided into fixed and non-fixed (i.e. portable) heaters.
1.1 86% of dwellings have central heating as their primary heating system; 8% of dwellings have programmable heating as their primary provision, 6% have fixed heaters and <1% have non-fixed heaters (see figure 1.1 and table 1.1).
1.2 The general pattern of heating provision is similar across tenures. Central heating plays the
dominant role in all, but is more often supplemented by other forms of heating in the owner occupied sector than in the rented accommodation sector; secondary heating systems are least common in the social rented sector.

Space & Water Heating
2
Central Heating 86.0%
Programmable Heating
7.6%
Fixed Heaters 6.2%
Non-Fixed Heaters
0.3%
Figure 1.1 – Primary Heating Provision (all dwellings). 1.3 Figure 1.2 displays how owner occupied dwellings are most likely to have central heating
(89% of dwellings) and those in private rented dwellings least likely (70%). A high proportion of private rented dwellings have fixed heaters as their primary heating provision (14%). Programmable heaters are most prevalent as the primary provision in registered social landlord and private rented dwellings (16% in both tenures) - see table 1.2.
Figure 1.2 – Primary heating provision by tenure (all dwellings).
1.4 Central heating is most common regardless of the age of the dwelling, however it is more often found exclusively in modern dwellings. Between 78% and 89% of all dwellings in all age bands use central heating. A relatively high proportion of post 1980 dwellings use programmable heaters as their primary heating provision (14%). Other non-programmable heating systems play a more significant role in older dwellings. The use of fixed heaters as the primary heating system declines over time, from 12% in pre-1919 dwellings to 2% in post-1980 dwellings (see table 1.3).
0%
10%
20%
30%
40%
50%
60%
70%
80%
90%
100%
Owner occupied Private rented LA RSLTenure
Per
cent
age
of d
wel
lings
Central Heating Programmable Heating Fixed Heaters Non-Fixed Heaters

Space & Water Heating
3
1.5 Detached houses are most likely to have central heating: 97% have a central heating system installed. Flats are least likely to have central heating with high rise purpose built flats displaying the lowest incidence (67%). There is a corresponding high incidence of programmable heating as the primary heating system in flats. A high proportion of terraced houses and converted flats rely on other forms of heating system (13-14%) - see table 1.4.
1.6 Dwellings in the North East are the most likely to have a central heating system installed (92%) and those in the South West the least likely (80%). Programmable systems as the primary heating provision show the reverse pattern, being most common in the South West and rarest in the North East. While levels of central heating are slightly above average in London (88%), a high proportion of dwellings in this region rely solely on these systems (47%), no other form of heating being present as a backup - see table 1.5. Where central heating is not available, programmable heating is generally the primary heating provision across the regions. Exceptions to this are seen in Yorkshire & Humberside, the North West & Merseyside and the West Midlands where ~10% of dwellings use fixed heaters (see table 1.5).
1.7 The household reference person (HRP) is defined as the principal earner in a household. Households with an old (over 85) or young (under 25) HRP are least likely to have central heating installed (74% and 76%, respectively). In households where the HRP is over 65 years old, programmable and other room heaters are increasingly the primary heating source. 10% of those within the over 85 age band rely solely on other forms of heating (see table 1.6).
1.8 Households which comprise of only one person under 60 years old are least likely to have central heating (75%), and most likely to rely solely on non-programmable room heaters. Couples with dependent children are most likely to have central heating (93%) - see table 1.7.
1.9 There is a correlation between size of income and the availability of central heating: as household income increases, there is a definitive preference for central heating. 95% of those in the highest income quintile have central heating, compared to just 78% in the lowest quintile as can be seen in figure 1.3.
0%
20%
40%
60%
80%
100%
1st quintile (lowest 20%) 2nd quintile 3rd quintile 4th quintile 5th quintile (highest 20%)
Income Quintile
Per
cent
age
of h
ouse
hold
s
Central Heating Programmable Heating Fixed Heaters
Figure 1.3 – Primary heating provision by income (all households).
Space & Water Heating
4
11% of those in the lowest quintile have programmable heating with the remaining 11% using fixed/unfixed heaters, the highest proportion compared to all other income groups (see figure 1.3 and table 1.8). CHANGE IN SPACE HEATING PROVISION SINCE 1996:
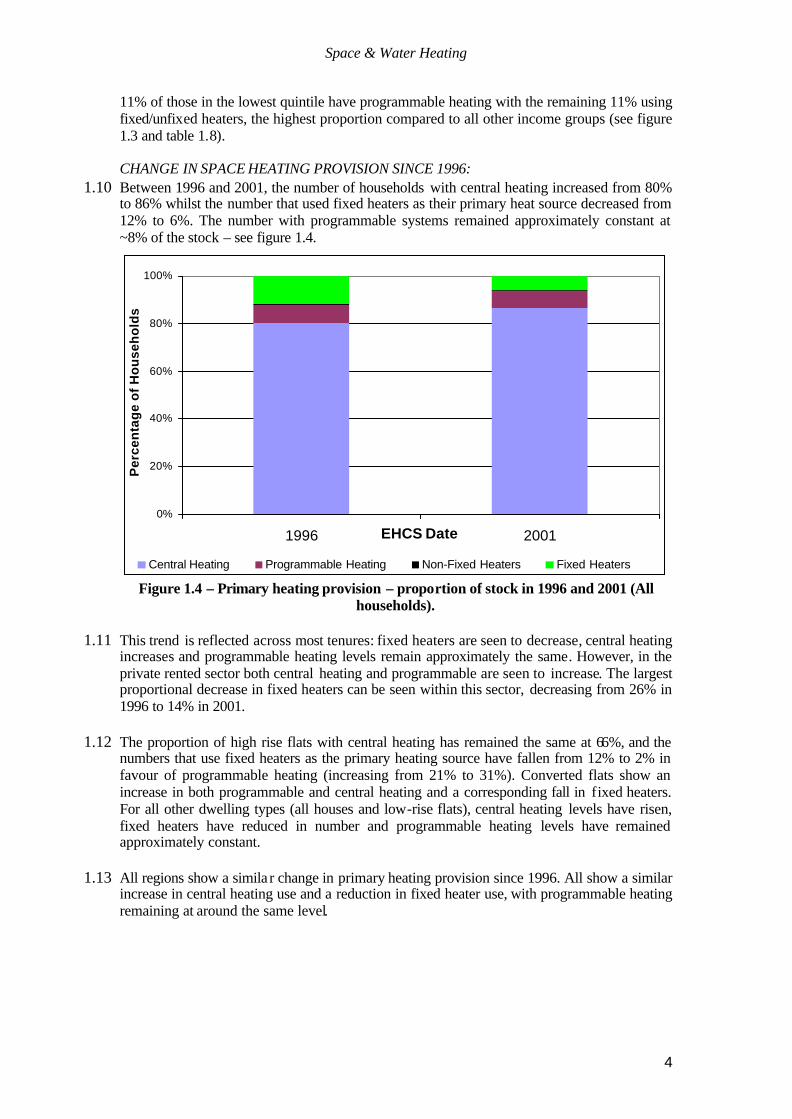
1.10 Between 1996 and 2001, the number of households with central heating increased from 80% to 86% whilst the number that used fixed heaters as their primary heat source decreased from 12% to 6%. The number with programmable systems remained approximately constant at ~8% of the stock – see figure 1.4.
Figure 1.4 – Primary heating provision – proportion of stock in 1996 and 2001 (All households).
1.11 This trend is reflected across most tenures: fixed heaters are seen to decrease, central heating
increases and programmable heating levels remain approximately the same. However, in the private rented sector both central heating and programmable are seen to increase. The largest proportional decrease in fixed heaters can be seen within this sector, decreasing from 26% in 1996 to 14% in 2001.
1.12 The proportion of high rise flats with central heating has remained the same at 66%, and the numbers that use fixed heaters as the primary heating source have fallen from 12% to 2% in favour of programmable heating (increasing from 21% to 31%). Converted flats show an increase in both programmable and central heating and a corresponding fall in fixed heaters. For all other dwelling types (all houses and low-rise flats), central heating levels have risen, fixed heaters have reduced in number and programmable heating levels have remained approximately constant.
1.13 All regions show a simila r change in primary heating provision since 1996. All show a similar increase in central heating use and a reduction in fixed heater use, with programmable heating remaining at around the same level.
0%
20%
40%
60%
80%
100%
1996 2001EHCS Date
Per
cen
tag
e o
f H
ou
seh
old
s
Central Heating Programmable Heating Non-Fixed Heaters Fixed Heaters
Space & Water Heating
5
Central Heating Systems
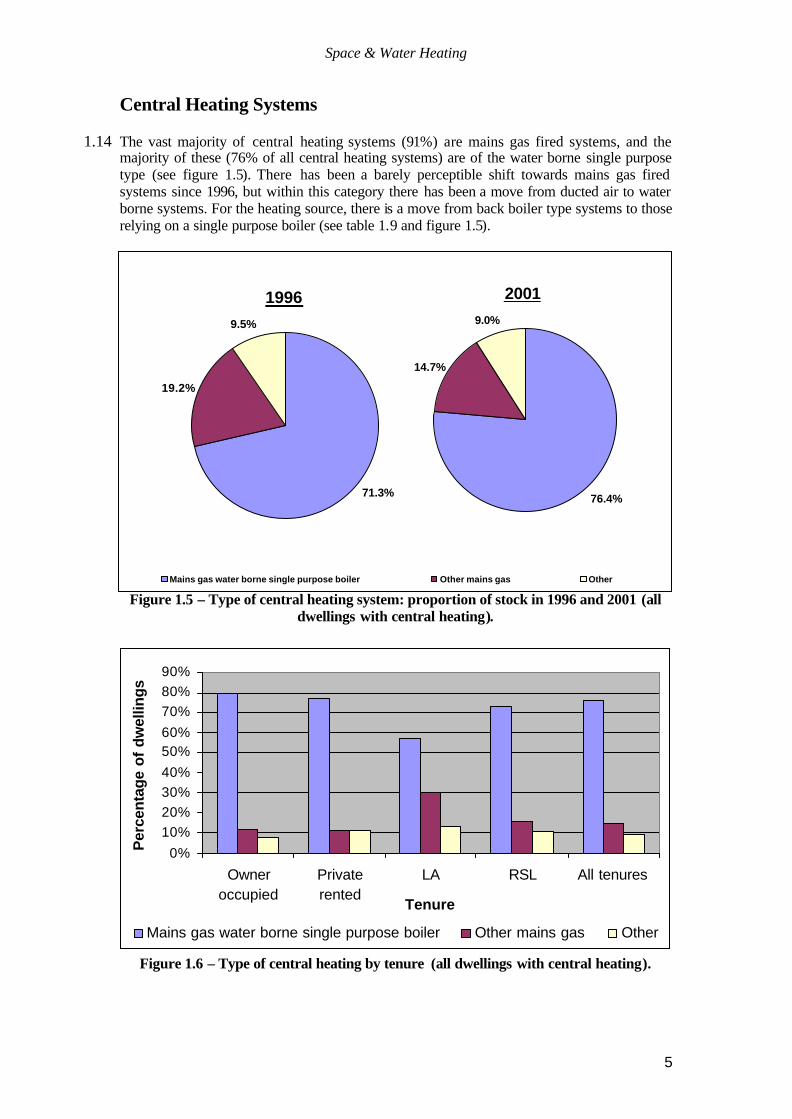
1.14 The vast majority of central heating systems (91%) are mains gas fired systems, and the majority of these (76% of all central heating systems) are of the water borne single purpose type (see figure 1.5). There has been a barely perceptible shift towards mains gas fired systems since 1996, but within this category there has been a move from ducted air to water borne systems. For the heating source, there is a move from back boiler type systems to those relying on a single purpose boiler (see table 1.9 and figure 1.5).
Figure 1.5 – Type of central heating system: proportion of stock in 1996 and 2001 (all dwellings with central heating).
Figure 1.6 – Type of central heating by tenure (all dwellings with central heating).
76.4%
14.7%
9.0%
Mains gas water borne single purpose boiler Other mains gas Other
71.3%
19.2%
9.5%
1996 2001
0%
10%20%30%40%
50%60%
70%80%90%
Owneroccupied
Privaterented
LA RSL All tenures
Tenure
Per
cent
age
of d
wel
lings
Mains gas water borne single purpose boiler Other mains gas Other

Space & Water Heating
6
1.15 Over one quarter of central heating boilers are combination boilers (which heat water on demand). These are particularly favoured in the private rented sector (38%) and to a lesser extent in the social rented sector. Combination boilers are most likely to be found in all types of flats, particularly in flat conversions (see table 1.11 and figure 1.6).
1.16 Overall, central heating boilers are spread throughout the age range, as shown in figure 1.7.
Most solid fuel systems are relatively old; only 10% are under 5 years old and the average age is around 16 years (compared to an average age of 12 years for all central heating systems). These systems are being replaced by mains gas or oil fired systems (see table 1.12).
Figure 1.7 – Age of central heating systems (all dwellings).
1.17 Under the assumption that a boiler that is 15 years old or more is coming up for replacement, there is scope for upgrading or installing new central heating systems. 70% of dwellings are already adequately served by relatively modern efficient systems. 14% of households have old gas powered central heating systems and half of the 14% without central heating have gas available; therefore a further 21% of the stock could have modern gas systems installed (see table 1.13).
1.18 Only 2% of the English housing stock is heated using communal systems or combined heat and power - this has remained almost constant between 1996 and 2001 (see table 1.14).
1.19 The vast majority of systems are controlled by a central timer – over 95% of the most popular
gas and oil systems may be controlled in this way. Time control is considerably less common for solid fuel and communal systems (see table 1.14).
1.20 Room thermostats switch off a heating system if the room temperature rises above the demand temperature. Thermostatic radiator valves (TRVs) provide temperature control for each radiator in the system. The latter is less common than the former but around 90% or so of the most popular systems have access to at least one of these temperature regulatory devices. Solid fuel and communal systems are less likely to have these types of control (table 1.14).
1.21 Central heating is most common in the owner occupied stock (present in around 90% of dwellings) and least common in the private rented sector (around 70%) - see table 1.2 and
0%
5%
10%
15%
20%
25%
30%
35%
40%
<3 3-5
6-10
11-1
5
16-2
5
>25 <3 3-5
6-10
11-1
5
16-2
5
>25 <3 3-5
6-10
11-1
5
16-2
5
>25
Age of system (years)
Per
cen
tag
e o
f sy
stem
typ
e
Central Heating Programmable Heating 'Other' Heating

Space & Water Heating
7
figure 1.2. In all tenures the favoured system is the mains gas water borne system, particularly in the owner occupied stock. Many local authority and social rented dwellings (up to 25%) use ducted air or other alternative gas systems. Not surprisingly, communal heating is concentrated in the local authority and social rented sectors (around 7% of dwellings in each of these tenures rely upon this form of heating) - see table 1.10 and figure 1.6. Programmable Heating Systems
1.22 The most common programmable heating systems are electric storage radiators. Around 13% of dwellings with storage radiators also have central heating, although 20% of dwellings with storage radiators rely on these systems entirely for their space heating needs (see table 1.15). The use of storage radiators is concentrated in the 14% of the housing stock with no gas supply - 74% of all storage radiators are found in these dwellings (see table 1.16).
1.23 The other forms of programmable heaters (gas convectors, and non-storage electrical
radiators) are fairly rare, being found in only 7% of all dwellings with a programmable system. Half of these dwellings also have central heating and so these heaters would be considered as subsidiary heating (table 1.15).
1.24 Programmable heating systems tend to be old (as shown in figure 1.7 and table 1.17). 36% of all programmable systems are more than 25 years old.
1.25 The use of programmable heating is concentrated in the private and social rented tenures and in all types of flats but particularly purpose built ones. The demographic characteristics of the main users tend to be the under 25s and the over 65s; in general the older the household the more likely it is that programmable heating is employed (see table 1.18). Other Space Heating Systems
1.26 There is a range of individual room devices used either for the primary heating in a home or supplementary heating alongside central heating/programmable systems. Around 75% of dwellings have other forms of heating but just 6% have only this type of heating (see table 1.1).
1.27 The dominant type of room heater is the mains gas fire, making up around 61% of all types. It is even more prevalent in dwellings where individual room appliances are the sole source of warmth. Electric fires/radiators, electrical portable heaters, solid fuel fires or stoves make up the other types of room heater employed (table 1.19). Electrical heaters are frequently used to supplement storage radiator systems.
1.28 Amongst properties with gas or oil fired central heating, supplementary heating tends to provide some visual focus, such as gas or solid fuel fires. Solid fuel central heating systems are often backed up by solid fuel fires, and electrical central heating systems or communally supplied heating are more often supplemented by other electrical appliances (see table 1.20).
1.29 The age distribution of other heating systems is shown in figure 1.7 and table 1.21. Solid fuel fireplaces are seldom found in modern dwellings whereas solid fuel stoves, though relatively few in number, are found across the entire age range. More than 30% of solid fuel stoves are 5 years old or less, underlining a trend for this type of heating that probably relates more to aesthetic appeal than to being particularly effective space heating appliances.

Space & Water Heating
8
Water Heating
Figure 2.1: Types of water heating system (all dwellings).
2.1 Almost all dwellings in 2001 have a system for supplying hot water on demand. 2.2 Hot water is supplied by combined central heating / hot water systems (~85% of dwellings),
immersion heaters (~59%), instantaneous heaters (~14%) and a few separate single purpose water boilers (~2%) - see table 2.1 and figure 2.1.
2.3 Around three quarters of those with central heating / hot water systems make use of a cylinder for storage of the water, and the rest employ a combination boiler (see table 1.11).
2.4 Around 47% of dwellings have only one source of hot water available, with 34% relying on hot water from central heating boilers. 6% of the stock has access to three or more sources (see table 2.2).
2.5 Over three quarters of immersion heaters are used as back-up to a central heating system, or perhaps as an alternative in the summer months, with only 11% of dwellings relying entirely on an immersion heater. Similarly, individual instantaneous heaters are infrequently used as the sole means of heating water but generally as back up to the central heating system (table 2.2).
2.6 13% of all dwellings have some form of individual instantaneous water heater. The majority
of these are of the ‘electric – single point’ type, for example, power showers (see table 2.12). 2.7 Traditional heating systems – separate hot water boilers and immersion heaters - tend to be
relatively old. Instantaneous heaters and combined space and water heating systems are of all ages (see table 2.11).
2.8 Owner occupied dwellings are most likely to obtain hot water from a central heating system. The greatest proportion of immersion heaters is found in private and social rental properties (see table 2.3).
0%
10%
20%
30%
40%
50%
60%
70%
80%
90%
With central heating Single purposeboiler
Immersion heater Instantaneousheater
Water heating system
Per
cen
tag
e o
f dw
ellin
gs

Space & Water Heating
9
2.9 Water heating provision does not vary dramatically with dwelling age. Older dwellings are slightly less likely to have hot-water supplied by a central heating system. A relatively high proportion of the post 1980 stock rely exclusively on immersion heaters for hot water (16%) - see table 2.4.
2.10 Flats are less likely to have combined hot-water / central heating systems than houses or bungalows - 95% of detached houses use these systems compared with only 53% of high-rise flats. Immersion heaters are more prevalent in flats with 36% of high rise purpose built flats relying solely on immersion heaters. Smaller houses are also more likely to use immersion heaters – 15% of small terraced houses rely solely on an immersion heater, compared to 3% of detached houses (see table 2.5).
2.11 It is most common to heat hot water within a combined central heating / hot water boiler in the North East (where central heating is most prevalent) and least common in the South West (where it is rarest). Reliance on immersion heaters is most common in the South West and least common in the North East. There are considerable regional differences when considering those dwellings that rely solely on a combined central heating / hot water systems and those employing multiple systems. Within both London and the South East ~83% of dwellings have the capacity to heat water together with their central heating system. In the South East around three-quarters of these dwellings also have access to at least one additional method of heating water, whereas in London only half have such access (see table 2.6).
2.12 Households in which the HRP is under 25 or over 75 are less likely to employ a combined hot water / central heating system and more likely to rely solely on an immersion heater. In the over 85 age band, a high percentage (22%) are entirely dependent on an immersion heater for hot water (see table 2.7).
2.13 Dwellings housing one person are least likely to employ a combined hot water / central heating system (70-73%) and couples with dependent child(ren) are most likely (90%). Where a combined system is not used, the majority of households rely solely on an immersion heater (see table 2.8).
2.14 Households where at least one person works full time are most likely to heat hot water along with a central heating boiler (86%), those working part-time less so (81%) and those where none are working the least of all (77-78%) - see table 2.9.
2.15 Households on lower incomes are more likely to rely solely on an instantaneous or immersion heater for their hot water - 20% of those in the lowest income quintile have instantaneous or immersion heaters as their sole water heating provision, compared to just 4% of those in the top income quintile (see table 2.10). CHANGE IN WATER HEATING PROVISION SINCE 1996:
2.16 There has been an increase in the proportion of households able to heat water along with their central heating system since 1996. In 1996 around 74% of households had a combined hot water / central heating system – this rises to 84% in 2001. This rise partly reflects the increased levels of central heating. The amount of dwellings able to make use of an immersion heater has dropped from 64% to 59% (see table 2.1 and figure 2.2).
2.17 The incidence of individual instantaneous heaters has increased. The majority of these are
likely to be power showers which in recent years have become popular in dwellings where the plumbing facilities do not permit stored water showers to operate (see table 2.2)

Space & Water Heating
10
Figure 2.2: Types of water heating system 1996 and 2001 (all dwellings).
Fuel Use for Space & Water Heating
3.1 40% of dwellings use only one fuel for space and water heating: 30% rely on mains gas, 9%
on electricity and <1% on solid fuel or fuel oil. The use of electricity as the single fuel is highest in the private rented and registered social landlord sectors, with almost 20% of dwellings in these sectors only using electricity for their heating needs. Most householders use a combination of mains gas with electricity (~48%) - see table 3.1 and figure 3.1.
3.2 3% of the stock uses fuel oil, and these are mostly in the owner occupied sector. The private
rented and local authority tenures are the main users of solid fuel, with almost 1% of the private rented sector using only solid fuel for their space and water heating needs.
0%
10%
20%
30%
40%
50%
60%
Owneroccupied
Privaterented
LA RSL All tenuresTenure
Per
cen
tag
e o
f d
wel
ling
s
electricity only mains gas only mains gas + electricity other combination
Figure 3.1: Combination of heating fuels by tenure (all dwellings).
0%
10%
20%
30%
40%
50%
60%
70%
80%
90%
With centralheating
Single purposeboiler
Immersion heater Instantaneousheater
Water Heating System
Per
cen
tag
e o
f d
wel
ling
s
1996 2001
Space & Water Heating
11
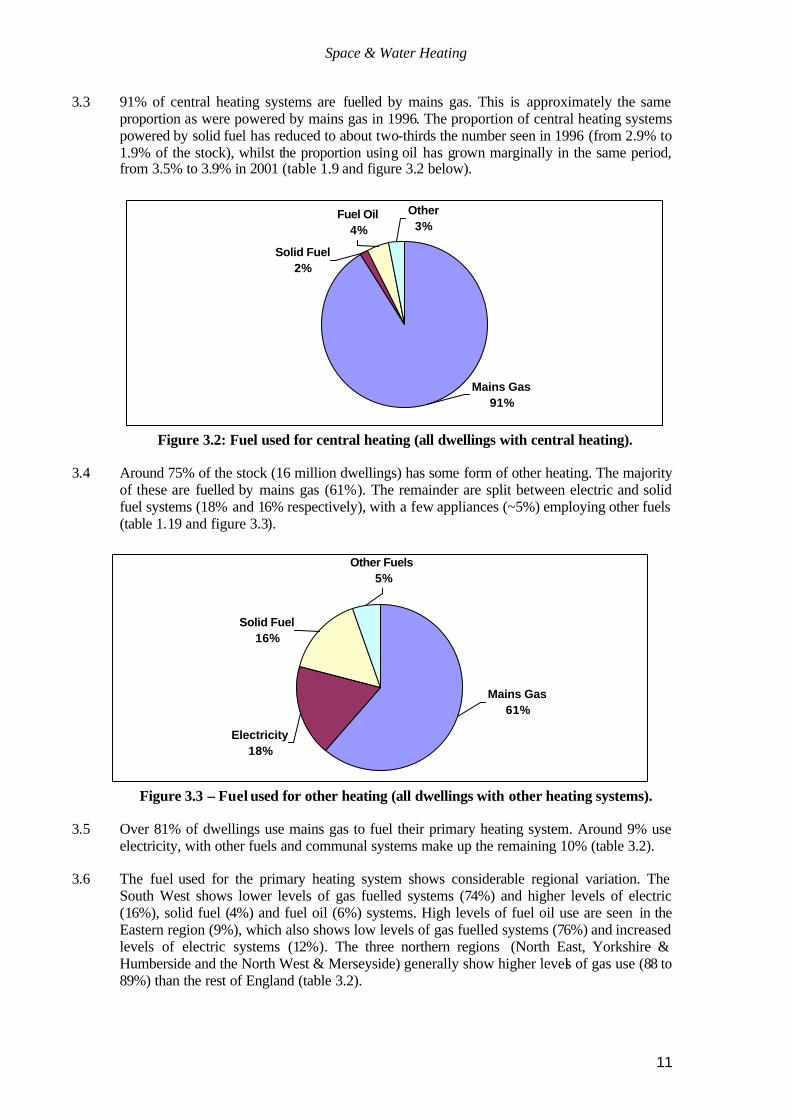
3.3 91% of central heating systems are fuelled by mains gas. This is approximately the same proportion as were powered by mains gas in 1996. The proportion of central heating systems powered by solid fuel has reduced to about two-thirds the number seen in 1996 (from 2.9% to 1.9% of the stock), whilst the proportion using oil has grown marginally in the same period, from 3.5% to 3.9% in 2001 (table 1.9 and figure 3.2 below).
Figure 3.2: Fuel used for central heating (all dwellings with central heating). 3.4 Around 75% of the stock (16 million dwellings) has some form of other heating. The majority
of these are fuelled by mains gas (61%). The remainder are split between electric and solid fuel systems (18% and 16% respectively), with a few appliances (~5%) employing other fuels (table 1.19 and figure 3.3).
Figure 3.3 – Fuel used for other heating (all dwellings with other heating systems). 3.5 Over 81% of dwellings use mains gas to fuel their primary heating system. Around 9% use
electricity, with other fuels and communal systems make up the remaining 10% (table 3.2).
3.6 The fuel used for the primary heating system shows considerable regional variation. The South West shows lower levels of gas fuelled systems (74%) and higher levels of electric (16%), solid fuel (4%) and fuel oil (6%) systems. High levels of fuel oil use are seen in the Eastern region (9%), which also shows low levels of gas fuelled systems (76%) and increased levels of electric systems (12%). The three northern regions (North East, Yorkshire & Humberside and the North West & Merseyside) generally show higher levels of gas use (88 to 89%) than the rest of England (table 3.2).
Mains Gas61%
Electricity18%
Solid Fuel16%
Other Fuels5%
Mains Gas91%
Solid Fuel2%
Fuel Oil4%
Other3%

INDEX TO SPACE AND WATER HEATING TABLES
Table 1.1: Space heating provision 2001Table 1.2: Space heating provision by TenureTable 1.3: Space heating provision by dwelling ageTable 1.4: Space heating provision by dwelling typeTable 1.5: Space heating provision by Government Office regionTable 1.6: Space heating provision by age of HRPTable 1.7: Space heating provision by household typeTable 1.8: Space heating provision by houshold income quintile.Table 1.9: Type of central heating system in use in 2001 and 1996 (percentages of all dwellings with central heating)Table 1.10: Type of central heating by tenure (percentage of dwellings with central heating within each tenure)Table 1.11: Use of ‘Combi’ type systems for central heating and hot water (percentages by tenure and dwelling type)Table 1.12: Age of central heating systems in 2001 (age profile in percentages for each type of central heating system)Table 1.13: The ‘need’ for renewal of existing central heating, and the scope installing a gas systemTable 1.14: Provision of controls in central heating systems in 2001 (percentage of each type of system with given controls)Table 1.15: Characteristics of programmable heating systems (percentages of dwellings with programmable heating)Table 1.16: The relationship between gas supply and use of electric storage radiators (percentages of dwellings with storage radiators)Table 1.17: Age of programmable heating systems (percentages of dwellings with a given type of programmable heating)Table 1.18: Characteristics of dwellings with programmable heating (percentages of dwellings within in each subgroup which have programmable heating)Table 1.19: Characteristics of 'other' heating systems (percentages of dwellings with 'other' heating)Table 1.20: 'Other' heating used in association with central and programmable heating systems.Table 1.21: Age of 'other' heating provision (percentages of dwellings with a given type of heating)Table 2.1: Water heating provision 2001 and 1996 (percent of dwellings overall; and percent of dwellings with a hot water supply)Table 2.2: Water heating provision: combinations of appliances (percent of dwellings)Table 2.3: Water heating provision by tenureTable 2.4: Water heating provision by dwelling ageTable 2.5: Water heating provision by dwelling typeTable 2.6: Water heating provision by Government Office regionTable 2.7: Water heating provision by age of HRPTable 2.8: Water heating provision by household typeTable 2.9: Water heating provision by employment status of HRPTable 2.10: Water heating provision by income quintileTable 2.11: Age of water heaters (percent of heaters in a given age band)Table 2.12: The use of individual instantaneous heaters (percent of dwellings with this form of provision)Table 3.1: Profile of fuel usage for space and water heating by tenure (percentages within each tenure)Table 3.2: Fuel used for primary heating system by Government Office Region

Table 1.1: Space heating provision 2001
count (000s), (column%)
29( 0.1 )
1,290( 6.1 )
380( 1.8 )
1,262( 6.0 )
4,787( 22.6 )
13,006( 61.5 )
88( 0.4 )
298( 1.4 )
21,140( 100.0 )
18,177( 86.0 )
1,600( 7.6 )
1,305( 6.2 )
58( 0.3 )
21,140( 100.0 )
base: All dwellings(grossed by dwellings).
Full Heating Provision Number of dwellings
None
Other only
Programmable only
Programmable + other
CH only
Number of dwellings
CH + other
CH + programmable
CH + programmable + other
Total
Fixed heaters
Non-fixed heaters
Total
Primary Heating Provision
Central heating
Programable

Table 1.2: Space heating provision by Tenure
count(000s), (row%), (column%)
Owner occupied Private rented LA RSL13 11 4 1 29
( 45.8 ) ( 38.6 ) ( 12.3 ) ( 3.4 ) ( 100.0 )( 0.1 ) ( 0.5 ) ( 0.1 ) ( 0.1 ) ( 0.1 )
732 301 207 51 1,290( 56.8 ) ( 23.3 ) ( 16.0 ) ( 3.9 ) ( 100.0 )( 5.0 ) ( 13.7 ) ( 7.4 ) ( 3.6 ) ( 6.1 )
142 95 70 73 380( 37.3 ) ( 25.0 ) ( 18.5 ) ( 19.2 ) ( 100.0 )( 1.0 ) ( 4.3 ) ( 2.5 ) ( 5.2 ) ( 1.8 )
674 256 178 154 1,262( 53.4 ) ( 20.2 ) ( 14.1 ) ( 12.2 ) ( 100.0 )( 4.6 ) ( 11.7 ) ( 6.4 ) ( 11.1 ) ( 6.0 )
2,810 610 811 556 4,787( 58.7 ) ( 12.7 ) ( 16.9 ) ( 11.6 ) ( 100.0 )( 19.0 ) ( 27.8 ) ( 29.1 ) ( 40.1 ) ( 22.6 )
10,133 872 1,477 525 13,006( 77.9 ) ( 6.7 ) ( 11.4 ) ( 4.0 ) ( 100.0 )( 68.6 ) ( 39.8 ) ( 52.9 ) ( 37.8 ) ( 61.5 )
52 10 15 11 88( 58.8 ) ( 11.6 ) ( 16.5 ) ( 13.1 ) ( 100.0 )( 0.4 ) ( 0.5 ) ( 0.5 ) ( 0.8 ) ( 0.4 )
215 37 29 17 298( 72.1 ) ( 12.6 ) ( 9.6 ) ( 5.7 ) ( 100.0 )( 1.5 ) ( 1.7 ) ( 1.0 ) ( 1.2 ) ( 1.4 )
14,771 2,191 2,790 1,388 21,140( 69.9 ) ( 10.4 ) ( 13.2 ) ( 6.6 ) ( 100.0 )( 100.0 ) ( 100.0 ) ( 100.0 ) ( 100.0 ) ( 100.0 )
Primary heating provision
13,210 1,527 2,331 1,109 18,177( 72.7 ) ( 8.4 ) ( 12.8 ) ( 6.1 ) ( 100.0 )( 89.4 ) ( 69.7 ) ( 83.5 ) ( 79.9 ) ( 86.0 )
795 340 242 223 1,600( 49.7 ) ( 21.3 ) ( 15.1 ) ( 14.0 ) ( 100.0 )( 5.4 ) ( 15.5 ) ( 8.7 ) ( 16.1 ) ( 7.6 )
734 304 213 54 1,305( 56.2 ) ( 23.3 ) ( 16.3 ) ( 4.1 ) ( 100.0 )( 5.0 ) ( 13.9 ) ( 7.6 ) ( 3.9 ) ( 6.2 )
32 20 4 1 58( 55.9 ) ( 34.6 ) ( 7.2 ) ( 2.3 ) ( 100.0 )( 0.2 ) ( 0.9 ) ( 0.1 ) ( 0.1 ) ( 0.3 )
14,771 2,191 2,790 1,388 21,140( 69.9 ) ( 10.4 ) ( 13.2 ) ( 6.6 ) ( 100.0 )( 100.0 ) ( 100.0 ) ( 100.0 ) ( 100.0 ) ( 100.0 )
base: All dwellings(grossed by dwellings).
Fixed heaters
Non-fixed heaters
Total
Tenure:
Programmable + other
CH only
Programmable
Central heating
CH + other
CH + programmable
CH + programmable + other
Total
Full Heating Provision All tenures
None
Other only
Programmable only

Table 1.3: Space heating provision by dwelling age
count(000s), (row%), (column%)
Pre 1919 1919-1944 1945-1964 1965-1980 Post 198018 6 3 2 0 29
( 62.5 ) ( 19.8 ) ( 10.9 ) ( 6.8 ) ( 0.0 ) ( 100.0 )( 0.4 ) ( 0.2 ) ( 0.1 ) ( 0.0 ) ( 0.0 ) ( 0.1 )
534 269 300 104 83 1,290( 41.4 ) ( 20.9 ) ( 23.3 ) ( 8.0 ) ( 6.5 ) ( 100.0 )( 12.1 ) ( 7.2 ) ( 6.7 ) ( 2.3 ) ( 2.1 ) ( 6.1 )
44 21 44 94 177 380( 11.5 ) ( 5.6 ) ( 11.5 ) ( 24.6 ) ( 46.7 ) ( 100.0 )( 1.0 ) ( 0.6 ) ( 1.0 ) ( 2.0 ) ( 4.5 ) ( 1.8 )
236 101 235 288 402 1,262( 18.7 ) ( 8.0 ) ( 18.6 ) ( 22.8 ) ( 31.8 ) ( 100.0 )( 5.4 ) ( 2.7 ) ( 5.2 ) ( 6.3 ) ( 10.3 ) ( 6.0 )
799 669 693 1,472 1,155 4,787( 16.7 ) ( 14.0 ) ( 14.5 ) ( 30.7 ) ( 24.1 ) ( 100.0 )( 18.1 ) ( 17.9 ) ( 15.5 ) ( 32.0 ) ( 29.5 ) ( 22.6 )
2,665 2,631 3,123 2,563 2,023 13,006( 20.5 ) ( 20.2 ) ( 24.0 ) ( 19.7 ) ( 15.6 ) ( 100.0 )( 60.5 ) ( 70.4 ) ( 69.8 ) ( 55.7 ) ( 51.7 ) ( 61.5 )
14 9 15 26 24 88( 15.7 ) ( 10.2 ) ( 16.7 ) ( 29.8 ) ( 27.7 ) ( 100.0 )( 0.3 ) ( 0.2 ) ( 0.3 ) ( 0.6 ) ( 0.6 ) ( 0.4 )
95 33 64 56 50 298( 32.0 ) ( 11.2 ) ( 21.4 ) ( 18.7 ) ( 16.7 ) ( 100.0 )( 2.2 ) ( 0.9 ) ( 1.4 ) ( 1.2 ) ( 1.3 ) ( 1.4 )
4,406 3,739 4,476 4,604 3,915 21,140( 20.8 ) ( 17.7 ) ( 21.2 ) ( 21.8 ) ( 18.5 ) ( 100.0 )( 100.0 ) ( 100.0 ) ( 100.0 ) ( 100.0 ) ( 100.0 ) ( 100.0 )
Primary heating provision
3,573 3,342 3,894 4,116 3,252 18,177( 19.7 ) ( 18.4 ) ( 21.4 ) ( 22.6 ) ( 17.9 ) ( 100.0 )( 81.1 ) ( 89.4 ) ( 87.0 ) ( 89.4 ) ( 83.1 ) ( 86.0 )
274 117 269 374 567 1,600( 17.1 ) ( 7.3 ) ( 16.8 ) ( 23.4 ) ( 35.4 ) ( 100.0 )( 6.2 ) ( 3.1 ) ( 6.0 ) ( 8.1 ) ( 14.5 ) ( 7.6 )
541 264 296 109 95 1,305( 41.5 ) ( 20.2 ) ( 22.7 ) ( 8.3 ) ( 7.3 ) ( 100.0 )( 12.3 ) ( 7.1 ) ( 6.6 ) ( 2.4 ) ( 2.4 ) ( 6.2 )
18 16 18 5 1 58( 31.1 ) ( 27.6 ) ( 31.0 ) ( 8.8 ) ( 1.5 ) ( 100.0 )( 0.4 ) ( 0.4 ) ( 0.4 ) ( 0.1 ) ( 0.0 ) ( 0.3 )
4,406 3,739 4,476 4,604 3,915 21,140( 20.8 ) ( 17.7 ) ( 21.2 ) ( 21.8 ) ( 18.5 ) ( 100.0 )( 100.0 ) ( 100.0 ) ( 100.0 ) ( 100.0 ) ( 100.0 ) ( 100.0 )
base: All dwellings(grossed by dwellings).
Total
Non-fixed heaters
Fixed heaters
Programmable
CH + other
CH only
Programmable + other
Central heating
Total
CH + programmable + other
CH + programmable
Dwelling age Total
Programmable only
Other only
None
Full Heating Provision

Table 1.4: Space heating provision by dwelling type
count(000s), (row%), (column%)
Small terraced house
Medium / large terraced house
Semi-detached
house
Detached house
BungalowConverted
flatPurpose built flat, low rise
Purpose built flat, high rise
6 5 2 3 5 7 1 0 29
( 20.2 ) ( 16.3 ) ( 6.8 ) ( 11.3 ) ( 18.7 ) ( 23.9 ) ( 2.8 ) ( 0.0 ) ( 100.0 )
( 0.2 ) ( 0.1 ) ( 0.0 ) ( 0.1 ) ( 0.3 ) ( 1.0 ) ( 0.0 ) ( 0.0 ) ( 0.1 )
362 251 313 36 33 94 195 7 1,290
( 28.0 ) ( 19.5 ) ( 24.2 ) ( 2.8 ) ( 2.5 ) ( 7.3 ) ( 15.1 ) ( 0.5 ) ( 100.0 )
( 13.6 ) ( 7.5 ) ( 5.3 ) ( 1.1 ) ( 1.6 ) ( 13.6 ) ( 6.7 ) ( 2.0 ) ( 6.1 )
35 25 25 2 26 26 196 43 380
( 9.3 ) ( 6.6 ) ( 6.7 ) ( 0.6 ) ( 6.9 ) ( 7.0 ) ( 51.5 ) ( 11.4 ) ( 100.0 )
( 1.3 ) ( 0.8 ) ( 0.4 ) ( 0.1 ) ( 1.3 ) ( 3.8 ) ( 6.7 ) ( 12.9 ) ( 1.8 )
178 112 219 46 154 68 425 62 1,262
( 14.1 ) ( 8.9 ) ( 17.4 ) ( 3.6 ) ( 12.2 ) ( 5.4 ) ( 33.6 ) ( 4.9 ) ( 100.0 )
( 6.7 ) ( 3.4 ) ( 3.7 ) ( 1.4 ) ( 7.5 ) ( 9.8 ) ( 14.5 ) ( 18.6 ) ( 6.0 )
697 915 928 425 326 242 1,105 149 4,787
( 14.6 ) ( 19.1 ) ( 19.4 ) ( 8.9 ) ( 6.8 ) ( 5.1 ) ( 23.1 ) ( 3.1 ) ( 100.0 )
( 26.2 ) ( 27.4 ) ( 15.9 ) ( 13.0 ) ( 15.9 ) ( 35.0 ) ( 37.7 ) ( 44.4 ) ( 22.6 )
1,330 1,967 4,298 2,701 1,466 243 934 67 13,006
( 10.2 ) ( 15.1 ) ( 33.0 ) ( 20.8 ) ( 11.3 ) ( 1.9 ) ( 7.2 ) ( 0.5 ) ( 100.0 )
( 50.0 ) ( 58.8 ) ( 73.4 ) ( 82.5 ) ( 71.3 ) ( 35.2 ) ( 31.9 ) ( 20.0 ) ( 61.5 )
11 9 16 10 4 4 30 3 88
( 12.5 ) ( 10.8 ) ( 18.3 ) ( 10.9 ) ( 4.9 ) ( 5.1 ) ( 33.8 ) ( 3.8 ) ( 100.0 )
( 0.4 ) ( 0.3 ) ( 0.3 ) ( 0.3 ) ( 0.2 ) ( 0.6 ) ( 1.0 ) ( 1.0 ) ( 0.4 )
42 60 51 51 41 7 44 4 298
( 14.0 ) ( 19.9 ) ( 17.1 ) ( 16.9 ) ( 13.7 ) ( 2.2 ) ( 14.8 ) ( 1.3 ) ( 100.0 )
( 1.6 ) ( 1.8 ) ( 0.9 ) ( 1.5 ) ( 2.0 ) ( 0.9 ) ( 1.5 ) ( 1.2 ) ( 1.4 )
2,660 3,344 5,853 3,273 2,055 691 2,929 335 21,140
( 12.6 ) ( 15.8 ) ( 27.7 ) ( 15.5 ) ( 9.7 ) ( 3.3 ) ( 13.9 ) ( 1.6 ) ( 100.0 )
( 100.0 ) ( 100.0 ) ( 100.0 ) ( 100.0 ) ( 100.0 ) ( 100.0 ) ( 100.0 ) ( 100.0 ) ( 100.0 )
Primary heating provision
2,080 2,951 5,292 3,185 1,837 496 2,113 223 18,177
( 11.4 ) ( 16.2 ) ( 29.1 ) ( 17.5 ) ( 10.1 ) ( 2.7 ) ( 11.6 ) ( 1.2 ) ( 100.0 )
( 78.2 ) ( 88.2 ) ( 90.4 ) ( 97.3 ) ( 89.4 ) ( 71.8 ) ( 72.1 ) ( 66.6 ) ( 86.0 )
210 133 234 49 178 91 600 105 1,600
( 13.1 ) ( 8.3 ) ( 14.6 ) ( 3.1 ) ( 11.1 ) ( 5.7 ) ( 37.5 ) ( 6.6 ) ( 100.0 )
( 7.9 ) ( 4.0 ) ( 4.0 ) ( 1.5 ) ( 8.6 ) ( 13.1 ) ( 20.5 ) ( 31.4 ) ( 7.6 )
365 255 310 38 39 91 199 7 1,305
( 27.9 ) ( 19.6 ) ( 23.7 ) ( 2.9 ) ( 3.0 ) ( 7.0 ) ( 15.3 ) ( 0.5 ) ( 100.0 )
( 13.7 ) ( 7.6 ) ( 5.3 ) ( 1.2 ) ( 1.9 ) ( 13.2 ) ( 6.8 ) ( 2.1 ) ( 6.2 )
5 5 16 1 1 13 16 0 58
( 9.4 ) ( 8.8 ) ( 27.9 ) ( 2.5 ) ( 1.5 ) ( 21.9 ) ( 28.1 ) ( 0.0 ) ( 100.0 )
( 0.2 ) ( 0.2 ) ( 0.3 ) ( 0.0 ) ( 0.0 ) ( 1.8 ) ( 0.6 ) ( 0.0 ) ( 0.3 )
2,660 3,344 5,853 3,273 2,055 691 2,929 335 21,140
( 12.6 ) ( 15.8 ) ( 27.7 ) ( 15.5 ) ( 9.7 ) ( 3.3 ) ( 13.9 ) ( 1.6 ) ( 100.0 )
( 100.0 ) ( 100.0 ) ( 100.0 ) ( 100.0 ) ( 100.0 ) ( 100.0 ) ( 100.0 ) ( 100.0 ) ( 100.0 )
base: All dwellings (grossed by dwellings).
Programmable + other
CH only
All Dwellings
None
Other only
Programmable only
Dwelling Type
Total
Full heating provision
Central heating
Programmable
Fixed heaters
Non-fixed heaters
CH + other
CH + programmable
CH + programmable + other
Total

Table 1.5: Space heating provision by Government Office region
count(000s), (row%), (column%)
North EastYorkshire & Humberside
North West & Merseyside
East Midlands
West Midlands
South West
EasternSouth East
London
0 1 5 3 2 0 5 4 8 29
( 0.0 ) ( 5.2 ) ( 16.5 ) ( 10.7 ) ( 8.0 ) ( 1.7 ) ( 16.4 ) ( 15.1 ) ( 26.4 ) ( 100.0 )
( 0.0 ) ( 0.1 ) ( 0.2 ) ( 0.2 ) ( 0.1 ) ( 0.0 ) ( 0.2 ) ( 0.1 ) ( 0.2 ) ( 0.1 )
31 228 272 63 200 134 83 124 155 1,290
( 2.4 ) ( 17.6 ) ( 21.1 ) ( 4.9 ) ( 15.5 ) ( 10.4 ) ( 6.5 ) ( 9.6 ) ( 12.0 ) ( 100.0 )
( 2.9 ) ( 10.3 ) ( 9.3 ) ( 3.4 ) ( 9.3 ) ( 6.3 ) ( 3.6 ) ( 3.6 ) ( 5.0 ) ( 6.1 )
11 15 23 24 18 63 63 75 87 380
( 3.0 ) ( 4.0 ) ( 6.0 ) ( 6.3 ) ( 4.7 ) ( 16.7 ) ( 16.6 ) ( 19.8 ) ( 22.9 ) ( 100.0 )
( 1.0 ) ( 0.7 ) ( 0.8 ) ( 1.3 ) ( 0.8 ) ( 3.0 ) ( 2.7 ) ( 2.2 ) ( 2.8 ) ( 1.8 )
41 94 177 109 137 215 161 212 116 1,262
( 3.2 ) ( 7.5 ) ( 14.0 ) ( 8.7 ) ( 10.9 ) ( 17.0 ) ( 12.7 ) ( 16.8 ) ( 9.2 ) ( 100.0 )
( 3.8 ) ( 4.3 ) ( 6.1 ) ( 5.9 ) ( 6.4 ) ( 10.2 ) ( 6.9 ) ( 6.2 ) ( 3.8 ) ( 6.0 )
157 251 322 247 261 437 646 1,030 1,437 4,787
( 3.3 ) ( 5.2 ) ( 6.7 ) ( 5.2 ) ( 5.5 ) ( 9.1 ) ( 13.5 ) ( 21.5 ) ( 30.0 ) ( 100.0 )
( 14.6 ) ( 11.4 ) ( 11.0 ) ( 13.4 ) ( 12.1 ) ( 20.6 ) ( 27.8 ) ( 30.1 ) ( 46.7 ) ( 22.6 )
813 1,598 2,077 1,357 1,495 1,200 1,319 1,914 1,232 13,006
( 6.2 ) ( 12.3 ) ( 16.0 ) ( 10.4 ) ( 11.5 ) ( 9.2 ) ( 10.1 ) ( 14.7 ) ( 9.5 ) ( 100.0 )
( 75.6 ) ( 72.4 ) ( 71.1 ) ( 73.7 ) ( 69.5 ) ( 56.7 ) ( 56.7 ) ( 55.9 ) ( 40.1 ) ( 61.5 )
7 4 3 5 2 13 19 16 19 88
( 8.2 ) ( 4.1 ) ( 3.7 ) ( 5.5 ) ( 2.6 ) ( 14.7 ) ( 21.4 ) ( 18.5 ) ( 21.2 ) ( 100.0 )
( 0.7 ) ( 0.2 ) ( 0.1 ) ( 0.3 ) ( 0.1 ) ( 0.6 ) ( 0.8 ) ( 0.5 ) ( 0.6 ) ( 0.4 )
14 16 41 33 36 55 31 51 22 298
( 4.8 ) ( 5.2 ) ( 13.7 ) ( 11.0 ) ( 12.0 ) ( 18.4 ) ( 10.4 ) ( 17.1 ) ( 7.5 ) ( 100.0 )
( 1.3 ) ( 0.7 ) ( 1.4 ) ( 1.8 ) ( 1.7 ) ( 2.6 ) ( 1.3 ) ( 1.5 ) ( 0.7 ) ( 1.4 )
1,074 2,207 2,919 1,841 2,151 2,119 2,327 3,428 3,076 21,140
( 5.1 ) ( 10.4 ) ( 13.8 ) ( 8.7 ) ( 10.2 ) ( 10.0 ) ( 11.0 ) ( 16.2 ) ( 14.5 ) ( 100.0 )
( 100.0 ) ( 100.0 ) ( 100.0 ) ( 100.0 ) ( 100.0 ) ( 100.0 ) ( 100.0 ) ( 100.0 ) ( 100.0 ) ( 100.0 )
Primary heating provision
991 1,866 2,441 1,642 1,794 1,705 2,015 3,012 2,710 18,177
( 5.5 ) ( 10.3 ) ( 13.4 ) ( 9.0 ) ( 9.9 ) ( 9.4 ) ( 11.1 ) ( 16.6 ) ( 14.9 ) ( 100.0 )
( 92.3 ) ( 84.6 ) ( 83.6 ) ( 89.2 ) ( 83.4 ) ( 80.5 ) ( 86.6 ) ( 87.9 ) ( 88.1 ) ( 86.0 )
51 110 192 130 152 272 219 277 198 1,600
( 3.2 ) ( 6.9 ) ( 12.0 ) ( 8.1 ) ( 9.5 ) ( 17.0 ) ( 13.7 ) ( 17.3 ) ( 12.4 ) ( 100.0 )
( 4.8 ) ( 5.0 ) ( 6.6 ) ( 7.1 ) ( 7.1 ) ( 12.8 ) ( 9.4 ) ( 8.1 ) ( 6.4 ) ( 7.6 )
30 224 278 67 199 135 89 129 153 1,305
( 2.3 ) ( 17.2 ) ( 21.3 ) ( 5.1 ) ( 15.2 ) ( 10.4 ) ( 6.8 ) ( 9.9 ) ( 11.8 ) ( 100.0 )
( 2.8 ) ( 10.2 ) ( 9.5 ) ( 3.7 ) ( 9.2 ) ( 6.4 ) ( 3.8 ) ( 3.8 ) ( 5.0 ) ( 6.2 )
2 6 7 2 6 6 4 10 14 58
( 2.7 ) ( 10.8 ) ( 12.6 ) ( 2.7 ) ( 11.1 ) ( 10.7 ) ( 7.1 ) ( 17.4 ) ( 24.9 ) ( 100.0 )
( 0.1 ) ( 0.3 ) ( 0.3 ) ( 0.1 ) ( 0.3 ) ( 0.3 ) ( 0.2 ) ( 0.3 ) ( 0.5 ) ( 0.3 )
1,074 2,207 2,919 1,841 2,151 2,119 2,327 3,428 3,076 21,140
( 5.1 ) ( 10.4 ) ( 13.8 ) ( 8.7 ) ( 10.2 ) ( 10.0 ) ( 11.0 ) ( 16.2 ) ( 14.5 ) ( 100.0 )
( 100.0 ) ( 100.0 ) ( 100.0 ) ( 100.0 ) ( 100.0 ) ( 100.0 ) ( 100.0 ) ( 100.0 ) ( 100.0 ) ( 100.0 )
base: All dwellings(grossed by dwellings).
Full Heating Provision
Government Office RegionAll Dwellings
Programmable only
Programmable + other
None
Other only
CH + programmable
CH + programmable + other
CH only
CH + other
Fixed heaters
Non-fixed heaters
Total
Total
Central heating
Programmable

Table 1.6: Space heating provision by age of HRP
count(000s), (row%), (column%)
up to 25 26-35 36-50 51-65 66-75 76-85 over 85 Unknown
3 1 7 0 0 0 0 0 11
( 25.3 ) ( 7.5 ) ( 63.3 ) ( 3.9 ) ( 0.0 ) ( 0.0 ) ( 0.0 ) ( 0.0 ) ( 100.0 )
( 0.3 ) ( 0.0 ) ( 0.1 ) ( 0.0 ) ( 0.0 ) ( 0.0 ) ( 0.0 ) ( 0.0 ) ( 0.1 )
82 189 305 272 184 146 39 0 1,216
( 6.7 ) ( 15.5 ) ( 25.1 ) ( 22.4 ) ( 15.1 ) ( 12.0 ) ( 3.2 ) ( 0.0 ) ( 100.0 )
( 7.7 ) ( 5.1 ) ( 5.0 ) ( 5.5 ) ( 7.1 ) ( 8.2 ) ( 10.3 ) ( 0.0 ) ( 5.9 )
79 87 63 50 30 42 9 0 359
( 21.9 ) ( 24.3 ) ( 17.4 ) ( 13.9 ) ( 8.5 ) ( 11.6 ) ( 2.5 ) ( 0.0 ) ( 100.0 )
( 7.4 ) ( 2.3 ) ( 1.0 ) ( 1.0 ) ( 1.2 ) ( 2.3 ) ( 2.4 ) ( 0.0 ) ( 1.8 )
90 225 245 222 193 191 49 0 1,215
( 7.4 ) ( 18.5 ) ( 20.1 ) ( 18.3 ) ( 15.9 ) ( 15.7 ) ( 4.0 ) ( 0.0 ) ( 100.0 )
( 8.5 ) ( 6.1 ) ( 4.1 ) ( 4.5 ) ( 7.4 ) ( 10.7 ) ( 13.0 ) ( 0.0 ) ( 5.9 )
382 1,181 1,408 837 410 311 62 0 4,593
( 8.3 ) ( 25.7 ) ( 30.7 ) ( 18.2 ) ( 8.9 ) ( 6.8 ) ( 1.4 ) ( 0.0 ) ( 100.0 )
( 36.0 ) ( 31.7 ) ( 23.3 ) ( 16.9 ) ( 15.8 ) ( 17.4 ) ( 16.7 ) ( 100.0 ) ( 22.4 )
406 1,987 3,914 3,471 1,702 1,053 200 0 12,733
( 3.2 ) ( 15.6 ) ( 30.7 ) ( 27.3 ) ( 13.4 ) ( 8.3 ) ( 1.6 ) ( 0.0 ) ( 100.0 )
( 38.3 ) ( 53.4 ) ( 64.8 ) ( 70.2 ) ( 65.7 ) ( 59.1 ) ( 53.5 ) ( 0.0 ) ( 62.1 )
6 13 24 22 12 5 4 0 86
( 6.9 ) ( 15.0 ) ( 27.7 ) ( 26.0 ) ( 14.2 ) ( 6.1 ) ( 4.1 ) ( 0.0 ) ( 100.0 )
( 0.6 ) ( 0.3 ) ( 0.4 ) ( 0.5 ) ( 0.5 ) ( 0.3 ) ( 0.9 ) ( 0.0 ) ( 0.4 )
14 37 72 67 60 34 12 0 296
( 4.7 ) ( 12.5 ) ( 24.5 ) ( 22.7 ) ( 20.1 ) ( 11.4 ) ( 4.0 ) ( 0.0 ) ( 100.0 )
( 1.3 ) ( 1.0 ) ( 1.2 ) ( 1.4 ) ( 2.3 ) ( 1.9 ) ( 3.2 ) ( 0.0 ) ( 1.4 )
1,062 3,720 6,038 4,943 2,591 1,781 375 0 20,510
( 5.2 ) ( 18.1 ) ( 29.4 ) ( 24.1 ) ( 12.6 ) ( 8.7 ) ( 1.8 ) ( 0.0 ) ( 100.0 )
( 100.0 ) ( 100.0 ) ( 100.0 ) ( 100.0 ) ( 100.0 ) ( 100.0 ) ( 100.0 ) ( 100.0 ) ( 100.0 )
Primary heating provision
809 3,218 5,419 4,397 2,184 1,402 277 0 17,706
( 4.6 ) ( 18.2 ) ( 30.6 ) ( 24.8 ) ( 12.3 ) ( 7.9 ) ( 1.6 ) ( 0.0 ) ( 100.0 )
( 76.2 ) ( 86.5 ) ( 89.7 ) ( 88.9 ) ( 84.3 ) ( 78.7 ) ( 74.0 ) ( 100.0 ) ( 86.3 )
166 295 303 265 219 228 58 0 1,534
( 10.8 ) ( 19.2 ) ( 19.7 ) ( 17.3 ) ( 14.3 ) ( 14.9 ) ( 3.8 ) ( 0.0 ) ( 100.0 )
( 15.7 ) ( 7.9 ) ( 5.0 ) ( 5.4 ) ( 8.4 ) ( 12.8 ) ( 15.5 ) ( 0.0 ) ( 7.5 )
80 199 306 264 182 147 37 0 1,214
( 6.6 ) ( 16.4 ) ( 25.2 ) ( 21.7 ) ( 15.0 ) ( 12.1 ) ( 3.1 ) ( 0.0 ) ( 100.0 )
( 7.6 ) ( 5.3 ) ( 5.1 ) ( 5.3 ) ( 7.0 ) ( 8.2 ) ( 9.9 ) ( 0.0 ) ( 5.9 )
6 8 11 18 7 4 2 0 56
( 11.2 ) ( 13.8 ) ( 19.1 ) ( 31.9 ) ( 12.8 ) ( 7.1 ) ( 4.0 ) ( 0.0 ) ( 100.0 )
( 0.6 ) ( 0.2 ) ( 0.2 ) ( 0.4 ) ( 0.3 ) ( 0.2 ) ( 0.6 ) ( 0.0 ) ( 0.3 )
1,062 3,720 6,038 4,943 2,591 1,781 375 0 20,510
( 5.2 ) ( 18.1 ) ( 29.4 ) ( 24.1 ) ( 12.6 ) ( 8.7 ) ( 1.8 ) ( 0.0 ) ( 100.0 )
( 100.0 ) ( 100.0 ) ( 100.0 ) ( 100.0 ) ( 100.0 ) ( 100.0 ) ( 100.0 ) ( 100.0 ) ( 100.0 )
base: All households(grossed by households).
Age of household reference person (HRP).All households
Total
None
Other only
Programmable only
Programmable + other
CH only
CH + other
Fixed heaters
Total
Non-fixed heaters
Full Heating Provision
CH + programmable
CH + programmable + other
Central heating
Programmable

Table 1.7: Space heating provision by household type
count(000s), (row%), (column%)
Couple, under 60: no dependent
child(ren)
Couple, 60 or over: no
dependent child(ren)
Couple: with dependent child(ren)
lone parent with dependent child(ren)
other multi-person
household
one person under 60
one person 60 or over
1 0 1 0 1 8 0 11( 13.0 ) ( 0.0 ) ( 11.5 ) ( 0.0 ) ( 7.0 ) ( 68.5 ) ( 0.0 ) ( 100.0 )( 0.0 ) ( 0.0 ) ( 0.0 ) ( 0.0 ) ( 0.1 ) ( 0.3 ) ( 0.0 ) ( 0.1 )
171 183 174 110 107 231 239 1,216( 14.0 ) ( 15.1 ) ( 14.3 ) ( 9.1 ) ( 8.8 ) ( 19.0 ) ( 19.7 ) ( 100.0 )( 4.2 ) ( 6.3 ) ( 3.5 ) ( 6.9 ) ( 7.4 ) ( 9.6 ) ( 7.8 ) ( 5.9 )
58 32 45 39 23 91 71 359( 16.0 ) ( 8.8 ) ( 12.6 ) ( 10.8 ) ( 6.4 ) ( 25.4 ) ( 19.8 ) ( 100.0 )( 1.4 ) ( 1.1 ) ( 0.9 ) ( 2.4 ) ( 1.6 ) ( 3.8 ) ( 2.3 ) ( 1.8 )
170 186 126 79 80 270 304 1,215( 14.0 ) ( 15.3 ) ( 10.4 ) ( 6.5 ) ( 6.6 ) ( 22.2 ) ( 25.0 ) ( 100.0 )( 4.2 ) ( 6.3 ) ( 2.5 ) ( 4.9 ) ( 5.5 ) ( 11.3 ) ( 9.9 ) ( 5.9 )
841 403 1,174 528 395 666 586 4,593( 18.3 ) ( 8.8 ) ( 25.6 ) ( 11.5 ) ( 8.6 ) ( 14.5 ) ( 12.8 ) ( 100.0 )( 20.6 ) ( 13.8 ) ( 23.6 ) ( 33.1 ) ( 27.4 ) ( 27.8 ) ( 19.0 ) ( 22.4 )
2,783 2,055 3,383 827 802 1,092 1,792 12,733( 21.9 ) ( 16.1 ) ( 26.6 ) ( 6.5 ) ( 6.3 ) ( 8.6 ) ( 14.1 ) ( 100.0 )( 68.1 ) ( 70.3 ) ( 67.8 ) ( 51.8 ) ( 55.6 ) ( 45.6 ) ( 58.3 ) ( 62.1 )
15 4 14 4 12 15 23 86( 17.5 ) ( 4.6 ) ( 16.2 ) ( 4.6 ) ( 13.4 ) ( 16.9 ) ( 26.9 ) ( 100.0 )( 0.4 ) ( 0.1 ) ( 0.3 ) ( 0.2 ) ( 0.8 ) ( 0.6 ) ( 0.8 ) ( 0.4 )
46 63 67 10 23 25 62 296( 15.7 ) ( 21.1 ) ( 22.7 ) ( 3.5 ) ( 7.8 ) ( 8.3 ) ( 20.8 ) ( 100.0 )( 1.1 ) ( 2.1 ) ( 1.4 ) ( 0.7 ) ( 1.6 ) ( 1.0 ) ( 2.0 ) ( 1.4 )
4,085 2,925 4,986 1,597 1,443 2,397 3,077 20,510( 19.9 ) ( 14.3 ) ( 24.3 ) ( 7.8 ) ( 7.0 ) ( 11.7 ) ( 15.0 ) ( 100.0 )( 100.0 ) ( 100.0 ) ( 100.0 ) ( 100.0 ) ( 100.0 ) ( 100.0 ) ( 100.0 ) ( 100.0 )
Primary heating provision
3,684 2,524 4,639 1,369 1,231 1,797 2,461 17,706( 20.8 ) ( 14.3 ) ( 26.2 ) ( 7.7 ) ( 7.0 ) ( 10.1 ) ( 13.9 ) ( 100.0 )( 90.2 ) ( 86.3 ) ( 93.0 ) ( 85.7 ) ( 85.3 ) ( 75.0 ) ( 80.0 ) ( 86.3 )
217 211 168 116 98 355 369 1,534( 14.1 ) ( 13.7 ) ( 11.0 ) ( 7.6 ) ( 6.4 ) ( 23.1 ) ( 24.1 ) ( 100.0 )( 5.3 ) ( 7.2 ) ( 3.4 ) ( 7.3 ) ( 6.8 ) ( 14.8 ) ( 12.0 ) ( 7.5 )
175 179 173 109 106 235 238 1,214( 14.4 ) ( 14.7 ) ( 14.3 ) ( 8.9 ) ( 8.7 ) ( 19.3 ) ( 19.6 ) ( 100.0 )( 4.3 ) ( 6.1 ) ( 3.5 ) ( 6.8 ) ( 7.3 ) ( 9.8 ) ( 7.7 ) ( 5.9 )
9 11 6 3 7 11 9 56( 16.4 ) ( 20.1 ) ( 10.2 ) ( 5.9 ) ( 12.8 ) ( 19.0 ) ( 15.6 ) ( 100.0 )( 0.2 ) ( 0.4 ) ( 0.1 ) ( 0.2 ) ( 0.5 ) ( 0.4 ) ( 0.3 ) ( 0.3 )
4,085 2,925 4,986 1,597 1,443 2,397 3,077 20,510( 19.9 ) ( 14.3 ) ( 24.3 ) ( 7.8 ) ( 7.0 ) ( 11.7 ) ( 15.0 ) ( 100.0 )( 100.0 ) ( 100.0 ) ( 100.0 ) ( 100.0 ) ( 100.0 ) ( 100.0 ) ( 100.0 ) ( 100.0 )
base: All households (grossed by households).
Full Heating Provision
Type of household
All households
None
Other only
Programmable only
Programmable + other
CH only
Total
CH + other
CH + programmable
CH + programmable +
other
Total
Central heating
Programmable
Fixed heaters
Non-fixed heaters
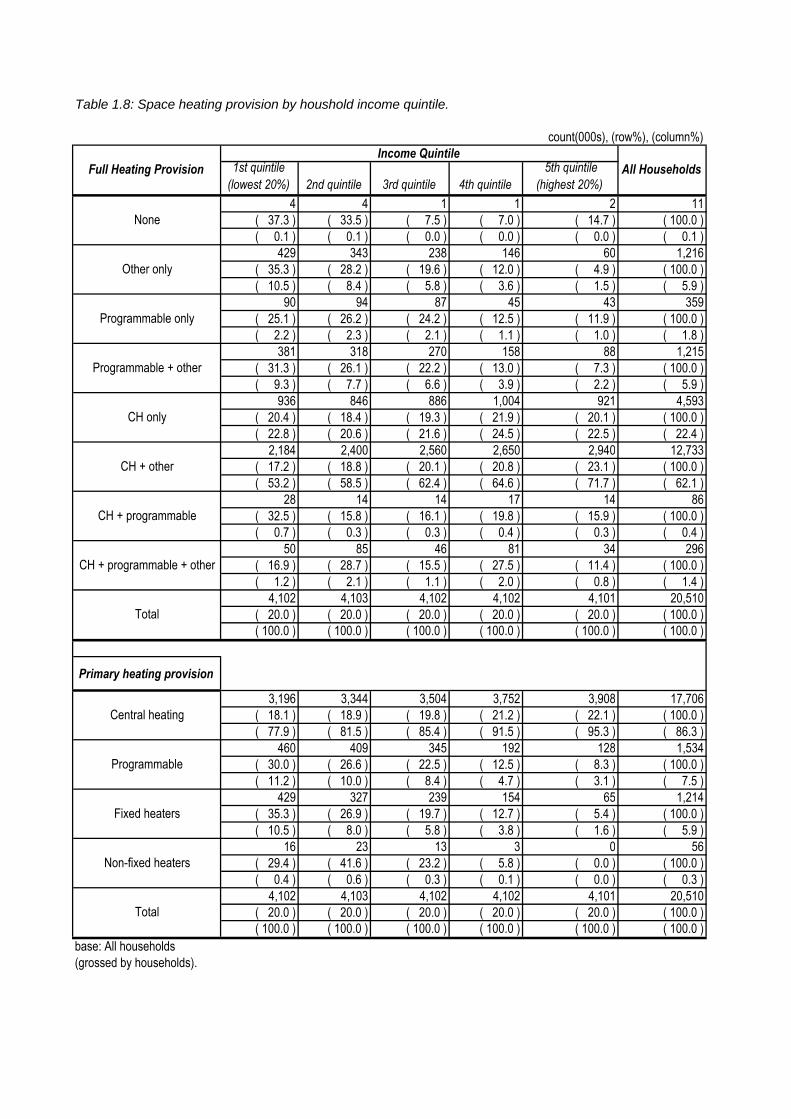
Table 1.8: Space heating provision by houshold income quintile.
count(000s), (row%), (column%)
1st quintile (lowest 20%) 2nd quintile 3rd quintile 4th quintile
5th quintile (highest 20%)
4 4 1 1 2 11( 37.3 ) ( 33.5 ) ( 7.5 ) ( 7.0 ) ( 14.7 ) ( 100.0 )( 0.1 ) ( 0.1 ) ( 0.0 ) ( 0.0 ) ( 0.0 ) ( 0.1 )
429 343 238 146 60 1,216( 35.3 ) ( 28.2 ) ( 19.6 ) ( 12.0 ) ( 4.9 ) ( 100.0 )( 10.5 ) ( 8.4 ) ( 5.8 ) ( 3.6 ) ( 1.5 ) ( 5.9 )
90 94 87 45 43 359( 25.1 ) ( 26.2 ) ( 24.2 ) ( 12.5 ) ( 11.9 ) ( 100.0 )( 2.2 ) ( 2.3 ) ( 2.1 ) ( 1.1 ) ( 1.0 ) ( 1.8 )
381 318 270 158 88 1,215( 31.3 ) ( 26.1 ) ( 22.2 ) ( 13.0 ) ( 7.3 ) ( 100.0 )( 9.3 ) ( 7.7 ) ( 6.6 ) ( 3.9 ) ( 2.2 ) ( 5.9 )
936 846 886 1,004 921 4,593( 20.4 ) ( 18.4 ) ( 19.3 ) ( 21.9 ) ( 20.1 ) ( 100.0 )( 22.8 ) ( 20.6 ) ( 21.6 ) ( 24.5 ) ( 22.5 ) ( 22.4 )
2,184 2,400 2,560 2,650 2,940 12,733( 17.2 ) ( 18.8 ) ( 20.1 ) ( 20.8 ) ( 23.1 ) ( 100.0 )( 53.2 ) ( 58.5 ) ( 62.4 ) ( 64.6 ) ( 71.7 ) ( 62.1 )
28 14 14 17 14 86( 32.5 ) ( 15.8 ) ( 16.1 ) ( 19.8 ) ( 15.9 ) ( 100.0 )( 0.7 ) ( 0.3 ) ( 0.3 ) ( 0.4 ) ( 0.3 ) ( 0.4 )
50 85 46 81 34 296( 16.9 ) ( 28.7 ) ( 15.5 ) ( 27.5 ) ( 11.4 ) ( 100.0 )( 1.2 ) ( 2.1 ) ( 1.1 ) ( 2.0 ) ( 0.8 ) ( 1.4 )
4,102 4,103 4,102 4,102 4,101 20,510( 20.0 ) ( 20.0 ) ( 20.0 ) ( 20.0 ) ( 20.0 ) ( 100.0 )( 100.0 ) ( 100.0 ) ( 100.0 ) ( 100.0 ) ( 100.0 ) ( 100.0 )
Primary heating provision
3,196 3,344 3,504 3,752 3,908 17,706( 18.1 ) ( 18.9 ) ( 19.8 ) ( 21.2 ) ( 22.1 ) ( 100.0 )( 77.9 ) ( 81.5 ) ( 85.4 ) ( 91.5 ) ( 95.3 ) ( 86.3 )
460 409 345 192 128 1,534( 30.0 ) ( 26.6 ) ( 22.5 ) ( 12.5 ) ( 8.3 ) ( 100.0 )( 11.2 ) ( 10.0 ) ( 8.4 ) ( 4.7 ) ( 3.1 ) ( 7.5 )
429 327 239 154 65 1,214( 35.3 ) ( 26.9 ) ( 19.7 ) ( 12.7 ) ( 5.4 ) ( 100.0 )( 10.5 ) ( 8.0 ) ( 5.8 ) ( 3.8 ) ( 1.6 ) ( 5.9 )
16 23 13 3 0 56( 29.4 ) ( 41.6 ) ( 23.2 ) ( 5.8 ) ( 0.0 ) ( 100.0 )( 0.4 ) ( 0.6 ) ( 0.3 ) ( 0.1 ) ( 0.0 ) ( 0.3 )
4,102 4,103 4,102 4,102 4,101 20,510( 20.0 ) ( 20.0 ) ( 20.0 ) ( 20.0 ) ( 20.0 ) ( 100.0 )( 100.0 ) ( 100.0 ) ( 100.0 ) ( 100.0 ) ( 100.0 ) ( 100.0 )
base: All households(grossed by households).
Full Heating ProvisionIncome Quintile
All Households
None
Other only
Programmable only
Programmable + other
CH only
CH + other
CH + programmable
CH + programmable + other
Total
Total
Central heating
Programmable
Fixed heaters
Non-fixed heaters

Table 1.9: Type of central heating system in use in 2001 and 1996 (percentages of all dwellings with central heating)
2001 1996% of dwellings with this type of system
% of dwellings with this type of system
Mains gas water borne single purpose boiler 76.4% 71.3%Mains gas water borne other e.g. back boiler 12.6% 15.8%Mains gas ducted air 2.1% 3.4%LPG bottled gas 0.5% 0.4%Solid fuel single purpose boiler 0.3% 0.5%Solid fuel other e.g. back boiler 1.6% 2.4%Fuel oil 3.9% 3.5%Communal or CHP 2.0% 1.5%Other Central Heating System 0.7% 1.2%Total 100.0% 100.0%base: All dwellings with central heating(grossed by dwellings).
Central heating system

Table 1.10: Type of central heating by tenure (percentage of dwellings with central heating within each tenure)
Owner occupied
Private rented
LA RSL All tenures
Mains gas water borne single purpose boiler 80.0% 77.2% 56.9% 73.0% 76.4%Mains gas water borne other e.g. back boiler 10.5% 9.6% 25.4% 14.2% 12.6%Mains gas ducted air 1.7% 1.8% 4.7% 1.9% 2.1%LPG bottled gas 0.6% 0.3% 0.5%Solid fuel single purpose boiler 0.2% 0.6% 0.2% 0.1% 0.3%Solid fuel other e.g. back boiler 1.1% 3.0% 3.6% 1.6% 1.6%Fuel oil 4.8% 4.1% 0.5% 0.3% 3.9%Electric boiler 0.2% 0.1% 0.5% 0.7% 0.3%Other non-electric boiler 0.1% 0.1% 0.2% 0.1%Electric floor/ceiling 0.3% 0.3% 0.9% 0.4% 0.4%Communal or CHP 0.5% 3.0% 7.3% 7.5% 2.0%Total 100.0% 100.0% 100.0% 100.0% 100.0%base: All dwellings with central heating(grossed by dwellings).
Tenure:Type of central heating system

Table 1.11: Use of ‘Combi’ type systems for central heating and hot water (percentages by tenure and dwelling type)
Owner occupied
Private rented LA RSL All tenures
Cylinder 73.8% 61.9% 79.2% 70.4% 73.3%Combi 26.2% 38.1% 20.8% 29.6% 26.7%
house converted flat low rise flat high rise flat All types
Cylinder 75.5% 42.5% 64.4% 63.3% 73.3%Combi 24.5% 57.5% 35.6% 36.7% 26.7%base: All dwellings with combined central heating and hot water system(grossed by dwellings).
Type of central heating / water system
Tenure
Type of central heating / water system
Building Type

Table 1.12: Age of central heating systems in 2001 (age profile in percentages for each type of central heating system)
<3 3-5 6-10 11-15 16-25 >25 <3 3-5 6-10 11-15 16-25 >25Mains gas water borne single purpose boiler 17.5% 16.0% 21.0% 12.6% 13.6% 19.3% 100.0% 8.2% 10.1% 16.1% 13.7% 22.9% 29.0% 100.0%Mains gas water borne other e.g. back boiler 7.2% 11.6% 23.1% 19.4% 28.0% 10.7% 100.0% 2.0% 5.0% 16.7% 20.1% 37.1% 19.0% 100.0%Mains gas ducted air 4.1% 7.4% 6.8% 8.6% 10.7% 62.4% 100.0% 0.5% 1.0% 2.0% 0.6% 9.2% 86.7% 100.0%LPG bottled gas 19.5% 17.8% 15.5% 21.4% 10.8% 15.1% 100.0% 9.9% 10.2% 17.9% 22.0% 17.5% 22.5% 100.0%Solid fuel single purpose boiler 4.6% 3.8% 19.9% 17.1% 30.8% 23.7% 100.0% 4.8% 3.2% 5.7% 16.4% 48.5% 21.4% 100.0%Solid fuel other e.g. back boiler 2.6% 8.7% 16.4% 19.9% 23.8% 28.6% 100.0% 1.1% 7.9% 15.0% 15.4% 29.9% 30.6% 100.0%Fuel oil 17.4% 15.8% 20.1% 12.4% 13.7% 20.7% 100.0% 7.8% 7.5% 14.1% 13.6% 20.0% 37.1% 100.0%Electric boiler 20.7% 1.4% 28.3% 7.8% 41.8% 100.0% 11.6% 1.2% 19.4% 1.6% 8.6% 57.6% 100.0%Other non-electric boiler 34.9% 40.2% 24.9% 100.0% 9.8% 52.5% 22.7% 15.0% 100.0%Electric floor/ceiling 13.4% 86.6% 100.0% 7.1% 92.9% 100.0%Communal or CHP 7.4% 2.1% 2.9% 3.9% 19.1% 64.5% 100.0% 3.7% 1.5% 2.0% 5.8% 17.1% 69.7% 100.0%All 15.6% 15.0% 20.7% 13.5% 15.7% 19.5% 100.0% 7.1% 9.0% 15.6% 14.3% 24.4% 29.5% 100.0%base: All dwellings with central heating(grossed by dwellings).
CH DISTRIBUTION SYSTEMHEAT SOURCE
TotalType Of Central heating system Age of system in years (2001)Age of system in years (2001) Total

Table 1.13: The ‘need’ for renewal of existing central heating, and the scope installing a gas system(percentages of the 21.1 million dwellings within the stock)
Form of heating House type: Gas availabilityCH boiler < 15 years old
or no CH
CH boiler > 15 years old
House : no gas 4.2% 1.0% Current situation % of dwellingsConverted flat : no gas 0.1% 0.1% Current ‘modern’ central heating 70.3%Low rise purpose built flat : no gas 1.1% 0.2% Older central heating : gas available 14.4%High rise purpose built flat : no gas 0.3% 0.0% Older central heating : no gas supply 1.3%House : gas available 54.4% 13.0% No central heating : gas available 7.1%Converted flat : gas available 1.8% 0.4% No central heating : no gas supply 6.9%Low rise purpose built flat : gas available 7.7% 1.1%High rise purpose built flat : gas available 0.7% 0.0%
House : no gas 3.3%Converted flat : no gas 0.5%Low rise purpose built flat : no gas 2.7%High rise purpose built flat : no gas 0.4%House : gas available 5.4%Converted flat : gas available 0.4%Low rise purpose built flat : gas available 1.2%High rise purpose built flat : gas available 0.1%
base: All dwellings.(grossed by dwellings).
No central heating
Central heating
Candidates for upgrading / installation of gas CHNo gas supply, and with old central heating
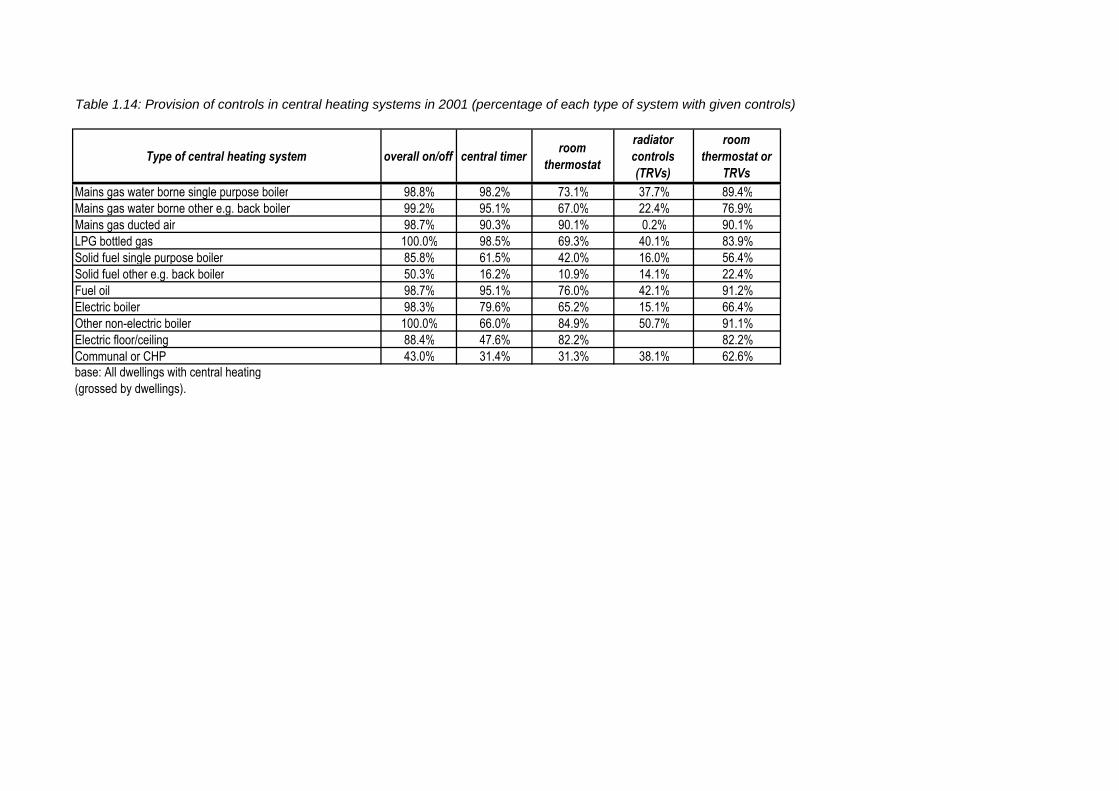
Table 1.14: Provision of controls in central heating systems in 2001 (percentage of each type of system with given controls)
Type of central heating system overall on/off central timerroom
thermostat
radiator controls (TRVs)
room thermostat or
TRVsMains gas water borne single purpose boiler 98.8% 98.2% 73.1% 37.7% 89.4%Mains gas water borne other e.g. back boiler 99.2% 95.1% 67.0% 22.4% 76.9%Mains gas ducted air 98.7% 90.3% 90.1% 0.2% 90.1%LPG bottled gas 100.0% 98.5% 69.3% 40.1% 83.9%Solid fuel single purpose boiler 85.8% 61.5% 42.0% 16.0% 56.4%Solid fuel other e.g. back boiler 50.3% 16.2% 10.9% 14.1% 22.4%Fuel oil 98.7% 95.1% 76.0% 42.1% 91.2%Electric boiler 98.3% 79.6% 65.2% 15.1% 66.4%Other non-electric boiler 100.0% 66.0% 84.9% 50.7% 91.1%Electric floor/ceiling 88.4% 47.6% 82.2% 82.2%Communal or CHP 43.0% 31.4% 31.3% 38.1% 62.6%base: All dwellings with central heating(grossed by dwellings).

Table 1.15: Characteristics of programmable heating systems (percentages of dwellings with programmable heating)
Programmable gas convector
Electric storage heater Electric (non-storage)
Profile of programmable heating 2.3% 93.1% 4.7% 100.0%
Heating profile for dwellingProgrammable only 8.1% 20.4% 9.1% 19.6%Programmable + other 49.7% 66.5% 33.5% 64.5%CH + programmable 22.4% 2.8% 14.6% 3.8%CH + programmable + other 19.8% 10.4% 42.7% 12.1%All 100.0% 100.0% 100.0% 100.0%base: All dwellings with programmable heating(grossed by dwellings).
Type of programmable heating:All

Table 1.16: The relationship between gas supply and use of electric storage radiators (percentages of dwellings with storage radiators)
No gas supplyHouse / converted flat 38.8%Flat in low rise block 30.7%Flat in high rise block 4.8%
Gas availableHouse / converted flat 19.1%Flat in low rise block 5.1%Flat in high rise block 1.4%
All 100.0%base: All dwellings with electric storage radiators.(grossed by dwellings).
Percentage of electric storage radiators within each type.
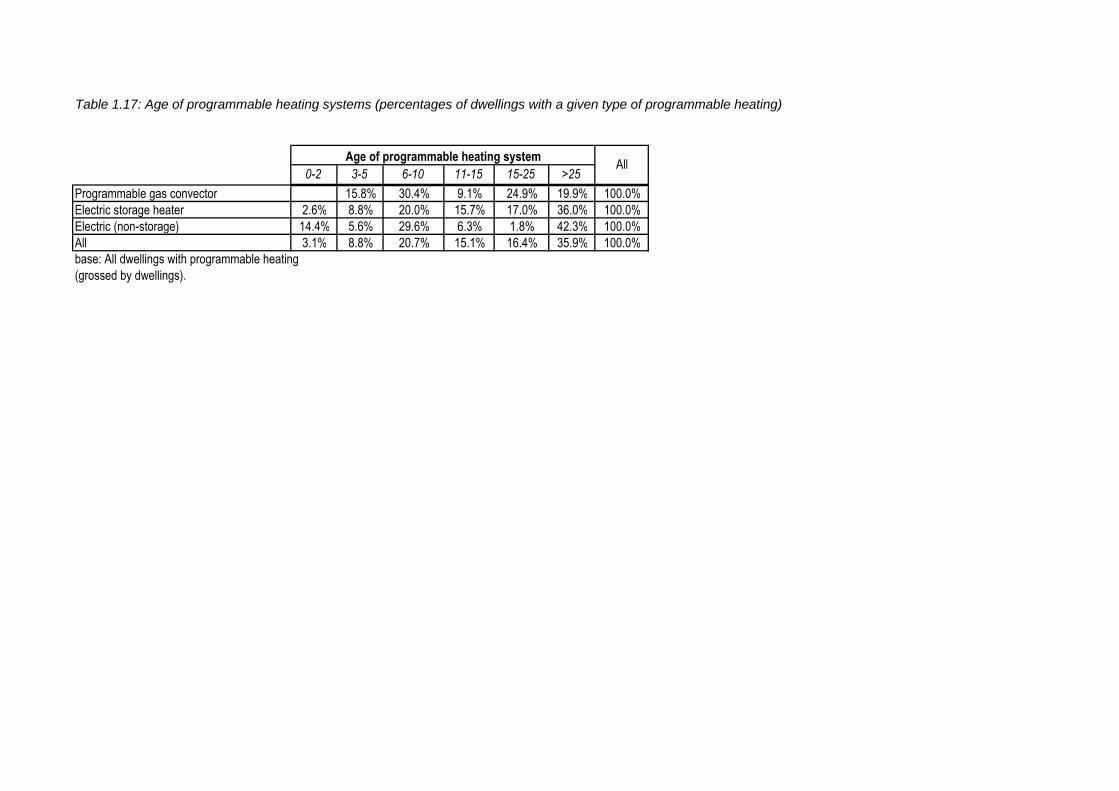
Table 1.17: Age of programmable heating systems (percentages of dwellings with a given type of programmable heating)
0-2 3-5 6-10 11-15 15-25 >25Programmable gas convector 15.8% 30.4% 9.1% 24.9% 19.9% 100.0%Electric storage heater 2.6% 8.8% 20.0% 15.7% 17.0% 36.0% 100.0%Electric (non-storage) 14.4% 5.6% 29.6% 6.3% 1.8% 42.3% 100.0%All 3.1% 8.8% 20.7% 15.1% 16.4% 35.9% 100.0%base: All dwellings with programmable heating(grossed by dwellings).
Age of programmable heating system All

Table 1.18: Characteristics of dwellings with programmable heating (percentages of dwellings within in each subgroup which have programmable heating)
Owner occupied
Private rented
LA RSL All tenure
House Converted flat
Low rise flat
High rise flat
All types
Up to 25 26-35 36-50 51-65 66-75 76-85 Over 85 All ages
% with programmable
heating7.3% 18.3% 10.5% 18.4% 9.6% 6.5% 15.3% 23.7% 33.7% 9.6% 18.0% 9.8% 6.7% 7.3% 11.4% 15.3% 19.6% 9.6%
base: All dwellings with programmable heating(grossed by dwellings).
Tenure Age of head of householdDwelling Type

Table 1.19: Characteristics of 'other' heating systems (percentages of dwellings with 'other' heating)
Heating profile for dwelling:Mains gas Other fixed gas Electric fires Electric portable Solid fuel open fire Solid fuel stove / space
heaterPortable paraffin /LPG All
Other only 73.3% 5.0% 8.1% 4.1% 6.8% 2.3% 0.3% 100.0%Programmable + other 16.3% 2.3% 57.4% 7.8% 11.3% 3.0% 1.8% 100.0%CH + other 64.7% 5.3% 11.5% 2.2% 13.6% 2.4% 0.3% 100.0%CH + programmable + other 40.0% 4.6% 23.8% 4.5% 21.8% 4.4% 1.0% 100.0%All 61.1% 5.0% 15.1% 2.8% 13.0% 2.5% 0.4% 100.0%base: All dwellings with other heating(grossed by dwellings).
Other heating - type of system

Table 1.20: 'Other' heating used in association with central and programmable heating systems.(percentages of dwellings with given type of central heating using other heating)
Type of heating system Mains gasOther fixed
gasElectric fires
Electric portable
Solid fuel open fire
Solid fuel stove / Space Heater
Portable paraffin / LPG
Mains gas water borne single purpose boiler 67.4% 4.6% 11.7% 2.0% 12.7% 1.4% 0.2% 100.0%Mains gas water borne other e.g. back boiler 85.8% 9.4% 1.6% 0.7% 2.0% 0.2% 0.2% 100.0%Mains gas ducted air 31.2% 2.2% 46.1% 14.0% 3.7% 0.8% 1.9% 100.0%LPG bottled gas 37.5% 9.9% 2.9% 29.5% 15.6% 4.6% 100.0%Solid fuel single purpose boiler 7.8% 17.9% 8.4% 57.3% 8.6% 100.0%Solid fuel other e.g. back boiler 5.1% 6.9% 5.3% 43.2% 36.1% 3.4% 100.0%Fuel oil 2.4% 3.1% 16.8% 3.0% 60.5% 13.2% 0.8% 100.0%Electric boiler 14.6% 1.4% 37.2% 10.8% 25.1% 10.3% 0.7% 100.0%Other non-electric boiler 32.7% 15.1% 17.6% 34.7% 100.0%Electric floor/ceiling 78.5% 12.2% 6.2% 3.1% 100.0%Communal or CHP 5.1% 1.9% 81.4% 9.7% 1.9% 100.0%All 64.4% 5.3% 11.6% 2.2% 13.7% 2.5% 0.3% 100.0%
Programmable gas convector 80.7% 4.8% 14.5% 100.0%Electric storage heater 14.5% 2.4% 58.3% 7.8% 11.9% 3.2% 1.9% 100.0%Electric (non-storage) 43.2% 44.4% 8.2% 4.3% 100.0%All programmable systems 16.2% 2.3% 57.0% 7.9% 11.6% 3.1% 1.8% 100.0%
base: All dwellings with Other heating and either central and / or programmable heating(grossed by dwellings).
CENTRAL HEATING SYSTEMS
PROGRAMMABLE HEATING SYSTEMS
Other heating - type of system
All types

Table 1.21: Age of 'other' heating provision (percentages of dwellings with a given type of heating)
Heating Provision 0-2 3-5 6-10 11-15 16-25 >25 AllMains gas 10.0% 16.8% 27.2% 15.1% 18.4% 12.5% 100.0%Other fixed gas 7.9% 13.6% 29.5% 13.5% 19.6% 16.0% 100.0%Electric fires 10.8% 13.5% 23.8% 12.3% 15.0% 24.6% 100.0%Electric portable 13.1% 20.5% 35.6% 8.1% 15.6% 7.2% 100.0%Solid fuel open fire 2.2% 3.5% 6.2% 2.8% 6.2% 79.1% 100.0%Solid fuel stove/space heater 15.3% 16.5% 23.7% 12.8% 12.4% 19.3% 100.0%Portable paraffin/LPG 22.9% 18.9% 33.7% 8.1% 7.2% 9.3% 100.0%All types 9.3% 14.5% 24.2% 12.7% 16.1% 23.3% 100.0%base: All dwellings with other heating(grossed by dwellings).
Age of 'other' heating provision in years
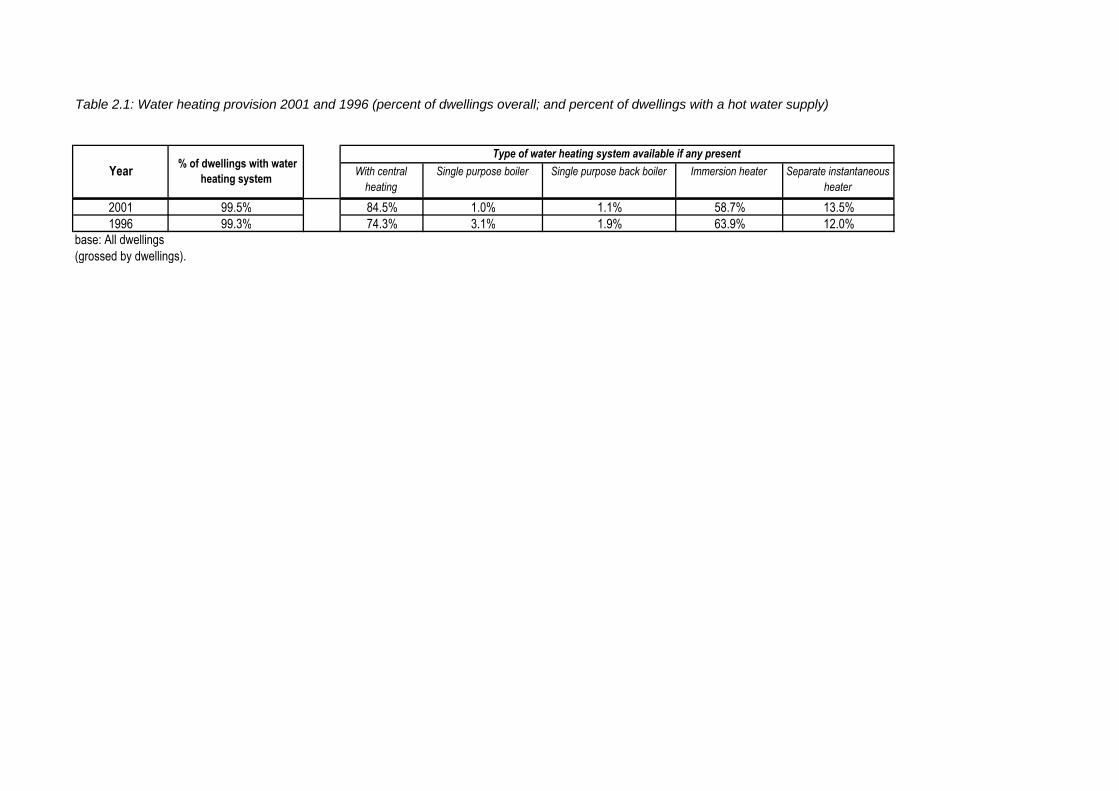
Table 2.1: Water heating provision 2001 and 1996 (percent of dwellings overall; and percent of dwellings with a hot water supply)
With central heating
Single purpose boiler Single purpose back boiler Immersion heater Separate instantaneous heater
2001 99.5% 84.5% 1.0% 1.1% 58.7% 13.5%1996 99.3% 74.3% 3.1% 1.9% 63.9% 12.0%
base: All dwellings(grossed by dwellings).
% of dwellings with water heating system
YearType of water heating system available if any present
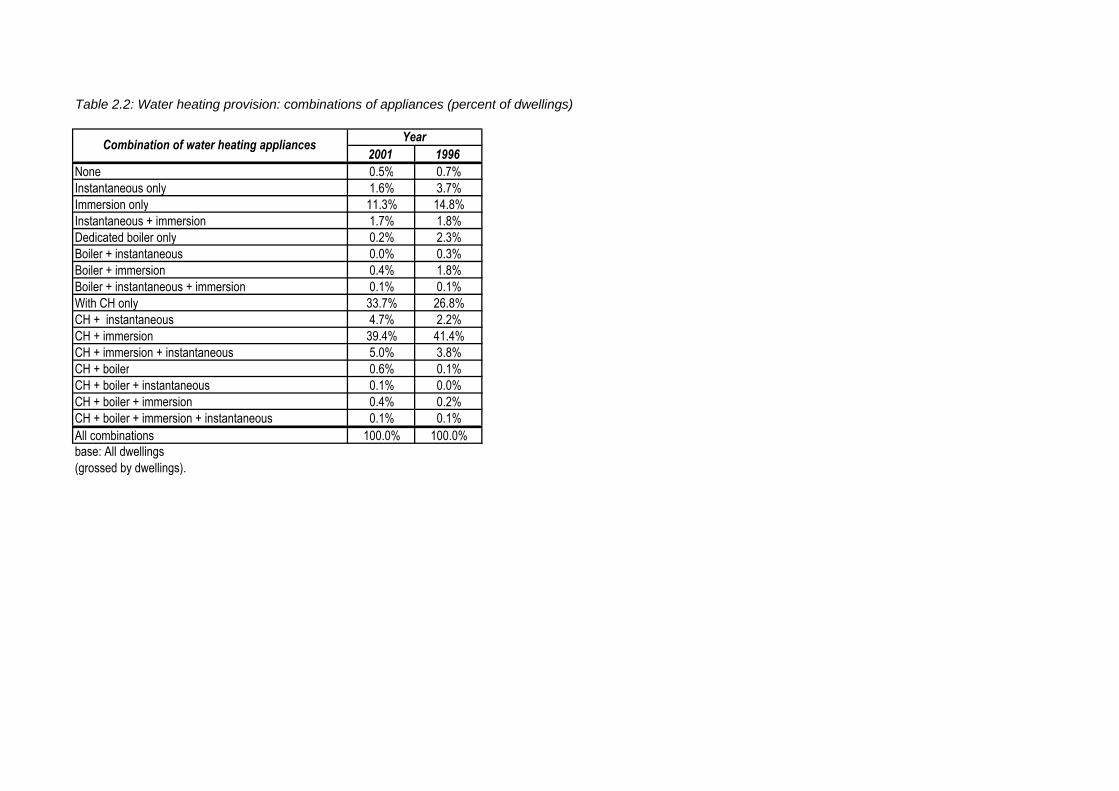
Table 2.2: Water heating provision: combinations of appliances (percent of dwellings)
2001 1996None 0.5% 0.7%Instantaneous only 1.6% 3.7%Immersion only 11.3% 14.8%Instantaneous + immersion 1.7% 1.8%Dedicated boiler only 0.2% 2.3%Boiler + instantaneous 0.0% 0.3%Boiler + immersion 0.4% 1.8%Boiler + instantaneous + immersion 0.1% 0.1%With CH only 33.7% 26.8%CH + instantaneous 4.7% 2.2%CH + immersion 39.4% 41.4%CH + immersion + instantaneous 5.0% 3.8%CH + boiler 0.6% 0.1%CH + boiler + instantaneous 0.1% 0.0%CH + boiler + immersion 0.4% 0.2%CH + boiler + immersion + instantaneous 0.1% 0.1%All combinations 100.0% 100.0%base: All dwellings(grossed by dwellings).
YearCombination of water heating appliances
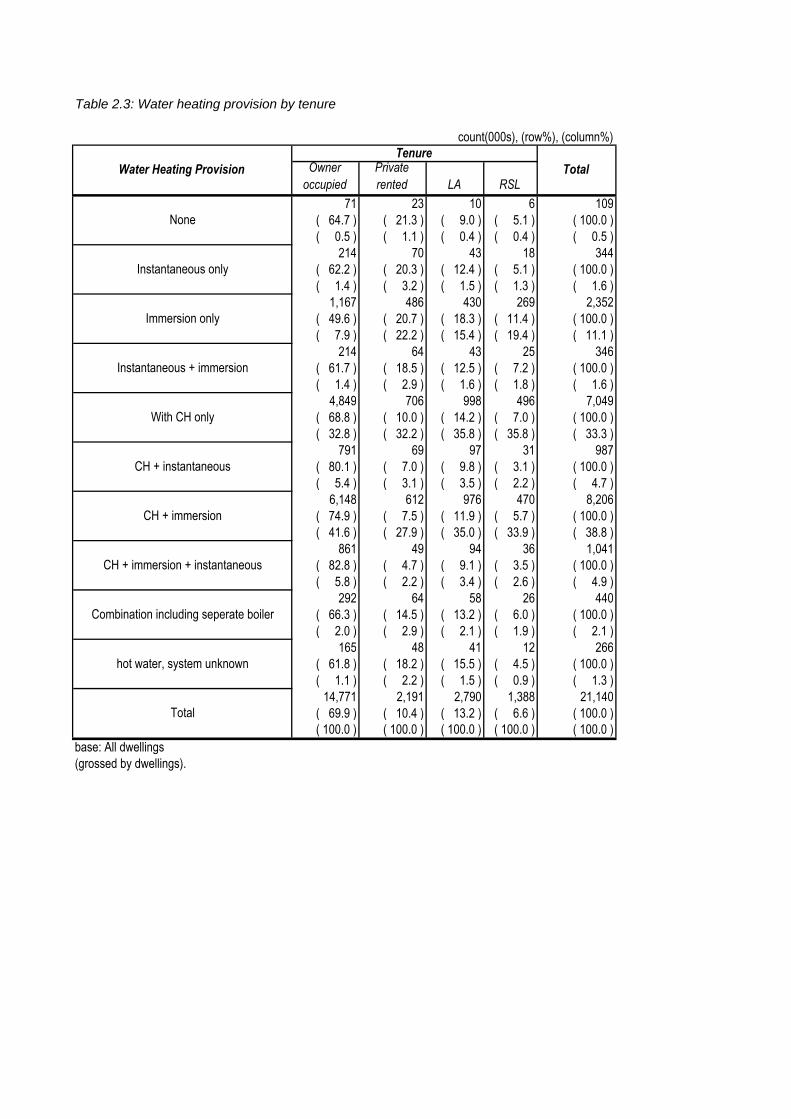
Table 2.3: Water heating provision by tenure
count(000s), (row%), (column%)
Owner occupied
Private rented LA RSL
71 23 10 6 109( 64.7 ) ( 21.3 ) ( 9.0 ) ( 5.1 ) ( 100.0 )( 0.5 ) ( 1.1 ) ( 0.4 ) ( 0.4 ) ( 0.5 )
214 70 43 18 344( 62.2 ) ( 20.3 ) ( 12.4 ) ( 5.1 ) ( 100.0 )( 1.4 ) ( 3.2 ) ( 1.5 ) ( 1.3 ) ( 1.6 )
1,167 486 430 269 2,352( 49.6 ) ( 20.7 ) ( 18.3 ) ( 11.4 ) ( 100.0 )( 7.9 ) ( 22.2 ) ( 15.4 ) ( 19.4 ) ( 11.1 )
214 64 43 25 346( 61.7 ) ( 18.5 ) ( 12.5 ) ( 7.2 ) ( 100.0 )( 1.4 ) ( 2.9 ) ( 1.6 ) ( 1.8 ) ( 1.6 )
4,849 706 998 496 7,049( 68.8 ) ( 10.0 ) ( 14.2 ) ( 7.0 ) ( 100.0 )( 32.8 ) ( 32.2 ) ( 35.8 ) ( 35.8 ) ( 33.3 )
791 69 97 31 987( 80.1 ) ( 7.0 ) ( 9.8 ) ( 3.1 ) ( 100.0 )( 5.4 ) ( 3.1 ) ( 3.5 ) ( 2.2 ) ( 4.7 )
6,148 612 976 470 8,206( 74.9 ) ( 7.5 ) ( 11.9 ) ( 5.7 ) ( 100.0 )( 41.6 ) ( 27.9 ) ( 35.0 ) ( 33.9 ) ( 38.8 )
861 49 94 36 1,041( 82.8 ) ( 4.7 ) ( 9.1 ) ( 3.5 ) ( 100.0 )( 5.8 ) ( 2.2 ) ( 3.4 ) ( 2.6 ) ( 4.9 )
292 64 58 26 440( 66.3 ) ( 14.5 ) ( 13.2 ) ( 6.0 ) ( 100.0 )( 2.0 ) ( 2.9 ) ( 2.1 ) ( 1.9 ) ( 2.1 )
165 48 41 12 266( 61.8 ) ( 18.2 ) ( 15.5 ) ( 4.5 ) ( 100.0 )( 1.1 ) ( 2.2 ) ( 1.5 ) ( 0.9 ) ( 1.3 )
14,771 2,191 2,790 1,388 21,140( 69.9 ) ( 10.4 ) ( 13.2 ) ( 6.6 ) ( 100.0 )( 100.0 ) ( 100.0 ) ( 100.0 ) ( 100.0 ) ( 100.0 )
base: All dwellings(grossed by dwellings).
Water Heating ProvisionTenure
Total
None
Instantaneous only
Immersion only
Instantaneous + immersion
With CH only
hot water, system unknown
Total
CH + instantaneous
CH + immersion
CH + immersion + instantaneous
Combination including seperate boiler
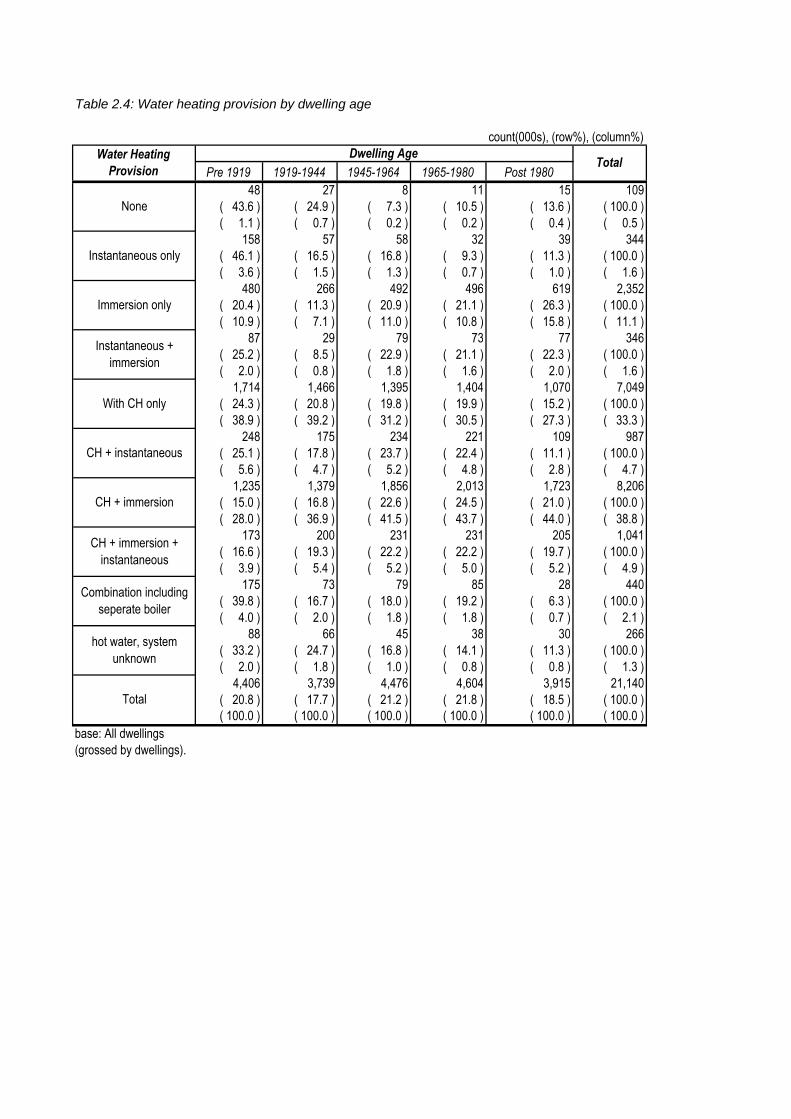
Table 2.4: Water heating provision by dwelling age
count(000s), (row%), (column%)
Pre 1919 1919-1944 1945-1964 1965-1980 Post 198048 27 8 11 15 109
( 43.6 ) ( 24.9 ) ( 7.3 ) ( 10.5 ) ( 13.6 ) ( 100.0 )( 1.1 ) ( 0.7 ) ( 0.2 ) ( 0.2 ) ( 0.4 ) ( 0.5 )
158 57 58 32 39 344( 46.1 ) ( 16.5 ) ( 16.8 ) ( 9.3 ) ( 11.3 ) ( 100.0 )( 3.6 ) ( 1.5 ) ( 1.3 ) ( 0.7 ) ( 1.0 ) ( 1.6 )
480 266 492 496 619 2,352( 20.4 ) ( 11.3 ) ( 20.9 ) ( 21.1 ) ( 26.3 ) ( 100.0 )( 10.9 ) ( 7.1 ) ( 11.0 ) ( 10.8 ) ( 15.8 ) ( 11.1 )
87 29 79 73 77 346( 25.2 ) ( 8.5 ) ( 22.9 ) ( 21.1 ) ( 22.3 ) ( 100.0 )( 2.0 ) ( 0.8 ) ( 1.8 ) ( 1.6 ) ( 2.0 ) ( 1.6 )
1,714 1,466 1,395 1,404 1,070 7,049( 24.3 ) ( 20.8 ) ( 19.8 ) ( 19.9 ) ( 15.2 ) ( 100.0 )( 38.9 ) ( 39.2 ) ( 31.2 ) ( 30.5 ) ( 27.3 ) ( 33.3 )
248 175 234 221 109 987( 25.1 ) ( 17.8 ) ( 23.7 ) ( 22.4 ) ( 11.1 ) ( 100.0 )( 5.6 ) ( 4.7 ) ( 5.2 ) ( 4.8 ) ( 2.8 ) ( 4.7 )
1,235 1,379 1,856 2,013 1,723 8,206( 15.0 ) ( 16.8 ) ( 22.6 ) ( 24.5 ) ( 21.0 ) ( 100.0 )( 28.0 ) ( 36.9 ) ( 41.5 ) ( 43.7 ) ( 44.0 ) ( 38.8 )
173 200 231 231 205 1,041( 16.6 ) ( 19.3 ) ( 22.2 ) ( 22.2 ) ( 19.7 ) ( 100.0 )( 3.9 ) ( 5.4 ) ( 5.2 ) ( 5.0 ) ( 5.2 ) ( 4.9 )
175 73 79 85 28 440( 39.8 ) ( 16.7 ) ( 18.0 ) ( 19.2 ) ( 6.3 ) ( 100.0 )( 4.0 ) ( 2.0 ) ( 1.8 ) ( 1.8 ) ( 0.7 ) ( 2.1 )
88 66 45 38 30 266( 33.2 ) ( 24.7 ) ( 16.8 ) ( 14.1 ) ( 11.3 ) ( 100.0 )( 2.0 ) ( 1.8 ) ( 1.0 ) ( 0.8 ) ( 0.8 ) ( 1.3 )
4,406 3,739 4,476 4,604 3,915 21,140( 20.8 ) ( 17.7 ) ( 21.2 ) ( 21.8 ) ( 18.5 ) ( 100.0 )( 100.0 ) ( 100.0 ) ( 100.0 ) ( 100.0 ) ( 100.0 ) ( 100.0 )
base: All dwellings(grossed by dwellings).
Water Heating Provision
TotalDwelling Age
None
Instantaneous only
Immersion only
Instantaneous + immersion
With CH only
hot water, system unknown
Total
CH + instantaneous
CH + immersion
CH + immersion + instantaneous
Combination including seperate boiler

Table 2.5: Water heating provision by dwelling type
count(000s), (row%), (column%)
Small terraced house
Medium/large terraced house
Semi-detached
house
Detached house
BungalowConverted
flatPurpose built flat, low rise
Purpose built flat, high rise
15 12 25 12 11 16 16 1 109
( 14.2 ) ( 11.1 ) ( 23.0 ) ( 11.3 ) ( 10.5 ) ( 14.6 ) ( 14.5 ) ( 0.8 ) ( 100.0 )
( 0.6 ) ( 0.4 ) ( 0.4 ) ( 0.4 ) ( 0.6 ) ( 2.3 ) ( 0.5 ) ( 0.3 ) ( 0.5 )
102 69 55 3 14 33 63 4 344
( 29.8 ) ( 20.1 ) ( 15.9 ) ( 0.9 ) ( 4.2 ) ( 9.7 ) ( 18.3 ) ( 1.2 ) ( 100.0 )
( 3.9 ) ( 2.1 ) ( 0.9 ) ( 0.1 ) ( 0.7 ) ( 4.8 ) ( 2.1 ) ( 1.2 ) ( 1.6 )
388 270 400 82 190 138 764 120 2,352
( 16.5 ) ( 11.5 ) ( 17.0 ) ( 3.5 ) ( 8.1 ) ( 5.9 ) ( 32.5 ) ( 5.1 ) ( 100.0 )
( 14.6 ) ( 8.1 ) ( 6.8 ) ( 2.5 ) ( 9.3 ) ( 20.0 ) ( 26.1 ) ( 35.7 ) ( 11.1 )
68 50 72 12 39 12 86 9 346
( 19.6 ) ( 14.4 ) ( 20.7 ) ( 3.5 ) ( 11.2 ) ( 3.4 ) ( 24.7 ) ( 2.6 ) ( 100.0 )
( 2.5 ) ( 1.5 ) ( 1.2 ) ( 0.4 ) ( 1.9 ) ( 1.7 ) ( 2.9 ) ( 2.7 ) ( 1.6 )
966 1,260 1,953 769 650 325 1,016 112 7,049
( 13.7 ) ( 17.9 ) ( 27.7 ) ( 10.9 ) ( 9.2 ) ( 4.6 ) ( 14.4 ) ( 1.6 ) ( 100.0 )
( 36.3 ) ( 37.7 ) ( 33.4 ) ( 23.5 ) ( 31.6 ) ( 47.0 ) ( 34.7 ) ( 33.3 ) ( 33.3 )
121 243 324 106 76 19 91 8 987
( 12.2 ) ( 24.6 ) ( 32.8 ) ( 10.8 ) ( 7.7 ) ( 1.9 ) ( 9.2 ) ( 0.8 ) ( 100.0 )
( 4.5 ) ( 7.3 ) ( 5.5 ) ( 3.2 ) ( 3.7 ) ( 2.8 ) ( 3.1 ) ( 2.3 ) ( 4.7 )
806 1,175 2,473 1,941 907 118 731 55 8,206
( 9.8 ) ( 14.3 ) ( 30.1 ) ( 23.7 ) ( 11.1 ) ( 1.4 ) ( 8.9 ) ( 0.7 ) ( 100.0 )
( 30.3 ) ( 35.1 ) ( 42.3 ) ( 59.3 ) ( 44.2 ) ( 17.1 ) ( 24.9 ) ( 16.4 ) ( 38.8 )
85 138 358 276 114 11 55 5 1,041
( 8.1 ) ( 13.2 ) ( 34.4 ) ( 26.5 ) ( 11.0 ) ( 1.0 ) ( 5.3 ) ( 0.4 ) ( 100.0 )
( 3.2 ) ( 4.1 ) ( 6.1 ) ( 8.4 ) ( 5.6 ) ( 1.5 ) ( 1.9 ) ( 1.4 ) ( 4.9 )
58 82 145 69 41 4 36 5 440
( 13.3 ) ( 18.5 ) ( 33.0 ) ( 15.6 ) ( 9.4 ) ( 0.9 ) ( 8.1 ) ( 1.1 ) ( 100.0 )
( 2.2 ) ( 2.4 ) ( 2.5 ) ( 2.1 ) ( 2.0 ) ( 0.6 ) ( 1.2 ) ( 1.5 ) ( 2.1 )
52 46 49 3 11 15 73 18 266
( 19.4 ) ( 17.3 ) ( 18.3 ) ( 1.2 ) ( 4.2 ) ( 5.5 ) ( 27.4 ) ( 6.7 ) ( 100.0 )
( 1.9 ) ( 1.4 ) ( 0.8 ) ( 0.1 ) ( 0.5 ) ( 2.1 ) ( 2.5 ) ( 5.3 ) ( 1.3 )
2,660 3,344 5,853 3,273 2,055 691 2,929 335 21,140
( 12.6 ) ( 15.8 ) ( 27.7 ) ( 15.5 ) ( 9.7 ) ( 3.3 ) ( 13.9 ) ( 1.6 ) ( 100.0 )
( 100.0 ) ( 100.0 ) ( 100.0 ) ( 100.0 ) ( 100.0 ) ( 100.0 ) ( 100.0 ) ( 100.0 ) ( 100.0 )
base: All dwellings(grossed by dwellings).
Dwelling Type
Water Heating Provision
Total
None
Instantaneous only
Immersion only
Instantaneous + immersion
With CH only
hot water, system unknown
Total
CH + instantaneous
CH + immersion
CH + immersion + instantaneous
Combination including seperate boiler

Table 2.6: Water heating provision by Government Office region
count(000s), (row%), (column%)
North EastYorkshire & Humberside
North West & Merseyside
East Midlands
West Midlands
South West
EasternSouth East
London
5 6 16 8 5 10 10 20 29 109
( 4.4 ) ( 5.8 ) ( 14.5 ) ( 7.6 ) ( 5.0 ) ( 9.1 ) ( 8.8 ) ( 18.0 ) ( 26.8 ) ( 100.0 )
( 0.5 ) ( 0.3 ) ( 0.5 ) ( 0.5 ) ( 0.3 ) ( 0.5 ) ( 0.4 ) ( 0.6 ) ( 1.0 ) ( 0.5 )
9 66 62 8 30 43 26 47 52 344
( 2.6 ) ( 19.3 ) ( 18.2 ) ( 2.4 ) ( 8.7 ) ( 12.4 ) ( 7.5 ) ( 13.8 ) ( 15.0 ) ( 100.0 )
( 0.8 ) ( 3.0 ) ( 2.1 ) ( 0.4 ) ( 1.4 ) ( 2.0 ) ( 1.1 ) ( 1.4 ) ( 1.7 ) ( 1.6 )
80 232 335 154 272 318 263 392 306 2,352
( 3.4 ) ( 9.9 ) ( 14.3 ) ( 6.5 ) ( 11.5 ) ( 13.5 ) ( 11.2 ) ( 16.7 ) ( 13.0 ) ( 100.0 )
( 7.4 ) ( 10.5 ) ( 11.5 ) ( 8.4 ) ( 12.6 ) ( 15.0 ) ( 11.3 ) ( 11.4 ) ( 9.9 ) ( 11.1 )
3 22 61 53 63 64 36 33 11 346
( 1.0 ) ( 6.3 ) ( 17.7 ) ( 15.2 ) ( 18.3 ) ( 18.3 ) ( 10.4 ) ( 9.5 ) ( 3.3 ) ( 100.0 )
( 0.3 ) ( 1.0 ) ( 2.1 ) ( 2.9 ) ( 2.9 ) ( 3.0 ) ( 1.6 ) ( 1.0 ) ( 0.4 ) ( 1.6 )
546 896 1,110 474 668 653 555 835 1,313 7,049
( 7.7 ) ( 12.7 ) ( 15.7 ) ( 6.7 ) ( 9.5 ) ( 9.3 ) ( 7.9 ) ( 11.9 ) ( 18.6 ) ( 100.0 )
( 50.8 ) ( 40.6 ) ( 38.0 ) ( 25.7 ) ( 31.0 ) ( 30.8 ) ( 23.8 ) ( 24.4 ) ( 42.7 ) ( 33.3 )
55 122 228 117 138 118 63 73 74 987
( 5.5 ) ( 12.4 ) ( 23.1 ) ( 11.8 ) ( 14.0 ) ( 12.0 ) ( 6.4 ) ( 7.4 ) ( 7.5 ) ( 100.0 )
( 5.1 ) ( 5.5 ) ( 7.8 ) ( 6.3 ) ( 6.4 ) ( 5.6 ) ( 2.7 ) ( 2.1 ) ( 2.4 ) ( 4.7 )
326 694 826 773 711 705 1,211 1,837 1,123 8,206
( 4.0 ) ( 8.5 ) ( 10.1 ) ( 9.4 ) ( 8.7 ) ( 8.6 ) ( 14.8 ) ( 22.4 ) ( 13.7 ) ( 100.0 )
( 30.3 ) ( 31.5 ) ( 28.3 ) ( 42.0 ) ( 33.1 ) ( 33.3 ) ( 52.0 ) ( 53.6 ) ( 36.5 ) ( 38.8 )
14 72 158 211 174 132 105 114 62 1,041
( 1.3 ) ( 6.9 ) ( 15.1 ) ( 20.3 ) ( 16.7 ) ( 12.7 ) ( 10.1 ) ( 10.9 ) ( 6.0 ) ( 100.0 )
( 1.3 ) ( 3.3 ) ( 5.4 ) ( 11.5 ) ( 8.1 ) ( 6.2 ) ( 4.5 ) ( 3.3 ) ( 2.0 ) ( 4.9 )
25 56 90 38 63 59 36 40 33 440
( 5.7 ) ( 12.6 ) ( 20.4 ) ( 8.7 ) ( 14.4 ) ( 13.4 ) ( 8.2 ) ( 9.0 ) ( 7.6 ) ( 100.0 )
( 2.3 ) ( 2.5 ) ( 3.1 ) ( 2.1 ) ( 2.9 ) ( 2.8 ) ( 1.6 ) ( 1.2 ) ( 1.1 ) ( 2.1 )
12 39 34 5 27 18 22 37 72 266
( 4.6 ) ( 14.8 ) ( 12.6 ) ( 2.0 ) ( 10.1 ) ( 6.6 ) ( 8.4 ) ( 13.9 ) ( 27.0 ) ( 100.0 )
( 1.1 ) ( 1.8 ) ( 1.2 ) ( 0.3 ) ( 1.3 ) ( 0.8 ) ( 1.0 ) ( 1.1 ) ( 2.3 ) ( 1.3 )
1,074 2,207 2,919 1,841 2,151 2,119 2,327 3,428 3,076 21,140
( 5.1 ) ( 10.4 ) ( 13.8 ) ( 8.7 ) ( 10.2 ) ( 10.0 ) ( 11.0 ) ( 16.2 ) ( 14.5 ) ( 100.0 )
( 100.0 ) ( 100.0 ) ( 100.0 ) ( 100.0 ) ( 100.0 ) ( 100.0 ) ( 100.0 ) ( 100.0 ) ( 100.0 ) ( 100.0 )
base: All dwellings(grossed by dwellings).
Water Heating Provision
Government Office Region
All regions.
None
Instantaneous only
Immersion only
Instantaneous + immersion
With CH only
hot water, system unknown
Total
CH + instantaneous
CH + immersion
CH + immersion + instantaneous
Combination including seperate boiler

Table 2.7: Water heating provision by age of HRP
count(000s), (row%), (column%)
up to 25 26-35 36-50 51-65 66-75 76-85 over 85 unknown
6 23 24 14 4 6 0 0 78
( 7.6 ) ( 29.9 ) ( 30.7 ) ( 18.4 ) ( 5.6 ) ( 7.6 ) ( 0.0 ) ( 0.0 ) ( 100.0 )
( 0.6 ) ( 0.6 ) ( 0.4 ) ( 0.3 ) ( 0.2 ) ( 0.3 ) ( 0.0 ) ( 0.0 ) ( 0.4 )
16 64 87 63 58 28 4 0 321
( 5.0 ) ( 20.1 ) ( 27.0 ) ( 19.7 ) ( 18.2 ) ( 8.8 ) ( 1.1 ) ( 0.0 ) ( 100.0 )
( 1.5 ) ( 1.7 ) ( 1.4 ) ( 1.3 ) ( 2.2 ) ( 1.6 ) ( 1.0 ) ( 0.0 ) ( 1.6 )
210 396 487 432 314 330 83 0 2,251
( 9.3 ) ( 17.6 ) ( 21.6 ) ( 19.2 ) ( 14.0 ) ( 14.6 ) ( 3.7 ) ( 0.0 ) ( 100.0 )
( 19.8 ) ( 10.7 ) ( 8.1 ) ( 8.7 ) ( 12.1 ) ( 18.5 ) ( 22.2 ) ( 0.0 ) ( 11.0 )
27 48 72 66 59 47 19 0 338
( 7.9 ) ( 14.3 ) ( 21.3 ) ( 19.6 ) ( 17.5 ) ( 14.0 ) ( 5.5 ) ( 0.0 ) ( 100.0 )
( 2.5 ) ( 1.3 ) ( 1.2 ) ( 1.3 ) ( 2.3 ) ( 2.7 ) ( 5.0 ) ( 0.0 ) ( 1.6 )
461 1,371 2,040 1,559 762 510 103 0 6,806
( 6.8 ) ( 20.1 ) ( 30.0 ) ( 22.9 ) ( 11.2 ) ( 7.5 ) ( 1.5 ) ( 0.0 ) ( 100.0 )
( 43.4 ) ( 36.9 ) ( 33.8 ) ( 31.5 ) ( 29.4 ) ( 28.6 ) ( 27.4 ) ( 100.0 ) ( 33.2 )
29 189 302 245 121 62 14 0 963
( 3.0 ) ( 19.7 ) ( 31.3 ) ( 25.5 ) ( 12.6 ) ( 6.4 ) ( 1.5 ) ( 0.0 ) ( 100.0 )
( 2.7 ) ( 5.1 ) ( 5.0 ) ( 5.0 ) ( 4.7 ) ( 3.5 ) ( 3.8 ) ( 0.0 ) ( 4.7 )
259 1,387 2,531 2,085 1,040 624 118 0 8,044
( 3.2 ) ( 17.2 ) ( 31.5 ) ( 25.9 ) ( 12.9 ) ( 7.8 ) ( 1.5 ) ( 0.0 ) ( 100.0 )
( 24.4 ) ( 37.3 ) ( 41.9 ) ( 42.2 ) ( 40.1 ) ( 35.0 ) ( 31.4 ) ( 0.0 ) ( 39.2 )
18 148 344 298 117 93 16 0 1,035
( 1.8 ) ( 14.3 ) ( 33.2 ) ( 28.8 ) ( 11.3 ) ( 9.0 ) ( 1.6 ) ( 0.0 ) ( 100.0 )
( 1.7 ) ( 4.0 ) ( 5.7 ) ( 6.0 ) ( 4.5 ) ( 5.2 ) ( 4.4 ) ( 0.0 ) ( 5.0 )
13 54 103 132 59 56 7 0 423
( 3.1 ) ( 12.7 ) ( 24.3 ) ( 31.2 ) ( 13.9 ) ( 13.3 ) ( 1.5 ) ( 0.0 ) ( 100.0 )
( 1.3 ) ( 1.4 ) ( 1.7 ) ( 2.7 ) ( 2.3 ) ( 3.2 ) ( 1.7 ) ( 0.0 ) ( 2.1 )
22 38 49 48 57 25 12 0 252
( 8.9 ) ( 15.2 ) ( 19.7 ) ( 19.2 ) ( 22.4 ) ( 9.9 ) ( 4.8 ) ( 0.0 ) ( 100.0 )
( 2.1 ) ( 1.0 ) ( 0.8 ) ( 1.0 ) ( 2.2 ) ( 1.4 ) ( 3.2 ) ( 0.0 ) ( 1.2 )
1,062 3,720 6,038 4,943 2,591 1,781 375 0 20,510
( 5.2 ) ( 18.1 ) ( 29.4 ) ( 24.1 ) ( 12.6 ) ( 8.7 ) ( 1.8 ) ( 0.0 ) ( 100.0 )
( 100.0 ) ( 100.0 ) ( 100.0 ) ( 100.0 ) ( 100.0 ) ( 100.0 ) ( 100.0 ) ( 100.0 ) ( 100.0 )
base: All households(grossed by households).
Water Heating Provision
Age of head of householdAll households.
None
Instantaneous only
Immersion only
Instantaneous + immersion
With CH only
hot water, system unknown
Total
CH + instantaneous
CH + immersion
CH + immersion + instantaneous
Combination including seperate boiler

Table 2.8: Water heating provision by household type
count(000s), (row%), (column%)
Couple, under 60: no dependent
child(ren)
Couple, 60 or over: no
dependent child(ren)
Couple: with dependent child(ren)
lone parent with dependent child(ren)
other multi-person
household
one person under 60
one person 60 or over
12 2 18 5 4 26 11 78( 15.4 ) ( 1.9 ) ( 23.0 ) ( 5.9 ) ( 5.1 ) ( 34.0 ) ( 14.7 ) ( 100.0 )( 0.3 ) ( 0.1 ) ( 0.4 ) ( 0.3 ) ( 0.3 ) ( 1.1 ) ( 0.4 ) ( 0.4 )
39 45 55 27 32 66 56 321( 12.1 ) ( 14.1 ) ( 17.0 ) ( 8.5 ) ( 10.1 ) ( 20.5 ) ( 17.6 ) ( 100.0 )( 1.0 ) ( 1.6 ) ( 1.1 ) ( 1.7 ) ( 2.2 ) ( 2.7 ) ( 1.8 ) ( 1.6 )
313 314 256 184 164 503 518 2,251( 13.9 ) ( 13.9 ) ( 11.4 ) ( 8.2 ) ( 7.3 ) ( 22.3 ) ( 23.0 ) ( 100.0 )( 7.7 ) ( 10.7 ) ( 5.1 ) ( 11.5 ) ( 11.3 ) ( 21.0 ) ( 16.8 ) ( 11.0 )
65 62 44 16 24 52 77 338( 19.2 ) ( 18.2 ) ( 13.0 ) ( 4.7 ) ( 7.0 ) ( 15.3 ) ( 22.7 ) ( 100.0 )( 1.6 ) ( 2.1 ) ( 0.9 ) ( 1.0 ) ( 1.6 ) ( 2.2 ) ( 2.5 ) ( 1.6 )
1,339 807 1,760 618 511 821 950 6,806( 19.7 ) ( 11.9 ) ( 25.9 ) ( 9.1 ) ( 7.5 ) ( 12.1 ) ( 14.0 ) ( 100.0 )( 32.8 ) ( 27.6 ) ( 35.3 ) ( 38.7 ) ( 35.4 ) ( 34.2 ) ( 30.9 ) ( 33.2 )
225 135 242 59 68 104 130 963( 23.4 ) ( 14.0 ) ( 25.1 ) ( 6.1 ) ( 7.1 ) ( 10.8 ) ( 13.5 ) ( 100.0 )( 5.5 ) ( 4.6 ) ( 4.8 ) ( 3.7 ) ( 4.7 ) ( 4.3 ) ( 4.2 ) ( 4.7 )
1,745 1,253 2,193 577 517 712 1,046 8,044( 21.7 ) ( 15.6 ) ( 27.3 ) ( 7.2 ) ( 6.4 ) ( 8.9 ) ( 13.0 ) ( 100.0 )( 42.7 ) ( 42.8 ) ( 44.0 ) ( 36.1 ) ( 35.8 ) ( 29.7 ) ( 34.0 ) ( 39.2 )
235 189 285 64 68 62 132 1,035( 22.7 ) ( 18.2 ) ( 27.6 ) ( 6.1 ) ( 6.6 ) ( 6.0 ) ( 12.8 ) ( 100.0 )( 5.8 ) ( 6.4 ) ( 5.7 ) ( 4.0 ) ( 4.7 ) ( 2.6 ) ( 4.3 ) ( 5.0 )
73 79 90 29 30 34 89 423( 17.2 ) ( 18.7 ) ( 21.3 ) ( 6.8 ) ( 7.0 ) ( 7.9 ) ( 20.9 ) ( 100.0 )( 1.8 ) ( 2.7 ) ( 1.8 ) ( 1.8 ) ( 2.1 ) ( 1.4 ) ( 2.9 ) ( 2.1 )
39 40 43 19 24 19 68 252( 15.4 ) ( 15.8 ) ( 17.1 ) ( 7.7 ) ( 9.6 ) ( 7.5 ) ( 26.8 ) ( 100.0 )( 1.0 ) ( 1.4 ) ( 0.9 ) ( 1.2 ) ( 1.7 ) ( 0.8 ) ( 2.2 ) ( 1.2 )
4,085 2,925 4,986 1,597 1,443 2,397 3,077 20,510( 19.9 ) ( 14.3 ) ( 24.3 ) ( 7.8 ) ( 7.0 ) ( 11.7 ) ( 15.0 ) ( 100.0 )( 100.0 ) ( 100.0 ) ( 100.0 ) ( 100.0 ) ( 100.0 ) ( 100.0 ) ( 100.0 ) ( 100.0 )
base: All households(grossed by households).
Water Heating Provision
Type of household
All households
None
Instantaneous only
Immersion only
Instantaneous + immersion
With CH only
hot water, system unknown
Total
CH + instantaneous
CH + immersion
CH + immersion + instantaneous
Combination including seperate
boiler

Table 2.9: Water heating provision by employment status of HRP
count(000s), (row%), (column%)
1 or more work full time
1 or more work part time
none working, one or more
retired
none working and none
retired
other / unknown
47 6 14 11 0 78( 60.8 ) ( 7.8 ) ( 17.6 ) ( 13.8 ) ( 0.0 ) ( 100.0 )( 0.4 ) ( 0.4 ) ( 0.3 ) ( 0.4 ) ( 0.0 ) ( 0.4 )
142 35 92 52 0 321( 44.2 ) ( 11.1 ) ( 28.6 ) ( 16.2 ) ( 0.0 ) ( 100.0 )( 1.3 ) ( 2.4 ) ( 1.7 ) ( 2.2 ) ( 0.0 ) ( 1.6 )
960 158 791 341 1 2,251( 42.6 ) ( 7.0 ) ( 35.2 ) ( 15.1 ) ( 0.0 ) ( 100.0 )( 8.5 ) ( 10.7 ) ( 14.9 ) ( 14.2 ) ( 7.9 ) ( 11.0 )
161 24 118 33 2 338( 47.6 ) ( 7.2 ) ( 34.8 ) ( 9.7 ) ( 0.7 ) ( 100.0 )( 1.4 ) ( 1.6 ) ( 2.2 ) ( 1.4 ) ( 17.2 ) ( 1.6 )
3,812 489 1,592 909 3 6,806( 56.0 ) ( 7.2 ) ( 23.4 ) ( 13.4 ) ( 0.0 ) ( 100.0 )( 33.7 ) ( 33.1 ) ( 29.9 ) ( 38.0 ) ( 22.6 ) ( 33.2 )
594 77 209 82 1 963( 61.7 ) ( 8.0 ) ( 21.7 ) ( 8.5 ) ( 0.1 ) ( 100.0 )( 5.3 ) ( 5.2 ) ( 3.9 ) ( 3.4 ) ( 5.3 ) ( 4.7 )
4,676 559 2,007 796 5 8,044( 58.1 ) ( 6.9 ) ( 25.0 ) ( 9.9 ) ( 0.1 ) ( 100.0 )( 41.4 ) ( 37.8 ) ( 37.7 ) ( 33.3 ) ( 38.6 ) ( 39.2 )
604 73 272 85 1 1,035( 58.4 ) ( 7.0 ) ( 26.3 ) ( 8.2 ) ( 0.1 ) ( 100.0 )( 5.3 ) ( 4.9 ) ( 5.1 ) ( 3.6 ) ( 8.3 ) ( 5.0 )
198 36 134 55 0 423( 46.8 ) ( 8.5 ) ( 31.6 ) ( 13.1 ) ( 0.0 ) ( 100.0 )( 1.8 ) ( 2.5 ) ( 2.5 ) ( 2.3 ) ( 0.0 ) ( 2.1 )
107 18 97 29 0 252( 42.6 ) ( 7.2 ) ( 38.7 ) ( 11.5 ) ( 0.0 ) ( 100.0 )( 0.9 ) ( 1.2 ) ( 1.8 ) ( 1.2 ) ( 0.0 ) ( 1.2 )
11,301 1,477 5,326 2,393 13 20,510( 55.1 ) ( 7.2 ) ( 26.0 ) ( 11.7 ) ( 0.1 ) ( 100.0 )( 100.0 ) ( 100.0 ) ( 100.0 ) ( 100.0 ) ( 100.0 ) ( 100.0 )
base: All households(grossed by households).
Water Heating Provision
Employment Status Of Head Of Household
Total
None
Instantaneous only
Immersion only
Instantaneous + immersion
With CH only
hot water, system unknown
Total
CH + instantaneous
CH + immersion
CH + immersion + instantaneous
Combination including seperate boiler

Table 2.10: Water heating provision by income quintile
count(000s), (row%), (column%)
1st quintile (lowest 20%)
2nd quintile 3rd quintile 4th quintile 5th quintile
(highest 20%)21 13 11 13 20 78
( 26.4 ) ( 16.9 ) ( 14.8 ) ( 16.7 ) ( 25.2 ) ( 100.0 )( 0.5 ) ( 0.3 ) ( 0.3 ) ( 0.3 ) ( 0.5 ) ( 0.4 )
104 73 86 53 5 321( 32.3 ) ( 22.6 ) ( 26.9 ) ( 16.4 ) ( 1.7 ) ( 100.0 )( 2.5 ) ( 1.8 ) ( 2.1 ) ( 1.3 ) ( 0.1 ) ( 1.6 )
724 634 439 276 179 2,251( 32.2 ) ( 28.2 ) ( 19.5 ) ( 12.2 ) ( 7.9 ) ( 100.0 )( 17.6 ) ( 15.5 ) ( 10.7 ) ( 6.7 ) ( 4.4 ) ( 11.0 )
84 87 85 48 34 338( 25.0 ) ( 25.9 ) ( 25.0 ) ( 14.1 ) ( 10.0 ) ( 100.0 )( 2.1 ) ( 2.1 ) ( 2.1 ) ( 1.2 ) ( 0.8 ) ( 1.6 )
1,399 1,324 1,398 1,423 1,261 6,806( 20.6 ) ( 19.5 ) ( 20.5 ) ( 20.9 ) ( 18.5 ) ( 100.0 )( 34.1 ) ( 32.3 ) ( 34.1 ) ( 34.7 ) ( 30.8 ) ( 33.2 )
130 197 225 240 171 963( 13.5 ) ( 20.4 ) ( 23.4 ) ( 24.9 ) ( 17.8 ) ( 100.0 )( 3.2 ) ( 4.8 ) ( 5.5 ) ( 5.8 ) ( 4.2 ) ( 4.7 )
1,310 1,410 1,504 1,716 2,104 8,044( 16.3 ) ( 17.5 ) ( 18.7 ) ( 21.3 ) ( 26.2 ) ( 100.0 )( 31.9 ) ( 34.4 ) ( 36.7 ) ( 41.8 ) ( 51.3 ) ( 39.2 )
151 203 197 243 241 1,035( 14.6 ) ( 19.6 ) ( 19.1 ) ( 23.5 ) ( 23.3 ) ( 100.0 )( 3.7 ) ( 4.9 ) ( 4.8 ) ( 5.9 ) ( 5.9 ) ( 5.0 )
97 96 103 70 57 423( 23.0 ) ( 22.8 ) ( 24.3 ) ( 16.4 ) ( 13.6 ) ( 100.0 )( 2.4 ) ( 2.3 ) ( 2.5 ) ( 1.7 ) ( 1.4 ) ( 2.1 )
82 66 53 23 28 252( 32.7 ) ( 26.1 ) ( 21.0 ) ( 8.9 ) ( 11.2 ) ( 100.0 )( 2.0 ) ( 1.6 ) ( 1.3 ) ( 0.5 ) ( 0.7 ) ( 1.2 )
4,102 4,103 4,102 4,102 4,101 20,510( 20.0 ) ( 20.0 ) ( 20.0 ) ( 20.0 ) ( 20.0 ) ( 100.0 )( 100.0 ) ( 100.0 ) ( 100.0 ) ( 100.0 ) ( 100.0 ) ( 100.0 )
base: All households(grossed by households).
TotalWater Heating ProvisionIncome Quintile
None
Instantaneous only
Immersion only
Instantaneous + immersion
With CH only
hot water, system unknown
Total
CH + instantaneous
CH + immersion
CH + immersion + instantaneous
Combination including seperate boiler
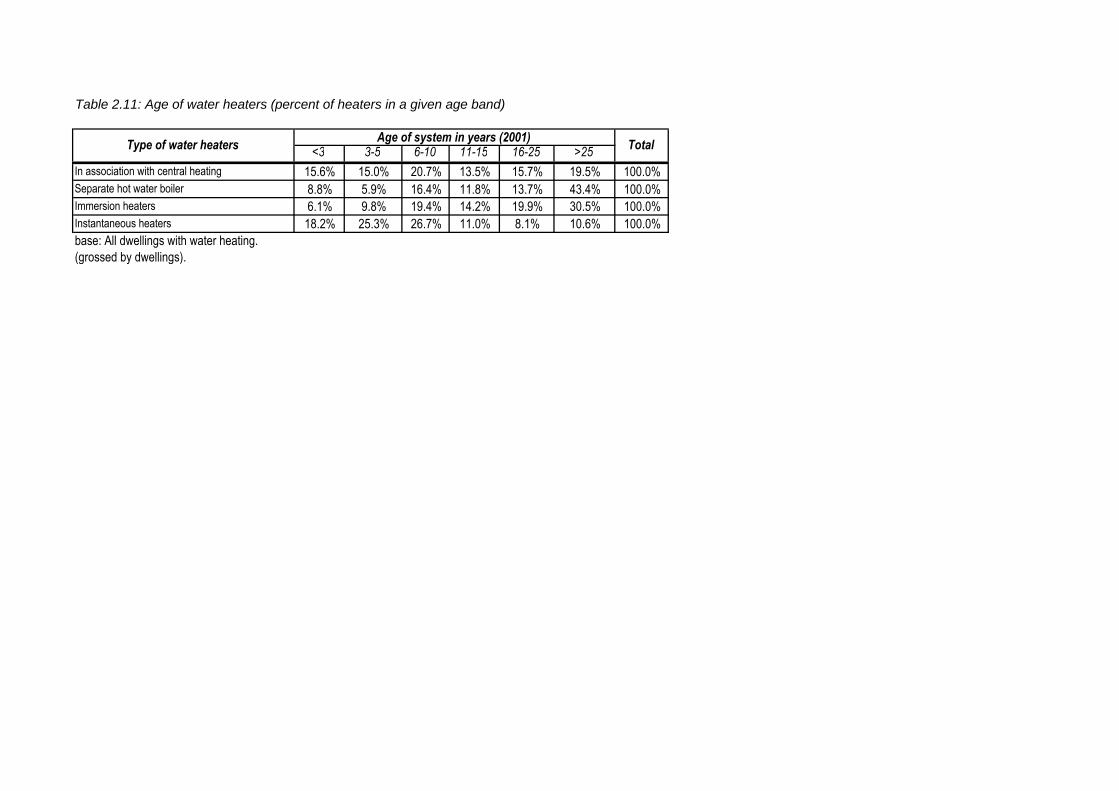
Table 2.11: Age of water heaters (percent of heaters in a given age band)
<3 3-5 6-10 11-15 16-25 >25In association with central heating 15.6% 15.0% 20.7% 13.5% 15.7% 19.5% 100.0%Separate hot water boiler 8.8% 5.9% 16.4% 11.8% 13.7% 43.4% 100.0%Immersion heaters 6.1% 9.8% 19.4% 14.2% 19.9% 30.5% 100.0%Instantaneous heaters 18.2% 25.3% 26.7% 11.0% 8.1% 10.6% 100.0%base: All dwellings with water heating.(grossed by dwellings).
Age of system in years (2001) TotalType of water heaters

Table 2.12: The use of individual instantaneous heaters (percent of dwellings with this form of provision)
Instantaneous heaters of unknown type
Gas - Single point heaters
Gas - Multi-point heaters
Electric - Single point heaters
Electric - Multi-point heaters
All types
Instantaneous only 1.4% 0.3% 8.6% 1.5% 0.4% 12.3%Instantaneous + immersion 1.6% 0.4% 0.0% 10.2% 0.2% 12.4%Boiler + instantaneous 0.3% 0.3%Boiler + instantaneous + immersion 0.1% 0.1% 0.8% 1.0%CH + instantaneous 2.9% 1.1% 3.3% 27.7% 0.2% 35.2%CH + immersion + instantaneous 4.2% 0.5% 32.2% 0.2% 37.1%CH + boiler + instantaneous 0.1% 0.1% 0.2% 0.3% 0.7%CH + boiler + immersion + instantaneous 0.2% 0.8% 1.1%All combinations 10.5% 2.3% 12.2% 73.9% 1.0% 100.0%base: All dwellings with instantaneous water heaters.(grossed by dwellings).
Profile of water heating provision
Type of instantaneous heaters

Table 3.1: Profile of fuel usage for space and water heating by tenure (percentages within each tenure)
Owner occupied
Private rented LA RSL All tenures
Electricity only 6.0% 19.1% 13.8% 19.9% 9.2%Solid fuel only 0.3% 0.8% 0.5% 0.1% 0.4%Solid fuel + electricity 2.4% 5.8% 3.7% 2.7% 2.9%Fuel oil only 0.2% 0.4% 0.1% 0.0% 0.2%Fuel oil + electricity 1.4% 0.8% 0.3% 0.1% 1.1%Fuel oil + solid fuel 2.6% 1.8% 0.0% 0.1% 2.0%Mains gas only 29.3% 29.8% 31.5% 30.1% 29.7%Mains gas + electricity 49.0% 35.9% 48.9% 45.8% 47.5%Mains gas + solid fuel 8.6% 5.7% 1.1% 1.2% 6.9%Mains gas + fuel oil + electricity 0.1% 0.1%All combinations 100.0% 100.0% 100.0% 100.0% 100.0%base: All dwellings with space or water heating.(grossed by dwellings).
Profile of fuel usageTenure

Table 3.2: Fuel used for primary heating system by Government Office Region
count(000s), (row%), (column%)
North EastYorkshire & Humberside
North West & Merseyside
East MidlandsWest
MidlandsSouth West Eastern South East London
945 1,932 2,589 1,489 1,819 1,563 1,779 2,836 2,647 17,599( 5.4 ) ( 11.0 ) ( 14.7 ) ( 8.5 ) ( 10.3 ) ( 8.9 ) ( 10.1 ) ( 16.1 ) ( 15.0 ) ( 100.0 )( 88.0 ) ( 87.6 ) ( 88.7 ) ( 80.9 ) ( 84.6 ) ( 73.8 ) ( 76.4 ) ( 82.7 ) ( 86.1 ) ( 83.2 )
62 138 233 157 196 334 268 363 259 2,012( 3.1 ) ( 6.9 ) ( 11.6 ) ( 7.8 ) ( 9.8 ) ( 16.6 ) ( 13.3 ) ( 18.1 ) ( 12.9 ) ( 100.0 )( 5.8 ) ( 6.3 ) ( 8.0 ) ( 8.5 ) ( 9.1 ) ( 15.8 ) ( 11.5 ) ( 10.6 ) ( 8.4 ) ( 9.5 )
36 75 19 83 59 76 49 39 7 444( 8.0 ) ( 17.0 ) ( 4.3 ) ( 18.8 ) ( 13.3 ) ( 17.2 ) ( 11.1 ) ( 8.7 ) ( 1.7 ) ( 100.0 )( 3.3 ) ( 3.4 ) ( 0.7 ) ( 4.5 ) ( 2.7 ) ( 3.6 ) ( 2.1 ) ( 1.1 ) ( 0.2 ) ( 2.1 )
13 32 34 81 61 135 202 140 12 708( 1.8 ) ( 4.5 ) ( 4.8 ) ( 11.4 ) ( 8.6 ) ( 19.1 ) ( 28.5 ) ( 19.8 ) ( 1.7 ) ( 100.0 )( 1.2 ) ( 1.4 ) ( 1.2 ) ( 4.4 ) ( 2.8 ) ( 6.4 ) ( 8.7 ) ( 4.1 ) ( 0.4 ) ( 3.4 )
19 29 44 30 16 11 29 49 150 377( 5.0 ) ( 7.7 ) ( 11.8 ) ( 8.0 ) ( 4.2 ) ( 2.8 ) ( 7.6 ) ( 13.1 ) ( 39.8 ) ( 100.0 )( 1.8 ) ( 1.3 ) ( 1.5 ) ( 1.6 ) ( 0.7 ) ( 0.5 ) ( 1.2 ) ( 1.4 ) ( 4.9 ) ( 1.8 )
1,074 2,207 2,919 1,841 2,151 2,119 2,327 3,428 3,076 21,140( 5.1 ) ( 10.4 ) ( 13.8 ) ( 8.7 ) ( 10.2 ) ( 10.0 ) ( 11.0 ) ( 16.2 ) ( 14.5 ) ( 100.0 )( 100.0 ) ( 100.0 ) ( 100.0 ) ( 100.0 ) ( 100.0 ) ( 100.0 ) ( 100.0 ) ( 100.0 ) ( 100.0 ) ( 100.0 )
base: All dwellings(grossed by dwellings).
Total
Total
Solid Fuel
Fuel Oil
Communal
Government Office RegionFuel used for primary heating
system
Gas
Electricity