energy transition in germany and regional spillovers: what ... · from the firm or university...
TRANSCRIPT

Dis cus si on Paper No. 17-044
Energy Transition in Germany and Regional Spillovers:
What Triggers the Diffusion of Renewable Energy in Firms?Jens Horbach and Christian Rammer

Dis cus si on Paper No. 17-044
Energy Transition in Germany and Regional Spillovers:
What Triggers the Diffusion of Renewable Energy in Firms?Jens Horbach and Christian Rammer
Download this ZEW Discussion Paper from our ftp server:
http://ftp.zew.de/pub/zew-docs/dp/dp17044.pdf
Die Dis cus si on Pape rs die nen einer mög lichst schnel len Ver brei tung von neue ren For schungs arbei ten des ZEW. Die Bei trä ge lie gen in allei ni ger Ver ant wor tung
der Auto ren und stel len nicht not wen di ger wei se die Mei nung des ZEW dar.
Dis cus si on Papers are inten ded to make results of ZEW research prompt ly avai la ble to other eco no mists in order to encou ra ge dis cus si on and sug gesti ons for revi si ons. The aut hors are sole ly
respon si ble for the con tents which do not neces sa ri ly repre sent the opi ni on of the ZEW.
Energy Transition in Germany and Regional Spillovers:
What Triggers the Diffusion of Renewable Energy in Firms?
Jens Horbach1, Christian Rammer2
October 2017
Abstract
The success of an energy turnaround towards renewables highly depends on the willingness and ability of firms to adopt energy technologies using renewable sources. Existing studies focused on the role of regulation and energy markets (e.g. the price for fossil energy) to ex-plain the diffusion of green energy technologies. The present paper tries to give a more com-prehensive view on the determinants of renewable energy innovations focusing on the crucial role of firms' regional environment (role of regional spillover effects, the greenness of a re-gion and the regional endowment with green energy plants). We use a unique database com-bining the Community Innovation Survey 2014 for Germany and NUTS 3 data on renewable energy plants, the greenness of a region and other economic control variables. We find that geographical proximity to electricity production based on renewable energy sources and the orientation of a region towards 'green issues' (measured by the share of green party voters) are both major drivers for such innovations. Furthermore, our results show that in addition to reg-ulation, government subsidies for eco-innovation, high energy costs and regional knowledge spillovers contribute to a rapid adoption of renewable energy. The reinforcing nature of this process leads to a diverging regional development of renewable energy innovations.
JEL-Classification: C25, O31, Q20, R11
Key Words: Eco-Innovation, Renewable Energy, Community Innovation Survey
1 University of Applied Sciences Augsburg, Germany
2 Centre for European Economic Research (ZEW), Mannheim, Germany

1
1. Introduction
Shifting energy consumption from fossil sources to renewables is a key policy objective in
many countries, including Germany. In 2016, Germany already attained a share of 29% of
renewable energy sources in gross electricity generation while fossil energy sources still show
a predominant share of 53.6% (hard coal 17.2%, lignite 23.1%, natural gas 12.4%, oil 0.9%)
(BMWi 2017a). Following the goals of the German government, the share of renewables shall
rise up to 45% in 2025 (BMWi 2017a). For 2050, a share of 80% is targeted. To reach these
ambitious goals, innovations leading to a substitution of fossil energy sources by renewables
are crucial.
At first glance, regulations such as the German renewable energy law seem to be one of the
most important determinants to introduce renewable energy innovations (see Gawel et al.
2014, Frondel et al. 2010, Rammer et al. 2017) but the importance of this nationwide law
cannot explain the significant regional differences in renewable energy innovation activities.
In the innovation literature, regional spillovers (see Cantner et al. 2016) and tacit knowledge
play a more and more important role whereas the growing literature on the determinants of
eco-innovation widely neglects these effects. The present paper tries to assess the relevance of
regional factors for innovation in renewable energy as an important subfield of eco-
innovation. We use a unique database combining three different sources. The main data
source is the Community Innovation Survey (CIS) 2014 for Germany which contains detailed
information on eco-innovation activities and their drivers, including innovations towards sub-
stituting fossil by renewable energy sources in a firm's process technologies. This firm-level
database is matched with data on more than 1,400,000 renewable energy plants (solar, water,
wind and biomass) and further regional indicators on the NUTS 3 level. These additional da-
tabases enlarge the already rich control variable set of the CIS by regional variables such as
the greenness of a region and the existing capacities in the regional renewable energy produc-
tion. Thus, we are able analysing if - besides "traditional" determinants such as environmental
regulations or subsidies - the introduction of renewable energy innovations is also supported
by regional spillover effects, the greenness of a region or the regional endowment with a
green capital stock. Our econometric models assess the importance of these effects while con-
trolling for the relevance of environmental policy measures, energy costs or the technological
capabilities of a firm.

2
The paper is organised as follows. Section 2 describes the theoretical framework of the rele-
vance of regional spillover effects on renewable energy innovations besides further potential
determinants. Furthermore, the section contains an overview of the existing empirical litera-
ture. In Section 3.1, the database, descriptive statistics and the econometric estimation strate-
gy are discussed. Section 3.2 presents the estimation results. Section 4 concludes and devel-
ops policy recommendations.
2. Determinants of Renewable Energy Innovations
Renewable energy innovations can be defined as process or organisational innovations lead-
ing to a substitution of fossil energy sources by renewable sources within firms. In most cas-
es, this substitution is cost-intensive so that government subsidies or rising costs of fossil en-
ergy sources may be trigger factors (e.g. Horbach et al. 2012, Grupp 1999) for renewable en-
ergy innovations. In addition, firms may be pushed to substitute fossil by renewable energy
sources if regulation on emissions (e.g. CO2) becomes more stringent. While these factors
usually affect all firms with a similar energy consumption pattern in the same way, substantial
regional differences in renewable energy innovation can be observed in German regions
(Länder). In general (Table 1), the West German Länder are more eco-innovative compared
to the East, especially Rhineland-Palatinate, Baden-Wurttemberg and Bavaria. The two last-
mentioned Länder also show a disproportionally high stock of solar and biomass plants per
capita whereas the wind plants are more concentrated in the Northeast of Germany because of
geographical reasons. Brandenburg shows high solar, biomass and wind values but not so
many innovative firms, the technologies they apply seem to be predominantly developed
elsewhere. North Rhine-Westphalia is highly innovative but seems not to be specialised in
renewable energy innovations.

3
Table 1: Regional distribution of innovation activities
German Länder Share of re-newable en-ergy innova-
tors (%)
Share of in-novative firms
(%)
Solar, bio-mass
(kwp/capita)
Wind (kwp/capita)
Baden-Wuerttemberg Bavaria Berlin Brandenburg Bremen Hamburg Hesse Lower Saxony Mecklenburg West-Pomerania North Rhine-Westphalia Rhineland-Palatinate Saarland Saxony Saxony-Anhalt Schleswig-Holstein Thuringia
14.4 13.6 4.4 8.3
13.4 8.1
10.9 11.1 9.8 8.7
14.3 12.5 7.7 7.3 7.5
10.8
59.2 58.0 55.3 48.7 60.2 56.8 59.9 53.4 48.7 59.3 62.3 56.7 55.2 47.2 51.9 56.1
64.7 82.6 3.1
129.0 6.9 4.7
27.0 57.9 38.0 27.9 46.5 44.3 18.3 48.8 70.1 56.4
7.0 8.0 0.1
231.3 22.5 2.7
12.5 84.2 64.5 20.5 49.2 22.5 11.6 96.2
147.8 50.3
Total 10.5 56.7 47.4 32.5 Source: Statistisches Bundesamt (2017), Community Innovation Survey 2014, own calculations.
The main aim of this paper is to explain these regional differences and to identify regional
determinants of eco-innovations in the field of renewable energy. Whereas the literature on
the determinants of eco-innovation is growing fast (see e.g. Barbieri et al. 2016 for a recent
overview), the inclusion of regional aspects still remains rare (see Antonioli et al. 2016, Cant-
ner et al. 2016, Horbach 2014 as exceptions). We argue that the regional factors play a promi-
nent role in the diffusion of eco-innovations, particularly if a decentralised approach is fol-
lowed. The decentralised approach rests on the conversion of energy from renewable sources
into electricity or heat at the location of the energy users through small renewable energy fa-
cilities (photovoltaic cells, solar panels, biomass power plants, geothermal energy plants) or
based on regional producer organisations (in the case of wind power) (Vona et al. 2012). In
contrast, the centralised approach rests on firms from the energy sector who convert their pro-
duction units from fossil to renewable energy sources and distribute electricity (or other forms
of energy) based on renewables to their customers.
Germany largely followed the decentralised way. In this approach, adopting renewable energy
technologies by energy consuming firms is a major driver for the energy transition. As with

4
other innovations, uncertainty about the technical feasibility and the market prospects as well
as high innovation costs can act as barriers.
On the background of regional economics (Krugman 1991, Asheim and Gertler 2005) the role
of regional spillover effects, tacit knowledge and regional technology endowments has to be
analysed. Furthermore, the green orientation of a region may lead to path dependencies. The
so-called diamond model of Porter (Porter 2000, Eickelpasch et al. 2011) assumes that, firstly,
the regional endowment with natural, human and capital resources, physical, administrative,
informational, scientific and technological infrastructure, and the quality and the specializa-
tion of production factors determine the technological capabilities of a region. Furthermore,
positive agglomeration effects result from the geographic proximity of (similar) firms, con-
sumers and a fitting infrastructure (Eckey 2008). They can be divided in localization and ur-
banization advantages. Localization advantages describe the positive external effects resulting
from the proximity of firms of the same industry whereas urbanization advantages result from
the existence of a high number of firms of different industries and from typical advantages of
highly concentrated urban areas (e.g. more leisure and cultural opportunities and a higher
product diversity) (Eckey 2008). Audretsch (1998:1) states that “The spillover of knowledge
from the firm or university creating that knowledge to a third-party firm is essential to innova-
tive activity. Such knowledge spillovers tend to be spatially restricted”. Asheim and Gertler
(2005:291) even resume that “…the more knowledge-intensive the economic activity, the
more geographically clustered it tends to be.” The role of spatial proximity has been rein-
forced despite the increasing use of digital communication technologies because of the in-
creasing importance of the so-called “…embedded tacit knowledge” (Asheim and Gertler
2005:292). Transferring this tacit knowledge usually requires face-to-face interaction. Espe-
cially the diffusion of organisational innovations such as the re-organisation of production
units can strongly profit from mutual learning and the exchange of experience within regions
since the codification of the critical knowledge e.g. through patenting and the trade of these
innovations through embodied technology is restricted. Firms that have successfully imple-
mented renewable energy systems will provide a 'role model' and encourage other firms to
follow. Antonioli et al. (2016:5) stress that "The degree of closeness to other firms that adopt
EIs [environmental innovations] and the presence of homogeneous institutional conditions in
a given territory can influence the diffusion of EIs through knowledge transfer."
5
Learning from other firms who have successfully adopted renewable energy technologies re-
duce information asymmetries over the technical and economic feasibility of new technolo-
gies. Such learning is strongly facilitated by geographic proximity to the peers (Audretsch
1998, Asheim and Gertler 2005) also because of the role of tacit knowledge that can only be
transmitted by face-to-face contacts. Pioneers of renewable energy innovation in a region and
specialised suppliers can demonstrate to other potential adopters how the innovation can work
and speed up diffusion thus leading to localization advantages. Furthermore, the political and
social environment in a region can push firms to adopt renewable energy innovation through
social pressure. On the other side, firms may use the implementation of renewables as an in-
strument to improve their reputation. If regional actors highly value a transition towards a
green economy, firms can profit from innovating in this area by gaining in reputation both
with respect to attracting qualified labour and by a better marketing of their products.
All in all, the technological spillovers resulting from already existing renewable energy
plants, specialised firms and workforce connected with the green orientation of the region
(higher reputation of the firm) help compensating for higher costs of renewables in the short
run. Based on these arguments, we derive the following hypotheses:
H1: The endowment of a region with renewable energy plants triggers the substitution of
fossil energy.
H2: Localisation effects are important for the diffusion of renewable energy innovations.
H3: The orientation of a region towards 'green issues' promotes the substitution of fossil
energy by renewables.
Regional factors are of course not the only determinants for renewable energy innovation. The
literature on eco-innovation has been stressing the role of regulation and energy costs (e.g.
Horbach et al. 2012, Demirel and Kesidou 2012). In addition, governments may provide sub-
sidies for the adoption of renewable energy technologies, which naturally will increase their
adoption. German has followed this approach with the Renewable Energy Sources Act (EEG).
This law aims "…to increase the proportion of electricity generated from renewable energy
sources as a percentage of gross electricity consumption to 1. 40 to 45 percent by 2025, 2. 55
to 60 percent by 2035 and 3. at least 80 percent by 2050" (BMWi 2017b:1). Fixed feed-in
tariffs and purchase guarantees support the introduction of renewables energies by lowering
the relative energy prices in favour of renewables so that their proportion of gross power con-

6
sumption increased from 6% in 2000 to 31.7% in 2016 (BMWi 2017a). In order to test the
relevance of regulation, subsidies and energy costs for renewable energy innovation, we for-
mulate our hypothesis H4:
H4: Government regulation, government subsidies and high energy costs increase the pro-
pensity of firms to adopt renewable energy technologies.
Empirical studies on innovation in renewables
The determinants of eco-innovation (see also Barbieri et al. 2016 or Horbach 2015 as over-
views) in general have been extensively analysed. In the following, we summarise the results
for the main recent studies concentrating on the determinants of the introduction and diffusion
of renewable energy innovations as a special field of eco-innovation.
In a recent analysis, Schleich et al. (2017) explore the determinants of wind power technolo-
gies in twelve OECD countries using patent counts. The stock of wind capacity, a country´s
innovative capacity measured by the number of patents per capita and the legitimacy of wind
technologies measured by the share of green party voters supports innovations in wind power
technologies. Furthermore, a stable policy environment is important. Cantner et al. (2016)
also use patent data to evaluate the influence of different policy instruments on technological
change and efficiency gains in wind power and photovoltaics. The authors find significant
differences between the driving forces of these renewable energy technologies. Whereas wind
power is mostly driven by technology push instruments, demand pull seems to be more im-
portant for photovoltaics. Costantini et al. (2017) stress the point that a well-balanced policy
mix of demand-pull and technology-push instruments is crucial for innovation in energy effi-
ciency technologies.
Johnstone et al. (2010) analyse the effects of different policy instruments on the development
of renewable energy technologies. Their patent analysis reveals a high importance of feed-in-
tariffs for solar energy whereas more cost-competitive technologies such as wind power are
not triggered by this policy instrument. Groba and Breitschopf (2013) confirm the crucial role
of specific renewable energy policies to overcome market failures and barriers for the intro-
duction of renewable energies.
Arvanitis et al. (2017) analyse effects of regulation measures, energy taxes and voluntary
agreements and subsidies on the development of green energy product innovations for Aus-
7
tria, Germany and Switzerland. If taxes and regulations do not support additional demand,
their influence is negative with respect to energy product innovations whereas subsidies and
voluntary agreements are positively correlated to energy product innovations.
Nesta et al. (2014) analyse the general determinants of renewable energy innovation. The au-
thors consider policy-inducement mechanisms, the influence of the market structure, the de-
mand and social cohesion and characteristics of countries´ knowledge bases. Their patent
analysis for different OECD countries from 1970 to 2005 shows a significantly negative in-
fluence of entry barriers and inequality on renewable energy innovation whereas product
market liberalization triggers green patent generation, especially in combination with ambi-
tious energy policies. Their patent analysis also accounts for the endogeneity of environmen-
tal policy. For 108 developing countries between 1980 and 2010, Pohl and Mulder (2013)
detect a positive role of regulatory instruments, higher per capita income and schooling levels,
and stable, democratic regimes on the diffusion of non-hydro related renewable energies.
Conti et al. (2016) estimate the relevance of knowledge spillovers for renewable energy inno-
vators from 1985 to 2010. The authors show that "EU RES inventors have increasingly built
'on the shoulders of the other EU giants'" (Conti et al. 2016:1).
Noailly and Smeets (2016:5) analyse the role of financial constraints for the realization of
renewable energy innovations. They find that innovative newcomers in the field of renewable
energy are especially concerned by financial constraints "…not solely because they are
younger and less mature than other established firms, but mainly because they focus on new
clean technologies that are still perceived as more risky by investors than the incumbent tech-
nologies based on fossil-fuel electricity generation." Furthermore, Foster et al. (2017) point to
the problem that the cost of fossil fuel power generation will respond to the increase use of
renewables thus leading to a delay of its diffusion.

8
3. Empirical Analysis of Renewable Energy Innovations in
German Firms
3.1 Data, Estimation Strategy and Indicators
Our study is based on a unique data set for Germany combining the Community Innovation
Survey (CIS) of the reference year 2014, regional data at the NUTS 3 level and data on
1,486,036 different renewable energy plants indicating the regionalised renewable energy
capital stock. The CIS 2014 contained a separate module on eco-innovations. An eco-
innovation has been defined as follows: "An innovation with environmental benefits is a new
or significantly improved product (good or service), process, organisational method or mar-
keting method that creates environmental benefits compared to alternatives. The environmen-
tal benefits can be the primary objective of the innovation or a by-product of other objectives.
The environmental benefits of an innovation can occur during the production of a good or
service, or during its consumption or use by the end user of a product. The end user can be an
individual, another enterprise, the Government, etc." (Eurostat 2015:12). The following con-
tains a list of environmental benefits that an eco-innovation could have produced either within
the firm or from the after-sale use of a product by the user for which surveyed firms should
say whether this benefit has occurred or not. In addition, the survey asked firms whether any
of these eco-innovations have been introduced in response to existing or expected environ-
mental regulations, the availability of financial support by governments, demand from cus-
tomers, or voluntary codes or industry agreements.
The German CIS 2014 covers 8,684 firms in mining and quarrying, manufacturing, energy
and water supply, and a large number of service sectors. The response rate was 25% both for
manufacturing and services which is in line with comparable non-mandatory surveys.
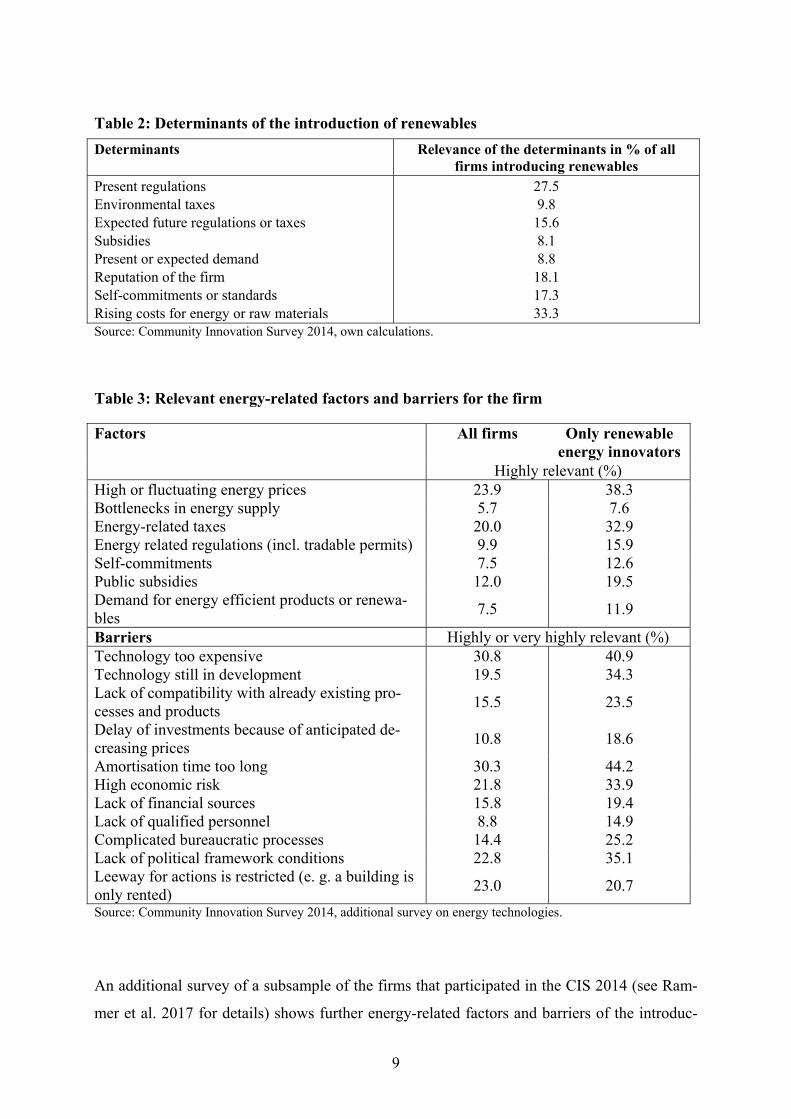
An analysis of the question on the determinants of all firms introducing renewable energy
innovations shows that present regulations (27.5%) and rising energy costs (33.3%) are most
important, the improvement of the reputation of the firm (18.1%) is also a highly relevant
factor (Table 2).
9
Table 2: Determinants of the introduction of renewables
Determinants Relevance of the determinants in % of all firms introducing renewables
Present regulations Environmental taxes Expected future regulations or taxes Subsidies Present or expected demand Reputation of the firm Self-commitments or standards Rising costs for energy or raw materials
27.5 9.8
15.6 8.1 8.8
18.1 17.3 33.3
Source: Community Innovation Survey 2014, own calculations.
Table 3: Relevant energy-related factors and barriers for the firm
Factors All firms Only renewable energy innovators
Highly relevant (%) High or fluctuating energy prices 23.9 38.3 Bottlenecks in energy supply 5.7 7.6 Energy-related taxes 20.0 32.9 Energy related regulations (incl. tradable permits) 9.9 15.9 Self-commitments 7.5 12.6 Public subsidies 12.0 19.5 Demand for energy efficient products or renewa-bles
7.5 11.9
Barriers Highly or very highly relevant (%) Technology too expensive 30.8 40.9 Technology still in development 19.5 34.3 Lack of compatibility with already existing pro-cesses and products
15.5 23.5
Delay of investments because of anticipated de-creasing prices
10.8 18.6
Amortisation time too long 30.3 44.2 High economic risk 21.8 33.9 Lack of financial sources 15.8 19.4 Lack of qualified personnel 8.8 14.9 Complicated bureaucratic processes 14.4 25.2 Lack of political framework conditions 22.8 35.1 Leeway for actions is restricted (e. g. a building is only rented)
23.0 20.7
Source: Community Innovation Survey 2014, additional survey on energy technologies.
An additional survey of a subsample of the firms that participated in the CIS 2014 (see Ram-
mer et al. 2017 for details) shows further energy-related factors and barriers of the introduc-
10
tion of renewable energy innovations (Table 3). The results show that high or fluctuating en-
ergy prices, taxes, regulations and public subsidies are especially relevant for renewable ener-
gy innovators. On the other side, complicated bureaucratic processes and a lack of political
framework conditions are barriers for renewable energy innovations. Furthermore, the eco-
nomic risk introducing renewables seems to be higher compared to all firms in the sample.
Estimation strategy
In a first step, we estimate the probability to introduce innovations that help substituting fos-
sils by renewables compared to all other firms in the sample. In a second step, we restrict our
sample to eco-innovators, only. This analysis aims at analysing the specificities of renewable
energy innovations compared to other eco-innovation fields especially the role of regulation
and cost-savings as motivation. Unfortunately, the data basis does not allow analysing the role
of regulation for the whole sample because the regulation variable is only available for eco-
innovators.
In all models, regional variables at the NUTS 3 level are matched to the firm-level data of the
CIS leading to possible intra-cluster correlation so that the standard errors using normal probit
models would be too low. We use multilevel mixed effects probit models to account for this
problem and probit models with clustered standard errors as a robustness check. As cluster
size in our sample varies significantly from 1 to 725 firms in a cluster multilevel mixed ef-
fects models are the more adequate choice.
Our two-level mixed-effects probit regression contains both random and fixed effects. The
model reads as follows (STATACorp 2015): We have to consider a two-level model for a
series of 396 clusters (396 regional German NUTS 3 units)
Pr (yij = 1) = H (xijβ + uj)
for j = 1; …; 396 clusters, with cluster j consisting of i = 1; …; nj observations. The responses
yij are the binary-valued renewableij. The vector xij are the covariates for the fixed effects,
whereas the vector uj analogously represents the random effects. The basis of this model is the
variance components model (stated as latent linear response): ∗ = xijß + uj + εij, where the
errors εij are distributed as normal and are independent of the random effects uj. The log like-
lihood function is approximated by Gauss-Hermite quadrature (STATACorp 2015, Cameron
and Trivedi 2009).
11
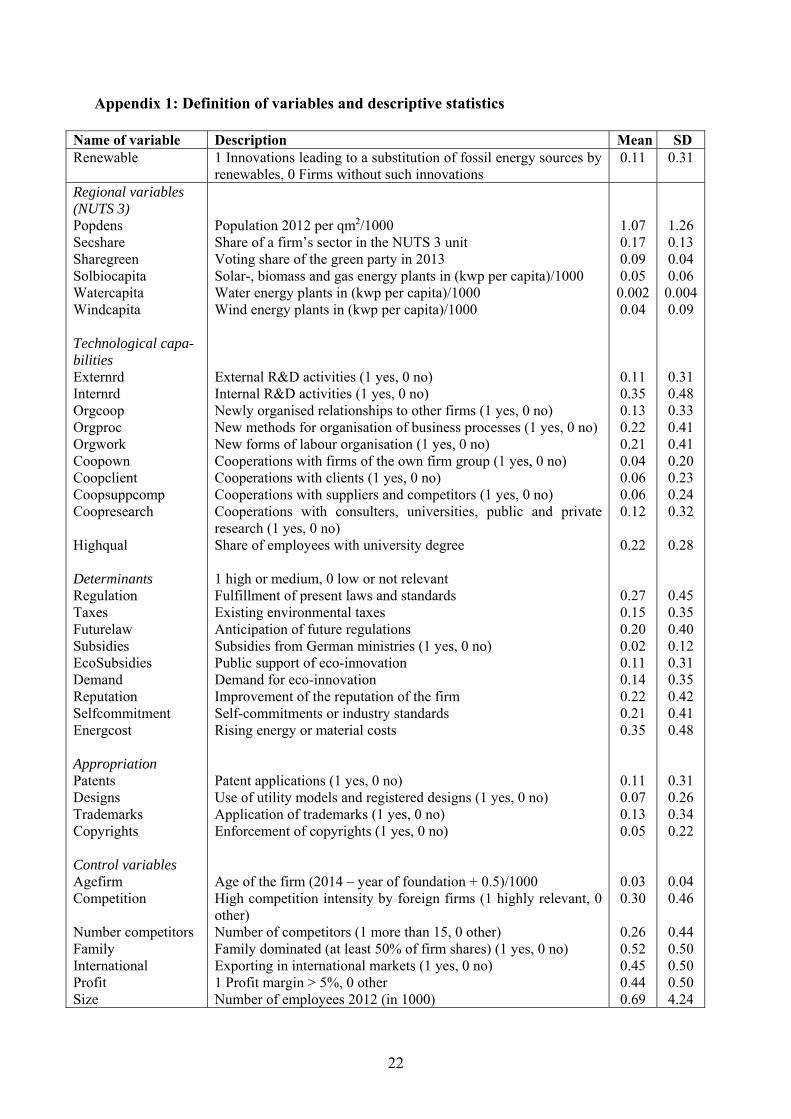
Measurement of variables
A description of all model variables along with descriptive statistics is provided in the Ap-
pendix. Our dependent variable Renewable gets the value one if the firm has realised an inno-
vation that led to a substitution of fossil energy sources by renewables.
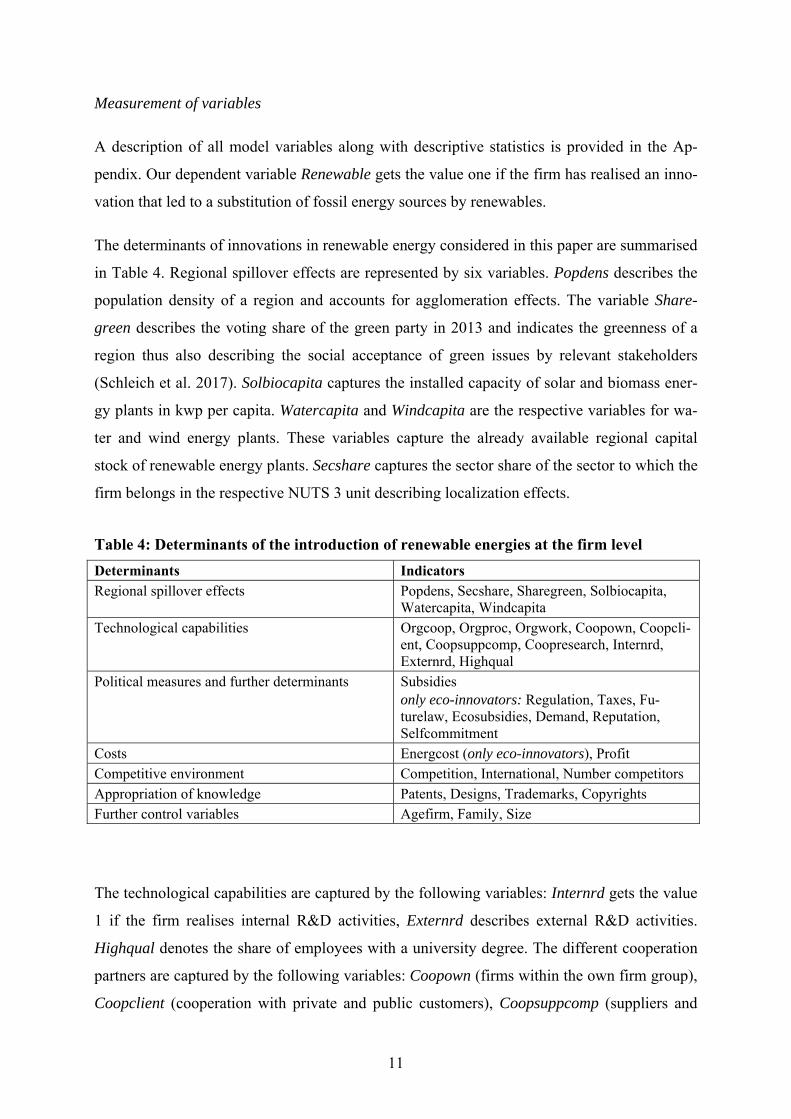
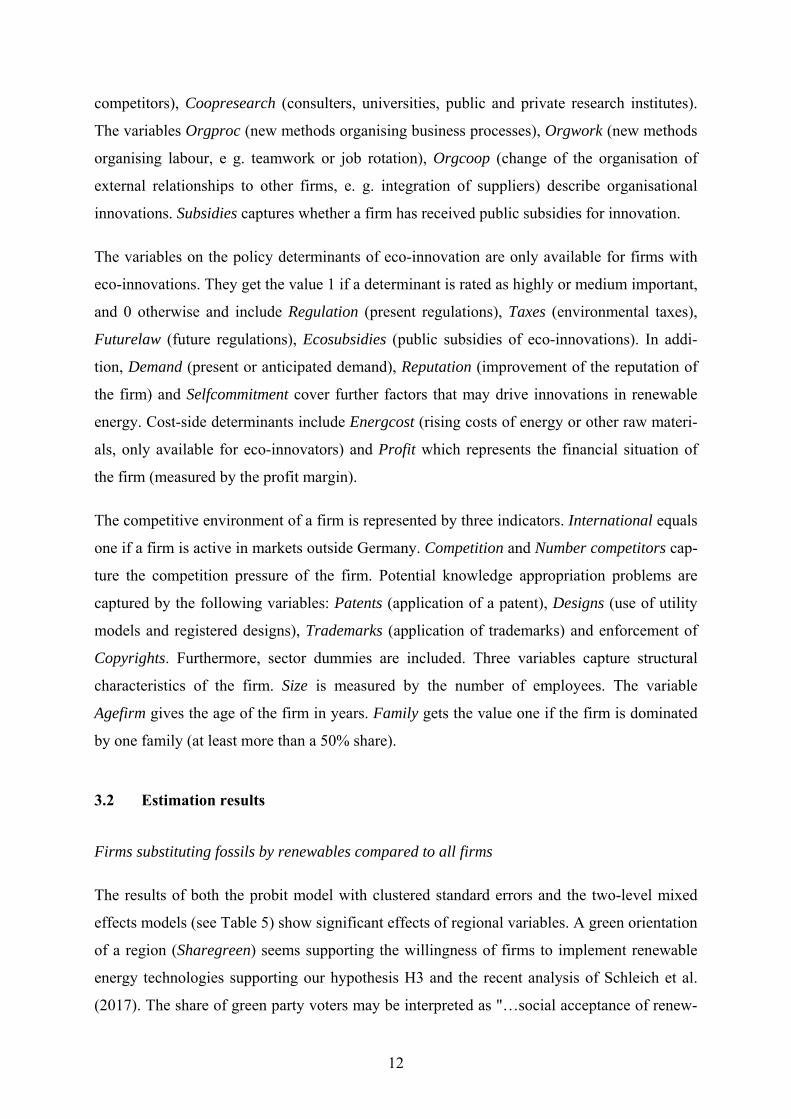
The determinants of innovations in renewable energy considered in this paper are summarised
in Table 4. Regional spillover effects are represented by six variables. Popdens describes the
population density of a region and accounts for agglomeration effects. The variable Share-
green describes the voting share of the green party in 2013 and indicates the greenness of a
region thus also describing the social acceptance of green issues by relevant stakeholders
(Schleich et al. 2017). Solbiocapita captures the installed capacity of solar and biomass ener-
gy plants in kwp per capita. Watercapita and Windcapita are the respective variables for wa-
ter and wind energy plants. These variables capture the already available regional capital
stock of renewable energy plants. Secshare captures the sector share of the sector to which the
firm belongs in the respective NUTS 3 unit describing localization effects.
Table 4: Determinants of the introduction of renewable energies at the firm level
Determinants Indicators Regional spillover effects Popdens, Secshare, Sharegreen, Solbiocapita,
Watercapita, Windcapita Technological capabilities Orgcoop, Orgproc, Orgwork, Coopown, Coopcli-
ent, Coopsuppcomp, Coopresearch, Internrd, Externrd, Highqual
Political measures and further determinants Subsidies only eco-innovators: Regulation, Taxes, Fu-turelaw, Ecosubsidies, Demand, Reputation, Selfcommitment
Costs Energcost (only eco-innovators), Profit Competitive environment Competition, International, Number competitors Appropriation of knowledge Patents, Designs, Trademarks, Copyrights Further control variables Agefirm, Family, Size
The technological capabilities are captured by the following variables: Internrd gets the value
1 if the firm realises internal R&D activities, Externrd describes external R&D activities.
Highqual denotes the share of employees with a university degree. The different cooperation
partners are captured by the following variables: Coopown (firms within the own firm group),
Coopclient (cooperation with private and public customers), Coopsuppcomp (suppliers and
12
competitors), Coopresearch (consulters, universities, public and private research institutes).
The variables Orgproc (new methods organising business processes), Orgwork (new methods
organising labour, e g. teamwork or job rotation), Orgcoop (change of the organisation of
external relationships to other firms, e. g. integration of suppliers) describe organisational
innovations. Subsidies captures whether a firm has received public subsidies for innovation.
The variables on the policy determinants of eco-innovation are only available for firms with
eco-innovations. They get the value 1 if a determinant is rated as highly or medium important,
and 0 otherwise and include Regulation (present regulations), Taxes (environmental taxes),
Futurelaw (future regulations), Ecosubsidies (public subsidies of eco-innovations). In addi-
tion, Demand (present or anticipated demand), Reputation (improvement of the reputation of
the firm) and Selfcommitment cover further factors that may drive innovations in renewable
energy. Cost-side determinants include Energcost (rising costs of energy or other raw materi-
als, only available for eco-innovators) and Profit which represents the financial situation of
the firm (measured by the profit margin).
The competitive environment of a firm is represented by three indicators. International equals
one if a firm is active in markets outside Germany. Competition and Number competitors cap-
ture the competition pressure of the firm. Potential knowledge appropriation problems are
captured by the following variables: Patents (application of a patent), Designs (use of utility
models and registered designs), Trademarks (application of trademarks) and enforcement of
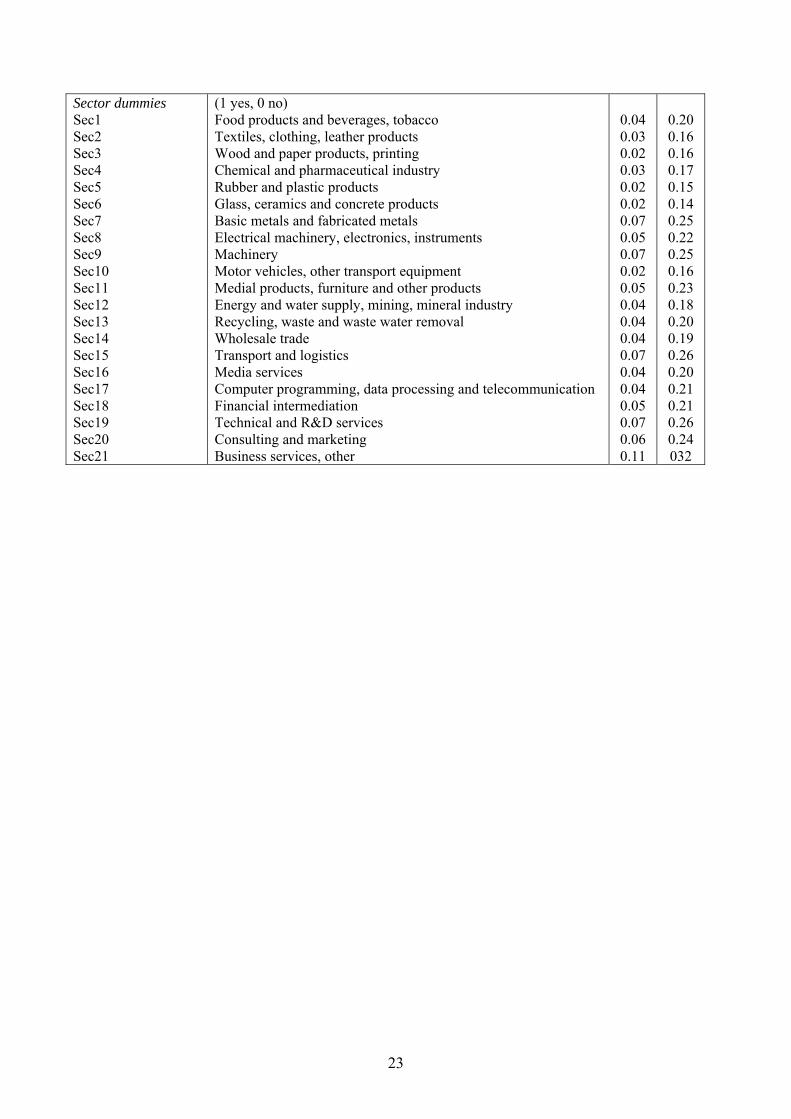
Copyrights. Furthermore, sector dummies are included. Three variables capture structural
characteristics of the firm. Size is measured by the number of employees. The variable
Agefirm gives the age of the firm in years. Family gets the value one if the firm is dominated
by one family (at least more than a 50% share).
3.2 Estimation results
Firms substituting fossils by renewables compared to all firms
The results of both the probit model with clustered standard errors and the two-level mixed
effects models (see Table 5) show significant effects of regional variables. A green orientation
of a region (Sharegreen) seems supporting the willingness of firms to implement renewable
energy technologies supporting our hypothesis H3 and the recent analysis of Schleich et al.
(2017). The share of green party voters may be interpreted as "…social acceptance of renew-
13
able energy technologies" (Schleich et al. 2017:688). Furthermore, a high share of solar and
biomass (Solbiocapita) in the region is connected with a higher substitution of fossil energy
within firms pointing to considerable regional spillover effects (Conti et al. 2017) and sup-
porting H1. The firms seem to use existing regional experiences by learning from other firms
(see Section 2) and capacities in renewables for their own substitution process of fossil fuels.
This result does not hold for water and wind power plants as these power plants are highly
dependent on geographical conditions. Agglomeration in the sense of urbanization effects do
not seem to be a pre-condition for renewable energy innovations within firms, the indicator
population density (Popdens) is even significantly negative whereas localization effects
measured by a high presence of similar firms in the region are significantly relevant for re-
newables (Secshare) supporting H2. We also estimated models where we controlled for the
Energy intensity of the firm but, interestingly, the respective variable always remained insig-
nificant. This may be due to the fact that energy intensive firms especially those having own
power plants would have to realise high investment costs to change their energy mix. As the
variable Energy intensity causes a drastic reduction of observations, we renounced including
this insignificant variable.
The substitution process from fossils to renewables is highly driven by organisational innova-
tions within a firm. The introduction of new methods organising business processes (Or-
gproc), new forms of labour organisation (Orgwork), new cooperation arrangements, the
change of customer relationships and a better integration of suppliers (Orgcoop) help to real-
ise renewable energy innovations. Concerning cooperation partners, energy innovative firms
mostly rely on firms from the same group of companies (Coopown) as cooperation partners.
Bigger and family owned firms are more likely to introduce renewable energies (size, Fami-
ly). The positive size-effect may be explained by the higher available resources to bear the
costs of the introduction of renewable energy innovations. Family dominated firms might
have a higher preference to improve their reputation and social responsibility. The realization
of renewable energy innovations is furthermore supported by subsidies, especially from min-
istries such as the environmental ministry (Subsidies).
14
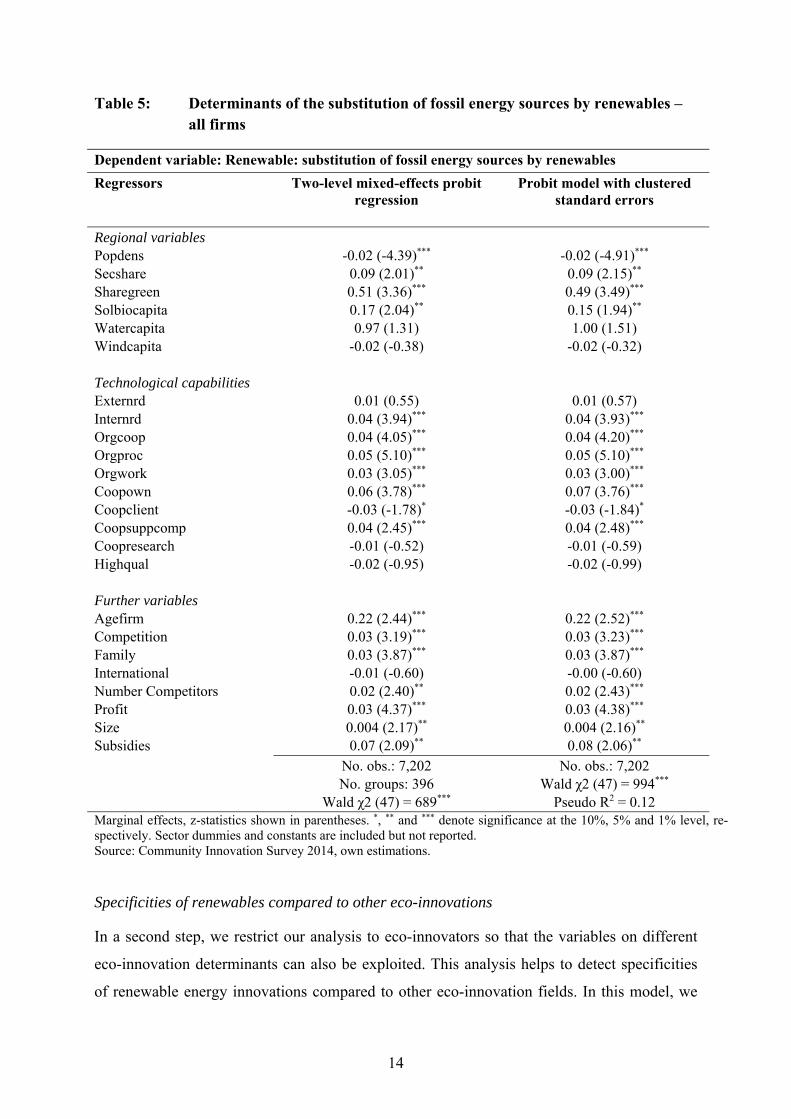
Table 5: Determinants of the substitution of fossil energy sources by renewables – all firms
Dependent variable: Renewable: substitution of fossil energy sources by renewables
Regressors Two-level mixed-effects probit regression
Probit model with clustered standard errors
Regional variables Popdens Secshare Sharegreen Solbiocapita Watercapita Windcapita Technological capabilities Externrd Internrd Orgcoop Orgproc Orgwork Coopown Coopclient Coopsuppcomp Coopresearch Highqual Further variables Agefirm Competition Family International Number Competitors Profit Size Subsidies
-0.02 (-4.39)*** 0.09 (2.01)** 0.51 (3.36)*** 0.17 (2.04)** 0.97 (1.31)
-0.02 (-0.38)
0.01 (0.55) 0.04 (3.94)*** 0.04 (4.05)*** 0.05 (5.10)*** 0.03 (3.05)*** 0.06 (3.78)*** -0.03 (-1.78)* 0.04 (2.45)*** -0.01 (-0.52) -0.02 (-0.95)
0.22 (2.44)*** 0.03 (3.19)*** 0.03 (3.87)*** -0.01 (-0.60) 0.02 (2.40)** 0.03 (4.37)*** 0.004 (2.17)** 0.07 (2.09)**
-0.02 (-4.91)*** 0.09 (2.15)** 0.49 (3.49)*** 0.15 (1.94)** 1.00 (1.51)
-0.02 (-0.32)
0.01 (0.57) 0.04 (3.93)*** 0.04 (4.20)*** 0.05 (5.10)*** 0.03 (3.00)*** 0.07 (3.76)*** -0.03 (-1.84)* 0.04 (2.48)*** -0.01 (-0.59) -0.02 (-0.99)
0.22 (2.52)*** 0.03 (3.23)*** 0.03 (3.87)*** -0.00 (-0.60) 0.02 (2.43)*** 0.03 (4.38)*** 0.004 (2.16)** 0.08 (2.06)**
No. obs.: 7,202 No. groups: 396
Wald χ2 (47) = 689***
No. obs.: 7,202 Wald χ2 (47) = 994***
Pseudo R2 = 0.12 Marginal effects, z-statistics shown in parentheses. *, ** and *** denote significance at the 10%, 5% and 1% level, re-spectively. Sector dummies and constants are included but not reported. Source: Community Innovation Survey 2014, own estimations.
Specificities of renewables compared to other eco-innovations
In a second step, we restrict our analysis to eco-innovators so that the variables on different
eco-innovation determinants can also be exploited. This analysis helps to detect specificities
of renewable energy innovations compared to other eco-innovation fields. In this model, we
15
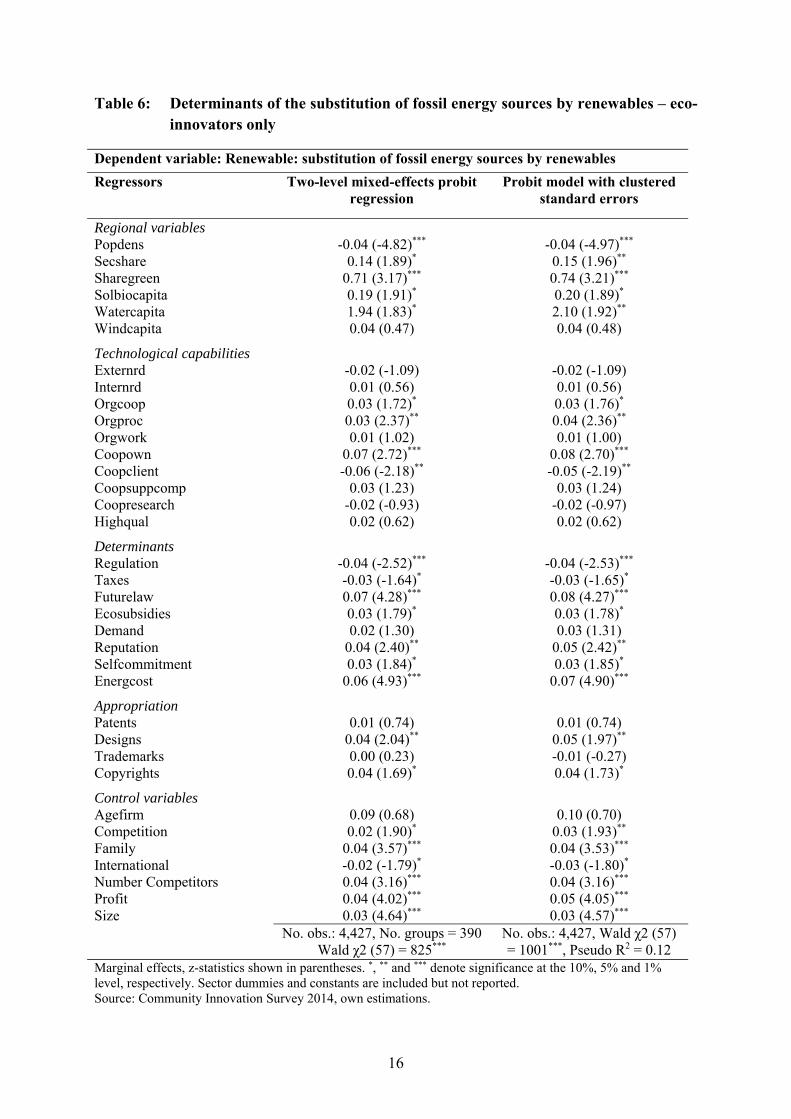
also controlled for the appropriation strategies of firms because they might influence the re-
sults of the variables describing the determinants. The results show (Table 6) that present reg-
ulations and taxes (Regulation, Taxes) are less important for renewables compared to other
eco-innovations whereas the firms perceive a positive influence of expected future regulations
(Futurelaw) on their renewable energy innovations. The improvement of the Reputation of
the firm is significantly more important for renewable energy innovations compared to other
eco-innovations confirming our argumentation in Section 2. Rising energy costs (Energcost)
seem to be a main motive to introduce renewables supporting H4. Firms in regions with an
already high amount of solar energy and water-based plants (Solbiocapita, Watercapita) are
more likely to substitute fossil energy by renewables also supporting H1. The green orienta-
tion (Sharegreen) of a region is more important for renewable energy innovations compared
to other eco-innovation fields (H3). The result that Family owned firms are more likely to
realise renewable energy innovations is also confirmed when only eco-innovators are consid-
ered. A higher competition measured by the Number of Competitors also triggers renewable
energy innovations. Bigger (Size) firms are also more likely to introduce renewables. These
firms seem to have fewer constraints to finance the switch from fossil energy to renewables.
Furthermore, this switch is only successful when the firms are capable and active in the intro-
duction of new methods of business processes. The significant influence of the variable Or-
gproc indicates that a re-organisation of the whole production process is especially important
for renewables compared to other eco-innovations. This argumentation is confirmed by the
positively significant variable Coopown denoting the relevance of cooperation partners from
the own firm group.
16
Table 6: Determinants of the substitution of fossil energy sources by renewables – eco-innovators only
Dependent variable: Renewable: substitution of fossil energy sources by renewables
Regressors Two-level mixed-effects probit regression
Probit model with clustered standard errors
Regional variables Popdens Secshare Sharegreen Solbiocapita Watercapita Windcapita
Technological capabilities Externrd Internrd Orgcoop Orgproc Orgwork Coopown Coopclient Coopsuppcomp Coopresearch Highqual
Determinants Regulation Taxes Futurelaw Ecosubsidies Demand Reputation Selfcommitment Energcost
Appropriation Patents Designs Trademarks Copyrights
Control variables Agefirm Competition Family International Number Competitors Profit Size
-0.04 (-4.82)***
0.14 (1.89)* 0.71 (3.17)*** 0.19 (1.91)* 1.94 (1.83)* 0.04 (0.47)
-0.02 (-1.09) 0.01 (0.56) 0.03 (1.72)* 0.03 (2.37)** 0.01 (1.02)
0.07 (2.72)*** -0.06 (-2.18)**
0.03 (1.23) -0.02 (-0.93) 0.02 (0.62)
-0.04 (-2.52)*** -0.03 (-1.64)* 0.07 (4.28)*** 0.03 (1.79)* 0.02 (1.30)
0.04 (2.40)** 0.03 (1.84)*
0.06 (4.93)***
0.01 (0.74)
0.04 (2.04)** 0.00 (0.23) 0.04 (1.69)*
0.09 (0.68) 0.02 (1.90)*
0.04 (3.57)***
-0.02 (-1.79)* 0.04 (3.16)*** 0.04 (4.02)*** 0.03 (4.64)***
-0.04 (-4.97)*** 0.15 (1.96)** 0.74 (3.21)*** 0.20 (1.89)* 2.10 (1.92)** 0.04 (0.48)
-0.02 (-1.09) 0.01 (0.56) 0.03 (1.76)* 0.04 (2.36)** 0.01 (1.00)
0.08 (2.70)*** -0.05 (-2.19)**
0.03 (1.24) -0.02 (-0.97) 0.02 (0.62)
-0.04 (-2.53)*** -0.03 (-1.65)* 0.08 (4.27)*** 0.03 (1.78)* 0.03 (1.31)
0.05 (2.42)** 0.03 (1.85)*
0.07 (4.90)***
0.01 (0.74)
0.05 (1.97)** -0.01 (-0.27) 0.04 (1.73)*
0.10 (0.70)
0.03 (1.93)** 0.04 (3.53)*** -0.03 (-1.80)* 0.04 (3.16)*** 0.05 (4.05)*** 0.03 (4.57)***
No. obs.: 4,427, No. groups = 390 Wald χ2 (57) = 825***
No. obs.: 4,427, Wald χ2 (57) = 1001***, Pseudo R2 = 0.12
Marginal effects, z-statistics shown in parentheses. *, ** and *** denote significance at the 10%, 5% and 1% level, respectively. Sector dummies and constants are included but not reported. Source: Community Innovation Survey 2014, own estimations.
17
4. Conclusions and Policy Implications
The transition from fossil to renewable energy in Germany aims at substituting the majority of
fossil energy sources by renewables for the production of electricity. Up to now, hard coal
and lignite still show a high share of about 40%. To reach the ambitious goal of 80% of re-
newables in 2050, innovation activities leading to an increase of the use of renewables are
crucial. Following the respective literature, regulation activities and an adequate policy mix of
technology push and demand pull measures are mainly responsible and necessary for the dif-
fusion of renewable energy. Despite the fact that most of the relevant political measures in
Germany such as the renewable energy law are nation-wide, the distribution of the renewable
energy innovation activities is considerably different between regions. The present paper tries
to assess the reasons for these regional disparities in the diffusion of renewable energy inno-
vations. Our econometric analysis is based on a unique combination of three databases: The
main source is firm level data from the Community Innovation Survey (CIS) 2014 for Ger-
many. This database has been merged with regional data on the NUTS 3 level and data on
nearly 1.5 million renewable energy plants (solar, biomass, gas, water and wind).
The results of our econometric analyses show that regional variables are highly relevant for
the renewable energy innovation dynamics. A green orientation of a region measured by the
share of green voters seems supporting the willingness of firms to implement renewable ener-
gy technologies. Furthermore, a high share of solar and biomass in the region is connected
with a higher substitution of fossil energy within firms pointing to considerable regional spill-
over effects. The firms seem to use existing regional experiences ("tacit knowledge") and ca-
pacities in renewables for their own substitution process of fossil fuels. The substitution pro-
cess from fossils to renewables is highly driven by organisational innovations within a firm.
The introduction of new methods organising business processes, new forms of labour organi-
sation, new cooperation arrangements, the change of customer relationships and a better inte-
gration of suppliers help to realise renewable energy innovations.
Restricting our analysis to eco-innovators only helps to detect specificities of renewable ener-
gy innovations compared to other eco-innovation fields. The results show that present regula-
tions and taxes are less important for renewables compared to other eco-innovations whereas
the firms perceive a positive influence of expected future regulations on their renewable ener-
gy innovations. The improvement of the reputation of the firm is more important for renewa-
ble energy innovations compared to other eco-innovations. Rising energy costs seem to be a

18
main motive to introduce renewables. Firms in regions with an already high amount of solar
and biomass energy plants are more likely to substitute fossil energy by renewables.
All in all, the analysis shows that a green orientation and the existing capacities of renewables
in a region matter and encourage more renewable energy innovations thus leading to path
dependencies. Therefore, not only "hard" regulation measures such as the renewable energy
law are relevant for the realization of renewable energy innovations but also soft instruments
that strengthen the green orientation of a region supporting substitution processes from fossil
to renewable energy. Measures that encourage the social and environmental responsibility of
firm leaders and the environmental consciousness of the population of a region seem to be
important for the diffusion of renewable energy innovations.

19
References
Antonioli, D., Borghesi, S., Mazzanti, M. (2016): Are regional systems greening the econo-
my? Local spillovers, green innovations and firms’ economic performances. Economics
of Innovation and New Technologies 25 (7): 692-713.
Arvanitis, S., Peneder, M., Rammer, C., Stucki, T., Wörter, M. (2017): Development and Uti-
lization of Energy-related Technologies, Economic Performance and the Role of Policy
Instruments, Journal of Cleaner Production 159: 47-61.
Asheim, B., Gertler, M. S. (2005): The Geography of Innovation: Regional Innovation Sys-
tems. In: Fagerberg, J., Mowery, D. C., Nelson, R. R. (eds.) (2005): The Oxford Hand-
book of Innovation, Oxford University Press, New York: 291-317.
Audretsch, D. (1998): Agglomeration and the Location of Innovative Activity. Oxford Re-
view of Economic Policy, 14 (2): 18-29.
Barbieri, N., Ghisetti, C., Gilli, M., Nicolli, F. (2016): A Survey of the Literature on Envi-
ronmental Innovation based on Main Path Analysis. Journal of Economic Surveys 30:
596-623. doi:10.1111/joes.12149.
BMWi (Federal Ministry for Economic Affairs and Energy) (2017a): For a future of green
energy, Berlin, https://www.bmwi.de/Redaktion/EN/Dossier/renewable-energy.html
BMWi (Federal Ministry for Economic Affairs and Energy) (2017b): Renewable Energy
Sources Act (EEG 2017), Berlin,
https://www.clearingstelle-eeg.de/files/node/8/EEG_2017_Englische_Version.pdf
Cameron, A. C., Trivedi, P. K. (2009): Microeconometrics using Stata. Stata Press, Lakeway
Drive.
Cantner, U., Graf, H., Herrmann, J., Kalthaus, M. (2016): Inventor networks in renewable
energies: The influence of the policy mix in Germany. Research Policy 45 (6), 1165-
1184. 10.1016/j.respol.2016.03.005.
Conti, C., Mancusi, M. L., Sanna-Randaccio, F., Sestini, R., Verdolini, E. (2016): Transition
Towards a Green Economy in Europe: Innovation and Knowledge Integration in the
Renewable Energy Sector, Fondazione Eni Enrico Mattei, Nota Di Lavoro 71.2016, Mi-
lano http://www.feem.it/userfiles/attach/2017515113174NDL2016-071.pdf
20
Costantini, V., Crespi, F., Palma, A. (2017): Characterizing the policy mix and its impact on
eco-innovation: A patent analysis of energy-efficient technologies. Research Policy 46
(4), 799-819. 10.1016/j.respol.2017.02.004.
Demirel, P., Kesidou, E. (2012): Stimulating different types of eco-innovation in the UK:
Government policies and firm motivations. Ecological Economics 70 (8): 1546-1557.
Eckey, H.-F. (2008): Regionalökonomie. Gabler Verlag, Wiesbaden.
Eickelpasch A., Lejpras A., Stephan A. (2011): Locational and internal sources of firm com-
petitive advantage: applying Porter’s diamond model at the firm level. Journal of Stra-
tegic Management and Education 7(2): 129-154.
Eurostat (2015): Questionnaire of the Community Innovation Survey 2014, Luxembourg.
Foster, E., Contestabile, M., Blazquez, J., Manzano, B., Workman, M., Shah, N. (2017): The
unstudied barriers to widespread renewable energy deployment: Fossil fuel price re-
sponses. Energy Policy 103: 258-264.
Frondel, M., Ritter, N., Schmidt, C. M., Vance, C. (2010): Economic impacts from the pro-
motion of renewable energy technologies: the German experience. Energy Policy 38:
4048-4056.
Gawel, E., Lehmann, P., Korte, K., Strunz, S., Bovet, J., Köck, W., Massier, P., Löschel, A.,
Schober, D., Ohlhorst, D., Tews, K., Schreurs, M., Reeg, M., Wassermann, S. (2014):
The future of the energy transition in Germany. Energy, Sustainability and Society 4
(15): 1-9.
Groba, F., Breitschopf, B. (2013): Impact of Renewable Energy Policy and Use on Innova-
tion. A Literature Review, DIW Discussion Paper 1318, Berlin.
Grupp, H. (1999): Umweltfreundliche Innovation durch Preissignale oder Regulation? – Eine
empirische Untersuchung für Deutschland. Jahrbücher für Nationalökonomie und
Statistik 219 (5, 6): 611-631.
Horbach, J., Rammer, C., Rennings, K. (2012): Determinants of Eco-innovations by Type of
Environmental Impact - The Role of Regulatory Push/Pull, Technology Push and Mar-
ket Pull. Ecological Economics 78: 112-122.
Horbach, J. (2014): Do eco-innovations need specific regional characteristics? An economet-
ric analysis for Germany. Review of Regional Research 34 (1): 23-38.
Horbach, J. (2015): The role of environmental policy for eco-innovation: Theoretical back-
ground and empirical results for different countries. In: Crespi, F., Quatraro, F. (eds.):
21
The Economics of Knowledge, Innovation and Systemic Technology Policy, Routledge,
London, New York: 348-360.
Johnstone, N., Haščič, I., Popp, D. (2010): Renewable Energy Policies and Technological
Innovation: Evidence Based on Patent Counts. Environmental and Resource Economics
45: 133-155.
Krugman, P. (1991): Geography and Trade. MIT Press, Cambridge.
Nesta, L., Vona, F., Nicolli, F. (2014): Environmental policies, competition and innovation in
renewable energy. Journal of Environmental Economics and Management 67 (3): 396–
411.
Noailly, J, Smeets, R. (2016): Financing energy innovation: The role of financing constraints
for directed technical change from fossil-fuel to renewable innovation, EIB Working
Papers 2016/06, Luxembourg,
http://www.eib.org/attachments/efs/economics_working_paper_2016_06_en.pdf
Pohl, B., Mulder, P. (2013): Explaining the Diffusion of Renewable Energy Technology in
Developing Countries. GIGA (German Institute of Global and Area Studies) Working
Papers 217, Hamburg,
http://edoc.vifapol.de/opus/volltexte/2013/4499/pdf/wp217_pohl_mulder.pdf
Porter, M. E. (2000): Locations, clusters and company strategy. In: Clark, G. L., Feldman, M.
P., Gertler, M. S. (eds.) (2000): The Oxford Handbook of Economic Geography. Oxford
University Press, Oxford.
Rammer, C., Gottschalk, S., Peneder, M., Wörter, M., Stucki, T., Arvanitis, S. (2017): Does
energy policy hurt international competitiveness of firms? A comparative study for
Germany, Switzerland and Austria. Energy Policy 109:154-180.
Schleich, J., Walz, R., Ragwitz, M. (2017): Effects of policies on patenting in wind-power
technologies. Energy Policy 108: 684-695.
StataCorp (2015): The STATA manual 2015. Stata Press, Lakeway Drive.
Statistisches Bundesamt (2017): Regionaldatenbank Deutschland. Wiesbaden.
www.regionalstatistik.de
Vona, F., Nicolli, F., Nesta, L. (2012): Determinants of Renewable Energy Innovation: Envi-
ronmental Policies vs. Market Regulation. OFCE Documents de Travail 2012-05, Paris.
22
Appendix 1: Definition of variables and descriptive statistics
Name of variable Description Mean SD Renewable
1 Innovations leading to a substitution of fossil energy sources by renewables, 0 Firms without such innovations
0.11 0.31
Regional variables (NUTS 3) Popdens Secshare Sharegreen Solbiocapita Watercapita Windcapita Technological capa-bilities Externrd Internrd Orgcoop Orgproc Orgwork Coopown Coopclient Coopsuppcomp Coopresearch Highqual Determinants Regulation Taxes Futurelaw Subsidies EcoSubsidies Demand Reputation Selfcommitment Energcost Appropriation Patents Designs Trademarks Copyrights Control variables Agefirm Competition Number competitors Family International Profit Size
Population 2012 per qm2/1000 Share of a firm’s sector in the NUTS 3 unit Voting share of the green party in 2013 Solar-, biomass and gas energy plants in (kwp per capita)/1000 Water energy plants in (kwp per capita)/1000 Wind energy plants in (kwp per capita)/1000 External R&D activities (1 yes, 0 no) Internal R&D activities (1 yes, 0 no) Newly organised relationships to other firms (1 yes, 0 no) New methods for organisation of business processes (1 yes, 0 no) New forms of labour organisation (1 yes, 0 no) Cooperations with firms of the own firm group (1 yes, 0 no) Cooperations with clients (1 yes, 0 no) Cooperations with suppliers and competitors (1 yes, 0 no) Cooperations with consulters, universities, public and private research (1 yes, 0 no) Share of employees with university degree 1 high or medium, 0 low or not relevant Fulfillment of present laws and standards Existing environmental taxes Anticipation of future regulations Subsidies from German ministries (1 yes, 0 no) Public support of eco-innovation Demand for eco-innovation Improvement of the reputation of the firm Self-commitments or industry standards Rising energy or material costs Patent applications (1 yes, 0 no) Use of utility models and registered designs (1 yes, 0 no) Application of trademarks (1 yes, 0 no) Enforcement of copyrights (1 yes, 0 no) Age of the firm (2014 – year of foundation + 0.5)/1000 High competition intensity by foreign firms (1 highly relevant, 0 other) Number of competitors (1 more than 15, 0 other) Family dominated (at least 50% of firm shares) (1 yes, 0 no) Exporting in international markets (1 yes, 0 no) 1 Profit margin > 5%, 0 other Number of employees 2012 (in 1000)
1.07 0.17 0.09 0.05 0.002 0.04
0.11 0.35 0.13 0.22 0.21 0.04 0.06 0.06 0.12
0.22
0.27 0.15 0.20 0.02 0.11 0.14 0.22 0.21 0.35
0.11 0.07 0.13 0.05
0.03 0.30
0.26 0.52 0.45 0.44 0.69
1.26 0.13 0.04 0.06 0.004 0.09
0.31 0.48 0.33 0.41 0.41 0.20 0.23 0.24 0.32
0.28
0.45 0.35 0.40 0.12 0.31 0.35 0.42 0.41 0.48
0.31 0.26 0.34 0.22
0.04 0.46
0.44 0.50 0.50 0.50 4.24
23
Sector dummies Sec1 Sec2 Sec3 Sec4 Sec5 Sec6 Sec7 Sec8 Sec9 Sec10 Sec11 Sec12 Sec13 Sec14 Sec15 Sec16 Sec17 Sec18 Sec19 Sec20 Sec21
(1 yes, 0 no) Food products and beverages, tobacco Textiles, clothing, leather products Wood and paper products, printing Chemical and pharmaceutical industry Rubber and plastic products Glass, ceramics and concrete products Basic metals and fabricated metals Electrical machinery, electronics, instruments Machinery Motor vehicles, other transport equipment Medial products, furniture and other products Energy and water supply, mining, mineral industry Recycling, waste and waste water removal Wholesale trade Transport and logistics Media services Computer programming, data processing and telecommunication Financial intermediation Technical and R&D services Consulting and marketing Business services, other
0.04 0.03 0.02 0.03 0.02 0.02 0.07 0.05 0.07 0.02 0.05 0.04 0.04 0.04 0.07 0.04 0.04 0.05 0.07 0.06 0.11
0.20 0.16 0.16 0.17 0.15 0.14 0.25 0.22 0.25 0.16 0.23 0.18 0.20 0.19 0.26 0.20 0.21 0.21 0.26 0.24 032