energy systems ee 5003 chapter 1: introduction:. energy energy – ability to do work, is a property...
TRANSCRIPT

Energy SystemsEE 5003
Chapter 1: Introduction:
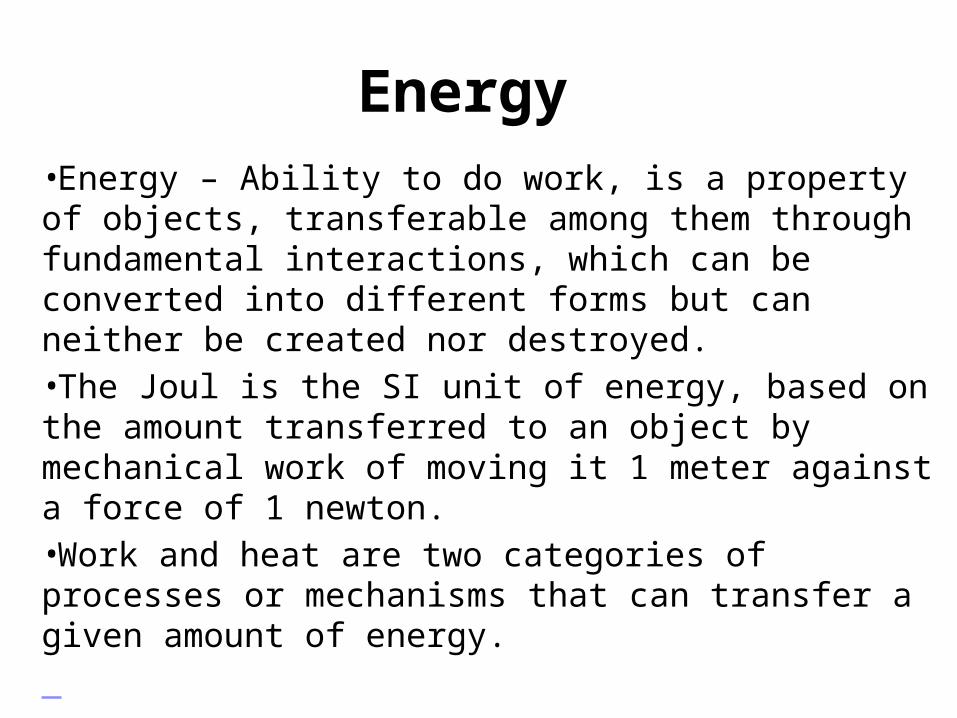
Energy•Energy – Ability to do work, is a property of objects, transferable among them through fundamental interactions, which can be converted into different forms but can neither be created nor destroyed.•The Joul is the SI unit of energy, based on the amount transferred to an object by mechanical work of moving it 1 meter against a force of 1 newton.•Work and heat are two categories of processes or mechanisms that can transfer a given amount of energy.
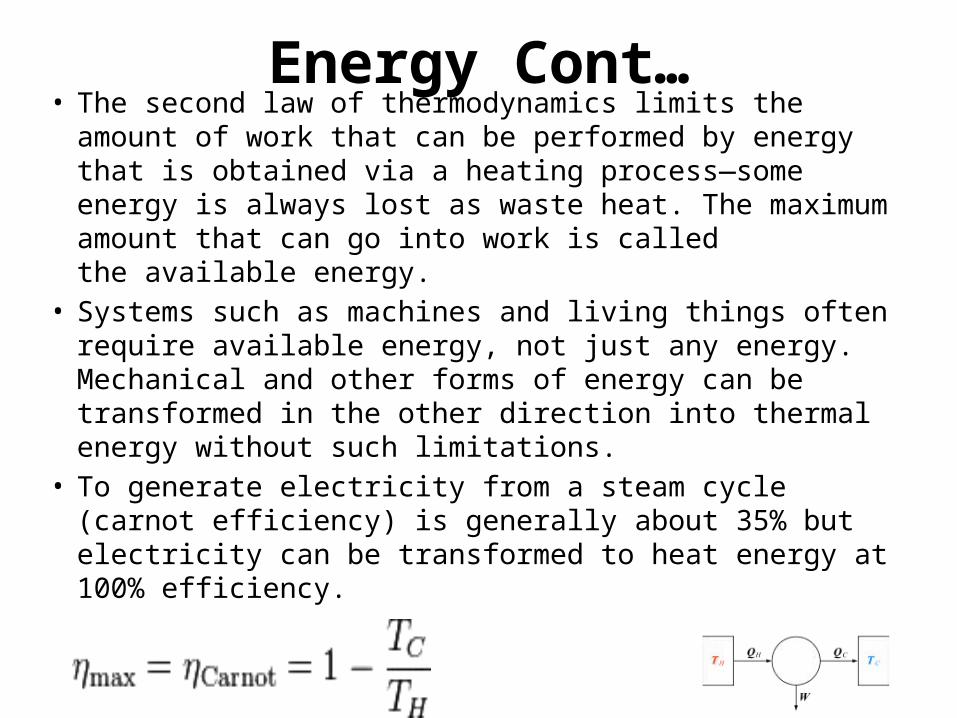
Energy Cont…• The second law of thermodynamics limits the amount of
work that can be performed by energy that is obtained via a heating process—some energy is always lost as waste heat. The maximum amount that can go into work is called the available energy.
• Systems such as machines and living things often require available energy, not just any energy. Mechanical and other forms of energy can be transformed in the other direction into thermal energy without such limitations.
• To generate electricity from a steam cycle (carnot efficiency) is generally about 35% but electricity can be transformed to heat energy at 100% efficiency.
Forms of EnergyCommon energy forms include :
- the kinetic energy of a moving object, - the radiant energy carried by light and other electromagnetic radiation,- the potential energy stored by virtue of the position of an object in a force field such as a gravitational, electric or magnetic field, - the thermal energy comprising the microscopic kinetic and potential energies of the disordered motions of the particles making up matter. Some specific forms of potential energy include elastic energy due to the stretching or deformation of solid objects and chemical energy such as is released when a fuel burns or food is digested.
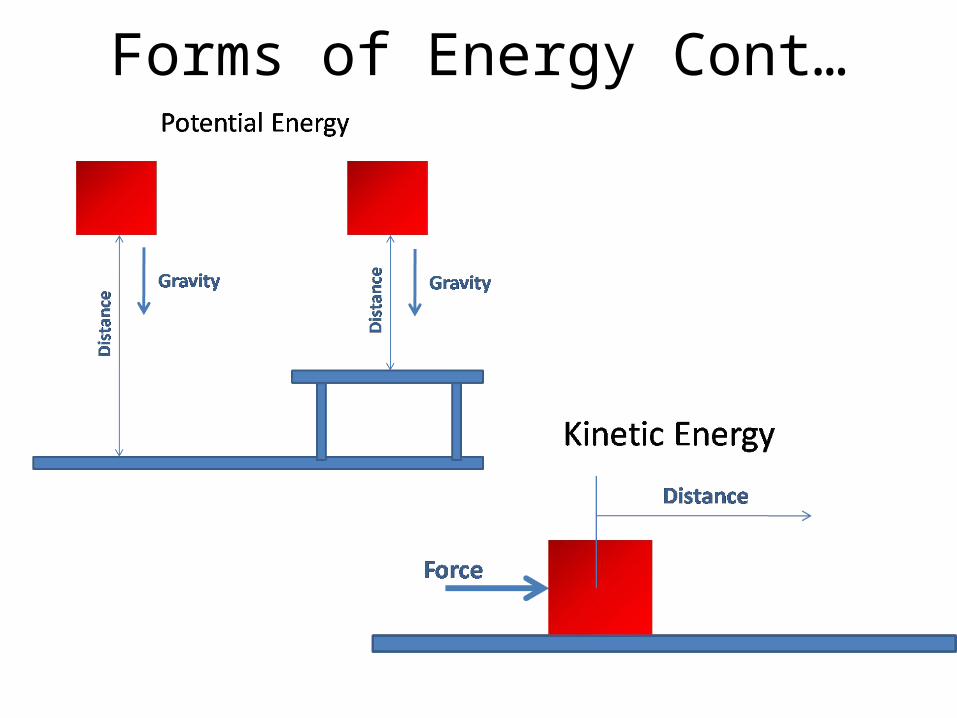
Forms of Energy Cont…
Forms of Energy
Mass – Energy Equivalence
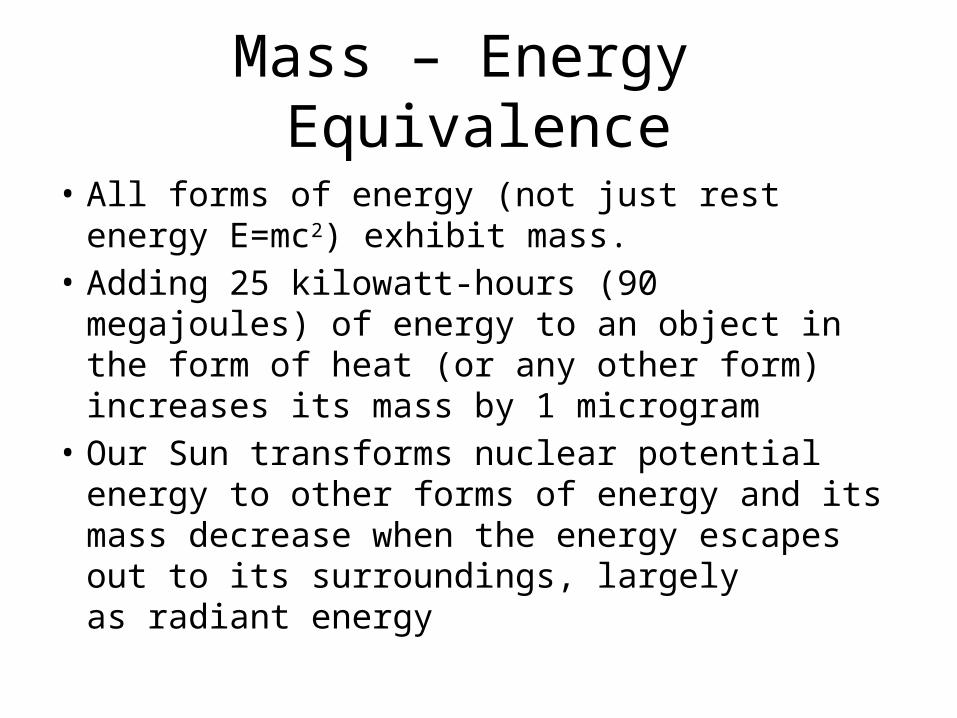
• All forms of energy (not just rest energy E=mc2) exhibit mass.
• Adding 25 kilowatt-hours (90 megajoules) of energy to an object in the form of heat (or any other form) increases its mass by 1 microgram
• Our Sun transforms nuclear potential energy to other forms of energy and its mass decrease when the energy escapes out to its surroundings, largely as radiant energy

living organisms require available energy to stay alive; humans get such energy from food along
with the oxygen needed to metabolize it
• We eat food but if we do a workout or even simply exists we dissipate energy and the mass of food we consumed is converted into energy and dissipates. Why do we put on weight because we do not dissipate as much energy as we take in. Food contains Carbohydrates, lipids and proteins.
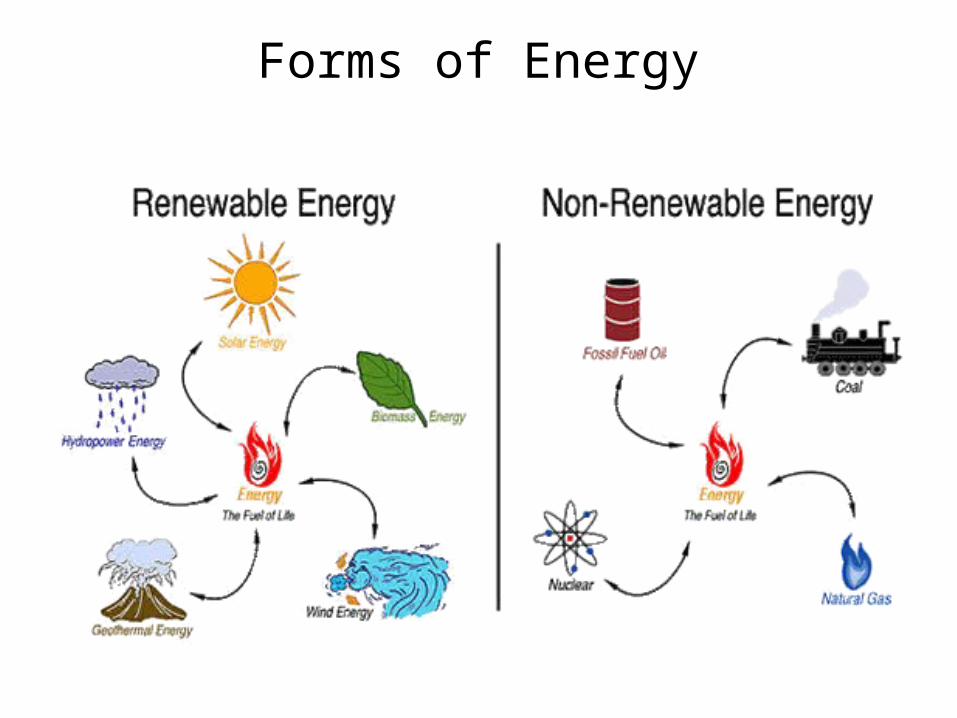
1.1 Energy SourcesEnergy Sources are basically divided into two categories: •Non Renewable energy Sources and•Renewable Energy Sources.Some of these sources are further classified as conventional or non conventional.
Non Renewable Energy Sources :
mainly defined as conventional ( they have been using these sources for over a century ) derived in conventional conversion processes to produce useful energy such as in power plants, refineries, Internal Combustion Engines, external combustion engines etc.
Examples : Coal, Fossil Fuel based (Petroleum based) oil and Gas products, Nuclear, etc.
Why do we call these sources non-Renewable? They are not replenished in a reasonable time span may be to renew these sources it may take millions of years. Nuclear is an exception, where it can never be replenished even after millions of years.

SOLID FUELS
• Hard coal – Coal that has a high degree of coalification with a gross calorific value above 23,865 KJ/kg (5,700 kcal/kg) on an ash-free but moist basis, There are two sub-categories of hard coal: (i) Coking coal is a hard coal used in the production of coke in a blast furnace charge. (ii) Bituminous coal and Anthracite (also known as steam coal) is used for steam raising and space heating purposes and includes all anthracite coals and bituminous coals not classified as coking coal.
• Lignite – One of the two sub-categories of brown coal. Brown coal is coal with a low degree of coalification which retained the anatomical structure of the vegetable matter from which it was formed. It has a gross calorific value (on a moist ash free basis) is less than 23,865 KJ/kg (5,700 kcal/kg). Brown coal comprises: (i) lignite - with a gross calorific value less than 17,435 KJ/kg (4,165 kcal/kg) and greater than 31 per cent volatile matter on a dry basis and (ii) sub-bituminous coal - with a gross calorific value between 17,435 KJ/kg (4,165 kcal/kg) and 23,865 KJ/kg (5,700 kcal/kg) containing more than 31 per cent volatile matter on a dry basis.
• Peat – A solid fuel formed from the partial decomposition of dead vegetation under conditions of high humidity and limited air access (initial stage of coalification). Its principal use is as a household fuel.
• Oil shale – A sedimentary rock containing a high proportion of organic matter (kerogen), which can be converted to crude oil or gas by heating.

LIQUID FUELS
• Crude oil – A mineral oil consisting of a mixture of hydrocarbons of natural origin, yellow to black in color, of variable density and viscosity. Can be extracted by Oil wells or extracted from bituminous minerals such as shales and bituminous sand, and oils from coal liquefaction.
• Petroleum products – Comprise the liquid fuels, lubricant oils
and solid and semi-solid products obtained by distillation and cracking of crude petroleum, shale oil, or semi-refined and unfinished petroleum products. These may include but not limited to Aviation Gasoline, Motor Gasoline, Diesel, Jet Fuel, Kerosene, Naphtha, Furnace Oil, Residual Oil, Bitumen, LPG ( Propane and Butane mainly)

GASEOUS FUELS
Natural gas – Gases consisting mainly of methane occurring naturally in underground deposits. It includes both non-associated gas (originating from fields producing only hydrocarbons in gaseous form) and associated gas (originating from fields producing both liquid and gaseous hydrocarbons), as well as methane recovered from coal mines.
Renewable Energy Sources :
most of the time these sources are defined as non- conventional sources except Major Hydro sources as they have been rediscovered as sources to be converted to useful energy by using age old principles but using modern technologies. Examples: Conventional Renewable sources - Major Hydro, Non-Conventional Renewable sources – small and mini Hydro,
Non-Conventional Renewable sources
-Solar both pV and thermal , -wind, biomass, -small and mini hydro, -geothermal ( Is it renewable? again a -misnomer but classified under renewable) etc.- Ocean related sources such as Tidal, wave, OTEC etc.,- Dendro Thermal
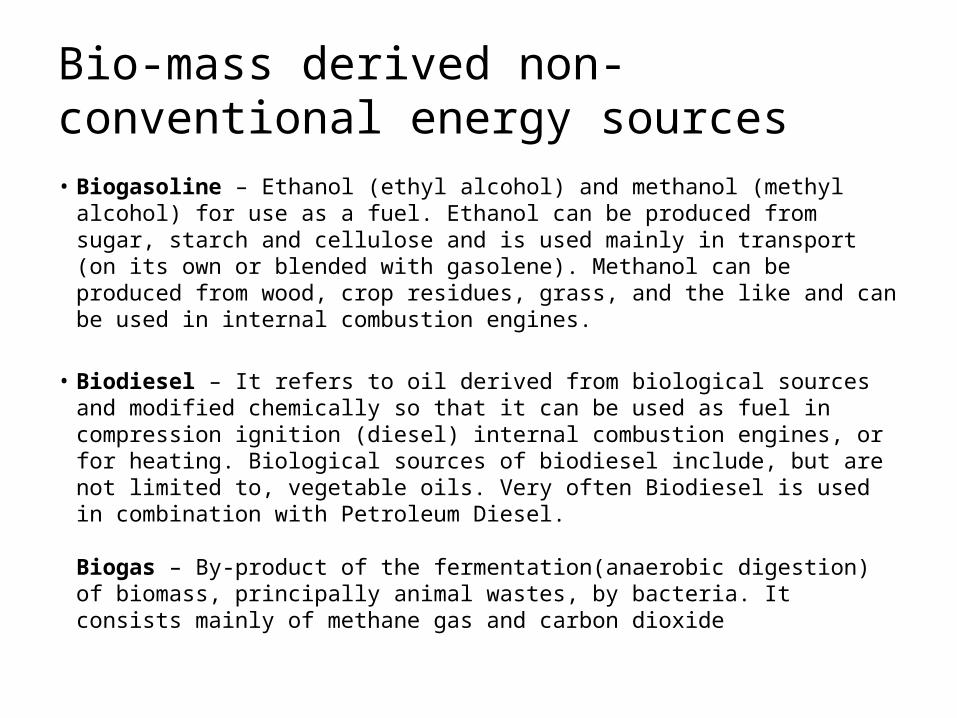
Bio-mass derived non-conventional energy sources• Biogasoline – Ethanol (ethyl alcohol) and methanol (methyl alcohol) for use
as a fuel. Ethanol can be produced from sugar, starch and cellulose and is used mainly in transport (on its own or blended with gasolene). Methanol can be produced from wood, crop residues, grass, and the like and can be used in internal combustion engines.
• Biodiesel – It refers to oil derived from biological sources and modified
chemically so that it can be used as fuel in compression ignition (diesel) internal combustion engines, or for heating. Biological sources of biodiesel include, but are not limited to, vegetable oils. Very often Biodiesel is used in combination with Petroleum Diesel.
Biogas – By-product of the fermentation(anaerobic digestion) of biomass, principally animal wastes, by bacteria. It consists mainly of methane gas and carbon dioxide

Other Traditional Fuels
Fuel wood, harvested or grownBaggasse, - waste from sugar industry Charcoal, - derived from wood or other crop residuesAnimal Waste, used in some countries such as in India common form dung cakes.Vegetable Waste, Municipal Waste, Industrial Waste, etc.
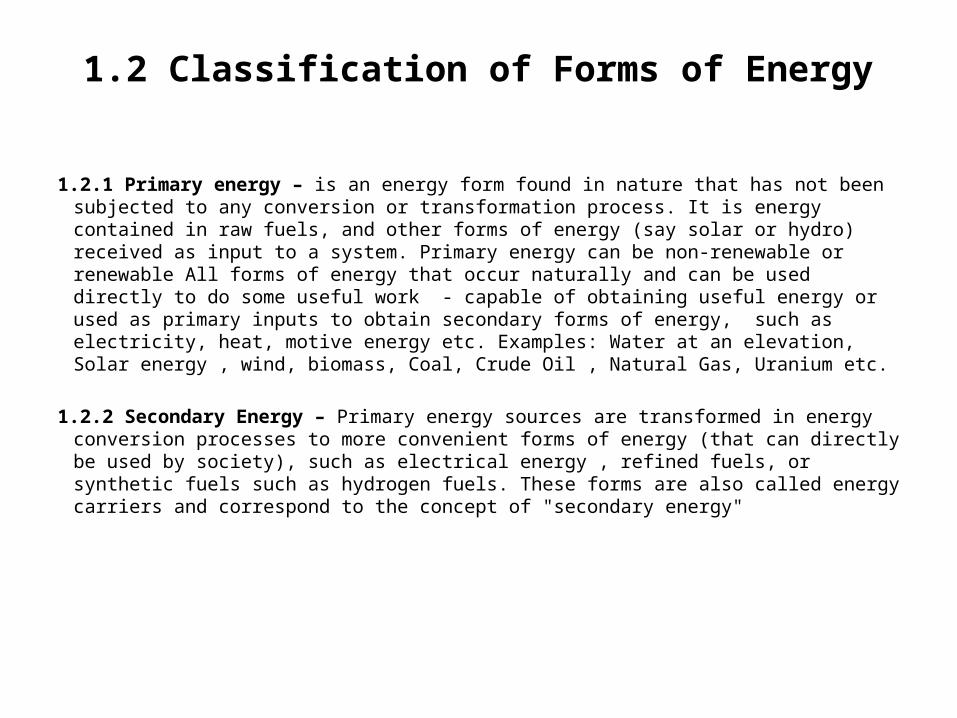
1.2 Classification of Forms of Energy
1.2.1 Primary energy – is an energy form found in nature that has not been subjected to any conversion or transformation process. It is energy contained in raw fuels, and other forms of energy (say solar or hydro) received as input to a system. Primary energy can be non-renewable or renewable All forms of energy that occur naturally and can be used directly to do some useful work - capable of obtaining useful energy or used as primary inputs to obtain secondary forms of energy, such as electricity, heat, motive energy etc. Examples: Water at an elevation, Solar energy , wind, biomass, Coal, Crude Oil , Natural Gas, Uranium etc.
1.2.2 Secondary Energy – Primary energy sources are transformed in energy conversion processes to more convenient forms of energy (that can directly be used by society), such as electrical energy , refined fuels, or synthetic fuels such as hydrogen fuels. These forms are also called energy carriers and correspond to the concept of "secondary energy"

1.2 Classification of Forms of Energy Cont…
1.2.3 Primary electricity – refers to electrical energy of geothermal, hydro, nuclear, tide, wind, wave/ocean and solar origin. Its production is assessed at the heat value of electricity (3.6 TJ/million kWh).
1.2.4 Secondary electricity –is defined as thermal electricity, which comprises conventional thermal plants of all types, whether or not equipped for the combined generation of heat and electric energy. Accordingly, they include steam-operated generating plants, with condensation and plants using internal combustion engines or gas turbines whether or not these are equipped for heat recovery.

Representation of Electricity in tradeable energy units
A unit of primary electricity may be equated theoretically with the amount of coal or oil required to produce an equivalent unit of thermal electricity.
In the case of hydro-electricity, the ideal condition (assuming 100% efficiency), is taken to be 3.6 TJ per million kWh which corresponds to 0.086 tons of oil equivalent per 1,000 kWh. (or 0.123 tons of coal equivalent )
In the case of nuclear and geothermal electricity, the average condition is assumed (33 and 10% efficiency respectively) and is taken to be 10.909 and 36 TJ per million kWh which corresponds to 0.372 and 1.228 tons of coal equivalent or 0.261 and 0.860 tons of oil equivalent per 1,000 kWh.
One TOE is defined as 10.0 x 10⁶ kcal or 0.041868 TJ (1 calorie =4.1868 joules).
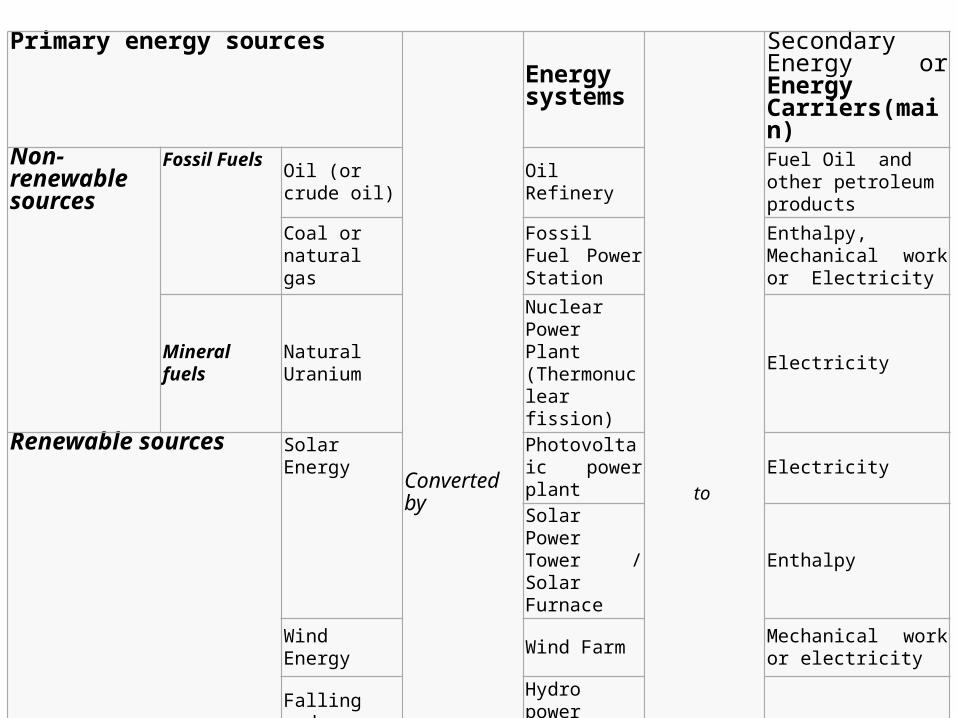
Primary energy sources
Converted by
Energy systems
to
Secondary Energy or Energy Carriers(main)
Non-renewablesources
Fossil Fuels Oil (or crude oil)
Oil RefineryFuel Oil and other petroleum products
Coal or natural gas
Fossil Fuel Power Station
Enthalpy, Mechanical work or Electricity
Mineralfuels
Natural Uranium
Nuclear Power Plant (Thermonuclear fission)
Electricity
Renewable sources Solar Energy Photovoltaic power plant
Electricity
Solar Power Tower / Solar Furnace
Enthalpy
Wind Energy Wind FarmMechanical work or electricity
Falling and flowing water, tidal
Hydro power plant, wave, Tidal Power Station
Mechanical work or electricity
Biomass sources
Biomass power station
Enthalpy or electricity
Geothermal Energy
Geothermal Power Station
Enthalpy or electricity
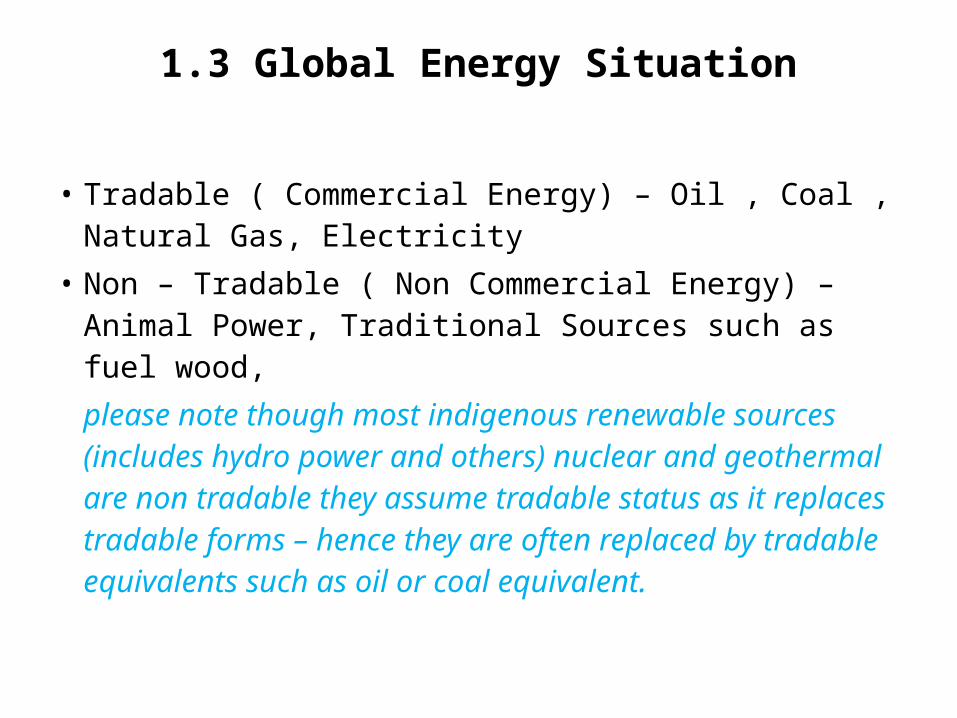
1.3 Global Energy Situation
• Tradable ( Commercial Energy) – Oil , Coal , Natural Gas, Electricity
• Non – Tradable ( Non Commercial Energy) – Animal Power, Traditional Sources such as fuel wood, please note though most indigenous renewable sources (includes hydro power and others) nuclear and geothermal are non tradable they assume tradable status as it replaces tradable forms – hence they are often replaced by tradable equivalents such as oil or coal equivalent.

Table 1.3.1 Production and consumption of commercial energy
Apart from the UN statistical Office (UNSO), The Department of Energy (DOE) of the USA and World Energy Council (WEC) collects global energy statistics and publishes periodic reports giving their own analysis of the global energy issues. These publications give insights to the world energy scenarios and also an indication of the world energy outlook in the years to come. These reports assist the world economies to forecast and plan their energy production and consumption patterns to suit the future energy outlook. The more recent global environmental impacts have had a significant bearing on the energy plans for the future.
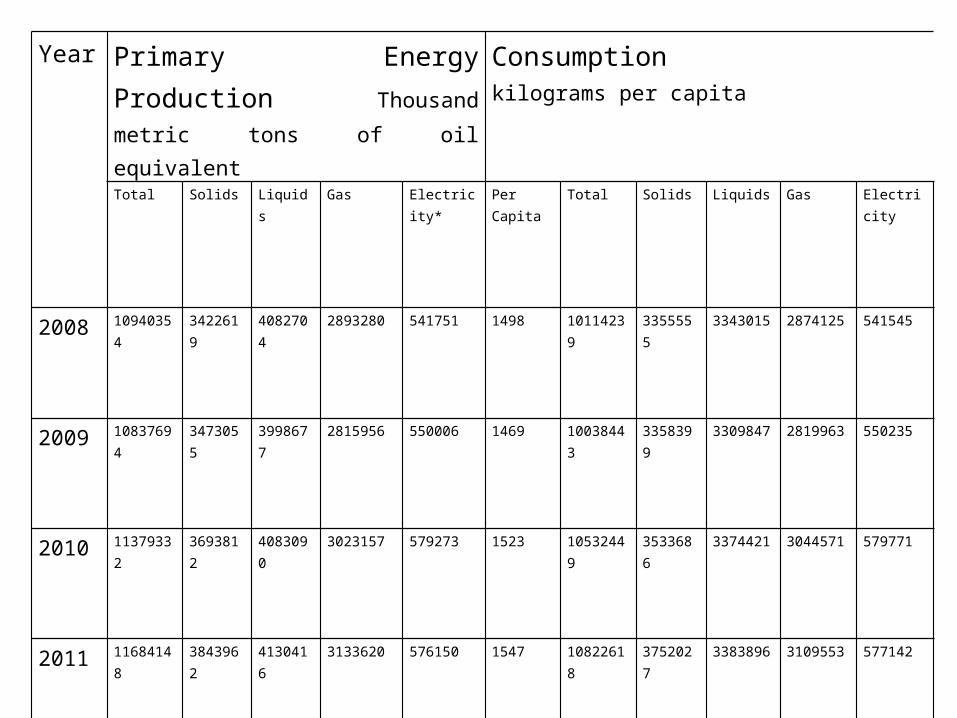
Year Primary Energy Production Thousand metric tons of oil equivalent
Consumption kilograms per capita
Total Solids Liquids Gas Electricity* Per Capita Total Solids Liquids Gas Electricity
2008 10940354 3422619 4082704 2893280 541751 1498 10114239 3355555 3343015 2874125 541545
2009 10837694 3473055 3998677 2815956 550006 1469 10038443 3358399 3309847 2819963 550235
2010 11379332
3693812 4083090 3023157 579273 1523 10532449 3533686 3374421 3044571
579771
2011 11684148
3843962 4130416 3133620 576150 1547 10822618 3752027 3383896 3109553 577142
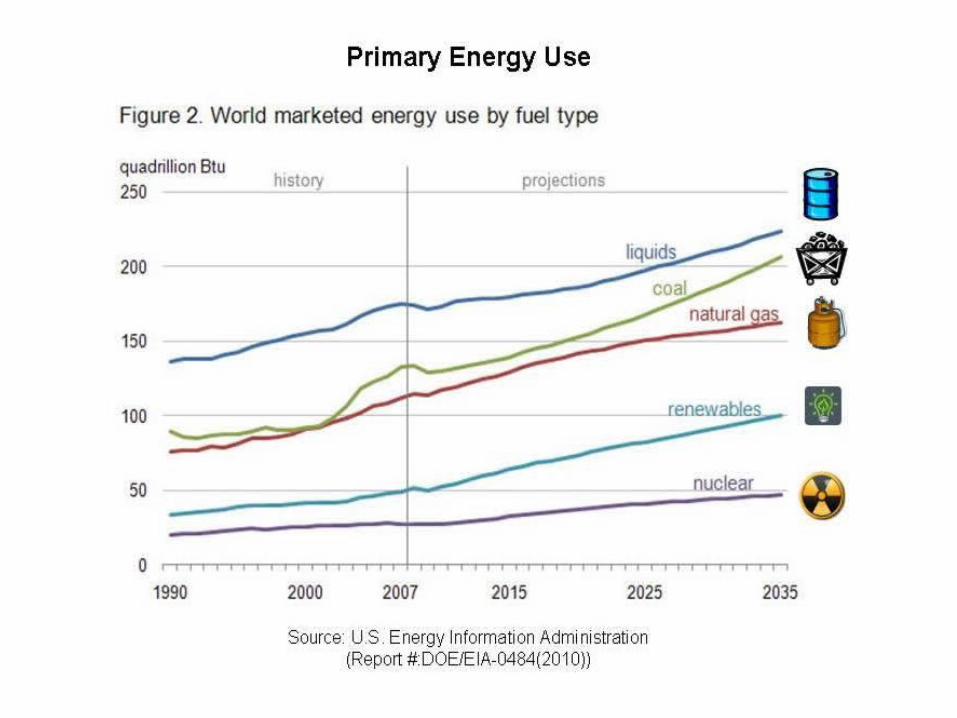

Figure 1.3.3 Total Primary Energy Supply Evolution

Table 1.3.2: Key Global Energy indicators for 1993, 2011 and 2020
Energy Source 1993 2013 2020 Percentage incresefrom 1993 to 2020
TPES* Mtoe 9 532 14 092 17 208 48%
Coal Mt 4 474 7 520 10 108 68%
Oil Mt 3 179 3 973 4 594 25%
Natural Gas bcm 2 176 3 518 4 049 62%
Nuclear TWh 2 106 2 386 3 761 13%
Hydro Power TWh 2 286 2 767 3 826 21%
Biomass Mtoe 1 036 1 277 1 323 23%
Other renewable**TWh
44 515 1 999 n/a
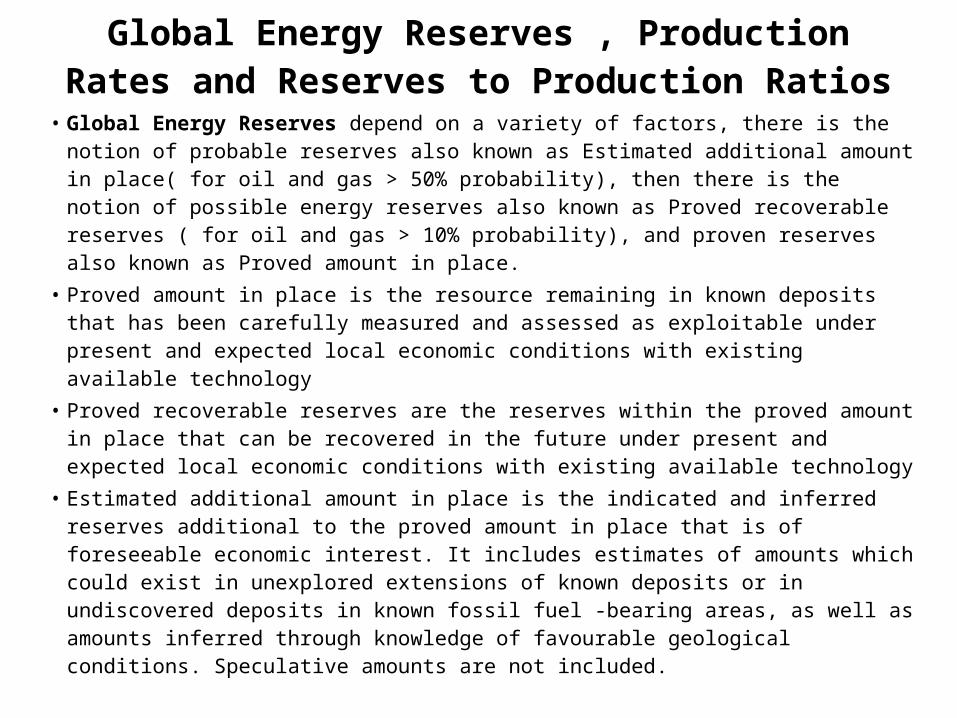
Global Energy Reserves , Production Rates and Reserves to Production Ratios
• Global Energy Reserves depend on a variety of factors, there is the notion of probable reserves also known as Estimated additional amount in place( for oil and gas > 50% probability), then there is the notion of possible energy reserves also known as Proved recoverable reserves ( for oil and gas > 10% probability), and proven reserves also known as Proved amount in place.
• Proved amount in place is the resource remaining in known deposits that has been carefully measured and assessed as exploitable under present and expected local economic conditions with existing available technology
• Proved recoverable reserves are the reserves within the proved amount in place that can be recovered in the future under present and expected local economic conditions with existing available technology
• Estimated additional amount in place is the indicated and inferred reserves additional to the proved amount in place that is of foreseeable economic interest. It includes estimates of amounts which could exist in unexplored extensions of known deposits or in undiscovered deposits in known fossil fuel -bearing areas, as well as amounts inferred through knowledge of favourable geological conditions. Speculative amounts are not included.
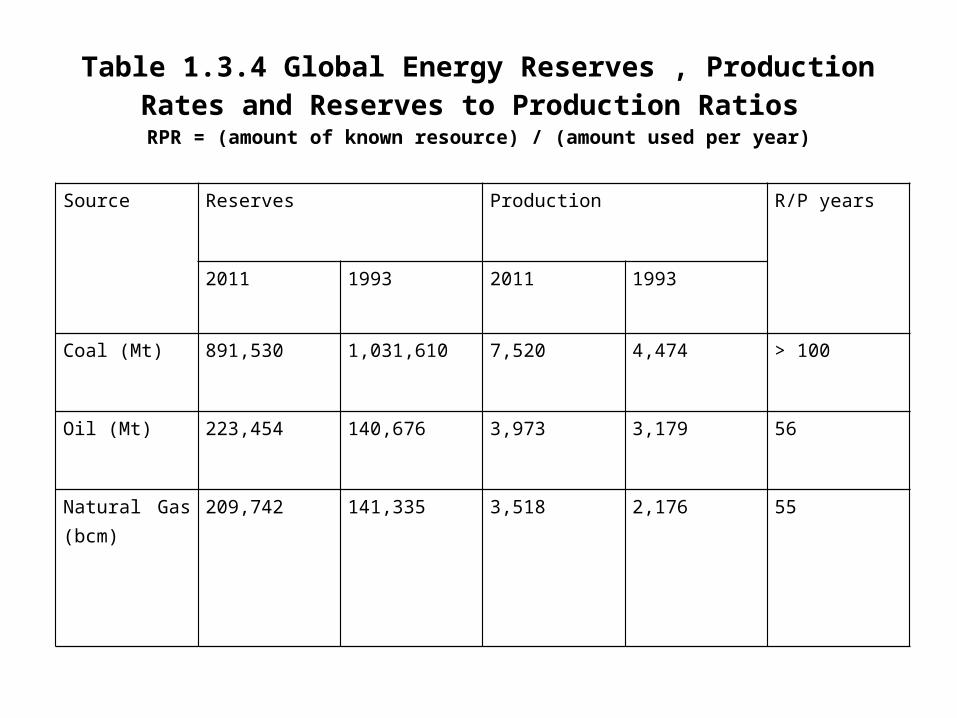
Table 1.3.4 Global Energy Reserves , Production Rates and Reserves to Production Ratios
RPR = (amount of known resource) / (amount used per year)
Source Reserves Production R/P years
2011 1993 2011 1993
Coal (Mt) 891,530 1,031,610 7,520 4,474 > 100
Oil (Mt) 223,454 140,676 3,973 3,179 56
Natural Gas (bcm)
209,742 141,335 3,518 2,176 55

Table 1.3.5 Global Installed Capacity and Annual Production of Nuclear and Renewable
Energy SourcesSource Installed Capacity (MW) Actual Generation (GWh)
2011 1993 2011 1993
Nuclear 364,078 340,295 2,385,903 2,106 000
Hydro Power 946,182 609,264 2,767,118 2,285,960
Wind 238,049 n/a 377,613 n/a
Solar PV 68,850 n/a 52 878 n/a

1.3.1 Types of Energy Resources
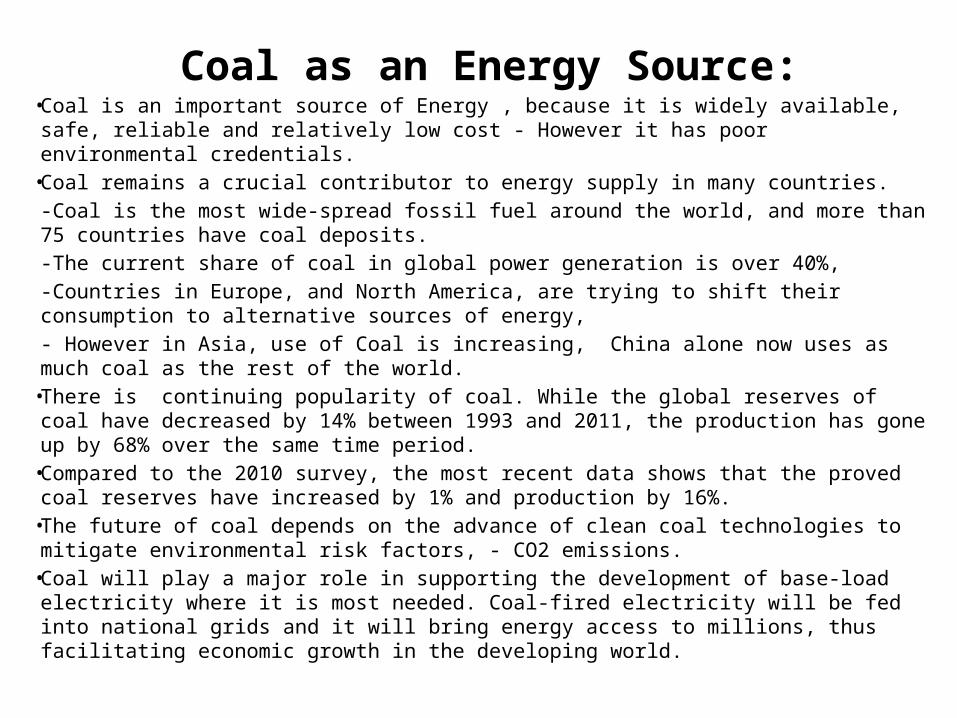
Coal as an Energy Source:• Coal is an important source of Energy , because it is widely available, safe, reliable and
relatively low cost - However it has poor environmental credentials. • Coal remains a crucial contributor to energy supply in many countries.
-Coal is the most wide-spread fossil fuel around the world, and more than 75 countries have coal deposits. -The current share of coal in global power generation is over 40%, -Countries in Europe, and North America, are trying to shift their consumption to alternative sources of energy, - However in Asia, use of Coal is increasing, China alone now uses as much coal as the rest of the world.
• There is continuing popularity of coal. While the global reserves of coal have decreased by 14% between 1993 and 2011, the production has gone up by 68% over the same time period.
• Compared to the 2010 survey, the most recent data shows that the proved coal reserves have increased by 1% and production by 16%.
• The future of coal depends on the advance of clean coal technologies to mitigate environmental risk factors, - CO2 emissions.
• Coal will play a major role in supporting the development of base-load electricity where it is most needed. Coal-fired electricity will be fed into national grids and it will bring energy access to millions, thus facilitating economic growth in the developing world.

Figure 1.3.4 World Coal Reserves


Oil as an Energy Source:
• The oil crisis in the 1970s and 1980s resulted in sky-rocketing price of oil. • Since then there have been, heated discussions about “peak oil” based on
the expectation of the world running out of oil within a few decades. • Global oil reserves are almost 60% larger today than 20 years ago, and
production of oil has gone up by 25%. If the unconventional oil resources, including oil shale, oil sands, extra heavy oil and natural bitumen are taken into account, the global oil reserves will be four times larger than the current conventional reserves.
• Oil still remains the premier energy resource with a wide range of possible applications. Its main use however, will be shifting towards transport and the petrochemical sector. In future oil’s position will face a challenge from other fuels such as natural gas.
• The oil resource assessments have increased steadily between 2000 and 2009,.Compared to the 2010 survey, the proved oil reserves increased by 37% and production by 1%. Oil is a mature global industry but a number of countries, for political reasons, have limited access to international companies.
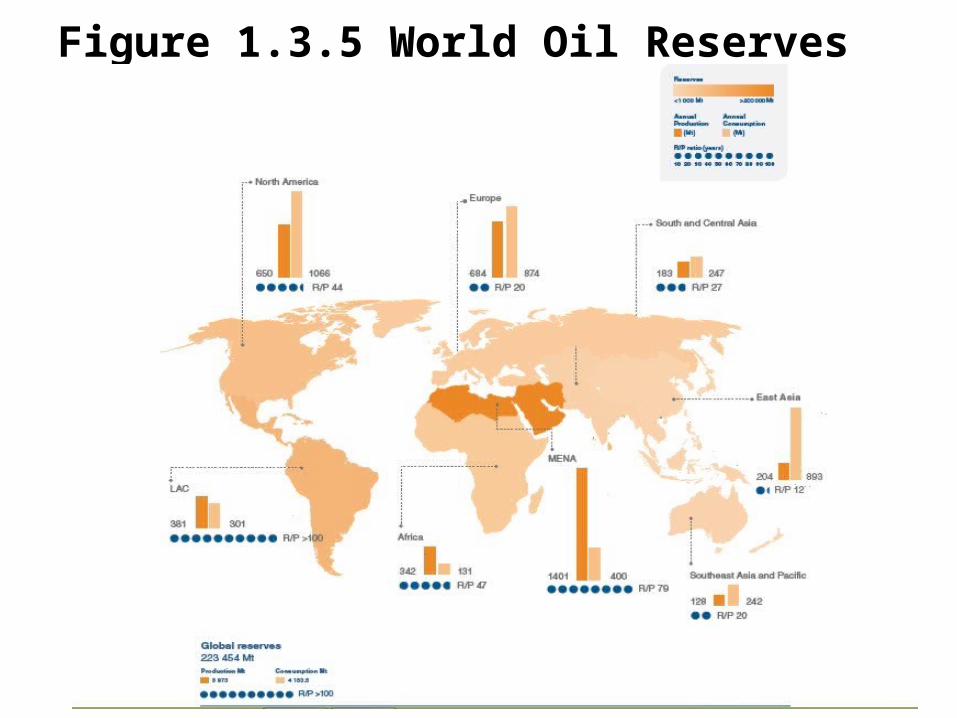
Figure 1.3.5 World Oil Reserves


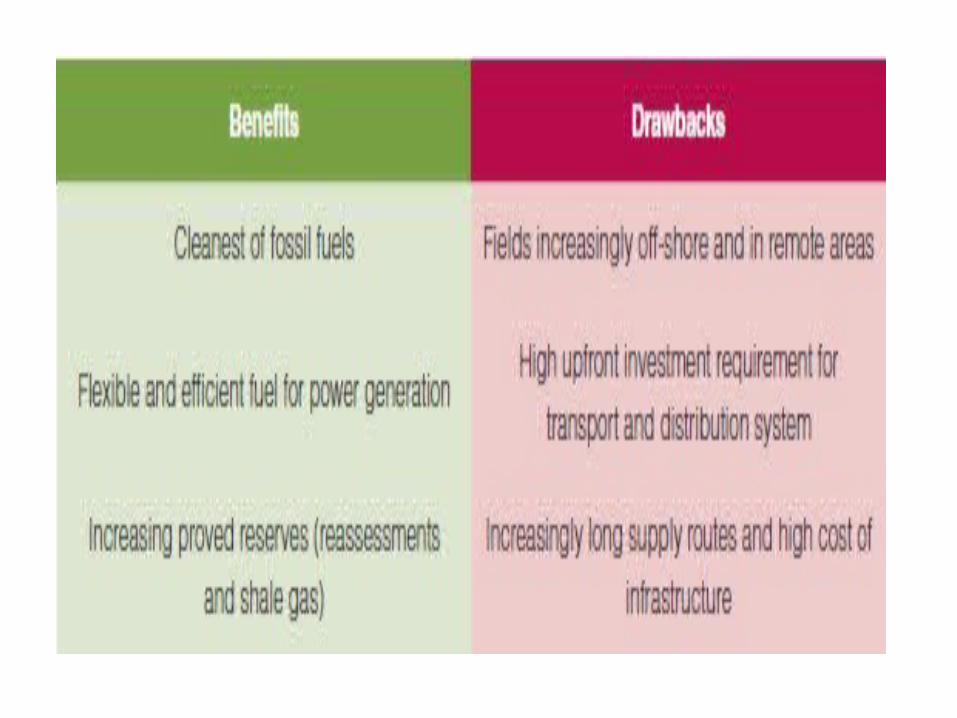
Natural Gas as an Energy Source:
• Natural gas will continue making significant contribution to the world energy economy. The cleanest of all fossil-based fuels, natural gas is plentiful and flexible.
• It is increasingly used in the most efficient power generation technologies, such as, Combined Cycle Gas Turbine (CCGT) with conversion efficiencies of about 60%.
• The reserves of conventional natural gas have grown by 36% over the past two decades and its production by 61%. Compared to the 2010 survey, the proved natural gas reserves have grown by 3% and production by 15%.
• The exploration, development and transport of gas usually requires significant upfront investment. Close coordination between investment in the gas and power infrastructure is necessary.
• In its search for secure, sustainable and affordable supplies of energy, the world is turning its attention to unconventional energy resources. Shale gas is one of them. It has turned upside down the North American gas markets, and is making significant strides in other regions. The emergence of shale gas as a potentially major energy source can have serious strategic implications for geopolitics and the energy industry.

Figure 1.3.6 Natural Gas Reserves
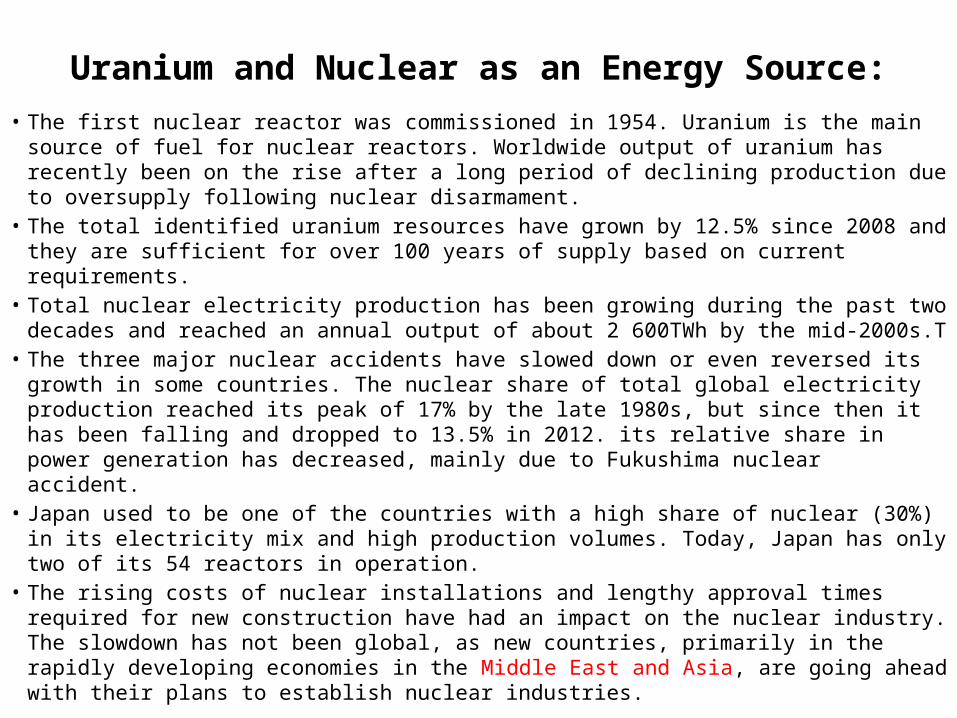
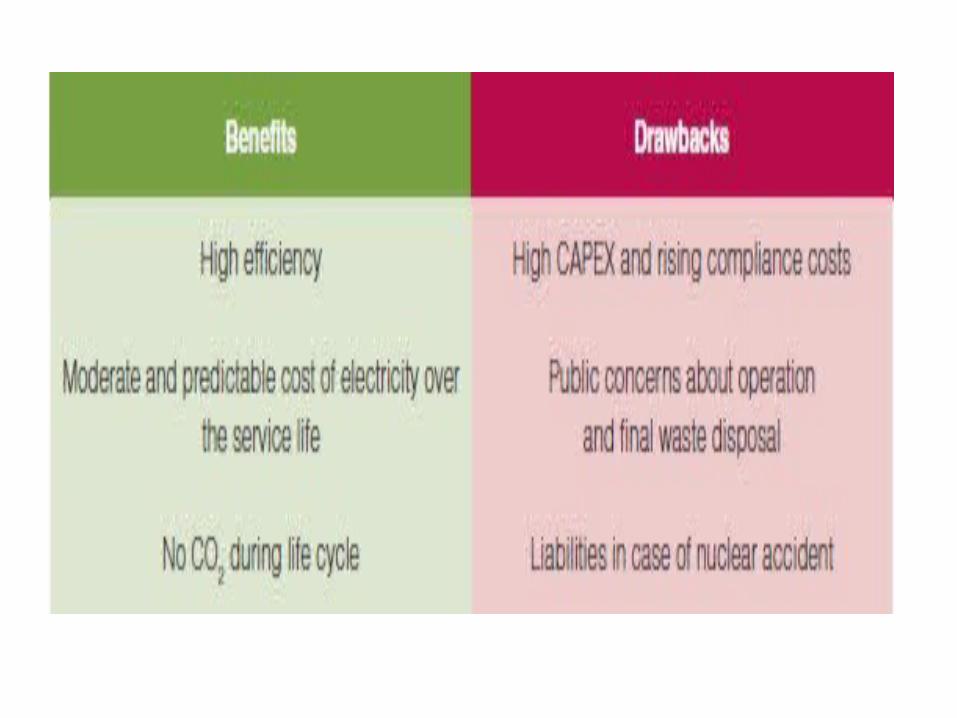
Uranium and Nuclear as an Energy Source:• The first nuclear reactor was commissioned in 1954. Uranium is the main source of fuel
for nuclear reactors. Worldwide output of uranium has recently been on the rise after a long period of declining production due to oversupply following nuclear disarmament.
• The total identified uranium resources have grown by 12.5% since 2008 and they are sufficient for over 100 years of supply based on current requirements.
• Total nuclear electricity production has been growing during the past two decades and reached an annual output of about 2 600TWh by the mid-2000s.T
• The three major nuclear accidents have slowed down or even reversed its growth in some countries. The nuclear share of total global electricity production reached its peak of 17% by the late 1980s, but since then it has been falling and dropped to 13.5% in 2012. its relative share in power generation has decreased, mainly due to Fukushima nuclear accident.
• Japan used to be one of the countries with a high share of nuclear (30%) in its electricity mix and high production volumes. Today, Japan has only two of its 54 reactors in operation.
• The rising costs of nuclear installations and lengthy approval times required for new construction have had an impact on the nuclear industry. The slowdown has not been global, as new countries, primarily in the rapidly developing economies in the Middle East and Asia, are going ahead with their plans to establish nuclear industries.

Hydro Power as an Energy Source:
• Hydro power provides a significant amount of energy throughout the world
and is present in more than 100 countries, contributing approximately 15% of the global electricity production. The top 5 largest markets for hydro power in terms of capacity are Brazil, Canada, China, Russia and the United States of America.
• China significantly exceeds the others, representing 24% of global installed capacity. In several other countries, hydro power accounts for over 50% of all electricity generation, including Iceland, Nepal and Mozambique for example. During 2012, an estimated 27–30GW of new hydro power and 2–3GW of pumped storage capacity was commissioned.
• In many cases, the growth in hydro power was facilitated by the lavish renewable energy support policies and CO2 penalties. Over the past two decades the total global installed hydro power capacity has increased by 55%, while the actual generation by 21%. The global installed hydro power capacity has increased by 8%, but the total electricity produced dropped by 14%, mainly due to water shortages.

Wind Power as an Energy Source:
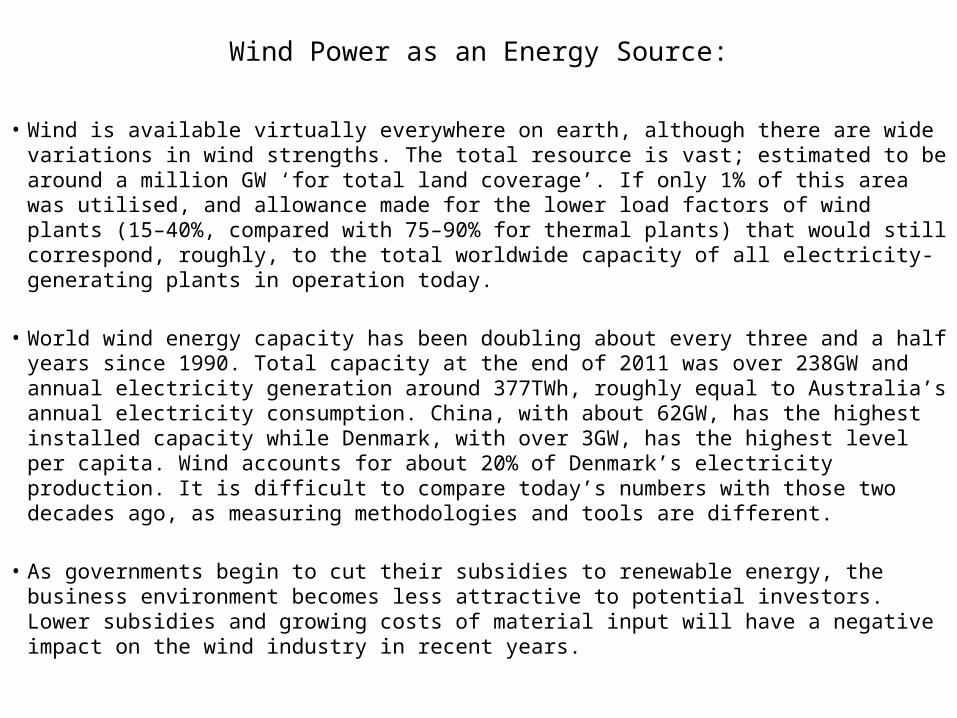
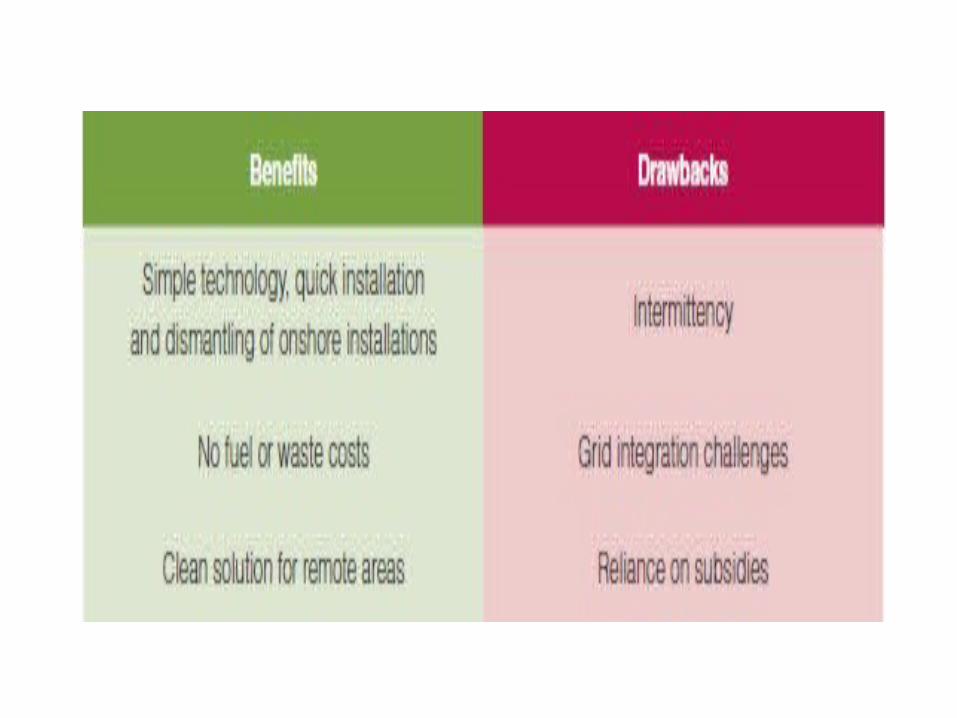
• Wind is available virtually everywhere on earth, although there are wide variations in wind strengths. The total resource is vast; estimated to be around a million GW ‘for total land coverage’. If only 1% of this area was utilised, and allowance made for the lower load factors of wind plants (15–40%, compared with 75–90% for thermal plants) that would still correspond, roughly, to the total worldwide capacity of all electricity-generating plants in operation today.
• World wind energy capacity has been doubling about every three and a half years since
1990. Total capacity at the end of 2011 was over 238GW and annual electricity generation around 377TWh, roughly equal to Australia’s annual electricity consumption. China, with about 62GW, has the highest installed capacity while Denmark, with over 3GW, has the highest level per capita. Wind accounts for about 20% of Denmark’s electricity production. It is difficult to compare today’s numbers with those two decades ago, as measuring methodologies and tools are different.
• As governments begin to cut their subsidies to renewable energy, the business
environment becomes less attractive to potential investors. Lower subsidies and growing costs of material input will have a negative impact on the wind industry in recent years.
Solar PV as an Energy Source:
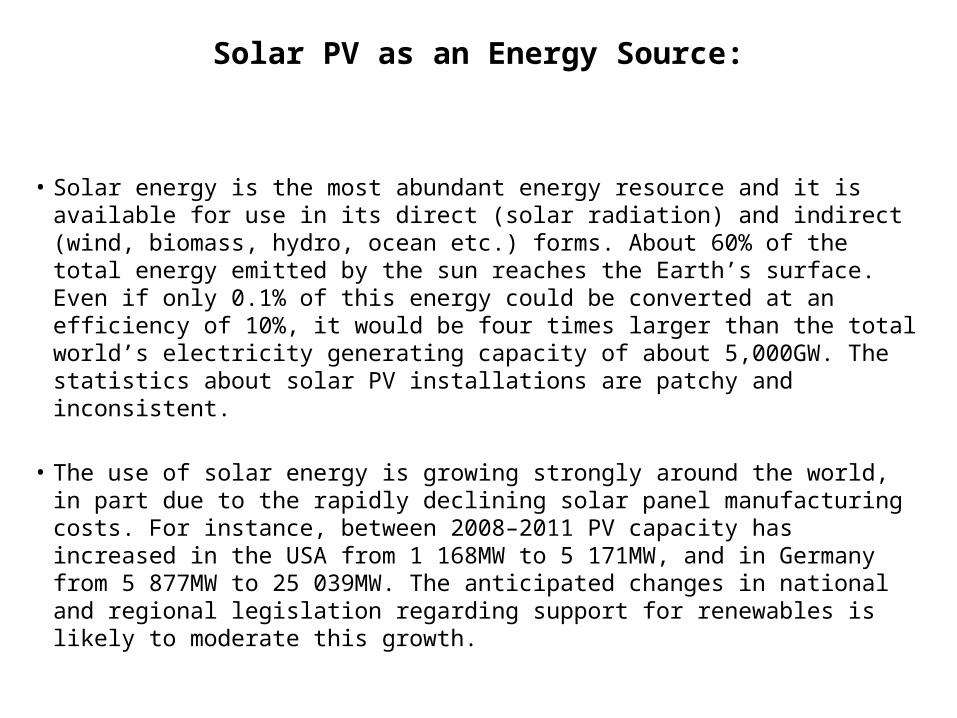
• Solar energy is the most abundant energy resource and it is available for
use in its direct (solar radiation) and indirect (wind, biomass, hydro, ocean etc.) forms. About 60% of the total energy emitted by the sun reaches the Earth’s surface. Even if only 0.1% of this energy could be converted at an efficiency of 10%, it would be four times larger than the total world’s electricity generating capacity of about 5,000GW. The statistics about solar PV installations are patchy and inconsistent.
• The use of solar energy is growing strongly around the world, in part due
to the rapidly declining solar panel manufacturing costs. For instance, between 2008–2011 PV capacity has increased in the USA from 1 168MW to 5 171MW, and in Germany from 5 877MW to 25 039MW. The anticipated changes in national and regional legislation regarding support for renewables is likely to moderate this growth.


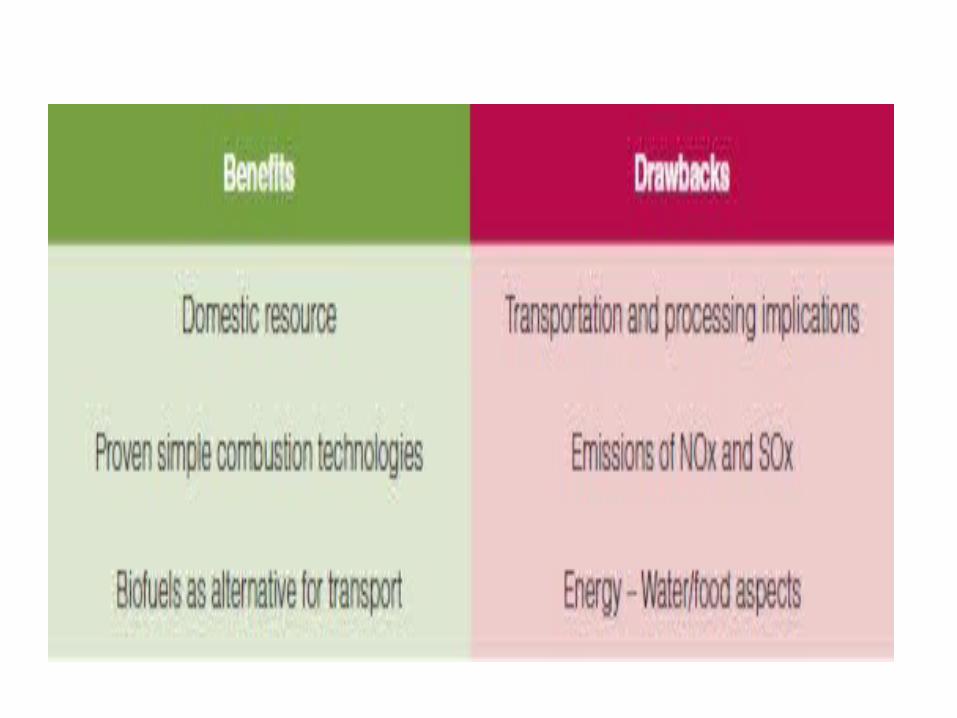
Bio-energy and Waste as an Energy Source:
• Bioenergy is a broad category of energy fuels manufactured from a variety of
feedstocks of biological origin and by numerous conversion technologies to generate heat, power, liquid biofuels and gaseous biofuels. The term “traditional biomass” mainly refers to fuelwood, charcoal, and agricultural residues used for household cooking, lighting and space-heating in developing countries. The industrial use of raw materials for production of pulp, paper, tobacco, pig iron so on, generates byproducts such as bark, wood chips, black liquor, agricultural residues, which can be converted to bioenergy.
• The share of bioenergy in TPES has been estimated at about 10% in 1990.
Between 1990 and 2010 bioenergy supply has increased from 38 to 52EJ as a result of growing energy demand. New policies to increase the share of renewable energy and indigenous energy resources are also driving demand. However, it is difficult to make accurate comparisons with earlier figures because of poor availability and low level of standardisation of data.
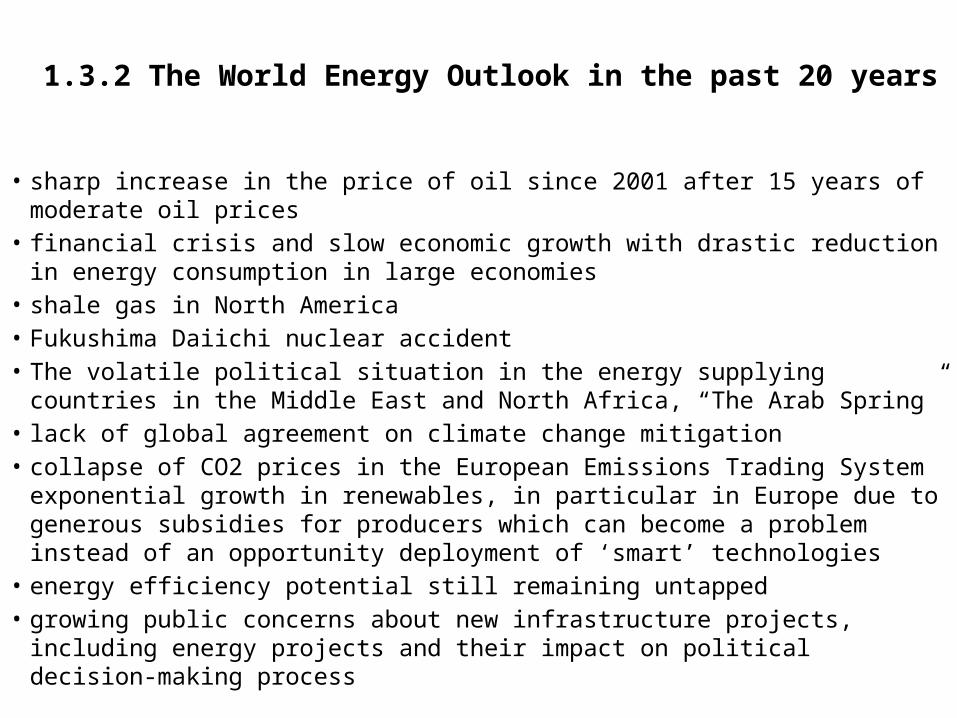
1.3.2 The World Energy Outlook in the past 20 years
• sharp increase in the price of oil since 2001 after 15 years of moderate oil prices• financial crisis and slow economic growth with drastic reduction in energy
consumption in large economies• shale gas in North America• Fukushima Daiichi nuclear accident• The volatile political situation in the energy supplying countries in the Middle
East and North Africa, “The Arab Spring”• lack of global agreement on climate change mitigation• collapse of CO2 prices in the European Emissions Trading System exponential
growth in renewables, in particular in Europe due to generous subsidies for producers which can become a problem instead of an opportunity deployment of ‘smart’ technologies
• energy efficiency potential still remaining untapped• growing public concerns about new infrastructure projects, including energy
projects and their impact on political decision-making process
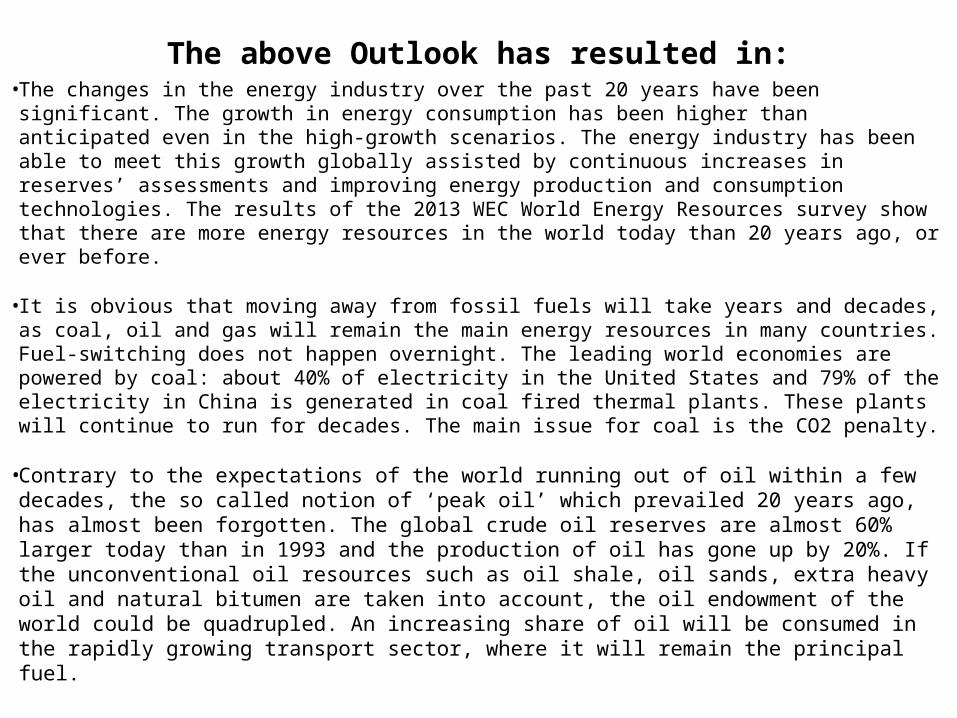
The above Outlook has resulted in:• The changes in the energy industry over the past 20 years have been significant. The growth
in energy consumption has been higher than anticipated even in the high-growth scenarios. The energy industry has been able to meet this growth globally assisted by continuous increases in reserves’ assessments and improving energy production and consumption technologies. The results of the 2013 WEC World Energy Resources survey show that there are more energy resources in the world today than 20 years ago, or ever before.
• It is obvious that moving away from fossil fuels will take years and decades, as coal, oil and gas will remain the main energy resources in many countries. Fuel-switching does not happen overnight. The leading world economies are powered by coal: about 40% of electricity in the United States and 79% of the electricity in China is generated in coal fired thermal plants. These plants will continue to run for decades. The main issue for coal is the CO2 penalty.
• Contrary to the expectations of the world running out of oil within a few decades, the so called notion of ‘peak oil’ which prevailed 20 years ago, has almost been forgotten. The global crude oil reserves are almost 60% larger today than in 1993 and the production of oil has gone up by 20%. If the unconventional oil resources such as oil shale, oil sands, extra heavy oil and natural bitumen are taken into account, the oil endowment of the world could be quadrupled. An increasing share of oil will be consumed in the rapidly growing transport sector, where it will remain the principal fuel.
The above Outlook has resulted in:• Natural gas is expected to continue its growth spurred by falling or stable prices, and
thanks to the growing contribution of unconventional gas, such as shale gas. In addition to power generation, natural gas is expected to play an increasing role as a transport fuel.
• The future of nuclear energy is uncertain. While some countries, mainly in Europe, are making plans to withdraw from nuclear, other countries are looking to establish nuclear power generation.
• The development of renewables, excluding large hydro, has been considerably slowerthan expected 20 years ago. Despite the exponential growth of renewable resources in percentage terms, in particular wind power and solar PV, renewable energy still accounts for a small percentage of TPES in most countries. Their contribution to energy supply is not expected to change dramatically in the coming years. The continuing growth of renewables strongly depends on subsidies and other support provided by governments. Integration of intermittent renewables in the electricity grids also remains an issue, as it results in additional balancing costs for the system and thus higher electricity bills.
• Energy efficiency helps address the “energy trilemma” and provides an immediate opportunity to decrease energy intensity. This will achieve energy savings and reduce the environmental impacts of energy production and use.

1.3.3 In Summary : • Finally, demand for energy will continue to grow. Even if global energy
resources seem to be abundant today, there are other constraints facing the energy sector, above all, significant capital investment in developing and developed economies is needed. The environment and climate, in particular, pose an additional challenge. Clean technologies will require adequate financing, and consumers all over the world should be prepared to pay higher prices for their energy than today. Energy is global and to make the right choices, decision makers should look at the global picture and base their decisions on a thorough life cycle analysis and reliable energy information.
• One of the major challenges facing the world at present is that
approximately 1.2 billion people live without any access to modern energy services.Access to energy is fundamental pre-requisite for modern life and a key tool in eradicating extreme poverty across the globe
1.4 Sri Lanka Energy Situation
1.4.1 Energy Resources Used in Sri
Lanka
Both indigenous resources available in the country such as biomass and hydro power and imported fossil fuels are the main resources used in the country to fulfill its energy needs.
Indigenous Energy Resources Available in Sri Lanka
Due to geo-climatic settings, Sri Lanka is blessed with several types of renewable energy resources. Some of them are widely used and developed to supply the energy requirements of the country. Others have the potential for development when the technologies become mature and economically feasible for use.
• Following are the main renewable resources available in Sri Lanka.
- Biomass- Hydro Power- Solar- Wind
the availability of petroleum within Sri Lankan territory is being investigated. and some Peat resources in the Muthurajawela swamp, there are no known commercially tradable energy resources in the country.
Biomass
Large quantities of firewood and other biomass resources are used for cooking in rural households and to a lesser extent, in urban households. A large portion of energy needs of the rural population is fulfilled by firewood. There are other uses of biomass for energy in the country, especially for thermal energy supply in the industrial sector.

Hydro
Hydro power is a key energy source used for electricity generation in Sri Lanka. A large share of the major hydro potential has already been developed and delivers valuable low cost electricity to the country. Currently, hydro power stations are operated to supply both peaking, intermediate and base load electricity generation requirements. A substantial number of small hydro power plants operate under the Standardised Power Purchase Agreement (SPPA) and many more are expected to join the fleet during the next few years.

Solar
• Solar Power was first introduced to Sri Lanka in 1976 at the Ruralk Energy Centre – Patiyapola
• More than 100,000 Solar Home Systems were installed during several attempts to introduce stand alone systems to provide basic lighting and TV applications in rural households commencing from 1983.
• Two solar power plants at the Hambantota Solar Park, are operated at a relatively low level, with annual plant factors of 16.01% from the 737 kW plant and 15.04% from the 500 kW.
• Approval has been granted for three 10 MW Solar PV plants and several more solar based power plants with storage capability.
• These efforts have given way to solar roof top units spurred by high cost of grid electricity to households in the high consuming categories through Net-metering scheme which was introduced in 2010. More than 3 MW of roof top PV systems are conectedto the national grid as at end 2013.

Wind
• Wind development was first initiated as a wind driven water pumping systems for irrigation purposes. This initiative supported by the Government of Netherlands in late 1970’s.
• In early 80’s a detailed wind resource data collection was initiated in the South Eastern, Norh Western and central regions of the country This was the first step towards introduction of wind for power generation., The first pilot scale 3MW wind power project was installed with world Bank assistance in the early 1990’s.
• wind resources in the entire country was conducted with assistance of the USAID.
• Sri Lanka was identified as a high wind resource country. With this revelation and the Small Power Purchase Agreement spurred the installation of several 10MW wind power projects mainly in the North Western Putalam area now with about 75 MW installed in the country.
• Mannar Island is now identified as an area with very high wind potential.

Oil/Gas Exploration
Cairn Lanka (Pvt) Ltd (CLPL) has completed its work commitment for the first phase successfully, which resulted in two successive gas and condensate discoveries in two of the three exploration wells drilled in 2011 and a fourth well in 2013. in Mannar
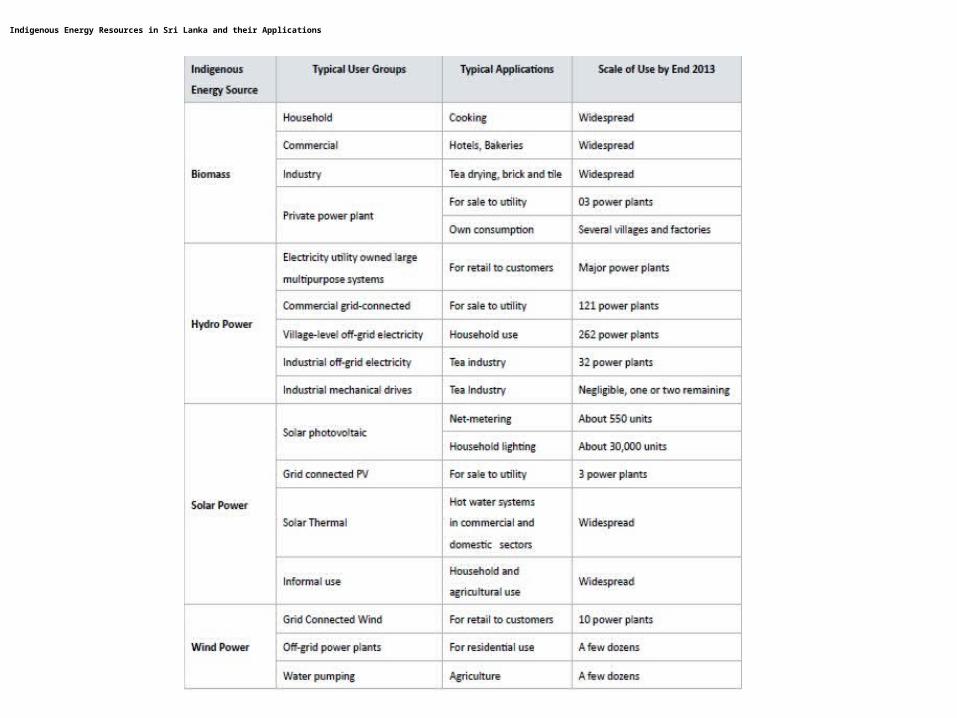
Indigenous Energy Resources in Sri Lanka and their Applications
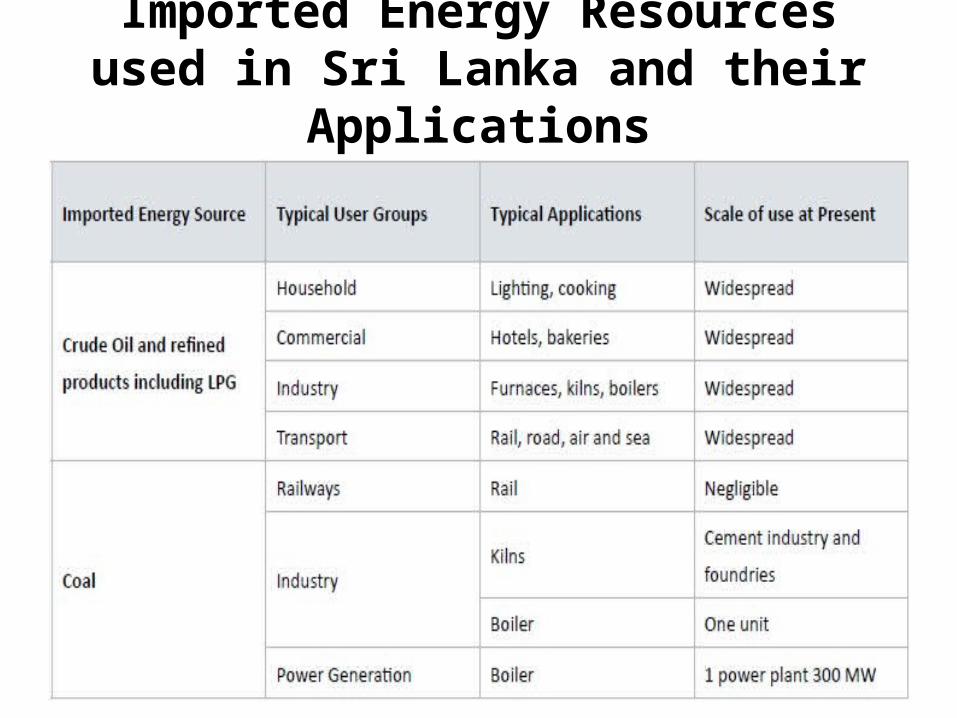
Imported Energy Resources used in Sri Lanka and their Applications
1.4.2 Energy Supply in Sri Lanka
The four main sources of Energy Supply in the country are:
• Biomass • Petroleum (Imported)• Coal (Imported)• Electricity (Generated from both indigenous and
imported sources)
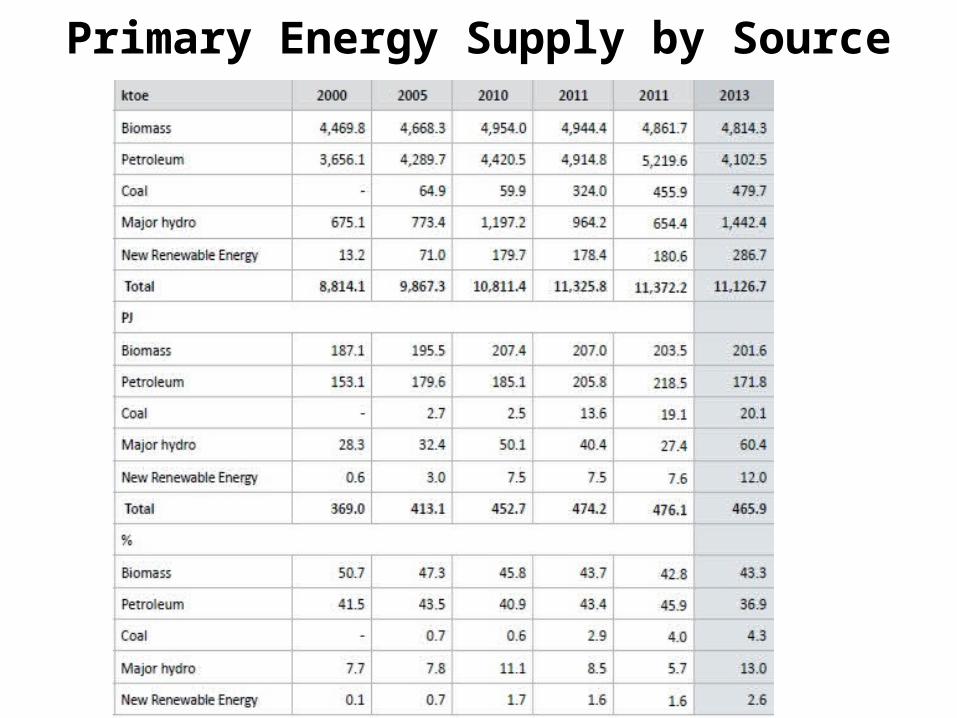
Primary Energy Supply by Source

Sources of Production of Biomass
Biomass comes in different forms. Following are the most common forms of biomass available in Sri Lanka.
• Fuel wood• Municipal Waste• Industrial Waste• Agricultural Waste
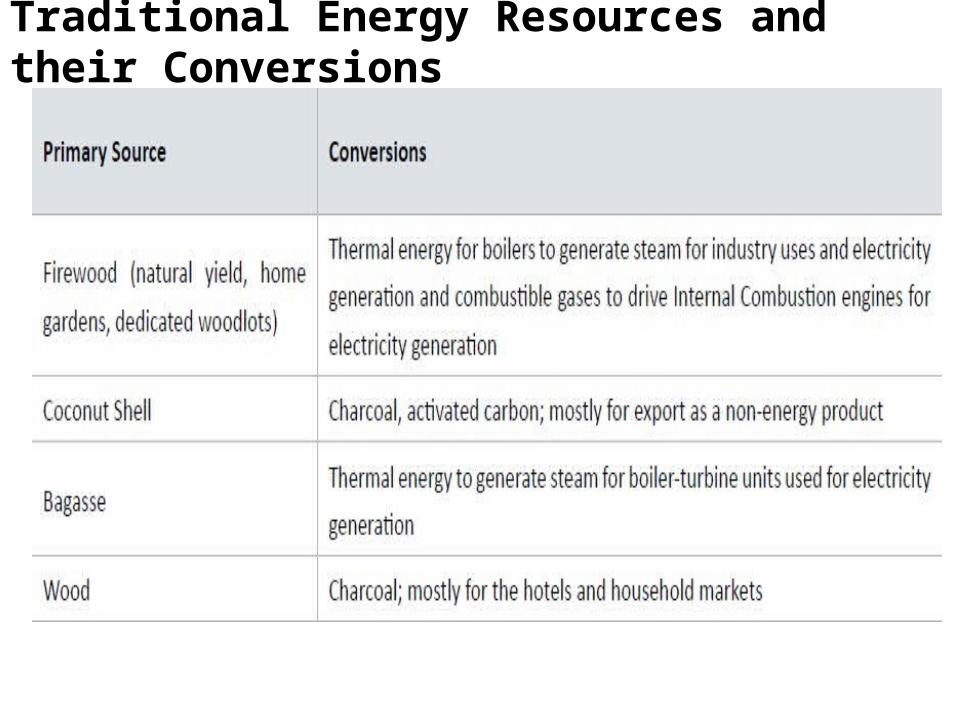
Traditional Energy Resources and their Conversions

Energy Supply from Petroleum
Sri Lanka totally depends on petroleum imports, both in the form of crude oil and as finished products. The importation of crude oil and finished petroleum products has increased over time. In 2013 however, the imported quantity of crude oil increased by 6.7%, while finished product imports decreased by 32.4%. This decrease is visible nearly in all fuels used in transport, power generation and industries.

Crude Oil and Petroleum product imports
Energy Supply from Coal
The demand for coal continued to rise in 2013 as well, owing to the operation of the coal-fired power plant. With the commissioning of the entire Coal Power plant in 2014, of 900 MW this coal importation is expected to increase up to 2.5 Mt per year.
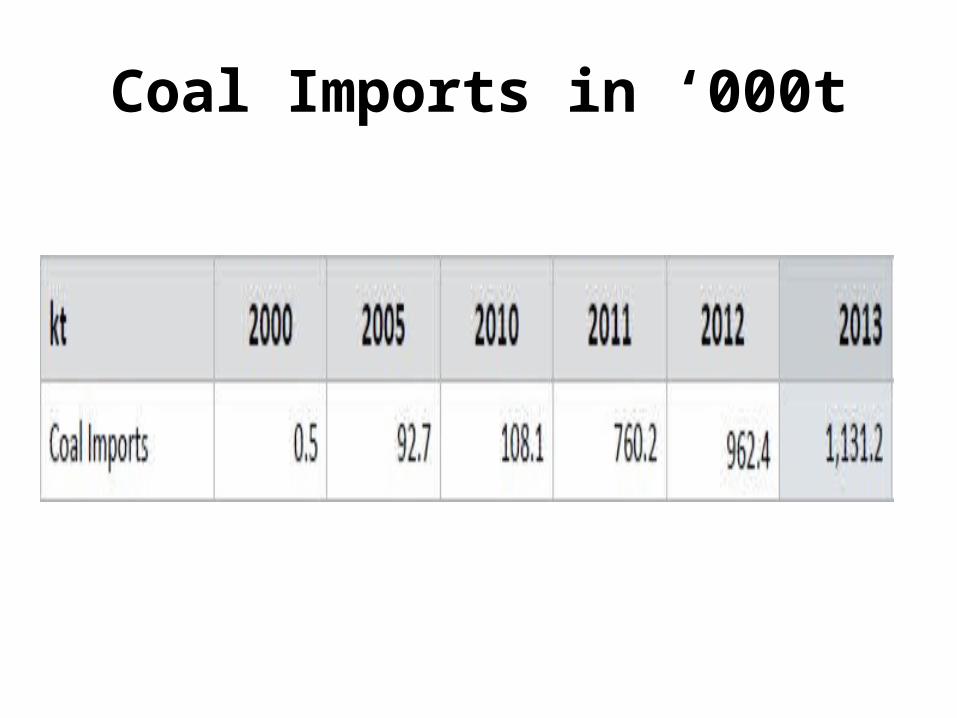
Coal Imports in ‘000t
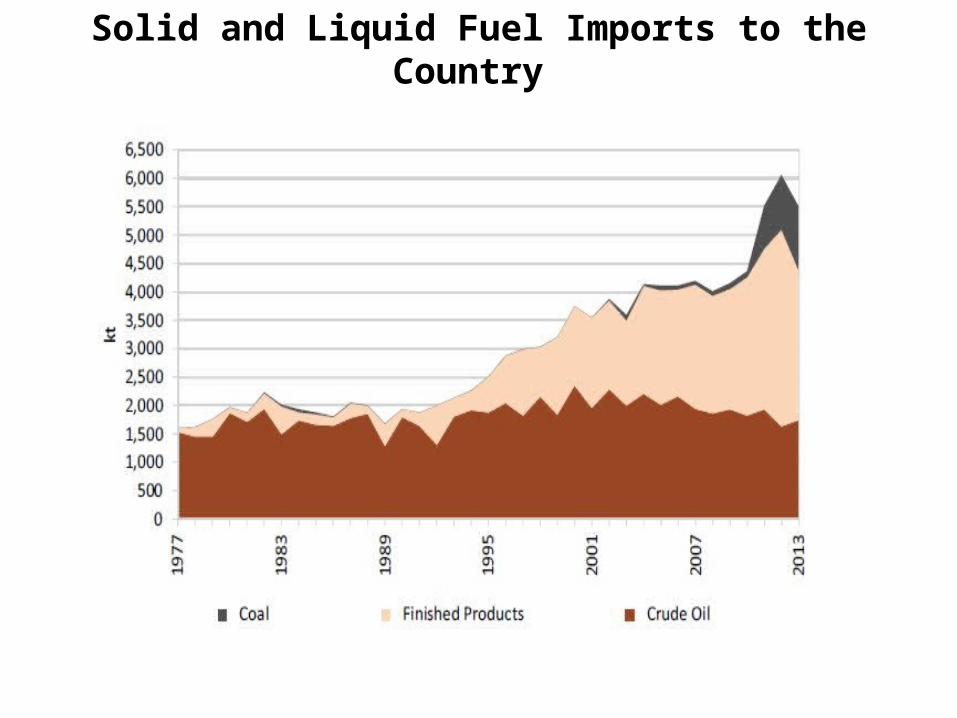
Solid and Liquid Fuel Imports to the Country

Supply from Major Hydro
• The topography of the country provides an excellent opportunity to harness the energy stored in river
• hydro resource for direct motive power was common in yesteryears, mainly to provide motive power to over 600 tea factories in the central hill country in the later part of the 19th century.
• The first technical paper on the use of Hydro power was presented by Eng. D J Wimalausurendra in 1922.
• The major hydropower development commenced with the Kehelgamu Oya – Maskeli Oya Project popularly known as the Laxapana Project. Subsequently with the launching of the Multipurpose Mahaweli Project and later other hydro power projects total installed capacity of hydro power stands at 1200 MW.
• Electricity production has become the sole use of the hydro as an energy resource in recent times apart from its strategic use in irrigation and drinking water . The contribution of hydro as an energy supply source is always through its secondary form, which is electricity.
• There are two other large scale hydro power stations, namely Samanalawewa on Walawe basin and Kukule Ganga on Kalu ganga basin, while small scale power plants such as Inginiyagala and Uda Walawa are also generating hydropower using their respective irrigation reservoir storages owned and operated by CEB.
Laxapana Complex
Laxapana Complex is a result of Kehelgamu – Maskeli Oya development project. The five power stations in the Laxapana Complex are situated along Kehelgamu oya and Maskeli Oya. The main reservoir at the top of Kehelgamu oya is Castlereagh reservoir. Main reservoir associated with Maskeli oya is Maussakelle reservoir.
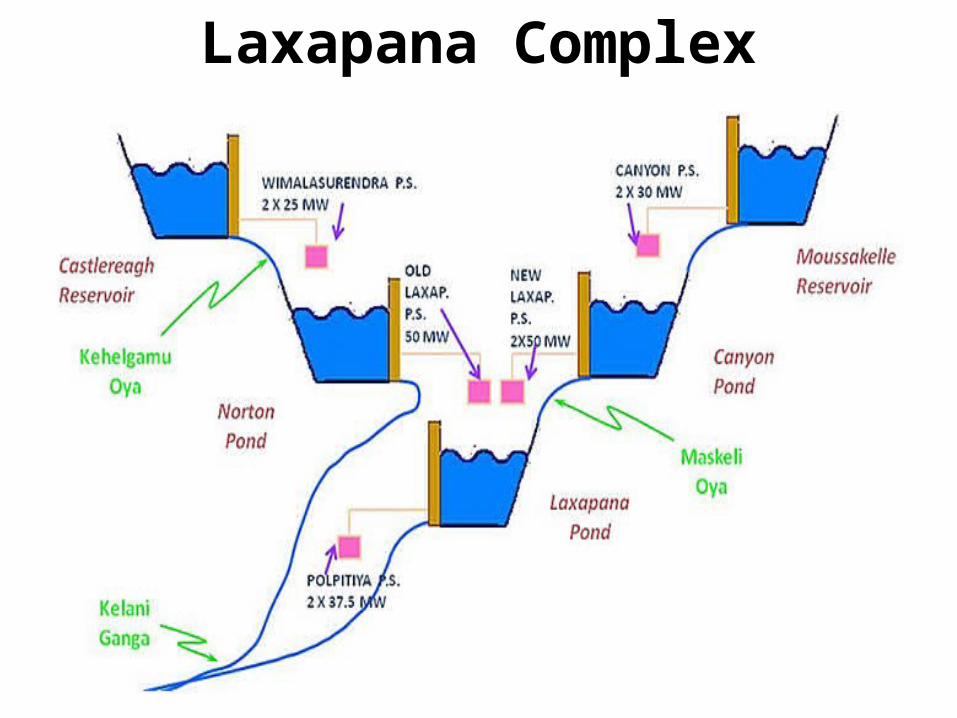
Laxapana Complex
Mahaweli Complex
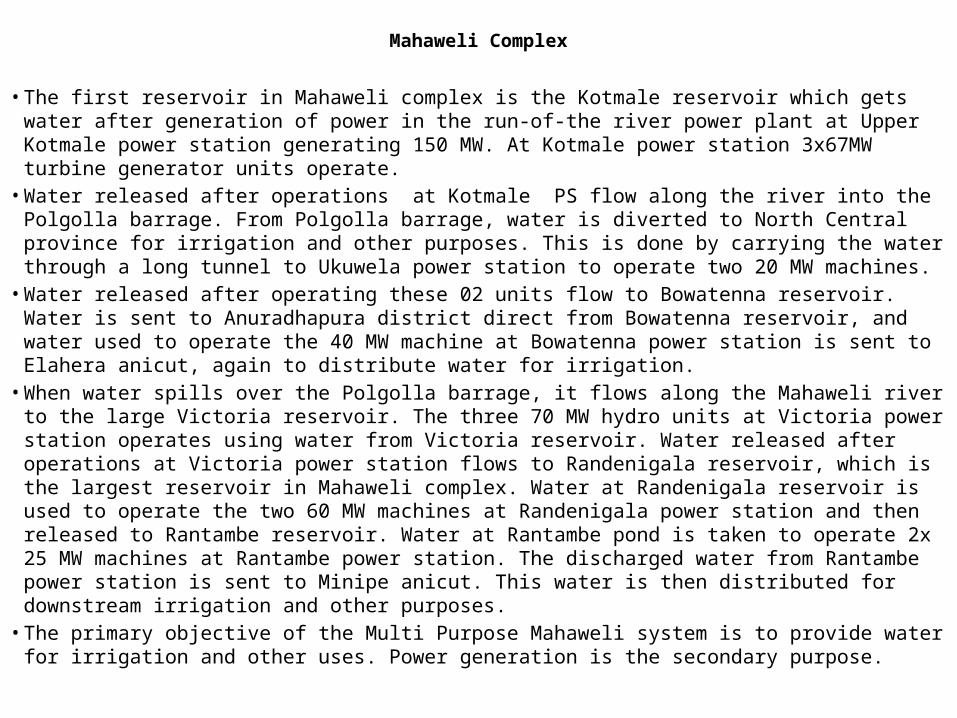
• The first reservoir in Mahaweli complex is the Kotmale reservoir which gets water after generation of power in the run-of-the river power plant at Upper Kotmale power station generating 150 MW. At Kotmale power station 3x67MW turbine generator units operate.
• Water released after operations at Kotmale PS flow along the river into the Polgolla barrage. From Polgolla barrage, water is diverted to North Central province for irrigation and other purposes. This is done by carrying the water through a long tunnel to Ukuwela power station to operate two 20 MW machines.
• Water released after operating these 02 units flow to Bowatenna reservoir. Water is sent to Anuradhapura district direct from Bowatenna reservoir, and water used to operate the 40 MW machine at Bowatenna power station is sent to Elahera anicut, again to distribute water for irrigation.
• When water spills over the Polgolla barrage, it flows along the Mahaweli river to the large Victoria reservoir. The three 70 MW hydro units at Victoria power station operates using water from Victoria reservoir. Water released after operations at Victoria power station flows to Randenigala reservoir, which is the largest reservoir in Mahaweli complex. Water at Randenigala reservoir is used to operate the two 60 MW machines at Randenigala power station and then released to Rantambe reservoir. Water at Rantambe pond is taken to operate 2x 25 MW machines at Rantambe power station. The discharged water from Rantambe power station is sent to Minipe anicut. This water is then distributed for downstream irrigation and other purposes.
• The primary objective of the Multi Purpose Mahaweli system is to provide water for irrigation and other uses. Power generation is the secondary purpose.

Mahaweli Complex
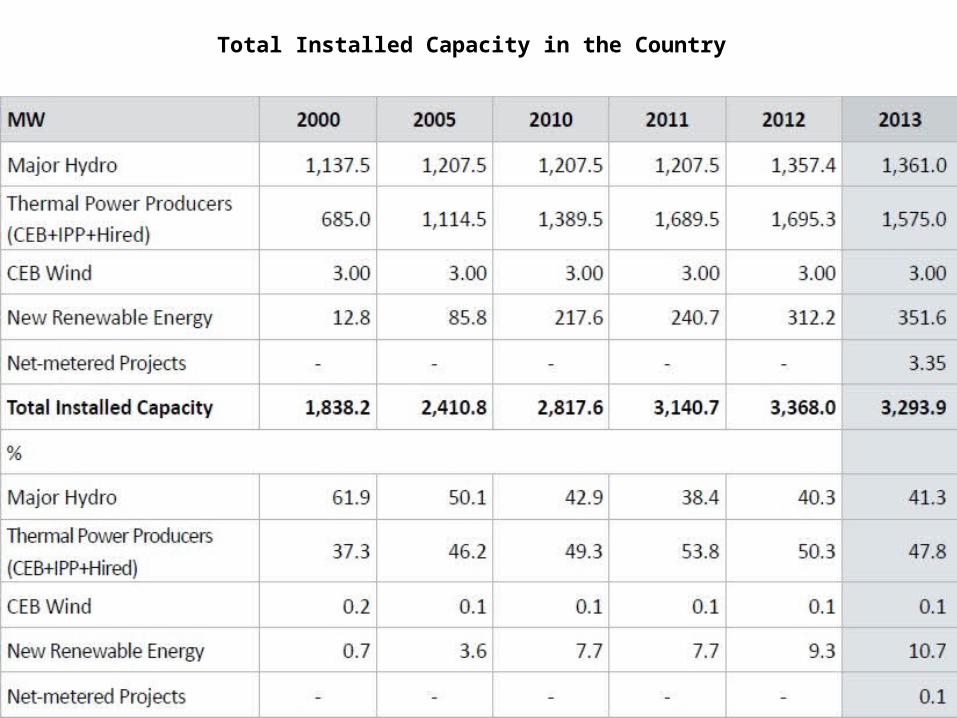
Total Installed Capacity in the Country

The total installed capacities by type of power plant.

Installed Capacities and Generation of NRE Power Plants by end 2013

Gross Generation of Grid Connected Power Plants

Gross Generation by sources

1.4.4 Energy Demand in Sri Lanka
• Energy is a vital building block for economic growth• Energy demand arises owing to energy needs of
households, industries, commercial buildings, etc. According to the needs of the user, the supply of energy has to take different forms. For example, the energy demand for cooking is in the form of biomass in rural areas, while it is in the form of either LP gas or electricity in urban areas. Therefore, not only the quantity of energy, even the quality and the form it is delivered, is determined by the demand.
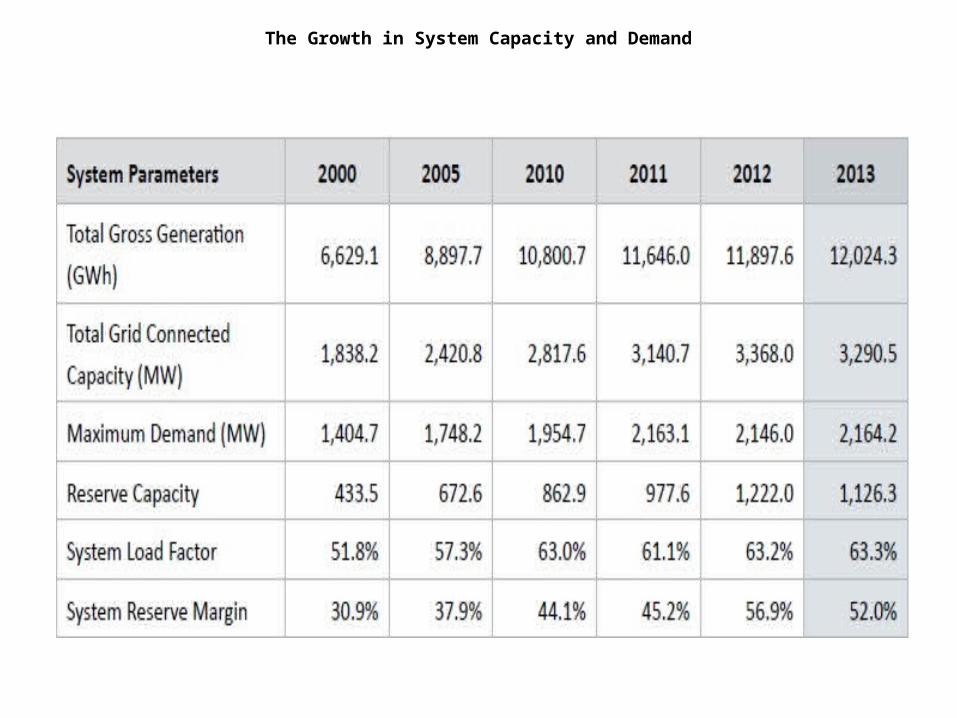
The Growth in System Capacity and Demand

Development of System Load Factor, Reserve Margin and Peak Demand
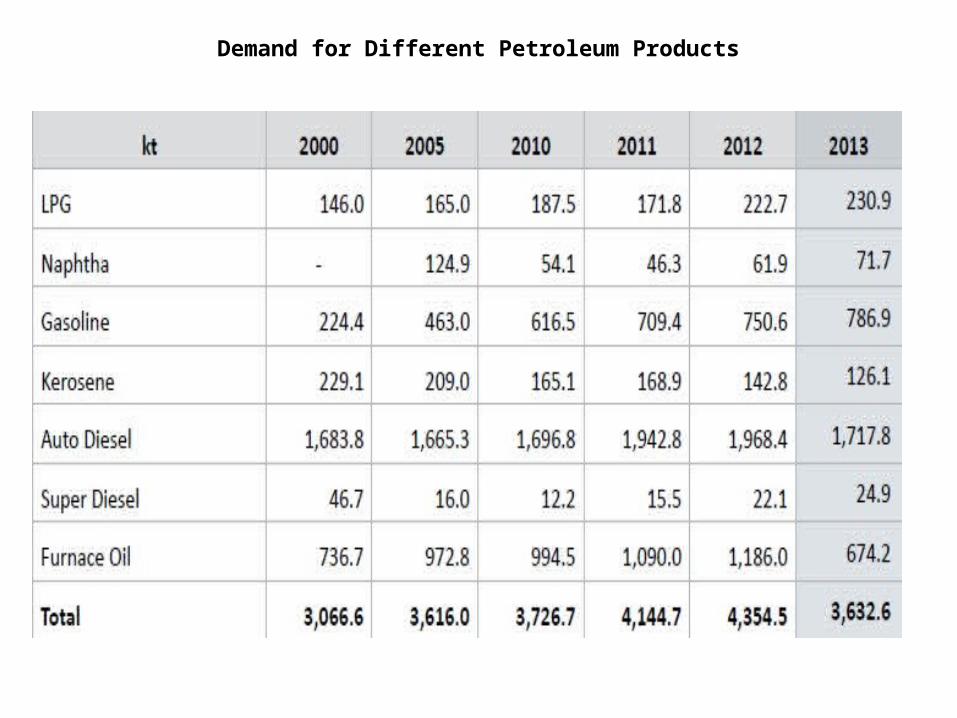
Demand for Different Petroleum Products

Demand for Coal and Biomass
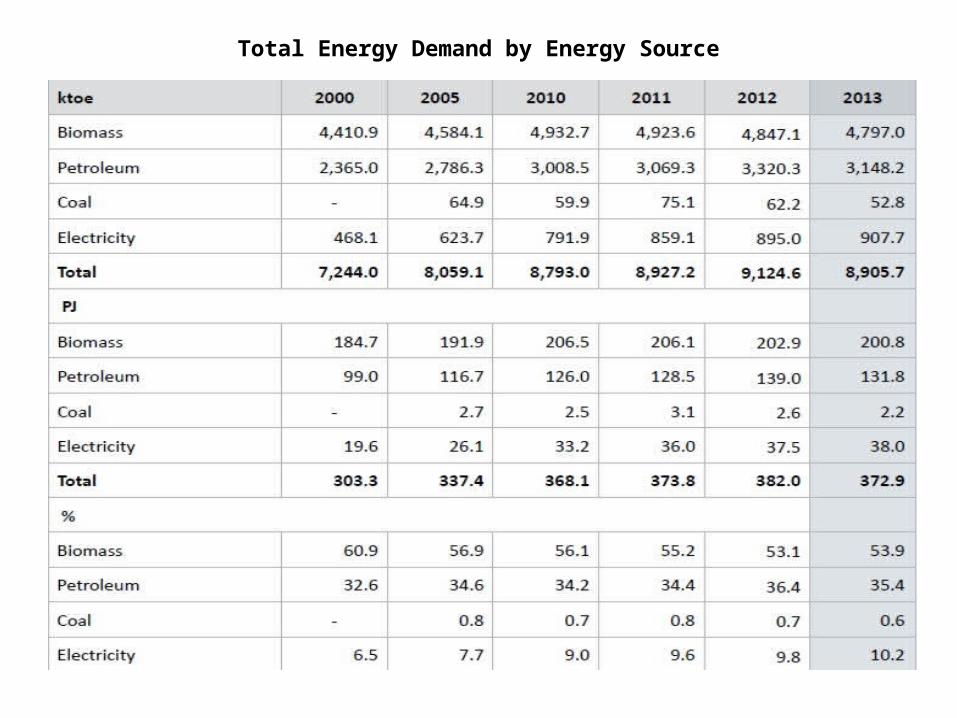
Total Energy Demand by Energy Source

Total Energy Demand by Energy Source
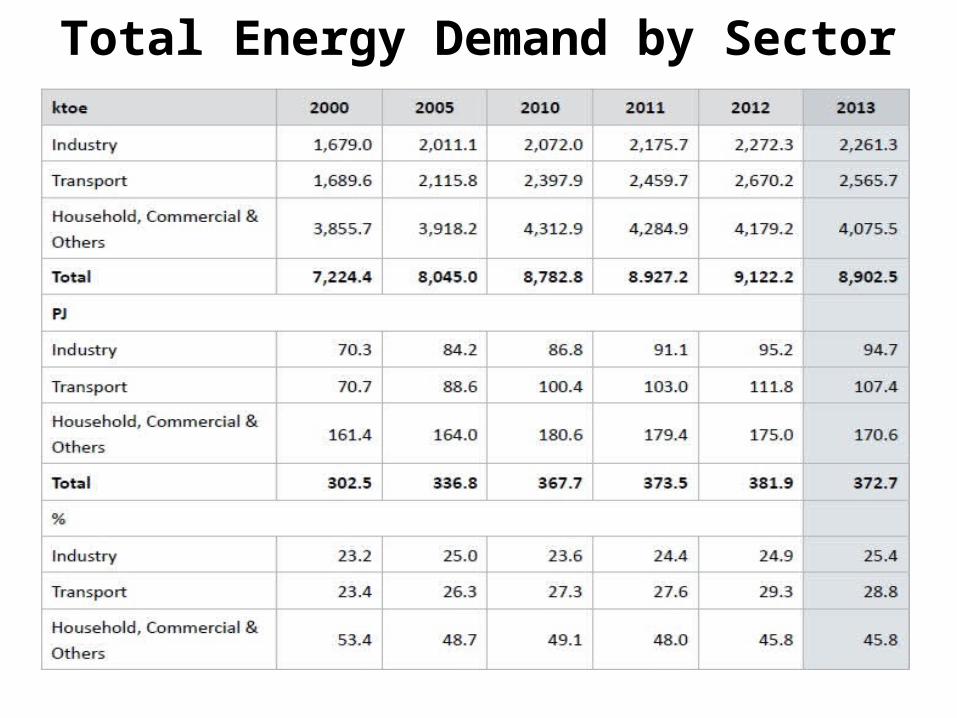
Total Energy Demand by Sector

Total Energy Demand by Sector

Energy Balance in PJ

Energy Flow Diagram for 2013