energy storage study presentation storage study... · egeas decision tree 6 bau d&e rpsh...
TRANSCRIPT

MISO Energy Storage Study

Background
• MISO initiated the Energy Storage Study to explore the benefits that pumped hydro storage, compressed air energy storage, and battery storage technologies could provide as well as their economic potential in the MISO region.
• This study is part of MISO’s involvement in GO15, an initiative with the largest power grid operators in the world.
• Study findings indicate that although there is overall opportunity for long-term storage resources in certain future scenarios, the existing MISO market and tariff conditions currently do not find large-scale investment in storage to be economical based on capacity and energy benefits captured in the model.

MISO’s Value-Based Planning
3
• The MISO 7-Step planning process should result in a robust plan under a variety of scenarios, not the least-cost plan under a single scenario
• By Identifying Possible Futures…
– D/E Growth, Retirements, Fuels, RPS, Environmental, DSM…
• We get a footprint-wide plan that can deliver value and accommodate plans and goals for all our stakeholders

Importance of Scenario Analysis
• The scenarios should simulate likely or plausible real-life future system conditions and provide a broad range of outcomes showing potential for storage to be economic.
• States have already implemented goals and mandates for renewables which could carryover to energy storage as another clean technology.
• There are potential business development ideas for storage in MISO.– System Support Resource (SSR) alternative– Address potential resource shortfall in summer 2016– Alternative to distribution transmission projects– Use in initiation of emergency operating procedures (EOPs)– Solution for market efficiency in congestion prone areas
4

Model Assumptions
5
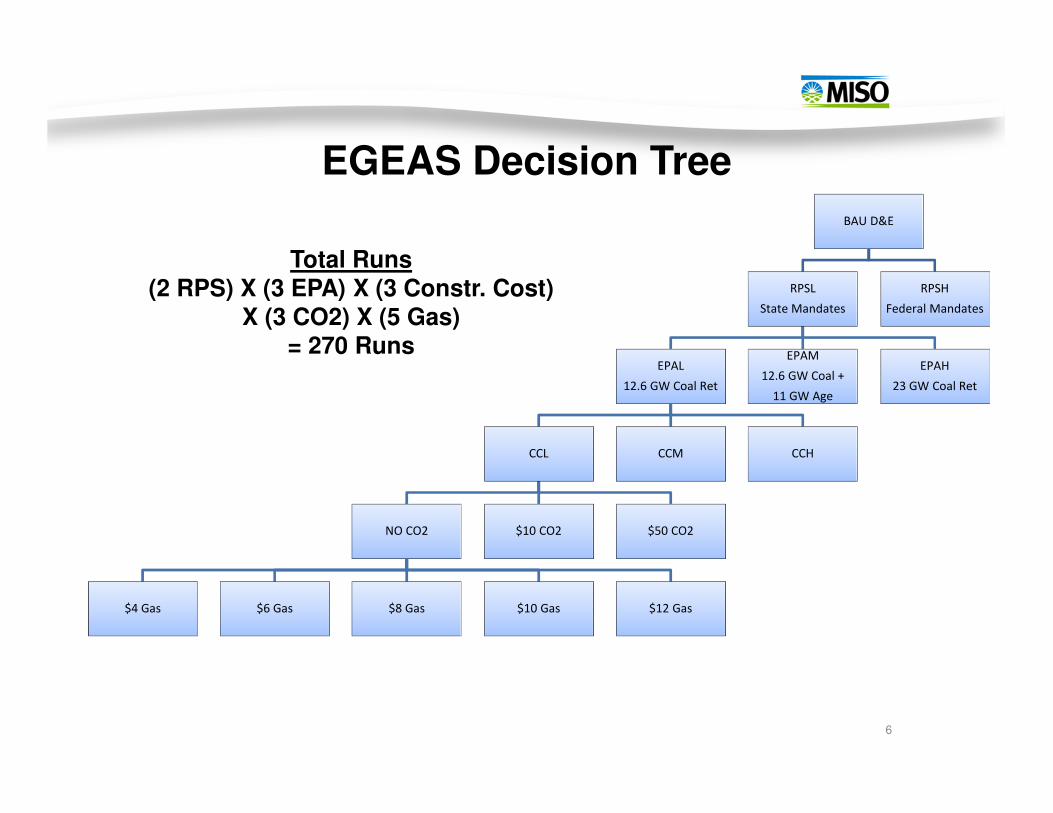
EGEAS Decision Tree
6
BAU D&E
RPSH
Federal Mandates
RPSL
State Mandates
EPAH
23 GW Coal Ret
EPAM
12.6 GW Coal +
11 GW Age
EPAL
12.6 GW Coal Ret
CCHCCMCCL
$50 CO2$10 CO2NO CO2
$12 Gas$10 Gas$8 Gas$6 Gas$4 Gas
Total Runs(2 RPS) X (3 EPA) X (3 Constr. Cost)
X (3 CO2) X (5 Gas)
= 270 Runs

Assumptions
7
Variable Low (L) Mid (M) High (H)
Pumped Storage Hydro
($/kW)4050 4590 5400
Compressed Air Energy
Storage ($/kW)957 1085 1276
Battery ($/kW) 1,914 2,170 2552
Demand Growth Rate 0.80%
Energy Growth Rate 0.80%
Natural Gas $4,6,8,10,12
CO2 ($/ton) 0 10 50
Retirements 12,600 MW
12,600 MW + 11,600 MW
age-related retirements =
24,200 MW
24 GW coal retirements
Renewable Portfolio
Standards
State mandates only /
6100 MW
30% MISO-Wide Mandate
Solar 10% of overall
mandate / 58,600 MW

Coal
39%
Gas
38%
Wind
8%
Nuclear
8%
Oil
2%Hydro
2%
Manitoba Tie
2%Pumped Hydro
Storage
1%
Biomass
0.12%Solar
0.04%
DSM
0.03%
Fuel Category MW Percentage
Coal 73,640 39%
Gas 72,724 38%
Wind 16,032 8%
Nuclear 14,953 8%
Oil 4,150 2%
Hydro 3,272 2%
Manitoba Tie 3,157 2%
Pumped Hydro
Storage2,518 1%
Biomass 224 0.12%
Solar 76 0.04%
DSM 66 0.03%
Total 190,812
Resource Mix
of MISO Footprint
for 2014

Electric Vehicle Assumptions
9
EV’s in MISO footprint
2006 2007 2008 2009 2010 2011
U.S. EVs 53,507 55,706 56,856 56,407 57,451 66,614
MISO EVs 2,263 2,225 2,421 2,728 2,339 2,686
% EV’s in
MISO 4.23% 3.99% 4.26% 4.84% 4.07% 4.03%
21 MW
400 MW
0.000
100.000
200.000
300.000
400.000
500.000
600.000
700.000
800.000
900.000
1000.000
2012 2016 2020 2024 2028 2032 2036
MW
EV Growth Projection for MISO
The historical percentage of EVs in MISO are applied to the EIA growth projection to calculate the number of EVs in MISO over the study period.

Results
10

11
0 2 4 6 8 10 12 14
EPAH_CCL_RPSH_Gas8_C0
EPAH_CCL_RPSH_Gas10_C0
EPAL_CCM_RPSL_Gas4_C50
EPAM_CCH_RPSH_Gas12_C0
EPAM_CCH_RPSH_Gas12_C10
EPAM_CCL_RPSH_Gas6_C0
EPAM_CCL_RPSH_Gas6_C10
EPAM_CCL_RPSH_Gas8_C10
EPAM_CCL_RPSH_Gas12_C50
EPAM_CCM_RPSH_Gas8_C0
EPAM_CCM_RPSH_Gas8_C10
EPAM_CCM_RPSH_Gas10_C0
EPAM_CCM_RPSH_Gas10_C10
EPAM_CCM_RPSH_Gas12_C10
EPAM_CCM_RPSH_Gas12_C50
EPAL_CCL_RPSH_Gas4_C50
EPAL_CCL_RPSL_Gas4_C50
EPAM_CCL_RPSH_Gas8_C0
EPAM_CCM_RPSH_Gas12_C0
EPAH_CCL_RPSH_Gas12_C0
EPAH_CCL_RPSH_Gas12_C10
EPAH_CCM_RPSH_Gas4_C50
EPAL_CCL_RPSH_Gas12_C0
EPAM_CCH_RPSL_Gas4_C50
EPAH_CCL_RPSH_Gas4_C50
EPAM_CCH_RPSH_Gas4_C50
EPAM_CCM_RPSH_Gas4_C50
EPAM_CCM_RPSL_Gas4_C50
EPAM_CCL_RPSH_Gas4_C50
EPAM_CCL_RPSH_Gas10_C0
EPAM_CCL_RPSH_Gas10_C10
EPAM_CCL_RPSH_Gas12_C0
EPAM_CCL_RPSH_Gas12_C10
EPAM_CCL_RPSL_Gas4_C50
GW
Ca
ses
Storage Selection Results• CAES is the preferred
storage resource because of its much lower construction costs and higher efficiency.
• The maximum amount of storage capacity added is 12 GW in the cases with medium retirements, low construction costs.
• High renewables, high gas prices and low carbon costs yield the most storage selection on one spectrum, while low renewables, low gas prices and high carbon costs yield just as much storage selection.
EPA = Generation Retirement (low, medium, high), CC = Construction Costs (low, medium, high), RPS = Renewable Penetration (low, high), Gas = Gas Price ($4, $6, $8, $10, $12), C = Carbon Costs ($0, $10, $50)
12

13
0
20,000
40,000
60,000
80,000
100,000
120,000
140,000
0 400 800 1200 1600 2000 2400 2800 3200 3600 4000 4400 4800 5200 5600 6000 6400 6800 7200 7600 8000 8400
MW
Hour
Load duration curve – Low Renewables sample
Wind
PV
Must Run
Load
The marginal units for both peak and off peak are gas units
since the Must Run and renewables are not able to meet
the load obligations. Thus there is not enough price
differential in the off-peak to justify storage resources.
14230
10,450
8,620
-
-
2,000
4,000
6,000
8,000
10,000
12,000
Resources contributing to storage charging Resources displaced by storage discharging
En
erg
y G
Wh
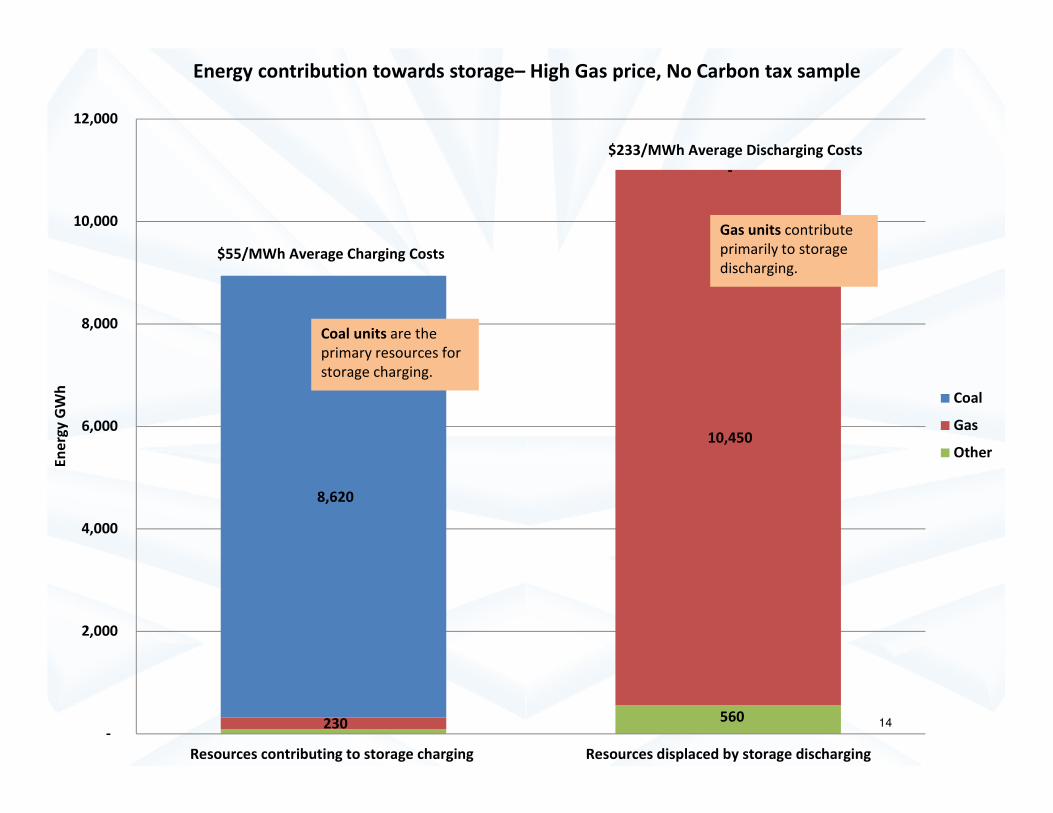
Energy contribution towards storage– High Gas price, No Carbon tax sample
Coal
Gas
Other
$233/MWh Average Discharging Costs
560
$55/MWh Average Charging Costs
Coal units are the
primary resources for
storage charging.
Gas units contribute
primarily to storage
discharging.

15
32,610
930
1,010
40,380
-
5,000
10,000
15,000
20,000
25,000
30,000
35,000
40,000
45,000
Resources contributing to storage charging Resources displaced by storage discharging
En
erg
y G
Wh
Energy contribution towards storage – Low gas price, High Carbon tax sample
Coal
Gas
Other
$50/MWh Average Charging Costs
$170/MWh Average Discharging Costs
Gas units are the
primary resources for
storage charging.
Coal units contribute
primarily to storage
discharging.
As carbon costs increase, gas becomes
cheaper to dispatch than coal, and storage
charging occurs primarily with gas units.

Summary• Low capital costs for storage resources allow the most storage selection to occur.
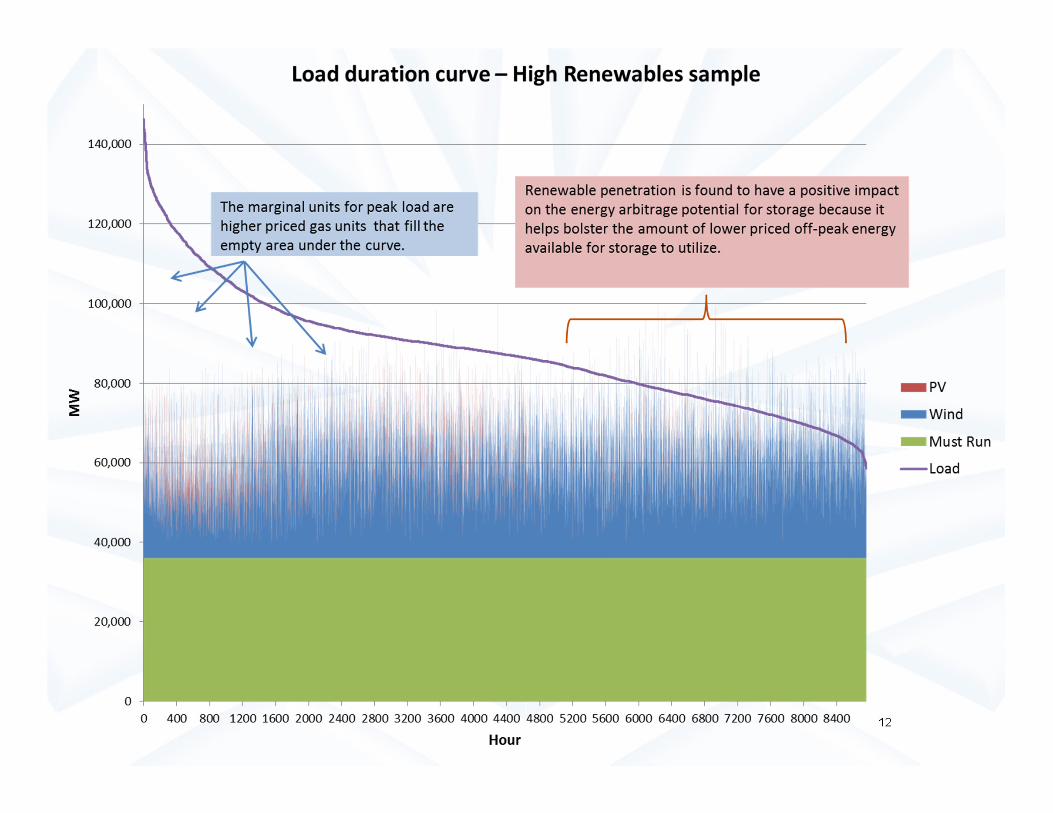
• Renewable penetration is found to have a positive impact on the energy arbitrage potential for storage because it helps bolster the amount of lower priced off-peak energy available for storage to utilize.
• Retirement of existing resources benefits storage up to a certain extent. When 23 GW of retirement comes solely from coal however, it negatively impacts the energy arbitrage potential because gas units become the marginal unit in the off-peak more frequently due to the lack of baseload generation.
• Carbon costs impact the system by reducing the storage potential when coal is the baseload resource and gas is the peaking resource. Under scenarios where gas prices remain low, high carbon costs make gas units ideal as baseload generation.
• This study only considers the energy arbitrage incentives along with planning reserve margin contributions. Further analysis is needed to explore the other financial opportunities available for storage, such as the Ancillary Services Market that could provide key incentives for battery and other fast-response, shorter term technologies in the intra-hour periods.
16
Additional questions? Please contact:
• Rao Konidena
• Clarence Bell
17
Follow Us!
@MISO_Energy