energy step ode osting studies analysis
TRANSCRIPT

BC Energy Step Code Costing Studies Analysis

i
ACKNOWLEDGEMENTS
This report is made possible by a financial contribution from Natural Resources Canada.
The review committee provided valuable input throughout the project.
Review Committee Membership
Wilma Leung BC Housing
Cassidy deVeer Canadian Home Builders’ Association Central Okanagan
Bahar Reza Canadian Home Builders’ Association Central Okanagan
Marika Luczi Canadian Home Builders’ Association Central Okanagan
Norm Connolly City of New Westminster and Technical Subcommittee Co-chair
Zachary May Province of British Columbia Building and Safety Standards Branch
Dale Andersson Province of British Columbia Building and Safety Standards Branch
Maya Chorobik Community Energy Association
Chris McLellan Natural Resources Canada
Alycia Coulter Canadian Home Builders’ Association British Columbia
Vanessa Joehl Canadian Home Builders’ Association British Columbia
Rose Choy Canadian Home Builders’ Association Central Interior
Kelly Reid Canadian Home Builders’ Association Central Interior
Gary Hamer BC Hydro
Patric Langevin Natural Resources Canada
Bob Deeks Canadian Home Builders’ Association British Columbia
ii
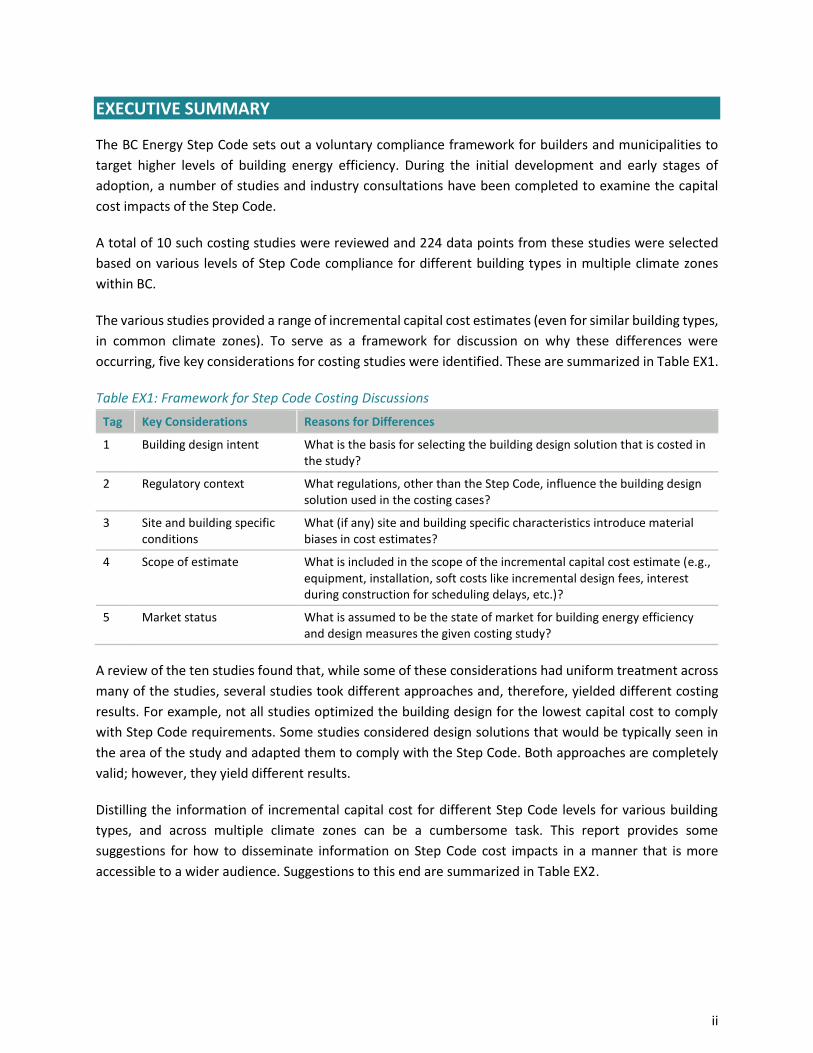
EXECUTIVE SUMMARY
The BC Energy Step Code sets out a voluntary compliance framework for builders and municipalities to
target higher levels of building energy efficiency. During the initial development and early stages of
adoption, a number of studies and industry consultations have been completed to examine the capital
cost impacts of the Step Code.
A total of 10 such costing studies were reviewed and 224 data points from these studies were selected
based on various levels of Step Code compliance for different building types in multiple climate zones
within BC.
The various studies provided a range of incremental capital cost estimates (even for similar building types,
in common climate zones). To serve as a framework for discussion on why these differences were
occurring, five key considerations for costing studies were identified. These are summarized in Table EX1.
Table EX1: Framework for Step Code Costing Discussions
Tag Key Considerations Reasons for Differences
1 Building design intent What is the basis for selecting the building design solution that is costed in the study?
2 Regulatory context What regulations, other than the Step Code, influence the building design solution used in the costing cases?
3 Site and building specific conditions
What (if any) site and building specific characteristics introduce material biases in cost estimates?
4 Scope of estimate What is included in the scope of the incremental capital cost estimate (e.g., equipment, installation, soft costs like incremental design fees, interest during construction for scheduling delays, etc.)?
5 Market status What is assumed to be the state of market for building energy efficiency and design measures the given costing study?
A review of the ten studies found that, while some of these considerations had uniform treatment across
many of the studies, several studies took different approaches and, therefore, yielded different costing
results. For example, not all studies optimized the building design for the lowest capital cost to comply
with Step Code requirements. Some studies considered design solutions that would be typically seen in
the area of the study and adapted them to comply with the Step Code. Both approaches are completely
valid; however, they yield different results.
Distilling the information of incremental capital cost for different Step Code levels for various building
types, and across multiple climate zones can be a cumbersome task. This report provides some
suggestions for how to disseminate information on Step Code cost impacts in a manner that is more
accessible to a wider audience. Suggestions to this end are summarized in Table EX2.

iii
Table EX2: Cost Study Communications Guidelines
Tag Suggestion Description
1 Discuss the goals of the study
Clearly describing the goals of the study allows consumers or other non-technical audiences to put the information into context.
2 Describe major assumptions
Providing transparency on the basis of building design, regulatory context, site specific conditions, and market status assumed in the study will help readers reconcile the differences with other reports.
3 Use graphical representation, ranges, and group buildings/ climate zones
There are inherent challenges in identifying one discrete point to represent the incremental capital cost. Presenting the information in terms of a range may better reflect the level of certainty related to the incremental cost for Step Code compliance. Presenting the ranges graphically may help make the information more easily understood. Capturing the cost premium for groups of buildings or climate zones on one chart may be simpler for all audiences to digest.
4 Put it in context The total cost of a new home includes capital cost (i.e., construction costs), land costs, fees, taxes, other soft costs, etc. Both the incremental capital cost and how this relates to the total cost of home ownership are both relevant pieces of information. In addition, the ongoing energy cost savings is also relevant to stakeholders, putting the upfront investment into a context of ongoing savings to long-term owners or tenants.
Lastly, this report provides guidance on the level of transparency future costing studies should provide.
Our recommendations for costing study guidelines were disclosure based, as opposed to a prescriptive
approach. This allows for flexibility in costing studies to address the priorities of specific stakeholders,
while enabling readers to better understand, and potentially reconcile differences with other costing
studies.
As the BC Energy Step Code continues to roll out across the Province, additional costing exercises by
Government, industry, consumer groups etc. will emerge. For those working on future costing studies,
this report can serve as a summary of the costing work completed to date, to provide guidelines on the
level of transparency a study should provide in order to compare results of one study against another,
and a basis for how to communicate the results to be more accessible to a wider audience.

iv
TABLE OF CONTENTS
Acknowledgements ........................................................................................................................................ i
EXECUTIVE SUMMARY .................................................................................................................................. ii
Table of Contents ......................................................................................................................................... iv
1. Introduction ........................................................................................................................ 1
1.1 Study Purpose and Objectives ............................................................................................ 1
1.2 List of Studies Reviewed ..................................................................................................... 1
2. Data ..................................................................................................................................... 3
3. Analysis ............................................................................................................................. 14
3.1 Building Design Intent ....................................................................................................... 15
3.2 Regulatory Context ........................................................................................................... 17
3.3 Building and Site Specific Conditions ................................................................................ 18
3.4 Scope of Estimate ............................................................................................................. 19
3.5 Market Status .................................................................................................................... 19
4. Discussion ......................................................................................................................... 21
4.1 Performance Gap .............................................................................................................. 21
4.2 GHG Impacts ..................................................................................................................... 22
4.3 Implications on Utility Providers ....................................................................................... 23
4.4 Incremental Construction Costs in Context ...................................................................... 23
5. Recommendations ............................................................................................................ 26
5.1 Cost Study Disclosure Guidelines ...................................................................................... 26
5.2 Communication of Step Code Costing Results .................................................................. 30
5.3 Related Costing Studies, Tools, and Ongoing Step Code Policy Development ................. 32
Appendix A: List of Studies
Appendix B: Data Points Analyzed
Appendix C: Interviews Conducted

1
1. INTRODUCTION
The BC Energy Step Code was introduced in 2017 and sets out a voluntary compliance framework for
builders and municipalities to target higher levels of energy efficiency. The Step Code targets reductions
in energy use towards a net-zero ready level in 2032 under the CleanBC strategy.
The BC Energy Step Code is an optional compliance path under the BC Building Code and can be adopted
by local municipalities. This approach enables local governments to choose the most appropriate targets
locally, and requires the development of local information sources to allow local governments to
understand impacts of the BC Energy Step Code.
During the initial development of the BC Energy Step Code and the early stages of local adoption, several
studies and industry consultations have been completed to examine the cost impacts of the Step Code.
However, many of those studies take different approaches in key elements, leading to different
conclusions. The current study looks to analyze and summarize the key differences and similarities in
approach between these previous costing studies in order to provide advice and guidance on how to
better gather and share cost information regarding the BC Energy Step Code, and also to provide advice
on how future studies can be improved.
1.1 Study Purpose and Objectives
The study is an analysis and comparison of previous costing studies completed around the BC Energy Step
Code, with three objectives:
• Following economic analysis best practices, provide a detailed understanding of the source(s) of,
or reason(s) for, differences in the findings of existing costing studies regarding the incremental
capital construction costs of building to the BC Energy Step Code.
• Provide advice or guidance on how to better gather and share information about the cost impacts
of the BC Energy Step Code.
• Provide advice or guidance on how future studies can be improved to consider multiple
perspectives, provide data that can be compared more easily across different studies, and
improve the study validity.
1.2 List of Studies Reviewed
Most of the studies chosen for the costing review focused on specifically the BC Energy Step Code.
However, several other studies were included as they provided information that is relevant to this
exercise. These other studies provide additional data points for looking at energy savings or net-zero ready
construction in other target frameworks and locations to provide a wider range of information. Additional
information on the studies reviewed is available in Appendix A.

2
Table 1: List of Studies Considered
Tag Study Name Commissioned By
1 Energy Step Code 2017 Metrics Research BC Housing, in partnership with BC Hydro, the BC Building and Safety Standards Branch, the City of Vancouver, and Natural Resources Canada
2 Energy Step Code 2018 Metrics Research
3 Energy Step Code: A Study by Industry for Consumers Canadian Home Builders’ Association Central Okanagan
4 Energy Step Code: How it works Canadian Home Builders’ Association Central Interior
5 The Economics of Passive House: Costing Study on Passive House for Single Family Homes in Vancouver
City of Vancouver
6 City of Vancouver Zero Emissions Building Plan: Rezoning cost comparison – residential and Rezoning cost comparison - office
City of Vancouver
7 Getting to Zero: A High Performance Energy Policy for New Buildings in the City of Richmond
City of Richmond
8 City of Surrey - Step Code costing info City of Surrey
9 UBC Modelling Study: Residential Archetypes University of British Columbia
10 Making the Case for Building to Zero Carbon Canada Green Building Council (CaGBC)
Much of the data from the studies related to carbon-based green building policies (e.g., City of Vancouver
Zero Emissions Building Plan Costing, CaGBC’s study on Making the Case for Zero Carbon) proved to be
not directly applicable to this exercise. This is because these codes include a greenhouse gas intensity
(GHGI) metric in addition to a thermal energy demand intensity (TEDI) and total energy use intensity (TEUI)
metric. As such, it was not always possible to extract the incremental cost attributable to only the TEDI
and TEUI where cost information was provided. Where it was possible to decouple these costs, data were
extracted to inform this work; however, this was the circumstance in a minority of cases considered.

3
2. DATA
From the ten studies listed in Table 1, 224 cost estimate data points were collected for review. Some
studies considered multiple building types in multiple climate zones; others provided cost estimates for a
smaller subset. A full list of data points is available in Appendix B.
The review of cost estimates focused on information for Climate Zones 4 and 5 only. This was because no
other studies aside from the Energy Step Code 2017 and 2018 Metrics Research looked at incremental
construction cost outside of these climate zones.
Table 2 provides a summary of the number of cost estimates extracted for this review by building type
and split between Climate Zones 4 and 5.
Table 2: Grouping of Cost Estimates Extracted by Building Type and Climate Zone
Building Type Climate Zone 4 Climate Zone 5 Total
Aggregate of All 1 – 1
Commercial 9 6 15
High-Rise Multi-Unit Residential Building (MURB) 48 8 56
Low-Rise Multi-Unit Residential Building (MURB) 15 8 23
Townhomes 15 20 35
Single Family – Large 14 15 29
Single Family – Med 16 15 31
Single Family – Small 14 20 34
Total 132 92 224
It should be noted that these cost estimates were not validated as part of the costing review. The purpose
of the review is to summarize the data that exists, explain why there are differences, and inform future
best practice guidelines on costing.
Range of Estimates
Where available, the study team harnessed a low, mid, and high estimate by building type and by climate
zone from each of the studies. Some studies provided a range of estimates with low, mid, and high values;
others provided discrete points only. Almost all studies provided cost estimates by building type and by
climate zone.
In compiling all the cost estimates harnessed from the various studies, a range of estimates was gathered
for the incremental capital cost (ICC) by Step Code level. Generally speaking, and not surprisingly, ICCs
increase with Step Code levels. What the aggregation of these data points also show is that the range of
estimates also grows the higher the Step Code level.
4
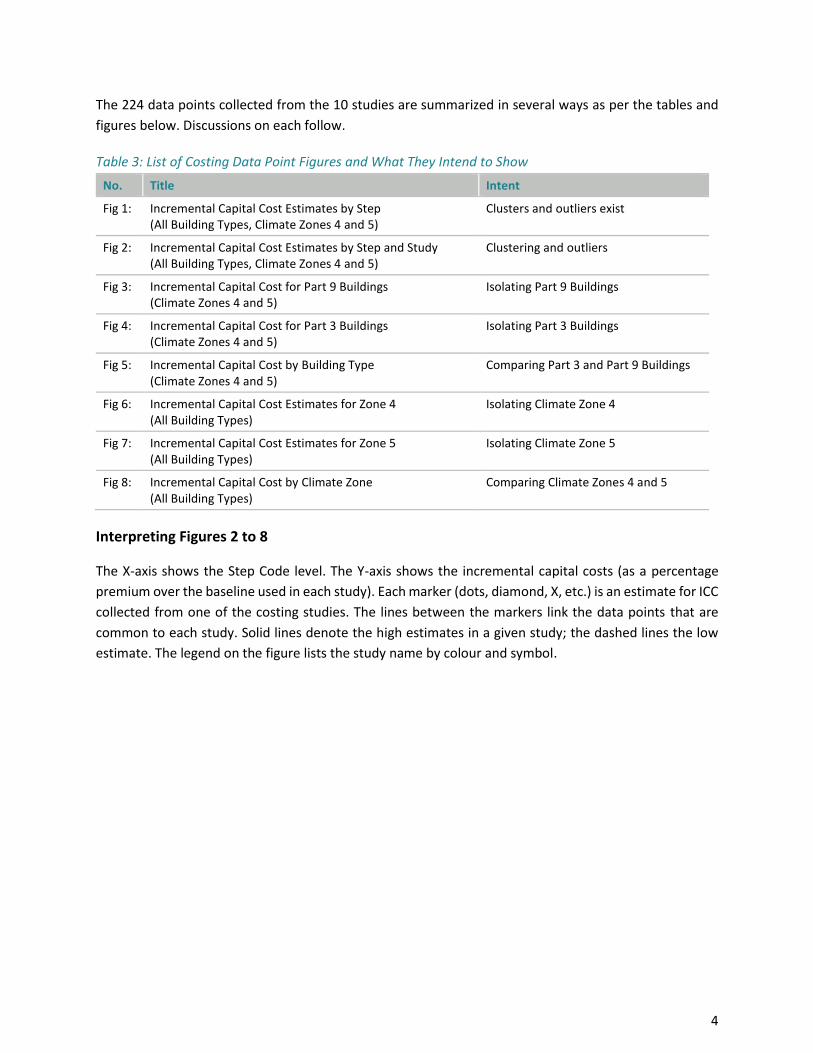
The 224 data points collected from the 10 studies are summarized in several ways as per the tables and
figures below. Discussions on each follow.
Table 3: List of Costing Data Point Figures and What They Intend to Show
No. Title Intent
Fig 1: Incremental Capital Cost Estimates by Step (All Building Types, Climate Zones 4 and 5)
Clusters and outliers exist
Fig 2: Incremental Capital Cost Estimates by Step and Study (All Building Types, Climate Zones 4 and 5)
Clustering and outliers
Fig 3: Incremental Capital Cost for Part 9 Buildings (Climate Zones 4 and 5)
Isolating Part 9 Buildings
Fig 4: Incremental Capital Cost for Part 3 Buildings (Climate Zones 4 and 5)
Isolating Part 3 Buildings
Fig 5: Incremental Capital Cost by Building Type (Climate Zones 4 and 5)
Comparing Part 3 and Part 9 Buildings
Fig 6: Incremental Capital Cost Estimates for Zone 4 (All Building Types)
Isolating Climate Zone 4
Fig 7: Incremental Capital Cost Estimates for Zone 5 (All Building Types)
Isolating Climate Zone 5
Fig 8: Incremental Capital Cost by Climate Zone (All Building Types)
Comparing Climate Zones 4 and 5
Interpreting Figures 2 to 8
The X-axis shows the Step Code level. The Y-axis shows the incremental capital costs (as a percentage
premium over the baseline used in each study). Each marker (dots, diamond, X, etc.) is an estimate for ICC
collected from one of the costing studies. The lines between the markers link the data points that are
common to each study. Solid lines denote the high estimates in a given study; the dashed lines the low
estimate. The legend on the figure lists the study name by colour and symbol.

5
Figures 1 and 2 Discussion: Clustering and Outliers
Figures 1 and 2 show that when the cost estimates from the 10 studies are plotted (for all building types
and Climate Zones 4 and 5), a clustering effect is evident. Based on the cost estimates compiled, many of
the studies show an incremental capital cost for Step 1 in the order of 0% to 1.5% and on the order of 3%
to 10% for Step 4 (for all building types in Climate Zones 4 and 5).
In addition to the clustered data, some outlier data points exist. Compared to the clustered data points,
the highest outlier cost estimate is significantly higher, at more than double at each Step Code level.
Discussion on possible reasons for these differences is provided in Section 3.

6

7

8
Figures 3, 4 and 5 Discussion: Isolating by Part 3 and 9 Buildings
The BC Building Code regulates buildings in two main categories: simple buildings and complex buildings,
commonly called Part 9 and Part 3 Buildings respectively. In general, a single-family home is a good
example of a Part 9 Building, while a shopping mall is an example of a Part 3 Building.

9
Part 3 Buildings are all buildings over 3 storeys in height or over 600 m2 in footprint area; buildings 3
storeys or less in height or under 600 m2 that are of a specific use; buildings intended for public gatherings,
residential care, detention or high-hazard industrial activities; and some larger buildings intended for
residential, commercial or medium-to-low hazard industrial activities.
Part 9 Buildings are most buildings 3 storeys and under in height and with a footprint area of 600 m2 or
less. They are small buildings intended for residential, commercial or medium-to-low hazard industrial
activities.1
Figure 3 isolates the incremental capital cost for Part 3 Buildings showing that the data generally suggest
more of an escalating rate of increase from one step to the next.
Figure 4 isolates the cost estimates for Part 9 Buildings and shows the data generally suggest the
incremental capital cost by Step Code level is more of a linear relationship.
Figure 5 compares the high and low estimates for the different building types and shows that the range
of estimate is much greater, and the high estimates are higher for Part 3 Buildings. The low estimates for
Part 3 and 9 Buildings closely coincide.
1 Description of Parts 3 and 9 in the building code from Building Act Guide Series: Section A1, Understanding B.C.’s Building Regulatory System,
Office of Housing and Construction Standards, June 2015.

10

11
12
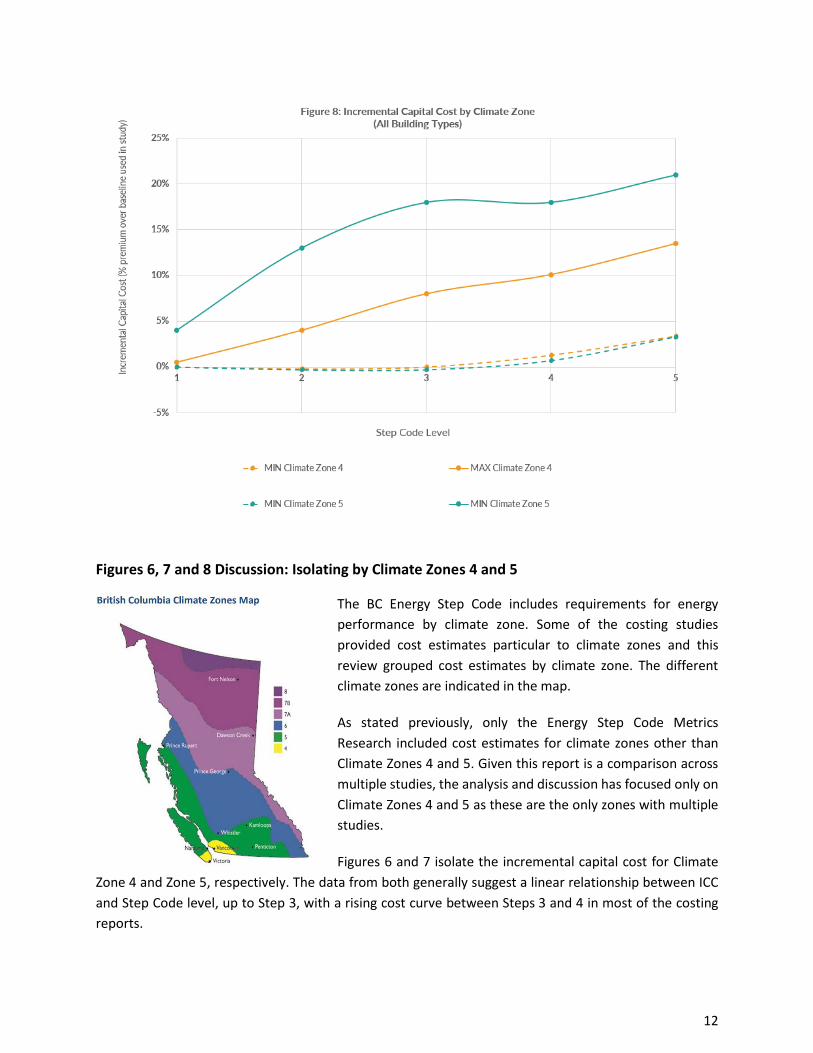
Figures 6, 7 and 8 Discussion: Isolating by Climate Zones 4 and 5
The BC Energy Step Code includes requirements for energy
performance by climate zone. Some of the costing studies
provided cost estimates particular to climate zones and this
review grouped cost estimates by climate zone. The different
climate zones are indicated in the map.
As stated previously, only the Energy Step Code Metrics
Research included cost estimates for climate zones other than
Climate Zones 4 and 5. Given this report is a comparison across
multiple studies, the analysis and discussion has focused only on
Climate Zones 4 and 5 as these are the only zones with multiple
studies.
Figures 6 and 7 isolate the incremental capital cost for Climate
Zone 4 and Zone 5, respectively. The data from both generally suggest a linear relationship between ICC
and Step Code level, up to Step 3, with a rising cost curve between Steps 3 and 4 in most of the costing
reports.

13
Figure 8 compares the high and low estimates for the different zones and shows that the range of estimate
is much greater, and the high estimates are higher for Climate Zone 5. The low estimates for Climate
Zones 4 and 5 closely coincide.
These finding closely mirror the findings by looking at the data by building type (e.g., comparing Part 3
and 9). This is largely attributed to the fact that most of the Climate Zone 4 data points are Part 3 Buildings
and most of the Climate Zone 5 Buildings are Part 9 Buildings.

14
3. ANALYSIS
The framework used to analyze the costing studies and to develop the costing best practice framework is
summarized in Table 3.
This framework was developed as a means of capturing and categorizing the main parameters on which
a costing study is based. The intent is that if all of the parameters in the framework were aligned, one
could have a true ‘apples to apples’ comparison across all of the studies.
This framework is used first to discuss differences between the studies, and then to develop a best
practice guideline for future costing studies.
Table 3: Framework for Step Code Costing Review and Best Practice Guidelines
Tag Parameter Description
1 Building design intent Relates to the design intend for the building references in the costing study. Possible basis for the building design includes:
- Solution with the lowest capital cost.
- Solution with the lowest life cycle energy cost.
- Solution with the lowest GHG abatement cost.
- ‘Typical’ solution seen or expected based on market demands.
It is likely that the construction cost of each of these solutions will be different. It is relevant to clarify what the design intent is for both the Baseline and Step Code compliant solutions. The incremental capital cost will differ based on which intent is used in a particular costing study.
2 Regulatory context Relates to the regulations, other than the Step Code, which may influence the building design solution used in the costing cases.
For example, zoning requirements or design panel reviews may demand specific architectural treatment (e.g., more or less glazing, articulation, or envelope penetrations such as eyebrows or balcony attachments). These will all have TEDI and incremental capital cost impacts not directly attributable to Step Code regulations.
Clarifying what other regulatory requirements are applied for the Baseline and Step Code compliant solution is critical to getting data on cost premiums directly attributable to the Step Code only.
3 Building and site-specific conditions
Relates to building and site-specific characteristics that may introduce material biases in cost estimates. Examples include constraints on building massing or orientation due to site specific conditions, and building/ground interface (i.e., slab-on-grade or basement construction, relevant for Part 9 Buildings).
Unique site-specific conditions assumed in the costing cases can have a material impact on the ICC estimates.
15
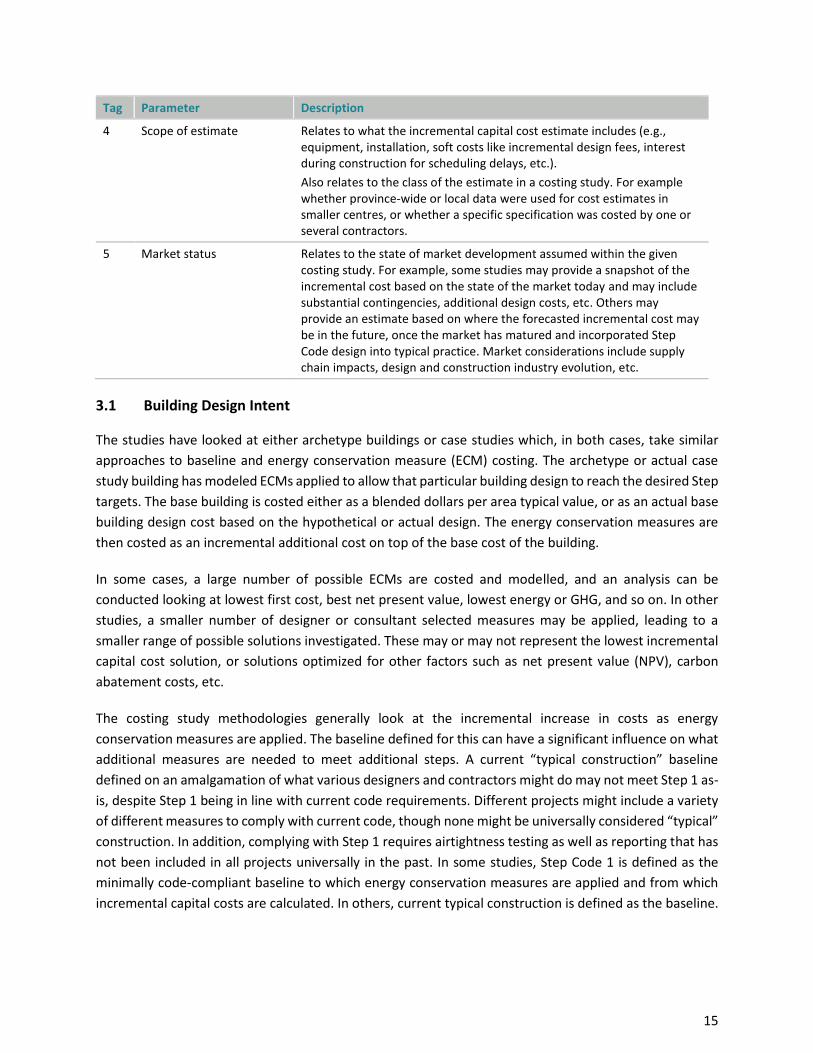
Tag Parameter Description
4 Scope of estimate Relates to what the incremental capital cost estimate includes (e.g., equipment, installation, soft costs like incremental design fees, interest during construction for scheduling delays, etc.).
Also relates to the class of the estimate in a costing study. For example whether province-wide or local data were used for cost estimates in smaller centres, or whether a specific specification was costed by one or several contractors.
5 Market status Relates to the state of market development assumed within the given costing study. For example, some studies may provide a snapshot of the incremental cost based on the state of the market today and may include substantial contingencies, additional design costs, etc. Others may provide an estimate based on where the forecasted incremental cost may be in the future, once the market has matured and incorporated Step Code design into typical practice. Market considerations include supply chain impacts, design and construction industry evolution, etc.
3.1 Building Design Intent
The studies have looked at either archetype buildings or case studies which, in both cases, take similar
approaches to baseline and energy conservation measure (ECM) costing. The archetype or actual case
study building has modeled ECMs applied to allow that particular building design to reach the desired Step
targets. The base building is costed either as a blended dollars per area typical value, or as an actual base
building design cost based on the hypothetical or actual design. The energy conservation measures are
then costed as an incremental additional cost on top of the base cost of the building.
In some cases, a large number of possible ECMs are costed and modelled, and an analysis can be
conducted looking at lowest first cost, best net present value, lowest energy or GHG, and so on. In other
studies, a smaller number of designer or consultant selected measures may be applied, leading to a
smaller range of possible solutions investigated. These may or may not represent the lowest incremental
capital cost solution, or solutions optimized for other factors such as net present value (NPV), carbon
abatement costs, etc.
The costing study methodologies generally look at the incremental increase in costs as energy
conservation measures are applied. The baseline defined for this can have a significant influence on what
additional measures are needed to meet additional steps. A current “typical construction” baseline
defined on an amalgamation of what various designers and contractors might do may not meet Step 1 as-
is, despite Step 1 being in line with current code requirements. Different projects might include a variety
of different measures to comply with current code, though none might be universally considered “typical”
construction. In addition, complying with Step 1 requires airtightness testing as well as reporting that has
not been included in all projects universally in the past. In some studies, Step Code 1 is defined as the
minimally code-compliant baseline to which energy conservation measures are applied and from which
incremental capital costs are calculated. In others, current typical construction is defined as the baseline.

16
For CHBA Central Okanagan study, the Step 1 incremental capital cost is assessed as $11,392 for the small
single-family house, and between $19,399 and $21,639 for the medium single-family house (2% to 4%).
For the Energy Step Code Metrics Research reports, the incremental cost to achieve Step 1 for Part 9
Buildings was more typically around $1,000 - $2,000 (0.2% to 0.4%.)
However, comparing the ECMs and targets between these two studies, there is a significant difference in
the measures targeted to achieve Step Code targets, with increased stringency in the measures
implemented in the CHBA study compared with the Metrics Report.
There are some differences in the building archetype that may be contributing to the more stringent and
costly ECMs required for the CHBA study, for example in the case of a medium single family home, the
Energy Step Code Metrics Research has a 2-storey, 237 m2 home with basement, compared with a ranch
style 267 m2 single storey with walk out basement and attached garage in the CHBA study. The presence
or absence of cooling may contribute to differences between archetypes, though the Step Code does
include a MEUI allowance for Part 9 homes that install cooling.
The incremental capital cost to achieve Step 5 for the medium single family dwelling for Climate Zone 5 in
the Energy Step Code Metrics Research report was 3.3% or approximately $17,100. The incremental
capital cost for the medium single family dwelling for Climate Zone 5 in the CHBA report was 10.5%, or
approximately $53,000. The lowest cost CHBA Step 5 option is $45,683, and includes a total of $11,474 of
soft costs such as energy advisor, administration, site supervisor, additional design fees, and a 12%
management fee. The exclusion of these items would still leave approximately a $17,100 increase
between the Energy Step Code Metrics Research value for this archetype and the CHBA study. The
upgraded windows to USI 0.8 are the largest single cost item, at just over $15,000, followed by R5 exterior
insulation at $5,150. The Step 5 medium single family dwelling in the Energy Step Code Metrics Research
report included USI 1.2 windows (an approximate $5,000 savings versus the USI 0.8 in the CHBA report),
but had higher wall and roof insulation levels that would likely equalize or overshadow that cost, based
on the other additional insulation costs listed in the CHBA report. There are several individual ECMs that
were not required in the Step Code report for this archetype, likely due to the different building typology
and specific building design.
The use of different building designs and floor areas in each study creates challenges in comparing the
findings of different studies. The sizes of small, medium, and large single family dwellings are varied
between studies. In most studies, what type of area (gross, finished, etc.) under consideration is not clear;
however, even beyond that, the Energy Step Code Metrics Research considers a small single family
dwelling to be approximately 100 m2, whereas the CHBA Central Okanagan study considers a small single
family dwelling to be approximately 215 m2, which is more than double the Energy Step Code Metrics
Research report’s size. The medium single family dwelling is much more comparable between the two.
The large single family in the CHBA Central Interior study uses 372 m2, whereas the large single family in
the Energy Step Code Metrics Research report is 511 m2. Many of the energy uses in a home, such as
kitchen and laundry, are the same regardless of dwelling size, and cause a larger area-weighted load in
smaller homes. The BC Energy Step Code includes an adjustment to targets based on the size of Part 9

17
dwellings to account for this, however the variations in building size between studies can make it difficult
to directly compare across studies. The sizes of Part 3 buildings are not expected to be a major driver of
ECMs or costs, and are not expected to be a major factor in differences between studies.
Beyond this, there are some obvious baseline differences in some of the studies considered; some use the
Vancouver Zero Emissions Building Plan, UBC REAP, or others as the relevant baseline under
consideration. These baselines are different at face value, but may contribute some understanding to the
general costing and net-zero energy ready (NZER) discussion. This difference should be kept in mind.
3.2 Regulatory Context
The BC Energy Step Code addresses the energy performance of buildings and works within a regulatory
context of the BC Building Code (BCBC), as well as other conditions such as rezoning requirements and
design review panels imposed by municipalities. Building projects must balance both the Step Code
requirements and other Building Code requirements in their designs. These regulatory contexts may be
universal throughout the province (BCBC) or local (zoning, rezoning, or design review recommendations).
The potential push/pull of these other requirements may lead projects or costing case studies to adopt
designs that need additional energy measures to reach Step Code targets.
For example, single family homes in Kelowna are asked to design with
a certain amount of articulation under Kelowna’s Official Community
Plan Urban DP Guidelines2. This increases their exterior envelope area,
leading to more heat loss and requiring other improvements to make
up for that increased heat loss. In other cases, a design review panel
might ask a project to increase window areas in certain locations, or
might make recommendations around elements such as balconies or
eyebrows that could increase thermal bridging.
While these factors are not expected to prevent buildings from
achieving Step Code targets, they can affect the measures used in
costing studies depending on how they are accounted for and how
these conditions are adapted to by the design. The measures selected to meet these regulatory
requirements would impact the costs to achieve a particular step. It is often difficult to separate the
regulatory context from building and site specific conditions discussed in the next section, or to separate
the regulatory context from the particular design or archetype design investigated, since the “typical”
design is likely informed by the regulations and experience of local designers and builders. This can create
difficulty in accurately comparing studies and identifying the causes of discrepancies. Following the
articulation example above, it appears that the typical home in Kelowna would have more articulation
than some jurisdictions may require. This may be considered simply a feature of “typical design” in the
2 City of Kelowna Official Community Plan, Chapter 14 Urban Design Panel Guidelines, Revised December 5 2017, https://apps.kelowna.ca/CityPage/Docs/PDFs/Bylaws/Official%20Community%20Plan%202030%20Bylaw%20No.%2010500/Chapter%2014%20-%20Urban%20Design%20DP%20Guidelines.pdf
Figure 1. Kelowna Urban DP Guidelines on articulation

18
region by designers and builders. However, further investigation into whether that “typical” is appropriate
as higher Steps are targeted or why a different typical archetype or case study design may be chosen in a
different context can yield information pointing to the regulatory context as the cause.
In the case of the studies analyzed, it is not clear what elements of the design are attributable to regulatory
conditions versus design choices to represent a typical archetype in the relevant region and building type.
In the example of the CHBA Okanagan study, the City of Kelowna’s requirements for added articulation
were noted by CHBA as one element affecting the design case studies chosen. Increased envelope area
per floor area would increase the energy use of the building and would require additional design measures
to achieve Step Code targets, however the impact of this specific requirement was not quantified.
3.3 Building and Site Specific Conditions
The massing of a building also makes a significant difference in what measures are needed to reach
targets. In a single-family dwelling, the presence of a basement versus slab-on-grade construction can
make it much easier for homes of the same size to hit targets using the same energy conservation
measures as less heat is lost to the outdoor air when much of the habitable area is below grade.
In Part 3 multi-unit residential buildings (MURBs), the massing can be represented using the “vertical
surface to floor area ratio” (VFAR). Most heat loss for these buildings occurs through the vertical exterior
envelope (walls and windows), so this factor is used to understand how massing correlates with TEDI. The
Energy Step Code Metrics Research reports look at several VFAR options but use a VFAR of 0.6 for
incremental costing. Other studies would potentially achieve very different results using a different VFAR.
As noted in the Step Code Metrics reports, a reduction in VFAR from 0.6 to 0.5 would lead to a 20% TEDI
savings in Climate Zone 4. The City of Richmond report used approximately 0.4 VFAR.
Some ECMs are inherently more cost effective than others, but may or may not be palatable to designers
and developers for other reasons. For example, designing with reduced VFAR or reducing or eliminating
balconies can provide considerable energy savings and potentially even cost savings; however, these
measures may not align with developer’s expectations of market demand.
Similarly, ECMs included in some of the costing studies were pursued for reasons unrelated to Step Code
compliance. For example, some studies use radiant floor heating in the Step Code case, but hydronic
baseboard terminal units in the baseline case. This results in inflating the incremental capital cost of Step
Code compliance. In-floor heat may be pursued for thermal comfort reasons, which is different than
strictly BC Energy Step Code compliance. Those ECMs add incremental cost without adding significant
energy benefit and can skew results towards showing higher costs. As discussed further in section 5 of
this report, the incremental capital costs included in Step Code costing studies should be solely that
attributable to Step Code, and should separate this cost from other design measures which may be
undertaken for purposes other than meeting Step Code targets.

19
3.4 Scope of Estimate
In developing an incremental capital cost of construction estimate, different studies may include different
elements. In general, studies would be expected to include equipment purchases and installation, and
may include soft costs (increases in design fees), contingency, and scheduling delays.
Many studies look at not only the increase in capital costs, but also at ongoing energy cost savings over
the life of the building. In considering life cycle costing, studies would typically include current utility rates
with an assumed escalation rate of increasing utility costs over time, an assumed discount rate of money
over time, and a fixed life cycle length (number of years). Life cycle costing included in the studies varies
in whether and how it accounts for variations in the life of equipment and changes to maintenance costs
of equipment, with some assuming a fixed life, and equalizing all measures (essentially discounting longer
lifetime measures such as envelope, and boosting shorter lifetime measures such as lighting and HVAC
systems).
Incremental capital costs of construction are typically calculated by developing either a case study or
archetype building to use as the baseline cost, and then applying incremental design changes to achieve
the desired energy targets. The design measures would be individually costed; however, measures may
be reported as either a separate cost for each item, may be grouped together into a single number, or
may be grouped with some granularity (e.g., envelope versus mechanical system measures).
The source of cost data varies between studies. For example, the Energy Step Code Metrics Research
reports use industry-wide survey cost data from Altus Canadian Construction Guide reports as their
baseline costs, and then use incremental costs for individual measures provided by a cost consultant for
Part 3 Buildings, and reported industry average cost data modified by consultants where industry averages
did not appear to match project experience for Part 9 Buildings. The CHBA Kelowna study, by contrast,
developed a specification as well as energy conservation measures and had both the baseline design and
the ECMs costed by a number of contractors. Additional methods might include looking at actual project
costs for a case study, and using other sources of typical pricing such as RSMeans© databases or other
cost databases.
3.5 Market Status
One significant impact on the outcome of costing studies appears to be the extent to which market
transformation is assumed to occur. Market transformation does not necessarily represent reductions in
the cost of a particular ECM; for example, with an assumption that a particular glazing type would be less
costly in 10 years, which would be difficult to substantiate and has not been included in the studies that
were reviewed.
Instead, the market transformation factor addresses whether additional design costs or delays are
accounted for, and may also address elements that could overlap with the building-specific and site-
specific conditions, such as building massing. Overall, market transformation considers whether the study
applies individual energy conservation measures to buildings as they are designed today and adds

20
contingencies for more stringent design and construction requirements, or whether the study includes
typical design and construction processes adapting to the new typical practice under the BC Energy Step
Code, absorbing those potential additional design costs and contingencies.
In addition, if market transformation is expected, then a costing study might anticipate that some
integrated design process is used and passive design optimization measures are included, particularly in
higher steps such as allowing for more efficient massing at higher steps.
A study assuming market transformation prior to adoption of higher steps may not incorporate additional
design fees or additional schedule delays, assuming that by the time those higher steps occur, the industry
will have developed methods for achieving those steps and they will be in more common practice. This is
the approach that was followed in the Energy Step Code Metrics Research studies, supported by research
showing that design costs have not typically been impacted in a lasting way by previous energy code
changes.
The CHBA studies (Central Interior and Central Okanagan) investigate the impacts of higher steps based
on current typical construction practice and allow for schedule delays, additional design fees, and
contingency. For example, for the medium single-family home, the CHBA Okanagan study accounts for
almost $12,000 in such additional soft costs including schedule delays, additional design fees, and a 12%
management fee, whereas the Step Code Metrics reports account for a maximum of $3,600.
A study that is considering local government adoption of those higher steps today, or one for industry
bodies looking at the potential impacts of those higher steps today, may include those additional costs
compared with typical design and construction practices, rather than allowing for some market
transformation over the period between now and the 2032 net-zero ready target date. On the other hand,
a study looking at the likely impacts of those same policies and steps coming into place over the next
decade might well want to allow for some market transformation to have occurred over that time.

21
4. DISCUSSION
The cost studies reviewed looked primarily at the incremental capital cost to build a Step Code compliant
building. However, the full cost (and benefit) of a Step Code compliant solution is not fully captured by
looking at the incremental capital cost alone.
Future costing studies may wish to broaden the scope of analysis to include a systems level perspective
on Step Code impacts. Some of these additional considerations are discussed below.
4.1 Performance Gap
Step Code compliance is tied to energy modelling results, not actual building operations. While a building
may be modelled to meet a certain energy use requirement, in practice it may or may not actually achieve
this target.
What has been observed in the buildings industry, almost universally since energy modelling programs
began as tools to assist with building design, is that actual energy use in buildings is higher than energy
use predicted in energy models and, in many cases, are much higher. A recent study commissioned by
Sidewalk Labs looked at the performance gap across approximately 100 MURBs in the Greater Toronto
area. What they found was that space heating (strongly correlated with TEDI) differed by approximately
40% between actual and modelled energy use. This was on average, and many saw a much larger
performance gap. Domestic hot water (correlated with TEUI) differed by approximately 20%3. Others cite
smaller performance gaps. Almost all cite higher actual uses than modelled energy use.
The BC Energy Step Code references energy modelling guidelines that endeavour to resolve many of the
shortcomings of previous energy modelling practices (in terms of predicting energy use). However,
because very few building designs with these new energy modelling guidelines have actual energy use
data, there is little evidence to support that the performance gap has been fully addressed at this time.
In addition to incremental capital cost, future studies may wish to gather data to reconcile any differences
that may exist between modelled and actual energy use, allowing more confidence in assessments of
long-term benefits and payback periods. This will help inform the efficacy of the BC Energy Step Code on
actual energy and climate outcomes.
It should be noted that this shortcoming is not particular to the Step Code alone. Virtually all building
codes and green building policies use modelled energy use as the compliance metric. Improvements in
energy modelling guidelines are helping to close the performance gap; however, without some form of
compliance during building operations, uncertainty as to whether regulation meets its desired objective
the will likely remain.
3 Sidewalk Labs Toronto Multi-Unit Residential Buildings Study: Energy Use and the Performance Gap, EQ Building Performance and Urban
Equation, January 2019

22
4.2 GHG Impacts
The BC Energy Step Code is a fuel neutral code and does not control for the more sensitive parameter in
dictating the GHG profile of a building – the type of fuel used.
Because the code itself is silent on GHG outcomes, so too are most of the cost studies related to the Step
Code. Taking a wider lens on the issue and including GHG implications within future costing studies may
be of interest to the Province. The measures that achieve the greatest GHGI savings may have different
cost implications from those optimizing for energy or TEDI savings.
Regulating only the modelled energy performance of a building and ignoring the type of fuel used does
not guarantee low-carbon outcomes. As the 2018 Metrics report states,
“…it (is) even possible to have higher GHG emissions than a BCBC building by adopting Steps 3,
4, and even 5. This outcome is counter to the primary interests of the local governments who
are interested in adopting the Step Code and counter to the Province’s own climate policy.
The primary issue driving GHG increases is fuel choice. Where buildings shift away from
electricity and toward natural gas, GHG emissions will increase if overall energy use reductions
are not significant enough.”
A fuel neutral approach to regulating carbon emissions in buildings is not in line with many of the modern
building codes and green building policies that are being implemented in Canada and globally. In 2017,
the City of Vancouver adopted a Zero Emissions Building plan that includes a carbon emission
performance requirement (GHGI). Similarly, the City of Toronto introduced a Zero Emissions Building
Framework in 2017 that includes a GHGI. The Canadian Green Building Council now has a Zero Carbon
Building Standard that directly regulates carbon emissions. The US Green Building Council which
administers LEED® has introduced an alternate compliance pathway that is carbon based and has their
own Zero Carbon Building Standard in development. Building Research Establishment Environmental
Assessment Method (BREEAM), a prominent building code in the UK, has had a carbon metric for many
years. Building codes in several other European Union states are based on primary energy use, which takes
into account fuel choice and recognizes renewable fuels.
Governments and green building associations across the world are moving away from energy use as the
measure of building performance to regulating for carbon emissions, which will have implications on the
measures chosen for study as well as the cost outcomes.
Future studies may wish to report on the modelled (or actual) GHG performance of Step Code compliant
solutions. This information could be used to inform the correlation between Step Code levels and GHG
outcomes to inform future policy decisions.

23
4.3 Implications on Utility Providers
Building heating demand reduction and decarbonizing heat will have implications on third-party utility
providers (i.e., gas and electric grids). Generally speaking, decarbonization of heat will shift a large portion
of heat from the gas grid to the electric grid. When costing studies look only at the incremental capital
cost of a building, these upstream costs (and benefits) are ignored.
Future studies may wish to broaden the scope of analysis to consider the upstream impacts of a societal
shift in the way buildings in the province are heated and cooled. Some of these impacts may include:
• Implications on transmission and generation capacity for electricity.
• Implications on the gas grid, both in terms of the potential for stranded assets and the role of
renewable natural gas in a decarbonizing economy.
• Avoided costs for new development areas for avoiding the natural gas grid in communities.
4.4 Incremental Construction Costs in Context
Construction cost is one element of the upfront cost for a new home. Other upfront costs include land
costs, development costs, financing, community amenity contributions, taxes and permitting fees.
Understanding how material the incremental construction costs are in the overall cost of a building might
be something future costing studies may wish to consider. Table 5 puts the Step Code cost premium in
context with total upfront housing costs.
Table 5: Bookend Cost Estimates for Upfront Housing Costs
Cost Category Low Bookend [$/sf] High Bookend [$/sf]
Land 0 500
Community amenity contributions 75 150
Construction cost 250 500
Development cost 75 150
Financing costs 75 150
Taxes and permitting fees 25 50
Total upfront cost of housing 500 1,500
The high bookend housing cost is based on a market report for a high-end condominium on the Cambie
Corridor in Vancouver (see Figure 8 for a breakdown of the costs from that report). The low bookend
housing costs assume no value of land and one-half of all other costs from the same report (to serve as a
bookending exercise only).
Using these high and low bookend costs for buildings, Table 6 relates the high and low ICC from the costing
studies to these numbers. The low Step Code incremental cost is the lowest cost estimate in the cluster
of data points to realize Step 4 (across all building types and climate zones; Figure 1). The high Step Code

24
incremental cost is the highest cost estimate in the cluster of data points to realize Step 4 (across all
building types and climate zones; Figure 1).
Table 6: Incremental Construction Cost for Step Code 4 in Context with Other Upfront Housing Costs
Housing Costs
Low Bookend [$500/sf] High Bookend [$1,500/sf]
Incremental Construction Costs for Step 4 (from costing studies)
Low [1%] 0.5% 0.3%
High [10%] 5.0% 3.3%
This comparison assumes that the percentage cost premium remains the same across the spectrum of
total upfront housing costs, which may or may not be the case. As a percentage, the low ICC of 1% for a
Step 4 building may not be 1% for a building with $250 per square foot construction costs. Similarly, the
high ICC of 10% may not be 10% for a building with $500 per square foot construction costs. This is a
“bookend-ing” exercise only to show the relative magnitude of the high and low ICC in context with high
and low overall building costs.
This study takes no position on whether these costs are high or low in the context of total upfront cost of
home ownership. Some consumers, may argue that even $1 more on the cost of a home in an already
unaffordable housing market is too much. Others may see the cost premium of < 5% on the total cost of
ownership in all cases as a modest amount. It is up to the consumers and public policy makers to
determine if the energy cost savings and public benefits that the BC Energy Step Code delivers warrant
these incremental costs.
This table only aims to put the incremental capital cost for construction in context with other housing
costs. It is provided as a suggestion for future costing studies to consider including this as part of the
information gathered and which the ICC is related to.

25
Image credit: MLA Advisory, from 2019 Market Intel Report4
Figure 8: Construction Cost Example Breakdown (High Bookend)
4 MLA Advisory, 2019 Market Intel Report, https://mlacanada.com/newsfeed/mla-advisory-market-intel-shares-2019-forecast. Accessed in
March 2019

26
5. RECOMMENDATIONS
The BC Energy Step Code is a voluntary framework and can be adopted by local governments, developers,
and others. It may be adopted at various times and steps across the province. Some of these jurisdictions
may also have unique existing regulations, climate conditions, or market constraints and adopters will
have a variety of competing priorities and interests. As such, any best practice framework for study costing
must be flexible enough accommodate for the various circumstances when a costing study is undertaken.
The recommendations in this report are centered on promoting disclosure and transparency in costing
studies, rather than offering prescriptive approaches to undertaking them. This is done so that costing
studies can serve the specific stakeholders’ interests, while ensuring the details on cost estimates are
clearly shown. This will allow others to compare and reconcile differences across studies should they
choose to do so.
5.1 Cost Study Disclosure Guidelines
Table 7 below provides guidance on what elements of costing assumptions should be clearly stated in
costing studies. This is so that audiences reviewing a given costing study will be able to compare the results
with other studies and put any differences in context.
In addition to acting as reporting guidelines, these disclosure guidelines can also be used to develop and
explore the initial goals and approaches of a study. This gives stakeholders a framework for discussing
how the study will be undertaken. They can be used by parties commissioning a study, consultants, review
committees, and other stakeholders to align their expectations and to allow more in-depth discussion at
the early stages of the costing study.
Table 7: Cost Study Disclosure Guidelines
Tag Name Description
1 Basis for building design The study should clearly state the rationale for selecting the building design (for both the baseline and Step Code compliance cases).
Possible basis for the building design includes:
- Solution with the lowest capital cost.
- Solution with the lowest life cycle cost.
- Solution with the lowest GHG abatement cost.
- ‘Typical’ solution seen or expected based on market demands.
- Other (please specify).
2 Regulatory context The costing study should clearly state if there are regulations, other than the BC Energy Step Code, which may influence the building design solutions used in the costing cases.
For example, a costing study undertaken by public sector organizations in BC may also be required to consider low carbon solutions given their carbon neutral mandate. Because low carbon outcomes are not a consideration of the BC Energy Step Code, this would be an additional consideration that these stakeholders may incorporate into the selection

27
Tag Name Description
of a building design solution. Stating this would provide relevant information for others comparing the outcomes of a study completed when looking at low carbon solutions in addition to fuel neutral solutions only.
Another example is if a building design solution that is costed is forced by other regulatory requirement to have unique characteristics which significantly affect energy use. Examples may include the need for unique form and massing, or building articulation on account of architectural considerations from design panel review, envelope penetrations, etc.
Similarly, if for some reason a stakeholder group is exempt from, or feels there is value in establishing a baseline for costing that does not satisfy the base building code, providing this information in the costing report is relevant for others to understand why the outcomes may differ between studies.
Lastly, the baseline code is dynamic. The minimum bar for what can be built outside of the Step Code will change at some point in time. Providing clarity on what version of the building code the baseline solution is based on is important information to disclose in a costing study.
3 Building-specific and site-specific conditions
While many building-specific and site-specific conditions exist that will influence the outcomes of a costing study, for simplicity two parameters are identified as the minimum ones to disclose. The building description should be provided, along with the description of individual energy conservation measures.
At a minimum the following two parameters should be clearly stated:
- Building massing (applicable for Part 3 Buildings). What is the VFAR for the building?
- Building/ground interface (applicable for Part 9). Does the building have a basement or is it slab-on-grade construction?
4 Scope of estimate
The study should clearly state whether and how the cost estimate includes the following:
- Equipment.
- Installation.
- Contingencies (particularly if a different contingency is used between the base building and Step Code compliant solution).
- Soft costs like incremental design fees for a Step Code solution.
- Scheduling delays attributable to Step Code requirements and the assumptions used (e.g., $X/month for X months of scheduling delays).
Cost estimates are expected to be broken down by envelope costs and energy system costs, or even more granularly by individual energy measure (where practical).
Envelope Costs: Includes costs for building envelope measures (windows, walls, doors, roof, etc.) and heat recovery ventilators (HRVs).
Energy System Costs: Includes costs for mechanical and electrical equipment in the building.

28
Tag Name Description
If the study considers operational or life cycle costs in addition to capital costs, they study should clearly provide the following information at a minimum:
- Annual energy use (by end-use and by fuel type or energy source).
- Operations and maintenance cost.
- Commodity (e.g., gas, electricity) forecast including the utility rate class, starting rate, escalation over time.
- Carbon pricing assumption.
- Expected life of equipment and plan for capital renewal if equipment needs to be renewed during the term of the analysis.
- Financing assumption.
- Tax treatment.
- Discount rate.
Lastly, the study should disclose how the cost estimate was developed and the class of estimate that was used (if applicable). One example of a cost estimate class system can be found here:
https://www.cca-acc.com/wp-content/uploads/2016/07/GuideCostPredictability.pdf
5 Market status The study should disclose what, if any, adjustment factors were used in any of the cost estimates to reflect the state of the market in developing the cost estimates for the given study. Examples might include contingency or increased design fees that may not be required once a market matures, or a study may assume more optimized design features (such as massing) than are typically seen in a particular market in anticipation that typical design evolving to meet Step Code targets.
For example the costing study may wish to simply categorize the estimates as being based on an immature, maturing, or fully matured state. Even this level of transparency on the basis for the cost estimate would help future readers compare differences across studies.
In Table 8, a sample cost bases is provided. This is an example of what could be set as the minimum level
of disclosure in a costing study that would allow audiences to interpret the data from a given study in the
context of the other costing work that exists.
The table also serves as a precedent that the Province may wish to adopt for their own internal costing
studies in order to establish consistency across the future costing they may do.

29
Table 8: Cost Study Disclosure Table – Example Approach
Tag Name Description
1 Basis for building design The study assumes that both the baseline and Step Code compliance cases were based on a solution that satisfies all BC Building Code 2012 (BCBC 2012) requirements.
Both the baseline and Step Code solutions to be optimized for the lowest construction cost to meet the code requirements.
Step 1 is used as the baseline for costing, with an allowance added for air leakage at Step 1, but no additional ECMs required to achieve Step 1 targets.
2 Regulatory context The costing study assumes compliance with BCBC 2012 as well as typical zoning and/or rezoning requirements in the region.
The costing study allows for balconies in the high-rise MURB, and significant articulation in the single-family dwelling.
BC Energy Step Code only was used as a requirement to inform the Step Code compliance solution.
3 Building-specific and site-specific conditions
Building massing (example for Part 3 Buildings).
Both the baseline and Step Code solutions that were costed used the same VFAR of 0.5.
Building/ground interface (applicable for Part 9):
- Two archetypes were costed, a small single-family residential modelled as slab-on-grade construction and a medium single-family residential with a basement.
Additional description of the archetypes would be provided in the report.
4 Scope of estimate
The incremental capital cost estimates include the following:
- Equipment.
- Installation.
- Soft costs.
- Scheduling delays (with information on the number of days or weeks delayed and cost per day or week).
- Contingency (with contingency amount provided).
Life cycle cost includes:
- Annual energy use (by end-use and by fuel type or energy source).
- Operations and maintenance cost.
- Commodity (e.g., gas, electricity) forecast including the utility rate class, starting rate, escalation over time.
- Carbon pricing assumption.

30
Tag Name Description
- Expected life of equipment and plan for capital renewal if equipment needs to be renewed during the term of the analysis.
- Financing assumption.
- Tax treatment.
- Discount rate.
The totals of the capital cost estimates are broken down by individual measure or at a minimum by envelope costs and energy system costs.
The costs estimates were developed by a Quantity Surveyor based on schematic design drawings and specs produced by a design team. The Quantity Surveyor produced Class C estimates.
5 Market status The Quantity Surveyor made adjustments to the cost estimates for energy measures in the Step Code 4 and 5 cases to reflect the fact that the market for these measures is immature. The specific adjustments that were made include:
- X% premium on design fees.
- X weeks of schedule delay at $X/week.
The Quantity Surveyor made no adjustments to the cost estimates for energy measures in the Step 1, 2, and 3 cases as the market for these measures and designs is fully mature and adjustments were not necessary.
5.2 Communication of Step Code Costing Results
As part of this engagement, the Province has requested recommendations on “how to better gather and
share information about the cost impacts of the BC Energy Step Code” (reference study Objective #2).
Gathering information within a consistent framework has been addressed throughout this report;
however, sharing those results, in particular with a non-technical audience, is addressed further below.
Several stakeholders have expressed concern with the Step Code cost information being difficult to
understand. For those outside of the buildings industry and non-technical audiences, feedback has been
that costing information is not accessible to general audiences.
A proposed guideline for communicating government reports on Step Code costing to non-technical
audiences is outlined in Table 9.
Table 9: Cost Study Communications Guidelines
Tag Name Description
1 Discuss the goals of the study
Clearly describing the goals of the study allows consumers or other non-technical audiences to put the information into context. For example, a study might intend to provide a broad set of energy and cost outcomes over a variety of climate zones for many building types to inform policy development, or it might intend to look at a particular case study in a particular location to provide a deeper dive into a particular scenario.

31
Tag Name Description
2 Describe major assumptions and methods, and their impacts
Using the disclosure guidelines described in Table 8, outline the basis of building design, regulatory context, building-specific and site-specific conditions, and market status assumed in the study. These inputs and assumptions should be put in context with the goals of the study and, where appropriate, describe the impacts and sensitivity of assumptions or methods to the conclusions of the study.
3 Use graphical representation, ranges, and group buildings/ climate zones
Because of the diversity of approaches to Step Code compliance, it is challenging to identify one discrete point to represent the incremental capital cost. Presenting the information in terms of a range may better reflect the level of certainty that one can develop related to the incremental cost for Step Code compliance.
Presenting the ranges of ICC graphically may help make the information more easily understood. The banded costs curves in this report are one means to show this information graphically. There are other ways to show the range of ICC, which may include:
- Vertical or horizontal bar charts with error bars.
- Comparative bubble charts (i.e., info graphics with small and large markers to reflect the cost band).
Capturing the cost premium for groups of buildings or climate zones on one chart may be simpler for all audiences to digest. Some granularity is lost, however, when too many combinations of building type and climate zone are offered. Stakeholders have advised that the information becomes too cumbersome and confusing.
Detailed tables with greater detail can always be provided within an appendix. However, including a summary level infographic with a range of ICC for multiple building types and across climate zones (especially where there is little differences in ICC) can help audiences follow and access the costing information more readily.
4 Put it in context For a building where the value of the housing cost is $1,000 per square foot and the construction cost is $300 per square foot if the range of construction cost increase for Step Code 4 is 1% to 10%, the range of cost premium on the overall cost of housing is 0.3% to 3.0%.
Both pieces of information are important, but for different reasons. Future Step Code costing studies may wish to include both parameters.
In addition, the ongoing energy cost savings can be presented, and may be relevant information to stakeholders, by putting the upfront investment into a context of ongoing savings to the long-term owners or tenants.

32
5.3 Related Costing Studies, Tools, and Ongoing Step Code Policy Development
There are a number of related costing studies and tools, as well as further Step Code policy development
that are mentioned here for information only.
National Resource Canada’s LEEP® program is currently developing a new tool for Part 9 residential
buildings that will include cost data and will be vetted by the industry through workshops. The tool will
provide greater access to relevant cost data for Part 9 buildings targeting various Step Code levels in BC.
The Better Buildings Program for net zero energy ready (NZER) buildings is currently underway and
provides incentives to Part 3 projects pursuing the highest levels of Step Code or Passive House. The
program requires a project costing report, including the incremental capital cost of the project compared
with a code compliance baseline building, as well as ongoing life cycle energy and maintenance savings.
This will provide Efficiency BC with a number of additional data points for Part 3 new construction.
BC Housing has two initiatives underway related to Step Code costing. It is collecting preliminary data on
incremental cost for the Rapid Response to Homelessness sites which have been built to meet the Energy
Step Code standards. Preliminary findings will be available by mid-August 2019. It is also working with a
Quantity Surveyor on a BC Energy Step Code Monitoring Project which is engaging builders to gather
information on their experiences implementing the Energy Step Code and changes to development costs.
Concurrent with this Costing Study, the Province also commissioned a Greenhouse Gas Emission Intensity
and Buildings Study to develop a detailed understanding of the range of possible GHG emission reductions
in new buildings at each step of the Step Code in relation to common and/or emerging energy systems in
buildings. The study will also provide policy options on how to optimize GHG emission reductions from
new buildings in a manner that achieves a range of policy objectives (e.g., maximum GHG reduction
potential, minimal incremental cost impacts, minimal energy cost impacts, consistency, and climate
resilience). The outcomes of this study and subsequent policy developments for the BC Energy Step Code
may have an impact on how future costing studies are undertaken. For example, if a GHGI metric were
included in the Step Code, it may be more relevant to consider the life cycle cost impacts of building
solutions (as opposed to just incremental capital cost). This is because GHG outcomes are more closely
tied to the type of fuel used in a building. If a building needs to meet GHGI requirements, both upfront
and ongoing costs become quite relevant. Many of the recommendations and guidelines in this report
would still hold; however, greater emphasis would be put on disclosing the details of life cycle costing.

APPENDIX A: LIST OF STUDIES
Tag Study Name Commissioned By
1 Energy Step Code 2017 Metrics Research
BC Housing, in partnership with BC Hydro, the BC Building and Safety Standards Branch, the City of Vancouver, and Natural Resources Canada
BC Housing
https://www.bchousing.org/research-centre/library/residential-design-construction/energy-step-code-2017-full-report&sortType=sortByDate
2 Energy Step Code 2018 Metrics Research
http://energystepcode.ca/app/uploads/sites/257/2018/09/2018-Metrics_Research_Report_Update_2018-09-18.pdf
3 Energy Step Code: A Study by Industry for Consumers
Canadian Home Builders’ Association Central Okanagan
https://www.chbaco.com/wp-content/uploads/2018/12/CHBA-CO-Step-Code-Costing-Report-Full-2018-12-05.pdf
4 Energy Step Code: How it works
Canadian Home Builders’ Association Central Interior
https://www.chbaci.ca/docs/chba_stepcodebrochure_sept2018_4pg.pdf
(Full detailed results available by request from CHBA Central Interior)
5
The Economics of Passive House: Costing Study on Passive House for Single Family Homes in Vancouver
City of Vancouver
https://www.passivehousecanada.com/wp-content/uploads/2016/09/The-Economics-of-Passive-Hosue_Vancouver-Costing-Study.pdf
6
City of Vancouver Zero Emissions Building Plan: Rezoning cost comparison – residential and Rezoning cost comparison - office
City of Vancouver
https://vancouver.ca/files/cov/rezoning-cost-comparison-residential.pdf
https://vancouver.ca/green-vancouver/zero-emissions-buildings.aspx
7
Getting to Zero: A High Performance Energy Policy for New Buildings in the City of Richmond
City of Richmond
https://energy.richmond.ca/wp-content/uploads/2017/07/Richmond_-_Energy_Step_Code_event_-_4_of_5_-_Part_3_details_-_170629.pdf
(Full report may be available on request from City of Richmond)
8 City of Surrey - Step Code costing study
City of Surrey Full report may be available on request from City of Surrey

9 UBC Modelling Study: Residential Archetypes
University of British Columbia
Full report available on request from UBC
10
Making the Case for Building to Zero Carbon
CaGBC
https://www.cagbc.org/CAGBC/Zero_Carbon/Report__Making_The_Case_For_Building_To_Zero_Carbon/CAGBC/Advocacy/making_the_case_for_building_to_zero_carbon_2019.aspx?hkey=3efa945b-07a4-465a-ad05-1fd0a14e57bb
Accessed March 2019

B-1
APPENDIX B: DATA POINTS ANALYZED
Study Tag
Study Name Building Type Climate
Zone
Step Code Level
ICC % Base
Construction Cost ($/sf)
Code Reference Basis for Estimate
1 Step Code Metric Report (Original) Single-family - small 4 1 0.40% 215 BC Building Code Lowest cost
1 Step Code Metric Report (Original) Single-family - small 4 2 2.40% 215 BC Building Code Lowest cost
1 Step Code Metric Report (Original) Single-family - small 4 3 4.70% 215 BC Building Code Lowest cost
1 Step Code Metric Report (Original) Single-family - small 4 4 7.50% 215 BC Building Code Lowest cost
1 Step Code Metric Report (Original) Single-family - small 4 5 13.50% 215 BC Building Code Lowest cost
1 Step Code Metric Report (Original) Single-family - medium 4 1 0.20% 190 BC Building Code Lowest cost
1 Step Code Metric Report (Original) Single-family - medium 4 2 0.20% 190 BC Building Code Lowest cost
1 Step Code Metric Report (Original) Single-family - medium 4 3 0.80% 190 BC Building Code Lowest cost
1 Step Code Metric Report (Original) Single-family - medium 4 4 1.80% 190 BC Building Code Lowest cost
1 Step Code Metric Report (Original) Single-family - medium 4 5 3.60% 190 BC Building Code Lowest cost
1 Step Code Metric Report (Original) Single-family - large 4 1 0.20% 180 BC Building Code Lowest cost
1 Step Code Metric Report (Original) Single-family - large 4 2 0.10% 180 BC Building Code Lowest cost
1 Step Code Metric Report (Original) Single-family - large 4 3 0.50% 180 BC Building Code Lowest cost
1 Step Code Metric Report (Original) Single-family - large 4 4 1.50% 180 BC Building Code Lowest cost
1 Step Code Metric Report (Original) Single-family - large 4 5 4.20% 180 BC Building Code Lowest cost
1 Step Code Metric Report (Original) Single-family - small 5 1 0.40% 215 BC Building Code Lowest cost
1 Step Code Metric Report (Original) Single-family - small 5 2 0.80% 215 BC Building Code Lowest cost
1 Step Code Metric Report (Original) Single-family - small 5 3 2.40% 215 BC Building Code Lowest cost
1 Step Code Metric Report (Original) Single-family - small 5 4 7.10% 215 BC Building Code Lowest cost

B-2
Study Tag
Study Name Building Type Climate
Zone
Step Code Level
ICC % Base
Construction Cost ($/sf)
Code Reference Basis for Estimate
1 Step Code Metric Report (Original) Single-family - small 5 5 16.20% 215 BC Building Code Lowest cost
1 Step Code Metric Report (Original) Single-family - medium 5 1 0.20% 190 BC Building Code Lowest cost
1 Step Code Metric Report (Original) Single-family - medium 5 2 0.00% 190 BC Building Code Lowest cost
1 Step Code Metric Report (Original) Single-family - medium 5 3 0.00% 190 BC Building Code Lowest cost
1 Step Code Metric Report (Original) Single-family - medium 5 4 1.50% 190 BC Building Code Lowest cost
1 Step Code Metric Report (Original) Single-family - medium 5 5 4.90% 190 BC Building Code Lowest cost
1 Step Code Metric Report (Original) Single-family - large 5 1 0.20% 180 BC Building Code Lowest cost
1 Step Code Metric Report (Original) Single-family - large 5 2 -0.30% 180 BC Building Code Lowest cost
1 Step Code Metric Report (Original) Single-family - large 5 3 -0.30% 180 BC Building Code Lowest cost
1 Step Code Metric Report (Original) Single-family - large 5 4 0.70% 180 BC Building Code Lowest cost
1 Step Code Metric Report (Original) Single-family - large 5 5 6.90% 180 BC Building Code Lowest cost
1 Step Code Metric Report (Original) Row 4 1 0.20% 163 BC Building Code Lowest cost
1 Step Code Metric Report (Original) Row 4 2 0.40% 163 BC Building Code Lowest cost
1 Step Code Metric Report (Original) Row 4 3 1.10% 163 BC Building Code Lowest cost
1 Step Code Metric Report (Original) Row 4 4 2.00% 163 BC Building Code Lowest cost
1 Step Code Metric Report (Original) Row 4 5 3.40% 163 BC Building Code Lowest cost
1 Step Code Metric Report (Original) Row 5 1 0.20% 163 BC Building Code Lowest cost
1 Step Code Metric Report (Original) Row 5 2 0.50% 163 BC Building Code Lowest cost
1 Step Code Metric Report (Original) Row 5 3 0.50% 163 BC Building Code Lowest cost
1 Step Code Metric Report (Original) Row 5 4 1.70% 163 BC Building Code Lowest cost
1 Step Code Metric Report (Original) Row 5 5 4.40% 163 BC Building Code Lowest cost
1 Step Code Metric Report (Original) Low-rise MURB 4 1 0.00% 225 BC Building Code Lowest cost
1 Step Code Metric Report (Original) Low-rise MURB 4 2 0.50% 225 BC Building Code Lowest cost

B-3
Study Tag
Study Name Building Type Climate
Zone
Step Code Level
ICC % Base
Construction Cost ($/sf)
Code Reference Basis for Estimate
1 Step Code Metric Report (Original) Low-rise MURB 4 3 0.60% 225 BC Building Code Lowest cost
1 Step Code Metric Report (Original) Low-rise MURB 4 4 2.60% 225 BC Building Code Lowest cost
1 Step Code Metric Report (Original) Low-rise MURB 5 1 0.00% 225 BC Building Code Lowest cost
1 Step Code Metric Report (Original) Low-rise MURB 5 2 0.50% 225 BC Building Code Lowest cost
1 Step Code Metric Report (Original) Low-rise MURB 5 3 2.20% 225 BC Building Code Lowest cost
1 Step Code Metric Report (Original) Low-rise MURB 5 4 3.30% 225 BC Building Code Lowest cost
1 Step Code Metric Report (Original) High-rise MURB 4 1 0.00% 282 BC Building Code Lowest cost
1 Step Code Metric Report (Original) High-rise MURB 4 2 0.40% 282 BC Building Code Lowest cost
1 Step Code Metric Report (Original) High-rise MURB 4 3 0.80% 282 BC Building Code Lowest cost
1 Step Code Metric Report (Original) High-rise MURB 4 4 2.40% 282 BC Building Code Lowest cost
1 Step Code Metric Report (Original) High-rise MURB 5 1 0.00% 282 BC Building Code Lowest cost
1 Step Code Metric Report (Original) High-rise MURB 5 2 1.00% 282 BC Building Code Lowest cost
1 Step Code Metric Report (Original) High-rise MURB 5 3 2.30% 282 BC Building Code Lowest cost
1 Step Code Metric Report (Original) High-rise MURB 5 4 3.20% 282 BC Building Code Lowest cost
1 Step Code Metric Report (Original) Commercial 4 1 0.00% 267 BC Building Code Lowest cost
1 Step Code Metric Report (Original) Commercial 4 2 -0.20% 267 BC Building Code Lowest cost
1 Step Code Metric Report (Original) Commercial 4 3 0.00% 267 BC Building Code Lowest cost
1 Step Code Metric Report (Original) Commercial 5 1 0.00% 267 BC Building Code Lowest cost
1 Step Code Metric Report (Original) Commercial 5 2 -0.10% 267 BC Building Code Lowest cost
1 Step Code Metric Report (Original) Commercial 5 3 0.20% 267 BC Building Code Lowest cost
2 Step Code Metric Report (Updated) Single-family - small 4 1 0.40% 215 BC Building Code Lowest cost
2 Step Code Metric Report (Updated) Single-family - small 4 2 1.50% 215 BC Building Code Lowest cost
2 Step Code Metric Report (Updated) Single-family - small 4 3 1.60% 215 BC Building Code Lowest cost

B-4
Study Tag
Study Name Building Type Climate
Zone
Step Code Level
ICC % Base
Construction Cost ($/sf)
Code Reference Basis for Estimate
2 Step Code Metric Report (Updated) Single-family - small 4 4 3.40% 215 BC Building Code Lowest cost
2 Step Code Metric Report (Updated) Single-family - small 4 5 8.70% 215 BC Building Code Lowest cost
2 Step Code Metric Report (Updated) Single-family - medium 4 1 0.20% 190 BC Building Code Lowest cost
2 Step Code Metric Report (Updated) Single-family - medium 4 2 0.40% 190 BC Building Code Lowest cost
2 Step Code Metric Report (Updated) Single-family - medium 4 3 0.90% 190 BC Building Code Lowest cost
2 Step Code Metric Report (Updated) Single-family - medium 4 4 1.80% 190 BC Building Code Lowest cost
2 Step Code Metric Report (Updated) Single-family - medium 4 5 3.60% 190 BC Building Code Lowest cost
2 Step Code Metric Report (Updated) Single-family - large 4 1 0.20% 180 BC Building Code Lowest cost
2 Step Code Metric Report (Updated) Single-family - large 4 2 1.20% 180 BC Building Code Lowest cost
2 Step Code Metric Report (Updated) Single-family - large 4 3 1.30% 180 BC Building Code Lowest cost
2 Step Code Metric Report (Updated) Single-family - large 4 4 2.40% 180 BC Building Code Lowest cost
2 Step Code Metric Report (Updated) Single-family - large 4 5 4.20% 180 BC Building Code Lowest cost
2 Step Code Metric Report (Updated) Single-family - small 5 1 0.40% 215 BC Building Code Lowest cost
2 Step Code Metric Report (Updated) Single-family - small 5 2 0.50% 215 BC Building Code Lowest cost
2 Step Code Metric Report (Updated) Single-family - small 5 3 1.20% 215 BC Building Code Lowest cost
2 Step Code Metric Report (Updated) Single-family - small 5 4 2.40% 215 BC Building Code Lowest cost
2 Step Code Metric Report (Updated) Single-family - small 5 5 7.60% 215 BC Building Code Lowest cost
2 Step Code Metric Report (Updated) Single-family - medium 5 1 0.20% 190 BC Building Code Lowest cost
2 Step Code Metric Report (Updated) Single-family - medium 5 2 0.20% 190 BC Building Code Lowest cost
2 Step Code Metric Report (Updated) Single-family - medium 5 3 0.40% 190 BC Building Code Lowest cost
2 Step Code Metric Report (Updated) Single-family - medium 5 4 1.40% 190 BC Building Code Lowest cost
2 Step Code Metric Report (Updated) Single-family - medium 5 5 3.30% 190 BC Building Code Lowest cost
2 Step Code Metric Report (Updated) Single-family - large 5 1 0.20% 180 BC Building Code Lowest cost

B-5
Study Tag
Study Name Building Type Climate
Zone
Step Code Level
ICC % Base
Construction Cost ($/sf)
Code Reference Basis for Estimate
2 Step Code Metric Report (Updated) Single-family - large 5 2 0.40% 180 BC Building Code Lowest cost
2 Step Code Metric Report (Updated) Single-family - large 5 3 0.60% 180 BC Building Code Lowest cost
2 Step Code Metric Report (Updated) Single-family - large 5 4 1.70% 180 BC Building Code Lowest cost
2 Step Code Metric Report (Updated) Single-family - large 5 5 3.70% 180 BC Building Code Lowest cost
2 Step Code Metric Report (Updated) Row 4 1 0.20% 163 BC Building Code Lowest cost
2 Step Code Metric Report (Updated) Row 4 2 0.40% 163 BC Building Code Lowest cost
2 Step Code Metric Report (Updated) Row 4 3 0.60% 163 BC Building Code Lowest cost
2 Step Code Metric Report (Updated) Row 4 4 1.80% 163 BC Building Code Lowest cost
2 Step Code Metric Report (Updated) Row 4 5 3.40% 163 BC Building Code Lowest cost
2 Step Code Metric Report (Updated) Row 5 1 0.20% 163 BC Building Code Lowest cost
2 Step Code Metric Report (Updated) Row 5 2 0.50% 163 BC Building Code Lowest cost
2 Step Code Metric Report (Updated) Row 5 3 0.50% 163 BC Building Code Lowest cost
2 Step Code Metric Report (Updated) Row 5 4 1.60% 163 BC Building Code Lowest cost
2 Step Code Metric Report (Updated) Row 5 5 3.30% 163 BC Building Code Lowest cost
2 Step Code Metric Report (Updated) Low-rise MURB 4 1 0.00% 225 BC Building Code Lowest cost
2 Step Code Metric Report (Updated) Low-rise MURB 4 2 0.50% 225 BC Building Code Lowest cost
2 Step Code Metric Report (Updated) Low-rise MURB 4 3 0.60% 225 BC Building Code Lowest cost
2 Step Code Metric Report (Updated) Low-rise MURB 4 4 2.60% 225 BC Building Code Lowest cost
2 Step Code Metric Report (Updated) Low-rise MURB 5 1 0.00% 225 BC Building Code Lowest cost
2 Step Code Metric Report (Updated) Low-rise MURB 5 2 0.50% 225 BC Building Code Lowest cost
2 Step Code Metric Report (Updated) Low-rise MURB 5 3 2.20% 225 BC Building Code Lowest cost
2 Step Code Metric Report (Updated) Low-rise MURB 5 4 3.30% 225 BC Building Code Lowest cost
2 Step Code Metric Report (Updated) High-rise MURB 4 1 0.00% 282 BC Building Code Lowest cost

B-6
Study Tag
Study Name Building Type Climate
Zone
Step Code Level
ICC % Base
Construction Cost ($/sf)
Code Reference Basis for Estimate
2 Step Code Metric Report (Updated) High-rise MURB 4 2 0.40% 282 BC Building Code Lowest cost
2 Step Code Metric Report (Updated) High-rise MURB 4 3 0.80% 282 BC Building Code Lowest cost
2 Step Code Metric Report (Updated) High-rise MURB 4 4 2.40% 282 BC Building Code Lowest cost
2 Step Code Metric Report (Updated) High-rise MURB 5 1 0.00% 282 BC Building Code Lowest cost
2 Step Code Metric Report (Updated) High-rise MURB 5 2 1.00% 282 BC Building Code Lowest cost
2 Step Code Metric Report (Updated) High-rise MURB 5 3 2.30% 282 BC Building Code Lowest cost
2 Step Code Metric Report (Updated) High-rise MURB 5 4 3.20% 282 BC Building Code Lowest cost
2 Step Code Metric Report (Updated) Commercial 4 1 0.00% 267 BC Building Code Lowest cost
2 Step Code Metric Report (Updated) Commercial 4 2 -0.20% 267 BC Building Code Lowest cost
2 Step Code Metric Report (Updated) Commercial 4 3 0.00% 267 BC Building Code Lowest cost
2 Step Code Metric Report (Updated) Commercial 5 1 0.00% 267 BC Building Code Lowest cost
2 Step Code Metric Report (Updated) Commercial 5 2 -0.10% 267 BC Building Code Lowest cost
2 Step Code Metric Report (Updated) Commercial 5 3 0.20% 267 BC Building Code Lowest cost
3 CHBA (Central Okanagan) Single-family - small 5 1 2.00% 201 BC Building Code Average
3 CHBA (Central Okanagan) Single-family - small 5 2 3.00% 201 BC Building Code Average
3 CHBA (Central Okanagan) Single-family - small 5 3 4.30% 201 BC Building Code Average
3 CHBA (Central Okanagan) Single-family - small 5 4 7.00% 201 BC Building Code Average
3 CHBA (Central Okanagan) Single-family - small 5 5 7.70% 201 BC Building Code Average
3 CHBA (Central Okanagan) Single-family - medium 5 1 4.00% 185 BC Building Code Average
3 CHBA (Central Okanagan) Single-family - medium 5 2 4.30% 185 BC Building Code Average
3 CHBA (Central Okanagan) Single-family - medium 5 3 6.40% 185 BC Building Code Average
3 CHBA (Central Okanagan) Single-family - medium 5 4 7.70% 185 BC Building Code Average
3 CHBA (Central Okanagan) Single-family - medium 5 5 10.30% 185 BC Building Code Average

B-7
Study Tag
Study Name Building Type Climate
Zone
Step Code Level
ICC % Base
Construction Cost ($/sf)
Code Reference Basis for Estimate
3 CHBA (Central Okanagan) Row 5 1 0.30% 200 BC Building Code Average
3 CHBA (Central Okanagan) Row 5 2 1.30% 200 BC Building Code Average
3 CHBA (Central Okanagan) Row 5 3 2.50% 200 BC Building Code Average
3 CHBA (Central Okanagan) Row 5 4 6.30% 200 BC Building Code Average
3 CHBA (Central Okanagan) Row 5 5 6.50% 200 BC Building Code Average
4 CoV The Economics of Passive House Single family - med 4 3 8.00% 200 VBBL Single value provided
4 CoV The Economics of Passive House Single family - med 4 5 10.00% 200 VBBL Single value provided
5 CAGBC: Making the Case for Buildings to Zero Carbon
Aggregate of all 4 5 8.00% 250 NECB 2011 Single value provided
6 City of Vancouver Zero Emissions Building Plan - Costing Info
Low-rise MURB 4 3 0.80% 283 VBBL Lowest cost
6 City of Vancouver Zero Emissions Building Plan - Costing Info
Low-rise MURB 4 3 1.00% 283 VBBL Average
6 City of Vancouver Zero Emissions Building Plan - Costing Info
Low-rise MURB 4 3 1.20% 283 VBBL Highest cost
6 City of Vancouver Zero Emissions Building Plan - Costing Info
Row 4 3 1.90% 215 VBBL Single value provided
8 City of Richmond - Step Code costing info Low-rise MURB 4 1 0.10% BC Building Code Lowest cost
8 City of Richmond - Step Code costing info Low-rise MURB 4 2 0.50% BC Building Code Lowest cost
8 City of Richmond - Step Code costing info Low-rise MURB 4 3 0.60% BC Building Code Lowest cost
8 City of Richmond - Step Code costing info Low-rise MURB 4 4 2.60% BC Building Code Lowest cost
8 City of Richmond - Step Code costing info High-rise MURB 4 1 0.10% BC Building Code Lowest cost
8 City of Richmond - Step Code costing info High-rise MURB 4 2 0.40% BC Building Code Lowest cost
8 City of Richmond - Step Code costing info High-rise MURB 4 3 0.80% BC Building Code Lowest cost

B-8
Study Tag
Study Name Building Type Climate
Zone
Step Code Level
ICC % Base
Construction Cost ($/sf)
Code Reference Basis for Estimate
8 City of Richmond - Step Code costing info High-rise MURB 4 4 2.40% BC Building Code Lowest cost
8 City of Richmond - Step Code costing info Commercial 4 1 0.10% BC Building Code Lowest cost
8 City of Richmond - Step Code costing info Commercial 4 2 0.10% BC Building Code Lowest cost
8 City of Richmond - Step Code costing info Commercial 4 3 0.10% BC Building Code Lowest cost
8 City of Richmond - Step Code costing info Single family - small 4 1 0.50% BC Building Code Lowest cost
8 City of Richmond - Step Code costing info Single family - small 4 2 4.00% BC Building Code Lowest cost
8 City of Richmond - Step Code costing info Single family - small 4 3 7.40% BC Building Code Lowest cost
8 City of Richmond - Step Code costing info Single family - small 4 4 10.10
% BC Building Code Lowest cost
8 City of Richmond - Step Code costing info Single family - med 4 1 0.20% BC Building Code Lowest cost
8 City of Richmond - Step Code costing info Single family - med 4 2 0.60% BC Building Code Lowest cost
8 City of Richmond - Step Code costing info Single family - med 4 3 1.60% BC Building Code Lowest cost
8 City of Richmond - Step Code costing info Single family - med 4 4 2.70% BC Building Code Lowest cost
8 City of Richmond - Step Code costing info Single family - large 4 1 0.20% BC Building Code Lowest cost
8 City of Richmond - Step Code costing info Single family - large 4 2 0.60% BC Building Code Lowest cost
8 City of Richmond - Step Code costing info Single family - large 4 3 1.40% BC Building Code Lowest cost
8 City of Richmond - Step Code costing info Single family - large 4 4 1.40% BC Building Code Lowest cost
8 City of Richmond - Step Code costing info Row 4 1 0.10% BC Building Code Lowest cost
8 City of Richmond - Step Code costing info Row 4 2 0.40% BC Building Code Lowest cost
8 City of Richmond - Step Code costing info Row 4 3 1.00% BC Building Code Lowest cost
8 City of Richmond - Step Code costing info Row 4 4 1.90% BC Building Code Lowest cost
9 City of Surrey - Step Code costing info High-rise MURB 4 1 0.00% 250 BC Building Code Lowest cost
9 City of Surrey - Step Code costing info High-rise MURB 4 2 0.80% 250 BC Building Code Lowest cost

B-9
Study Tag
Study Name Building Type Climate
Zone
Step Code Level
ICC % Base
Construction Cost ($/sf)
Code Reference Basis for Estimate
9 City of Surrey - Step Code costing info High-rise MURB 4 3 2.00% 250 BC Building Code Lowest cost
9 City of Surrey - Step Code costing info High-rise MURB 4 4 1.60% 250 BC Building Code Lowest cost
9 City of Surrey - Step Code costing info High-rise MURB 4 1 0.00% 250 BC Building Code Average
9 City of Surrey - Step Code costing info High-rise MURB 4 2 1.00% 250 BC Building Code Average
9 City of Surrey - Step Code costing info High-rise MURB 4 3 3.00% 250 BC Building Code Average
9 City of Surrey - Step Code costing info High-rise MURB 4 4 5.80% 250 BC Building Code Average
9 City of Surrey - Step Code costing info High-rise MURB 4 1 0.00% 250 BC Building Code Highest cost
9 City of Surrey - Step Code costing info High-rise MURB 4 2 1.20% 250 BC Building Code Highest cost
9 City of Surrey - Step Code costing info High-rise MURB 4 3 4.00% 250 BC Building Code Highest cost
9 City of Surrey - Step Code costing info High-rise MURB 4 4 10.00% 250 BC Building Code Highest cost
10 UBC Study High-rise MURB 4 1 0.00% 283 UBC REAP Lowest cost
10 UBC Study High-rise MURB 4 2 0.40% 283 UBC REAP Lowest cost
10 UBC Study High-rise MURB 4 3 0.50% 283 UBC REAP Lowest cost
10 UBC Study High-rise MURB 4 4 1.40% 283 UBC REAP Lowest cost
10 UBC Study High-rise MURB 4 1 0.00% 283 UBC REAP Average
10 UBC Study High-rise MURB 4 2 0.65% 283 UBC REAP Average
10 UBC Study High-rise MURB 4 3 0.95% 283 UBC REAP Average
10 UBC Study High-rise MURB 4 4 2.75% 283 UBC REAP Average
10 UBC Study High-rise MURB 4 1 0.00% 283 UBC REAP Highest cost
10 UBC Study High-rise MURB 4 2 0.90% 283 UBC REAP Highest cost
10 UBC Study High-rise MURB 4 3 1.40% 283 UBC REAP Highest cost
10 UBC Study High-rise MURB 4 4 4.10% 283 UBC REAP Highest cost
10 UBC Study High-rise MURB 4 1 0.00% 225 UBC REAP Lowest cost
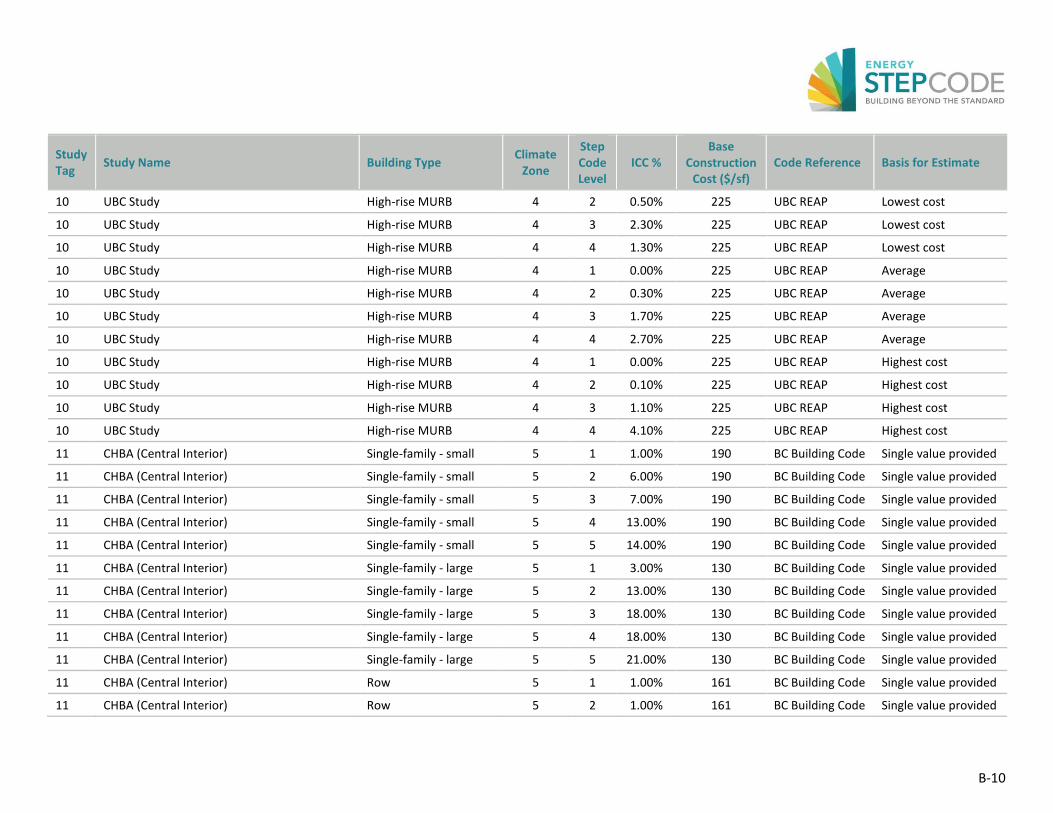
B-10
Study Tag
Study Name Building Type Climate
Zone
Step Code Level
ICC % Base
Construction Cost ($/sf)
Code Reference Basis for Estimate
10 UBC Study High-rise MURB 4 2 0.50% 225 UBC REAP Lowest cost
10 UBC Study High-rise MURB 4 3 2.30% 225 UBC REAP Lowest cost
10 UBC Study High-rise MURB 4 4 1.30% 225 UBC REAP Lowest cost
10 UBC Study High-rise MURB 4 1 0.00% 225 UBC REAP Average
10 UBC Study High-rise MURB 4 2 0.30% 225 UBC REAP Average
10 UBC Study High-rise MURB 4 3 1.70% 225 UBC REAP Average
10 UBC Study High-rise MURB 4 4 2.70% 225 UBC REAP Average
10 UBC Study High-rise MURB 4 1 0.00% 225 UBC REAP Highest cost
10 UBC Study High-rise MURB 4 2 0.10% 225 UBC REAP Highest cost
10 UBC Study High-rise MURB 4 3 1.10% 225 UBC REAP Highest cost
10 UBC Study High-rise MURB 4 4 4.10% 225 UBC REAP Highest cost
11 CHBA (Central Interior) Single-family - small 5 1 1.00% 190 BC Building Code Single value provided
11 CHBA (Central Interior) Single-family - small 5 2 6.00% 190 BC Building Code Single value provided
11 CHBA (Central Interior) Single-family - small 5 3 7.00% 190 BC Building Code Single value provided
11 CHBA (Central Interior) Single-family - small 5 4 13.00% 190 BC Building Code Single value provided
11 CHBA (Central Interior) Single-family - small 5 5 14.00% 190 BC Building Code Single value provided
11 CHBA (Central Interior) Single-family - large 5 1 3.00% 130 BC Building Code Single value provided
11 CHBA (Central Interior) Single-family - large 5 2 13.00% 130 BC Building Code Single value provided
11 CHBA (Central Interior) Single-family - large 5 3 18.00% 130 BC Building Code Single value provided
11 CHBA (Central Interior) Single-family - large 5 4 18.00% 130 BC Building Code Single value provided
11 CHBA (Central Interior) Single-family - large 5 5 21.00% 130 BC Building Code Single value provided
11 CHBA (Central Interior) Row 5 1 1.00% 161 BC Building Code Single value provided
11 CHBA (Central Interior) Row 5 2 1.00% 161 BC Building Code Single value provided

B-11
Study Tag
Study Name Building Type Climate
Zone
Step Code Level
ICC % Base
Construction Cost ($/sf)
Code Reference Basis for Estimate
11 CHBA (Central Interior) Row 5 3 1.00% 161 BC Building Code Single value provided
11 CHBA (Central Interior) Row 5 4 6.00% 161 BC Building Code Single value provided
11 CHBA (Central Interior) Row 5 5 11.00% 161 BC Building Code Single value provided

B-12
APPENDIX C: INTERVIEWS CONDUCTED
The following interviews were conducted individually by study team members.
Organization Position
Natural Resources Canada LEEP Program Project Officer
Canadian Home Builders Association Director, Net Zero Energy Housing, Canadian Home Builders' Association
CHBA Central Interior Executive Officer
Campus and Community Planning, University of British Columbia Community Energy Manager
City of Vancouver Green Building Engineer, Sustainability Group
Zero Emissions Building Centre of Excellence Executive Director