energy recovery in natural gas pressure reduction stations
TRANSCRIPT

Energy Recovery in Natural Gas Pressure Reduction Stations
Goncalo Secca [email protected]
Instituto Superior Tecnico, Universidade de Lisboa, Portugal
June 2018
Abstract
High-pressure natural gas (NG), which flows through the Portuguese transmission system, is split intoseveral branches before arriving to consumers. At the distribution network entrance, NG pressure mustbe reduced to reach day-to-day consumers needs (industrial or domestic purposes). These reductionsoccur through expansion valves lowering the pressure from 50-70 bar to nearly 20 bar. In a competitiveglobal market, where environment concerns are paramount, energy waste is a key issue, which explainsthe current growing interest in recovering energy from the NG pressure reduction. A system with aturboexpander (TE) driving a generator is, therefore, suggested for the production of electrical energy.A thermodynamic analysis of the proposed system was made and several simulations were performedwith a MATLAB model, showing that the energy recovery from this pressure drop is not as obviousas it seems. The reason is that the expansion cools the gas at temperatures that can cause hydrateformation. To avoid such drawbacks, some energy might have to be consumed to raise the temperatureprior to expansion, which may turn out to be unattractive on thermodynamic grounds, but still worthconsidering based on economic arguments.Keywords: Energy Recovery, Natural Gas, Expansion Turbine, Pressure Reduction.
1. Introduction
In a world highly dependent on fossil fuels, en-ergy production is a major concern, leading to adaily search for new sources of renewable energy, aswell as improvements in the efficiency of current sys-tems. NG transport system, summarised in Figure1, is an example where it may be possible to re-cover energy. Once extracted, the NG is processedand compressed before being injected, under high-pressure, into a transmission piping system. Thestandard pressure varies between 50 and 70 bar,however, to be delivered to distribution companiesor power plants, the gas must be reduced close to17 bar and 42 bar, respectively. The pressure re-duction occurs in the so-called City Gate Station(CGS), through the use of pressure regulators.
This process is nothing more than a simple expan-sion in a throttling valve, which, due to the JouleThompson effect, slightly cools the NG. As a re-sult, a heat exchanger (HX) coupled to a boiler isused to heat up the gas before expansion, avoid-ing low outlet temperatures that may cause con-densation and hydrate formation. Since the hugepressure drop represents a decrease in the energyof the whole system, replacing the valve with a TEcoupled to a generator may allow the recovery ofsome energy that would otherwise be lost. How-ever, one should pay attention to the temperaturedrop, which is much higher than in a throttle valve,
Figure 1: NG Transport Chain.
leading to higher heating requirements.
The aim of this research consists in evaluatingseveral scenarios, where the aforementioned tech-nology can be applied in Portugal. A thermody-namic analysis was made, giving some insight intothe variables that most influence the feasibility ofsuch systems.
2. Literature Review
The use of TE to produce electricity from theNG pressure reduction is not a recent idea. Theconcept has been explored, for CGS, since the 80’s.One of the pioneer companies was San Diego Gasand Electricity, which in 1983 applied a TE to re-
1
duce the NG pressure from 55 to 26 bar. Withoutany heating, the electricity generated was about 890MWh/year for the first 4 years of operation [1]. Le-man and Worrell [2] mention three expansion tur-bine projects built in the 90’s, one in Japan and twoin the Netherlands. Regarding the latter, since 1991there is a pressure reduction station which providesNG to the city of Amsterdam, using TE with theso-called Combined Heat and Power (CHP) technol-ogy. The heat supplied by the CHP units rises thegas temperature to more than 80◦C, avoiding cool-ing below the critical temperature of hydrate forma-tion, when the NG expands from 40 to 8 bar. In thisfacility, with an annual flow rate variation between25,000 and 110,000 Nm3/h, 12,022 MWh of elec-tricity were generated in the first year, correspond-ing to a net power of 1.37 MW. The other Dutchproject is located in the port city of IJmuiden. Toheat the NG, waste heat from the refrigeration pro-cess of a nearby steel mill was used, instead of CHPunits. Before the pressure reduction from 63 to 8bar, hot water at 70◦C rises the temperature of theNG. Throughout 1994, the system received 12,500MWh of heat from the steel mill and generatedroughly 11,000 MWh of electricity, with an aver-age flow rate of 26 thousand Nm3/h, which meansthat the system recovered almost 88% of the heatinput. In Osaka, Japan, the scenario is quite differ-ent. The CGS is located near a district heating andcooling facility which supplies hot and cool water tothe city. With a TE, the NG entering the stationat an average temperature of 20◦C, drops to -30◦C.For this case, there is an opportunity to provide re-frigeration energy to the cooling facility while theNG is heated up before being delivered to the distri-bution network. On the other hand, if there is littledemand for cooling energy (e.g. during the winter),the NG can be heated before entering the turbine,using the waste heat generated by the heating fa-cility. With an average flow rate of 15,000 Nm3/hand a pressure reduction from 6 to 2 bar, in 1994the TE generated 1400 MWh of electricity in 2600hours [2]. In Bruxelles there is a 5.3 MW combinedsystem running since 2002. With a nominal flowof 75,000 Nm3/h, this CGS reduces the gas pres-sure from 14 to 1.7 bar. Lean-burned CHP unitsare used to produce 2.7 MW of electricity and toheat the gas at the TE inlet, which generates 2.6MW [3]. Fuel cells are another promising technol-ogy. The fuel cell provides both electricity and heatwithout any combustion. In 2007, a TE and fuelcell integrated system started to work in Toronto,harvesting 2.2 MW (only 1 MW coming from theturbine) [4]. A summary of all the aforementionedcases is presented in table 1.
Several authors have been studying the bene-fits of TE pressure reduction systems in different
countries. Software packages, such as HYSYS, arewidely used in this type of simulations [5]. Withthese numerical tools, or simply with some ther-modynamic calculations, the goal of all ongoing re-search is, basically, to gather data from a specificCGS in order to assess the economic relevance ofenergy recovery.
3. Actual SystemIn a standard CGS, once the NG enters, it is fil-
tered to remove the dust and then it is heated. Thistemperature rise is necessary to avoid hydrate for-mation when the gas expands in a pressure regulat-ing valve. Usually, there are two pressure reductionlines mounted in parallel, for reasons related to sys-tem maintenance and also to ensure a permanentsupply of NG. A typical configuration of a CGS isshown in Figure 2.
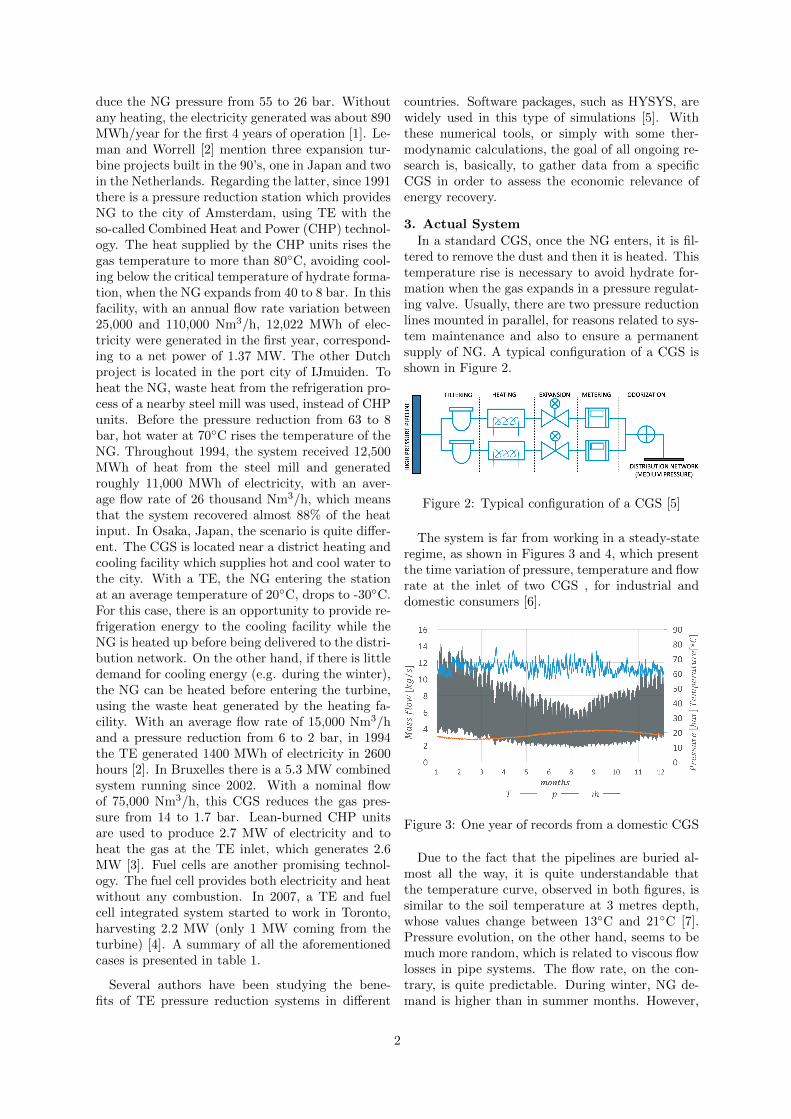
Figure 2: Typical configuration of a CGS [5]
The system is far from working in a steady-stateregime, as shown in Figures 3 and 4, which presentthe time variation of pressure, temperature and flowrate at the inlet of two CGS , for industrial anddomestic consumers [6].
Figure 3: One year of records from a domestic CGS
Due to the fact that the pipelines are buried al-most all the way, it is quite understandable thatthe temperature curve, observed in both figures, issimilar to the soil temperature at 3 metres depth,whose values change between 13◦C and 21◦C [7].Pressure evolution, on the other hand, seems to bemuch more random, which is related to viscous flowlosses in pipe systems. The flow rate, on the con-trary, is quite predictable. During winter, NG de-mand is higher than in summer months. However,
2

Table 1: Resume of some existing projectsLocal Year Av.Flow pin/pout Heating Power
[×103Nm3/h] [bar] [MW ]San Diego, US [1] 1983 - 55/26 none 0.1Amsterdam, NL [2] 1991 67.5 40/8 CHP and boilers 1.37IJmuiden, NL [2] 1994 26.5 63/8 Waste heat from a steel mill 1.26Osaka, JP [2] 1994 15 6/2 Heating and Cooling facility 0.54Brussels, BE [3] 2002 75 14/1.7 Lean burn CHP 2.6Toronto, CA [4] 2008 - - Fuel Cell and Boilers 1
Figure 4: One of year records from an industrialCGS
in both winter and summer, the gap between theminimum and maximum values is quite large for do-mestic consumers as a result of peak consumption,whereas in the industrial sector this phenomenon isalmost irrelevant, with only a slight increase duringwinter. The two main differences between domes-tic and industrial users are the pressure at the exitof the CGS and the order of magnitude of the flowrate. In the former case, outlet pressures are equalto 17 bar while in the latter a common value is 42bar.
4. Proposed System
Scheme
Figure 5 depicts a standard configuration schemeof a CGS, when a TE is implemented to recoverenergy from the NG pressure reduction. The TEshould be mounted in parallel to the existing linein order to guarantee normal operating conditions,in case the proposed system fails or requires main-tenance. As the TE extracts energy from the NG,the temperature drop will be much higher than in athrottle valve. As a result, a HX coupled to a boilermust be placed before the expansion, just as in theoriginal system. The temperature at the inlet of theTE is regulated by the HX. However, pressure mayfluctuate at sections 6 and 7 and to ensure properconditions at section 9 an expansion valve is placedafter the TE.
Figure 5: CGS scheme
Boundary ConditionsThis system has some constraints that must be
addressed. At a CGS, the NG arrives with a cer-tain pressure, temperature and flow rate. Thesevalues,T1, p1 and m1, are imposed and fluctuatethroughout the year as seen in Figures 3 and 4.When leaving the CGS, the NG must be at a pres-sure agreed with the consumers. Therefore, theoutlet pressure is also a boundary condition. Foreach pressure, there is a threshold temperature be-low which hydrates can form. Hammerschmidt [8]proposed the following equation to calculate thisminimum temperature:
Thf =5
9(36.76(p× 10−1)0.285 − 32) (1)
As a result, another constraint of the systemis the minimum temperature at sections 8 and 4.Since it is assumed that p4 = p8 = p9, this impliesthat T4min = T8min = T9min. In summary, theboundary conditions are p1, T1, m1, p9, with twoconstraints T4min and T8min and (subscripts referto Figure 5).
Natural GasThe NG is a complex mixture of hydrocarbons,
extracted from underground sources. It is com-posed primarily by methane, but also includesethane, propane and other hydrocarbons in smalleramounts. As shown in table 2, near 90% of theNG is methane. This is the reason why, in somestudies and simulations, methane is often used toobtain approximate solutions. The same approachis followed in this study.
3

Table 2: Typical Composition of Natural Gas [9].Name Formula Volume (%)Methane CH4 >85Ethane C2H6 3 - 8Propane C3H8 1 - 2Butane C4H10 <1Pentane C5H12 <1Carbon dioxide CO2 1 - 2Hydrogen sulfide H2S <1Nitrogen N2 1 - 5Helium He <0,5
Real vs Ideal GasTo simplify the thermodynamic analysis, it is
common to consider an ideal gas, described by asimple equation of state (EOS):
p = ρRT (2)
With this assumption and neglecting kineticaland potential energy variations, the generalizedBernoulli equation for an expansion valve becomes:
p1ρ1g
+v1
2
2g+ z1 + hf12 =
p2ρ2g
+v2
2
2g+ z2 (3)
⇔ hf12=
p1ρ1g− p2ρ2g
(4)
⇔ hf12=R(T1 − T2)
g(5)
where hf12 is the head-loss in the valve. On theother hand, the energy balance of the valve, is givenby:
m(h1 − h2) = mcp(T1 − T2) = 0 (6)
where cp is the mean specific heat, at constantpressure, between temperatures T1 and T2. Fromthe previous equations one concludes that ∆T = 0and hf12
= 0. Therefore, the ideal gas assumptionleads to a contradiction and another EOS must bechosen.
For a pure substance the infinitesimal changesin internal specific energy and enthalpy are [10],respectively, equal to du = cvdT + (∂u/∂v)T dvand dh = cpdT + (∂h/∂p)T dp. Since (∂u/∂v)T =T (∂p/∂T )v − p and (∂h/∂p)T = v − T (∂v/∂T )p,integrating one obtains:
u2 − u1 =
∫ 2
1
cvdT +
∫ 2
1
[T
(∂p
∂T
)v
− p]dv (7)
h2 − h1 =
∫ 2
1
cpdT +
∫ 2
1
[v − T
(∂v
∂T
)p
]dp (8)
To compute equations 7 and 8, an EOS is re-quired. There are several EOS and some of themare quite accurate at predicting the NG properties.
As stated in [11], complex models, such as AGAand MGREG, are commonly used as well as Peng-Robinson, Redlich-Kwong-Soave and other cubicEOS.
To simplify the analysis, the Van der Waals(VdW) equation 9 was chosen. VdW EOS takesinto account the volume occupied by the molecules(factor b) and the interactions between them (factora). These two factors depend on the gas composi-tion and are well-known [10].
p =RT
v − b− a
v2(9)
5. Mathematical Formulation
Heat ExchangersAssuming an isobaric evolution in the HX, the
energy balance yields:
Q = m∆h = mcp∆T (10)
Equation 8 requires knowledge of v(T ), which isnot possible with VdW EOS. Therefore, the inte-gration path between two generic states 1 and 2 issplit into an isothermal path between 1 and x, fol-lowed by an isobaric path between x and 2 (Figure6).
Figure 6: path on T-s diagram
Having said that, the first term of equation (7)disappears from 1 to x, and in equation (8) onlythe first term needs to be calculated from x to 2.Bearing this in mind, equations (11) and (13) areobtained:
ux − u1 = a
(1
v1− 1
vx
)(11)
hx − h1 = (ux − u1) + (pxvx − p1v1) (12)
h2 − hx = cp (T2 − Tx) (13)
Equation (12) comes from the definition of en-thalpy. Summing the two enthalpy changes, yieldsa general equation for ∆h:
h2 − h1 = a
(1
v1− 1
vx
)+ (pxvx − p1v1) + cp (T2 − Tx) (14)
4

The value of cp is an average value between states2 and x, taken from a superheated methane table[12].
Expansion Valves
In expansion valves the energy balance impliesthat ∆h = 0 [10]. Then, using equation (14), theoutlet or inlet temperature can be obtained knowingthe pressure on both sides and one of the tempera-tures. For Tout the equation is:
hin − hout = 0⇔ Tout = Tin −a
cp
(1
vin− 1
vx
)− 1
cp(poutvx − pinvin) (15)
Where the 2nd and 3rd term are related to the realgas behaviour and make the temperature decreasein the valve.
Turboexpander
Once the turbine pressure ratio is set, the outletpressure at the TE is calculated from the inlet pres-sure, which is equal to the pressure at the entranceof the CGS, neglecting viscous dissipation in theHX and pipes. As a result, the unknown variablein TE is the inlet temperature T6. Figure 7 showsthe relevant points to find the solution.
Figure 7: path on T-s diagram
Two important equations to get T6 are the en-tropy balance for an ideal TE (equation (16))and the definition of isentropic efficiency (equation(17)).
∆s6−7s =
∫ 7s
6
cvTdT +
∫ 7s
6
(∂p
∂T
)v
dv = 0
⇔ T6T7s
=
(v7s − bv6 − b
) Rcv
(16)
η =h6 − h7h6 − h7s
=
a(
1v7− 1
vx
)+ (pxvx − p7v7) + cp (T6 − Tx)
a(
1v7s− 1
vy
)+ (pyvy − p7sv7s) + cp (T6 − Ty)
(17)
With the VdW EOS for points 6, 7s and y, asystem of 5 equations with 5 unknowns (T6, T7s, v6,v7s and vy) is obtained and solved by an iterativemethod, outlined in Figure 8.
p6 =
(RT6v6 − b
)− a
v26(18)
p7s =
(RT7sv7s − b
)− a
v27s(19)
py =
(RTyvy − b
)− a
v2y⇔ p6 =
(RT7svy − b
)− a
v2y(20)
Figure 8: iterative process
If the temperature at the inlet of the TE is im-posed, the computation of the outlet temperaturerequires only equations (16) and (17) to estimatethe values of T7 and T7s, respectively. In addition,the work produced by the turbine is given by theequation:
W = m (h6 − h7) (21)
In equation (17), TE’s efficiency must be known.The large mass flow fluctuations over the year, orduring a day, have an influence on TE’s efficiency.Figure 9 depicts this dependence.
Figure 9: Relation between efficiency and flow [13]
5
Turboexpander Design
Since TE can withstand a mass flow of 20% to150% of the design mass flow mdes [13], the valuechosen is given by mdes = m1max/1.5, where m1max
is the maximum mass flow at point 1. For industrialCGS m1 > 0.2mdes for all entry mass flows, whichimplies that the NG flows always through the TE,a situation that does not apply to domestic CGS.Regarding the design pressure ratio, it is defined bythe ratio between the lowest inlet pressure recordedover the year (55 bar and 49 bar for the domes-tic and industrial CGS, respectively) and the outletpressure. According to this definition, for the do-mestic CGS the pressure ratio yields 3.235, whereasit is equal to 1.167 for the industrial one. The de-sign outlet temperature is calculated by equation(1), for an outlet pressure equal to 17 bar and 42 bar(domestic and industrial CGS, respectively). More-over, the inlet design temperature is computed bythe iterative method outlined in the previous sec-tion, assuming an initial efficiency of 80%. Radialflow TE are commonly used in this type of applica-tions [1]. Two important equations have to be takeninto account to compute the design efficiency:
Ns =0.076N
√V
(∆hi)34
(22)
SP = 1.49m1∆hiη0 (23)
where ∆hi (kJ/kg) is the ideal enthalpy differ-ence between inlet and outlet, N (rpm) and Ns
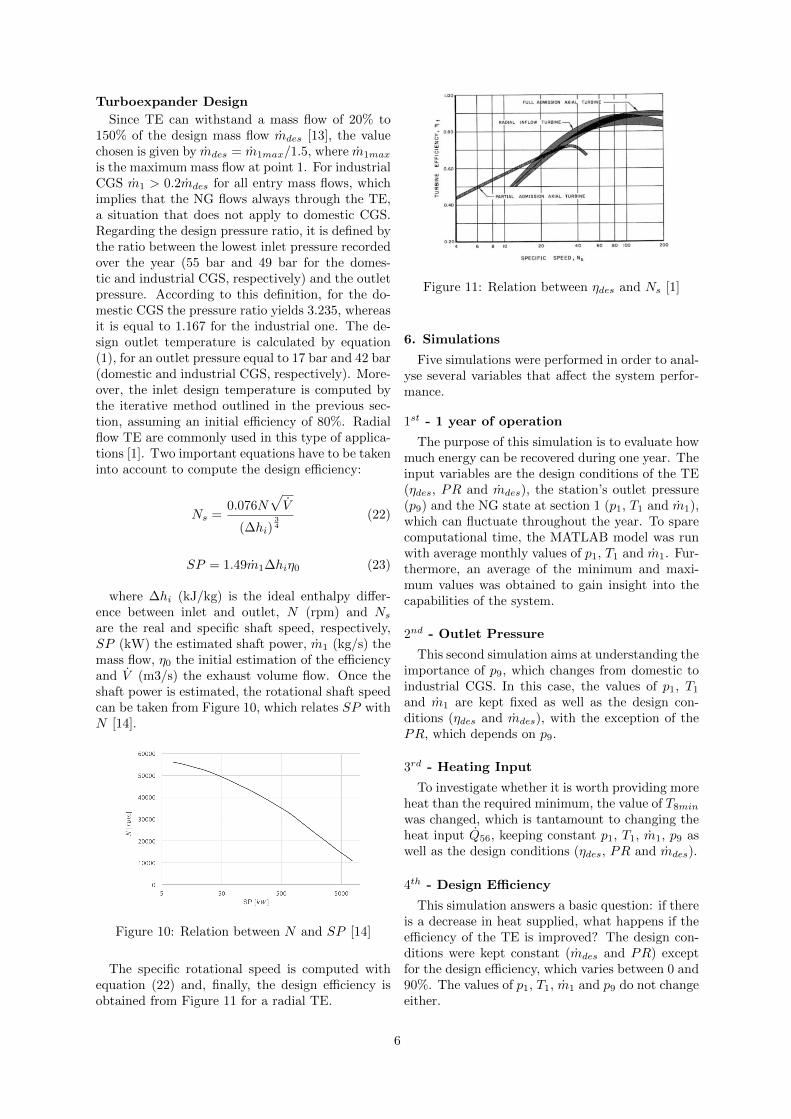
are the real and specific shaft speed, respectively,SP (kW) the estimated shaft power, m1 (kg/s) themass flow, η0 the initial estimation of the efficiencyand V (m3/s) the exhaust volume flow. Once theshaft power is estimated, the rotational shaft speedcan be taken from Figure 10, which relates SP withN [14].
Figure 10: Relation between N and SP [14]
The specific rotational speed is computed withequation (22) and, finally, the design efficiency isobtained from Figure 11 for a radial TE.
Figure 11: Relation between ηdes and Ns [1]
6. Simulations
Five simulations were performed in order to anal-yse several variables that affect the system perfor-mance.
1st - 1 year of operation
The purpose of this simulation is to evaluate howmuch energy can be recovered during one year. Theinput variables are the design conditions of the TE(ηdes, PR and mdes), the station’s outlet pressure(p9) and the NG state at section 1 (p1, T1 and m1),which can fluctuate throughout the year. To sparecomputational time, the MATLAB model was runwith average monthly values of p1, T1 and m1. Fur-thermore, an average of the minimum and maxi-mum values was obtained to gain insight into thecapabilities of the system.
2nd - Outlet Pressure
This second simulation aims at understanding theimportance of p9, which changes from domestic toindustrial CGS. In this case, the values of p1, T1and m1 are kept fixed as well as the design con-ditions (ηdes and mdes), with the exception of thePR, which depends on p9.
3rd - Heating Input
To investigate whether it is worth providing moreheat than the required minimum, the value of T8min
was changed, which is tantamount to changing theheat input Q56, keeping constant p1, T1, m1, p9 aswell as the design conditions (ηdes, PR and mdes).
4th - Design Efficiency
This simulation answers a basic question: if thereis a decrease in heat supplied, what happens if theefficiency of the TE is improved? The design con-ditions were kept constant (mdes and PR) exceptfor the design efficiency, which varies between 0 and90%. The values of p1, T1, m1 and p9 do not changeeither.
6
5th - TE Inlet PressureAs mentioned above, heating is required before
the NG expands in the TE, in order to avoid hy-drate formation. The goal of this simulation is tounderstand how the change in the inlet pressure ofthe TE affects the performance of the system, stillensuring that there are no hydrates. To control p6an expansion valve was placed just before the HX,thus reducing the pressure and temperature drop inthe TE. The variables p1, T1, m1, p9, ηdes and mdes
were kept constant. In this simulation, the TE linestarts only after the HX of the other line, in order tomaintain the temperature above hydrate formationafter the new valve.
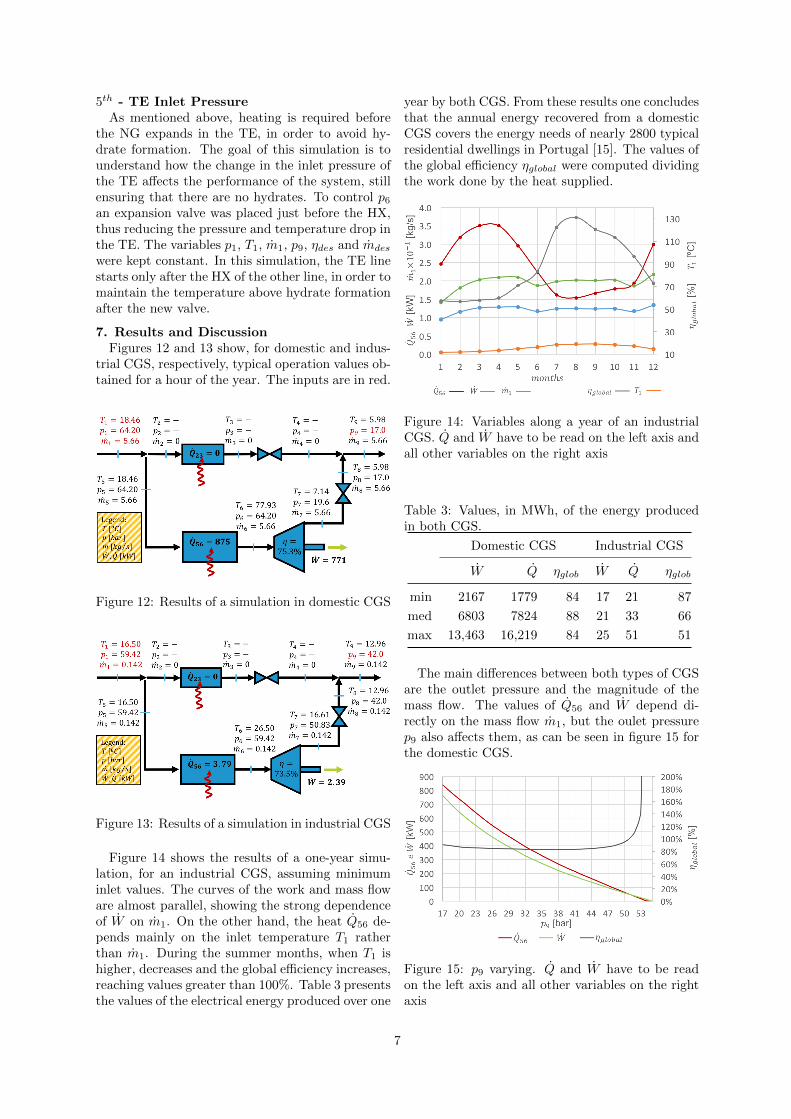
7. Results and DiscussionFigures 12 and 13 show, for domestic and indus-
trial CGS, respectively, typical operation values ob-tained for a hour of the year. The inputs are in red.
Figure 12: Results of a simulation in domestic CGS
Figure 13: Results of a simulation in industrial CGS
Figure 14 shows the results of a one-year simu-lation, for an industrial CGS, assuming minimuminlet values. The curves of the work and mass floware almost parallel, showing the strong dependenceof W on m1. On the other hand, the heat Q56 de-pends mainly on the inlet temperature T1 ratherthan m1. During the summer months, when T1 ishigher, decreases and the global efficiency increases,reaching values greater than 100%. Table 3 presentsthe values of the electrical energy produced over one
year by both CGS. From these results one concludesthat the annual energy recovered from a domesticCGS covers the energy needs of nearly 2800 typicalresidential dwellings in Portugal [15]. The values ofthe global efficiency ηglobal were computed dividingthe work done by the heat supplied.
Figure 14: Variables along a year of an industrialCGS. Q and W have to be read on the left axis andall other variables on the right axis
Table 3: Values, in MWh, of the energy producedin both CGS.
Domestic CGS Industrial CGS
W Q ηglob W Q ηglob
min 2167 1779 84 17 21 87
med 6803 7824 88 21 33 66
max 13,463 16,219 84 25 51 51
The main differences between both types of CGSare the outlet pressure and the magnitude of themass flow. The values of Q56 and W depend di-rectly on the mass flow m1, but the oulet pressurep9 also affects them, as can be seen in figure 15 forthe domestic CGS.
Figure 15: p9 varying. Q and W have to be readon the left axis and all other variables on the rightaxis
7
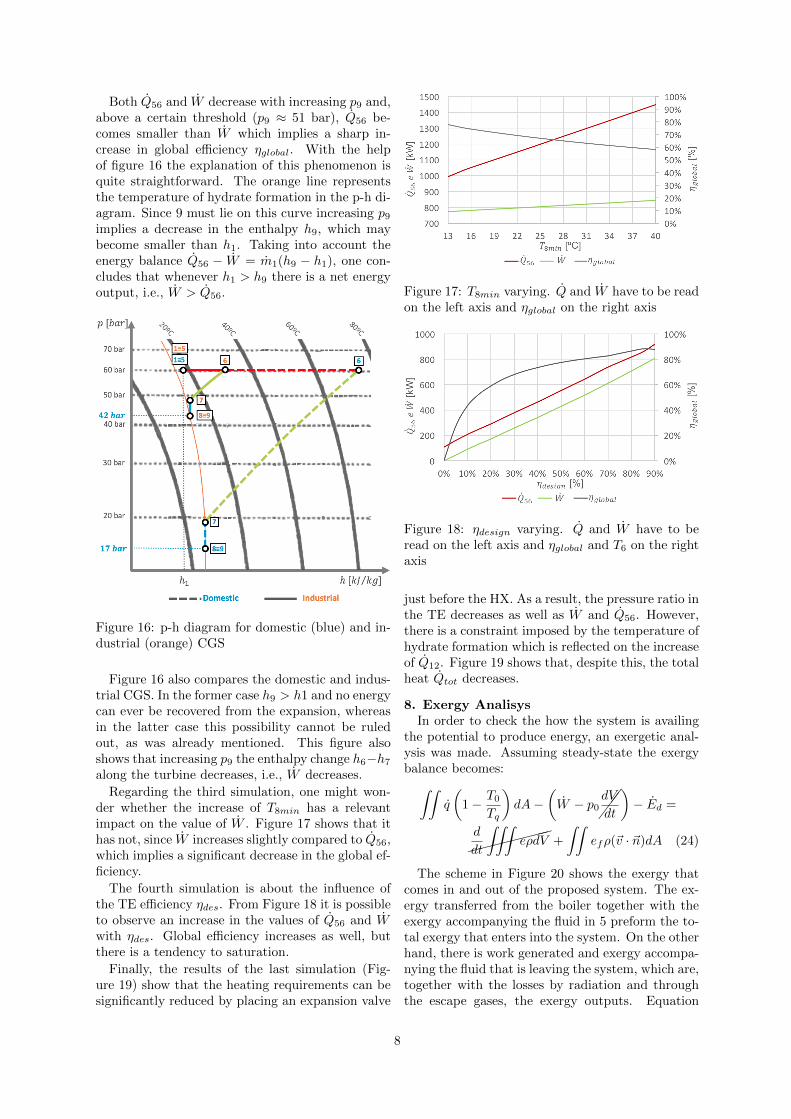
Both Q56 and W decrease with increasing p9 and,above a certain threshold (p9 ≈ 51 bar), Q56 be-comes smaller than W which implies a sharp in-crease in global efficiency ηglobal. With the helpof figure 16 the explanation of this phenomenon isquite straightforward. The orange line representsthe temperature of hydrate formation in the p-h di-agram. Since 9 must lie on this curve increasing p9implies a decrease in the enthalpy h9, which maybecome smaller than h1. Taking into account theenergy balance Q56 − W = m1(h9 − h1), one con-cludes that whenever h1 > h9 there is a net energyoutput, i.e., W > Q56.
Figure 16: p-h diagram for domestic (blue) and in-dustrial (orange) CGS
Figure 16 also compares the domestic and indus-trial CGS. In the former case h9 > h1 and no energycan ever be recovered from the expansion, whereasin the latter case this possibility cannot be ruledout, as was already mentioned. This figure alsoshows that increasing p9 the enthalpy change h6−h7along the turbine decreases, i.e., W decreases.
Regarding the third simulation, one might won-der whether the increase of T8min has a relevantimpact on the value of W . Figure 17 shows that ithas not, since W increases slightly compared to Q56,which implies a significant decrease in the global ef-ficiency.
The fourth simulation is about the influence ofthe TE efficiency ηdes. From Figure 18 it is possibleto observe an increase in the values of Q56 and Wwith ηdes. Global efficiency increases as well, butthere is a tendency to saturation.
Finally, the results of the last simulation (Fig-ure 19) show that the heating requirements can besignificantly reduced by placing an expansion valve
Figure 17: T8min varying. Q and W have to be readon the left axis and ηglobal on the right axis
Figure 18: ηdesign varying. Q and W have to beread on the left axis and ηglobal and T6 on the rightaxis
just before the HX. As a result, the pressure ratio inthe TE decreases as well as W and Q56. However,there is a constraint imposed by the temperature ofhydrate formation which is reflected on the increaseof Q12. Figure 19 shows that, despite this, the totalheat Qtot decreases.
8. Exergy AnalisysIn order to check the how the system is availing
the potential to produce energy, an exergetic anal-ysis was made. Assuming steady-state the exergybalance becomes:∫∫
q
(1− T0
Tq
)dA−
(W − p0
���dV
dt
)− Ed =
�������d
dt
∫∫∫eρdV +
∫∫efρ(~v · ~n)dA (24)
The scheme in Figure 20 shows the exergy thatcomes in and out of the proposed system. The ex-ergy transferred from the boiler together with theexergy accompanying the fluid in 5 preform the to-tal exergy that enters into the system. On the otherhand, there is work generated and exergy accompa-nying the fluid that is leaving the system, which are,together with the losses by radiation and throughthe escape gases, the exergy outputs. Equation
8

Figure 19: p6 varying. Q and W have to be readon the right axis and all other variables on the leftaxis
(25), from exergy balance, shows clearly how eachterm contributes to the system, placing the inputson the left-hand side and the distribution of thisexergy on the right-hand side.
Figure 20: Proposed scheme exergy contributions.
Qin
(1− T0
Tin
)+ m5ef5
= W + m7ef7+
Qg
(1− T0
Tg
)+ Qsur
(1− T0
Tsur
)+ Ed (25)
In equation (25) the term Ed refers to the exergythat is destructed in the system, and is a sum of therate of exergy destruction both in the boiler and inthe TE (Ed = Edb + Edt).
Since the objective of the system is deliver NGto distribution network at a certain pressure andtemperature at the same time that work is pro-duced, the exergetic efficiency can be defined byequation (26), where this exergy outputs are di-vided by the exergy that comes into the system(boiler heat transfer and exergy accompanying en-try gas).
ε =W + m7ef7
Qin
(1− T0
Tin
)+ m5ef5
(26)
Having this, an exergy balance sheet was createdin table 4, where can be observed that the mostof the exergy that enters the system leave with the
outlet flow, which maintain an huge potential of im-provement. Assuming this outlet exergy as an ob-jective leads to higher exergetic efficiencies, 79% fordomestic CGS and 96% to industrial as can be seenin table 5. However, the rate of exergy destructionis considerable, specially in domestic CGS, whereEd = 872kW .
Table 4: Exergy balance of domestic (left) and in-dustrial (right) CGS.
Exergy in Qin+Flow 100% 100%
Exergy out
TE 20, 11% 2, 73%
Flow 59, 09% 93, 03%
Losses 0, 08% 0, 02%
Ex.DestroiedTE 4, 31% 0, 94%
Boiler 16, 41% 3, 29%
Table 5: Exergetic analysis results.
Domestic CGS Industrial CGS
Ed[kW] ε[%] Ed[kW] ε[%]
TE 182 82 0.82 0.21
Boiler 690 14 9 2.59
TE+Boiler 872 79 96 0.16
9. ConclusionsFrom the thermodynamic analysis, with all the
constraints and boundary conditions that must beimposed, one concludes that recovering energy frompressure reduction stations is not as obvious as itseems. One of the main reasons is that the greaterthe difference between the inlet and outlet pressure,the higher the temperature drop and heating re-quirements. However, depending on the character-istics of the station and on the availability of heatsources nearby, there are many parameters that canbe adjusted to make possible and attractive the en-ergy production in a CGS. Despite having globalefficiencies almost always below 100%, the main ar-gument in favour of energy recovery at pressure re-duction stations is based on economic reasons. Ifthe boiler coupled to the HX works with the NG, theproject may still be attractive because the cost ofthe kWh of NG is cheaper than the kWh of electric-ity. A domestic CGS can produce almost 7 GWh ofelectricity per year, which is equivalent to the elec-tricity consumption of about 2.8 thousand typicalPortuguese dwellings.
Considering that distribution companies paye 0.047 per kWh of electricity on this kind of pro-
9
duction and that the NG consumed costs nearlye 0.019 per kWh, it can be said the the system iseconomically viable if:
W (365× 24)Celect − Q(365× 24)CNG > 0
⇒ W
Q>
CNG
Celect
ηglobal > 40%
And as seen above, the global efficiency is alwayshigher than 40%.
Acronyms
CGS City Gate Station
CHP Combined Heat and Power
EOS Equation of State
HX Heat Exchanger
NG Natural Gas
PR Pressure Ratio
TE Turboexpander
VdW Van der Waals
References[1] Heinz P Bloch and Claire Soares. Turboex-
panders and Process Applications. Gulf Pro-fessional Publishing, 2001.
[2] Bryan Lehman and Ernst Worrell. ElectricityProduction from Natural Gas Pressure Recov-ery Using Expansion Turbines. In Proc. 2001ACEEE Summer Study on Energy Efficiencyin Industry, volume 2, pages 24–27, 2001.
[3] CHP System Powers Electrabel Gas Distribu-tion Center. Pipeline & Gas Journal, October2002.
[4] Enbridge and FuelCell Energy PowerUp World’s First DFC-ERG Fuel Cell.http://www.marketwired.com/press-release/enbridge-inc-tsx-enb-913121.htm.Date accessed: 04-05-2018.
[5] Imran Nazir Unar, Aziza Aftab, Masroor Abro,et al. Estimation of Power Production Po-tential from Natural Gas Pressure ReductionStations in Pakistan Using ASPEN HYSYS.Mehran University Research Journal of Engi-neering & Technology, 34(3):301, 2015.
[6] Natural Gas Infrastructures TPA Website.https://www.ign.ren.pt/en/. Date accessed:05-05-2018.
[7] Rogerio Duarte and Miguel Santos. Clima-tizacao Geosolar em Moura. 2012.
[8] EG Hammerschmidt. Formation of Gas Hy-drates in Natural Gas Transmission Lines. In-dustrial & Engineering Chemistry, 26(8):851–855, 1934.
[9] Saeid Mokhatab and William A Poe. Handbookof Natural Gas Transmission and Processing.Gulf Professional Publishing, 2012.
[10] Michael J Moran, Howard N Shapiro, Daisie DBoettner, and Margaret B Bailey. Fundamen-tals of Engineering Thermodynamics. JohnWiley & Sons, 2010.
[11] Kh Nasrifar and O Bolland. Prediction ofThermodynamic Properties of Natural GasMixtures Using 10 Equations of State Includ-ing a New Cubic Two-Constant Equation ofState. Journal of Petroleum Science and En-gineering, 51(3-4):253–266, 2006.
[12] Ulrich Setzmann and Wolfgang Wagner. A newequation of state and tables of thermodynamicproperties for methane covering the range fromthe melting line to 625 k at pressures up to100 mpa. Journal of Physical and Chemicalreference data, 20(6):1061–1155, 1991.
[13] Abbas Zabihi and Majid Taghizadeh. Feasibil-ity Study on Energy Recovery at Sari-AkandCity Gate Station Using Turboexpander. Jour-nal of Natural Gas Science and Engineering,35:152–159, 2016.
[14] Navid Zehtabiyan Rezaie and Majid Saffar-Avval. Feasibility study of turbo expander in-stallation in city gate station. In Proceedingsof the 25th International Conference on Effi-ciency, Cost, Optimization and Simulation ofEnergy Conversion Systems and Processes, Pe-rugia, Italy, volume 2629, page 47, 2012.
[15] Dossier de Imprensa - Tarifas e Precos para aEnergia Eletrica em 2018. ERSE, 15-12-2017.
10