energy production and consumption in portugal: stylized facts
TRANSCRIPT
Articles | Summer 2010
Economic Bulletin | Banco de Portugal 69
ENERGY PRODUCTION AND CONSUMPTION IN PORTUGAL: STYLIZED FACTS*
João Amador**
1. INTRODUCTION
Energy is of vital importance in all economies. As a matter of fact, energy is a basic input in virtually
all production processes and an important fi nal consumption item for households. Therefore, struc-
tural characteristics in terms of energy production and consumption, as well as shocks in prices or
quantities, have a strong impact in most economic variables. The literature on the impact of energy in
economic activity is wide and regained interest in the last years due to the increase and high volatility
of its prices. Some recent papers on the macroeconomic impact and drivers of oil price shocks are
Blanchard and Gali (2008), Kilian (2009) and Hamilton (2009).
There are multiple and interrelated dimensions involved in the analysis of the impact of energy in
economies, ranging from microeconomic regulatory issues to macroeconomic impacts on GDP, infl a-
tion and the current account. The analysis of energy issues has its own specifi cities, though energy
markets share many of the basic characteristics of other markets in the economy. The supply of
energy implies the transformation of primary energy sources into types of energy that can be later
used as inputs or as fi nal households’ consumption. For example, hydroelectric power can be used to
produce electricity and crude oil can be transformed into liquid fuel for road, maritime or air transport.
The extraction of primary energy sources and their transformation into different types of energy prod-
ucts is an economic activity by itself and contributes to the total gross value added and employment.
The energy sectors are typically associated with network industries. The investments required in
energy extraction, transformation and distribution are typically high, leading to markets dominated
by a small number of fi rms, which interact with an inelastic energy demand curve. This gives rise to
important competition issues that are typically settled by specifi c regulatory authorities, either at the
national or at the European level (see, for example, EC (2009)). As in other markets, primary and
secondary energy supply is not only a function of energy endowments but it is also affected by energy
price levels. In addition, the structure of primary and secondary energy production depends on the
relative cost of each production technology, which may include not only economic and fi nancial costs,
in their strict sense.
In macroeconomic terms, the signifi cant share of energy in total production costs and in households’
total expenditure turn supply induced energy price shocks into important drivers of economic fl uctua-
* The author thanks comments by Jorge Correia da Cunha and José Ramos Maria. The opinions expressed in the article are those of the author and do not necessarily coincide with those of Banco de Portugal or the Eurosystem. Any errors and omissions are the sole responsibility of the author.
** Banco de Portugal, Economics and Research Department.

Summer 2010 | Articles
Banco de Portugal | Economic Bulletin70
tions. Conversely, developments in international economic activity potentially affect energy prices
through the demand of energy. Overall, energy shocks potentially affect producer costs, infl ation
and output, as well as external competitiveness and the terms of trade. The effect of energy shocks
on the foreign account is naturally stronger for countries with higher energy dependence, i.e., those
where domestic primary energy production covers a small share of fi nal energy consumption. In the-
se countries the current account balance is typically affected by swings in international energy prices
through changes in the terms of trade, though in some cases a positive effect can emerge from a
higher foreign demand by oil exporting countries. In addition, a high energy dependence exposes
countries to episodes of severe energy shortages associated with political or military instability, with
disrupting effects on economic activity.1 Finally, environmental concerns have become stronger and
emissions reducing policies have become important in the recent years, with direct consequences on
energy production and consumption (see, for example, Tol (2008)). These issues will certainly shape
energy policies and the energy sector over the next decades.
This article aims to characterize structural aspects in the Portuguese energy production and con-
sumption patterns, taking a long term perspective and providing a comparison with other advanced
countries. The data used in the article comes essentially from the International Energy Agency (IEA)
database. We focus just on a set of aggregate stylized facts, including key indicators like energy
dependence and energy intensity, but setting aside issues related with market structure and regu-
lation, infl ation and current account. Although very important, the later topics require autonomous
and methodologically different papers. A broader analysis, including the characteristics of energy
markets, regulatory issues and the impact of energy prices in activity and infl ation in the euro area
is presented in ECB (2010). In addition, taking a detailed and policy-oriented approach, AIE (2009)
reviews recent energy developments in Portugal, including energy policies, sectoral analysis and
energy technology. Neves and Esteves (2004) discuss the channels through which oil prices affect
the economy and present estimates for the overall impact of an oil price increase on GDP and prices
in the main developed countries and Portugal.
The article is organized as follows. In Section 2 we analyze the structure of primary energy production
in Portugal and its foreign dependence. Section 3 presents the share of energy producing sectors in
the Portuguese total gross value added and employment and describes the patterns of fi nal energy
production and consumption. Section 4 turns to the analysis of the links between economic activity
and energy consumption (energy intensity). Section 5 concludes.
(1) For an extensive analysis of energy security issues see, for example, Bohi and Toman (1996).

Articles | Summer 2010
Economic Bulletin | Banco de Portugal 71
2. PRIMARY SOURCES OF ENERGY AND SUPPLIERS
2.1 Primary energy production
Primary energy production is the fi rst stage in the energy production activity. The structure of primary
energy production is very heterogeneous across countries and changes slowly along decades as
it heavily depends on the endowment of natural resources and past investments in energy produc-
ing infrastructures such as dams or nuclear central facilities. The panel a) of Chart 1 presents the
structure of primary energy production in Portugal from 1960 to 2008. “Combustible renewables and
waste’’ represent the largest share of domestic energy production with a share of about 70 per cent
in 2008.2 Primary energy production based on hydro power plants is the second largest domestic
source of primary energy, with an average share of about 20 per cent in the last decade. This compo-
nent is substantially volatile as it depends on the yearly amount of rain.3 Solid fuels (coal and peat),
represented around 20 per cent of primary energy production in Portugal in the beginning of the
sixties, but recorded a declining trend and have virtually disappeared in the last decade. Renewable
energies like the solar, wind and geothermal have signifi cantly increased their importance, though
they still represent a relatively small share in total domestic energy production (16 per cent in 2008).4
Panel b) of Chart 1 compares the structure of primary energy production in a set of advanced coun-
(2) According to the IEA methodology, combustible renewables and waste comprises solid biomass, liquid biomass, biogas, industrial waste and municipal waste. Biomass is defi ned as any plant matter used directly as fuel or converted into fuels (e.g. charcoal) or electricity and/or heat. Included here are wood, vegetal waste (including wood waste and crops used for energy production), ethanol, animal materials/wastes and sulphite lyes. Municipal waste compri-ses wastes produced by the residential, commercial and public service sectors that are collected by local authorities for disposal in a central location for the production of heat and/or power. Hospital waste is included in this category. Data under this heading are often based on incomplete information. Thus the data give only a broad impression of developments, and are not strictly comparable between countries. In some cases complete categories of vegetal fuel are omitted due to lack of information.
(3) Although other sources of energy can be used to partially refi ll dams, especially when there is low electricity demand (e.g. if wind power is being generated during hours of low electricity consumption - mix of primary energy sources), the yearly amount of rain clearly determines hydro electric production in the following periods.
(4) Different sources of energy are converted into a common unit of measurement, tonnes of oil equivalent (toe).
Chart 1
STRUCTURE OF PRIMARY PRODUCTION (a) Portugal (b) Selected OECD countries (2008) (Break in 1989 due to reclassifi cation of categories)
Sources: IEA (International Energy Agency) and author’s calculations.
0
10
20
30
40
50
60
70
80
90
100
1960 1964 1968 1972 1976 1980 1984 1988 1992 1996 2000 2004 2008
Per
cen
t
Solid fuels HydroGeothermal Solar/wind/otherCombustible renewables and waste
0
10
20
30
40
50
60
70
80
90
100
AT
BE
DK FI
FR
DE
GR IE IT JP LU ND PT
ES
SW UK
US
EU
15E
A12
Per
cen
t
Renewables Nuclear Gas Oil Solid fuels

Summer 2010 | Articles
Banco de Portugal | Economic Bulletin72
tries in 2008. Portugal and Luxembourg are the only countries with primary energy production relying
entirely on renewable energies. Other countries poorly endowed with primary energy sources like oil,
gas or solid fuels have adopted nuclear energy. This is the case of Belgium, Finland, France, Japan,
Spain and Sweden. Other economies like Germany, Netherlands, UK and US have also adopted
nuclear energy, despite relevant endowments of other energy sources. The Netherlands stands out
as a country with a signifi cant share of gas, while Denmark and the UK present signifi cant shares of
both gas and oil.
The comparison between the level of domestic energy production and total primary energy supply
sets the degree of energy dependence, i.e., the share of energy supplied to the economy that is
imported. Chart 2 reports the evolution of this indicator for Portugal and the EU15 since the sixties
and also a comparison across a set of advanced countries in the recent years. The degree of energy
dependence in Portugal has always been substantially higher than that observed in the EU15, around
84 per cent in the last three decades. This is partly the refl ex of the structure of primary energy pro-
duction, which bases solely on renewables, and it is related to the broader issue of poor total energy
endowments. Nevertheless, the degree of energy dependence in Portugal is similar to that of Spain
in the period 2006-2008 (88 per cent) and lower than that of Luxembourg, Ireland, Belgium and Italy.
Denmark is the only net exporter of energy in the set of countries presented.
Energy dependence by type of product depends on several aspects. Firstly, countries’ endowments
determine net imports. For example, there will be low imports of locally abundant energy sources.
Secondly, some countries import primary energy as an input to produce fi nal energy that is subse-
quently exported. This is basically the case of the oil refi ning industry. Thirdly, energy imports depend
on the technological choices related with the production of fi nal energy for consumption, notably for
Chart 2
ENERGY DEPENDENCE(a) Portugal (b) Selected OECD countries (average 2006-2008)
Sources: IEA (International Energy Agency) and author’s calculations.
0
20
40
60
80
100
120
1960 1964 1968 1972 1976 1980 1984 1988 1992 1996 2000 2004 2008
Per
cen
t
EU15
Portugal
-40
-20
0
20
40
60
80
100
120
AT
BE
DK FI
FR
DE
GR IE IT JP LU ND PT
ES
SW UK
US
EA
12E
U15
Per
cen
t
Articles | Summer 2010
Economic Bulletin | Banco de Portugal 73
the production of electricity. More generally, the transformation of primary energy sources into energy
for fi nal consumption is dependent on the structural conditions, technological choices and countries’
policies. It should be noted that, as in other markets, primary energy supply is not only a function of
energy endowments but it is also affected by its prices. In addition, the structure of primary energy
production also depends on the relative cost of each production technology, which may include not
only economic and fi nancial costs, in their strict sense. Moreover, primary energy production usually
involves signifi cant fi xed costs, thus investment decisions in these markets typically consider a long-
term horizon.
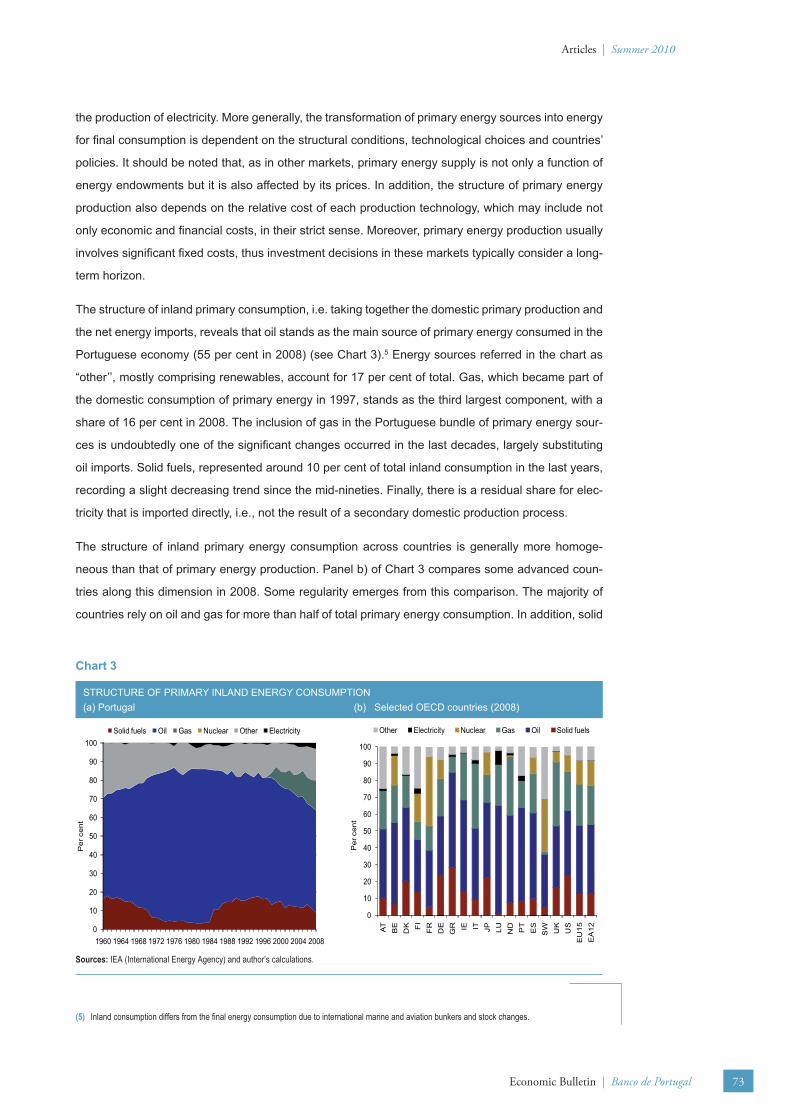
The structure of inland primary consumption, i.e. taking together the domestic primary production and
the net energy imports, reveals that oil stands as the main source of primary energy consumed in the
Portuguese economy (55 per cent in 2008) (see Chart 3).5 Energy sources referred in the chart as
“other’’, mostly comprising renewables, account for 17 per cent of total. Gas, which became part of
the domestic consumption of primary energy in 1997, stands as the third largest component, with a
share of 16 per cent in 2008. The inclusion of gas in the Portuguese bundle of primary energy sour-
ces is undoubtedly one of the signifi cant changes occurred in the last decades, largely substituting
oil imports. Solid fuels, represented around 10 per cent of total inland consumption in the last years,
recording a slight decreasing trend since the mid-nineties. Finally, there is a residual share for elec-
tricity that is imported directly, i.e., not the result of a secondary domestic production process.
The structure of inland primary energy consumption across countries is generally more homoge-
neous than that of primary energy production. Panel b) of Chart 3 compares some advanced coun-
tries along this dimension in 2008. Some regularity emerges from this comparison. The majority of
countries rely on oil and gas for more than half of total primary energy consumption. In addition, solid
(5) Inland consumption differs from the fi nal energy consumption due to international marine and aviation bunkers and stock changes.
Chart 3
STRUCTURE OF PRIMARY INLAND ENERGY CONSUMPTION(a) Portugal (b) Selected OECD countries (2008)
Sources: IEA (International Energy Agency) and author’s calculations.
0
10
20
30
40
50
60
70
80
90
100
1960 1964 1968 1972 1976 1980 1984 1988 1992 1996 2000 2004 2008
Per
cen
t
Solid fuels Oil Gas Nuclear Other Electricity
0
10
20
30
40
50
60
70
80
90
100
AT
BE
DK FI
FR
DE
GR IE IT JP LU ND PT
ES
SW UK
US
EU
15E
A12
Per
cen
t
Other Electricity Nuclear Gas Oil Solid fuels

Summer 2010 | Articles
Banco de Portugal | Economic Bulletin74
fuels tend to represent less than 20 per cent of total primary consumption. Finally, nuclear energy
naturally plays a larger role in countries which have a lower share of fossil fuels.
2.2 Foreign suppliers
The choice of foreign energy suppliers depends on geographical aspects, types of products imported
and energy security considerations. Although energy security involves several dimensions, the reli-
ability and accessibility of energy sources are key aspects.6 In this respect, in last decades Portugal
has diversifi ed the set of foreign energy suppliers, increasing overall energy security. Chart 4 plots
the share of different regions in total energy imports in nominal terms from 1967 to 2008. The im-
portance of the Gulf countries in Portuguese energy imports was very high during the seventies but
dropped substantially afterwards and presently their weight is only slightly higher than 10 per cent.
Conversely, European suppliers (EU15 plus Norway) increased their importance, with a peak of
around 40 per cent in the late nineties. More recently, the North African and the sub-Saharan African
regions signifi cantly increased their importance, the former mainly as a supplier of gas.7 The stan-
dard deviation of the shares presented in Chart 4 decreased from a maximum of 34.5 in 1979 to a
minimum of 1.4 in 1990, standing presently around 5 per cent. Apart from these regions, Brazil and
Russia presently represent 10 per cent of total energy imports.
(6) Other dimensions of energy security include exposure to the volatility in prices and negotiating power, degree of electrical connectivity, etc. For a longer discussion of this issue and an energy security index for the euro area see Box 2 in ECB (2010).
(7) It should be noted that before February 2004, most gas imports from Nigeria arrived via the Huelva terminal in Spain, where they are regasifi ed and sent by pipeline to Portugal. Since February 2004, gas imports arrive directly in Portugal at the Sines terminal.
Chart 4
FOREIGN ENERGY SUPPLIERS
Sources: CHELEM and author’s calculations.
0
10
20
30
40
50
60
70
80
1967 1971 1975 1979 1983 1987 1991 1995 1999 2003 2007
Per
cen
t
EU15 + Norway North Africa Africa sub-Sahara Gulf

Articles | Summer 2010
Economic Bulletin | Banco de Portugal 75
3. ENERGY INDUSTRIES AND CONSUMPTION PATTERNS
3.1 Gross value added and employment
Primary energy sources must be extracted and transformed into energy products suitable to be used
as inputs in the production chain of fi rms or consumed by households. Therefore, the activities of
extracting and transforming primary energy into fi nal energy products are important in any economy.
Nevertheless, fi gures for sectoral gross value added and employment are plagued by statistical prob-
lems, especially if a long period or a cross country comparison is required. The set of energy related
industries comprises the sectors “mining and quarrying of energy producing materials’’, “coke, refi ned
petroleum products and nuclear fuel’’ and “electricity, gas, steam and hot water supply’’ of the Interna-
tional Standard Industrial Classifi cation of economic activities, Revision 3 (ISIC Rev. 3).
Chart 5 presents the share of these sectors in gross value added (GVA) and employment in a set of
advanced countries for the average of the period 2004-2006. The sector of “electricity, gas, steam
and hot water supply’’ is typically the largest energy sector, except in countries that have signifi cant
primary energy endowments and thus signifi cant “mining and quarrying of energy producing materi-
als’’ activities (Denmark, Netherlands and UK). With the exception of these three countries, the share
of energy related industries in total GVA is lower than 3 per cent. In what concerns the share of em-
ployment in energy related industries on total employment in the economy, values are small (lower
than 1 per cent) and “electricity, gas, steam and hot water supply’’ plays the largest role. As for the
Portuguese economy, the share of energy related activities in total GVA is near the average (2.6 per
cent) but their share in total employment is the lowest of all countries represented (0.22 per cent),
with a slight declining trend along the last decades.
Chart 5
SHARE OF ENERGY SECTORS IN GVA AND EMPLOYMENT(a) Gross value added (b) Employment
Source: OECD (STAN).
0.0
1.0
2.0
3.0
4.0
5.0
6.0
AT BE DK FI DE GR IT LU ND PT ES SW UK
Per
cen
t
Mining and quarrying of energy producing materialsCoke, refined petroleum products and nuclear fuelElectricity, gas, steam and hot water supply
0.0
0.1
0.2
0.3
0.4
0.5
0.6
0.7
0.8
0.9
AT BE DK FI DE GR IT LU ND PT ES SW
Per
cen
t
Mining and quarrying of energy producing materialsCoke, refined petroleum products and nuclear fuelElectricity, gas, steam and hot water supply

Summer 2010 | Articles
Banco de Portugal | Economic Bulletin76
3.2 Patterns of energy consumption
Households and fi rms consume a set of energy products. The panel a) of Chart 6 presents the struc-
ture of fi nal energy consumption in Portugal by type of product. Oil is the dominant fi nal energy prod-
uct consumed in Portugal, with a share above 55 per cent in 2008. Nevertheless, this share has been
decreasing since the mid-nineties. Electricity represents about one fi fth of total fi nal energy consump-
tion, while “other’’ (mostly combustible renewables) represents about 17 per cent. Finally, there is a
progressive usage of gas, which presently represents about 7 per cent of fi nal energy consumption.
In international terms oil is the dominant fi nal energy product in consumption.
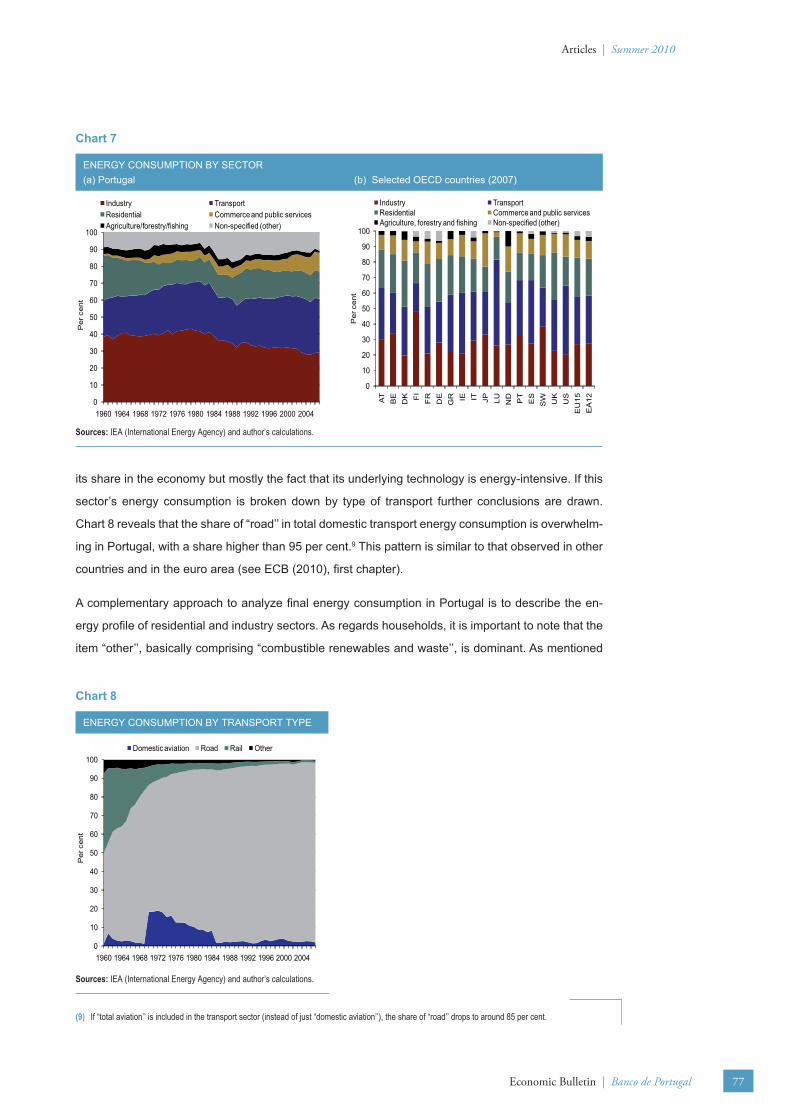
The structure of fi nal energy consumption by sector is, inter alia, the refl ex of the structure of the
economy and its level of development. This latter factor is related with the type of technologies used
in production and the profi le of households’ consumption. Since these are structural aspects in the
economy, the sectoral structure of energy consumption evolves slowly along the decades. Panel a)
of Chart 7 sector presents the evolution of this structure for the Portuguese economy since 1960. In
the last two decades “industry’’ and “transport’’ represented each one third of total fi nal energy con-
sumption. The third largest consumption sector is “residential’’, with a share of around 16 per cent.
“Commerce and public services’’ have increased their share, representing presently more than 10
per cent of total energy consumption, while the reverse trend is observed in “agriculture, forestry and
fi shing’’. The “non-specifi ed’’ item is interpreted as a residual component.8 Panel b) of Chart 7 sector
shows that the structure of energy consumption by sector is not very different across countries.
The large importance of the transport sector in fi nal domestic energy consumption refl ects not only
(8) This residual component includes: i) non-specifi ed items, i.e., all fuel use not elsewhere specifi ed as well as consumption in the above-designated cate-gories for which separate fi gures have not been provided. Military fuel use for all mobile and stationary consumption is included here (e.g. ships, aircraft, road and energy used in living quarters) regardless of whether the fuel delivered is for the military of that country or for the military of another country; ii) non-energy use, which covers those fuels that are used as raw materials in the different sectors and are not consumed as a fuel or transformed into another fuel. These items are of diffi cult measurement and subject to reclassifi cation, thus causing series breaks.
Chart 6
STRUCTURE OF FINAL ENERGY CONSUMPTION(a) Portugal (b) Selected OECD countries (2007)
0
10
20
30
40
50
60
70
80
90
100
1960 1964 1968 1972 1976 1980 1984 1988 1992 1996 2000 2004
Per
cen
t
Solid fuels Oil Gas Heat Other Electricity
0
10
20
30
40
50
60
70
80
90
100
AT
BE
DK FI
FR
DE
GR IE IT JP LU ND PT
ES
SW UK
US
EU
15E
A12
Per
cen
t
Solid Oil Gas Heat Other Electricity
Sources: IEA (International Energy Agency) and author’s calculations.
Articles | Summer 2010
Economic Bulletin | Banco de Portugal 77
its share in the economy but mostly the fact that its underlying technology is energy-intensive. If this
sector’s energy consumption is broken down by type of transport further conclusions are drawn.
Chart 8 reveals that the share of “road’’ in total domestic transport energy consumption is overwhelm-
ing in Portugal, with a share higher than 95 per cent.9 This pattern is similar to that observed in other
countries and in the euro area (see ECB (2010), fi rst chapter).
A complementary approach to analyze fi nal energy consumption in Portugal is to describe the en-
ergy profi le of residential and industry sectors. As regards households, it is important to note that the
item “other’’, basically comprising “combustible renewables and waste’’, is dominant. As mentioned
(9) If “total aviation’’ is included in the transport sector (instead of just “domestic aviation’’), the share of “road’’ drops to around 85 per cent.
Chart 7
ENERGY CONSUMPTION BY SECTOR(a) Portugal (b) Selected OECD countries (2007)
Sources: IEA (International Energy Agency) and author’s calculations.
0
10
20
30
40
50
60
70
80
90
100
1960 1964 1968 1972 1976 1980 1984 1988 1992 1996 2000 2004
Per
cen
t
Industry TransportResidential Commerce and public servicesAgriculture/forestry/fishing Non-specified (other)
0
10
20
30
40
50
60
70
80
90
100
AT
BE
DK FI
FR
DE
GR IE IT JP LU ND PT
ES
SW UK
US
EU
15E
A12
Per
cen
t
Industry TransportResidential Commerce and public servicesAgriculture, forestry and fishing Non-specified (other)
Chart 8
ENERGY CONSUMPTION BY TRANSPORT TYPE
Sources: IEA (International Energy Agency) and author’s calculations.
0
10
20
30
40
50
60
70
80
90
100
1960 1964 1968 1972 1976 1980 1984 1988 1992 1996 2000 2004
Per
cen
t
Domestic aviation Road Rail Other

Summer 2010 | Articles
Banco de Portugal | Economic Bulletin78
above, this item is important in the structure of the domestic primary energy production, but this high
share also refl ects the existence of statistical problems as data under this heading are often based on
incomplete information. Electricity plays an important role in the energy basket of households (35.5
per cent in the period 2004-2007). This item has been gaining importance in the last years, contrary
to what is observed for oil products, whose share is presently slightly higher than 20 per cent. The
consumption of gas is still small but it increased signifi cantly in the last decade (see top panel of Table
1). This structure shows important differences relatively to the (non-weighted) average of the EU15.
The share of electricity in the households’ energy consumption bundle is lower in the EU15 (24.6 per
cent in the period 2004-2007), while that of oil is relatively close. The largest difference concerns the
share of gas, which is the largest household energy consumption item in many EU15 countries. In
addition, the consumption of heat is non-negligible in the EU15 as it is in Portugal.10
In what concerns the energy profi le of the industry sector, the lower panel of Table 1 reveals that
electricity and oil play the leading roles, with shares in Portugal of 26 and 27 per cent in the period
2004-2007, respectively. Nevertheless the share of oil has been decreasing very substantially, having
reached 41 per cent in the period 1992-1998. This has been compensated by the increase in the
share of gas in industry energy consumption, which increased from a share of 0.7 per cent in 1992-98
to 16.9 per cent in 2004-07. Comparatively to the EU15 average, despite the recent developments,
the Portuguese industrial energy consumption bundle has still a high share of oil and relatively lower
shares of electricity and, mostly gas. As in the residential sector, the share of the item “other’’ is com-
paratively high in Portugal.
(10) Heat production includes all heat produced by main activity producer combined heat and power (CHP) and heat plants, as well as heat sold by autopro-ducer CHP and heat plants to third parties.
Table 1PATERNS OF CONSUMPTION OF RESIDENCIAL AND INDUSTRY SECTORS IN PORTUGAL AND THE EU15
Portugal EU15
Consumption profi le of residential 1992-98 1999-03 2004-07 1992-98 1999-03 2004-07
Electricity 26.1 31.5 35.5 21.3 22.7 24.6
Oil 27.1 24.2 21.3 25.6 22.9 19.8
Gas 1.8 4.1 6.3 35.5 39.6 42.9
Solid fuels 0.0 0.0 0.0 3.6 1.6 1.0
Heat 0.0 0.2 0.2 5.2 4.4 2.5
Other 45.0 40.0 36.7 8.8 8.8 9.3
Total 100 100 100 100 100 100
Consumption profi le of industry 1992-98 1999-03 2004-07 1992-98 1999-03 2004-07
Electricity 22.8 22.6 26.1 30.1 31.7 33.1
Oil 41.3 37.4 27.0 19.2 17.0 15.8
Gas 0.7 12.3 16.9 30.8 34.1 31.6
Solid fuels 10.4 4.3 1.3 13.1 9.0 8.3
Heat 0.9 2.5 5.2 1.3 2.6 5.1
Other 23.8 21.0 23.5 5.6 5.7 6.1
Total 100 100 100 100 100 100
Sources: IEA (International Energy Agency) and author’s calculations.Note: EU15 - Average non-weighted.
Articles | Summer 2010
Economic Bulletin | Banco de Portugal 79
4. ENERGY INTENSITY
The ratio between energy consumption in an economy and its GDP level - the energy intensity - is a
typical variable when energy stylized facts are analyzed. The economic literature refers that the path
of energy intensity depends on a complex interaction between structural factors and cyclical develo-
pments. The list of factors affecting energy intensity over time is long and includes variables like the
per capita GDP level, sectoral specialization of the economy, production technologies, average age
of the capital stock, transportation patterns, climactic conditions and overall energy effi ciency. Chima
(2007) presents a list of references for the literature on the determinants of energy intensity and gives
emphasis to the inverse U-shape relation between per capita GDP level and energy intensity. Less
developed economies, with a high share of low-energy intensive activities and poor living conditions
tend to show low energy intensity. The same reasoning explains that economies in catching up tend
to show rising energy intensities and those more advanced, which make use of effi cient production
processes and energy saving technologies, may record declining energy intensities. Although many
variables affect energy intensity, this indicator is often used as a proxy for energy effi ciency, espe-
cially among similar countries.
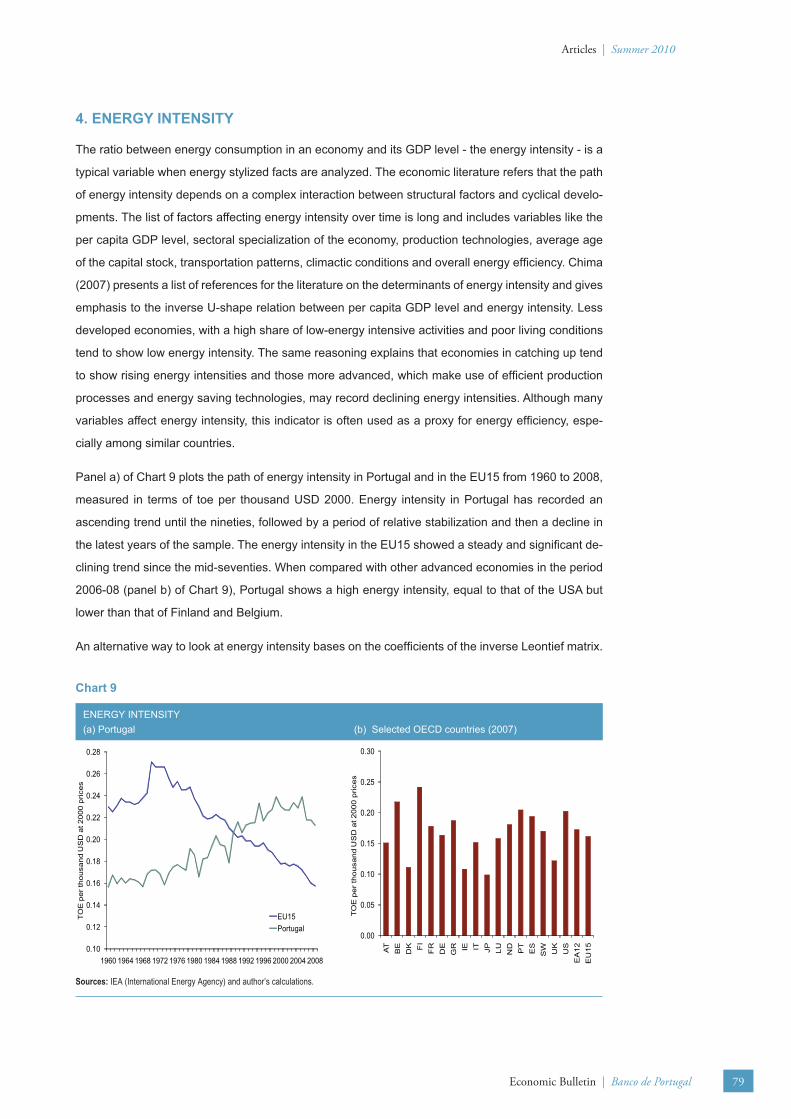
Panel a) of Chart 9 plots the path of energy intensity in Portugal and in the EU15 from 1960 to 2008,
measured in terms of toe per thousand USD 2000. Energy intensity in Portugal has recorded an
ascending trend until the nineties, followed by a period of relative stabilization and then a decline in
the latest years of the sample. The energy intensity in the EU15 showed a steady and signifi cant de-
clining trend since the mid-seventies. When compared with other advanced economies in the period
2006-08 (panel b) of Chart 9), Portugal shows a high energy intensity, equal to that of the USA but
lower than that of Finland and Belgium.
An alternative way to look at energy intensity bases on the coeffi cients of the inverse Leontief matrix.
Chart 9
ENERGY INTENSITY(a) Portugal (b) Selected OECD countries (2007)
Sources: IEA (International Energy Agency) and author’s calculations.
0.10
0.12
0.14
0.16
0.18
0.20
0.22
0.24
0.26
0.28
1960 1964 1968 1972 1976 1980 1984 1988 1992 1996 2000 2004 2008
TO
E p
er th
ousa
nd U
SD
at 2
000
pric
es
EU15Portugal
0.00
0.05
0.10
0.15
0.20
0.25
0.30
AT
BE
DK FI
FR
DE
GR IE IT JP LU ND PT
ES
SW UK
US
EA
12E
U15
TO
E p
er th
ousa
nd U
SD
at 2
000
pric
es
Summer 2010 | Articles
Banco de Portugal | Economic Bulletin80
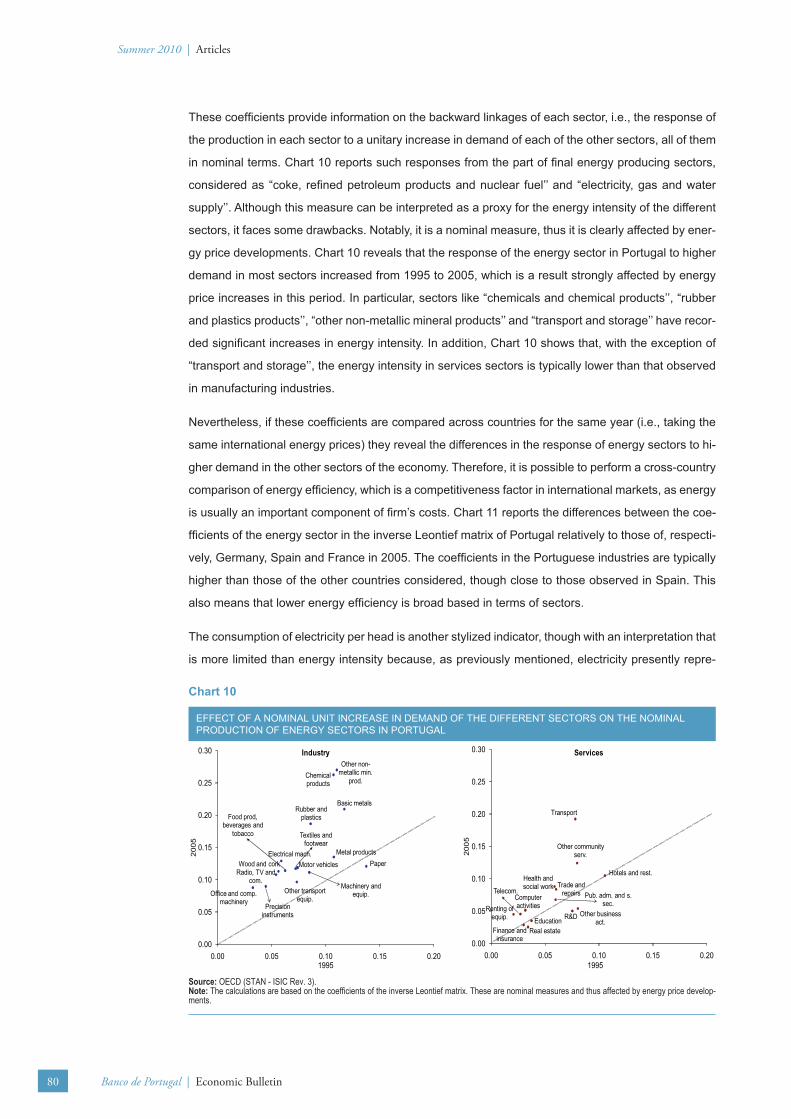
These coeffi cients provide information on the backward linkages of each sector, i.e., the response of
the production in each sector to a unitary increase in demand of each of the other sectors, all of them
in nominal terms. Chart 10 reports such responses from the part of fi nal energy producing sectors,
considered as “coke, refi ned petroleum products and nuclear fuel’’ and “electricity, gas and water
supply’’. Although this measure can be interpreted as a proxy for the energy intensity of the different
sectors, it faces some drawbacks. Notably, it is a nominal measure, thus it is clearly affected by ener-
gy price developments. Chart 10 reveals that the response of the energy sector in Portugal to higher
demand in most sectors increased from 1995 to 2005, which is a result strongly affected by energy
price increases in this period. In particular, sectors like “chemicals and chemical products’’, “rubber
and plastics products’’, “other non-metallic mineral products’’ and “transport and storage’’ have recor-
ded signifi cant increases in energy intensity. In addition, Chart 10 shows that, with the exception of
“transport and storage’’, the energy intensity in services sectors is typically lower than that observed
in manufacturing industries.
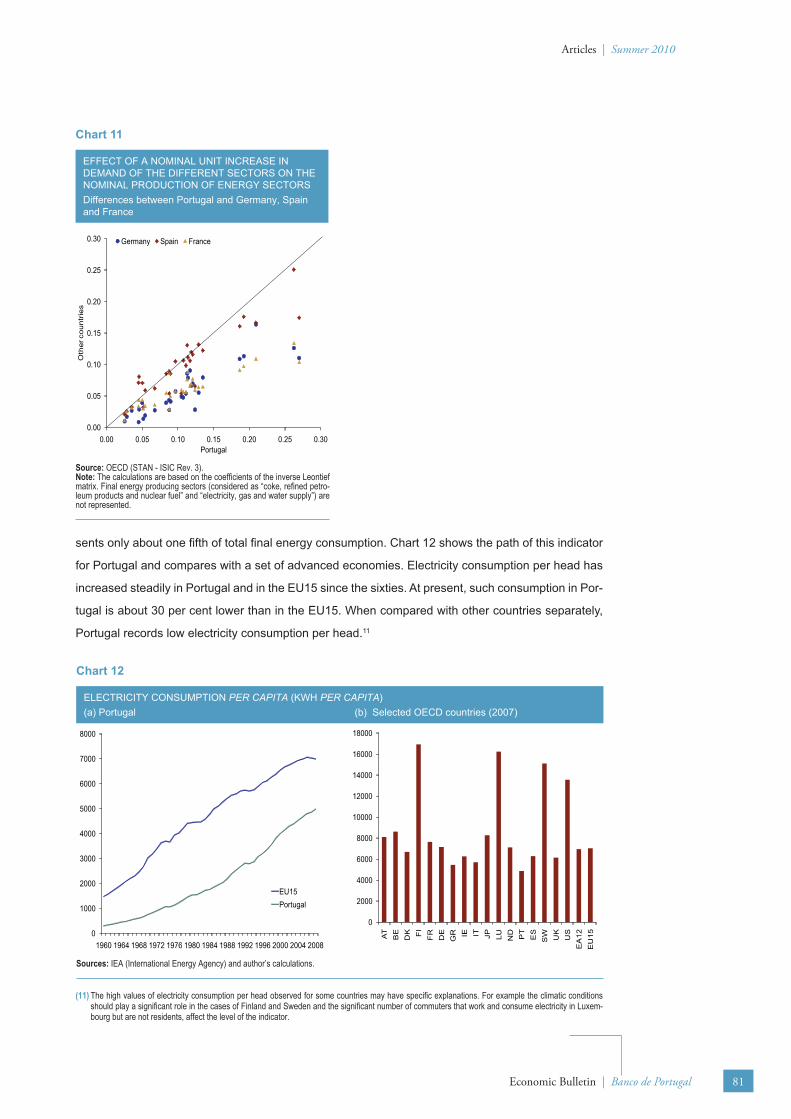
Nevertheless, if these coeffi cients are compared across countries for the same year (i.e., taking the
same international energy prices) they reveal the differences in the response of energy sectors to hi-
gher demand in the other sectors of the economy. Therefore, it is possible to perform a cross-country
comparison of energy effi ciency, which is a competitiveness factor in international markets, as energy
is usually an important component of fi rm’s costs. Chart 11 reports the differences between the coe-
ffi cients of the energy sector in the inverse Leontief matrix of Portugal relatively to those of, respecti-
vely, Germany, Spain and France in 2005. The coeffi cients in the Portuguese industries are typically
higher than those of the other countries considered, though close to those observed in Spain. This
also means that lower energy effi ciency is broad based in terms of sectors.
The consumption of electricity per head is another stylized indicator, though with an interpretation that
is more limited than energy intensity because, as previously mentioned, electricity presently repre-
Chart 10
EFFECT OF A NOMINAL UNIT INCREASE IN DEMAND OF THE DIFFERENT SECTORS ON THE NOMINAL PRODUCTION OF ENERGY SECTORS IN PORTUGAL
Source: OECD (STAN - ISIC Rev. 3).Note: The calculations are based on the coeffi cients of the inverse Leontief matrix. These are nominal measures and thus affected by energy price develop-ments.
Textiles and footwear
Food prod, beverages and
tobacco
Wood and cork Paper
Chemical products
Rubber and plastics
Other non-metallic min.
prod.
Basic metals
Metal products
Machinery and equip.Office and comp.
machinery
Electrical mach.
Radio, TV and com.
Precision instruments
Motor vehicles
Other transport equip.
0.00
0.05
0.10
0.15
0.20
0.25
0.30
0.00 0.05 0.10 0.15 0.20
2005
1995
Industry
Health and social work
EducationReal estate
Transport
Finance and insurance
Hotels and rest.
Telecom. Pub. adm. and s. sec.
R&D
Computer activities
Trade and repairs
Other community serv.
Other business act.
Renting of equip.
0.00
0.05
0.10
0.15
0.20
0.25
0.30
0.00 0.05 0.10 0.15 0.20
2005
1995
Services
Articles | Summer 2010
Economic Bulletin | Banco de Portugal 81
sents only about one fi fth of total fi nal energy consumption. Chart 12 shows the path of this indicator
for Portugal and compares with a set of advanced economies. Electricity consumption per head has
increased steadily in Portugal and in the EU15 since the sixties. At present, such consumption in Por-
tugal is about 30 per cent lower than in the EU15. When compared with other countries separately,
Portugal records low electricity consumption per head.11
(11) The high values of electricity consumption per head observed for some countries may have specifi c explanations. For example the climatic conditions should play a signifi cant role in the cases of Finland and Sweden and the signifi cant number of commuters that work and consume electricity in Luxem-bourg but are not residents, affect the level of the indicator.
Chart 11
EFFECT OF A NOMINAL UNIT INCREASE IN DEMAND OF THE DIFFERENT SECTORS ON THE NOMINAL PRODUCTION OF ENERGY SECTORS Differences between Portugal and Germany, Spain and France
Source: OECD (STAN - ISIC Rev. 3).Note: The calculations are based on the coeffi cients of the inverse Leontief matrix. Final energy producing sectors (considered as “coke, refi ned petro-leum products and nuclear fuel” and “electricity, gas and water supply”) are not represented.
0.00
0.05
0.10
0.15
0.20
0.25
0.30
0.00 0.05 0.10 0.15 0.20 0.25 0.30
Oth
er c
ount
ries
Portugal
Germany Spain France
Chart 12
ELECTRICITY CONSUMPTION PER CAPITA (KWH PER CAPITA) (a) Portugal (b) Selected OECD countries (2007)
Sources: IEA (International Energy Agency) and author’s calculations.
0
1000
2000
3000
4000
5000
6000
7000
8000
1960 1964 1968 1972 1976 1980 1984 1988 1992 1996 2000 2004 2008
EU15Portugal
0
2000
4000
6000
8000
10000
12000
14000
16000
18000
AT
BE
DK FI
FR
DE
GR IE IT JP LU ND PT
ES
SW UK
US
EA
12E
U15

Summer 2010 | Articles
Banco de Portugal | Economic Bulletin82
5. CONCLUDING REMARKS
This article presents a set of stylized facts regarding energy production and consumption in Portugal,
taking a long term perspective and comparing with a set of advanced economies. The links between
energy related issues, competition in the respective markets, consumer prices and the current ac-
count are not discussed.
Portugal is a country characterized by a small primary energy production, deriving from non-existent
fossil energy resources and no nuclear energy production. Primary energy production is entirely
associated with renewable energies. This structural situation naturally leads to a high level of ener-
gy dependence, which is a feature also shown by other EU15 economies. Nevertheless, such high
energy dependence does not pose immediate concerns about energy security as there is evidence
on the diversifi cation of foreign energy suppliers. In what concerns energy consumption patterns, the
general picture is not much different from that observed in other European countries, with industry
and transport representing the bulk of total energy consumption. The largest difference regarding the
energy consumption bundles of the residential and industry sectors is the still small role played by
gas.
Energy intensity in Portugal has recorded an ascending trend until the nineties, followed by a period
of relative stabilization and then a decline in the latest years of the sample. Over the same period,
the energy intensity in the EU15 showed a steady and signifi cant declining trend. The comparison
with other countries reveals that Portugal records a relatively high energy intensity, which is broad
based in terms of sectors. Such underlying structural conditions, together with international high and
volatile energy prices, will continue to stand as determinants of the potential growth of the Portuguese
economy in the future.
Articles | Summer 2010
Economic Bulletin | Banco de Portugal 83
REFERENCESBlanchard, O. and Gali, J. (2008), “The macroeconomic effects of oil prices: Why are the 2000’s so
different from the 1970’s?”, Working Paper 13368, NBER.
Bohi, D. and Toman, M. (1996), The economics of energy security, Kluwer Academic Publishers.
Chima, C. (2007), “Intensity of energy use in the usa: 1949-2003”, Journal of Business and Economics Research 5(11), 17–30.
EC (2009), “Report on progress in creating the internal gas and electricity market”, Communication from the European Commission (11.3.200, COM(2009).
ECB (2010), “Energy markets and the macro-economy”, Occasional Paper Series 113, Task Force of the Monetary Policy Committee of the European System of Central Banks, European Central Bank.
Esteves, P. and Neves, P. (2004), “Oil prices and the economy”, Banco de Portugal, Economic Bulletin - December.
Hamilton, J. D. (2009), “Causes and consequences of the oil shock of 2007-08”, Working Paper 15002, NBER.
IEA (2009), “Energy Policies of IEA countries - Portugal” 2009 Review, OECD/IEA.
Kilian, L. (2009), “Not all oil price shocks are alike: disentangling demand and supply shocks in the crude oil market”, American Economic Review 99(3), 1053–1069.
Tol, R. (2008), “The economic effects of climate change”, Journal of Economic Perspectives 23, 29–51.