energy policy implications: pjm planningflueck/chicago_pes/2012/ieee pes... · 2015-2016 new...
TRANSCRIPT

12/7/12
1
PJM©2012
Energy Policy Implications: PJM Planning
Chicago, Illinois
November 14, 2012
Steven R. Herling Vice President, Planning PJM Interconnection
PJM©2012 2
PJM as Part of the Eastern Interconnection
KEY STATISTICS PJM member companies 800+ millions of people served 60 peak load in megawatts 163,848 MWs of generating capacity 185,600 miles of transmission lines 65,441 GWh of annual energy 832,331 generation sources 1,365 square miles of territory 214,000 area served 13 states + DC externally facing tie lines 142
• 26% of generation in Eastern Interconnection
• 28% of load in Eastern Interconnection
• 19% of transmission assets in Eastern Interconnection
21% of U.S. GDP produced in PJM
As of 1/4/2012

12/7/12
2
PJM©2012 3
Order 1000 Requirements: – Planning authority required to “consider” public policy
requirements (defined as legislative and regulatory requirements)
– Order 1000 is a requirement to “evaluate” options to meet identified public policy requirements, not a requirement that PJM, on its own, order such projects be built. (Order 1000, para. 213)
Planning For Public Policy
PJM©2012 4
Public Policy Requirements
• Generation Retirement Drivers – EPA Regulations – HEDD Regulations – Other Environmental Regulations
• Generation Addition Drivers – Renewable Portfolio Standards
• Wind Generation Development • Solar Generation Development
– Marcellus Shale
• Demand Response / Energy Efficiency Programs

12/7/12
3
PJM©2012 5
Summary of Environmentally Related Rules
GHG Tailoring Rule and
Proposed NSPS
Cross State Air Pollution Rule
(vacated)
Mercury & Air Toxics
Standards
Clean Water Act 316(b)
New Jersey High Electric Demand Day
Renewable Portfolio
Standards
Pollutant or target issue
CO2 and other GHGs
• SO2 and NOx annual caps • NOx seasonal cap
Mercury, other Heavy Metals, and Acid Gases
Cooling water intake structures
Ozone formation from NOx on hot days
Ensure a certain percentage of renewables
Relevant Dates
1/1/2011 – reporting, Mid-2013 – emission limits
• 1/1/2012: Phase 1 • 1/1/2014: Phase 2 • Vacated by DC Circuit Court
4/16/2015, extension possible under safety valve
2012 final rule 2015-2018
Phase 1 - current Phase 2 - May 1, 2015
various
Units impacted
All fossil units All fossil units Primarily coal
Coal and oil, primarily coal
All existing units Peaking units All units
Standard BACT case-by-case. CO2 – 1,000 lb/MWh
Limited cap & trade. Use of FGD or DSI and SCR likely
MACT to be defined, likely FGD or DSI, ACI, fabric filter
BTA to be defined, likely not once thru cooling. Case-by-case
NOx rate standard. Use of SCR and other controls likely
Mandated percentage of electricity sales from renewables
Impact on Units
Mostly fixed costs
Fixed Costs Variable Costs -- allowance prices
Mostly fixed costs, but also some VOM
Mostly fixed costs
Mostly fixed costs
Reduced net energy market revenues for non-RPS units
PJM©2012 6
Generation Retirement Announcements
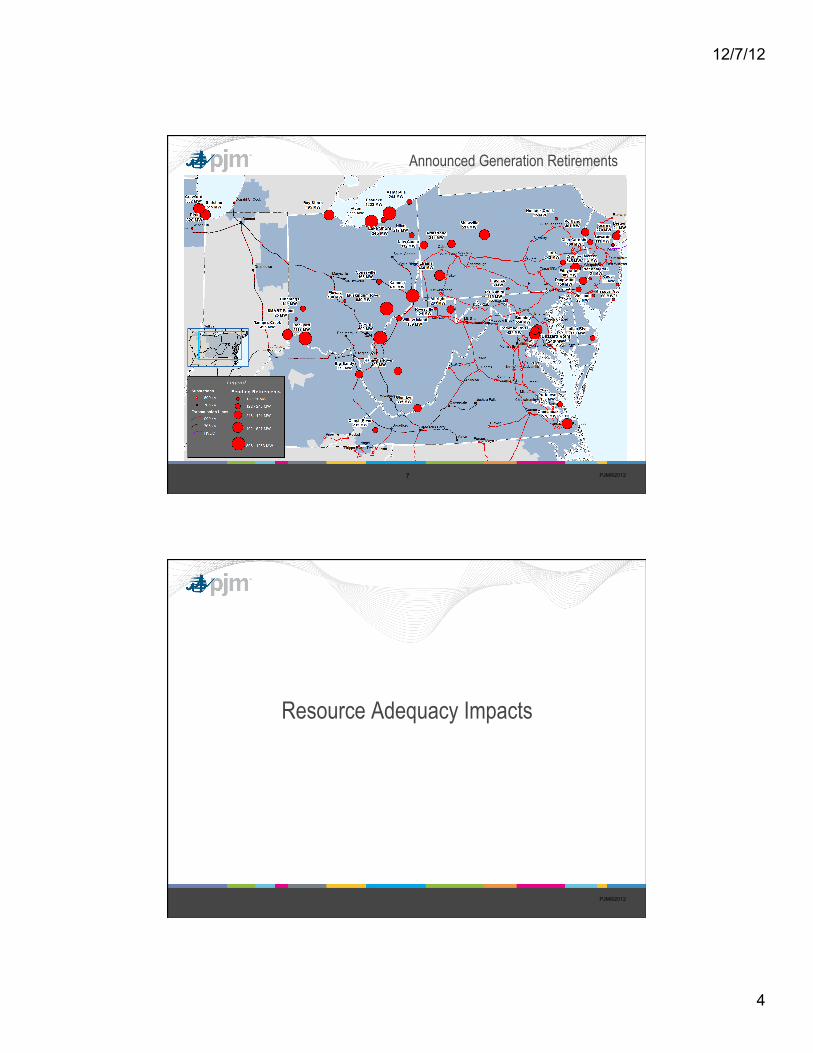
12/7/12
4
PJM©2012 7
Announced Generation Retirements
PJM©2012
Resource Adequacy Impacts

12/7/12
5
PJM©2012 9
Forecasted Reserves in PJM
PJM©2012 10
Fuel Mix of Existing PJM Installed Generating Capacity (MW) as of January 1, 2012

12/7/12
6
PJM©2012 11
Interconnection Queue
Gas
Wind
Nuclear
Solar
Coal
All Other
38,462 MWE 27,341 MWE
2,725 MWE 2,129 MWE 1,735 MWE
1,022 MWE
99 Projects 149 Projects 20 Projects 183 Projects 11 projects 51 Projects
Queue Volume by Fuel Type (as of
May 1, 2012)
Completed Interconnection Studies by Year
PJM©2012 12
Queued Generation

12/7/12
7
PJM©2012 13
State RPS Requirements
PJM©2012 14
Overlay Scenario 2: 20 GW Off-Shore Wind
Overlay Scenario 1: 4 GW Off-Shore Wind
Transmission Build-Out for Renewables

12/7/12
8
PJM©2012 15
2015-2016 new combined cycle cleared generation
PJM©2012
Transmission System Impacts

12/7/12
9
PJM©2012 17
Load Deliverability
Transmission system’s capability to deliver energy from aggregate of all capacity resources to an electrical area experiencing a capacity deficiency.
PJM©2012 18
Generator Deliverability
Strength of the transmission system to ensure that generation can be reliably transferred to the aggregate of PJM load.

12/7/12
10
PJM©2012 19
RTEP Summary
• Year to date the PJM Board of Managers has approved 147 projects totaling over $2.4 Billion to address transmission issues related to the recent generator deactivation notices
– 27 projects in the Mid-Atlantic area of PJM – 20 projects in the Southern area of PJM – 100 projects in PJM West
• Over $1 Billion in the ATSI transmission zone • Over$500 Million in AEP
PJM©2012
Ohio Area Upgrades

12/7/12
11
PJM©2012 21
ATSI Transmission Zone Summary
• Significant thermal and reactive problems
• Required upgrades include new 345 kV lines, new 345/138 kV substations, reactive
• Eastlake 1-5 and Lakeshore 18 converted to synchronous condensers
• RMR for Eastlake 1-3, Ashtabula 5 and Lake Shore 18
PJM©2012 22
ATSI Transmission Zone Reinforcement
• Load Deliverability • Create a new Northfield Area 345
kV switching station by looping in the Eastlake – Juniper 345 kV line and the Perry - Inland 345 kV line.
• Estimated Project Cost: $37.5M
• Build a new Mansfield - Northfield Area 345 kV line.
• 115 miles - ~80 miles will use open position on a DCTL, remaining line to follow existing 345 kV line on new DCTL structures
• Estimated Project Cost: $184.5M • Projected in-service date:
6/1/2015.

12/7/12
12
PJM©2012 23
ATSI Transmission Zone Reinforcement • N-1-1 Thermal: Loss of
Allen Junction-Lulu 345kV + Lemoyne-Five Points 345kV results in 102% overload on Lemoyne-BG Tap 138kV
• Build new Allen Junction - Midway - Lemonye 345kV line (48 miles of open tower position)
• Estimated Project Cost: $86.3M
• Proposed in-service date: 6/1/2016
PJM©2012 24
Retirement Upgrade Alternative Analysis
• Marysville – South Amherst 765 kV
– Also includes 2-5 miles of 345 kV from South Amherst – Beaver 345 kV
• Trivalley – South Amherst 765 kV
– Trivalley will intersect Kammer – Vassell 765 kV near Conesville 345 kV
– Also includes 2-5 miles of 345 kV from South Amherst – Beaver 345 kV
• Conesville – Beaver 345 kV • Conesville – Harmon 345 kV • Beaver Valley - Leroy
Center 345kV + Mansfield – Leroy Center 345kV line

12/7/12
13
PJM©2012
Operational Issues
PJM©2012 26
Peak Seasonal Retrofit Outages Across RTO Retrofit Outages
Maximum Black Start Impact
2012
Winter Period (WP) 0 0 Spring Maintenance (SM) 1900 0 PPM 0 0 Fall Maintenance (FM) 2400 0 Winter Period (WP) 0 0
2013
Winter Period (WP) 4700 0 Spring Maintenance (SM) 4300 0 PPM 700 0 Fall Maintenance (FM) 1800 0 Winter Period (WP) 600 0
2014
Winter Period (WP) 1800 0 Spring Maintenance (SM) 4400 0 PPM 0 0 Fall Maintenance (FM) 6400 300 Winter Period (WP) 3300 200
2015
Winter Period (WP) 800 0 Spring Maintenance (SM) 6400 200 PPM 500 0 Fall Maintenance (FM) 2300 0 Winter Period (WP) 1900 0
2016
Winter Period (WP) 2100 0 Spring Maintenance (SM) 5100 0 PPM 500 0 Fall Maintenance (FM) 2900 0 Winter Period (WP) 900 0
2017
Winter Period (WP) 800 0 Spring Maintenance (SM) 2900 0 PPM 0 0 Fall Maintenance (FM) 400 0 Winter Period (WP) 0 0
2018
Winter Period (WP) 1000 0 Spring Maintenance (SM) 2600 0 PPM 0 0 Fall Maintenance (FM) 400 0 Winter Period (WP) 0 0
0
1000
2000
3000
4000
5000
6000
7000
WP
SM
P
PM
FM
W
P W
P S
M
PP
M
FM
WP
WP
SM
P
PM
FM
W
P W
P S
M
PP
M
FM
WP
WP
SM
P
PM
FM
W
P W
P S
M
PP
M
FM
WP
WP
SM
P
PM
FM
W
P
2012 2013 2014 2015 2016 2017 2018
Retrofit Outages
Maximum Black Start Impact

12/7/12
14
PJM©2012 27
Environmental Retrofit Outages and Typical Maintenance Outages
Retrofit Outages
(MW)
Typical Maint Outages
(MW)
2012
Winter Period (WP) 0 18000 Spring Maintenance (SM) 1900 42500 PPM 0 500 Fall Maintenance (FM) 2400 35000 Winter Period (WP) 0 18000
2013
Winter Period (WP) 4700 18000 Spring Maintenance (SM) 4300 42500 PPM 700 500 Fall Maintenance (FM) 2300 35000 Winter Period (WP) 600 18000
2014
Winter Period (WP) 2000 18000 Spring Maintenance (SM) 4600 42500 PPM 0 500 Fall Maintenance (FM) 6000 35000 Winter Period (WP) 4000 18000
2015
Winter Period (WP) 1200 18000 Spring Maintenance (SM) 6500 42500 PPM 500 500 Fall Maintenance (FM) 2300 35000 Winter Period (WP) 1900 18000
2016
Winter Period (WP) 2100 18000 Spring Maintenance (SM) 5100 42500 PPM 500 500 Fall Maintenance (FM) 2900 35000 Winter Period (WP) 900 18000
2017
Winter Period (WP) 800 18000 Spring Maintenance (SM) 2900 42500 PPM 0 500 Fall Maintenance (FM) 400 35000 Winter Period (WP) 0 18000
2018
Winter Period (WP) 1000 18000 Spring Maintenance (SM) 2600 42500 PPM 0 500 Fall Maintenance (FM) 400 35000 Winter Period (WP) 0 18000
*Some retrofit outages may be included in typical maintenance outages.
0
10000
20000
30000
40000
50000
60000 W
P S
M
PP
M
FM
WP
WP
SM
P
PM
FM
W
P W
P S
M
PP
M
FM
WP
WP
SM
P
PM
FM
W
P W
P S
M
PP
M
FM
WP
WP
SM
P
PM
FM
W
P W
P S
M
PP
M
FM
WP
2012 2013 2014 2015 2016 2017 2018
Retrofit Outages Typical Maint Outages
PJM©2012
What’s Next?

12/7/12
15
PJM©2012 29
HEDD Unit Retirements?
PJM©2012 30
Questions?