energy paths due to blue tower process - intech - open science
TRANSCRIPT
25
Energy Paths due to Blue Tower Process
Kiyoshi Dowaki Tokyo University of Science
Japan
1. Introduction
In order to solve the environmental problem, decarbonisation has received worldwide attention. In particular, hydrogen energy, which is produced from renewable energy resources of wind power, hydropower, photovoltaic, solar thermal power, geothermal power and biomass, is the most promising. The fuels from biomass feedstock would be electricity and/or thermal energy through typical incineration system (e.g. gas-engine or gas-turbine), or the secondary energy of hydrogen, methanol and/or dimethyl-ether (DME), which are so-called "biomass to liquid" fuels (BTL). Actually, the biomass energy system is one of the environmentally friendly energy systems
which will contribute to the global warming protection. However, there would be somewhat
problems at the time when the eco-friendly systems will be promoted to the target area. For
instance, it is known well that the resource might cause competition with the biomass as
food. Also, even if there are abundant material sources, the products through the system
would be costly in comparison to the conventional one due to the characteristics of low
energy density. According to the recent interviews, the cost problem is extremely significant and the market abilities of products are important from the viewpoint of the sustainable business management, too. When we consider the promotion of eco-friendly system, the operational condition on the eco-business, the technological barriers and the environmental contribution effect have to be absolutely estimated before we decide to execute the project or not. That is, we need to create the suitable energy paths and the business model. In our previous studies, we focused on the biomass gasification system whose scale is not
conventional scale in the chemical industrial sector, and we concluded that the
comprehensive arguments including the application example through the system were
required. This means that the suitable plant scale is necessary due to the low energy density
of biomass feedstock. On the promotion of new technology, the public support due to
central or local government at the earlier stage, and the good business scheme based on the
emission trading or the increased awareness of willingness to pay for eco-products would
be required in order to operate the plant operation business, too.
Thus, in this section, we propose the several energy paths on the biomass utilization from the viewpoints of “energy”, “environment” and “economy”. Especially, we consider the biomass energy system due to the Blue-Tower process which will be able to produce electricity and thermal energy by the co-generation unit (ex. gas-engine, gas-turbine or fuel cell), to purify Bio-H2 through PSA (pressure swing adsorption) unit.
www.intechopen.com

Biofuel's Engineering Process Technology
586
So far, the focus has been on the use of biomass energy systems, such as the biomass gasification process, which have mainly been developed in Europe. Above all, we think that the Blue Tower (BT) process, which is developed by D.M.2 Projekt GmbH, is close to being realized as a commercial plant. Our group of Tokyo University of Science (the Dowaki laboratory) including the Japanese company (Japan Planning Organization Inc.) which purchased the licence of the patent on basic BT process has developed the applied technology through the results of the demo-plant, the lab-scale experiments or the investigations from all viewpoints. Next, we describe the future projection of eco-friendly fuels supply as follows. Since the Kyoto protocol has come into effect in 2005, the technology on CO2 emissions mitigation has developed significantly. In particular, the biomass energy system, that is, the energy system using biomass materials such as wood, organic waste, sewage and similar material, is one of the promising energy systems to abate CO2 emissions. Although gasification technologies have attracted attention from all over the world, as one of the future technologies, their energy efficiencies are quite different, due to the energy conversion methodologies. Under these circumstances, the energy production cost is likely to still be high, even if related subsidies, environmental regulations and/or policies are put in place to support them. In the early stages, it was thought that the biomass energy system, through gas-engine cogeneration, would be a mainstream. However, since there is a discrepancy between the demand and the supply, that is, since the produced energy cannot be stored, the energy of electricity and/or heat would be excessive. Consequently, in such a system, CO2 emissions mitigations could not be realized, and the energy production cost would be expensive. With this as its background, the Japanese government has tried to promote the biomass energy system as an effort to solve global warming. As an example, the Ministry of Economy, Trade and Industry (METI) predicts the biomass energy use of 39.1 PJ in the future plan of energy demand and supply (METI, 2007). The Ministry of Agriculture, Forestry and Fisheries (MAFF) also predicts biomass energy use of 110.5 to 210.1 PJ in the future energy demand and supply plan of 2010. Especially, MAFF has a project to produce BTL fuel of 5.0×10⁸ L in the transportation sector (MAFF, 2006). On the other hand, the annual amount of hydrogen gas that was consumed in 2005 was 1.5 to 2.0×10¹⁰ Nm3 in Japan. Half of this hydrogen energy was produced from fossil fuel (K.K. Gas Review, 2007). For 2015, the many Japanese car makers have effort to promote the fuel cell vehicles (FCVs). Hence, hydrogen energy from renewable energy resources is important from the viewpoint of CO2 emissions mitigation. Under the above circumstances, we understood that there was good potentiality to produce Bio-H2 fuel. However, we have to indicate the successful business model at the earlier stage in order to expand the eco-business using this gasification process. It might be necessary to concentrate the concrete application system through BT process. Next, we considered the acceptability for the related facilities in agriculture or a forestry field. Because the environmentally friendly system such as a PV system or a fuel cell co-generation system is still not enough to be promoted for those facilities. That is, there would be potential to combine the biomass energy system which is environmentally friendly with the agriculture related facilities. In addition, MAFF contribute to the global warming protection through the carbon-footprint of agricultural products. The ministry has a few subsidy menus on the promotion of the system. Also, on the surplus energy of electricity, there are institutions by which the energy companies are obliged to purchase them with
www.intechopen.com

Energy Paths due to Blue Tower Process
587
additional fees. Using the above institutions and/or subsidy menus under the leadership of the Japanese government, we considered the agricultural products harvesting system in which the biomass gasification (BT) process with gas-engine or fuel cell is assumed to be introduced. In this section, we propose the several energy paths. For the entire system design, we
analysed CO2 emissions and/or energy intensities due to Life Cycle Assessment (LCA)
methodology. This assessment follows ISO 14041 guidelines. For each path, we defined the
system boundary. The system boundary includes the entire life cycle of each energy input
(electricity/thermal energy), including the pre-processing process, the energy conversion
process etc. That is, for the concrete energy system, we executed the process design which is
based on the simulator using the experimental results, and estimated the energy efficiency,
the CO2 intensity, the energy cost including the business model.
Here is the schematic design of this section in Fig.1. As we mentioned them before, we
introduce the biomass energy system of Blue Tower technology and explain about the
environmental system analysis in consideration of the eco-business operation.
Fig. 1. Outline of biomass energy system through Blue Tower process
www.intechopen.com

Biofuel's Engineering Process Technology
588
2. Blue Tower technology
The characteristics of the BT process are similar to the indirect gasification process with a pyrolyzer. This gasifier has three reactors for the preheating process, the reforming process and the pyrolysis process. The gasifier has the following characteristics; 1) pyrolysis reactions take place in the pyrolyzer, 2) pyrolysis gases are reformed by H2O (steam), 3) heat required for their reactions is supplied by combustion of off-gas, Tar and Char. Additional heat through a chip boiler might be required in order to accelerate the reactions well. With regard to the gasification performance, the gaseous yield and concentration are dependent upon the kinds of materials, the operating temperature, and the inner pressure (Mühlen et al., 1999, Mayer et al., 2004). Here, in order to evaluate the reliability of each fuel production, we fabricated an apparatus, which included the concept of the BT process (a pyrolyzer and a reformer), and we executed the basic chemical experiments using the biomass samples with the size of 2-3 mm. In the experiments, we measured the syngas components and estimated the equilibrium constants, adjusting the temperature condition and/or steam-carbon ratio (S/C). Also, we ensured the reliability of our simulator which was available for some analyses on the energy cost and/or CO2 intensity etc. comparing our calculation to the demo-plant data. Assuming that the materials chopped at the size of 20-30 mm are fed into the reactor, H2 of 54.4 vol.% and CO of 24.4 vol.% were generated at 950ºC and Steam/Carbon=1.0 due to our simulator (Dowaki et al., 2007). On the other hand, we executed the studies in order to confirm the absolute proof of the chemical equilibrium reactions, and/or the heat balance in use of the experimental apparatus and/or the demo-plant (1t/d scale) at Izumo, shimane prefecture in Japan. Likewise, the studies on the handling of equipment (the plant operation) have been done at Izumo. In the previous studies, we made the simulator of BT process in order to estimate the operational performance. This simulation program used the parameters estimated by the experimental results of a room condition. Also, the estimation accuracy due to the simulator was analysed. For instance, Kameyama et al. compared the operational result of the demo-plant to that of the simulator. Accordingly, we made sure that the simulated data were corresponding with the practice data to some extent (Kameyama et al., 2010). Here, we describe the system outline and the performance characteristics of this process which was evaluated through the demonstrated operation with 1t/d plant (see Fig. 2) of the Blue Tower gasification process.
2.1 BT process simulator due to the basic experiments Based on the basic experiment on the pyrolysis and the reforming, we have developed the
simulator by which the gaseous yields and/or the energy efficiency through BT process can
be estimated. Here, we compared the practice data through the demo-plant with the result
of the simulator.
In general, there would be somewhat deviation between the practice data and the estimated
one due to the simulator. That is, it would be extremely significant to identify the deviation
from the viewpoint of the reliable plant operation.
The calculation logic of the simulator which we developed is as follows (Dowaki et al. 2007): 1. The reaction temperature in each furnace (pyrolyzer and reformer) and the steam
feeding rate are fixed. 2. Based on the gaseous yields in the pyrolysis and/or the reforming reactions, which
were analysed by gas chromatograph (GC-8A, Shimadzu), the gaseous components in
www.intechopen.com

Energy Paths due to Blue Tower Process
589
each furnace were estimated due to the following two equilibrium reactions. In our experiments, Shincarbon-ST was used as a measure column, and the six kinds of gases which can be measured include H2, CO, CO2 CH4, C2H4 and C2H6, respectively.
Wood BiomassN2(Purge gas)
LPG
P
Potable Water Waste Water
Ash
Pre Heater
Reformer
Pyrolyser
Scrubber
Cooling Tower
Activated carbon& Filters
Air Heat Exchanger
Heat Carrier Conveyer
WasteHeat Boiler
Gas Holder
Char Separator
Char
Air
P
Cyclone
Steam
Heat Carrier
Gas InternalCombustion Engine
& Power Generator
Flue Gas
Heated Gas Generator
Fig. 2. Schematic design of 1t/d Blue Tower plant
Note that we considered the approach temperature difference between the theoretical one and the reaction one on these equilibrium reactions. Here, in the gasification process after the pyrolysis reaction, it is usually thought that the following two reactions take place.
4 2 23CH H O CO H (1)
2 2 2CO H O CO H (2)
Using our experimental apparatus, the approach temperature differences between theoretical temperature and the actual temperature was measured. This temperature difference is known as the approach temperature. In Eqs. (1) and (2), the equilibrium constant of shift reaction and that of methanation reaction are represented as follows:
2 2
2
expCO H
sCO H O
P PG T TK
RT P P
(3)
4 2
2
3exp
CH H Om
H CO
P PG T TK
RT P P
(4)
www.intechopen.com
Biofuel's Engineering Process Technology
590
Where, T , R and iP are the approach temperature [K], gas constant [J/molK] and the
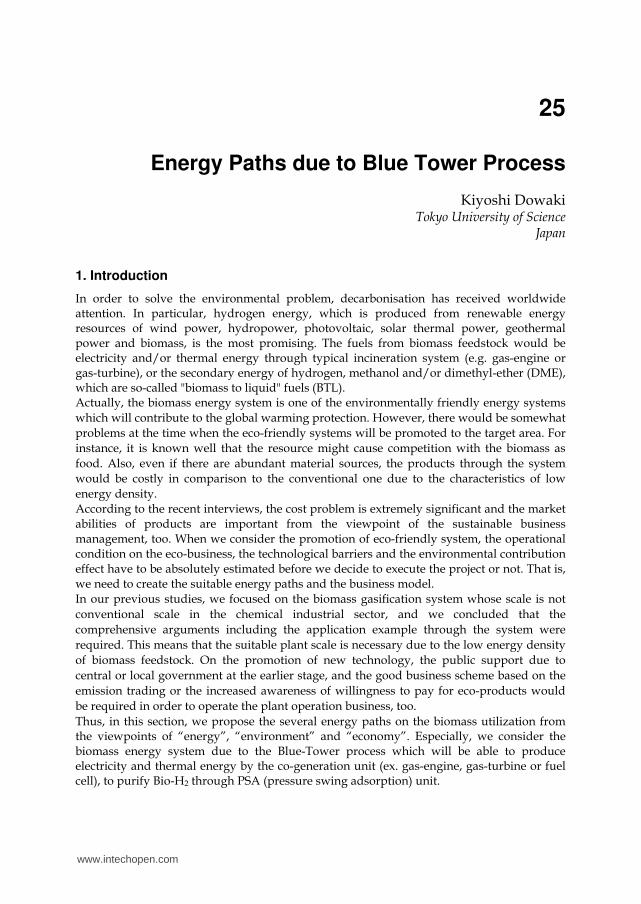
partial pressure of i-component [Pa], respectively. Next, we compared the measurement data in Izumo plant (1t/d) with the estimated results using the simulator (see Table 1). Here, the tasks of Run 11 and Run 11.2 in which the decomposed reactions are assumed to be completed in the pyrolyzer are described. Both tasks were executed on March, 2009 (Kameyama et al. 2010).
Deviatoin [-] Temparature at Refomer [°C]
Measured Estimated
Run 11.1 0.134 820 801
Run 11.2 0.367 750 774
Table 1. Comparison of the measured data and the simulated ones
In this verification, we focused on the molar fractions of H2, CO, CH4 and CO2, and found the average reaction temperature so that the total deviation on molar fraction between the measurement data and the estimated one due to Eqs. (3) and (4) is a minimum. That is, we investigated if the gaseous components based on the temperature which was measured in the plant corresponded to the estimated ones due to the simulator. The reason why we verified the gaseous components using the temperature as a variable is as follows; in the demo-plant, we did not know the temperature profile on the vertical and/or horizontal directions precisely since the sampling point of the temperature in reformer is one position. Thus, assumed that the estimated temperature based on the measured gaseous components would represent the average one of reformer, we made sure that the process simulator would be more suitable. Next, based on the process simulator which has a precision to some extent, we describe the
example due to the biomass feedstock of waste Japanese cedar. With regard to the
gasification performance, since gaseous yields and concentrations are dependent upon the
kind of materials, the operating temperature, and the inner pressure, they were examined
using the gasifier apparatus which has a reformer and a pyrolyzer.
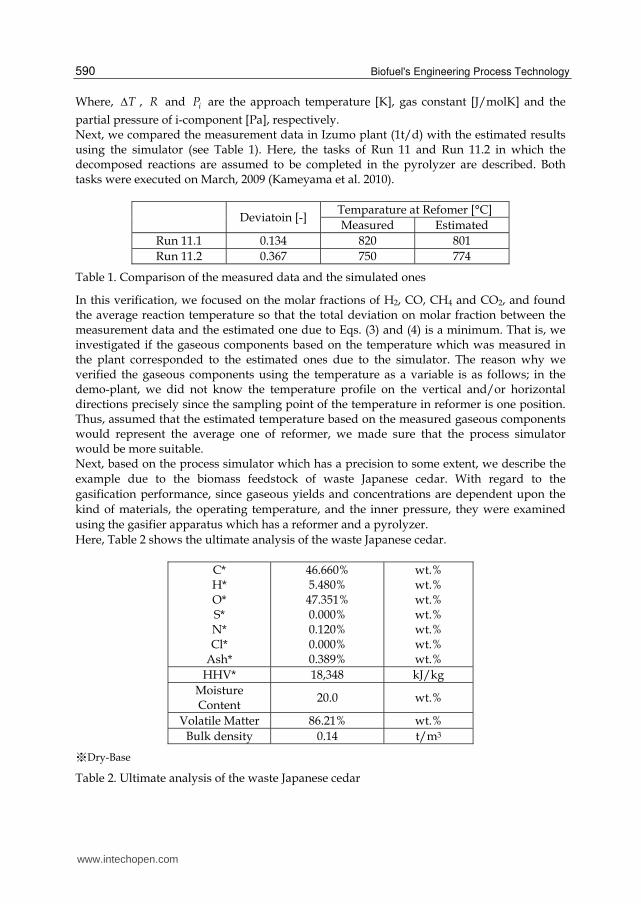
Here, Table 2 shows the ultimate analysis of the waste Japanese cedar.
C* H* O* S* N* Cl*
Ash*
46.660% 5.480% 47.351% 0.000% 0.120% 0.000% 0.389%
wt.% wt.% wt.% wt.% wt.% wt.% wt.%
HHV* 18,348 kJ/kg
Moisture Content
20.0 wt.%
Volatile Matter 86.21% wt.%
Bulk density 0.14 t/m3
※Dry-Base
Table 2. Ultimate analysis of the waste Japanese cedar
www.intechopen.com

Energy Paths due to Blue Tower Process
591
Through the tests, the syngas components and the equilibrium constants were obtained. For instance, Fig.3 illustrates the gaseous yields on the pyrolysis at 550 °C with variation of S/C =0.14 to 0.98, and the reforming reaction at S/C=1.0 with variation of 800 to 950 °C, respectively. Here, a steam carbon ratio is defined as the following equation.
2
Added Steam [mol/s] Moisture [mol/s]/
Carbon Content of Material [mol/s]S C mol H O mol C
(5)
Note that the gaseous components are modified at 20% moisture content. Also, the approach temperature for each reaction is shown as Table 3.
Reaction T Unit
Pyrolysis 78.3 °C
Reforming 252.0 °C
Table 3. Approach temperature for each reaction (estimated)
a) Pyrolysis (550 °C, S/C=0.14-0.93)
b) Reforming reaction (800-950 °C, S/C=1.0)
Fig. 3. Gaseous yields of pyrolysis (a) and reforming reaction (b).
www.intechopen.com

Biofuel's Engineering Process Technology
592
Based on the above experimental results, we estimated the following material balance:
31.078 43.495 23.677 0.069 2
2 4 2 2
2 52 3 2.686 0.482 0.343 0.004
31.078
24.052 11.682 2.435 9.442 23.228
2.92 10 4.40 10
C H O N H O
H CO CH CO H O
N NH C H O N
(6)
2.686 0.482 0.343 0.004C H O N is the chemical component of char, and its heating value was 32.0
MJ/kg. In our simulator, the energy performance would be solved so that the input and the output on heat and materials would be balanced.
Next, using 9.5mm ball, we measured the temperature profiles at the surface of ball and the center of it. In the phase of absorption of heat, the ball was kept at each designed temperature between 200 and 950 ºC. At the time, there was difference between the surface temperature and the center one, and the temperature differences were measured. Inversely, in the phase of heat radiation, the ball was heated up to 1,000 ºC in the furnace, and it was put in a room temperature. Simultaneously, the temperature differences were measured. Note that these temperature profiles are time series data. As a result, the thermal conductivities can be obtained. Also, since the thermal circulation time has to be the same as the reacting time on a pyrolysis and a steam reforming reaction, the optimal size of the ball is decided. Thus, the adequate auxiliary power for the circulation of HC would be obtained. Due to this result, we can estimate the suitable residence time in each reactor for the temperature profile which would be led by the simulator. Based on the above concept, we could estimate the syngas through BT process (Dowaki et al., 2008a, Dowaki, 2011a).
2.2 Process design of energy production system through BT process Next, we introduce the examples of process design through BT process. As we mentioned before, there would be many energy paths through BT process. Here, as the examples, H2 production and Cogeneration system (CGS) would be concentrated. The purpose of each process design would be due to the energy analysis and/or the environmental one using LCA methodology.
2.2.1 Case study of Bio-H2 production system Through a reaction process based on superheated steam, the biomass is converted to the syngas with a high concentration of H2. In the BT process, pyrolysis gases are reformed with H2O (steam), and Tar and Char are generated as co-products. Since Tar contents pass through the higher temperature zone, the residual volume would be negligible. Also, due to the recycling of the sensible heat of syngas, the total efficiency of the entire system would be improved. Here, the process design of Bio-H2 was executed by the consideration of basic experimental results. The capability of the biomass gasification plant is 12 t/d, and the annual operation days are 300 day/yr. In the process design, the heat energy generated from the gasifier was assumed to be utilized as the energy for materials dryer. Due to the recycling of thermal energy, the energy of dryer can be reduced at most. For instance, the moisture content can be compensated up to 42 wt.% against the initial moisture content of 50 wt.%. The syngas generated through BT gasifier is transferred to the shift-reaction convertor, and then is fed
www.intechopen.com

Energy Paths due to Blue Tower Process
593
into PSA (Pressure Swing Adsorption). In the PSA, the high concentrated H2 gas was purified to 99.99Vol.% (4N) of H2 gas. Here, Tables 4 shows the performance of Bio-H2 production system. In Tables 4, the cold gas
efficiency Cold is defined as follows:
MJ h
MJ h MJ h MJ hCold
Syngas
Feedstock Char Offgas (7)
Also, the total efficiency Total of this system is
2io-H MJ h
MJ hTotal
B
Feedstock (8)
BT Process (15 t/d) Feedstock 635.9 kg/h
8,415 MJ/h
Syngas (For Bio-H2)
678.5 Nm3/h
4,544 MJ/h
Cold-Gas Eff. Cold 62.0% LHV-%
Auxiliary Power 247.4 kW
PSA (4N-H2) Bio-H2 303.5 Nm3/h
3,275 MJ/h
Total Eff. Total 38.9% LHV-%
Table 4. Performance of Bio-H2 production system (estimated)
2.2.2 Case study of Cogeneration system Next, we explained about the co-generation system by which electricity and thermal energy can be generated. In the case of BT-CGS, due to the heat balance, the reaction energy in the furnace might be shortage. Thus, the additional feedstock would be necessary. In the case of Bio-H2 production system, since off-gas through PSA is available, the additional biomass material is not required. Also, from the viewpoint of the economic condition, the case that the additional one is fed into BT would be much better in comparison to the case without any feedstock. That is, more products (i.e. electricity and/or thermal energy) can be generated. Consequently, the economic condition of BT-CGS operation would be improved by a lot of energy products. Thus, we consider BT-CGS case in which the additional feedstock is required. For the operation of gas-engine due to the low calorific heating value of bio-gas which means the syngas of BT gasifier, although there are sometimes problems on the heating value of fuel, we executed the process design using the practice parameters which were analysed by the engine manufacturing maker.
Table 5 shows the performance of Bio-CGS. In Tables 5, the cold gas efficiency Cold , the net
power efficiency Pow , the heat recovery efficiency Heat and the net total efficiency Total are
defined as follows:
www.intechopen.com

Biofuel's Engineering Process Technology
594
MJ h
MJ h MJ h . MJ hCold
Syngas
Feedstock Char Add Feedstock (9)
Power Power-Auxiliary MJ h
MJ h . MJ hPow
Net
Feedstock Add Feedstock
(10)
MJ h MJ h
MJ h . MJ hHeat
Steam Hot water
Feedstock Add Feedstock
(11)
Total Pow Heat (12)
¶(9pt)BT Process (18 t/d)
Feedstock 625.0 kg/h
8,278 MJ/h
Additional Feedstock
139.5 kg/h
1,846 MJ/h
Syngas (For Gas-engine)
1,021 Nm3/h
6,922 MJ/h
Cold-Gas Eff. Cold 59.0% LHV-%
Auxiliary Power 111 kW
Gas-Engine
Power (Net) 459 kW
Steam 1,344 MJ/h
Hot water 1,551 MJ/h
Power Eff. 16.3% LHV-%
Heat Recovery Eff. 28.6% LHV-%
Total Eff.(Net) 44.9% LHV-%
Table 5. Performance of BT-CGS (estimated)
3. Concept of the biomass Life Cycle Assessment
So far, the biomass Life Cycle Assessment (LCA) analyses, in which the pre-processing
process of chipping, transportation and drying of biomass materials are included, and in
which the energy conversion process of a production energy of electricity and/or heat
through an integrated gasification combined cycle (IGCC) power system or a co-generation
system (CGS) is included, were analysed (Dowaki et al. 2002, Dowaki et al. 2003).
In this section, we describe on the BT-CGS and the production system of Bio-H2. At the beginning, in this section, we defined the system boundary of the biomass LCA. A target is to estimate a life cycle inventory (CO2 emissions and/or energy intensities) of the entire system with a biomass gasification system and/or a purification one. That is, we refer to the environmentally friendly system, such as the biomass energy system, considering CO2 emissions and/or energy intensities from the entire system based on LCA methodology.
www.intechopen.com

Energy Paths due to Blue Tower Process
595
In the case of BT-CGS or Bio-H2, due to the shortage of reaction heat in the furnace or the larger auxiliary power output of PSA, the specific CO2 emission might be affected. That is, the process design and the energy analysis on basis of the process simulation would be extremely significant.
3.1 System boundary Following ISO 14041 guidelines, we define the system boundary in the biomass energy system. The system boundary includes the entire life cycle of Bio-H2 fuel or electricity and thermal
energy products, including the pre-processing process and the energy conversion process.
(See Fig. 4). In the pre-processing process, there are sub-processes of chipping,
transportation by trucks, and drying. In the energy conversion process, there are sub-
processes of the gasification through the BT plant with a purification process or a CGS unit.
Also, in our estimation, we focused on “well to tank (WtW)” analysis.
Fig. 4. System boundary of biomass LCA.
3.2 Functional unit The target product is Bio-H2 and CGS products of electricity and/or heat energy. Thus, the functional unit is assumed to be the unit per a produced energy. The lower heating values of H2 and electricity are 10.8 MJ/Nm3 and 3.6 MJ/kWh, respectively.
3.3 Pre-processing process In the pre-processing process, there are sub-processes of chipping, transportation, and
drying of biomass materials. In particular, within the sub-processes of transportation and
drying, we have to consider uncertainties. To date, there are few studies considering these
uncertainties. CO2 emissions and energy intensities in the biomass LCA would be affected
by the moisture content of biomass materials, and the transportation distance from the
www.intechopen.com

Biofuel's Engineering Process Technology
596
cultivation site, or the site of accumulating waste materials, to the energy plant. Table 6
shows heating values, and that of CO2 emissions, for each fuel with biomass materials,
respectively. Also, CO2 emissions and energy intensities were estimated using the Monte
Carlo simulation in order to consider these uncertainties (Dowaki and Genchi, 2009).
Fuel CO2 Note
Feedstock 0.0 g-CO2/MJ-Fuel at 20 wt.% (moisture content), Japanese
Cedar, HV:13.23 MJ/kg Diesel 74.4 g-CO2/MJ-Fuel Chipping, Transportation, HV: 35.50 MJ/L
Electricity 123.1 g-CO2/MJ-Fuel Auxiliary power of the plant (Primary
Energy)
Table 6. Data of the specific CO2 emissions
3.3.1 Sub-processes of chipping, transportation and drying The energy consumption of chipping, transportation and drying is as follows: a. Chipping: The energy consumption of the chipping process is due to electricity and
diesel. The specific units of energy consumption are 13.6 kWh/material-t (122.4 MJ/material-t) and 1.23 L-diesel/material-t (43.7 MJ/material-t), respectively (Hashimoto et al., 2000).
b. Transportation: The chopped biomass materials are delivered to the plant by 10 ton diesel trucks. CO2 emissions and/or energy intensities on a given transportation run would be affected by the weight of biomass materials. That is, the weight of which the materials can be carried is restricted to bulk density. We measured the bulk density (=0.14 t/m3) in the atmosphere. The bulk density is dependent upon the moisture content. Thus, assuming that the bulk density is at a moisture content of 15 wt.% ( 15 ),
the bulk density MC at any moisture content ( MC wt.%) is
15
0.85
1MC
MC (13)
Next, the loading platform of 10t-trucks is to be approximately 24.7 m3 (Suri-Keikaku Co. Ltd., 2005). Consequently, even a truck with 10 ton’s volume cannot always carry that in full weight. Here, CO2 emissions and/or energy intensities are assumed to be due to the fuel consumption of truck, which is indicated as a function of the loading rate of weight. That is, using the loading rate of , the fuel consumption rate of a 10t-
truck FCf is
FCf a b (14)
where, a(=714 g-CO2/km) and b(=508 g-CO2/km) are constants on the fuel consumption of the truck (Dowaki et al., 2008b).
The definition of the loading rate of is as follows: Assuming that the plant scale is Ps
dry-t/d, and that the annual operating time is 300 days, the annual material balance on
the feed materials is 300Ps t-dry/yr. Since the throughput per year at MC wt.% is 300 1Ps MC , the total number of transportation by 10 t trucks at MC wt.% ( matN )
is
www.intechopen.com

Energy Paths due to Blue Tower Process
597
300 1
124.7
matMC
Ps MCN
(15)
Where, is represented as the maximum integer, so as not to exceed . Thus, the
average loading rate of a 10 t-truck ( ave ) is
300 1
10ave
mat
Ps MC
N
(16)
Providing the average loading rate, and multiplying FCf by the transportation
distance and the specific CO2 emissions or the energy consumption of diesel, we can estimate CO2 emissions or fuel consumption in the transportation sub-process. In this paper, the transportation distance is the range between 5 ( minDist ) and 50 km
( maxDist ), because the wooden materials in Japan are distributed widely. That is, it is
assumed that the feed materials are collected within a radius of 50 km. c. Drying: Next, on the sub-process of drying, the energy consumption was estimated
under the condition that the moisture content of feed materials would decrease to 20 wt.%. Here, assuming that the initial moisture contents are from 20 ( minMC ) to 50 wt.%
( maxMC ), the raw materials are dried by a boiler. Also, the auxiliary power of a pump
in a boiler is included in the energy consumption of the sub-process. The operational specification of a wood-chip dryer (boiler) is the energy efficiency of 80 %, and the auxiliary power of a pump of 0.195 kWh/t-water (1.75 MJ/t-water). Note that the moisture content of feedstock can be reduced by the hot exhausted gas to some extent.
d. Monte Carlo simulation on the uncertainties: As the above, in this paper, we estimated CO2 emissions and/or energy intensities, considering the uncertainties of the transportation distance and the moisture content. In this paper, the following two uncertainties of the distance and the moisture content were considered by the Monte Carlo simulation.
That is, the uncertainties on the transportation distance ( Dist km) and the moisture
content ( MC wt.%) are represented by uniform random numbers iRnd between 0 and
1 in Eqs. (17) and (18). Note that 1Rnd and 2Rnd are independent and identically
distributed.
min 2 max minDist Dist Rnd Dist Dist (17)
min 1 max minMC MC Rnd MC MC (18)
An iteration count in the simulation was executed up to 10,000. The range within a 95 % significant level was adopted as the uncertain data on the distance and the moisture content, in order to estimate CO2 emissions. In this case, the gross distributions on CO2 emissions would be normal distributions.
3.4 CO2 emissions on CGS and Bio-H2 fuel Based on the above data, CO2 emissions of CGS (electricity and/or thermal energy) and Bio-H2 fuels are shown in Fig. 5.
www.intechopen.com

Biofuel's Engineering Process Technology
598
0.0
30.0
60.0
90.0
120.0
150.0
min. max. ave. min. max. ave.
CO
2em
issio
ns [g
-CO
2/M
J-p
rod
uct
E]
Auxiliary Dryer TransportationChip Conv.Electricity Conv. H2Electricity
Case 2 (Bio-H2 production)
Case 1(CGS)
Fig. 5. CO2 emission in each case (Case 1:CGS, Case 2 Bio-H2 production).
According to Fig. 5, the entire CO2 emissions are 16.3-65.7 g-CO2/MJ of CGS and 39.6-95.3 g-CO2/MJ of Bio-H2, respectively. Especially, in the CGS case, the specific CO2 emissions of electricity are 5.9-23.9 g-CO2/MJ, and the reduction percentages in comparison to the conventional electricity in Japan are 80.6-95.2%. In the case of Bio-H2 case, the reduction percentages against the conventional H2 production (121.3 g-CO2/MJ, Natural gas origin) are 21.4-67.3%. CO2 emissions at the material drying and at the auxiliary power of a purification process of PSA occupy a large portion of the entire CO2 emission. Especially, the influence due to the compression power of H2 purification would be significant. In the case of Bio-H2, the amount of 35.1% to 84.4 % of the total CO2 emissions would be emitted from the auxiliary power including the power for BT operation. Also, in the case of CGS, that of 16.5% to 66.6 % would be emitted from the auxiliary power origin, even if the PSA operation is not equipped. The deviations of CO2 emissions (the maximum value – the minimum one) due to the uncertainties on the moisture content and the transportation distance would be within 49.5 g-CO2/MJ of CGS and 55.7 g-CO2/MJ of Bio-H2, respectively. That is, the range of collection of biomass feedstock would be extremely significant from the viewpoint of CO2 emission reduction on basis of LCA methodology.
4. Future application of bio-fuel
As we mentioned before, the renewable energy source, especially, the biomass energy source would be promising for global warming protection. Using the biomass feedstock, there are many fuels which can be converted through the gasification, the fermentation or another process. Here, we concentrated to the biomass gasification process by which electricity and thermal energy or Bio-H2 fuel are produced. Also, the CO2 emission due to
www.intechopen.com

Energy Paths due to Blue Tower Process
599
LCA methodology, which is estimated in order to understand the impact of Global warming numerically, was estimated. As a next step, we have to create the countermeasure for promotion of our proposed system. However, there is not example in which the relationship between the supply and the demand is argued enough. Based on the sequential and entire system, we have to judge the effects and/or the benefits such as CO2 emission etc. (See Fig. 1). Here, as a good example, we introduce the following system. However, that might be difficult to promote our proposed system due to the cost barrier against a conventional system at the present time. The combined system in which the renewable energy such as Bio-H2 can be available would have a significant meaning in the future utilization for Global warming protection. Simultaneously, we have to create the new business model which would be suitable for the end users. Now, there is the proposal to install an advanced cell phone (a smart phone) with a PEFC unit so as to get CO2 benefit. A smart phone is an electronic device used for two-way radio telecommunication over a cellular network of base stations known as cell sites. The sale of mobile phones has been one of the fastest growing markets in the world today. For instance, the cell phone users of Japan were approximately 107 million in 2005 (Infoplease, 2005). At present, around 85% people in America have used cell phone. In addition, new technology of a mobile communication is being developed very quickly. A few years ago, people used their cell phone just for making a call or sending a short mail through a SMS function. However, at the current time, there are a lot of features of a smart phone such as music player, video player, game, chatting, internet browsing and email, etc. These factors should increase energy consumption and increase CO2 emission. The current power supply system in a smart phone is dominated by a Li-ion battery, which has some advantage such as wide variety of shapes/sizes without a memory effect. In addition, the rapidly advancing needs for mobile communication are increasing the consumer demand for portable application with even higher power output, longer operation time, smaller size, and lighter weight. A Li-ion and other rechargeable battery system might not be suitable for high power and long time span portable devices due to their lower energy density, shorter operational time, and safety. Li-ion batteries are well established as a power supply for portable devices. Recently, since the power demand has been increasing faster than battery capabilities, the fuel cells might become a promising alternate for niche applications. A fuel cell is an electrochemical device which continuously converts chemical energy into electricity and thermal energy by feeding H2 fuel and oxygen into it. A fuel cell power supply can be higher energy per a unit mass than conventional batteries. Also, the using of fuel cell system is not harmful to the environment, if compared with a Li-ion battery (Hoogers, 2003). Also, there are the following two types of fuel cell: 1) Polymer Electrolyte Fuel Cell (PEFC) and 2) Direct Methanol Fuel Cell (DMFC), which are operated in low temperature. These two systems are almost same, the difference is only in fuel, that is, the PEFC is operated by H2 (gas) and DMFC is done by methanol (liquid). Here, we focused on the PEFC into which H2 fuel is fed. The reason why we concentrate the system is that the fuel for a PEFC can be produced by the renewable resources such as biomass feedstock with a lower CO2 emission in comparison to the conventional production system. In the area where there is plenty of biomass feedstock (e.g. Indonesia and Malaysia etc.), there is a good potential to install that. A PEFC is applied to replace a Li-ion battery. A comparison of CO2 emission between a Li-ion battery cell phone and a PEFC cell phone was calculated using Life Cycle Assessment (LCA) methodology, in consideration of the user's behaviour.
www.intechopen.com
Biofuel's Engineering Process Technology
600
4.1 A case study on a smart phone due to LCA methodology The goal of this study is to compare the CO2 emission of the conventional Li-ion cell phone and the PEFC cell phone. The functional unit is the specific CO2 emission per a life cycle (LC) of kg-CO2/LC. Fig. 6 shows the life cycle stage on the schematic design of system boundary, in which a pre-processing of raw materials, a manufacture, a transportation and distribution, an energy consumption of end users and a disposal process are included. Also, in this study, we referred to the duration time of each operation of cell phone (Dowaki et al., 2010a).
Energy use sector
System boundary
TransportationBiomass Material
(Waste Wood etc.)Drying
H2 production
(Blue Tower*)
Fossil liquid fuel
Electricity
(Fossil fuel origin)Auxiliary
Fuel
H2 fuel for
PEFC-Smart phone
Direct CO2 emission*
(Due to energy use)
* Biomass gasification system
+ H2 purification system
(except transportation of a fuel cartridge)
Electricity**
for
Li-ion Smart phone
Indirect CO2 emission*
(Due to cell equipment)
Note:
* Estimated period=2.6 years
** This value is based on the wheel to tank, that is, the input energy for producing the fuel besides raw energy source (primary energy) is considered, too.
Cell phone equipment manufacture sector
Raw MaterialManufacture
(part, member)Smart phone
Fossil fuelLi-ion Smart phone
(Conventional)
PEFC Smart phone
(Target case)
Life time=2.6 years
Life time=2.6 years
(Assumption)
Transportation
Fuel
Fig. 6. System boundary of a cell phone analysis.
In the system boundary, as we described the prior section, we think about the availability of Bio-H2 through BT process. For the purpose, we executed the questionnaire on the way to use a smart phone firstly. Also, we executed the performance of a PEM cell which is based on a PEFC unit using the electric power measurement device. The difference between a Li-ion and a PEFC cell phone is in electrical energy sources. The
Li-ion cell phone is supplied by conventional electricity, whereas a PEFC cell phone is done
by Bio-H2 as an energy input. The battery charge due to the conventional electricity emits
CO2 of one of the greenhouse gases. On the other hand, since the Bio-H2 would be carbon
neutral, the CO2 emission is equivalent to zero in a combustion process. However, the
production process of a renewable fuel is accompanied with the conventional energy inputs
(i.e. fossil fuels). Thus, it is extremely important to estimate the energy system based on LCA
methodology.
4.1.1 A questionnaire for the smart phone users In order to investigate the way to use a smart phone in each user, we executed the questionnaire between February 17 and February 24, 2011. 200 respondents in Japan
www.intechopen.com

Energy Paths due to Blue Tower Process
601
participated in this research. Also, target respondents are the users who use a smart phone, with their ages between 15 and 65 years, respectively. In the questionnaire content, the duration time of a talking, a SMS, music (MP3), a game, a web-site (internet), an e-mail checking, and an idle time were estimated for each age category. Fig. 7 shows the result of the duration time of each function. The checking time of internet would be larger in both weekdays and holyday (Dowaki et al., 2011b).
0
20
40
60
80
100
120
Talking Music Game SMS e-mail Internet
Du
ration t
ime (
Weekday)
[min
/day]
under 20s 20s
30s 40s
over 50
a) Weekdays
0
20
40
60
80
100
120
Talking Music Game SMS e-mail Internet
Dura
tion t
ime (
Holid
ay)
[min
/day]
under 20s 20s
30s 40s
over 50
b) Holiday
Fig. 7. Duration time of each function in a smart phone.
4.1.2 Measurement of the performance of a PEFC unit Based on the duration time, we measured the performance of a PEM-cell which is based on
a PEFC unit for a smart phone. That is, using the result of output capability of a PEM-cell
and the maximum duration time, we designed the cell area of a PEFC, and estimated the
energy consumption for each function. Here, in order to have a good reliability, 10 times experiments have been done for the following tasks: a talking, a SMS, music (MP3), a game, a web-site (internet) and an e-mail checking, respectively. In our experiments, we used the electric measurement device (AC/DC POWER HiTESTER 3334, HIOKI E.E. Corp.) to measure the voltage and the current, and the power which is obtained by these factors. Next, for the purpose of estimating the cell performance, we measured the potential of a
PEM-cell in varying currents. The apparatus consists of a PEM-cell (Micro Inc.) and a
www.intechopen.com
Biofuel's Engineering Process Technology
602
potentiostat (HAB-151, Hokuto Denko Corp.). The size of the cell with low platinum loading
electrodes (1.0 Pt mg/cm2) and Nafion® 115 is 4 cm2×3 cells. Using a potentiostat, 1) an
open circuit voltage 0V [Volt] was measured and 2) the relationship of current density J vs.
cell potential V was evaluated between approximately 200 mV/cell and an open circuit
potential 0V . Also, H2 flow in anode was up to 20 ml/min and the concentration of H2 was
100 vol.% at a constant percentage (see Fig.8). Note that each parameter on the performance
of a PEM-cell is decided at the condition which is not rate-limiting. In this case, we adopted
the flow rate condition of 20 ml/min. The cathode was stayed at the atmospheric condition.
The conditions in both the anode and cathode sides were not saturated by steam (Dowaki et
al., 2010a, Dowaki et al., 2011b).
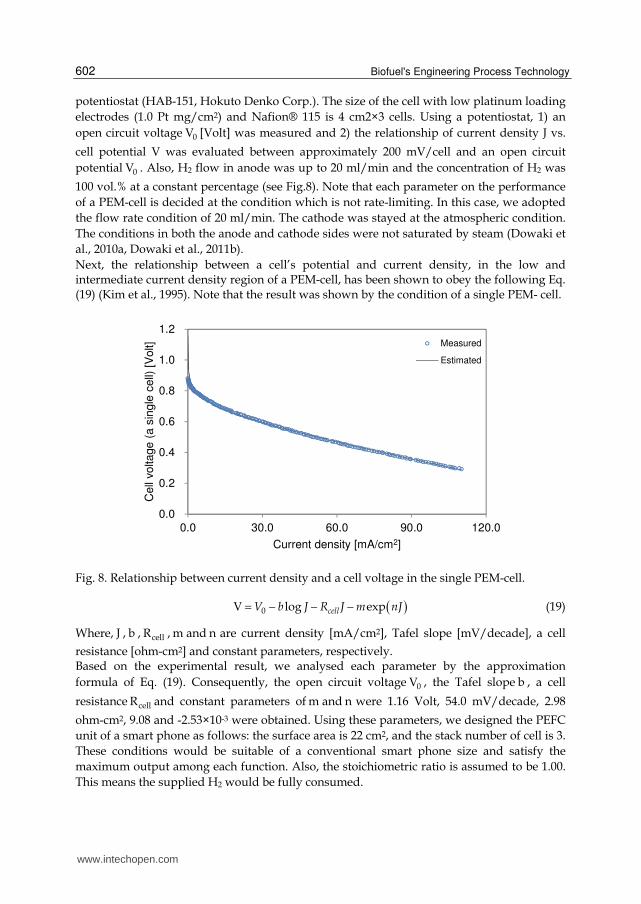
Next, the relationship between a cell’s potential and current density, in the low and intermediate current density region of a PEM-cell, has been shown to obey the following Eq. (19) (Kim et al., 1995). Note that the result was shown by the condition of a single PEM- cell.
0.0
0.2
0.4
0.6
0.8
1.0
1.2
0.0 30.0 60.0 90.0 120.0
Cell
vo
lta
ge
(a
sin
gle
cell)
[V
olt]
Current density [mA/cm2]
Measured
Estimated
Fig. 8. Relationship between current density and a cell voltage in the single PEM-cell.
0V log expcellV b J R J m nJ (19)
Where, J , b , cellR , m and n are current density [mA/cm2], Tafel slope [mV/decade], a cell
resistance [ohm-cm2] and constant parameters, respectively. Based on the experimental result, we analysed each parameter by the approximation
formula of Eq. (19). Consequently, the open circuit voltage 0V , the Tafel slope b , a cell
resistance cellR and constant parameters of m and n were 1.16 Volt, 54.0 mV/decade, 2.98
ohm-cm2, 9.08 and -2.53×10⁻³ were obtained. Using these parameters, we designed the PEFC
unit of a smart phone as follows: the surface area is 22 cm2, and the stack number of cell is 3.
These conditions would be suitable of a conventional smart phone size and satisfy the
maximum output among each function. Also, the stoichiometric ratio is assumed to be 1.00.
This means the supplied H2 would be fully consumed.
www.intechopen.com

Energy Paths due to Blue Tower Process
603
Next, due to the questionnaire for smart phone users (see Fig. 7), the energy consumption for each function and the performance of PEFC using a PEM-cell experimental result, we estimated CO2 emission on basis of LCA methodology. Using Eq. (19), the H2 flow rate in practice use is able to be calculated. Here, a PEFC would be operated between 1.17 and 2.63 Volt. The specific energy consumption in each function was between 0.39 and 37.7 Nml/min.
4.1.3 Specific CO2 emission of a smart phone Based on the above analysed results, we estimated the CO2 emission of a smart phone use. Here, we considered the indirect and the direct CO2 emissions. The direct CO2 emission is equivalent to the fuel consumption origin. On the other hand, the indirect one is mainly on the device of a smart phone. In this study, we focused on HTC Desire X06HT made in Taiwan as a model phone. The indirect CO2 emission is calculated by Input-Output (IO) table, and this emission referred to the prior result. Also, we estimated the conventional smart phone including Li-ion battery in order to compare to the new one. Assuming that the holding time (life time: LT) when one user has a smart phone until he or she change the new one is 2.6 years, the indirect CO2 emission of HTC Desire X06HT including Li-ion battery would be 15.32 kg-CO2/unit. The emission of a smart phone with a PEFC unit would be 15.30 kg-CO2/unit. Although there are uncertainties on the storage tank of H2 to some extent, referring to the data of DMFC storage tank which has already developed, we estimated the emission as almost same as the conventional case (Dowaki et al., 2010a). Next, the direct CO2 emission is affected by the specific CO2 emission of each fuel. Here, the CO2 emissions of conventional electricity, H2 fuel of natural gas origin (on-site) and Bio-H2 are assumed to be 123.1 g-CO2/MJ, 121.3 and 39.6 g-CO2/MJ-H2, respectively. The CO2 emission per one life cycle is shown in Fig. 9. Note that the specific emission of Bio-H2 is a minimum level (see Fig. 5).
10.0
12.0
14.0
16.0
18.0
20.0
22.0
Li-
ion
BT
-H2
Fossil-
H2
Li-
ion
BT
-H2
Fossil-
H2
Li-
ion
BT
-H2
Fossil-
H2
Li-
ion
BT
-H2
Fossil-
H2
Li-
ion
BT
-H2
Fossil-
H2
Under 20 20's 30's 40's Over 50
CO
2 e
mis
sio
n [kg-C
O2/L
C]
Case categories
Direct CO2 Indirect CO2
Fig. 9. Life Cycle CO2 emission for a smart phone use.
According to this result, due to application of a PEFC unit to the smart phone, we would be able to reduce CO2 emissions of 3.9% to 6.1 % in comparison to the conventional phone. Especially, in the category of younger generation, the CO2 reduction benefit would be effective.
www.intechopen.com

Biofuel's Engineering Process Technology
604
4.2 A case study on a greenhouse facility due to LCA methodology Next, we propose the advanced greenhouse system for paprika cultivation with the combined biomass gasification process of BT with SOFC (Solid Oxide Fuel Cell). The BT gasifier which is a biomass gasification process has a characteristic of generating hydrogen gas of high concentration in syngas. Here, we considered the acceptability for the related facilities in agriculture field. Because the environmentally friendly system such as a PV system or a fuel cell co-generation system is still not enough to be promoted for those facilities. That is, there would be potential to combine the biomass energy system which is environmentally friendly with the agriculture related facilities. In addition, MAFF contribute to the global warming protection through the carbon-footprint of agricultural products. The ministry has a few subsidy menus on the promotion of the system. Also, on the surplus energy of electricity and/or thermal energy, there are institutions by which the energy companies are obliged to purchase them with additional fees. Using the above institutions and/or subsidy menus under the leadership of the Japanese government, we considered the following concrete paprika harvesting system in which the biomass gasification (BT) process with SOFC is assumed to be introduced (Dowaki et al., 2010b). First, our model site is the paprika harvesting facility in Miyagi of Japan, whose area is 4.6
ha. In our study, through interviews from the owner company, we used the data of not only
the energy consumption of electricity and oil, but also the supply of CO2 gas which is fed
into the greenhouse as a growth promoting agent. That is, in the model we proposed, the
electricity, the thermal energy and the CO2 gas which is included in exhausted gas through
BT plant are assumed to be available for the greenhouse facility of paprika harvesting. In
addition, due to the combination of the advanced power generation such as SOFC,
additional benefit of CO2 emission reduction would be obtained. This may be advantageous
from the profit aspect since the surplus electricity would be able to be sold to the
commercial energy companies. Also, from the viewpoint of thermal energy use, the
combined BT with SOFC units would be advantageous since the exhausted gas with a high
temperature (ca.700 °C) is generated. Although the operation of SOFC has been in a
developmental stage, we used the published parameters. The initial cost of SOFC unit seems
to be costly in comparison to the conventional power system. However, it is said that the
commercial stage of SOFC is close. Thus, the initial cost was assumed to be equivalent to the
target price as of 2015. The thermal energy for the greenhouse is supplied by the heat pump
equipment. This would bring to the benefit of cost and/or CO2 emission reduction, since
there is little waste thermal energy (Dowaki et al., 2011c).
On the other hand, MAFF tries to introduce the carbon-footprint for the agricultural
products. It is difficult to estimate the monetary values of CO2 emissions of agricultural
products. For instance, Kikuchi et al. investigated the willingness to pay for CO2 emission
reduction of vegetables (Kikuchi and Itsubo, 2009). They found out that the consumers have
a willingness to pay for an additional cost of approximately 5% up against a conventional
price. Although this is only a limited effect, there would be a potential to earn income due to
the carbon footprint. That is, with regard to income in our system, revenues to the plant
owner would include the related subsidy, the processing fee of waste material, the sale of
surplus electricity and the paprika sale with low CO2 emission. The carbon-footprint of
agricultural product might be important one of income sources.
In this study, we analysed the CO2 emission due to LCA methodology.
www.intechopen.com

Energy Paths due to Blue Tower Process
605
4.2.1 A LCA for the paprika cultivation In the LCA concept of this paper, the direct factors and the indirect ones have to be considered. In our definition, fossil fuel energy inputs (primary energy basis) and the electricity of fossil fuel origin are included in the direct factors. Also, chemical fertilizers are included in the indirect ones. Here, note that another greenhouse gases such as N2O and CH4 are not taken into consideration. So far, in the biomass LCA analyses, the pre-processing process of chipping, transportation and drying of biomass materials, and the energy conversion process of a production energy of electricity and/or heat, through an energy system are included. This time, the paprika harvesting process has to be added to the entire life cycle stage. Using the chemical experimental data, the design of BT plant with SOFC units would be extremely significant in the biomass LCA. A target is to estimate a life cycle inventory of the entire system with BT gasifier and SOFC. Here, we describe on the system boundary in this study. Following ISO 14041 guidelines, we define the system boundary in the biomass energy system (see Fig. 10) (Dowaki et al., 2010b).
Fig. 10. System boundary of a paprika production system.
The system boundary includes the entire life cycle of each energy input (electricity/thermal energy), including the pre-processing process, the energy conversion process and the paprika harvesting process. In the pre-processing process, there are sub-processes of chipping, transportation by trucks, and drying. In the energy conversion process, there are sub-processes of the gasification through the BT plant (19 t/d) with the four units of SOFC (200 kW/unit) process. In the paprika harvesting process, it is assumed that the exhausted gas of CO2 is available as a growth agent. Here, the target product is a paprika. Thus, the functional unit is assumed to be the unit per a produced paprika (Dowaki et al., 2011c). Next, in the pre-processing process, there are sub-processes of chipping, transportation, and drying of biomass materials. In particular, within the sub-processes of transportation and drying, we have to consider uncertainties (see section 3.3.1). To date, there are a few studies considering these uncertainties. CO2 emissions in the biomass LCA would be affected by the moisture content of biomass materials, and the transportation distance from the cultivation site, or the site of accumulating waste materials, to the energy plant. Hence, it would be extremely significant to consider these factors. Table 7 shows the specific CO2 emissions, for each fuel with biomass materials, respectively.
www.intechopen.com

Biofuel's Engineering Process Technology
606
Item CO2 Note
Feedstock 0.0 g-CO2/MJ-Fuel at 20 wt.% (moisture content), Japanese Cedar, HV:13.23 MJ/kg
Diesel 74.4 g-CO2/MJ-Fuel Chipping, Transportation, HV: 35.50 MJ/L Bunker A 76.9 g-CO2/MJ-Fuel Paprika production (Boiler) Kerosene 73.6 g-CO2/MJ-Fuel Paprika production (Boiler) Electricity 123.1 g-CO2/MJ-Fuel* Paprika production (Ventilation and
lightning)
Fertilizer (N) 5.67 kg-CO2/kg Indirect CO2 emission Fertilizer (P2O5) 0.88 kg-CO2/kg Indirect CO2 emission Fertilizer (K2O) 1.85 kg-CO2/kg Indirect CO2 emission
Table 7. Data of the specific CO2 emissions.
On the energy conversion process, assuming that the 19 t/d BT plant and 4×200 kW SOFC
(BT-SOFC system) were installed, we estimated the CO2 emission in the paprika production
system. Here, the operational condition of SOFC unit is assumed to be almost full load
operation. Also, the specification of SOFC unit is shown in Table 8.
Unit Scale [kW] 200
Number of unit - 4
Operating Temp. [°C] 900
Current density [mA/cm2] 612
Stoichiometric ratio - 1.25
Tafel slope [mV/dec.] 2.2
Cell Resistance [ohm] 0.52
Open Circuit Voltage [mV] 950
DC/AC converter Eff. [%] 95
Table 8. Specification of SOFC unit.
Due to the specification data in each system, the performance of BT-SOFC system is
obtained as Table 9. Also, the thermal energy supply to the facility is assumed to be due to
the heat pump (COP: 5.5).
BT Process (19t/d)
Feedstock 781.3 kg/h
10,338 MJ/h
Cold-Gas eff.(Eq. (7))
56.2 LHV%
Auxiliary Power 127.3 kW
SOFC (4×200 kW)
Power eff.vs. syngas
45.5 LHV%
Power eff. vs. feed 25.0 LHV%
Net eff. vs. feed 20.6 LHV%
Net power scale 590 kW
Table 9. Performance of BT-SOFC system.
www.intechopen.com

Energy Paths due to Blue Tower Process
607
4.2.2 Paprika cultivation facility In this study, we investigated the greenhouse facility at Miyagi of Japan where paprika is
brought into cultivation. In this facility, the annual product yields are around 200 t/yr. The
energy of electricity, kerosene and bunker A for lighting and a heater, and the input of CO2
gas as a growth agent are consumed. Here, since the energy data of time series was
necessary, the boiler fuels of kerosene and/or bunker A were assumed to be in proportion to
a difference between the minimum temperature for growing and the atmospheric one. Also,
electricity was assumed to be consumed for 12 hours per a day.
Next, the consumption of CO2 gas as a growth agent would be analysed statistically. In a plant such as paprika, CO2 is consumed through photosynthesis. That is, this volume would be proportional to the duration of bright sunshine and an intensity of radiation. Fig.11 shows the statistically estimated CO2 consumption.
y = 23.15e0.0009x
R² = 0.801
y = 821.36e0.0008x
R² = 0.782
0
2,500
5,000
7,500
10,000
0 1,000 2,000 3,000 4,000 5,000 6,000
CO
2in
put[
kg-C
O2]
Radiation×Duration of sunshine [Wh/m2 ]
CO2 input(Feb.-Jun.)
CO2 input(Jul.-Dec.)
Fig. 11. CO2 supply volume as a growth agent.
On the other hand, fertilizers of N, P2O5 and K2O only were considered, however another chemical inputs were ignored (Dowaki et al., 2010b).
4.2.3 Specific CO2 emission of a paprika production Based on the above results, we estimated the CO2 emission in conventional case and that of
BT-SOFC case (see Fig. 12). In this study, the CO2 intensities in BT-SOFC case are included
on the uncertainties of moisture content and a transportation distance (See section 3.3.1).
In the conventional case, the specific CO2 emission of 622.6 g-CO2/paprika was estimated. On the other hand, in the BT-SOFC case, the specific CO2 emission of 38.1 to 218.4 g-CO2/paprika was analysed, and CO2 reduction rate was 64.9% to 93.9%, respectively. Also,
since the surplus electricity of 4,137 MWh/yr would be generated through this system, the much CO2 reduction benefit might be obtained due to the alternation with the conventional electricity.
www.intechopen.com

Biofuel's Engineering Process Technology
608
Fig. 12. Specific CO2 emission of a paprika.
5. Conclusions
As we described before, there is a good potential to install the renewable energy system such as a biomass energy system. In this section, we focused on the Blue Tower gasification process. In the near future, when we consider the promotion of eco-friendly business, we have to realize the sustainable business model which can be operated under a good cost condition and/or a reduction of CO2 emission. That is, we have to consider not only technological barrier but also the CO2 abatement effect. In this case, LCA methodology would be reasonable and necessary. Of course, the business scheme would be extremely significant. In this section, we introduced two cases based on the biomass gasification system of BT process. In both cases, for instance, if we utilize the subsidies due to the central and/or local governments at the initial stage, or the regulation of feed-in tariff is available, the proposed business scheme would become increasingly competitive against the conventional business model. Also, recently, people have a great concern on the carbon-foot print based on LCA methodology. This means that there is potentiality to purchase the product with low-carbon emission. For the future, in order to mitigate GHG gases, we might have to consider the suitable technological system and the effective eco-socio system.
6. References
Ministry of Economy, Trade and Industry, Japan (METI). (2007). Report on Next-Generation Vehicle and Fuel Initiative, 11.07.2007, Available from:
www.meti.go.jp/press/20070528001/initiative-torimatome.pdf The Ministry of Agriculture, Forestry and Fisheries, Japan (MAFF). (2006). 11.07.2007,
Available from: http://www.maff.go.jp/biomass/h18_point.pdf
www.intechopen.com

Energy Paths due to Blue Tower Process
609
K.K. Gas Review. (2007). Demand and Supply for industrial gas, 2007 Gas Georama in Japan (in Japanse). p.65
M .Mayer, H. J. Mühlen and C. Schmid. (2004). Blue Tower hydrogen from biomass, European Conference on Renewable Energies and Cooperation Exchange, Vienna, Austria
H. J. Mühlen and C. Schmid. (1999). Staged Reforming-A Thermal Conversion Process Specifically Developed for Biomass, Proceedings 2nd Olle Lindström Symposium, pp. 75-82, Stockholm, Sweden
K. Dowaki, T. Ohta, Y. Kasahara, M. Kameyama, K. Sakawaki and S. Mori. (2007) An Economic and Energy Analysis on Bio-hydrogen Fuel using a Gasification Process. Renewable Energy, Vol. 32, Issue 1, pp. 80-94
M. Kameyamaa, S. Ogura, H. Kamiuchi and K. Dowaki. (2010). Performance evaluation of 1t/d scale plant through Blue Tower gasification process (in Japanese). Journal of Japan Society of Energy and Resources, Vol. 31, No. 2, pp.43-50
K. Dowaki, Y. Kon, and M. Kameyama. (2008a). A Modified Design of CGS Operation or Bio-H2 Production through Blue Tower (BT) Process. The 8th International conference on Eco balance, B-07, Tokyo, Japan
K. Dowaki, M. Nakazono, M. Yamanari, M. Kameyama and H. Kamiuchi. (2011a). An Analysis of Heat and Flow Characteristic of Heat Carrier in BT Process (in Japanese). Proceedings of the 27th conference on energy, economy, and environment, pp.271-274, Tokyo, Japan
K. Dowaki, H. Ishitani, R. Matsuhashi and N. Sam. (2002). A comprehensive life cycle analysis of a biomass energy system. Technology, Vol. 8, pp. 193–204
K. Dowaki, S. Mori, H. Abe, P. Grierson, M. Adams, N. Sam and P. Nimiago. (2003). A life cycle analysis of a biomass energy system taking sustainable forest management into consideration. Proceedings of 6th International Conference on Greenhouse Gas Control Technologies, pp. 1383–1388, Kyoto, Japan
K. Dowaki and Y. Genchi. (2009). Life Cycle Inventory Analysis on Bio-DME and/or Bio-MeOH products through BLUE Tower Process. International Journal of LCA, Vol.14, Number 7, pp.611-620
S. Hashimoto, T. Obara and Y. Terashima. (2000). Evaluation of demolition wood waste recycling from environmental aspect (in Japanese), Journal of environmental systems and engineering VII, Vol. 643, Issue VII-14, pp.37–48
Suri-Keikaku Co. Ltd. (2005). FY2004 Survey on estimation and investigation of exhaust emission factors and their total amount (in Japanese).
K. Dowaki, T. Eguchi, R. Ohkubo and Y. Genchi (2008b) A life cycle assessment on a fuel production through distributed biomass gasification process (in Japanese). Transaction of the institute of Electrical Engineers of Japan C, Vol. 128, Issue 2, pp.168–175
Infoplease. (2005). Cell Phone Usage Worldwide, by Country. 01.04.2011, Available from: http://www.infoplease.com/ipa/A0933605.html
G. Hoogers. (2003). Fuel Cell Technology Handbook, In: Portable Applications, G. Hoogers, (Ed.), Capter 9, CRC Press LLC, ISBN 0849308771
K. Dowaki, T. Izawa and K. Sakamoto. (2010a). An analysis of CO2 emission on the cell phone with PEFC using Bio-H2 fuel (in Japanese). Journal of Life Cycle Assessment, Japan, Vol. 6, Issue 3, pp. 259-269
www.intechopen.com
Biofuel's Engineering Process Technology
610
K. Dowaki, K. Yasumoto, M. Yamanari, Y. Iwai and H. Nishiyama. (2011b). A system analysis on the mobile device in consideration of the characteristics of cell phone users (in Japanese). Proceedings of The 6th meeting of the institute of Life Cycle Assessment, Japan, pp.170-171, Sendai, Japan
J. Kim, S. M. Lee and S. Srinivasan. (1995). Modeling of Proton Exchange Membrane Fuel Cell Performance with an Empirical Equation. Journal of The Electrochemical Society, Volume 142, Issue 8, pp. 2670-2674
K. Dowaki, M. Yamanari, Y. Takada and J. Kamihirata. (2010b). An indication of a carbon-footprint of Paprika due to the greenhouse facilities with an installation of biomass energy system, The 9th International conference on Eco balance, A2-1510, Tokyo, Japan
K. Dowaki, K. Fukumoto, M. Shimoguchi and M. Yamanari. (2011c). Proposals of the agricultural products cultivation system due to Blue Tower Gasification combined-cycle systems to reduce CO2 emission. Proceedings of The Life Cycle Management conference (LCM 2011), Submitted, Berlin, Germany
K. Kikuchi and N. Itsubo. (2009). Utility of Applying Carbon Footprint at Farmers’ Market Aimed at Promotion of Local Production for Local Consumption (in Japanese), Journal of Life Cycle Assessment, Japan, Vol. 5, No. 4, 2009, pp.446-455
www.intechopen.com

Biofuel's Engineering Process TechnologyEdited by Dr. Marco Aurelio Dos Santos Bernardes
ISBN 978-953-307-480-1Hard cover, 742 pagesPublisher InTechPublished online 01, August, 2011Published in print edition August, 2011
InTech EuropeUniversity Campus STeP Ri Slavka Krautzeka 83/A 51000 Rijeka, Croatia Phone: +385 (51) 770 447 Fax: +385 (51) 686 166www.intechopen.com
InTech ChinaUnit 405, Office Block, Hotel Equatorial Shanghai No.65, Yan An Road (West), Shanghai, 200040, China
Phone: +86-21-62489820 Fax: +86-21-62489821
This book aspires to be a comprehensive summary of current biofuels issues and thereby contribute to theunderstanding of this important topic. Readers will find themes including biofuels development efforts, theirimplications for the food industry, current and future biofuels crops, the successful Brazilian ethanol program,insights of the first, second, third and fourth biofuel generations, advanced biofuel production techniques,related waste treatment, emissions and environmental impacts, water consumption, produced allergens andtoxins. Additionally, the biofuel policy discussion is expected to be continuing in the foreseeable future and thereading of the biofuels features dealt with in this book, are recommended for anyone interested inunderstanding this diverse and developing theme.
How to referenceIn order to correctly reference this scholarly work, feel free to copy and paste the following:
Kiyoshi Dowaki (2011). Energy Paths due to Blue Tower Process, Biofuel's Engineering Process Technology,Dr. Marco Aurelio Dos Santos Bernardes (Ed.), ISBN: 978-953-307-480-1, InTech, Available from:http://www.intechopen.com/books/biofuel-s-engineering-process-technology/energy-paths-due-to-blue-tower-process

© 2011 The Author(s). Licensee IntechOpen. This chapter is distributedunder the terms of the Creative Commons Attribution-NonCommercial-ShareAlike-3.0 License, which permits use, distribution and reproduction fornon-commercial purposes, provided the original is properly cited andderivative works building on this content are distributed under the samelicense.