energy outlook white paper preliminary draft
TRANSCRIPT

Energy Outlook White Paper Preliminary Draft
Author:
Aaron Katzenstein, Ph.D. - Supervisor
Reviewers and Contributors:
Philip M. Fine, Ph.D. – Deputy Executive Officer
Mohsen Nazemi, P.E. – Deputy Executive Officer
Jill Whynot – Assistant Deputy Executive Officer
Barbara Baird – Chief Deputy Counsel
Scott Epstein, Ph.D. – A.Q. Specialist
2016 AQMP White Paper

1
Preliminary Draft -
ENERGY OUTLOOK WHITE PAPER
I. Purpose
In order to attain federal ambient air quality standards for ozone and PM2.5 in the South Coast Air
Basin (Basin), and to achieve the state’s GHG reduction targets, transformational changes
regarding how we select and use energy resources are essential. The Energy Outlook White Paper
Workgroup was assembled to assist staff in the development of a white paper that provides insight
and analysis on a range of topics that impact the energy sector and air quality within the Basin.
The range of topics and analysis, in part, cover:
• Review of the energy resource choices within the AQMP planning horizon;
• Identification of potential demand, supply, and infrastructure needs for energy
sectors based on existing and proposed regulations, policies, and programs;
• Review of emerging technologies that impact efficiency and reliability;
• Scenario analysis based on input from other working groups for various energy
sectors;
• Energy infrastructure; and
• Recommended actions for coordinated efforts among the public agencies, fuel
providers, and consumers for the scenarios analyzed.
II. Background
The 2016 Air Quality Management plan will largely focus on a NOx heavy reduction strategy to
achieve the 2023 and 2031 federal ozone standard deadlines in the Basin. Additional but limited
reductions of VOCs are needed to help achieve the federal ozone standards, and reductions of both
NOx and VOCs will reduce levels of fine particulate matter being formed within the atmosphere.
In addition to reducing these criteria pollutants, significant reductions in greenhouse gas emissions
(GHG) are needed to achieve the State greenhouse gas targets, and to develop pathways for others
in the nation and the world to limit atmospheric levels of GHGs below thresholds that lessen the
potential for catastrophic climate change impacts.
Within California, many different policies, regulations, market-based mechanisms and incentives
are in place and/or are being implemented that impact the types of energy supplied and used, how
energy is used, and the emissions associated with energy generation and use. Policies and

2
regulations previously enacted for air quality improvement have had an impact on the types of
energy supplied and used in the Basin. As an example, the amount of coal use for electricity
production in California has declined from a peak of 1,363 tons in 1993 to 539 tons in 20121. This
partially is a result of the Emission Performance Standard established by SB 1368 in 2006, which
does not allow an increase in generating capacity of a facility that exceeds 1,100 lbs. CO2 per
MWh2. Similar GHG emissions limits are being implemented under the EPA’s Clean Power Plan
and will result in fuel switching of several coal power plants nationally. The sources of energy in
California will continue to change as a result of the rapid development of new technologies and
renewables, needs to protect public health from air pollution, and initiatives such as Governor
Brown’s new targets to reduce fossil fuel usage by 50%, increase renewable power generation to
50%, and increase efficiency within existing buildings 50% by 2030.
The energy supply and consumption pathways for California in 2008 are shown in Figure 1. These
energy pathways show a clear split of energy supply vs. end use, with liquid petroleum fuels
primarily used in transportation, whereas, stationary non-transportation end uses utilize gaseous,
solid, nuclear, and renewable energy sources. These historical energy flows have relatively little
energy crossover between the stationary and transportation sectors. Newer technologies, declining
renewable energy costs, changing and volatile fossil energy prices, along with newly implemented
Figure 1: 2008 California Energy Flow in trillion BTUs3.

3
policies and regulations are resulting in the traditionally separated transportation and stationary
energy sectors becoming more integrated and economically coupled. The changes in energy supply
and the increase in cross sector energy demand will create benefits and potential costs for the use
of each energy type along with potential impacts on criteria pollutant, toxic, and GHG emissions.
Additionally, the energy losses within the overall energy system are high. Energy losses relating to
power generation are shown in Figure 1 to be 62% of the total primary energy used to generate
electricity (not including losses associated with imported electricity generation). These losses are a
result of inefficiencies within technologies to generate energy that result in waste heat. Also shown
in Figure 1, the difference between energy inputs into the refinery sector and petroleum outputs
result in 25% losses in energy also as a result of waste heat production. Not shown in Figure 1 are
the significant energy losses that occur within the stationary and transportation end uses of
electricity, natural gas, and petroleum. Within the transportation sector these losses are typically
around 80% to the heat losses associated with the widespread use of internal combustion drive train
technologies4.
New renewable energy policies, implementation of new technologies and the enhanced energy
efficiency efforts being undertaken in California are driven, in part, by the need for significant
reductions in greenhouse gases and will also result in significant criteria pollutant reductions. Since
NOx emissions largely do not have a naturally occurring source in the Basin, except for biomass
burning sources, the entire inventory of NOx emissions is the direct result of combustion sources
and the properties of the fuel and end use technologies. Additionally, a large majority of VOC and
GHG emissions in the Basin also result from either fugitive or combustion emissions resulting from
our energy choices. In 2011, the SCAQMD Governing Board adopted the SCAQMD Air Quality
Related Energy Policy which guides the SCAQMD in integrating air quality and GHG reductions
along with Basin energy issues in a coordinated manner5. Transformations of the traditional energy
infrastructure will be needed as new technologies that have zero and near zero emissions and
renewable energy sources are increasingly implemented.

4
III. Emissions by Energy Type
Shown below in Figure 2 are the NOx emissions from the 2012 AQMP inventory resulting from
different types of energy use. The diesel and gasoline fuels (consumed primarily for transportation)
result in the highest NOx emissions. Even as fleet turnover to lower emission vehicles occurs in
the transportation sector and further reductions are achieved for stationary sources, The 2012
AQMP projects that the Basin will not achieve NOx levels sufficient to achieve the 2023 and 2031
ozone standard, without significant further reductions of NOx.
Figure 2: 2012 AQMP NOx annual average emissions inventory by fuel type. Source: Chapter 10, 2012 AQMP.
(Figure 2 is being updated with 2016 inventory).
The carbon dioxide emissions in the Basin associated with fossil fuel combustion are directly
linked to the carbon content in the fuels and the amount of fuels used. As shown in Figure 3 the
2008 Basin carbon dioxide emissions were over 134 million metric tons. This emission estimate
does not include fuels used to generate power that is imported into the Basin or the impact of
many of the GHG policies and regulations that have come into effect since the 2012 AQMP
analysis.
Figure 3: Greenhouse Gas (CO2) emissions in 2008 by fuel type (total 134 MMT CO2, 2012 AQMP).

5
IV. Policies and Regulations Impacting Energy Use in California
There are several federal, state, and local regulations and policies that impact energy usage in
California. Table 1 provides a partial list of policies and regulations which have been recently
enacted or proposed at the different levels of government.
Table 1: Polices and Regulations Impacting Energy Use in California
Policy
Objective
Level of
Governme
nt
Name Goal
Air Quality Federal Clean Air Act
Achieve health based standard levels of criteria and toxic pollutants
along with protecting public health from ozone depleting substances
and greenhouse gases.
GHG Reduction Federal Clean Power Plan Reduce GHG emissions from new, modified and existing power
plants
Fuel Standard Federal
Energy Independence
and Security Act of
2007
36 billion gallons of renewable transportation fuel by 2022
Truck GHG
Reductions Federal Phase 2
Increases fuel economy of trucks and trailers starting for model year
2021
Petroleum
Reduction State
California State
Alternative Fuels Plan,
Governors Target
(SB 350 proposed)
Reduce petroleum use in to 15% below 2003 levels by 2020; 50%
reduction in petroleum fuel use by 2030.
ZEV Mandate State California Executive
order B-16-2012 1 million EVs by 2023 and 1.5 million by 2025
Vehicle Efficiency State Pavley Standards
AB 1493 Increase vehicle efficiencies and reduce GHG emissions
GHG Reduction State
AB32, California
Global Warming
Solutions Act
Governor Targets
Reduce GHG emissions to 1990 levels by 2020, 40% below 1990
levels in 2030, and 80% below 1990 levels by 2050.
GHG Reduction State Cap and Trade Reduce GHG emissions from stationary facilities and fuel providers.
Renewable Power
Generation State
Renewable Portfolio
Standard Governors
Target
(SB 350 proposed)
33% renewable electricity generation by 2020 and target of 50%
renewable power generation by 2030.
Building Efficiency
Standards State
Title 24, Governors
Target
(SB 350 proposed)
Net zero energy new residential construction by 2020, net zero
energy commercial construction by 2030, increase in existing
building efficiency 50% by 2030.
Emissions
Performance
Standard
State SB 1368 Establish base load generation to not exceed 1,100 lbs CO2/MWh
Coastal water
protection State Once Through Cooling
Eliminate use of once through ocean water cooling by coastal power
plants. Protection of coastal waters and marine life.
Energy Storage
Mandate State AB2514 1.3GW storage mandate by 2020
Large Stationary
Emissions
Reductions
Local
Regional Clean Air
Incentives Market
(RECLAIM)
Declining Allocations and Credit trading program within Basin for
NOx and SOx reductions from large stationary sources.

6
V. Energy Landscape Over the past decade the energy landscape in the United States has changed dramatically. This is
largely the result of an increase in domestic fossil fuel production from implementing
unconventional recovery techniques such as fracking. As a result the United States is requiring
less imported energy to match consumption and, by around 2028, is projected to recover as much
fossil energy as consumed, Figure 46. However, there are many potential environmental issues
and concerns associated with unconventional recovery techniques and the transport of fuel from
increased domestic energy production. These concerns, in-part, include the potential for
groundwater contamination, wastewater disposal, and emissions associated with well production.
At the same time, renewable energy is also being more widely implemented and integrated with
new technologies in transportation, energy storage, distributed energy, and demand side
management7. One of the most significant changes in the renewable landscape has been the
dramatic drop in costs for solar power generation as shown in Figure 5. Under the California Solar
Initiative, the installed costs for rooftop PV systems have dropped 50% over the last 7 years to a
recent average below $5 per watt.
Figure 4: Historical and projected United States domestic
energy production and consumption6.

7
The increase in production of oil and gas within the United States has also led to declining prices.
These changes, new technologies, along with new policies and regulations are changing the energy
landscape within the Basin. Current and upcoming issues and technologies for each energy sector
that may result in emissions impacts are discussed below.
a. Electricity
Background
The electricity energy sector is reliant on many different types of fossil and renewable energy
sources to meet electrical load demands in real time. A stable grid relies upon the delicate balancing
of matching generation with demand, traditionally accomplished by using large central power plants
connected to transmission grids operated by grid balancing agencies such as the California
Independent System Operator (CAISO). These large transmission grids help supply localized
distribution grids operated by utilities to supply end use customers. The traditional generation and
distribution system meets electricity demand increases through large central power plants and
peaking generation units. The need to balance generation capacity with peak demand periods,
occurring during the daytime during the summer months, requires excess generating capacity that
often sits idle. Peaking units generally have capacity factors around 5% and do not operate as
efficiently as larger combined cycle base load power plants9.
The traditional one way flow of electricity from large power plant to passive end use creates
additional expenses for ratepayers based on the need for excess infrastructure and generating
capacity. A version of the simplified traditional utility model with large plants supplying end users
is still somewhat in place within California, but started changing with state demand side programs
being implemented by the CEC and DOE in the 1970’s. These programs started the process of
adjusting end user demand to help minimize the amount of electrical infrastructure needed to
maintain the electrical grid. The early demand side management regulations implemented by the
CEC, include building energy standards under Title 24 and appliance efficiency standards. End use
Figure 4: Solar panel prices and installations over time. (Source: Bloomberg
Markets8).

8
efficiency programs along with other demand side measures have helped lower and leveled the per
capita electricity consumption in California while also reducing the amount of new power plants
needed (see Residential and Commercial Energy White Paper).
Electricity pricing structures also reduce electricity demand during peak demand periods. Many
large electricity consumers are billed largely based on time of use and for on-peak power demand.
Under this pricing structure electricity rates vary substantially during the highest usage hours of the
summer months. Time of use rate structures have recently become available to residential
customers as utility smart meters have been implemented. To help shave energy during peak
demand periods, many utilities have created demand response programs that provide financial
benefits to customers that install equipment to shave energy use during high demand periods.
The electricity sector in Southern California is undergoing rapid changes with the unexpected
shutdown of the San Onofre Nuclear Generating Station along with the repowering of coastal
generating plants to meet the state’s requirements of the Once-Through-Cooling (OTC) Policy. At
the same time, other mandates requiring implementation of
more renewable power generation and increasing the amount
of electric cars in California are quickly creating additional
demands on the electricity system.
Under AB162, utilities are required to disclose the percentage
of power from different generation sources that they supply to
customers as they progress toward supplying at least 33%
energy from renewable generation sources by 2020. As shown
in Figure 6, SCE in 2013 supplied 22% from qualifying
renewable resources and is currently on track to achieve the
33% target in 2020. In 2003, the Energy Action Plan
implemented the states preferred resources for electrical
loading order which places priority, respectively, on demand
side management, renewable generation, and lastly, additional
fossil fuel powered generation10. Other regulations such as
California’s GHG Cap and Trade Program provide market
incentives that promote increased generation efficiencies and
the use of renewable fuels.
As higher percentages of variable and intermittent renewable resources are integrated into the
electrical grid, matching generation with demand becomes increasingly difficult with traditional
grid systems and can make the electrical grid less reliable. The addition of large amounts of
renewable generation often requires resources that can balance the short term intermittency. For
photovoltaics and wind generation, this often results from intermittent cloud cover (Figure 7) and
varying wind speeds, respectively. Additional resources must be implemented to balance
Figure 6: Power content label for Southern
California Edison's power supply mix in 2013.

9
large variable renewable power sources on the larger transmission and utility distribution electrical
grids. Figure 8, shows the actual and projected net generation demand that is required from fossil
generation as more wind and solar power are projected to be added to the CAISO transmission
electrical grid. Referred to as the “Duck Curve”, due to its shape, the primary impact of adding
more solar generation requires
the output from fossil
generation units to significantly
decline or idle during the peak
daylight hours. The generation
units, however, must be quickly
dispatchable not only to help
balance potential renewable
generation intermittency, but
also be capable and ready to
provide the rapid generation
ramp needed as the sun sets and
system load increases into the
evening.
Currently, peaking generation
and synchronous condensers
are being utilized to help provide the flexible and dispatchable resources that help integrate
renewable resources into the electrical grid. The peaking generation units help support renewable
resources by having fast ramp rates and response times, but negate some of the GHG emissions
benefitsof using renewables by maintaining reliance on fossil generation. Additionally, increasing
the number of startup events along with ramping needs results in slightly higher criteria pollutant
emissions from peaking generation units than have been observed from these generators in the past
(refer to: UCI Professor Jack Brouwer April 15th Energy Outlook Workgroup Presentation11).
As a result of changes in power plants such as San Onofre closure, along with the planned closure
and repowering of additional Southern California coastal power plants, there is a need for voltage
support on the local distribution networks. Smaller generating plants and other distributed energy
Figure 7: Daily power output from solar panel array
showing generation intermittency from passing clouds.
(Courtesy UC, Irvine)
Figure 8: "Duck Curve" represents the net load which shows the variability in
demand and supply that CAISO must balance with controllable flexible resources.
The net load represents the load that must be met with flexible and dispatchable
resources. The net load subtracts the variable renewable generation from the end
user demand. (Source CAISO)

10
resources are being implemented in a newer grid structure that provides more resilience and less
reliance on large traditional generation, and operates with less infrastructure redundancy.
Additionally, a change under CPUC Rule 21 is being made to start allowing smart inverters attached
to rooftop solar installations to provide voltage support, a measure already being implemented in
Europe. In California most inverters installed with rooftop solar panel systems are smart inverters;
however, the grid services capabilities, such as voltage support, has been disallowed in California
under outdated grid interconnection requirements that are currently under review12.
New Technologies and Adapting to a Changing Grid Landscape
As mentioned earlier, the traditional electric grid management paradigm has been to add additional
generation to match demand with end use customers being passive consumers. It has been shown
that demand side management is much less costly than adding generation and provides greater
utilization of existing resources13,14,15. Demand side management is
increasingly becoming more important as higher amounts of power are derived
from renewable generation making it more difficult to match generation with
demand16. Southern California Edison is undertaking a preferred resources pilot
program within Orange County that is studying which types of demand side
management resources can help alleviate infrastructure needs, in part, due to the
San Onofre shutdown17. Large amounts of renewable power during low demand
periods have recently resulted in periods of over-generation that led to negative
wholesale market prices18. New technologies are rapidly being developed and
implemented that provide flexible resources to help manage any excess power generated from
renewable resources along with reduced load during times of peak demand or high net load ramping
needs16.
To help balance end user demand with generation, households and businesses are increasingly
relying on energy management systems that help reduce peak demand charges, can participate in
demand response events, and better manage energy loads with onsite generation and occupancy
needs. One example of these technologies in the residential sector has been the implementation of
Wi-Fi connected smart thermostats that help reduce heating and cooling energy use by using
occupancy sensors along with weather forecasts. Other technologies are beginning to utilize utility
smart meters with cellular phones to incentivize participation in demand response events
(Ohmconnect.com). These systems also can be registered with utility demand response programs
and are being developed to integrate with other electricity end uses.

11
One of the largest challenges facing the
electricity sector will be integrating
increasingly large amounts of power and
energy demands from an increasingly
electrified transportation sector (Figure 9).
Traditionally, as shown in Figure 1, the
transportation sector primarily has relied
on liquid fuels and has been separated
from the electricity sector. Original
implementation designs for the existing
electrical infrastructure did not
incorporate energy or power requirements
for transportation. As increasing numbers
of electric vehicles become reliant on the
electrical grid for energy needs,
incorporating electric vehicles into the grid can be done in a manner that actually helps provide
needed grid resources. Demonstrations are being done with managed charging of electric vehicles
that synchronize with grid resource needs during periods of over generation and peak usage.
Existing utility rules are being reviewed to also allow electric vehicles to provide other ancillary
grid services such as frequency regulation, voltage support and reactive power. Managing electric
transportation charging in this manner may be done by the site host, local utility, and/or system
integrator. Collectively, plugged in electric vehicles can provide significant grid resources when
intelligently integrated with the grid. If unmanaged, the integration of transportation energy needs
onto the electrical grid will create additional infrastructure needs without benefits to grid stability.
Incorporating large amounts of energy storage will help integrate increasing amounts of renewable
generation, better manage demand charges and help reduce infrastructure costs for electric vehicle
chargers. Energy storage systems can be deployed on the larger transmission grid, the local utility
distribution grids, and behind the meter applications. Several different technologies are being
utilized for energy storage systems which include: batteries, fuel production, flywheels, pumped
hydro, and compressed air. Currently the most widely used storage systems utilize different battery
chemistries along with using second life electric vehicle batteries. The costs for batteries for both
vehicle and stationary storage applications have been shown to be steadily dropping, however, it is
often difficult to reliably determine and compare recent prices without a standard methodology.
Thus, there is a need to establish a battery price index or energy storage price index as these
technologies become more widely used20.
Figure 9: Projected energy needs by electric vehicles in California
(High, Mid, and Low scenarios)19.

12
Grid scale energy storage systems are starting to be implemented that replace the need for peaking
generation plants. These systems have several advantages over peaking generation units in that they
have high utilization capacity factors, zero emissions, and are
easier to site. As more renewable generation is integrated, and
over generation becomes more prominent, the excess power
may be used to electrolyze water to form hydrogen and oxygen.
The hydrogen can then be stored nearby and used for
transportation applications, power generation, integrated into
the natural gas pipelines, and/or used to develop synthetic
fuels. The application of hydrogen in natural gas pipelines is
being demonstrated in Europe.
Behind the meter storage systems are being used to help offset
peak demand charges, provide backup power when needed,
integrate vehicle chargers with existing infrastructure, and off grid applications. As many
residences and businesses are under time of use utility rates, the storage systems can provide
arbitrage opportunities for the residents and businesses to utilize low electricity costs during off
peak hours and use the stored power during high priced periods “on-peak” 21. Behind the meter
applications also include backup power and in many applications may reduce or eliminate the need
for backup generation units and, when coupled with renewable generation under high utility rates,
may become a cost effective technology for off grid solutions22.
b. Natural Gas
Within the United States the natural gas supply has gone from a possible need for imports to that of
ample supply and declining prices. This is a result of technological developments in exploration,
drilling, and well stimulation that have increased recoverable reserves within the United States
(Figure 10). The increase in supply and resource base has driven natural gas prices down to a recent
$3 per thousand cubic feet in May 2015, 60% lower than in May 2008 when reserves started to
dramatically increase. In 2008, an
estimated $3 billion worth of
natural gas was consumed in the
residential and commercial sectors
Basin wide.
Greentechgrid: Nov. 2014
Figure 10: Increase in U.S. natural gas proven reserves over time6.
13
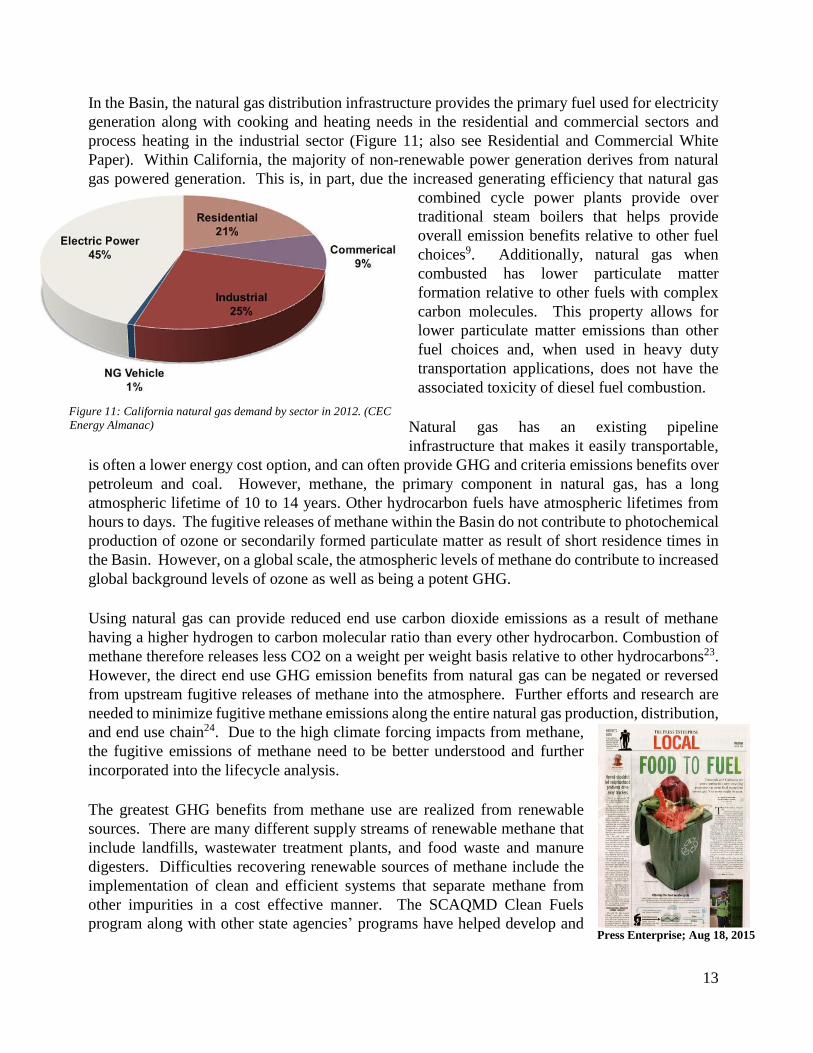
In the Basin, the natural gas distribution infrastructure provides the primary fuel used for electricity
generation along with cooking and heating needs in the residential and commercial sectors and
process heating in the industrial sector (Figure 11; also see Residential and Commercial White
Paper). Within California, the majority of non-renewable power generation derives from natural
gas powered generation. This is, in part, due the increased generating efficiency that natural gas
combined cycle power plants provide over
traditional steam boilers that helps provide
overall emission benefits relative to other fuel
choices9. Additionally, natural gas when
combusted has lower particulate matter
formation relative to other fuels with complex
carbon molecules. This property allows for
lower particulate matter emissions than other
fuel choices and, when used in heavy duty
transportation applications, does not have the
associated toxicity of diesel fuel combustion.
Natural gas has an existing pipeline
infrastructure that makes it easily transportable,
is often a lower energy cost option, and can often provide GHG and criteria emissions benefits over
petroleum and coal. However, methane, the primary component in natural gas, has a long
atmospheric lifetime of 10 to 14 years. Other hydrocarbon fuels have atmospheric lifetimes from
hours to days. The fugitive releases of methane within the Basin do not contribute to photochemical
production of ozone or secondarily formed particulate matter as result of short residence times in
the Basin. However, on a global scale, the atmospheric levels of methane do contribute to increased
global background levels of ozone as well as being a potent GHG.
Using natural gas can provide reduced end use carbon dioxide emissions as a result of methane
having a higher hydrogen to carbon molecular ratio than every other hydrocarbon. Combustion of
methane therefore releases less CO2 on a weight per weight basis relative to other hydrocarbons23.
However, the direct end use GHG emission benefits from natural gas can be negated or reversed
from upstream fugitive releases of methane into the atmosphere. Further efforts and research are
needed to minimize fugitive methane emissions along the entire natural gas production, distribution,
and end use chain24. Due to the high climate forcing impacts from methane,
the fugitive emissions of methane need to be better understood and further
incorporated into the lifecycle analysis.
The greatest GHG benefits from methane use are realized from renewable
sources. There are many different supply streams of renewable methane that
include landfills, wastewater treatment plants, and food waste and manure
digesters. Difficulties recovering renewable sources of methane include the
implementation of clean and efficient systems that separate methane from
other impurities in a cost effective manner. The SCAQMD Clean Fuels
program along with other state agencies’ programs have helped develop and Press Enterprise; Aug 18, 2015
Figure 11: California natural gas demand by sector in 2012. (CEC
Energy Almanac)

14
demonstrate technologies to clean up renewable methane waste streams for power generation and
transportation uses. Although these technologies are being implemented, it is currently unclear how
much renewable methane might be cost-effectively recovered within the Basin from the many
different waste streams.
New Technologies and Uses
The natural gas distribution system in California is slightly constrained during the winter month
periods when more natural gas is required for heating purposes25. During these months underground
storage helps provide natural gas during peak demand periods. Much like electricity generation
constraints during peak summer demand periods, the natural gas pipelines require a similar
balancing technique during times of high usage in the winter months. Within Southern California,
there is currently over 140 Billion cubic feet of underground storage using depleted reservoirs that
help balance Basin natural gas needs between seasons of high use and high prices with seasons that
have lower prices and lower natural gas demands.
As mentioned earlier, methane use in California will increasingly be derived from renewable
sources. Several technologies will likely become more prominent; these include11,26:
Technologies, such as pressure swing absorption, that help scrub the natural gas from
different waste streams.
Developing natural gas from excess renewable power generation (power to gas).
Increasing use of natural gas for stationary and transportation fuel cells.
Using oxy generation systems for combustion processes without pollutant emissions.
Ultra low NOx heavy duty compressed natural gas (CNG) engines.

15
c. Liquid Fuels
In the Basin, the primary use of liquid petroleum fuels is for transportation purposes. In 2008 over
7.3 billion gallons of gasoline and 1.4 billion gallons of diesel were consumed within the Basin with
a combined estimated cost of $32 billion dollars (2012 AQMP). Of all the different energy types,
the gasoline and diesel fuels often have more significant price volatilities as a result of variations in
global crude prices, refinery capacity issues, and overall supply for California blended fuels4 as
shown in Figures 12 and 13. Supply issues for California reformulated gasoline can result in prices
for California gasoline being decoupled from crude oil market prices and gasoline prices in the rest
of the nation, Figure 13.
Figure 12: Average weekly market price between a
gallon of California gasoline and WTI crude. (Source
CEC Energy Almanac and EIA)
As previously shown in Figure 2, the use of liquid fuels currently result in the highest emissions
of NOx and is the largest contributor to GHG emissions within the Basin. A large transformation
is needed within engine technologies to lower NOx emissions from transportation sources. As
shown in Figure 2, diesel use results in significant NOx emissions, particularly within the heavy
duty and off-road engine categories. As outlined within the Goods Movement, On-Road and Off-
Road white papers, new technologies are needed to improve engine emissions and drive train
efficiencies to reduce NOx along with GHG levels27.
Continued use of liquid fuels will increasingly require climate friendly fuel use pathways that, in
part, include more efficient end use technologies. Overall GHG emissions need to be considered,
not only at the tailpipe but also by using a full well to wheels emissions analysis that accounts for
fuel production and distribution. This is currently implemented within the Low Carbon Fuel
Standard (LCFS) to determine the carbon intensities of different fuels by reviewing the lifecycle
analysis of bio-fuels along with other low carbon intensity alternative fuels. A similar analysis can
also consider the associated lifecycle emissions of criteria and toxic pollutant emissions but is
currently not part of the LCFS program. Unfortunately, the majority of bio-fuels produced still
have a positive GHG impact and the upstream emissions associated with traditional oil and gas
recovery are still relatively uncertain28. The use of bio-fuels can provide a partial solution to GHG
Figure 13: Plot shows recent high market premium (in cents) on
California Reformulated Gasoline Blendstock for Oxygenate Blending
(CARBOB) minus the NYMEX national price. (CEC Petroleum Watch
July 15, 2015)

16
reductions, particularly in applications that don’t have alternative technologies available such as
aircraft. However, the limited availability of fuel feed stocks, land use considerations, weather
variability, and potential negative impacts upon food prices are all issues that should be addressed
as bio-fuels develop as part of the solution in reducing GHG emissions.
d. Other Energy Choices
As newer technologies such as fuel cells become more widely available for power generation and
transportation, the supply of alternative energy sources will become more important. Partially
discussed in earlier sections, these energy sources will include renewable fuels such as biodiesel,
ethanol, and waste woody biomass. Some of these renewable fuels may be produced from algae
that sequester CO2 from power plant emissions that are then converted back into fuels used again
at the power plant (See: SoCal Gas, Ron Kent’s April 15th Energy Outlook Workgroup Presentation26).
Other energy supply choices that will be produced from different feed stocks and energy sources
are fuels that do not occur naturally in pure form such as hydrogen and dimethyl ether (DME). The
production of these fuels will help provide emission benefits but may also be produced to help
integrate increasingly larger percentages of renewables onto the electrical grid, provide renewable
energy streams for transportation, and use existing infrastructure for transport and delivery.
In 2015 the first fuel cell vehicles for purchase were introduced in California from Toyota and
Hyundai. As these vehicles are being introduced, supplies of hydrogen and fueling infrastructure
is needed to support their operation. Using hydrogen as an energy source produces water as a
byproduct in fuel cell applications. Additionally, the fugitive release of hydrogen into the
atmosphere does not have an impact on climate, criteria pollutants, or toxic risk.
Although the end uses of hydrogen are generally considered zero-emission, the sources of hydrogen
fuel and the associated emissions to generate hydrogen can vary significantly. Currently, the largest
supply of hydrogen within California comes from steam reformation of hydrocarbons. Methane
currently is widely used as the hydrocarbon source for production of hydrogen; however, other
compounds such as methanol have been utilized for onsite reformation and fuel cell systems.
Unfortunately the reformation process emits CO2 as a byproduct which can be mitigated by using
renewable sources, or possibly by future carbon capture technologies such as algae systems.
Production of hydrogen can also occur through the electrolysis of water. As mentioned within the
Electricity section, the implementation of renewable generation will result in periods of
overproduction relative to real time demand. Rather than curtail the production of power, the excess
energy can also be stored by producing fuels. Hydrogen generated during periods of excess power
through electrolysis of water, referred to as “power to gas”, can be utilized by fuel cells during
periods of high electrical demand or within the transportation sector. During the electrolysis
process, hydrogen and oxygen are produced, and the oxygen might also be recovered and used at
nearby peak generation units using zero-emission oxy combustion technologies (see natural gas
emerging technologies section). Additionally, the large amounts of hydrogen produced renewably
through this process may eventually be blended with natural gas and added into the distribution

17
pipelines. It is also possible to use the hydrogen produced with waste CO2 streams to produce
synthetic natural gas along with other hydrocarbons.
While it is currently not possible to track the amount of hydrogen being produced from different
sources within the Basin, the implementation of both stationary and transportation fuel cells along
with implementing clean pathways to develop large quantities of hydrogen needs to be closely
monitored and supported.

18
VI. Scenario Analysis
Studies have been conducted to show how new technologies can help achieve both air quality and
climate goals. For example, there have been several studies conducting “back casts” on the state
energy sectors to identify potential pathways to achieve the 2050 GHG targets 29,30,.31. Achieving
the GHG state targets will have the co-benefit of criteria pollutant reductions. The scenario case
shown in Figure 14 uses the 2012 AQMP inventory and applies the Governor’s 2030 target
reductions of 50% reduced petroleum use, a 50% increase in existing building energy efficiency,
and a 50% renewable portfolio standard. A linear implementation of the 50% targets is assumed
along with a linear and proportional reduction in criteria pollutants applied to the forecasted
inventory years (2019, 2023, and 2030). In Figure 15 the boxes with dashed lines represent the
difference in NOx tons per day between the applied scenario and the 2012 AQMP inventory shown
in Figure 2.
Figure 14: Potential impact on 2012 AQMP inventory from 50% reductions in existing building energy usage,
petroleum use, and 50% renewable power. Dashed areas show reductions in NOx from applied scenario over 2012
inventory. (NOTE Figure 14 is being updated with 2016 inventory and plot layout will change)
In Figure 14, the applied “50% reduction” scenario still not achieve the required NOx reductions to
meet the projected NOx carrying capacities for ozone attainment in 2023 and 2031. Further NOx
reductions will be needed above and beyond this scenario that make progress towards the state’s
2030 GHG targets. A comparison of the NOx levels needed for attainment, Figure 15, shows the
baseline inventory currently does not reach ozone attainment. Applying the NOx reductions that
might be achieved through the Governor’s
50/50/50 targets, also, does not provide enough
NOx reductions to achieve the ozone standard,
but it makes significant progress towards this
goal. Accordingly, further NOx reductions will
still be needed.
Figure 15: Basin NOx levels showing projections for future
years from 2012 AQMP inventory (red), future NOx levels with
scenario (green), and levels needed for ozone attainment
(blue). (Note: Figure 15 is being updated with 2016
inventory).

19
VII. Findings and Recommendations for 2016 AQMP
Southern California is facing challenges in providing its residents with clean air, clean and
sufficient supplies of water, affordable and reliable energy, and efficient transportation options. The
traditional energy landscape is rapidly changing to incorporate new technologies that alleviate
resource challenges, are adaptable to match changing demand profiles, and provide more efficient
use of energy with fewer emissions. To increase resilience and provide leadership in reducing
greenhouse gas emissions while addressing looming air quality deadlines, the changes occurring
within the energy sector are providing opportunities and pathways to achieve these goals.
As part of the 2016 AQMP, staff is recommending consideration of the following actions:
Electricity:
Monitor the implementation of increasingly large electrical energy demand from
electric transportation. Promote the demonstration and development of
technologies that minimize the emission impacts of adding electric transportation
while reducing infrastructure needs.
Support the development of a battery price index and/or energy storage index to
provide clarity on recent storage prices.
Support development and demonstrate energy storage applications and the benefits
they can have on reducing the need for additional fossil generation units and/or
increased start up/ shutdown/ramping of existing peaking units.
Review and develop programs for increased demand side management
implementation and for technology development with an additional focus on
emission benefits.
Natural Gas:
Further study the potential supply of renewable natural gas from applicable waste
streams, such as waste water treatment plants, in the Basin.
Implement new technologies such as fuel cells that use reformation and can
provide high efficiencies through combined heat and power applications. Use
these technologies to help integrate the transportation sector, to provide grid
services, and as a potential replacement for backup generation units.
Work with utilities and other energy developers to review the integration of the
natural gas system with power generation and the further implementation of
renewables.
Assess the development of oxy combustion power generation systems.
Liquid Fuels

20
Consider criteria pollutants in the well to wheels lifecycle analysis of fuels. This
analysis would include criteria and toxic emissions associated with flaring at well
sites, , processing, and delivery.
Promote the development of renewable fuels that provide criteria pollutant
emission reductions as well as GHG benefits.
Other Fuels
Support the development of an index that monitors of the amounts of hydrogen
used in transportation along with a price tracking monitor for costs associated
with different hydrogen producing technologies.
Continue to demonstrate and promote renewable energy sources that provide
criteria pollutant reductions as well as GHG reductions.
VIII. References 1. EIA, California Electric Power Consumption Estimates,
http://www.eia.gov/state/seds/data.cfm?incfile=/state/seds/sep_use/eu/use_eu_CA.html&sid=California.

21
2. 2014 Total System Power, CEC; http://energyalmanac.ca.gov/electricity/total_system_power.html.
3. CEC, California Energy Balance Database, January 2012.
4. U.S. DOE, Where the energy goes: gasoline vehicles, http://www.fueleconomy.gov/feg/atv.shtml .
5. http://www.aqmd.gov/home/about/policies/aqmd-air-quality-related-energy-policy
6. EIA Annual Energy Outlook 2015, April 2015.
7. Jacobson et al. 100% clean and renewable wind, water, and sunlight all-sector energy roadmaps for the 50 United
States, Energy Environment Sci., 2015, 8, 2093.
8. Bloomberg Markets, May 2015 page 40.
9. CEC, Thermal Efficiency of Gas-Fired Generation in California: 2014 Update, Sept. 2014, (CEC-200-2014-005).
10. 2003 Energy Action Plan (http://www.energy.ca.gov/energy_action_plan/index.html ).
11. Brouwer, Jack; Air quality simulations – renewable energy and other technology implementation scenarios,
Energy Outlook workgroup presentation, April 15, 2015 (http://www.aqmd.gov/home/about/groups-
committees/aqmp-advisory-group/2016-aqmp-white-papers#energy).
12. California Public Utilities Commission, Rule 21 Smart Inverter Working Group,
(http://www.energy.ca.gov/electricity_analysis/rule21/).
13. The Program Administrator Cost of Saved Energy for Utility Customer-Funded Energy Efficiency Programs,
Lawrence Berkeley Laboratory, March 2014.
14. OPOWER, Without energy efficiency there’d be an extra Europe plugged into the grid, October 2014.
15. New Expectations for Electricity Consumers, The Wall Street Journal, Aug. 3, 2015.
16. Rocky Mountain Institute, The Economics of Demand Flexibility: How “Flexiwatts” Create Quantifiable Value
for Customers and the Grid, 2015 (http://www.rmi.org/electricity_demand_flexibility ).
17. Southern California Edison, Preferred Resources Pilot Program;
http://www.edison.com/home/innovation/preferred-resources-pilot.html#.
18. Bloomberg Business, Solar Shines as Sellers Sometimes Pay Buyers to Use Power, May 26, 2015.
19. CEC, California Energy Demand 2014-2024 Final Forecast, January 2014.
20. Nature Climate Change, Rapidly Falling Costs of Battery Packs for Electric Vehicles, March 23, 2015.
21. Applied Energy, Economic viability of energy storage systems based on price arbitrage potential in real-time
U.S. electricity markets, 114 (2014) 512-519.
22. Rocky Mountain Institute, The Economics of Grid Defection: When and Where Distributed Solar Generation
Plus Storage Competes with Traditional Utility Service, 2014
(http://www.rmi.org/electricity_grid_defection#economics_of_grid_defection ).
23. Leveraging Natural Gas to Reduce Greenhouse Gas Emissions, C2ES, June 2013.
24. Brandt et al., Methane Leaks from North American Natural Gas Systems, Science, 343(6172) 2014.
25. 2013 Natural Gas Issues, Trends, and Outlook, CEC July 2014. CEC-200-2014-001-SF.
26. Gas Co. Energy Outlook Workgroup presentation by Ron Kent on April, 15, 2015
(http://www.aqmd.gov/docs/default-source/GB-Committees/energy-outlook-white-paper-working-group/socal-
gas.pdf?sfvrsn=2).
27. Goods Movement, Passenger Transportation, and Off-Road Commercial 2016 AQMP White Papers.
(http://www.aqmd.gov/home/about/groups-committees/aqmp-advisory-group/2016-aqmp-white-papers).
28. Low Carbon Fuel Standard, Table 6. Carbon Intensity Lookup Table for Gasoline and Fuels that Substitute
Gasoline (http://www.arb.ca.gov/fuels/lcfs/121409lcfs_lutables.pdf ).
29. Yang et al., Achieving California’s 80% greenhouse gas reduction target in 2050: Technology, policy and
scenario analysis using CA-TIMES energy economic systems model, Atmospheric Environment, February 2015
(118-130).
30. E3, Pathways to Deep decarbonization in the United States, November 2014 (http://unsdsn.org/what-we-do/deep-
decarbonization-pathways/).
31. E3, Summary of the California State Agencies’ PATHWAYS Project: Long-term Greenhouse Gas Reduction
Scenarios, April 6, 2015 (http://www.arb.ca.gov/html/fact_sheets/e3_2030scenarios.pdf ).