energy out west 2014 nis
TRANSCRIPT


Energy Efficient Multifamily Buildings:Why? What are the Benefits?
Energy Out WestApril 18, 2014
Nehemiah StoneBenningfield Group Inc.

3
Context Quote
• “[for low-income households], the likelihood that their energy bills will exceed their means is determined more by the condition of their home than by their income.” – The Weatherization Leveraging Partnership Project
Scale of the Issue
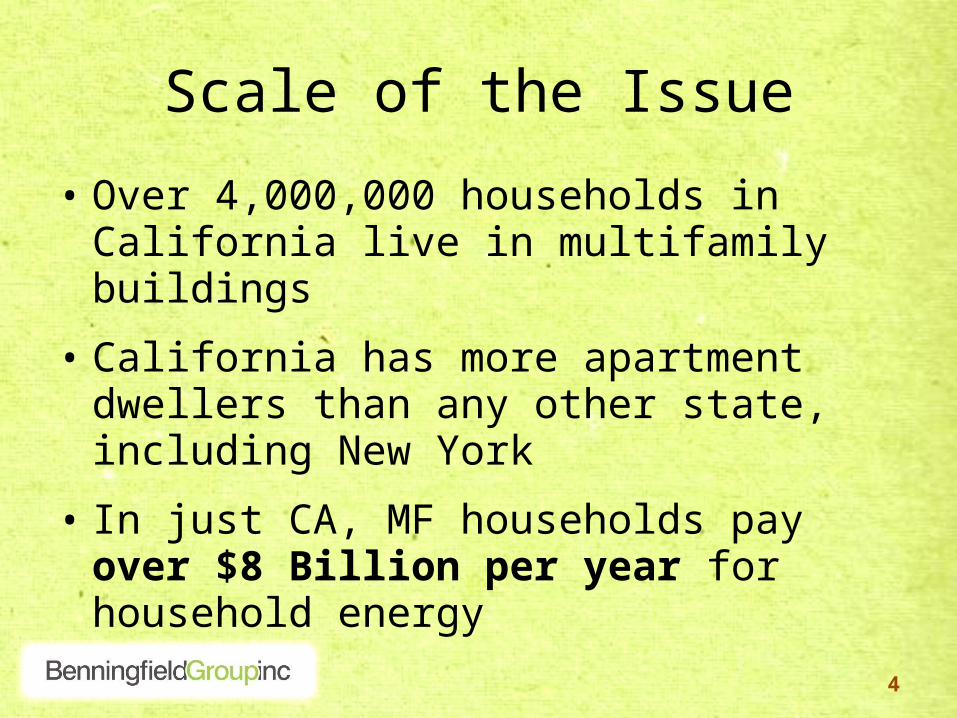
• Over 4,000,000 households in California live in multifamily buildings
• California has more apartment dwellers than any other state, including New York
• In just CA, MF households pay over $8 Billion per year for household energy
4

Too Much Information???

Gaining Perspective

EIA Data For 2009 (latest year available)
http://www.eia.gov/consumption/residential/data/2009/index.cfm?view=consumption#summary

Scale Continued
• Approximately 86% of single-family homes are owner occupied
• Approximately 88% of multifamily homes are tenant occupied
• Average annual income in SF is $61,000/yr
• Average annual income in MF is $31,000/yr
9
Income vs Energy Cost Disparity
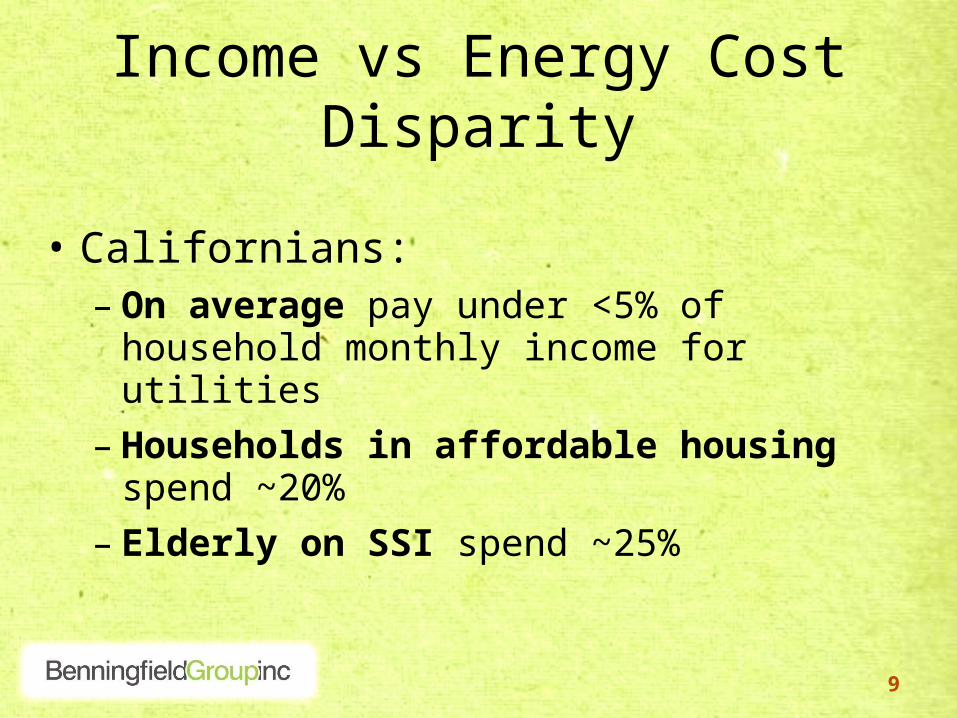
• Californians:– On average pay under <5% of household monthly
income for utilities– Households in affordable housing spend ~20% – Elderly on SSI spend ~25%

10
Energy Cost vs IncomeFederal Poverty Level is only about $21k for a household of four...yet nearly 13 million households (out of 108 million total) are at or below FPL.

11
Energy Price Increases• In the period of 2003-2006, compared to the
cost of other goods (Consumer Price Index):– The cost of Shelter increased at about the same
rate as the overall price increase (CPI)
– The cost of Fuels and Utilities increased at a rate 15% greater than CPI
– The relationship has not been dramatically different since then
Consumer Price Index, U.S. Department of Labor

Energy Price ShocksImpact of a weather or rate shock
on a household’s budget.
Mo Avg 5% 10% 25% 50%25.00$ 1.25$ 2.50$ 6.25$ 12.50$ 50.00$ 2.50$ 5.00$ 12.50$ 25.00$ 75.00$ 3.75$ 7.50$ 18.75$ 37.50$
100.00$ 5.00$ 10.00$ 25.00$ 50.00$ 125.00$ 6.25$ 12.50$ 31.25$ 62.50$ 150.00$ 7.50$ 15.00$ 37.50$ 75.00$

Residential Energy Costs
• In 2009, the 111 Million households in the U.S. spent $230,000,000,000 (~1/4 Trillion Dollars) on household energy.
• For those in multifamily housing, the cost of energy was over $36 Billion [remember this number!]
• HUD spent over $6 Billion for energy in low-income households
• The sad reality of these data is that…

Affordable Housing?• Although they pay relatively high energy costs,
low-income households still cannot achieve the same level of comfort as the average household.
• Tenants limit their energy purchases to what they can afford, not the level they want, or even the level they need.
So, is it really affordable housing if tenants cannot afford the utilities?

“But that’s not what I came to talk with you about today.” (apologies to Arlo Guthrie)

Co-Benefits
• What do you care about?
• Used to be called “non-energy benefits,” but if these are the benefits you care about, why define them as the opposite of a benefit you care less about?
• We don’t refer to nutrition and health as food’s “non-taste benefits.”

Talk About Efficiency’s Co-Benefits

Co-Benefits of Residential Energy Efficiency
• Better Health and Comfort• Increased Property Value• Increased Net Monthly Income
– Lower Maintenance Costs– Lower Vacancy Rates– Less Frequent Turnover
• Neighborhood Economics• Better Scoring for Competitive LIHTCs


Health and Comfort• Harvard study – insulating 46M existing U.S.
homes to the 2000 IECC level would result in:– 240 fewer pre-mature deaths/year– 6500 fewer significant asthma attacks/year– 110,000 fewer lost work/school days/year

Health and Comfort
• Value of health impacts alone from fixing an inefficient home has a 15 year payback, just looking at reduced cold, moisture, and mental stress. [i.e., not even counting AC!] (U.K. study)
Cold Moisture Bill Stress TotalDirect Health Costs 31.8 7.9 25.7 65.4Cost of Lost Work 16.9 0.06 0.2 17.16Health System Costs 10.2 1.5 0.9 12.6
Total 58.9 9.46 26.8 95.16Contribution % 62% 10% 28% 100%
Value of Reduced… (Brit. Pounds )Loss Category

Health and Comfort (cont.)• There are more deaths every year from
heat waves than all other weather related events combined.– 750 in one week (Chicago 1995)– 15,000 in France (2003)
• “A 77-year-old man whose air conditioning unit was blowing hot air was found dead in his Central Valley home… the air conditioner in the room was blowing out air that was more than 100 degrees…” (2013)
Health and Comfort (cont.)
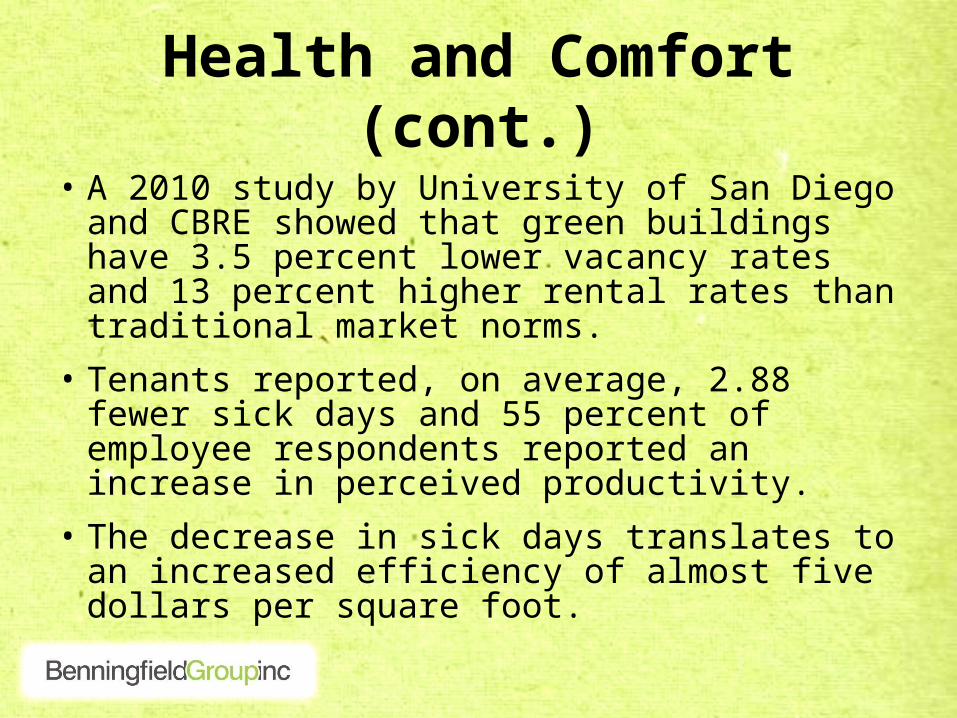
• A 2010 study by University of San Diego and CBRE showed that green buildings have 3.5 percent lower vacancy rates and 13 percent higher rental rates than traditional market norms.
• Tenants reported, on average, 2.88 fewer sick days and 55 percent of employee respondents reported an increase in perceived productivity.
• The decrease in sick days translates to an increased efficiency of almost five dollars per square foot.

Vacancy & Turnover
• CBRE study of commercial space in S.D. in 2012 showed a 25% lower vacancy rate for LEED buildings.
• Energy Trust of Oregon case study: upgrade of heating and DHW in Celio Apartments resulted in reduced turnover and increased tenant satisfaction. [http://energytrust.org/library/case-studies/CS_Multifamily.pdf]

Vacancy & Turnover
• …But if your tenants do leave, there is a way to keep up with them…
• The “new” mobile home

Maintenance Savings• Lighting:
– Incandescent and halogen lights = 1,000 hours (8 hours/day for 125 days)
– Fluorescent lights = 10,000 hours (8 hours/day for 1,250 days)
– LED lights = 40,000 hours (8 hours/day for 5,000 days)
• EE buildings produce less strain on HVAC equipment – reducing maintenance costs [example: cool roofs reduce AC run time]

Maintenance Savings
• One of the most energy efficient options is building monitoring and control– Early feedback preventing catastrophic failures
– Reduces run time for most equipment and lighting
– Helps maintenance staff pinpoint equipment that needs attention, saving diagnostic time

Property Value• ICF studies indicate that energy efficiency
measures that reduce annual household energy costs by $1, result in $10-$25 in increased property value.
• By using the CUAC, owners can increaseability to service debtand qualify for larger loans or better terms.

Property Value
• Adding energy efficient features in isolation, does not by itself add property value.[note the NFRC label on the boarded up window!]

Owners’ Utility Costs
• Energy efficiency savings all accrue to the owner in master-metered buildings.
• Savings from energy efficiency in common area energy use (such as CDHW, lighting, or boilers/chillers) also all accrue to the owner.

Community Economic BenefitsSummary
• Nearly 4/5 of $1 ($0.78) spent on utilities leaves the local community.
• $0.75 of $1 that a household spends on everything else, STAYS in the local community.
• Due to the Multiplier Effect, energy efficiency that saves fifty households just $10/mo. each, results in $17,340 of local economic activity every year!

Energy Efficiency is TRUE Community Development
• The following four slides provide the details behind the summary.

Multiplier Effect
• Spend a dollar on a haircut, and the barber spends about $0.75 of that in the local community. Spent at:– Hardware store– Dinner out– Daycare– Groceries– Etc.
• Spend a dollar on energy, and only $0.28 stays in the local community.
33
34
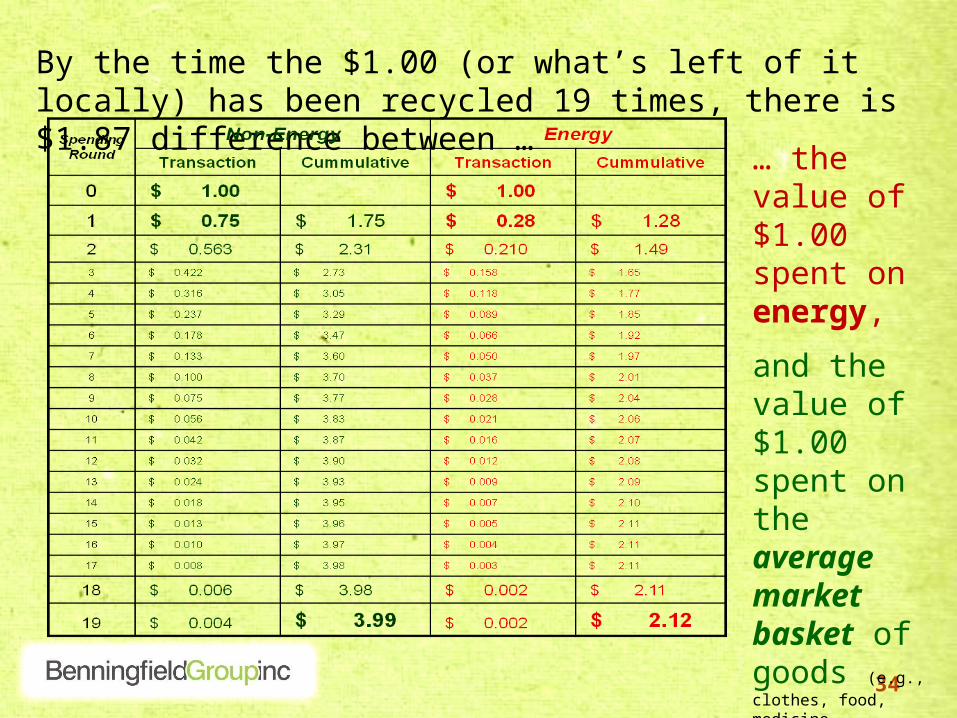
By the time the $1.00 (or what’s left of it locally) has been recycled 19 times, there is $1.87 difference between …
… the value of $1.00 spent on energy,
and the value of $1.00 spent on the average market basket of goods (e.g., clothes, food, medicine, haircuts, daycare).

Value to the Community
• $25,000 invested in energy efficiency in a multifamily building will save its tenants $5,000 to $25,000 per year in energy costs (retrofit vs. new construction).
• 1 to 5 year payback.
• Multiplier effect: additional $9,300 - $46,750 benefit to the community.
• 6 ½ month to 2.7 year payback.– …with accumulating benefits every year thereafter!
35

Community Economic Activity Increase
• Within the range of $5,000 to $25,000 of energy cost savings from a $25,000 investment in multifamily energy efficiency, if we assume just $10,000/year savings…
Annual Svgs MultiplierCommunity Economic
Activity$10,000 3.99 $39,900$10,000 2.12 $21,200
$18,700Annual Economic Value

Remember that $36 Billion Number?
36,000,000,000$ 5,400,000,000$
21,546,000,000$ 11,448,000,000$ 10,098,000,000$
Annual MF Energy Costs15% Savings3.99 Multiplier2.12 Multiplier
Community Development Value

Reduced Risk of Climate Change

So, How Do You Get There?
• Confused?
• Not sure where to go for design assistance?
• Not sure how to get there?
• Not sure where “there” is?

40
The Utilities Provide Assistance See TRC to learn about some helpful programs.
Energy Upgrade California San Diego Multifamily Program
Multifamily Energy Efficiency Rebate (MFEER) Program For individual units or systems Incentives on per-sq.ft., per fixture, or per equipment unit basis
Whole Building Programs For comprehensive renovations Incentives tied to percent improvement

41
…because we all need a smile now and then…

Thank you for your attention.
Nehemiah StonePrincipal
Benningfield Group Inc.
(916) 221-3110 ext 11