energy management regulation & esco industry update in japan · energy management regulation...
TRANSCRIPT

Energy Management Regulation &
ESCO Industry Update
In Japan
19 November, 2015
Tetsuya MAEKAWA (M.Sc.)
International Affairs Committee
Japan Association of Energy Service Companies
(JAESCO)
EMAK Workshop, Moscow
1
Contents
1. Country Energy Status 1-1 Supply Side
1-2 Global warming Issue
1-3 Demand Side
2. National Policy about Energy Management 2-1 Energy Conservation Law
2-2 Energy Management Regulation Scheme
3. ESCO Industry in Japan 3-1 ESCO in brief
3-2 JAESCO Statistics
3-3 Selected Best Practice of ESCOs
4. Suggestions to Russia

0%
10%
20%
30%
40%
50%
60%
70%
80%
90%
100%
1955 1960 1965 1970 1975 1980 1985 1990 1995 2000 2005 2013
Oil Coal Natural Gas Nuclear Hydro Renewable
1st
Oil
Crisis
2nd
Oil
Crisis
46
24%
24%
0
100
200
300
400
500
600
1955 1960 1965 1970 1975 1980 1985 1990 1995 2000 2005 2013
Renewable
Hydro
Nuclear
Natural Gas
Coal
Oil
Oil
Coal
Natural Gas
Nuclear
Nuclear
1st Oil Crisis
2nd Oil Crisis
Primary Energy Supply Trend of Japan (1955-2013)
1. Country Energy Status
1-1 Supply Side
- Japan has been reducing its dependence on oil by increasing natural gas and nuclear (until March 2011).
- After Fukushima accident in 2011, natural gas compensated the gap.
2

Coal
Oil
Natural Gas
Nuclear
Hydro
Renewable
2030
25%
Primary Energy Supply - Renewable : 13-14% - Nuclear : 11-10%
3
Japan’s Self Sufficiency Transition
Nuclear
Renewable Renewable
Nuclear
- Japanese share of GHG emission is just 2.8% of the world.
- Japanese Government will declare in Paris to reduce GHG by 26% by 2030 compared to
that of 2013.
- In order to achieve it, Japanese Government decided to aim for the following percentages of
sources of energy to generate electricity, based on the reduction of electricity consumption
by 17% by 2030.
1-2 Global Warming Issue
Oil : 3% Coal : 26% Natural Gas : 27% Renewable : 22-24% Nuclear : 22-20%
Geothermal : 1.0 - 1.1% Biomass : 3.7 - 4.6 % Wind power : 1.7% Photovoltaic : 7.0 % Hydro : 8.8 – 9.2 %
Sources: “Comprehensive Energy Statistics” and “Annual Report on National Accounts.” ※Value of 2012 are preliminary.
(millions kL of crude oil equivalent)
Transportation sector
Commercial sector
Industry sector
Real GDP 19732012
2.4-times 23.1%
20.0%
42.6%
65.5%
4
Final energy
consumption
1973→2012
1.3-times
Tra
nsp
orta
tion
19732012
1.8-time
19732012
2.4-tims
Consum
er
Com
merc
ial
19732012
2.8-tims
Resid
en
tial
19732012
2.1-tims
indu
stry
19732012
0.8-tims
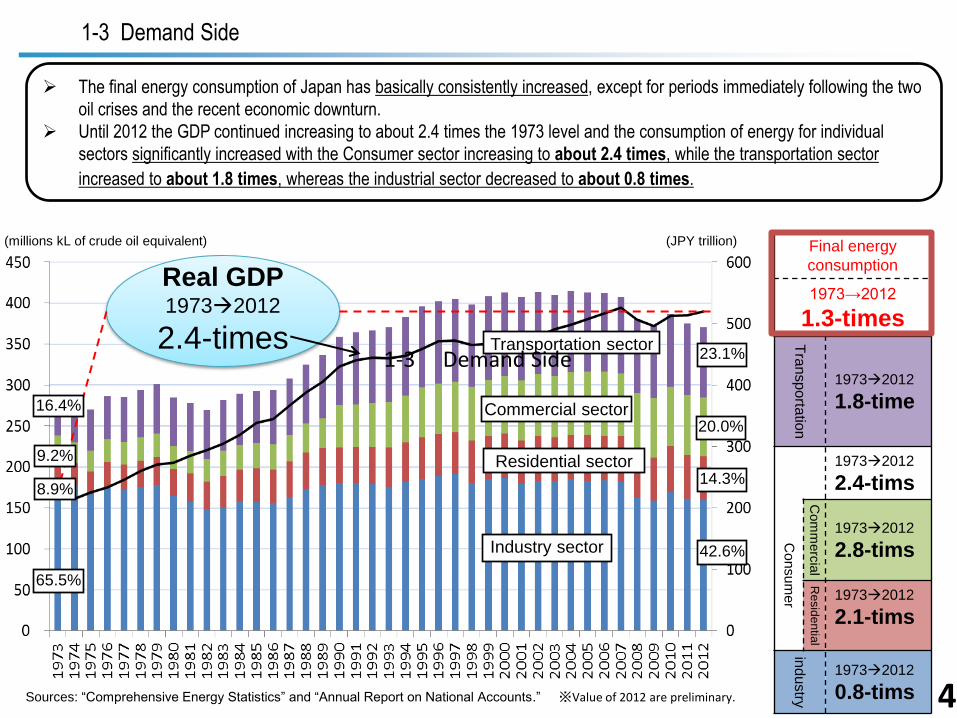
The final energy consumption of Japan has basically consistently increased, except for periods immediately following the two
oil crises and the recent economic downturn.
Until 2012 the GDP continued increasing to about 2.4 times the 1973 level and the consumption of energy for individual
sectors significantly increased with the Consumer sector increasing to about 2.4 times, while the transportation sector
increased to about 1.8 times, whereas the industrial sector decreased to about 0.8 times.
(JPY trillion)
14.3% Residential sector 9.2%
16.4%
8.9%
1-3 Demand Side
1-3 Demand Side
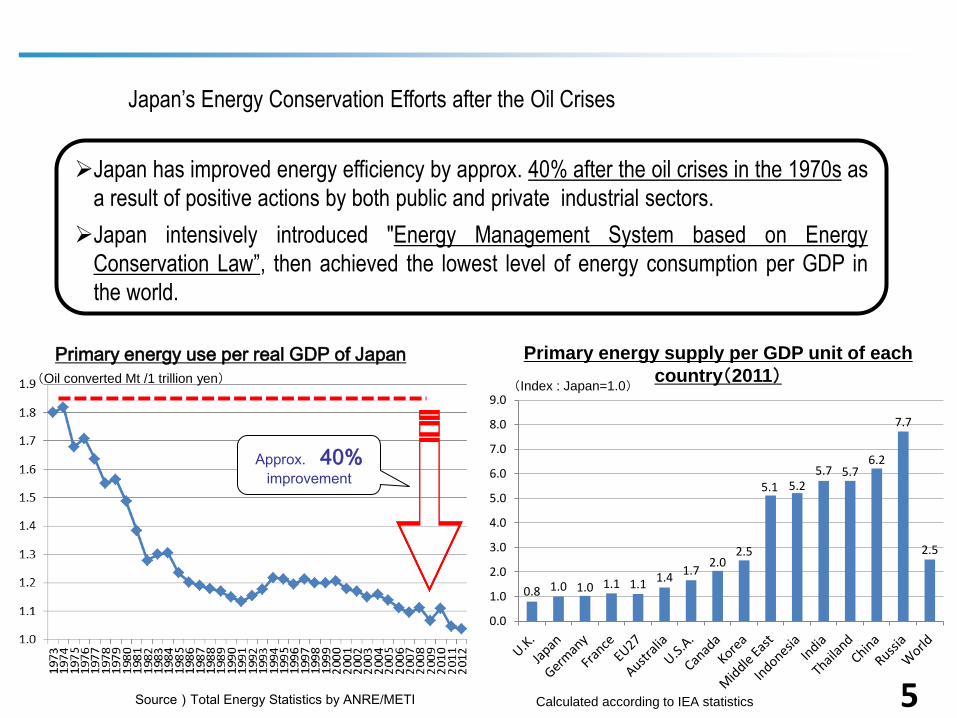
Japan has improved energy efficiency by approx. 40% after the oil crises in the 1970s as
a result of positive actions by both public and private industrial sectors.
Japan intensively introduced "Energy Management System based on Energy
Conservation Law”, then achieved the lowest level of energy consumption per GDP in
the world.
Japan’s Energy Conservation Efforts after the Oil Crises
Source)Total Energy Statistics by ANRE/METI
Primary energy use per real GDP of Japan
(Oil converted Mt /1 trillion yen)
Approx. 40% improvement
Calculated according to IEA statistics
Primary energy supply per GDP unit of each
country(2011) (Index : Japan=1.0)
0.8 1.0 1.0 1.1 1.1 1.4
1.7 2.0
2.5
5.1 5.2 5.7 5.7
6.2
7.7
2.5
0.0
1.0
2.0
3.0
4.0
5.0
6.0
7.0
8.0
9.0
5

(1) Manufacturing plants & business stablishments
(2) Transportation
(3) Residential buildings and structures
(4) Machinery and equipment
◆ Business operators with an annual energy consumption of at least 1,500kl (equivalent crude oil) at manufacturing plants and business establishments.
◆ Freight carriers with a transportation capacity of a minimum certain scale, such as 200 trucks or 300 railway cars for railroads, etc.
◆ Cargo owners with an annual freight transport order of at least 30 million tons .
◆ Structures on a large scale with a total floor areas of at least 2000m2.
◆ Small to mid size structures with a total floor area of at least 300m2.
◆ Business operators who build and sell residential buildings (annually supplying at least 150 units).
◆ Passenger cars, air conditioners, television sets, etc., 29 items.
(Comprises about 70% of household energy consumption.)
6
2-1 Energy Conservation Law
“Energy Conservation Law” was introduced in 1979 .
The Law covers industry, commercial & residential and transportation sectors.
2. National Policy about Energy Management

Manufacturing plants & business locations
Obligation for business operators to make an effort and public disclosure of judgment standards
○ Specified business operators and specified
chain business operators
(Energy consumption of 1,500kl per year)
・ Obligation to appoint Energy Managers, etc.
・ Obligation to periodically report on energy
consumption status.
・ Obligation to submit medium and long term
plans.
・ Reduction efforts of 1% per year
Transportation
Obligation for business operators to make an effort and public disclosure of judgment standards
○ Specified carriers (freight and passengers) (Fleet of vehicles: At least 200 trucks or at least
300 railway cars for railroads, etc.) ・ Obligation to submit medium and long term
plans. ・ Obligation to periodically report energy
consumption status. ・ Reduction efforts of 1% per year ○ Specified consigners (Annual transport volume of at least 30 million ton-
km.) ・ Obligation to submit plans. ・ Obligation to periodically report consumption of
energy related to consigned transportation.
Provisions relating to machinery and equipment
Obligation for manufacturers and import business operators of energy consuming equipment to make an effort
Top Runner Standards (29 units)
・ Standards for energy conservation of passenger cars, air conditioners, television sets, etc. To exceed the performance of most superior products that have been commercialized at the present time is required of each type of unit.
Obligation to make effort in providing information to general consumers
・ Provision of information on energy conservation (annual electric power consumption, fuel economy, etc.) that is easy to understand at storefronts of retailers who sell household electrical appliances, etc.
・ Popularization of energy conserving equipment and the provision of information, etc., by electric power and gas companies.
Provision of information
Residential buildings and structures
Obligation for construction clients and owners to make an effort and public disclosure of judgment standards
○ Specified buildings
(Total floor area of at least 300m2.)
・ Obligations relating to the submission of notifications pertaining to energy conserving measures implemented by construction clients in relation to large scale modifications and obligations relating to reporting the status of overall maintenance.
○ Housing providers
(Annual supply of at least 150 units.)
・ Obligation to observe targets for improving energy conservation performance of supplied ready built residential housing.
Detailed regulations of Energy Conservation Law
7
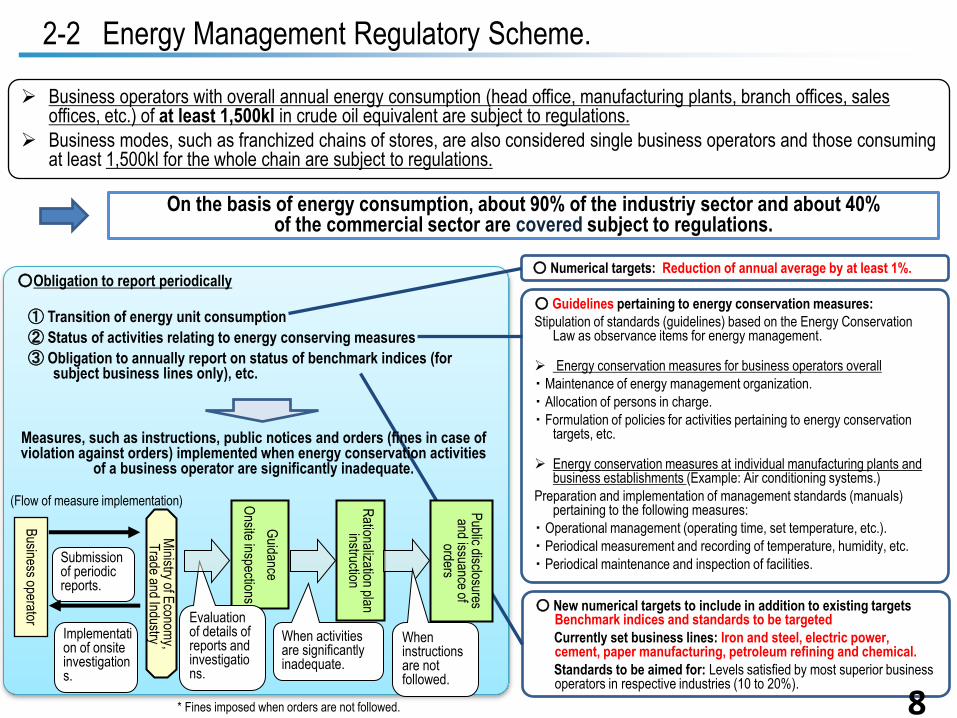
○Obligation to report periodically
① Transition of energy unit consumption
② Status of activities relating to energy conserving measures
③ Obligation to annually report on status of benchmark indices (for subject business lines only), etc.
(Flow of measure implementation)
Business operator
Submission of periodic reports.
Implementation of onsite investigations.
Ministry of E
conomy,
Trade and Industry
Rationalization plan
instruction
Guidance
Onsite inspections
Evaluation of details of reports and investigations.
When activities are significantly inadequate.
When instructions are not followed.
* Fines imposed when orders are not followed.
○ Guidelines pertaining to energy conservation measures:
Stipulation of standards (guidelines) based on the Energy Conservation Law as observance items for energy management.
Energy conservation measures for business operators overall
・ Maintenance of energy management organization.
・ Allocation of persons in charge.
・ Formulation of policies for activities pertaining to energy conservation targets, etc.
Energy conservation measures at individual manufacturing plants and business establishments (Example: Air conditioning systems.)
Preparation and implementation of management standards (manuals) pertaining to the following measures:
・ Operational management (operating time, set temperature, etc.).
・ Periodical measurement and recording of temperature, humidity, etc.
・ Periodical maintenance and inspection of facilities.
On the basis of energy consumption, about 90% of the industriy sector and about 40% of the commercial sector are covered subject to regulations.
○ New numerical targets to include in addition to existing targets Benchmark indices and standards to be targeted
Currently set business lines: Iron and steel, electric power, cement, paper manufacturing, petroleum refining and chemical.
Standards to be aimed for: Levels satisfied by most superior business operators in respective industries (10 to 20%).
○ Numerical targets: Reduction of annual average by at least 1%.
2-2 Energy Management Regulatory Scheme.
Business operators with overall annual energy consumption (head office, manufacturing plants, branch offices, sales offices, etc.) of at least 1,500kl in crude oil equivalent are subject to regulations.
Business modes, such as franchized chains of stores, are also considered single business operators and those consuming at least 1,500kl for the whole chain are subject to regulations.
Public disclosures and issuance of
orders
Measures, such as instructions, public notices and orders (fines in case of violation against orders) implemented when energy conservation activities
of a business operator are significantly inadequate.
8

Qualification of Type2 Energy Manager
Qualification of Type1 Energy Manager
“Type 1 & 2 Designated Energy Management Factories” are obliged to appoint Following number of “Type 1 Energy Managers” or “Type 2 Energy Managers” depending on the industrial category and annual energy consumption
Type 1 & 2 Energy Manager play a central role to promote energy management in Type 1 & 2 Designated Management Factories
100,000kl or more
Annual energy consumption
50,000kl or more
20,000kl or more
3,000kl or more
1,500kl or more
Less than 1,500kl -
2 person
Type1 Energy Manager
Person who has a Qualified Energy Manager’s License
Person who has a Qualified Energy Manager’s License
Person who has completed Energy Management Seminar
Typ
e 1
EM
Fac
tory
O
ther
s
Other manufacturing, Mining
Coke manufacturing, electricity, gas
and heat supply
Head office/office bldg. of the left listed industries All industries other than those listed at left
Energy Manager Ty
pe
2
EM F
acto
ry
1 person
1person
2 person
3 person
4 person
Type1 Energy Manager
Type2 Energy Manager
1 person
1 person Type2 Energy Manager
9

ESCO service fee
Energy Costs
with
ESCO service
Performance guarantee
Customer’s
profit
Energy Costs
Before
ESCO service
Reduction of Energy Costs
There are two major characteristics of ESCOs.
・ Guarantees Energy
Efficiency Performance
(Performance Contract)
・Investment cost is
provided by ESCOs and
service fee is covered
from the savings of
energy cost
(Pay from the Savings)
3. ESCO Industry in Japan
10
3-1 ESCO in brief

Conventional Renovation ESCO service
Saved Energy Cost
〔yen/year〕
Xn years of contract
ESCO service fee
〔yen/year 〕
Saved Energy Costs
〔 yen/year 〕
Renovation Costs
〔 yen〕
Payback years of Xm
For the same amount of energy savings -------
merit
investment
11

Background - Deregulation of Energy Market
- Global Environmental Issue
History of ESCO Industry
1996 – Concept was Imported from US
1997 – First ESCO Company in Japan was established
1999 – JAESCO was established
12
History of Japanese ESCO Industry

Background of Active ESCOs in JAPAN
Electric Power Companies Gas Companies - Japan Facility Solutions, Inc.
- Kanden Energy Solution, Inc.
- C Energy Co. Ltd
-Tokyo Gas Engineering Solutions Corporation - Creative Techno Solution Co.,Ltd
Manufactures - Azbil Corp. - Takasago Thermal Engineering Co.,Ltd
Constructors
- The First ESCO, Ltd. - Mitsubishi UFJ Lease & Finance Company
- Hitachi, Inc. - Gunze Engineering Co.,Ltd
Leasing Companies Others
- Nippon Koei Co. ,Ltd.
13
- Miura Co., Ltd.

Governmental policies to promote ESCO
(3)MLIT
May 2011 : revision of manual for public buildings to introduce ESCOs
(1) METI
April 2007 : published “Manual for local governments to introduce ESCO”.
April 2010 : revision of the energy conservation law and its ordinance.
“large energy consumers must consider the performance contract
provided by ESCOs in order to improve energy efficiency.”
April 2014 : revision of the ordinance of energy conservation law
“ large energy consumers must consider to introduce services of
BEMS Aggregators and/or ESCOs to improve load leveling
performance.”
(2)MOE
December 2007 : law for procurement of environmentally conscious products
“ Government and public organizations must consider to
procure ESCO services for their buildings and facilities.”
14

Recent Trend (1)
- Downsizing of ESCO Market
Left Markets are : (1) Central Governmental Buildings
(2) Major Real Estate Companies
(3) Factory Buildings & Industrial Processes
where in-house engineers are bright & tough.
- Subsidy from the Government ?
- Privileged Subsidy only for ESCO Projects has been abolished .
- Subsidy for Energy Efficiency Projects still exist with tough competition.
- A few Local Governments keeps ESCO Procurement More than 200 Projects has been procured since 1997
15

Recent Trend (2)
- New Governmental Procurement Law
for better Environment (2007 + 2012rev.) (1) Adopted for Electricity, Car, Building, ESCO
(2) Public Buildings are encouraged to procure ESCO Services
(3) Contract Year can be extended to 10 for ESCO Services
(other Governmental contracts are 1 year in principle)
BUT, no procurement of ESCO by the central Government so far.
- ECCJ (Energy Conservation Center of Japan) and some local
Governments provide free energy audit services Both sides of effects for ESCOs.
16

- Number of Member Companies: 80
- Established in 1999
- Roles of JAESCO - Policy related lobbying activities
- PR and marketing of the ESCO concept
- Training the staff of member companies
- Information exchange between members
- International cooperation
- Others including publishing a book of ESCO
17
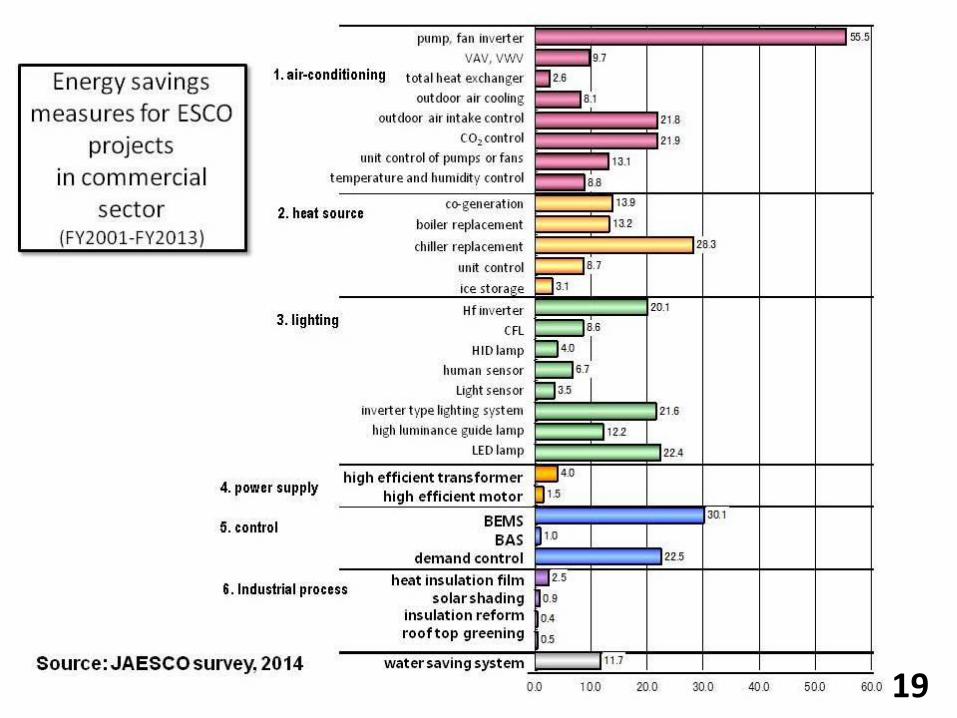
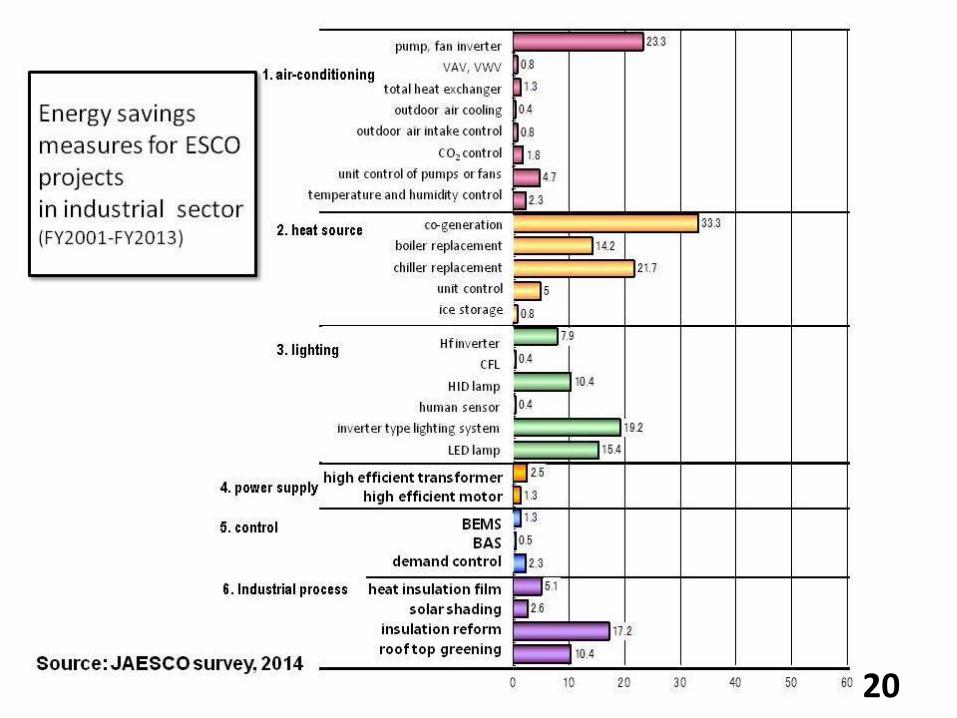
3-2 JAESCO Statistics
(1) JAESCO has been collecting data from
member companies about their
business performance of ESCO
services since 1998.
(2) The data is fluctuating, maybe because
of economic situation of Japanese
economy, power supply conditions and
so forth.
(3) In addition, nowadays, non-member
companies of JAESCO conduct ESCO
services, which are not taken into
account.
(4) Please have a look at the following
slides with these situation in your mind.
Market Data of Japanese ESCO Industry

Trend of ESCO Market Size in Japan
10 18 29 38 27 3652 37
6843
69
2446 55
27 121
7
35
112
317
119
266
151 216
78
6341
97
59
148
29
7
163
148
217
7048
47
0
50
100
150
200
250
300
350
400
450
1998 1999 2000 2001 2002 2003 2004 2005 2006 2007 2008 2009 2010 2011 2012 2013
(億円)
(年度)
1019
36
73
140
353
172
303
278
406
176
94
250
300
122
299
その他(ESP、オンサイト発電など)シェアード・セイビングズ契約ギャランティード・セイビングス契約
(4)
(9)
(2)
(8)
( ):更新
others(ESP, on-site generation )
shared savings contract
guaranteed contract ( ) : renovation (billion
yen) 45
40
35
30
25
20
15
10
5
0
Source: JAESCO survey, 2014 18
19
20
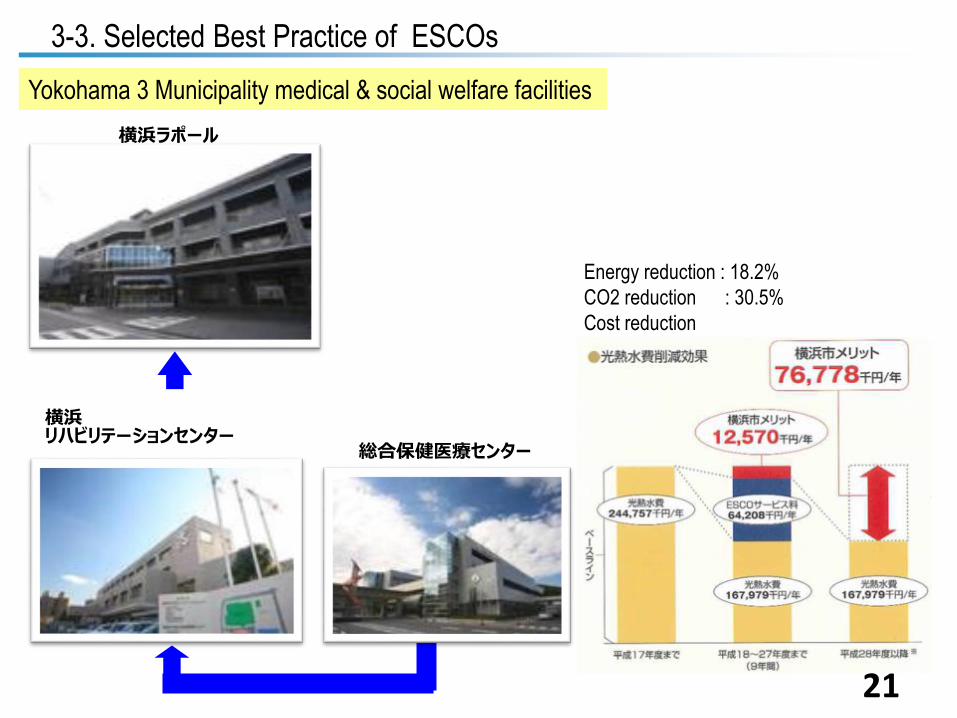
横浜 リハビリテーションセンター
横浜ラポール
総合保健医療センター
Energy reduction : 18.2%
CO2 reduction : 30.5%
Cost reduction
21
Yokohama 3 Municipality medical & social welfare facilities
3-3. Selected Best Practice of ESCOs
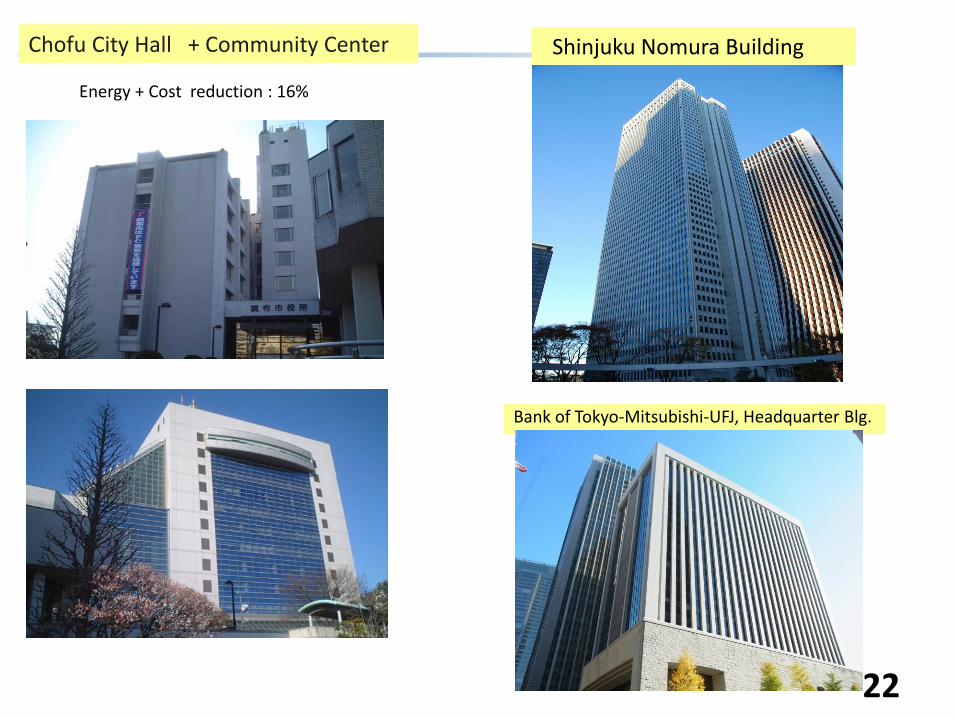
Chofu City Hall + Community Center
Energy + Cost reduction : 16%
22
Bank of Tokyo-Mitsubishi-UFJ, Headquarter Blg.
Shinjuku Nomura Building

15 Buildings in Edogawa Ward
Facility Name m2
1 General Culture Center 16,496
2 Hotel Seaside Edogawa 5,564
3 Edogawa City Office 15,774
4 Sports Center 10,230
5 Sports Land 6,169
6 General Gymnasium 5,257
7 Central Library 8,452
8 Nishi-Kasai Library 2,342
Facility Name m2
9 Koiwa Urban Plaza 7,538
10 Edogawa Community Center 9,465
11 Komatsugawa Community Facility 5,234
12 Kasai Community Center 4,927
13 Tobu Friend Hall 6,080
14 Koiwa Community Center 3,685
15 Shinseicho Community Center 2,899
Total 110,112
Energy + Cost reduction : 11%
23
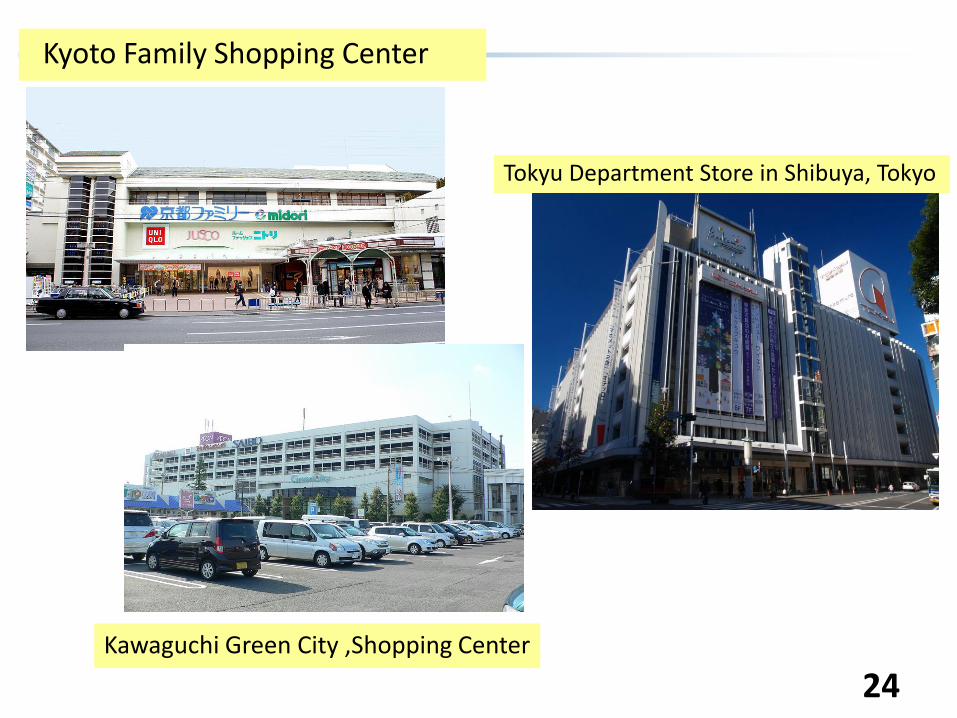
Kyoto Family Shopping Center
24 Kawaguchi Green City ,Shopping Center
Tokyu Department Store in Shibuya, Tokyo

Meiji Pharmaceutical University
25 Tohoku Historical Museum
Tokyo Metropolitan Hiroo Hospital
Energy + Cost reduction : 24%
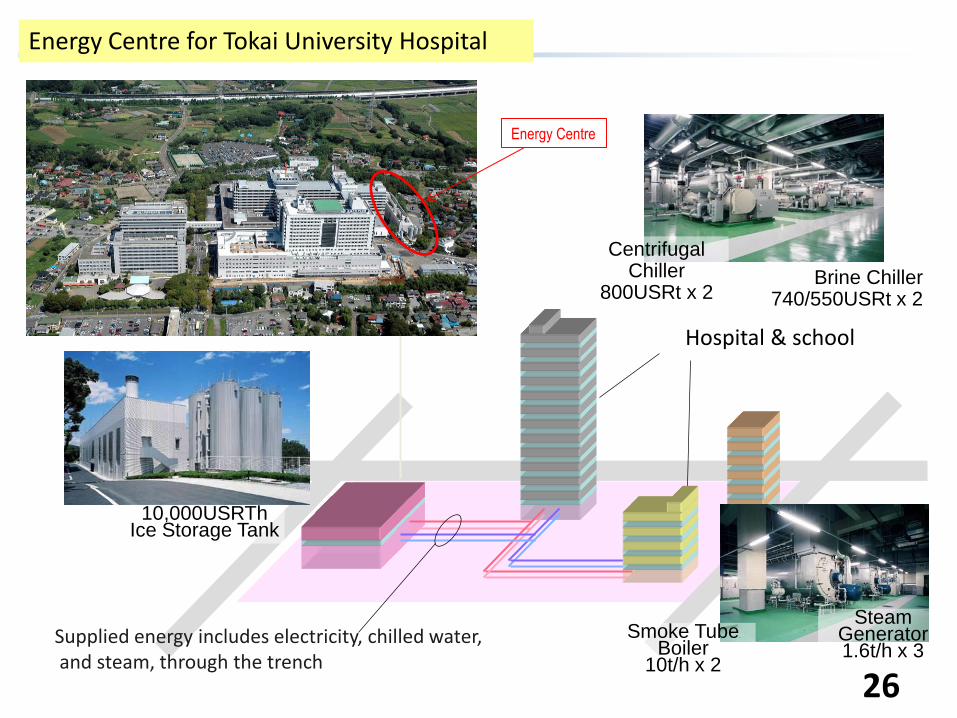
Supplied energy includes electricity, chilled water, and steam, through the trench
Hospital & school
26
10,000USRTh Ice Storage Tank
Brine Chiller 740/550USRt x 2
Centrifugal Chiller
800USRt x 2
Smoke Tube Boiler
10t/h x 2
Steam Generator 1.6t/h x 3
Energy Centre for Tokai University Hospital
Energy Centre

27
4. Suggestions to Russia
For Energy Uses
CEO and
Head of Factory
- Pay more attention to
energy consumption of their
facilities.
- Discuss with person in
charge of energy once a
month
Persons in
charge of energy
on site
- Recognize that they need
measurement to control the
facilities.
- Compare the energy data
with other sites.
- Disclose the energy
consumption data to
employees on site every
month with comparisons.
others
For Policy Makers and Regulators
To introduce
Regulations
- Report to the governments
- Official appointment of
persons in charge of
energy on site
To provide
Incentives
- Subsidy
- Awards
To grow
private EE
industry
- Give chances by utilizing
Governmental facilities.
- Establish Association
- Publish guidebooks
- Provide benchmarking data
- Encourage students
To learn from
other countries
EMAK is a good chance!
others

28
Thank you for your attention.
Tetsuya MAEKAWA (M.Sc) [email protected]
Adviser Energy Solutions Dept., NIPPON KOEI Co.,Ltd Deputy Head International Affairs Committee, Japan Association of Energy Service Companies (JAESCO)