energy management of manned boost-glide vehicles: a historical
TRANSCRIPT

NASA/TP-2004-212037
Energy Management of Manned Boost-Glide Vehicles: A Historical Perspective
Richard E. DayNASA Dryden Flight Research CenterEdwards, California
May 2004

The NASA STI Program Office…in Profile
Since its founding, NASA has been dedicatedto the advancement of aeronautics and space science. The NASA Scientific and Technical Information (STI) Program Office plays a keypart in helping NASA maintain thisimportant role.
The NASA STI Program Office is operated byLangley Research Center, the lead center forNASA’s scientific and technical information.The NASA STI Program Office provides access to the NASA STI Database, the largest collectionof aeronautical and space science STI in theworld. The Program Office is also NASA’s institutional mechanism for disseminating theresults of its research and development activities. These results are published by NASA in theNASA STI Report Series, which includes the following report types:
• TECHNICAL PUBLICATION. Reports of completed research or a major significantphase of research that present the results of NASA programs and include extensive dataor theoretical analysis. Includes compilations of significant scientific and technical data and information deemed to be of continuing reference value. NASA’s counterpart of peer-reviewed formal professional papers but has less stringent limitations on manuscriptlength and extent of graphic presentations.
• TECHNICAL MEMORANDUM. Scientificand technical findings that are preliminary orof specialized interest, e.g., quick releasereports, working papers, and bibliographiesthat contain minimal annotation. Does notcontain extensive analysis.
• CONTRACTOR REPORT. Scientific and technical findings by NASA-sponsored contractors and grantees.
• CONFERENCE PUBLICATION. Collected papers from scientific andtechnical conferences, symposia, seminars,or other meetings sponsored or cosponsoredby NASA.
• SPECIAL PUBLICATION. Scientific,technical, or historical information fromNASA programs, projects, and missions,often concerned with subjects havingsubstantial public interest.
• TECHNICAL TRANSLATION. English- language translations of foreign scientific and technical material pertinent toNASA’s mission.
Specialized services that complement the STIProgram Office’s diverse offerings include creating custom thesauri, building customizeddatabases, organizing and publishing researchresults…even providing videos.
For more information about the NASA STIProgram Office, see the following:
• Access the NASA STI Program Home Pageat
http://www.sti.nasa.gov
• E-mail your question via the Internet to [email protected]
• Fax your question to the NASA Access HelpDesk at (301) 621-0134
• Telephone the NASA Access Help Desk at(301) 621-0390
• Write to:NASA Access Help DeskNASA Center for AeroSpace Information7121 Standard DriveHanover, MD 21076-1320

NASA/TP-2004-212037
Energy Management of Manned Boost-Glide Vehicles: A Historical Perspective
Richard E. DayNASA Dryden Flight Research CenterEdwards, California
May 2004
National Aeronautics andSpace Administration
Dryden Flight Research CenterEdwards, California 93523-0273

NOTICE
Use of trade names or names of manufacturers in this document does not constitute an official endorsementof such products or manufacturers, either expressed or implied, by the National Aeronautics andSpace Administration.
Available from the following:
NASA Center for AeroSpace Information (CASI) National Technical Information Service (NTIS)7121 Standard Drive 5285 Port Royal RoadHanover, MD 21076-1320 Springfield, VA 22161-2171(301) 621-0390 (703) 487-4650

iii
CONTENTS
Page
PREFACE. . . . . . . . . . . . . . . . . . . . . . . . . . . . . . . . . . . . . . . . . . . . . . . . . . . . . . . . . . . . . . . . . vii
ACKNOWLEDGMENTS . . . . . . . . . . . . . . . . . . . . . . . . . . . . . . . . . . . . . . . . . . . . . . . . . . . . viii
ABSTRACT . . . . . . . . . . . . . . . . . . . . . . . . . . . . . . . . . . . . . . . . . . . . . . . . . . . . . . . . . . . . . . . . 1
NOMENCLATURE . . . . . . . . . . . . . . . . . . . . . . . . . . . . . . . . . . . . . . . . . . . . . . . . . . . . . . . . . . 1Acronyms . . . . . . . . . . . . . . . . . . . . . . . . . . . . . . . . . . . . . . . . . . . . . . . . . . . . . . . . . . . . . 1Symbols . . . . . . . . . . . . . . . . . . . . . . . . . . . . . . . . . . . . . . . . . . . . . . . . . . . . . . . . . . . . . . . 2
INTRODUCTION . . . . . . . . . . . . . . . . . . . . . . . . . . . . . . . . . . . . . . . . . . . . . . . . . . . . . . . . . . . 3Energy Management and Footprints . . . . . . . . . . . . . . . . . . . . . . . . . . . . . . . . . . . . . . . . . 4The Development of Energy Management . . . . . . . . . . . . . . . . . . . . . . . . . . . . . . . . . . . . 6
CHAPTER 1.FIRSTS EARLY BOOST GLIDE VEHICLES: A BRIEF HISTORY OF MANNED ROCKET PROPELLED AIRCRAFT . . . . . . . . . . . . . . . . . . . . . . . . . . . . . . . . . . . . . . . . . . . 7
Prewar Era . . . . . . . . . . . . . . . . . . . . . . . . . . . . . . . . . . . . . . . . . . . . . . . . . . . . . . . . . . . . . 7War Era . . . . . . . . . . . . . . . . . . . . . . . . . . . . . . . . . . . . . . . . . . . . . . . . . . . . . . . . . . . . . . . 7Postwar Era . . . . . . . . . . . . . . . . . . . . . . . . . . . . . . . . . . . . . . . . . . . . . . . . . . . . . . . . . . . . 8
CHAPTER 2.XLR 11 ROCKET POWERED AIRCRAFT . . . . . . . . . . . . . . . . . . . . . . . . . . . . . . . . . . . . . . 10
Birth of Manned Rocket Research Airplanes: 1946 to 1975 . . . . . . . . . . . . . . . . . . . . . . 10Operations and Performance of XLR-11 Powered Aircraft . . . . . . . . . . . . . . . . . . . . . . . 11The X-1E Early Development of Energy Management. . . . . . . . . . . . . . . . . . . . . . . . . . 11XLR-11 Contributions to Boost-Glide Energy Management . . . . . . . . . . . . . . . . . . . . . . 14
CHAPTER 3.X 2 AIRCRAFT DELINEATES A REQUIREMENT FOR ENERGY MANAGEMENT. . . 15
Background of the X-2 Aircraft . . . . . . . . . . . . . . . . . . . . . . . . . . . . . . . . . . . . . . . . . . . . 15Operations . . . . . . . . . . . . . . . . . . . . . . . . . . . . . . . . . . . . . . . . . . . . . . . . . . . . . . . . . . . . . 16Scenario of the Final Flight . . . . . . . . . . . . . . . . . . . . . . . . . . . . . . . . . . . . . . . . . . . . . . . . 17Extended Range Requirements . . . . . . . . . . . . . . . . . . . . . . . . . . . . . . . . . . . . . . . . . . . . . 18
CHAPTER 4.The X 15 AIRCRAFT . . . . . . . . . . . . . . . . . . . . . . . . . . . . . . . . . . . . . . . . . . . . . . . . . . . . . . . 19
Foundations for Space Operations . . . . . . . . . . . . . . . . . . . . . . . . . . . . . . . . . . . . . . . . . . 19Background . . . . . . . . . . . . . . . . . . . . . . . . . . . . . . . . . . . . . . . . . . . . . . . . . . . . . . . 19XLR-11 Interim Engine Operations . . . . . . . . . . . . . . . . . . . . . . . . . . . . . . . . . . . . . 19The XLR-99 Engine . . . . . . . . . . . . . . . . . . . . . . . . . . . . . . . . . . . . . . . . . . . . . . . . . 20The X-15 Six-Degree-of-Freedom Simulator . . . . . . . . . . . . . . . . . . . . . . . . . . . . . 22Simulator Flight Planning for the X-15 Aircraft . . . . . . . . . . . . . . . . . . . . . . . . . . . 24
–– ––
–
–
–
–

iv
Geocentric Effects . . . . . . . . . . . . . . . . . . . . . . . . . . . . . . . . . . . . . . . . . . . . . . . . . . . . . . . 25Lift to Drag Ratio Spectrum . . . . . . . . . . . . . . . . . . . . . . . . . . . . . . . . . . . . . . . . . . . . . . . 26Development of Low Lift-to-Drag Ratio Operational Techniques and Position Locators 28
Ground Simulations . . . . . . . . . . . . . . . . . . . . . . . . . . . . . . . . . . . . . . . . . . . . . . . . . 28The X-15 Aircraft High Key and Low Key Locators . . . . . . . . . . . . . . . . . . . . . . . 28
High key . . . . . . . . . . . . . . . . . . . . . . . . . . . . . . . . . . . . . . . . . . . . . . . . . . . . 28Low key . . . . . . . . . . . . . . . . . . . . . . . . . . . . . . . . . . . . . . . . . . . . . . . . . . . . 28
Early Analog Simulations . . . . . . . . . . . . . . . . . . . . . . . . . . . . . . . . . . . . . . . . . . . . 29Studies Prior to First Flight of the X-15 Aircraft Analog and Flight Simulations . 29Early X-15 Operations . . . . . . . . . . . . . . . . . . . . . . . . . . . . . . . . . . . . . . . . . . . . . . . 33
First thirty flights: Refinement of high and low key positions . . . . . . . . . . 33Later operations: After first thirty flights, increased energy requires
greater tolerances. . . . . . . . . . . . . . . . . . . . . . . . . . . . . . . . . . . . . . . . . . . . 33Maximum performance flights . . . . . . . . . . . . . . . . . . . . . . . . . . . . . . . . . . . 34
Flight Planning for the X-15 Aircraft . . . . . . . . . . . . . . . . . . . . . . . . . . . . . . . . . . . . . . . . 37Development of Energy Management Footprints for Ground Monitoring . . . . . . . . . . . . 37
Benefits of Air Launch . . . . . . . . . . . . . . . . . . . . . . . . . . . . . . . . . . . . . . . . . . . . . . . 38Anomalous Incidents Overshoots and Undershoots . . . . . . . . . . . . . . . . . . . . . . . . 40
Accomplishments of the X-15 Aircraft . . . . . . . . . . . . . . . . . . . . . . . . . . . . . . . . . . . . . . . 41
CHAPTER 5.PROJECT HIGH RANGE . . . . . . . . . . . . . . . . . . . . . . . . . . . . . . . . . . . . . . . . . . . . . . . . . . . . . 42
Development of High-Energy Boost-Glide Operations . . . . . . . . . . . . . . . . . . . . . . . . . . 42Radar Site Evaluation and Development . . . . . . . . . . . . . . . . . . . . . . . . . . . . . . . . . 44Operational Logistics . . . . . . . . . . . . . . . . . . . . . . . . . . . . . . . . . . . . . . . . . . . . . . . . 46Control Room Anecdotes . . . . . . . . . . . . . . . . . . . . . . . . . . . . . . . . . . . . . . . . . . . . . 46Selection of Launch and Intermediate Emergency Lakes . . . . . . . . . . . . . . . . . . . . 47Remote Lake Requirements . . . . . . . . . . . . . . . . . . . . . . . . . . . . . . . . . . . . . . . . . . . 47Early Dry Lake Survey . . . . . . . . . . . . . . . . . . . . . . . . . . . . . . . . . . . . . . . . . . . . . . 48Survey Conducted by the Air Force Flight Test Center and North American
Aircraft. . . . . . . . . . . . . . . . . . . . . . . . . . . . . . . . . . . . . . . . . . . . . . . . . . . . . . . . . . . 48High Range Legacy and Enduring Value . . . . . . . . . . . . . . . . . . . . . . . . . . . . . . . . . . . . . 52
CHAPTER 6.THE SPACE SHUTTLE . . . . . . . . . . . . . . . . . . . . . . . . . . . . . . . . . . . . . . . . . . . . . . . . . . . . . . 53
First Space Transportation System . . . . . . . . . . . . . . . . . . . . . . . . . . . . . . . . . . . . . . . . . . 53Background . . . . . . . . . . . . . . . . . . . . . . . . . . . . . . . . . . . . . . . . . . . . . . . . . . . . . . . 53Retro-Glide Energy Management . . . . . . . . . . . . . . . . . . . . . . . . . . . . . . . . . . . . . . 54
STS-1 First Orbital Flight Reentry and Landing at Edwards . . . . . . . . . . . . . . . . . . . . . 55
REFERENCES . . . . . . . . . . . . . . . . . . . . . . . . . . . . . . . . . . . . . . . . . . . . . . . . . . . . . . . . . . . . . 57
ABOUT THE AUTHORRichard E. Day . . . . . . . . . . . . . . . . . . . . . . . . . . . . . . . . . . . . . . . . . . . . . . . . . . . . . . . . . . . . . . 59
–
–
–

v
TABLES
1. A summary of notable manned-rocket flight firsts, by decade . . . . . . . . . . . . . . . . . . . . . . . 9
2. Research rocket aircraft powered by XLR-11 rocket engines . . . . . . . . . . . . . . . . . . . . . . . 11
3. Comparative sea-level thrust of three XLR rocket engines . . . . . . . . . . . . . . . . . . . . . . . . . 21
4. Energy values and ranges for the X-15 aircraft maximum performance flights. . . . . . . . . . 35
5. High Range dry lake launch sites selected for emergency landings during the X-15 program . 51
FIGURES
1. Rogers Dry Lake with 68 miles of lakebed runways and a 15,000-ft concrete runway . . . . . 3
2. Ground monitor display of energy management footprint of the X-15 aircraft . . . . . . . . . . . 4
3. Footprints of various vehicles. . . . . . . . . . . . . . . . . . . . . . . . . . . . . . . . . . . . . . . . . . . . . . . . . 5
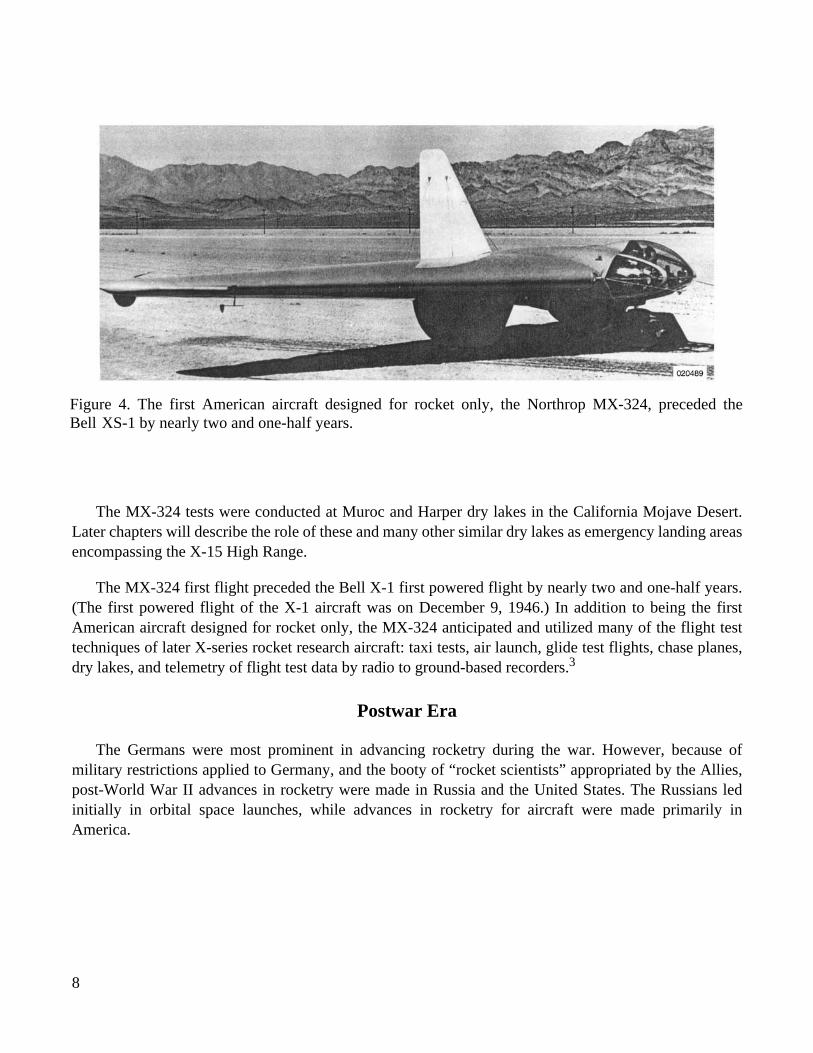
4. The first American aircraft designed for rocket only, the Northrop MX-324, preceded the Bell XS-1 by nearly two and one-half years . . . . . . . . . . . . . . . . . . . . . . . . . . . . . . . . . . 8
5. The D-558-II airplane on Rogers lakebed . . . . . . . . . . . . . . . . . . . . . . . . . . . . . . . . . . . . . . 10
6. The X-1E airplane on Rogers lakebed . . . . . . . . . . . . . . . . . . . . . . . . . . . . . . . . . . . . . . . . . 12
7. Typical X-1E landing pattern . . . . . . . . . . . . . . . . . . . . . . . . . . . . . . . . . . . . . . . . . . . . . . . . 12
8. Photograph of the Douglas X-3 research airplane. Considered for replacement of jet engines with two XLR-11 engines for Mach 4.2 capability, 1952 . . . . . . . . . . . . . . . . . . . 13
9. Photograph of the X-2 rocket research airplane . . . . . . . . . . . . . . . . . . . . . . . . . . . . . . . . . . 15
10. Air launch of X-2 rocket research airplane. . . . . . . . . . . . . . . . . . . . . . . . . . . . . . . . . . . . . . 16
11. The X-15 aircraft equipped with dual XLR-11 engines for interim operations prior to installation of XLR-99 engine . . . . . . . . . . . . . . . . . . . . . . . . . . . . . . . . . . . . . . . . . . . . . . . 20
12. Rear view of the X-15 aircraft with the XLR-99 engine. Also shown are the upper and lower speed brakes fully extended, the wedge shaped upper rudder and the landing skids . . . 21
13. The NAA X-15 six-degree-of-freedom simulator . . . . . . . . . . . . . . . . . . . . . . . . . . . . . . . . 23
14. Centrifugal acceleration as a function of tangential velocity . . . . . . . . . . . . . . . . . . . . . . . . 26
15. Lift-to-drag ratio spectrum of air and space vehicles. Flightpath angle, , plotted as a function of L/D for stabilized glide angles . . . . . . . . . . . . . . . . . . . . . . . . . . . . . . . . . . . . . 27
16. Flight test data of L/D as a function of lift coefficient (landing configuration) for boost-glide vehicles preceding the X-15 aircraft and wind tunnel data for the X-15 . . . . . 30
γ
vi
17. An F-104A airplane on the lakebed. Flight simulator for X-15 landing patterns. . . . . . . . . 30
18. The X-15 wind tunnel values compared to F-104A flight values of L/Ds as a function of lift coefficient in the landing configuration . . . . . . . . . . . . . . . . . . . . . . . . . . . . . . . . . . . . . 31
19. Typical high key approach with the F-104A aircraft configured to match wind tunnel values of the X-15 aircraft . . . . . . . . . . . . . . . . . . . . . . . . . . . . . . . . . . . . . . . . . . . . . . . . . . 32
20. The X-15 aircraft mission performance comparison . . . . . . . . . . . . . . . . . . . . . . . . . . . . . . 34
21. Altitude mission showing trajectory, ground range, and radar tracking station locations for the X-15 aircraft . . . . . . . . . . . . . . . . . . . . . . . . . . . . . . . . . . . . . . . . . . . . . . . 35
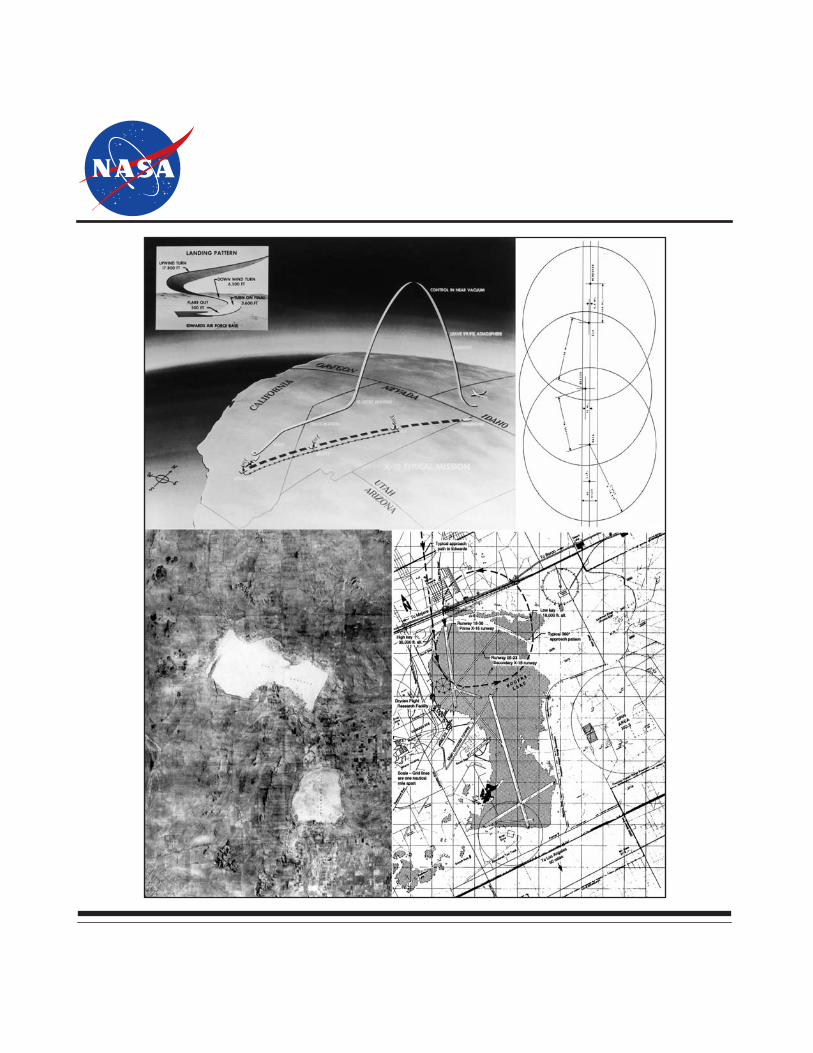
22. Typical approach pattern from remote launch site showing high key, low key, and runways for the X-15 aircraft . . . . . . . . . . . . . . . . . . . . . . . . . . . . . . . . . . . . . . . . . . . . . . . 36
23. Progression of footprint during an X-15 aircraft altitude mission . . . . . . . . . . . . . . . . . . . . 38
24. Air launch of X-15 from B-52 carrier aircraft . . . . . . . . . . . . . . . . . . . . . . . . . . . . . . . . . . . 39
25. High Range sites and information flow . . . . . . . . . . . . . . . . . . . . . . . . . . . . . . . . . . . . . . . . 43
26. Tracking station, Ely, Nevada. . . . . . . . . . . . . . . . . . . . . . . . . . . . . . . . . . . . . . . . . . . . . . . . 44
27. Overlap of radar coverage for the Ely, Beatty, Edwards radar range . . . . . . . . . . . . . . . . . . 45
28. Location of the dry lakes by longitude and latitude with symbols indicating suitability for X-15 aircraft . . . . . . . . . . . . . . . . . . . . . . . . . . . . . . . . . . . . . . . . . . . . . . . . . . . . . . . . . . 49
29. Political map of all the X-15 program lakebeds . . . . . . . . . . . . . . . . . . . . . . . . . . . . . . . . . . 50
30. Space Shuttle configuring for landing . . . . . . . . . . . . . . . . . . . . . . . . . . . . . . . . . . . . . . . . . 54
31. Pitching moment coefficient as a function of angle of attack at various Mach numbers for the Space Shuttle . . . . . . . . . . . . . . . . . . . . . . . . . . . . . . . . . . . . . . . . . . . . . . . . . . . . . . 55
32. Portion of one of the Dryden mission control rooms during first Space Shuttle landing, 1981 . . 56

vii
PREFACE
This paper is a collection of the author’s experiences working with pilots and engineers during thedecades of research flights from the early days of rocket aircraft to the present. The paper is also based oninformation from many technical reports published from the late 1940s to the present.

viii
ACKNOWLEDGMENTS
The author wishes to thank the following for their contributions to this review of the development ofenergy management techniques for manned, high-energy boost-glide vehicles.
A special thanks to Edwin J. Saltzman who came to NACA (the predecessor of NASA) in 1951 andfor 50 years has specialized in the field of aerodynamic performance, particularly lift and drag, the primecomponents in the study of boost-glide energy management. Ed’s advice, recommendations, exhaustivesearch for remote but very relevant materials, and excellent editorial comments were extremely helpful.
William H. Dana, NASA X-15 pilot and former Chief Engineer, NASA Dryden Flight ResearchCenter. Bill flew sixteen X-15 flights including the last flight, October 24, 1968. Most of these flightswere high-energy altitude flights, qualifying Bill as an excellent source of information for this paper.
Neil Armstrong, NACA/NASA experimental test pilot, flew seven X-15 flights, including the longestand most revealing of low lift-to-drag ratio (L/D) energy management boundaries. This flightdemonstrated that low L/D aircraft could handle extreme anomalies in energy management and was agreat influence in the design of the Space Shuttle. Neil’s early engineering energy management work inanalog and flight simulations contributed greatly to this paper. These accomplishments, among manyothers, provided Neil impeccable credentials for astronaut selection in 1962.
Robert Hoey, retired Air Force Flight Test Center (AFFTC) engineer, for his help in developing themethods used in boost-glide energy management, the footprints, their display and control. Bob was theAir Force X-15 project engineer counterpart to the author during the early X-15 flight planning.
Gene Matranga, retired NACA/NASA flight test engineer, for his contributions to early X-1E andX-15 energy management analysis. These efforts using analog simulations and F-104A flight simulationslaid the groundwork for future X-15 energy management techniques. His reference reports and his paperon details of the first thirty X-15 flights were substantial contributions to the current historical report.
John McTigue, retired NACA/NASA aeronautical engineer, came to the High-Speed Flight Stationin 1953. He was the original project engineer on X-15 no. 3, and was later program manager of the fiveoriginal heavyweight lifting bodies. His counsel through the years has been a contributory factor to thisreport.
Kenneth W. Iliff, Chief Scientist, NASA Dryden Flight Research Center, for pioneering a method todetermine aircraft aerodynamic characteristics to an increased degree of accuracy. Data obtained by thismethod and reported in his and other papers have been invaluable.
Robert Kempel, former AFFTC/NASA aerospace engineer. Bob, an aircraft history buff, providedresearch material for the early rocket-only aircraft.
Ryan Dibley, Dryden Flight Research Center research engineer, who has overseen the preliminaryediting and layout of
Energy Management of Manned Boost-Glide Vehicles: A Historical Perspective
.

ix
There were many engineers and pilots involved in the core studies of energy management conceptsand their development, three of whom should be acknowledged posthumously: Milton O. Thompson,NACA/NASA test pilot and aeronautical engineer, flew fourteen X-15 flights and was formerly ChiefEngineer at Dryden. The flight testing and publication of his many concepts and techniques for handlinghigh-energy, low L/D, unpowered vehicles, produced a large portion of reference materials for thisreport.
Joseph Walker, former NACA/NASA research pilot, flew rocket-powered X-series aircraft from theX-1A to the X-15. Joe became chief pilot at Dryden in 1955. He flew twenty-five X-15 flights and wasthe prime NASA pilot in the envelope expansion flights—the flights where most energy managementtechniques were developed.
Walter C. Williams, first director at the High-Speed Flight Station, intuitively understood theimportance of energy management. He approved the engineering concepts and access to property andassets required to implement energy management. Walt permitted engineers to develop theories andoperational procedures with a minimum of supervision, expediting the development of energymanagement. Walt later carried these concepts to the Manned Spacecraft Center (MSC), Houston, Texas,when he transferred as Director of Operations for Project Mercury.

ABSTRACT
As flight progressed from propellers to jets to rockets, the propulsive energy grew exponentially.With the development of rocket-only boosted vehicles, energy management of these boost-glidersbecame a distinct requirement for the unpowered return to base, alternate landing site, or water-parachutelanding, starting with the X-series rocket aircraft and terminating with the present-day Shuttle. Theproblem presented here consists of: speed (kinetic energy)—altitude (potential energy)—steep glideangles created by low lift-to-drag ratios (L/D)—distance to landing site—and the bothersome effects ofthe atmospheric characteristics varying with altitude. The primary discussion regards post-boost,stabilized glides; however, the effects of centrifugal and geopotential acceleration are discussed as well.The aircraft and spacecraft discussed here are the X-1, X-2, X-15, and the Shuttle; and to a lesser,comparative extent, Mercury, Gemini, Apollo, and lifting bodies. The footprints, landfalls, and methodsdeveloped for energy management are also described. The essential tools required for energymanagement—simulator planning, instrumentation, radar, telemetry, extended land or water range,Mission Control Center (with specialist controllers), and emergency alternate landing sites—were firstestablished through development of early concepts and were then validated by research flight tests.
NOMENCLATURE
Acronyms
AFB Air Force Base
AFFTC Air Force Flight Test Center, Edwards AFB, California
ALT (Shuttle) approach and landing tests
APU auxiliary power unit
ARS American Rocket Society (became AIAA in 1963 with IAS)
FRC Flight Research Center, Edwards, California (later NASA Dryden)
GEDA Goodyear Electronic Differential Analyzer
HSFS High-Speed Flight Station
IAS Institute of Aeronautical Sciences (became AIAA in 1963 with ARS)
JPL (NASA) Jet Propulsion Laboratory, Pasadena, California
JSC (NASA) Johnson Space Center, Houston, Texas
KSC (NASA) Kennedy Space Center, Florida
MH Minneapolis-Honeywell (now Honeywell, Inc.), Minneapolis, Minnesota
NAA North American Aviation, Downey, California
NACA National Advisory Committee for Aeronautics

2
NASA National Aeronautics and Space Administration
OMS orbital maneuvering system
RAPP Research Airplane Projects Panel
RCC reinforced carbon-carbon
RCS reaction control system
RMI Reaction Motors Incorporated, Rockaway, New Jersey
STS Space Transportation System
TAEM terminal area energy management
TPS thermal protection system
UHF ultrahigh frequency
USAF United States Air Force
XLR experimental liquid rocket
Symbols
a
c
centrifugal acceleration, ft/sec
2
a
g
geopotential acceleration, ft/sec
2
C
L
coefficient of lift
g
acceleration of Earth at mean sea level, ft/sec
2
h
altitude above surface of Earth, ft
L/D lift-to-drag ratio, dimensionless
R radius of Earth, ft
V
velocity normal to the geocentric radius, ft/sec
W/S
wing loading, lb/ft
2
α
angle of attack, deg or rad
γ
flightpath angle, deg or rad

3
INTRODUCTION
For the ancient mariner reaching a destination required setting a course by stars and the sun, spottingthe first land birds at sea, followed by a landfall leading to a harbor, and eventually a port and dock.Space navigation for boost-glide vehicles follows a similar pattern, but in a three-dimensional, moretechnically advanced series of navigational landfalls and position locators.
During a span of some five decades, from the days of Kitty Hawk to the advent of rocket-poweredresearch aircraft, a requirement for boost-glide energy management did not exist. The problem firstpresented itself at the Rogers Dry Lake testing site in California (fig. 1) when rocket-boosted researchaircraft supplied an unprecedented amount of energy, presenting the possibility of the unpowered (glide)flight overrunning a point of no return or falling short of the landing site. The constant increase in rocketpower would eventually demand a terminal area footprint larger than Rogers Dry Lake, and larger thanemergency landing lakes along the flight corridor for high-energy flights from remote launch sites.
Entries from orbit are “retro-glide” and from lunar orbit to the surface of the moon are“retro-ballistic.” Because each of these is originally boosted to reach the energy level for terminalrecovery, the title of this paper contains the generic term of “boost-glide.”
Figure 1. Rogers Dry Lake with 68 miles of lakebed runways and a 15,000-ft concrete runway.
EC98 44613-1

4
This paper discusses the maps, landmarks, navigational aids, and techniques as they apply to themany facets of energy management for high-energy, boost-glide vehicles from the late 1940s to thepresent, primarily the experimental rocket research airplanes. During this period, the essential toolsrequired for energy management—simulator planning, radar, instrumentation, telemetry, extended landor water range, a mission control center with specialist controllers, and emergency alternate landingsites — were first established through development of early concepts and were then validated by researchflight tests conducted by the NACA/NASA and the Air Force Flight Test Center (AFFTC) at EdwardsAFB, California. These tools were passed on to the Mission Control Centers of Johnson Space Center(JSC) (Houston, Texas), Jet Propulsion Laboratory (JPL) (Pasadena, California), and other future spaceorganizations.
The evolution of manned flight has been that of glider, to propeller, to jet, to rocket, and eventuallyback to glider. The boost-glide vehicles of the last half-century range from winged bodies to blunt bodieswith ever-decreasing range capabilities.
Energy Management and Footprints
The term “energy management,” as used in this paper, includes management of the total energy ofboost-glide vehicles from ground or air; from launch to landing. The boost portion determines thedownrange location, vector, and total energy at thrust termination. The unpowered portion, beginning atthrust termination for suborbital vehicles, or retrofire for reentry, commits the vehicle to a landing withinits down-range and cross-range glide capabilities; its footprint.
A “footprint” is a bounded ground or water area that outlines the perimeter of the glide capabilitiesfor the unpowered portion of a flight or mission. Figure 2 shows a ground-monitored cathode-ray tubedisplaying a map and footprint of an X-15 mission. The display shows the X-15 footprint from launch tolanding as the flight proceeds. The launch lake, contingency landing dry lakes, and destination lake(always Rogers Dry Lake, adjacent to Edwards Air Force Base) are generated graphically on acathode-ray tube. The ground features are fixed displays. The footprint grows and diminishes as theenergy does likewise. The shape of the footprint and how it is generated and utilized is discussed inChapter 4, “The X-15 Aircraft.”
1
Figure 2. Ground monitor display of energy management footprint of the X-15 aircraft.

5
Figure 3. Footprints of various vehicles.
Figure 3 shows the footprints of various space vehicles and lifting bodies.
•
Blunt bodies
Mercury, Gemini and Apollo shown from a launch abort (east of Florida). Mercurywas pure ballistic. Gemini and Apollo produced small but significant footprints by controlling thebank angle of the low L/D vector.
•
Lifting bodies
Footprints shown for lifting bodies are calculated.
•
Shuttle
Thermal problems of atmospheric reentry were solved by presenting a heat-protectedunderside to atmosphere at high angle of attack. Roll control was used to manage the footprint andprevent atmospheric skip. Lifting bodies were designed to use these same techniques.
The task of properly managing the total energy of the unpowered vehicle consists of directing it to asuitable landing within a predetermined area. The total energy is a function of the mass, velocity, andaltitude of the vehicle—the square of the velocity (kinetic energy), the three-dimensional velocity vector(direction), and altitude (potential energy). These parameters, coupled with the lift-to-drag ratio, L/D, ofthe unpowered glider determine a footprint. Centrifugal and geopotential effects were considered whenapplicable and are discussed in Chapter 4, “The X-15 Aircraft.” Second-order geodesic effects used inorbital and interplanetary trajectories were not considered.

6
The Development of Energy Management
The calculation of energy management would be pure Newtonian ballistics (as in lunar landings)except for the bothersome effects of varying atmospheric properties as altitude decreases. Mach numbereffects on lift and drag, and speed effects on heating and skip must be factored into the equation whenvectoring an unpowered craft for safe recovery.
The vehicles utilized in developing the techniques for energy management are air-launched researchaircraft equipped with the Experimental Liquid Rocket (XLR) series rocket motors: the X-1, D-558-II,X-2, and X-15.
NACA/NASA and AFFTC engineers and pilots at Edwards, California, developed many of theenergy management techniques for future high-energy boost-glide vehicles. These techniques included:
• Simulator flight planning.
• Appropriately configured aircraft for simulating boost-glide vehicles; e.g., the F-104A.
• Development of energy management locators called the “high key” and “low key.”
• Flight crew training methods.
• A range radar-communications complex and a mission control center.
• The terminal area portion of the Shuttle reentry.
• The flight simulator and training for the lunar landing.

7
CHAPTER 1
FIRSTS—EARLY BOOST–GLIDE VEHICLES: A BRIEF HISTORY OF MANNED ROCKET–PROPELLED AIRCRAFT
An abbreviated history of manned boost-glide vehicles should not neglect a chronology of first flightsof the vehicles designed for rocket flight only. These vehicles advanced in successive decades fromsolid-rocket equipped gliders to liquid-rocket military vehicles to rocket research aircraft. Although theseearly flights did not produce sufficient energy to require sophisticated energy management techniques,most—including the first—did employ an energy saving technique known as
air launch
. A more detaileddescription of the energy saving, and other advantages of air launch is provided in Chapter 4, “The X-15Aircraft.” The enormous energy of present-day space program vehicles has evolved from these initialefforts. Some of these first flights are described below.
Prewar Era
In Germany, June 11, 1928, a rocket mounted tailless glider—the
Ente
(duck), designed by AlexanderLippisch and flown by Fredrich Stamer, was the first manned flight of an aircraft designed for rocketpropulsion only. In 1929, the craft flew approximately 70 sec and traveled 4300 feet.
2,3
The solidrockets that provided the propulsion for these early aircraft were limited in both power and sustainedburning. R. H. Goddard and Eugene Sänger realized the inadequacies of powder rockets in the early1920s, but liquid-rocket engines for manned aircraft would not prove practical for some time.
War Era
From the mid-1930s to mid-1940s, the Germans, driven by military urgency, developed a series ofrocket motors that were installed in various aircraft. The first military aircraft designed for rocket flightonly, using liquid fuel, was the He-176, flown on June 20, 1939, followed by the first operational rocketaircraft, the Me-163B, in August of 1943.
2,3
The first American flight of an aircraft designed for rocket flight only was not the X-1, but theMX-324 (fig. 4), a prototype of the proposed XP-79 interceptor fighter. This flying wing was designed atWright Field, Dayton, Ohio and built by John Northrop. The aircraft was equipped with a 200-lb thrustAerojet XCAL-200 acid-aniline liquid rocket engine. On June 22, 1944, after being towed to an altitudeof approximately 8000 ft by a P-38 Lightning, the aircraft was released. After rocket ignition, the aircraftattained a maximum speed of 350 mph. The pilot, Harry Crosby, made a successful landing on HarperDry Lake without incident.
4, 5
8
The MX-324 tests were conducted at Muroc and Harper dry lakes in the California Mojave Desert.Later chapters will describe the role of these and many other similar dry lakes as emergency landing areasencompassing the X-15 High Range.
The MX-324 first flight preceded the Bell X-1 first powered flight by nearly two and one-half years.(The first powered flight of the X-1 aircraft was on December 9, 1946.) In addition to being the firstAmerican aircraft designed for rocket only, the MX-324 anticipated and utilized many of the flight testtechniques of later X-series rocket research aircraft: taxi tests, air launch, glide test flights, chase planes,dry lakes, and telemetry of flight test data by radio to ground-based recorders.
3
Postwar Era
The Germans were most prominent in advancing rocketry during the war. However, because ofmilitary restrictions applied to Germany, and the booty of “rocket scientists” appropriated by the Allies,post-World War II advances in rocketry were made in Russia and the United States. The Russians ledinitially in orbital space launches, while advances in rocketry for aircraft were made primarily inAmerica.
Figure 4. The first American aircraft designed for rocket only, the Northrop MX-324, preceded theBell XS-1 by nearly two and one-half years.

9
Summary
Table 1 provides a tabular summary of the information in Chapter 1. This table includes dates,airplanes, and places where each event occurred.
Table 1. A summary of notable manned-rocket flight firsts, by decade.
Decade Date Aircraft Place ofOrigin Comments
1920s June 1928
Ente
Germany Solid rocket mounted glider, flown by Fredrich Stamer
1930s June 1939 He-176 Germany First aircraft designed for rocket-only flight
1940s June 1944 MX-324 United States First American manned rocket-only flight.
October 1947 X-1 Breaks sonic barrier
1950s X-15 United States First manned hypersonic flight, developed boost-glide energy management, and was an innovator for Shuttle design
1960s April 1961 Vostok 1 Russia Yuri Gagarin. First manned orbital flight
July 1969 Apollo11 United States Neil Armstrong. First man on moon.
1970s 1977 Shuttle United States Shuttle glide flights, approach and landing tests (ALT)
1980s 1981 Shuttle United States First Shuttle orbital flight, STS-1.

10
CHAPTER 2
XLR–11 ROCKET POWERED AIRCRAFT
Birth of Manned Rocket Research Airplanes: 1946 to 1975
The first reliable, effective rocket engine that would provide boost for experimental research aircraftwas produced by four members of the American Rocket Society (ARS) who combined forces to formReaction Motors Incorporated (RMI) (Rockaway, New Jersey) for developing the Experimental LiquidRocket (XLR-11) rocket motor.
3
The XLR-11 engine had four separate rocket chambers. Each chamber provided 1500 lb of ratedthrust and could be operated independently as a means of throttling thrust in quarters, up to 6000 pounds.
The XLR-11 possessed remarkable longevity, powering an impressive fleet of rocket aircraft formore than a quarter of a century (1946 to 1975). This fleet of vehicles were the first rocket aircraftdevoted solely to high performance experimental flight research. They were not constrained by militaryor commercial demands and ranged from being the first to break the sound barrier (XS-1), to the first toreach Mach 2.0 (D-558-II [fig. 5]), to the first to exceed the X-2 Mach 3.2 record (X-15 with two XLR-11engines).
Figure 5. The D-558-II airplane on Rogers lakebed.E-1441

11
Operations and Performance of XLR-11 Powered Aircraft
Table 2 shows the beginning and ending dates of powered flights and maximum performance for eachseries.
6
The X-1E – Early Development of Energy Management
Design efforts to extend aircraft performance produced increased wing loadings,
W/S
, and decreasedlift-to-drag ratios, L/D. These design changes were beneficial in reducing drag to achieve supersonic andhypersonic speeds, but were also detrimental in that they reduced the area of the maneuvering footprintand presented difficulties in the approach and landing.
As L/D values decreased, the glide slope angle and the rate of descent increased, making it moredifficult for pilots to estimate distances and times required for acceptable landings. The X-1E (fig. 6) wasmodified with a low-aspect-ratio wing having a thickness-to-chord ratio of four percent—the onlyaircraft of the X-1/D-558 series to have sufficiently low L/D values to require unique energymanagement techniques. This X-1E was the first to experiment with approach patterns designed to givethe pilot more time in the traffic pattern to manage energy.
Figure 7 shows a profile and plan view of a typical landing pattern for the X-1E. The landing patternwas approached in a conventional manner except that altitudes and speeds were somewhat higher than forpowered aircraft. The initial reference point was established at 12,000 ft (mean sea level) on a downwindheading (180 deg remaining to turn). The downwind leg was offset some four miles from the centerlineof the landing runway. On downwind, abeam the touchdown point, landing gear and partial flaps weredeployed at a speed of 240 knots. Full flaps were usually deployed on the final approach. At the initialreference point the pilot had almost three minutes until touchdown—additional time for handlingincreased speeds and sink rates.
7,8
Table 2. Research rocket aircraft powered by XLR-11 rocket engines.
Aircraft Powered flight, dates Maximum speed, Mach number
Maximum altitude, ft
X-1E 12/09/46 to 11/06/58 2.24 90,440
D-558-II 01/26/51 to 12/20/56 2.0 83,235
X-15 interim engine 09/17/59 to 02/07/61 3.5 136,500
HL-10 10/23/68 to 07/17/70 1.86 90,303
X-24A 03/19/70 to 06/04/71 1.60 71,400
X-24B 11/15/73 to 09/23/75 1.75 74,100
M2-F3 11/25/70 to 12/20/72 1.61 71,500

12
Figure 6. The
X-1E airplane on Rogers lakebed.
Figure 7. Typical X-1E landing pattern.
E-1927

13
As the considerably lower wind tunnel values of X-15 L/D ratios were becoming available, HSFSengineers began analog simulation and flight test programs to determine what landing techniques wouldbe required to satisfy these lower values. By changing configuration and thrust of an F-104A, pilots couldmatch the L/D characteristics of the X-15 approach and landing patterns to establish
high key
and
low key
locators (discussed in Chapter 4, “The X-15 Aircraft”).
Another candidate for harnessing XLR-11 power was the underpowered X-3 (fig. 8) built by DouglasAircraft Company (Long Beach, CA). Wind tunnel and engine tests indicated that the X-3 could notreach Mach 1.0 in level flight, which indeed it did not. With interim J34 engines, the maximum speedattained in flight tests was Mach 1.21, in a dive.
6
Other than being underpowered, the X-3 was a prime candidate for supersonic flight test. Realizingthe potential loss—two years prior to delivery to the NACA—of a front line high-speed research airplane,researchers made a proposal to modify the X-3 by using thrust from two XLR-11 rocket engines and frominitial conditions provided by air launch. Hand calculations indicated that the X-3 could attain Mach 4.2.
*
The Research Airplane Projects Panel (RAPP) did not consider the X-3 effort worthwhile in view of therapidly developing F-104—that would have Mach 2.0 capabilities—and an imminent contract award forthe X-15.
6
Figure 8. Photograph of the Douglas X-3 research airplane. Considered for replacement of jet engineswith two XLR-11 engines for Mach 4.2 capability, 1952.
______________________________*Drake, Hubert W., and Day, Richard E.,
Proposed Modification of X-3 Airplane to Rocket Power and Air Launch
.Memorandum for Chief of Research, NACA High-Speed Flight Research Station, Edwards, California, October 24, 1952.
E-17348

14
These calculations, using the archaic slide rule for graphical construction and a planimeter forintegration, required many hours for solution. Personal computers today can calculate and plot the sameproblem in a matter of seconds with a greater degree of accuracy.
With an air launch near Rogers Dry Lake, this performance at Mach 4.2 would not have permitted alanding on the launch lakebed. At this early date, 1952, no thought was given to energy management,alternate launch sites, or interim emergency landing sites.
Between 1968 and 1975, the XLR-11 came out of hibernation to boost a new breed of odd-lookingwingless vehicles that defied the name “airplane” and were consequently named “lifting bodies.” Duringthis period of time, the engine thrust had been increased by one-third.
XLR-11 Contributions to Boost-Glide Energy Management
Hundreds of flights of the XLR-11-equipped aircraft provided considerable background experiencefor boost-glide operations and data relevant to energy management. The X-1E established thefundamentals of landing site energy management for low L/D aircraft by originating new approach andlanding techniques.

15
CHAPTER 3X–2 AIRCRAFT DELINEATES A REQUIREMENT
FOR ENERGY MANAGEMENT
Each generation of rocket powered aircraft produced more propulsive energy than the preceding one.The next generation in this series of rocket research aircraft, the X-2—with approximately twice thethrust of its predecessors—became the first boost-glide vehicle to demonstrate a need for energymanagement.
Background of the X-2 Aircraft
The X-2 (fig. 9), built by the Bell Aircraft Corporation (Buffalo, New York), was air launched from amodified B-50 bomber (fig. 10). After rocket burnout, it glided unpowered on an extendible skid landinggear to a landing on the hard playa surface at Rogers Dry Lake. The airplane was powered by the XLR-25twin-chamber rocket engine. Built by the Curtiss-Wright Aircraft Corporation (Caldwell, New Jersey),the chambers provided 10,000 and 5,000 lb of thrust respectively. Propellants provided an expected burntime of approximately 140 seconds. During the period of August 1954 to September 1956, the X-2 made4 glide flights and 13 powered flights, all landing within the bounds of Rogers Dry Lake except for thelast powered flight.
9,10
Figure 9. Photograph of the X-2 rocket research airplane.
E-2817

16
Figure 10. Air launch of X-2 rocket research airplane.
Operations
Energy management for the X-2 was based on experience gained from all precedinglaunch-to-landing rocket flights. The air launch had to be located in the vicinity of Rogers Dry Lake, suchthat the aircraft could land near the shoreline of Rosamond Dry Lake in the event of rocket ignitionfailure. On the other hand, the landing site must take into account a successful rocket burn of expectedmaximum duration that would position the X-2 far downrange. Therefore, the energy managementfootprint must cover the landing areas of the dry lakebed at all times. These logistics were a prime factorin driving the X-2 into a veritable trap on powered flight 13, demonstrating a requirement for precisionenergy management.
The Air Force Flight Test Center conducted the flight demonstration program for the X-2 atEdwards AFB with the NACA HSFS providing data recording instrumentation, radar tracking, andengineering support. Powered flights began in November 1955.
As the flight test program proceeded, the X-2 reached increased speeds and covered a more expansiverange. Lt. Col. Frank Everest attained a Mach number of 2.87 on powered flight 9 and was able to land on
E-2820

17
the lakebed. As shall be described below, Mach 3 appeared to be the X-2 speed limit for remaining withinthe bounds of the dry lake.
At this point in time, Everest was reassigned and Captain Milburn Apt was designated the X-2 pilot.On September 27, 1956, the X-2 established a world speed record of Mach 3.2 (2118 mph) but, afterrocket burnout, became the victim of three distinct, but separate, instabilities, each leading directly intothe next, culminating in the loss of the airplane and pilot.
10
In the previous year (1955), the Air Force had obtained a Goodyear Electronic Differential Analyzer(GEDA) analog computer. NACA engineers provided the equations, controls, and displays to develop theX-2 simulator using this computer. NACA engineers also provided X-2 simulator operations and pilottraining and briefing. The simulator did not have sufficient equipment to compute the performance,trajectory, or range in the three degrees of longitudinal freedom; consequently the simulations wereconfined to the simpler five degrees of lateral-directional freedom, enabling the pilots to assess thehandling qualities of the aircraft at a fixed (simulator) altitude and speed. The sixth degree of freedomdetermines the velocity vector, altitude, and total range capability required for monitoring and managingthe energy. Real-time, six-degree-of-freedom analog simulation would not be available until the timewhen the X-15 made its appearance.
The X-2 pilots made many runs on the simulator to investigate unsafe flight conditions. They weretaught how to recover from control instability if motions were beginning to diverge, by executing apushover to lower the angle of attack. Prior to each high-speed flight the pilots were instructed tomaintain a low angle of attack after burnout until slowing to Mach 2.4, at which speed it was safe toincrease angle of attack for turns. On his record-breaking flight, Everest decelerated from Mach 2.87 toMach 2.2 before entering a turn (increasing angle of attack) to return to Rogers Dry Lake. Everest,however, was not painted into a corner, as Apt would be.
Scenario of the Final Flight
Apt had “flown” the simulator and received briefings on July 29, 1956, plus several non-loggedinformal simulator sessions between that date and September 24 of the same year, to prepare for the 13thpowered flight. On September 27, 1956, the mother ship, with the X-2 attached, climbed to 30,000 ft and,on Apt’s command, launched the X-2. He flew a flawless maximum-performance trajectory, and therocket burned longer than expected in reaching propellant depletion. This unexpected increase inperformance, which propelled the aircraft to Mach 3.2, positioned the X-2 further from the landing site(Rogers Dry Lake) than planned, placing the airplane at a possible point of no return. At this point, Aptwas literally painted into a corner. He had to decide whether to decelerate to Mach 2.4, as briefed, andthen make a safe turn, thus increasing the distance even further from the landing site, or try to make theturn immediately and risk the instabilities that had been predicted and “flown” on the simulator.
The simulator was a new device that had never been used previously for training or flight planning.Most pilots had, in fact, expressed a certain amount of distrust of it. Whether distrust of the simulator or afear of not making it back to the landing site affected Apt's decision, he opted for the turn. His radiomessage was, “O.K. She’s cut out. I’m turning.” There was an ominous silence of 20 sec before Aptuttered an almost unintelligible, “ -- she goes!”
Postflight records indicated that the X-2 remained stable up to a Mach number of 3.2 while at lowangles of attack. After rocket burnout, Apt attempted a bank for return to the dry lake, increasing angle of
18
attack and thus decreasing directional stability, sending the aircraft into roll inertial coupling and wildlydivergent motions. Shortly after these divergences, the pilot made two recovery attempts, then pulled the“T” handle initiating cockpit separation. After separation, the radar operator indicated that the radarimage was in two parts, one larger than the other. Ground control instructed him to follow the smallerimage (the capsule). The stabilization parachute that deployed did not slow the capsule sufficiently toprovide time for escape from the cockpit. The pilot jettisoned the cockpit canopy but could not escapefrom the capsule in time to use his personal parachute and died on impact.
After the location of the crash site was reported by the B-50 pilot, the oscillograph data recorderswere salvaged and developed. When the film was unrolled to view, it was déjà-vu. The film traces lookedexactly like the strip recorder traces of simulator runs and, in particular, the training runs made prior tothe flight. It was immediately apparent what the events were, how they happened, and why theyhappened.
10
A proposal was made to salvage the X-2—which was relatively intact—and modify it to a hypersonicconfiguration.
7
The X-15, however, designed to achieve hypersonic speeds, was waiting in the wings.The X-2 was not approved for the modification, making Apt’s tragic flight the last in the program.
Extended Range Requirements
The vast area of Rogers Dry Lake was no longer capable of encompassing the range requirements forthe emerging generation of high-energy boost-glide vehicles. At this point in time, late 1956, there weresufficient X-15 data from wind tunnel and engine tests to predict X-15 performance and future rangerequirements. As a result, a contract was awarded to initiate Project High Range, an instrumented flightcorridor for monitoring the X-15 flights from distant remote launch sites to the NACA site at Rogers DryLake (see Chapter 5, “Project High Range”).

19
CHAPTER 4
THE X–15 AIRCRAFT
Foundations for Space Operations
Background
The X-1 series rocket aircraft with landing configuration L/Ds as low as 4.0 were the forerunners inestablishing the necessity for key locations and new landing techniques. All were air launched in thevicinity of, and landed on, Rogers Dry Lake, precluding the need for an extended range and alternateemergency landing sites.
The X-2 demonstrated that energy management must consist not only of guidance after burnout butalso performance calculations that predetermine the total energy vector of the vehicle at all times, fromlaunch to landing. If there had been X-2 performance calculations to determine range, speed, and altitude,it would no doubt have altered the flight planning and outcome of the final, fatal flight.
The demise of the X-2 prevented the NACA from obtaining anticipated quantitative high supersonicheating data. Postflight examination at the crash scene indicated that although the aircraft had sustained aperiod of 15 sec above Mach 3, the stainless steel skin had not suffered from aerodynamic heating. Thisfinding indicated that the time had come to expand the experimental research program into thehypersonic speed regime (speeds exceeding Mach 5.0). The need for such expansion had been recognizedsome years earlier. In 1952, the NACA Committee on Aeronautics urged that the NACA studyrequirements for piloted hypersonic aircraft. From this study, “Project 1226,” the X-15 emerged. OnSeptember 30, 1955, the Air Force informed North American Aviation (NAA), Inc. (Los Angeles,California), that it had won the X-15 contract.
6
In February 1956, the company that developed theXLR-11 rocket motors, Reaction Motors, Inc., was given a contract to develop the XLR-99 rocket engine(more on XLR-99 later). By September 1956, enough wind tunnel and structural data had been collectedto allow construction of the first X-15 to be started.
The X-15 program was a joint effort of the NACA/NASA and the military. NACA/NASA providedconceptual design, technical direction, instrumentation, and flight operations. The U.S. Air Force and theU.S. Navy provided funding. The USAF provided and operated the launch aircraft. Each of these partnersfurnished X-15 pilots.
XLR-11 Interim Engine Operations
Several delays in development of the XLR-99 rocket engine presented a potentially prolonged delayin the program. As a result, aircraft numbers 1 and 2 were each equipped with two XLR-11 engines forinterim flight operations. The first X-15 arrived at NASA in October 1958. The first flight powered bythe alternative XLR-11 engines was delayed almost a year, and the first flight equipped with the XLR-99engines was delayed more than two years. Flight planning for these operational programs wasintermingled; however, the X-15 simulator had the capability of switching from one propulsion system tothe other.

20
Locally launched early flights with the XLR-11 engines (fig. 11) held maximum speeds belowMach 3.0 and required no footprint. Later flights exceeding Mach 3.0 were remote launches fromSilver Lake.
Figure 11. The X-15 aircraft equipped with dual XLR-11 engines for interim operations prior toinstallation of XLR-99 engine.
The XLR-99 Engine
When the XLR-99 engine (fig. 12) finally became operational, the contractor made three acceptanceflights. Each was planned on the simulator and was designed to keep speed below Mach 3.
E88 013-42

21
The XLR-99 engine, with maximum rated sea-level thrust of 50,000 lb, was capable of restart andwas throttleable from full thrust to half thrust. The XLR-11 engine thrust could only be varied inincrements by cutting or restarting one or more of its four chambers. Table 3 lists a comparison of theconfiguration and thrust capabilities of three of the XLR series engines and the aircraft they powered.11
Figure 12. Rear view of the X-15 aircraft with the XLR-99 engine. Also shown are the upper and lowerspeed brakes fully extended, the wedge shaped upper rudder and the landing skids.
Table 3. Comparative sea-level thrust of three XLR rocket engines.
Engine Aircraft Configuration Total rated thrust, lbf
XLR-11 X-1 4 chambers, 1,500 lbf each 6,000
XLR-25 X-2 2 chambers, 5,000 and 10,000 lbf 15,000
XLR-99 X-15 Single chamber 50,000
E-88 013-52

22
The X-15 Six-Degree-of-Freedom Simulator
Advancing technology vastly increased the performance of the X-15 over that of previous boost-glidevehicles. Fortunately, technology also increased the capabilities of the primary flight test analytical tool,the simulator (figs. 13 (a) and (b)). Earlier five-degree-of-freedom simulators could provide only stabilityand control analyses at fixed speeds and altitudes. The X-15 six-degree-of-freedom analog simulator hadthe capability of calculating and plotting the velocity vector, altitude, and total range, providing the toolsfor energy management studies. These studies revealed a quantum leap of energy managementrequirements, from remote launches through intermediate energy conditions, to landing.
The X-15 program was the first to use the simulator for studying and planning the expansion of theflight envelope, for individual flight planning, and especially for the energy management analysis andoperations. Milton Thompson, an X-15 pilot, and later the NASA Dryden Chief Engineer, stated:“I personally do not believe we could have successfully flown the aircraft without a simulation,particularly in regard to managing energy.”
11
Long before X-15 simulator operations at NASA Dryden, the X-15 simulator was built at the NAAfacility on the south side of the Los Angeles airport. The simulator was fabricated for design and test ofhardware and software, primarily for the dynamics of the control system.
The simulator complex consisted of the following for computing and recording the three translationaland three rotational degrees of freedom aircraft motions in real time:
• Operational amplifiers, function generators, servomechanisms and electronic multipliers forcomputing trigonometric and algebraic terms.
• Cockpit controls, display panel, and integrated control system hardware test bed.
• Several multichannel strip chart recorders.
• A large, vertical x-y recorder for plotting longitudinal and lateral ground distances to determinegeographical locations, as well as altitude versus range.
• Smaller horizontal x-y recorders used for various plots and as input devices for aerodynamicderivative matching.
• The capability to switch from simulated XLR-11 to XLR-99 engine operations.
• A malfunction generator for generating major systems failures.
Prior to the simulator moving to the NASA Dryden facility in 1960, NACA and NASA engineerswere allowed simulator time for early flight planning. During this period of time, envelope expansionstudies, the ventral removal study (removal of the lower rudder to improve lateral-directional stabilityand control), and early energy management studies were done.

23
(a) Cockpit controls, display panel, and integrated control system hardware test bed.
(b) Electronic analog calculating and recording equipment.
Figure 13. The NAA X-15 six-degree-of-freedom simulator.
24
Simulator Flight Planning for the X-15 Aircraft
Simulator flight planning was a rather lengthy process for the X-15 aircraft, with energy managementconsuming a disproportionate amount of the time but paying benefits as the operational programprogressed.
The time consumed for various phases of planning and operations evolved as follows:
• Months Envelope-expansion. Using wind tunnel values of aerodynamic characteristics andmanufacturers values of physical characteristics, simulator flights were conducted in incrementsof altitude, Mach number, dynamic pressure, angle of attack, and acceleration loads. Maneuverswere performed at each level to evaluate limits. Results of the envelope expansion study werepresented to the NACA HSFS director and staff for approval and eventually at a Wright Fieldconference. Energy management was not considered during this phase.
• Weeks-Days Flight planning prior to each flight. Flight planners distributed a memorandum ofthe proposed flight to the Flight Operations Directorate and to the branches of ResearchEngineering requesting engineering inputs for data maneuvers at various flight conditions. Flightplanners, who were usually ex-military or civil pilots, then converted the requests into maneuversand a timeline for the flight. All conceivable emergency situations were considered. Energymanagement was folded into these simulations. Pilots often participated in this flight planningphase.
• Days-Hours Pilot training. Since the pilots had other flying commitments, they could notparticipate in the full flight planning sessions. Pilots would “fly” the timelines, performing therequired maneuvers time and again until they had memorized the entire flight includingemergency situations and energy management profiles. Nominally, the pilot would spend40 to 50 hours distilling all this information into a 10-minute flight.11,12 After each flight, newvalues of the aircraft’s characteristics, obtained from flight data maneuvers, replaced the windtunnel and theoretical values in the simulator.
The above requirements and capabilities of the X-15 simulator and its history, including manyanecdotes concerning the simulator and simulator operations, are described in reference 12. This book isan excellent history of all the aircraft and space simulators used by the FRC from the X-2 to the LunarLanding Research Vehicle (LLRV) and lifting bodies.

25
Geocentric Effects
Note the additional effects influencing the design of energy management—the accelerationsproduced by extreme radial velocities and altitudes.
Centrifugal acceleration
is a function of the vehicle’s velocity and altitude and is determined by theequation , where is the centrifugal acceleration,
V
is the vehicle’s velocity normalto the geocentric radius, . R is the Earth’s radius and
h
is the vehicle’s geometric altitude(fig. 14).
Geopotential acceleration
decreases as the inverse square of the geopotential radius and isdetermined by the equation where is geopotential acceleration,
g
is theacceleration of the Earth’s gravity at sea level.
Considering geopotential as positive and centrifugal as negative effects, one can calculate an altitudefor which there is a velocity that will produce zero acceleration (microgravity), or as it is sometimereferred to, “zero
g
,” for orbiting satellites or vehicles.
Definitions of Terms
Geocentric
Measured as from the center of the Earth
Geodetic
Distance in which the curvature of the Earth is takeninto consideration
Geometric altitude
Actual altitude (
h
) above surface of the Earth
Geopotential energy
Potential energy at
h
, above the Earth
Geosynchronous orbit (Geostationary orbit)
A satellite’s angular velocity equals the Earth’s angularvelocity in the equatorial plane and the satellite appearsto be stationary from Earth.
ac V2
R h+( )⁄= acR h+( )
ag g R R h+( )⁄[ ] 2= ag

26
Figure 14. Centrifugal acceleration as a function of tangential velocity.
The tick on the curve labeled “X-15” in figure 14 shows the rather low incremental accelerationproduced by the X-15 at maximum performance. The circle symbol located on the right curve indicatesthe velocity required (25,405 ft/sec) to produce “zero g” at an altitude of 1 million feet.
The curves of figure 14 show centrifugal acceleration calculations for two altitudes. The curve on theleft is for zero altitude (h). The curve on the right is for one million ft, indicating the very small decreasein centrifugal effect with lower altitudes. There is also little effective decrease in geopotentialacceleration with altitudes up to one million ft—a nominal orbiting altitude. Considering the radiusof the Earth to be 21 million ft, the geopotential acceleration at 1 million ft altitude (h) is
, a loss of only about 10 percent. The effect becomes more prominent withincreasing orbital altitudes such as geosynchronous orbit.
Lift to Drag Ratio Spectrum
Because the X-15 was the first boost-glide aircraft with abnormally low L/Ds and sufficient energy torequire an instrumented range and remote emergency landing sites, it might be advisable at this junctureto examine the spectrum of L/Ds of all types of air and space vehicles to review their glide characteristicsas a function of L/D.
30
20
10
0 10
"Zero g"
X-15
Acceleration,ft/sec2
20Tangential velocity, ft/sec
30 x 103
020491
21 22⁄( )2g 0.91g=

27
Figure 15 shows the glide angle (γ) as a function of L/D for stabilized glide angles (no centrifugal orgeopotential effects). The glide angle is determined from the first order equation: tan γ = 1/(L/D). Labelsfor various types of vehicles show that the spectrum of L/Ds extends roughly from zero for ballisticbodies to impressively high values for clean, high-aspect-ratio gliders and sailplanes.
Figure 15. Lift-to-drag ratio spectrum of air and space vehicles. Flightpath angle, γ, plotted as a functionof L/D for stabilized glide angles.
The labeled portions of the curve indicate the range of L/Ds and their various characteristics, fromplummeting to soaring, for various types of air and space vehicles.
Lift-to-drag ratio
• A – (0-1) Ballistic and semi-ballistic: Mercury, L/D = 0; Rolling entry for Gemini and Apollo tocontrol footprint; Shuttle during stabilized portion of 40-deg reentry
• B – (1-2) X-15, hypersonic and reentry13
• C – (2-6) Covering the knee of the curve; landing configuration L/Ds for XLR-11-equippedvehicles, X-2, X-15, and Shuttle
• D – (6-18) Commercial, civil, and military
• E – (18-40+) Gliders and sailplanes
A, B, and C are primarily the boost-glide vehicles that require customized range and energymanagement facilities.
0
10
20
30
40
A
B
C
DE
50
60
70
80
90
2 4 6 8 12 14 16 18 2010L/D, dimensionless
Flightpathangle,
γ, deg
020492
α

28
Development of Low Lift-to-Drag Ratio Operational Techniques and Position Locators
Ground Simulations
During the design phase and wind tunnel tests of the X-15, it became apparent that a lower thannormal lift-to-drag ratio, L/D, and a higher than normal wing loading, W/S, would present the pilot with amore difficult approach, flare, and landing. As stated previously, L/D determines the glide angle; thelower the ratio, the steeper the glide angle. A higher wing loading, W/S, increases the speed of thedescent. This combination, in addition to high energy remote launches, affects many aspects ofcontrolling the unpowered glide to a successful landing.
• Ranging Lesser ranging capabilities means smaller footprints.
• Location Necessitates locators; such as high key and low key.
• Margins Simulator flight planning is required to avoid “undershoot” or “overshoot” of the high key location.
• Timing A steeper glide angle and increased vertical velocity provide less time for judging the final approach, flare, and landing distances.
The X-15 Aircraft High Key and Low Key Locators
Because the X-15 L/Ds were considerably lower than those for the X-1E and launches were fromremote sites, a more rigorous definition of the terminal area key locators was required. In addition,locations such as high key and low key are so interdependent that it is difficult to discuss one withoutreference to the other.
The bothersome effects of decreasing values of L/D were beginning to plague test pilots of advancedfighter jets. While making flameout approaches and landings, in low L/D configurations, pilots werehaving some difficulty in judging vertical velocities and distances, resulting in some damage to theaircraft. Knowing that the X-15 would have even lower L/Ds, High-Speed Flight Station engineersinitiated a series of studies on analog simulators and on jet aircraft configured to match the L/D of theX-15 in the landing configuration.
High keyHigh key is the location (altitude, airspeed, and heading) at the end of the boost-glide where a spiral
turn is initiated over the intended touchdown point. This locator is at a sufficiently high altitude toprevent overshoots and undershoots and to establish adequate time and distance required for low keytasks.
Low keyLow key is that point in the descent from high key, opposite the intended touchdown point, where the
final turn is initiated. In the final turn, position and speed are established for the approach, flare, andlanding.

29
These key locations and conditions are a function of L/D and are tailored to a particular aircraft andits energy and distance from landing at burnout. For example, the aircraft with the lowest L/D of the X-1series, the X-1E, was launched and landed locally. It did not establish a key locator. The high and low keyaltitudes of the X-15 were increased as the energy and launch distances of the flights increased. Theseincremental requirements of energy management are discussed later.
Facing the fact that the X-15 would be operational in the near future, the NACA HSFS engineers andpilots began laying plans for circumventing the energy management obstacles. During the period betweenmid-1955 and the start of X-15 operations in mid-1959, there were enormous amounts of groundsimulator studies and flight research regarding low L/D energy management flight techniques. Theseefforts established footprints from remote launch sites as well as high key and low key space locations.The footprints and key locators provided a potential energy marker to prevent overshoots andundershoots, thus permitting wider latitude for judgment of time and distance in the landing pattern. Thein-flight simulations were accomplished by modulating the L/D of such aircraft as the F-104A, byextending gear, and by varying flaps and speed brakes at reduced throttle settings.
Early Analog Simulations
During the period of time spent at the manufacturer’s facility prior to X-15 operations, NACA/NASAengineers conducted envelope expansion studies on the X-15 simulator. Before many simulatedhigh-energy flights took place, it became obvious that overshoots and undershoots of the intendedlanding site would be common unless energy management became an integral part of flight planning.
If low on energy, the pilot of a powered aircraft can apply throttle. After burnout, the pilot of the X-15had no power, so he maintained the (preplanned) excess energy by flying at the airspeed for maximumL/D and using speed brakes to bleed off excess energy as necessary. Consequently, during simulations,flight planners made sure that at burnout the X-15 had energy in excess of that required to return to highkey at Rogers Dry Lake. When deflected, the speed brakes exposed considerable area to the airstream andwere quite effective as decelerators (essentially reverse thrusters). The upper and lower extendedsegments of the X-15 speed brakes are shown in figure 12.
Studies Prior to First Flight of the X-15 Aircraft—Analog and Flight Simulations
The envelope of L/D as a function of lift coefficient (landing configuration) for boost-glide vehiclespreceding the X-15 is shown in the shaded area of figure 16. The envelope shows flight test data of L/Dratios for the landing configuration, the highest L/D of approximately 6.0 for the X-2 and the lowest ofapproximately 4.0 for the X-1E. The figure also shows 1958 wind tunnel values of the L/D range for theclean (solid line) and landing configuration (dashed line) of the X-15 with landing L/Ds of approximatelyone-half those of its predecessors.
Because the X-15 would have considerably lower L/Ds and higher wing loadings (W/S) than theX-1E (see figure 7), it would undoubtedly need to establish its own key positions and perhaps new orrefined landing pattern techniques. Fortunately there was an operational aircraft in the FRC stablecapable of closely approximating the X-15 low-speed performance characteristics. The LockheedF-104A (fig. 17) had many of the attributes for closely matching these requirements. Figure 18 shows thenearly identical X-15 wind tunnel values compared to F-104A flight values of L/Ds as a function oflift coefficient, .CL

30
Figure 16. Flight test data of L/D as a function of lift coefficient (landing configuration) for boost-glidevehicles preceding the X-15 aircraft and wind tunnel data for the X-15.
Figure 17. An F-104A airplane on the lakebed. Flight simulator for X-15 landing patterns.
E-3016

31
Figure 18. The X-15 wind tunnel values compared to F-104A flight values of L/Ds as a function of liftcoefficient in the landing configuration.
Many F-104A flights were made to select the best locators and flight pattern for future X-15operations. Figure 19 illustrates a typical landing flight pattern of the F-104A with L/D and wing loading(W/S) closely approximating that of the X-15. Comparing this figure with figure 7 of Chapter 2 indicatesthat with a L/D of approximately one-half that of the X-1E, the high key for the X-15 aircraft (20,000 ft)is nearly double that of the X-1E from 12,000 to 21,000 feet.
Figure 19 shows a typical high key approach starting at 21,000 ft and an indicated airspeed ofapproximately 275 knots on a 270-deg heading from the intended runway—vertical velocities of 300 to400 ft/sec were encountered on the turn to the base leg. The final approach was started at an altitude of2500 ft, where sink rate was reduced to less than 200 ft/second. By increasing normal acceleration atapproximately 500 ft, the pilot reduced the sink rate to below 100 ft/sec at 275 knots. Vertical velocitywas progressively decreased to about 5 ft/sec at 20 ft above the ground, at an air speed of 235 knots.Excess speed at this point permitted the pilot 8 seconds to touchdown at a speed of 185 knots.
Various approach headings were flown, but a 270-deg heading above the touchdown point wasusually preferred for initial orientation prior to turning.14 During these flight tests, analog simulationswere run concurrently to assist in the analysis.

32
Figure 19. Typical high key approach with the F-104A aircraft configured to match wind tunnel values ofthe X-15 aircraft.
•
An alternate approach
During this period of time, an alternate method of accomplishing lowL/D approaches was demonstrated at Ames Research Center (Moffett Field, California), alsousing an F-104A airplane. The method was designed to simplify landing patterns and techniquesby omitting high key above the touchdown point and instead making a straight-in approach. TheAmes method was accomplished in three phases.
Phase I
started with a constant-attitude,high-speed dive from a specific altitude aimed at a precise point short of the approach runway.During
Phase II
a constant
g
pullout was made from a specified altitude and speed, flaring to ashallow flight path angle.
Phase III
consisted of a deceleration to a touchdown point.
15
Thismethod resulted in precise and controllable landings but left a somewhat ambiguous high and lowkey that did not account for remote high-energy launch overshoots and undershoots.
At a later period in X-15 operations—discussed later in this chapter—an acceptable compositemethod was adopted for the final approach after performing a circular pattern from high key over thetouchdown point.
11
The F-104A proved to be an excellent flight simulator for establishing X-15 high key, low key,approach, flare, and landing procedures. These tests were more definitive than those of the X-1Ein establishing landing performance requirements. The F-104A was also quite prolific in producingdata, having the capability of making frequent flights and several landing patterns in a single flight. TheF-104A not only served as a simulator to determine future energy management parameters andtechniques for high-energy boost-glide vehicles; it also served as a flight simulator to hone a pilot’sexperience prior to each X-15 flight—at Edwards and at remote emergency sites. In addition to all theabove, an especially modified F-104 also served as a Reaction Control System (RCS) trainer for flightcontrol in the tenuous atmosphere of X-15 high altitude flights and later space vehicle flights.
16

33
• Centrifuge Program An X-15 simulation was run in six degrees of freedom at The Naval AirDevelopment Center, Johnsville, Pennsylvania. The centrifuge as such, did not contribute toenergy management studies but did, inadvertently, demonstrate the effect of extreme decelerationin atmospheric reentry. During a simulated reentry from the maximum design altitude, CaptainRobert White (USAF X-15 pilot) forgot to lower the head bumper (an extendible block to restrainforward motion of the pilot’s helmet). At four longitudinal and seven normal gs, the pilot wasexperiencing eight gs at a downward angle of 55 degrees. His head slumped forward. The “deadman” switch release stopped the centrifuge motion.
The kinesthetic reaction of extreme energy from atmospheric deceleration, as opposed to maximumboost phase longitudinal acceleration of 4 gs, was so obviously demonstrated that the head bumper wasused on many of the high-energy flights.
Early X-15 Operations
First thirty flights: Refinement of high and low key positionsWith the beginning of X-15 operations in June 1959, the first 30 flights were completed in 18 months.
All types of approaches were flown—S-shaped, 180 deg, 270 deg, and 360 degrees. These flightsresulted in the following average values.17
• high key 20,000 ft, airspeed of 300 knots, wing loading of 72 lb/sq ft
• low key 12,000 ft, airspeed 250–300 knots.
• final flare 1200 ft at 270 knots, a vertical velocity of 110 ft/sec from a 1.4 g flare.
• touchdown with 30 deg flaps, angle of attack of 8 deg, L/D of 3.5 and a vertical velocityof ~ 4 ft/second. Pilots were able to touch down within ± 1000 feet. At least one landing wasmade by each of the seven pilots assigned at the time, during this 30-flight interval.16
The first remote launches were made from Silver Dry Lake located about 100 statute mileseast-northeast of Edwards near the California-Nevada border. The various launch lakes and emergencylanding lakes and how they were selected are described in Chapter 5, “Project High Range.”
Later operations: After first thirty flights, increased energy requires greater tolerancesThe first 30 launches determined nominal high and low keys of 20,000 and 12,000 ft respectively.
However, these flights were of insufficient energy to establish a window of high and low key positionsfor remote high-energy launches. There were subtle changes made in energy management techniques asexperience accumulated during the remaining 169 flights.
As stated previously, the properties of the atmosphere are the most troublesome for determining afootprint or maximum range available. Total energy at burnout does not always determine maximumrange. Figures 20 (a) and (b) indicate the performance values of altitude versus Mach number for analtitude flight and a speed flight respectively. As indicated on the figures, the total energies at burnout arepractically identical; however, the resulting ranges, or footprints, are considerably different.
At burnout of the altitude flight, figure 20 (a), the X-15 has a high rate of climb and is above99 percent of the atmosphere. With negligible forces other than gravity acting during ballistic flight, therange and footprint are considerably increased over those of the speed flight, figure 20 (b), where burnoutis at a lower altitude and the rate of climb is minimal. The drag of the increased atmospheric densityshows a loss of speed, considerably diminishing the range and footprint.

34
(a) Altitude flight profile.
(b) Speed flight profile.
Figure 20. The X-15 aircraft mission performance comparison.
The dashed lines of figures 20 (a) and (b) again indicate the value of the X-15 six-degree-of-freedomsimulator for flight planning, pilot preparation, and energy management.
Maximum performance flightsFigures 20 (a) and (b) indicated that although the energies at burnout of these build-up speed and
altitude flights were nearly identical, the range of the altitude flight was considerably greater because ofthe ballistic portion of the profile. Table 4 indicates that the same is true for the maximum performanceflights of the X-15 program.

35
During X-15 operations from High Range remote launch sites, high key, as shown in figures 21and 22, was nominally at an altitude of 35,000 ft directly over, and aligned with, the lakebed landingrunway at 250 to 300 knots airspeed, from which a spiraling 360-deg descent was made. At the 180-degpoint, the lateral separation from the intended touchdown point was approximately 4 miles. This pointwas the low key location at a nominal altitude of 18,000 to 20,000 ft and an airspeed still at 250 to300 knots. The final approach, flare, and landing were quite similar to those previously established.
This final definition of high and low key for the X-15 aircraft was sufficient to embrace thewindow-defining limits for overshoots and undershoots.
(Insert figure 22 here)
Table 4. Energy values and ranges for the X-15 aircraft maximum performance flights.
Flight number Date Maximum speed, Mach number, Velocity
Maximum altitude, ft
Energy burnout,
ft-lb × 10-9
Range to Edwards,
statute miles
91Maximum altitude
08/22/1963 M = 5.58V = 5565 ft/sec
354,200* 9.8 Smith’s Ranch280
188Maximum speed
10/03/1967 M = 6.7V = 6629 ft/sec
102,000 11.7 Mud Lake,200
*Although maximum altitude for Flight 91 was above 300,000 ft, the altitude at burnout, required for calculating the potential energy was 148,000 ft.9
Figure 21. Altitude mission showing trajectory, ground range, and radar tracking station locations for theX-15 aircraft.
E-88013-25

36
Figure 22. Typical approach pattern from remote launch site showing high key, low key, and runways forthe X-15 aircraft.

37
Flight Planning for the X-15 Aircraft
Each flight was initially practiced on the X-15 simulator for many hours to determine a timeline offlight maneuvers and the energy management aspects of the total flight, with some degree of excessenergy as a device to prevent undershoot. The excess energy could be attenuated by variable extension ofthe speed brakes. On the other hand, adding excess energy could not exceed the ability of the speedbrakes to attenuate possible overshoots. The prime reason for this was that all emergency dry lake landingsites were to the north and east; there were no emergency landing sites south of Rogers Dry Lake.A nonrecoverable overshoot would be much like an overshoot on an aircraft carrier without the capabilityof a wave-off and go-around.
The simulator exercises were followed with X-15-configured F-104 flights to verify and refine theanalog simulations. The F-104 flights were not only flown at Rogers Dry Lake but at the designatedemergency lakes.
The analog and F-104 exercises were so successful in establishing energy management criteria andtechniques that several anomalous incidents of extreme overshoots and undershoots were dealt withsuccessfully through pilot-control-room coordination.
The additional advantages of establishing a high key reference location are described in the section“Anomalous Incidents – Overshoots and Undershoots” (page 40).
Development of Energy Management Footprints for Ground Monitoring
Prior to operations with the XLR-99 engine, NAA developed a set of generic footprints using a digitalcomputer. These digitally generated patterns were difficult to use operationally but served as a guide fordetermining operational footprints by “flying” the X-15 six-degree-of-freedom analog simulator. Usinginitial conditions of mass, velocity vector, altitude, and ground position, the simulator was “flown” tomaximum forward, cross, and reverse range by flying the airspeed for maximum L/D. After several runs,points were established for outlining one-half of a symmetrical footprint.
Because the analog computer did not have the power of a digital computer, and the digital was tooslow at that time, neither method was capable of real-time display for ground monitoring. Fortunately thefootprints closely resembled an analytic geometry shape resembling a heart, called a “cardioid.” Theequation expressed in polar coordinates used much less data and could be calculated in real time fordisplay on a cathode-ray tube for ground monitoring. During operations, flight data was sent to the analogfor calculating and displaying the cardioid for real-time monitoring. The more powerful and faster digitalcomputers of today easily generate such figures in real time.
Figure 2 in the “Introduction” shows a cardioid as displayed on a cathode-ray tube for groundmonitoring. Figure 23 shows a series of cardioid footprints as an X-15 aircraft progresses for an altitudemission. The first cardioid represents range capability for an ignition failure at launch, t = 0, thesame size as the footprint for an air-launched glide flight. The launch lake had to be within this footprint.

38
Figure 23. Progression of footprint during an X-15 aircraft altitude mission.
At t = 50 sec, the climb angle and speed increased such that the cardioid would move ahead of the X-15aircraft and gradually grow larger. At burnout, t = 82 sec, the cardioid, representing the maximum totalenergy, attained its maximum size. The footprint retained its size, shape, and position because the aircraftwas above 99 percent of the atmosphere and in pure ballistic flight, at constant energy. There was nosignificant drag, only gravity, to influence the conservation of energy. Therefore the kinetic energy plusthe potential energy represented total energy and remained constant as speed and altitude varied untilreentry into the atmosphere. This constant energy trend is shown in figure 20 (a) by the straight-linetrajectories from burnout to reentry. At burnout the footprint covers several emergency landing lakes andample room at Rogers Dry Lake for a high key approach. At reentry the cardioid shrinks rapidly untilreaching high key.
Energy management was eventually controlled by the time of the rocket burn. A hundred-secondclock, mounted at the top of the instrument panel automatically was started and stopped by enginechamber pressure. Simulator flight planning determined the time of rocket burn for returning to thelaunch lake, time for intermediate lakes, and time for reaching high key at the destination. At all timesduring a flight ample dry lakes, shown in the figure, were available for emergency landings (fig. 23).
Benefits of Air Launch
The energy-saving advantages of air launch, as opposed to ground launch, are so obvious that thevery first German and American rocket-only aircraft, described in Chapter 1, employed thisenergy-saving technique. A photograph of an air launch of an X-15 airplane is shown in figure 24. Thevarious benefits of air launch are listed below.

39
Figure 24. Air launch of X-15 from B-52 carrier aircraft.
• On-board fuel conservation The launched aircraft doesn’t have to carry the fuel required toclimb from a ground launch to air launch altitude.
• Kinetic energy The launched vehicle has the free velocity benefits (V2) of the launch aircraft.
• Potential energy The benefits of the launch altitude (h), nominally 45,000 ft for the X-15 aircraft.
• Air density Air launch also avoids the energy-gobbling density of the atmosphere. For a launch at40,000 ft the aircraft is above three-quarters of the atmosphere. At equal speeds, the drag isone-fourth that of sea level.
• Increased thrust As the atmospheric pressure decreases with altitude, rocket thrust increases. Thethrust of the XLR-99 increased from 50,000 lbf at sea level to 57,250 lbf at 45,000 ft pressurealtitude, the nominal launch altitude for the X-15 aircraft.18
• Propellant “top-off” The ability to transfer propellants from the mother ship to an X-15 airplanepermits replacement of propellant “boil-off” during the climb to launch altitude.
• Safety If the rocket engine does not ignite, shuts down after launch, or produces only partialpower, the air-launched vehicle can jettison propellants and land. A ground launch, in most cases,ends in disaster under such conditions.
Unlike multistaged orbital rockets, the air launch altitudes and speeds of the X-15 aircraft, as statedpreviously, were insufficient to appreciably benefit from the geopotential altitude and centrifugal effect.
E-4942

40
Anomalous Incidents – Overshoots and Undershoots
Simulator flight planning produced excellent energy management results for the X-15 aircraft flights,however various anomalous incidents occurred to produce flight deviations resulting in overshoots orundershoots of the predicted altitude or range. Almost all of these incidents were overshoots due to thedifficulty of hitting all the flight plan checkpoints required for altitude flights. Undershoots wereprimarily caused by some system malfunction shortly after launch. High key altitude was progressivelyincreased such that undershoots, when they occurred, were not a problem. In addition, alternatecontingency lakebeds were always accessible for landings.
A small variation in timing, climb angle, or thrust could produce the following variations in predictedaltitude:
• Timing For altitude flights, the rate of climb at shutdown or burnout was normally over4000 ft/second.
• Engine performance Calculations plus simulator flight planning experience indicated that anextra 1000 lb of thrust would add about 5000 ft to maximum altitude. Performance amongdifferent engines indicated that thrust could vary by 3000 lbf.
• Climb angle A one-degree error in climb angle could produce a 5000 ft change in maximumaltitude.
If each of the above variations were cumulative to increase rate of climb, the additive effect couldresult in an overshoot of tens of thousands of feet. Described below are five examples of overshoots thatoccurred during the program.
Neil Armstrong On a mission to check out a new Minneapolis Honeywell (MH) (Minneapolis,Minnesota) adaptive flight control system, Neil Armstrong was launched from Mud Lake, April 20, 1962(Flight 51). The planned altitude was 205,000 ft, with maneuvers during ascent and descent to test thenew control system. The MH system included reaction controls blended with aerodynamic controls asdynamic pressure changed during ascent and reentry. Neil only slightly exceeded the planned altitude.However, while he was monitoring the control system g-limiting feature, the airplane had completed theentry and was in a climb. He flew by Edwards at approximately Mach 3 at 100,000 ft. At this altitude,making a 180-deg turn back to base is impossible. Neil continued for about 45 miles south of Edwards toLa Canada and the Rose Bowl before completing a turn towards Edwards. He barely limped intoEdwards South Base, skimming the Joshua trees, in an unprecedented landing to the North. This wasprimarily a range overshoot rather than an altitude overshoot. This space-related experience was only oneof many that honed Neil’s talents for lunar energy management.11
Robert White This was also a flight checking and demonstration of the MH adaptive control system.White was launched from Delamar Lake, on a flight planned for an altitude of 282,000 ft but achieved314,750. Bob, late on shutdown and several degrees high on climb angle, reached an altitude of 314,750ft, an overshoot of 32,750 ft. Following the altitude overshoot, the pullout was completed almost over thenorth lakebed at Edwards with a high key of 80,000 ft at Mach 3.5. At this speed and altitude, and with noappreciable rate of climb, White was able to make a wide 360-deg turn and approach at a morereasonable high key of 28,000 ft.11

41
John McKay On a launch from Delamar Lake to conduct scientific experiments, May 15, 1963(Flight 83), McKay overshot a planned altitude of 98,000 ft by 26,200 ft. McKay recovered to high keyand the mission was completed without further incident.11
Joseph Walker On an altitude buildup flight, planned for 315,000 ft, Walker was launched fromSmith’s Ranch July 19, 1963 (Flight 90). After launch and pull-up to a one-and one-half degree error inclimb angle, a higher than expected thrust, and a longer than expected engine burn, the X-15 airplaneclimbed to 347,800 ft, for an overshoot of 32,800 ft—almost precisely White’s overshoot of 32,750 ft onFlight 62. Walker recovered and proceeded to high key without further incident.11
William Dana November 1, 1966, Bill Dana was launched from Smith’s Ranch, (Flight 174) on aplanned altitude mission to 267,000 ft to perform various scientific experiments. In establishing hisclimb, Bill attained and maintained a climb angle of 39 deg until engine shutdown. Because of an error inthe climb attitude indicator, Bill was climbing at an attitude of 42 deg instead of 39. In addition, theengine burned longer than predicted. Realizing this, Bill shut down the engine immediately but extra timewas added to the burn. During a portion of this time Bill was out of contact with the mission controlcenter and was not advised of the flightpath and high-energy conditions. As a result, the extra time andattitude angle carried the X-15 airplane to an altitude of 306,900 ft, an overshoot of almost 40,000 ft! Billrecovered nicely, made high key, followed by a normal landing. The overshoot did not compromise thescientific experiment objectives.11
Wind tunnel tests indicated that the Shuttle would have L/D ratios comparable to those of the X-15aircraft, consequently, the capability of the X-15 aircraft to handle large variations of excessive energiesfor boost-gliders was not lost on the design of the Shuttle, especially in the decision to eliminate theinternally stored cruise and landing engines.
Accomplishments of the X-15 Aircraft
In the hierarchy of experimental research airplanes, the X-15 aircraft exceeded the others in allcategories of achievement. It was the only X-series aircraft that was designed for, and would fly to,hypersonic speeds and extreme altitudes. The X-15 aircraft still holds the record for speed and altitude formanned single-staged boost-glide vehicles. The three X-15 airplanes flew 199 flights covering nearly adecade from June 1959 to October 1968. The X-15 aircraft were the most successful in returning researchdata for future design criteria of hypersonic boost-glide aircraft and orbital vehicles. These aircraft alsoserved as a test bed for future space range and control center design, established requirements forsix-degree-of-freedom simulation, flight planning, and the fundamentals of boost-glide vehicle energymanagement.

42
CHAPTER 5
PROJECT HIGH RANGE
Development of High-Energy Boost-Glide Operations
The final flight of the X-2 airplane on September 27, 1956, had demonstrated that moderately lowL/D boost-glide vehicles, launched locally, could overrun the Rogers-Rosamond footprint unlessconstrained to Mach 3.0 (see Chapter 3). Also by September 1956, enough wind-tunnel data had beencollected and analyzed on the X-15 aircraft to indicate that for the higher energy flights this aircraftwould require remote launches which, in turn, would require extensive real estate and support facilities.
These requirements, outlined in a 1956 NACA HSFS report19 resulted in the Project High Rangecontract award to the Electronic Engineering Company of California (Los Angeles, California)(Air Force Contract number AF 04(611)-1703, March 9, 1956†) with an expected completion dateof March 1959. The aerodynamic test range would require an instrumented ground range capable ofmonitoring the flight through its entire trajectory and would basically consist of sites at Edwards,California; Beatty, Nevada; and Ely, Nevada, with the prime control center at the FRC (Edwards). Theoriginal selection for the northernmost site was Wendover Air Force Base in Utah with Salt Lake as alaunch contingency landing site, but these were later rejected as unsuitable for X-15 aircraft landings.Figures 25 (a) and (b) show the geographical location and information flow of the radar sites.
The uprange Beatty and Ely sites were agreed upon by the AFFTC, the NACA, and the Project HighRange contractor. In addition to these radar sites, a contract was awarded to Reeves InstrumentCorporation (New York, New York) by EAFB for construction of a van-mounted radar unit. The mobileradar unit could be incorporated at any point within the radar range. This mobile radar could be stationedat any of the suitable dry lakes or, if desired, make a four-station radar range.‡
The Engineering Plan called for the following development:
• Perform a suitability evaluation at the two uprange sites.
• Lay out and construct access roads to each uprange site.
• Design and construct shelters at uprange sites.
• Install radar, telemetry, and communications equipment.
• Design and construct a radar tracking station in addition to the NACA (Edwards) building
†Schock, R.L., Project High Range, Engineering Plan, Electronic Engineering Company of California, Los Angeles, California,March 9, 1956.
‡NASA Aerodynamic Test Range Facilities Handbook, NASA Flight Research Center, Edwards, California, February 1971.

43
(a) Location of the X-15 aircraft ground range.
(b) Information flow on the X-15 aircraft range.
Figure 25. High Range sites and information flow.

44
Radar Site Evaluation and Development
In addition to the physical shelters, requirements included the following:
• Establish radar sites capable of line-of-sight overlap from furthest launch point to Edwards radar.
• Establish control centers with visual displays for radar and telemetry information andintercommunications, at and between centers.
• Provide long-range UHF communications.
• Ensure capability for tracking launch ship for navigational information.
• Provide backup performance data to the pilot: velocity, altitude, angle of attack, flightpath angle,ground track, and position.
• Monitor safety of flight system status, for ground analysis and transmission of critical informationto pilot.
• Provide rendezvous information to escort (chase) aircraft.
• Vector the pilot to key locations for approach.
• Provide a record of radar and telemetry data for subsequent research analysis.
• Ensure availability of an airfield near uprange sites.
After performing site suitability evaluations, the contractor proceeded to construct access roads andbuildings to house the range equipment. For compatibility, structures and equipment at the two uprangeshelters were to be identical. A photograph of the Ely radar site is shown in figure 26.
Figure 26. Tracking station, Ely, Nevada.
E-7656

45
Figure 27 shows the continuous high-range radar coverage and data transmission capabilities. Eachstation had a 218-mile radius coverage that assured continuous coverage for even the most remote sites.A range switch had the capability of increasing the coverage radius to 436 miles. With the switch in thelong-range position, any one station overlapped the entire range.
Figure 27. Overlap of radar coverage for the Ely, Beatty, Edwards radar range.

46
Telemetry data were received at both the FRC and Ely sites, recorded on magnetic tape, andprocessed in real time at FRC. Ground-to-air communications were provided by long range UHFequipment.
In the control rooms, the flight information relayed to flight controllers was displayed at consoles,meters, and plotting boards. All the instrumentation required for safety of flight was monitored anddownloaded for future research information. The various critical items being monitored were:
• Propulsion – Pressures, APUs, oxidizer, fuel, temperatures.
• Stability and control – Angle of attack, angle of sideslip, angular rates and positions, linear andangular accelerations.
• Control systems – Stability augmentation, aerodynamic surface positions, reaction controls(RCS).
• Energy management – Geometric location, velocity vector, time, air data.
• Scientific experiment parameters
• Medical – Vital signs, g forces.
Operational Logistics
Prior to each flight, operational personnel and equipment were flown to the launch site in an AFFTCC-130 cargo aircraft; at times, the personnel would be flown separately in the NASA R4D. Theoperational personnel consisted of technicians, flight test engineers, and an X-15 pilot to serve as flightcontroller. NASA pilots flew range checkout flights to check radar and telemetry with T-33, F-100, andF-104 aircraft.11
The NASA site at Edwards was the primary flight control center, with an X-15 pilot at the director’sconsole, in direct communications with the X-15 pilot flying the airplane. This operational procedure wasthe basis for future space operations, establishing the pilot, or astronaut, as the capsule communicator(Cap Com) and with a complement of engineers monitoring all aspects of the mission.
Control Room Anecdotes
For nearly a decade of X-15 aircraft operations, numerous personnel participated in the FRC controlroom. During such a prolonged period of time, it is not surprising that some unusual or improbableincidents occurred. Three that come to mind are described below:
1. One of the strip chart recorders in the control room recorded time histories of medical parameters,with one channel recording the pilot’s breathing. The medical recorder was monitored by AirForce flight surgeon Lt. Col. Burt Rowen. During the first flight, while the X-15 was still attachedto the carrier aircraft, the pilot, Scott Crossfield, who loved to taunt the medics, radioed down toRowen, “Burt, how am I doing?” Rowen replied—“Fine Scott. You’re doing OK.” To which Scottreplied, “Burt, I’ve been holding my breath for two minutes.”

47
2. During one of the early local launches, the North American Aviation flight controller,Q.C. Harvey, kept getting reports of accumulating bad weather. Just prior to launch, Harvey gavethe order to abort the mission because of bad weather. The pilot of the B-52 carrier aircraftreplied, “Harvey, there isn’t a cloud in the sky.” With the weather settled, the mission continued.
3. It was well known that during stressful activities, such as automobile racing, the participants haveinordinately high heart rates. Prior to entering the hypersonic rocket aircraft era, the medicalcommunity wondered if the X-15 pilots could endure the anticipated high heart rates duringcritical periods of flight test. The primary test for the 42nd flight was to test stability and controlwith the lower rudder removed. The ventral rudder was designed to increase directional stability.The simulator had indicated that at the higher angles of attack the X-15 was uncontrollable withthe ventral attached, and controllable with the ventral removed. During the critical portion of thisflight, the engineer who proposed removal of the ventral took his pulse and found that it washigher than the pilot’s. Observations showed that the same was true for most participating groundpersonnel in later flights and during the space program.
Selection of Launch and Intermediate Emergency Lakes
Prior to and during the High Range development at Ely and Beatty, suitable dry lakes were selectedalong the flight corridor for air launch locations and for emergency landing dry lakes. In comprehensivesurveys, the only suitable dry lakes for launch and emergency landings were in the quadrant northeast ofEAFB, with none south of Rogers Dry Lake. As explained in Chapter 4, this southern boundary presentedsome difficulty in establishing energy management procedures that would prevent the X-15 aircraft fromovershooting Rogers Dry Lake.
Remote Lake Requirements
Because the X-15 aircraft landed on skids, the only acceptable landing areas were dry lakebeds,which (with the exception noted above) were plentiful in the arid Southwest. Surveys were undertaken bythe NACA/NASA, the AFFTC, and NAA. In selecting the lakes, several characteristics had to beconsidered:
• The surface had to be hard and smooth.
• The desired landing strip had to be at least three miles long.
• The landing approach had to be unencumbered by hills or mountains.
• There could be no railroad, road, ditch or power lines crossing the landing strip.
• There had to be means of vehicular access for recovery of the X-15 airplane.
• A launch lakebed had to be within gliding distance of the launch point and alternates had to belocated at appropriate intervals, to allow coverage in case of shutdown occurring at any timeduring the flight.
• The launch site and intermediate lakes had to be within line of sight (LOS) radar coverage.

48
After the lake sites were selected, they were marked by the Air Force with standardizedeight-foot-wide tar stripes 300 ft apart for reference dimensions. Hardness was checked with a five-in.steel ball dropped from six ft and the resulting diameter was checked to compare with predeterminedlakes—similar to Brinell metallic testing.11, 20
The proximity of launch sites was determined during flight planning simulator sessions, primarilyfrom energy management considerations:
• Local: Local-launches were for the lowest energy flights and did not exceed Mach 3.0, asdescribed earlier. These flights were launched near Rogers Dry Lake and were primarily for themanufacturer’s airworthiness demonstrations and pilot check-out.
• Short range: These launches were for moderate energy buildup flights of the XLR-11 engineenvelope expansion program. Most were launched from Silver Dry Lake.
• Long range: Launches for XLR-99 envelope expansion flights, heating data, and various researchflights took place at all northeast quadrant lakes.
• Maximum range: Launches for maximum energy flights, primarily maximum altitude attempts,departed from Smith’s Ranch and Delamar Dry Lakes.
Early Dry Lake Survey
After the X-15 aircraft had exhausted the Rogers Dry Lake footprint with flights limited to Mach 3.0,and before the later high-energy flights, NASA and the U.S. Air Force were eager to continue flights inthe lower end of the envelope expansion program—flights requiring launches approximately100 statute miles from Edwards. For these buildup flights, the launch lake had to be within the range ofthe Edwards radar with suitable intermediate emergency landing lakebeds. For these purposes Joe Walker(an X-15 pilot) and the author undertook a lakebed survey in the octant east-northeast of Edwards in aU.S. Air Force helicopter. A primary launch site, Silver Dry Lake, was found approximately 100 milesfrom Edwards near the Nevada border with intervening emergency sites at Three Sisters, Cuddeback,Harper, and Bicycle Dry Lakes, as shown in figure 28.
Survey Conducted by the Air Force Flight Test Center and North American Aircraft
A survey was made of some 50 dry lakes north of Edwards in California, Nevada, and Utah. Amongthose that were deemed suitable for X-15 landings were Cuddeback, Hidden Hills, Ivanpah, Delamar,Smith’s Ranch, and Mud. This survey included Salt Lake at Wendover AFB, Utah, which was in theoriginal proposal, but was not considered usable. Figure 28 shows the location of the dry lakes bylongitude and latitude with symbols for suitability of the X-15 aircraft landings.20 Figure 29 is a politicalmap showing many of the lakes used.11
Seven uprange lakes were eventually chosen. Only four were used in the early program: Silver,Hidden Hills, Mud and Delamar. Smith’s Ranch and Delamar were used for maximum energy altitudeflights. Railroad Valley was uniquely located for two scientific experiment flights. Cuddeback, althoughsuitable, was used only once for air launch and twice for emergency landings. Table 5 lists all the launchlakes for the 199 flights and the lakes utilized for landings of the ten aborted flights of the X-15 airplanes.
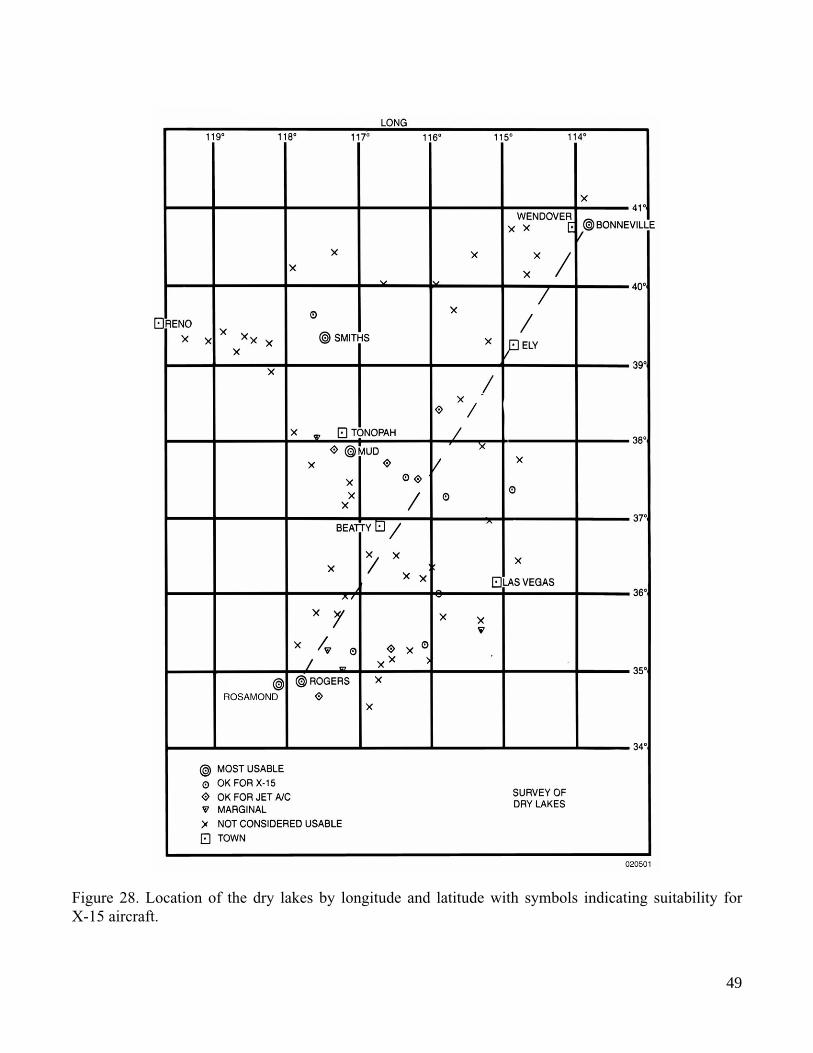
49
Figure 28. Location of the dry lakes by longitude and latitude with symbols indicating suitability forX-15 aircraft.
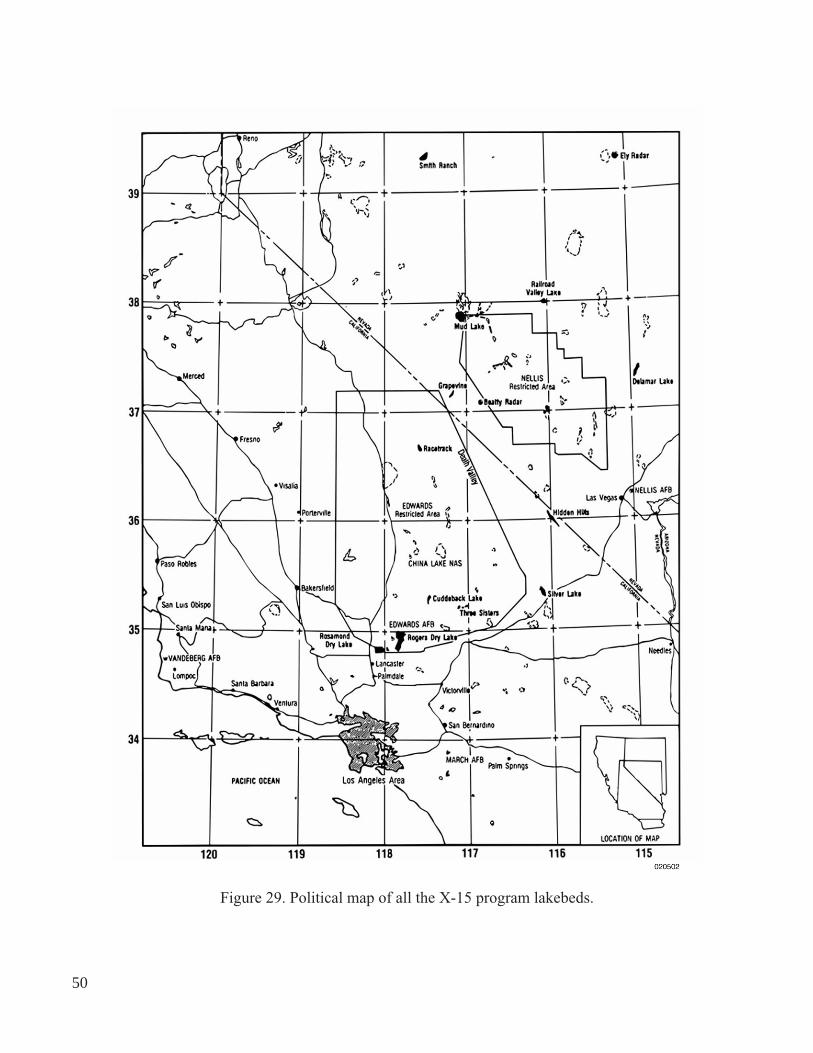
50
Figure 29. Political map of all the X-15 program lakebeds.

51
Air launches were not made directly over the selected launch lake, but usually in-line with the launchlake-to-Rogers trajectory and close enough to the lake to glide to an emergency landing. This extendedthe range for the entire trajectory by approximately 20 miles. For example, the maximum performanceflights shown in table 4, Chapter 4, encompass 305 miles (Smith’s Ranch launch) and 220 miles(Mud Lake launch).
Another energy management problem that placed a vital demand on the High Range radar sprangfrom the fact that remote lakebeds were not at the same altitude as Rogers Dry Lake at Edwards. Highand low key altitudes for remote sites had to be adjusted for the difference. For example, the differencebetween Smith’s Ranch altitude of 6100 ft (highest lake) and Edwards, 2270 ft, is 3830 feet. Consideringthe launch altitude to be 40,000 ft, a failure to light at launch, would make the geometric altitude forEdwards = 37,700 (above nominal high key of 35,000 ft) and for Smith’s Ranch = 33,900 (belownominal high key).
This variation in launch altitude turned out not to be a problem since pilots had practiced straight-inand S-turn approaches since the days of the X-1 aircraft. The altitude difference presented much the sameproblem but was less severe than the altitude overshoots and undershoots at Rogers. However, prior toflight, pilots always flew the F-104A jet aircraft to the designated launch lake for practice approaches. Inaddition to honing energy management, the pilots could become oriented to the mountain terrain andunfamiliar lakebed.
Table 5. High Range dry lake launch sites selected for emergency landings during theX-15 program.
Dry lake Distance, statute miles
Total launches
First launch date
Emergency landings
Rogers 0 8 09/23/60 0
Rosamond 5 18 06/08/59 1
Silver 105 14 05/12/60 1
Hidden Hills 130 50 03/30/61 0
Mud 200 34 05/25/61 4
Delamar 220 62 06/01/62 1
Smith’s Ranch 280 10 07/19/63 1
Railroad Valley 230 2 07/16/68 0
Cuddeback 30 1 11/03/65 2

52
In addition to selecting dry lakes at increasing intervals to satisfy the demands of increasing energyflights, it was fortunate that the lakes were dispersed over a vast area covering three Western states. If onelaunch lake was weathered-in, another might be open. The open lake would be satisfactory for launch aslong as the emergency lakes along the flight corridor were not obscured and the alternate launch site hadbeen considered satisfactory during flight planning.
High Range Legacy and Enduring Value
During the near-decade of X-15 aircraft flight operations, the radar, telemetry, and communicationscapabilities of the High Range successfully served as a link binding the pilot, the aircraft, flightcontrollers, systems engineers, and technicians together to function smoothly as a unit during flightoperations. The prospect of the X-15 aircraft high-energy boost-glide flights created a demand for ProjectHigh Range which in turn served as a model for the fundamentals and logistics of future global range andMission Control Center operations for flights to destinations from Mercury to Mars.
Milton Thompson, who flew many of the X-15 flights and later became DFRC chief engineer,provided an excellent summary of the contributions of the High Range to later space programs:
We were monitoring the same kinds and type of data on the X-15 that NASA iscurrently monitoring on the Space Shuttle. In fact, much of our research aircraftoperational experience at NASA Dryden was passed on to the space programthrough key individuals who transferred to the original Space Task Group,planning for Project Mercury, the first American space venture.
Walt Williams, the first chief of the NASA Dryden Center became the deputy forflight operations. Williams, along with a number of other Dryden personnel whoalso transferred, established a space version of Dryden’s experimental aircrafttest complex. Many of the flight test procedures developed at Dryden wereapplied directly to the Mercury spacecraft flight operation. The man whoconceived and developed the X-15 tracking range, Gerry Truszynski, transferredto NASA headquarters and proceeded to develop the space tracking net and laterthe Deep Space Tracking Network. He subsequently became NASA’s Chief ofTracking and Data Acquisition.11
In addition to serving as a model for early space program operations, the NASA DFRC range site,control center, and Rogers Dry Lake were utilized for the air-launched, subsonic, Shuttle Approach andLanding Tests (ALT) program. The complex also served as the primary landing site for the initial Shuttleflights and still serves as an alternate landing site for Shuttle missions.
During X-15 operations and since, the Range has been periodically upgraded as technologyimproved. The NASA range control station still serves the newer lifting body boost-glide X-model airand spacecraft.

53
CHAPTER 6
THE SPACE SHUTTLE
In the early 1970s NASA was selected to develop the Space Shuttle for a new Space TransportationSystem (STS). After design, manufacture, and subsonic testing of a prototype, the Space Shuttle startedspace launches in the early 1980s.
First Space Transportation System
Background
Some of the original launch studies included bundles of strap-on solid rockets looking much like anoverloaded Russian Vostok. The final launch design consisted of two jettisonable, reusable solid rocketsand a large jettisonable strap-on external tank carrying liquid propellants for the three Space Shuttle mainengines. Shortly after launch, the solid rockets are jettisoned and the external tank provides propellants tojust-short of orbital velocity and is jettisoned. Two intermediate thrust rockets of the orbital maneuveringsystem (OMS) act as the third stage, thrusting the Shuttle into orbit. The OMS also serves for orbitaladjustments, station keeping, and pre-entry retrofire.
The Shuttle spacecraft was originally designed to house two extendible cruise and landing jet engines.Fuel tankage, engine storage, and deployment mechanisms created a structural, weight, and plumbingnightmare making reentry and landing impractical. Many flight tests defining energy management wereperformed at Edwards, California by NACA, NASA, and the AFFTC. The X-15 aircraft had been sosuccessful at hypersonic and extreme altitude energy management and bull’s-eye lakebed runwaylandings—including large anomalous energy deviations—that during a symposium at the Flight ResearchCenter (FRC) in 1970 to discuss flight test results pertaining to the Shuttle, the FRC highly recommendeddeletion of the cruise-landing jet engines.
21
During 1969-70, shortly after the end of the X-15 program,the AFFTC conducted low L/D tests with an F-111A and an NB-52B with L/Ds from 3.2 to 8.0 thatincluded Terminal Area Energy Management (TAEM).
22
These data from NACA, NASA, and AFFTCwere the greatest influences for eliminating the extendible landing-cruise engines, permitting a lighter,less complex structure with more payload capability.
New thermal protection concepts were adopted for the extreme heating of gliding reentry. TheThermal Protection System (TPS) included Reinforced Carbon-Carbon (RCC) for the nosecone andheat-bearing leading edge structures. Lightweight ceramic tiles and coated NOMEX
®
(Dupont,Richmond, Virginia) were located on other heat-bearing surfaces.
23
Figure 30 shows the Space Shuttleconfiguring for a landing.
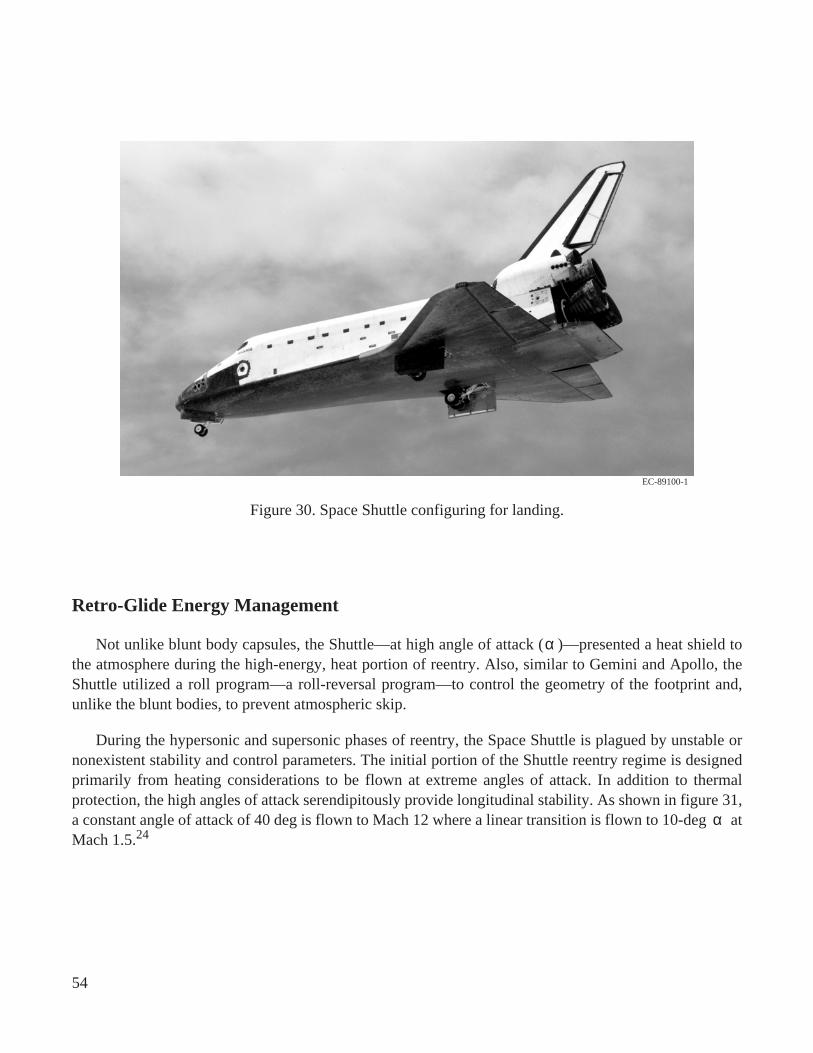
54
Figure 30. Space Shuttle configuring for landing.
Retro-Glide Energy Management
Not unlike blunt body capsules, the Shuttle—at high angle of attack ( )—presented a heat shield tothe atmosphere during the high-energy, heat portion of reentry. Also, similar to Gemini and Apollo, theShuttle utilized a roll program—a roll-reversal program—to control the geometry of the footprint and,unlike the blunt bodies, to prevent atmospheric skip.
During the hypersonic and supersonic phases of reentry, the Space Shuttle is plagued by unstable ornonexistent stability and control parameters. The initial portion of the Shuttle reentry regime is designedprimarily from heating considerations to be flown at extreme angles of attack. In addition to thermalprotection, the high angles of attack serendipitously provide longitudinal stability. As shown in figure 31,a constant angle of attack of 40 deg is flown to Mach 12 where a linear transition is flown to 10-deg atMach 1.5.24
α
α
EC-89100-1

55
Figure 31. Pitching moment coefficient as a function of angle of attack at various Mach numbers for theSpace Shuttle.
The Shuttle, while at a constant of 40 deg, maintains L/D of approximately 1.0 while deceleratingfrom the Mach 25 entry interface to Mach 12. During this period the Shuttle is on the back side of the L/Dversus curve. As the is reduced to 20 deg at Mach 4.0, L/D increases to a maximum of 1.8. As speedenters the transonic range and the is further reduced, the L/D, now on the front side of the curve, isreduced to 1.3 at 6 deg ,25, 26 and the Shuttle enters the Terminal Area Energy Management (TAEM)approach and landing interface.
STS-1 First Orbital Flight—Reentry and Landing at Edwards
The Shuttle Columbia made the first orbital flight. It was launched from the Kennedy Space Center(KSC) April 12, 1981 and landed at Edwards on April 14. Although the Columbia’s approach was fromthe west over the Pacific Ocean—as opposed to the X-15 airplane approaches from the north andeast—the primary station of the High Range, Dryden, was used for the first TAEM entry interface fromorbit by the Shuttle.
The photograph that is figure 32 shows a portion of one of the Dryden mission control roomsduring the approach and landing. The overhead and desk monitors display television of the landingarea of Rogers lakebed, the Shuttle attitude indicator, and various other mission parameters. The largeX-Y recorder, second from right, displays a map of the reentry track from the California coast toEdwards.
M 1.50 M 2.00
2.0 3.0 4.0 5.0 6.0
0 – .04 – .08
50
30
20
10
0
–10
M 2.00
M 3.00M 4.00
M 5.00
M 8.00α,
deg
M 1.50
1.30
1.20
1.10
M 3.00 M 4.00 M 5.00
Pitching moment
Cm 0.65 L8
α,deg
M 8.00 M ≥ 10.00
M ≥ 10.00
M 12+
020503
M ≥ 10.00α schedule
α
α αα
α

56
Figure 32. Portion of one of the Dryden mission control rooms during first Space Shuttle landing, 1981.
As the Shuttle crossed the Pacific coast north of Vandenberg AFB, at approximately Mach 5.5 and atan altitude of 120,000 ft—quite similar in speed, altitude and range to the X-15 aircraft maximum energypost-boost-glides flights—the engineer in front of the recorder would place tick marks on the reentrytrack for each descending Mach number called by the astronauts. It was an eerie feeling to watch the firstreentry Mach numbers and ground track exactly match those predicted and marked on the plot.
ECN-15174

57
REFERENCES
1. Hoey, Robert G. and Richard E. Day, Mission Planning and Operational Procedures for the X-15Airplane, NASA TN D-1159, 1962.
2. Gunston, Bill, The Development of Jet and Turbine Aero Engines, Rockets and Ramjets, HaynesPublishing, Sparkford, Nr Yeovil, Somerset, BA22 7JJ, 1966.
3. Perry, Robert L., The Antecedents of the X-1, The RAND Corporation, Santa Monica, California,P-3154, June 1965.
4. Wooldridge, E. T., Winged Wonders, The Story of the Flying Wings, Smithsonian Institution Press,1985.
5. Begin, Lee, The Northrop Flying Wing Prototypes, The Northrop Corporation, Aircraft Division,Hawthorne California, undated.
6. Day, Richard E. and Jack Fischel, Stability and Control Characteristics Obtained DuringDemonstration of the Douglas X-3 Research Airplane, NACA RM H55E16, 1955.
7. Finch, Thomas W., Gene J. Matranga, Joseph A. Walker, and Neil A. Armstrong, “Flight andAnalog Studies of Landing Techniques.” Conference on the Progress of the X-15 Project,IAS Building, Los Angeles, California, July 28–30, 1958, pp. 83–93.
8. Matranga, Gene J. and Neil A. Armstrong, Approach and Landing Investigation at Lift-Drag Ratiosof 2 to 4 Utilizing a Straight-Wing Fighter Airplane, NASA TM X-31, August 1959, 87H25161,62N71855.
9. Hallion, Richard P., On the Frontier, Flight Research at Dryden, 1946–1981. The NASA HistorySeries, NASA SP-4303, U.S. Government Printing Office, DC, 1984.
10. Day, Richard E. and Donald Reisert, Flight Behavior of the X-2 Research Airplane to a MachNumber of 3.2 and a Geometric Altitude of 126,200 feet, NASA TM X-137, 1959.
11. Thompson, Milton O., At the Edge of Space, The Smithsonian Institution, 1992.
12. Waltman, Gene L., Black Magic and Gremlins: Analog Flight Simulations at NASA’s FlightResearch Center, NASA SP-2000-4520, 2000. Monographs in Aerospace History, No. 20.
13. Saltzman, E. J. and D. J. Garringer, Summary of Full-Scale Lift and Drag Characteristics of the X-15Airplane, NASA TN D-3343, March 1966, 66N19345.
14. Weil, Joseph and Gene J. Matranga, Review of Techniques Applicable to the Recovery of LiftingHypervelocity Vehicles, NASA TM X-334, 1960.
15. Bray, Richard S., Fred J. Drinkwater, and Maurice D. White, A Flight Study of a Power-Off LandingTechnique Applicable to Re-Entry Vehicles, NASA TN D-323, 1960.

58
16. Reisert, Donald and Elmore J. Adkins, “Flight and Operational Experiences with Pilot OperatedReaction Controls,” ARS Journal, April 1962, pp. 626-631.
17. Matranga Gene J., Analysis of X-15 Landing Approach and Flare Characteristics Determined fromthe First 30 Flights, NASA TN D-1057, 1961.
18. Leiby, R. G., D. R. Bellman, and N. E. DeMar, “XLR99 Engine Operating Experience,”Research-Airplane-Committee Report on Conference on the Progress of the X-15 Project, 1961,pp. 215–226, (see N71-75443), 71N75459.
19. Taback, I. and G. M. Truszynski, “Instrumentation for the X-15,” Research-Airplane-CommitteeReport on Conference on the Progress of the X-15 Project, Langley Aeronautical Laboratory,Langley Field, Virginia, October 25–26, 1956, pp. 183–191.
20. Jenkins, Dennis R., Hypersonics Before the Shuttle: A Concise History of the X-15 ResearchAirplane, NASA SP-2000-4518, June 2000. Monographs in History Series, Number 18.
21. Thompson, M. O., Flight Test Results Pertaining to the Space Shuttlecraft—Final Remarks andFuture Plans, Paper 13, October 1970, pp. 147–151.
22. Schofield, Lyle, David F. Richardson, and Major Peter C. Hoag, Terminal Area EnergyManagement, Approach and Landing Investigation for Maneuvering Reentry Vehicles Using F-111Aand NB-52B Aircraft, FTC-TD-70-2, June 1970.
23. Rockwell International, “Aerodynamic Design Data Book,” Orbiter Vehicle 102 (ADDB-1), vol. 1,SD 72-SH-0060-IJ, June 25, 1976.
24. Day, Richard E., Coupling Dynamics in Aircraft: A Historical Perspective, NASA SP-532, May 1997.
25. Preliminary Analysis of STS-1 Entry Flight Data, NASA TM-81363, compiled by the NASADryden Flight Research Center Staff, 1981.
26. Romere, Paul O. and A. M. Whitnah, “Space Shuttle Entry Longitudinal Aerodynamic Comparisonsof Flights 1-4 With Preflight Predictions,” NASA Conference Publication 2283 ShuttlePerformance: Lessons Learned, NASA Langley Research Center, Hampton, Virginia, March 8–10,1983, pp. 283–308.

59
ABOUT THE AUTHOR
Richard E. Day
Before Pearl Harbor, Dick Day volunteered for and flew with the Royal Canadian Air Force. AfterPearl Harbor he transferred to the U.S. Army Air Forces and flew B-17 combat missions in Europe inWorld War II. After the war Dick enrolled at the University of Indiana. In 1951, with a degree in physicsand mathematics in hand, Dick joined the National Advisory Committee for Aeronautics (NACA) at theHigh-Speed Flight Station at Edwards Air Force Base, California, as an aeronautical research engineer.Among his early assignments were the X-1 rocket research aircraft and the XF-92 delta-wing researchairplane
In 1953, Day acquired access to the analog computer owned by the U.S. Air Force at Edwards AirForce Base. He programmed the computer with the characteristics of an airplane (as recorded by thatairplane in flight), then added a control stick and a cathode ray tube which served as a pilot’s display.Thus, he had constructed a rudimentary flight simulator.
Dick soon had the simulator programmed with the characteristics of the Bell X-2 airplane. Data fromthe most recent flight would be programmed into the simulator. Then, the estimated degradation instability due to the proposed next increase in Mach number or angle of attack would be added to theprogram, and the pilot could estimate the controllability that the airplane would exhibit at the predictedflight condition.
Predictions were made for flight 13 of the X-2 that the airplane would experience control reversal ifflown to high angle of attack at a speed in excess of Mach 2.4. On flight 13, the X-2 airplane reachedMach 3.2, a speed much faster than predicted. The pilot may have been concerned that he was flying pasthis landing site (Rogers Lake) at a high rate of speed. A turn was initiated above Mach 2.4, and the angleof attack limit was exceeded. Control reversal ensued, followed by an inertial roll coupling, a pitchup,and a spin. The X-2 airplane was lost and the pilot was killed.
Analysis in the months following the X-2 airplane crash revealed that there was another hazardawaiting the newer, faster rocket research airplanes. The new threat was high energy—high potentialenergy because of the high altitudes the new, fast rocket airplanes were able to achieve, and high kineticenergy resulting from the high speeds.
The lower-powered rocket airplanes that preceded the X-2 airplane had not required a “launch lake”;that is, a dry lake that could be reached safely for landing if the rocket engine did not light. Their launchlake was also their destination (Rogers Dry Lake). With flight 13 of the X-2 airplane the aeronauticalcommunity had outgrown the “one lake” concept when planning rocket aircraft flights.
Soon, the X-15 aircraft was in its speed-altitude buildup, and as the maximum speed of its flightsincreased, the simulator indicated that the X-15 aircraft could no longer get back to the lake it launchedover. Using the simulator, Dick planned a flight that used both a launch lake (Silver Lake) and thedestination lake (Rogers Lake). This pair, with the launch lake 100 nmi from Edwards, filled the rangerequirements for X-15 aircraft flights that went to speeds slightly over Mach 3. For faster flights, Daywas able to move the launch out to 200 nmi or even farther. As the flight distances grew longer, therequired number of dry lakes increased. An X-15 aircraft launched at Silver Lake might attain a speed

60
less than that required to glide all the way to Edwards, but too fast to turn back and reach Silver Lake. Inorder to use Silver Lake as a launch lake, the flight planner had to find a suitable lake along the route offlight that the X-15 airplane could reach after flying out of range of the launch lake and before it couldreach Edwards. Some of the long range X-15 aircraft flights required, in addition to the launch lake anddestination, three intermediate dry lakes, in order to ensure a landing site, no matter what maximumspeed was reached.
With the subject of high-speed aircraft energy management understood, Dick moved on to otherchallenges. Dick’s friend and the former director of the High-Speed Flight Station, Walt Williams, wasDirector of Operations for Project Mercury at Houston, Texas. Williams knew Dick’s capabilities fromtheir work together at Edwards, and in 1962 persuaded him to take the job of Assistant Division Chief forAstronaut Training in the Mercury Project. There, in addition to training astronauts on the simulator, hewrote astronaut tests, served on the astronaut selection board, and devised training programs. One of thesubjects taught to the astronauts was energy management.
Dick left NASA in 1964 to join the Aerospace Corporation (El Segundo, California) and work on theManned Orbiting Laboratory (MOL). His position was Director of Operations. One of the areas under hisoversight was astronaut training. When the Manned Orbiting Laboratory was canceled in 1969, Dick leftthe Aerospace Corporation and worked in a variety of positions in the aerospace private sector.He worked on diverse test programs that included serving as chief aerodynamicist and flight test engineeron the Super Guppy, a C-97 aircraft modified to air-transport segments of large rocket boosters.
In 1975, the High-Speed Flight Station (now renamed the NASA Dryden Flight Research Center)asked Dick to return, to work in Space Shuttle simulation. Dick has worked here as a civil servant orcontract engineer ever since.
Dick Day has worked in almost every area of aeronautics and astronautics. His writings are alwayseducational and interesting.
Energy Management of Manned Boost-Glide Vehicles: A HistoricalPerspective
maintains the standard.
William H. DanaNASA Dryden Flight Research CenterEdwards, CaliforniaApril 24, 2002
REPORT DOCUMENTATION PAGE Form ApprovedOMB No. 0704-0188
Public reporting burden for this collection of information is estimated to average 1 hour per response, including the time for reviewing instructions, searching existing data sources, gathering andmaintaining the data needed, and completing and reviewing the collection of information. Send comments regarding this burden estimate or any other aspect of this collection of information,including suggestions for reducing this burden, to Washington Headquarters Services, Directorate for Information Operations and Reports, 1215 Jefferson Davis Highway, Suite 1204, Arlington,VA 22202-4302, and to the Office of Management and Budget, Paperwork Reduction Project (0704-0188), Washington, DC 20503.
1. AGENCY USE ONLY (Leave blank) 2. REPORT DATE 3. REPORT TYPE AND DATES COVERED
4. TITLE AND SUBTITLE 5. FUNDING NUMBERS
6. AUTHOR(S)
8. PERFORMING ORGANIZATION REPORT NUMBER
7. PERFORMING ORGANIZATION NAME(S) AND ADDRESS(ES)
9. SPONSORING/MONITORING AGENCY NAME(S) AND ADDRESS(ES) 10. SPONSORING/MONITORING AGENCY REPORT NUMBER
11. SUPPLEMENTARY NOTES
12a. DISTRIBUTION/AVAILABILITY STATEMENT 12b. DISTRIBUTION CODE
13. ABSTRACT (Maximum 200 words)
14. SUBJECT TERMS 15. NUMBER OF PAGES
16. PRICE CODE
17. SECURITY CLASSIFICATION OF REPORT
18. SECURITY CLASSIFICATION OF THIS PAGE
19. SECURITY CLASSIFICATION OF ABSTRACT
20. LIMITATION OF ABSTRACT
NSN 7540-01-280-5500 Standard Form 298 (Rev. 2-89)Prescribed by ANSI Std. Z39-18298-102
Energy Management of Manned Boost-Glide Vehicles: A Historical Perspective
036-00-00-GM-T T-00-HIS
Richard E. Day
NASA Dryden Flight Research CenterP.O. Box 273Edwards, California 93523-0273
H-2494
National Aeronautics and Space AdministrationWashington, DC 20546-0001 NASA/TP-2004-212037
As flight progressed from propellers to jets to rockets, the propulsive energy grew exponentially. With thedevelopment of rocket-only boosted vehicles, energy management of these boost-gliders became a distinctrequirement for the unpowered return to base, alternate landing site, or water-parachute landing, starting withthe X-series rocket aircraft and terminating with the present-day Shuttle. The problem presented hereconsists of: speed (kinetic energy)—altitude (potential energy)—steep glide angles created by low lift-to-dragratios (L/D)—distance to landing site—and the bothersome effects of the atmospheric characteristics varyingwith altitude. The primary discussion regards post-boost, stabilized glides; however, the effects of centrifugaland geopotential acceleration are discussed as well. The aircraft and spacecraft discussed here are the X-1, X-2,X-15, and the Shuttle; and to a lesser, comparative extent, Mercury, Gemini, Apollo, and lifting bodies. Thefootprints, landfalls, and methods developed for energy management are also described. The essential toolsrequired for energy management—simulator planning, instrumentation, radar, telemetry, extended land or waterrange, Mission Control Center (with specialist controllers), and emergency alternate landing sites—were firstestablished through development of early concepts and were then validated by research flight tests.
Approach and landing, Energy management, History of rocket aircraft,Mission control center, Rocket propulsion
73
Unclassified Unclassified Unclassified Unlimited
May 2004 Technical Publication
Unclassified—UnlimitedSubject Category 05
This report is available at http://www.dfrc.nasa.gov/DTRS/