energy management 2018 29 –31 aug’2018 · 1 welcome to 19th national award for excellence in...
TRANSCRIPT
1
WELCOME
TO
19TH NATIONAL AWARD FOR EXCELLENCE IN
ENERGY MANAGEMENT 2018
29 – 31 Aug’2018
Presenters
Thejraj B
Nagendra H R
Jafar Husen
VIKRANT TYRE PLANT, MYSURU. KARNATAKA
2
1. PLANT / UNIT INTRODUCTION
Late Lala
Juggilal Singhania
Late Lala
Kamlapat Singhania
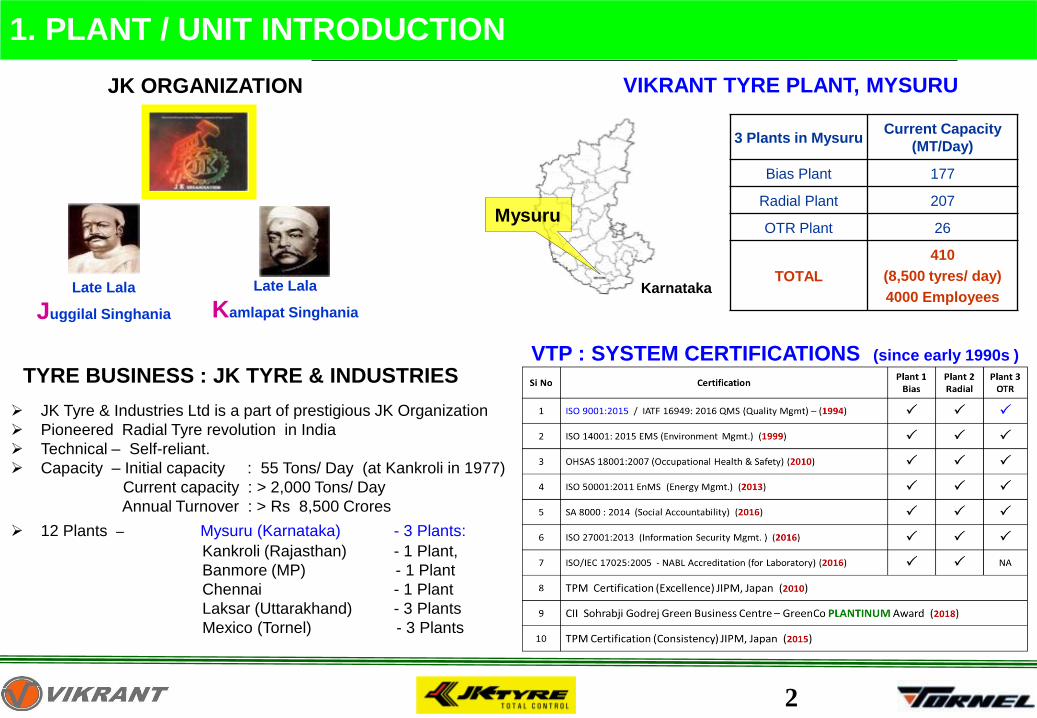
JK ORGANIZATION
TYRE BUSINESS : JK TYRE & INDUSTRIES
➢ JK Tyre & Industries Ltd is a part of prestigious JK Organization
➢ Pioneered Radial Tyre revolution in India
➢ Technical – Self-reliant.
➢ Capacity – Initial capacity : 55 Tons/ Day (at Kankroli in 1977)
Current capacity : > 2,000 Tons/ Day
Annual Turnover : > Rs 8,500 Crores
➢ 12 Plants – Mysuru (Karnataka) - 3 Plants:
Kankroli (Rajasthan) - 1 Plant,
Banmore (MP) - 1 Plant
Chennai - 1 Plant
Laksar (Uttarakhand) - 3 Plants
Mexico (Tornel) - 3 Plants
Mysuru
Karnataka
3 Plants in MysuruCurrent Capacity
(MT/Day)
Bias Plant 177
Radial Plant 207
OTR Plant 26
TOTAL
410
(8,500 tyres/ day)
4000 Employees
VIKRANT TYRE PLANT, MYSURU
VTP : SYSTEM CERTIFICATIONS (since early 1990s )
3
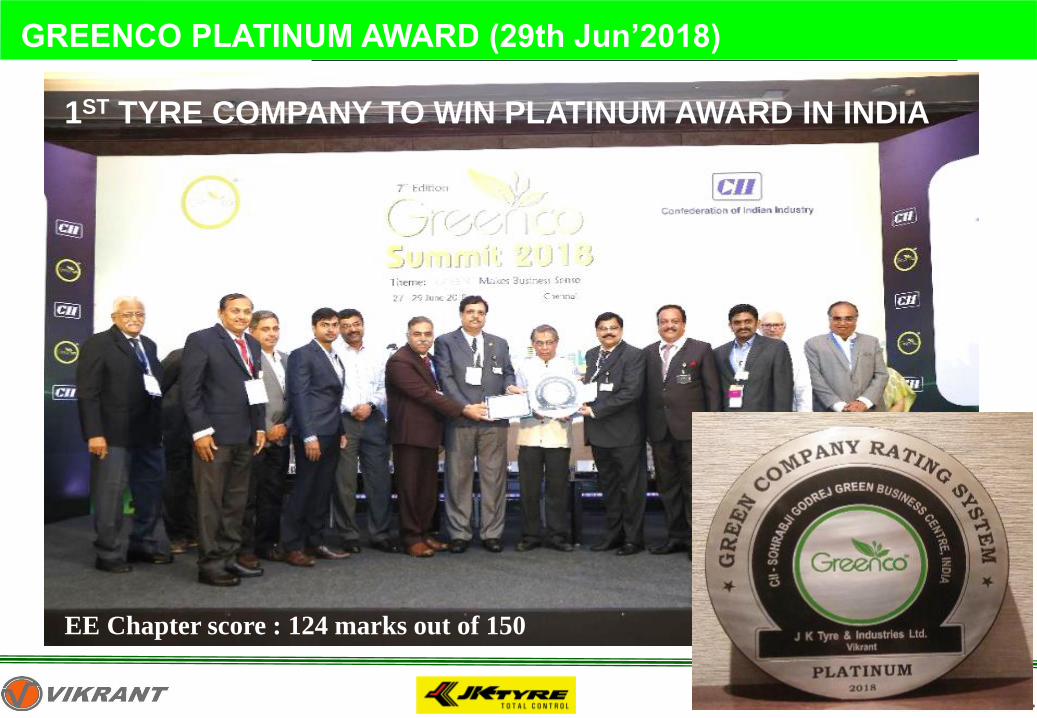
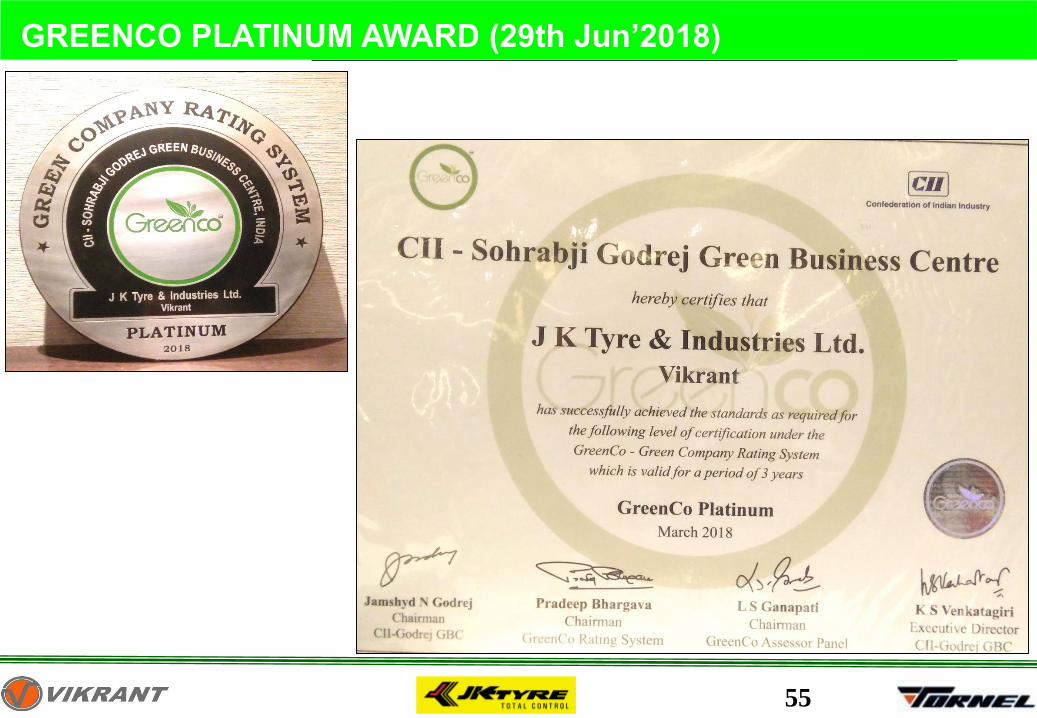
GREENCO PLATINUM AWARD (29th Jun’2018)
1ST TYRE COMPANY TO WIN PLATINUM AWARD IN INDIA
EE Chapter score : 124 marks out of 150
4
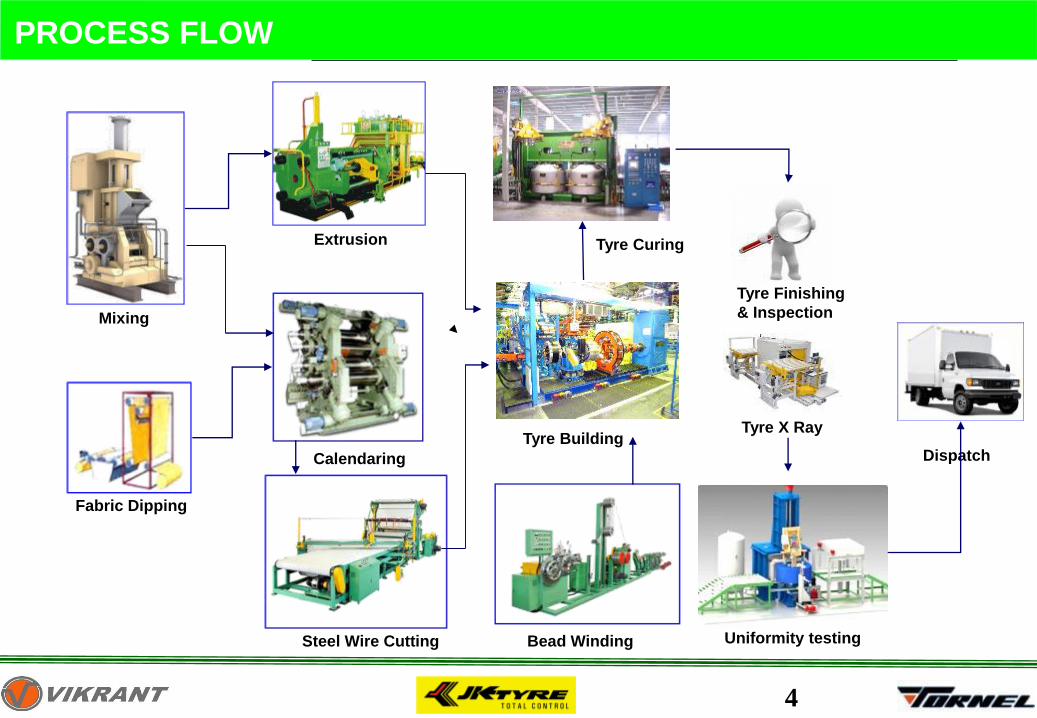
PROCESS FLOW
Mixing
Fabric Dipping
Calendaring
Extrusion
Tyre Building
Tyre Curing
Bead Winding Uniformity testing
Dispatch
Steel Wire Cutting
Tyre X Ray
Tyre Finishing
& Inspection
5
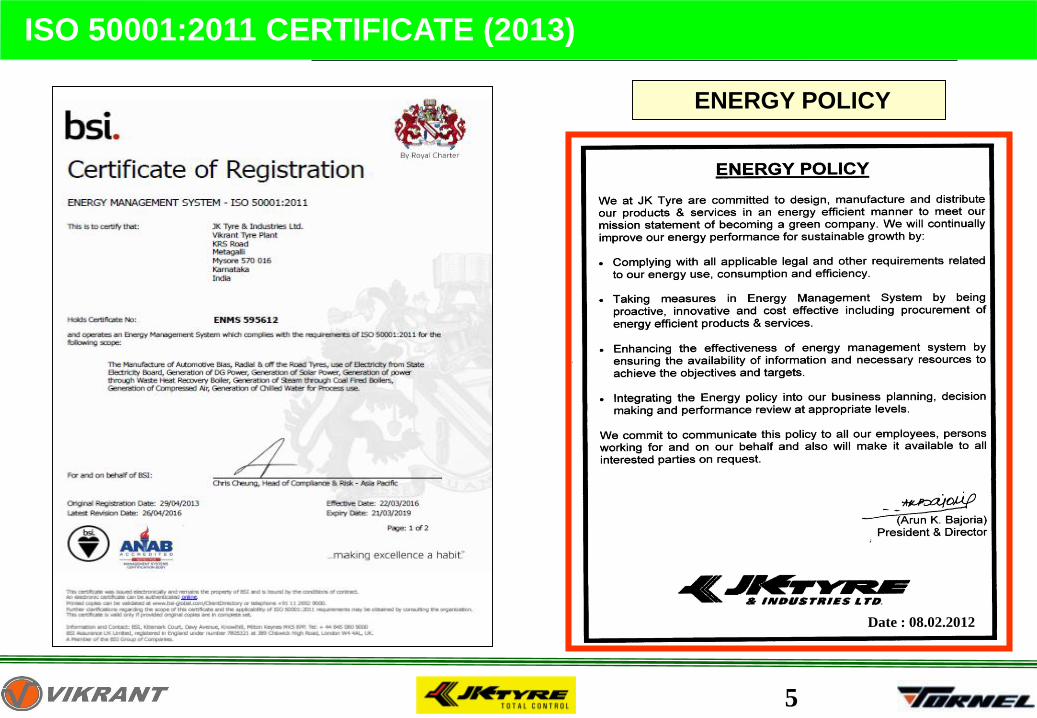
ISO 50001:2011 CERTIFICATE (2013)
ENERGY POLICY
Date : 08.02.2012
6
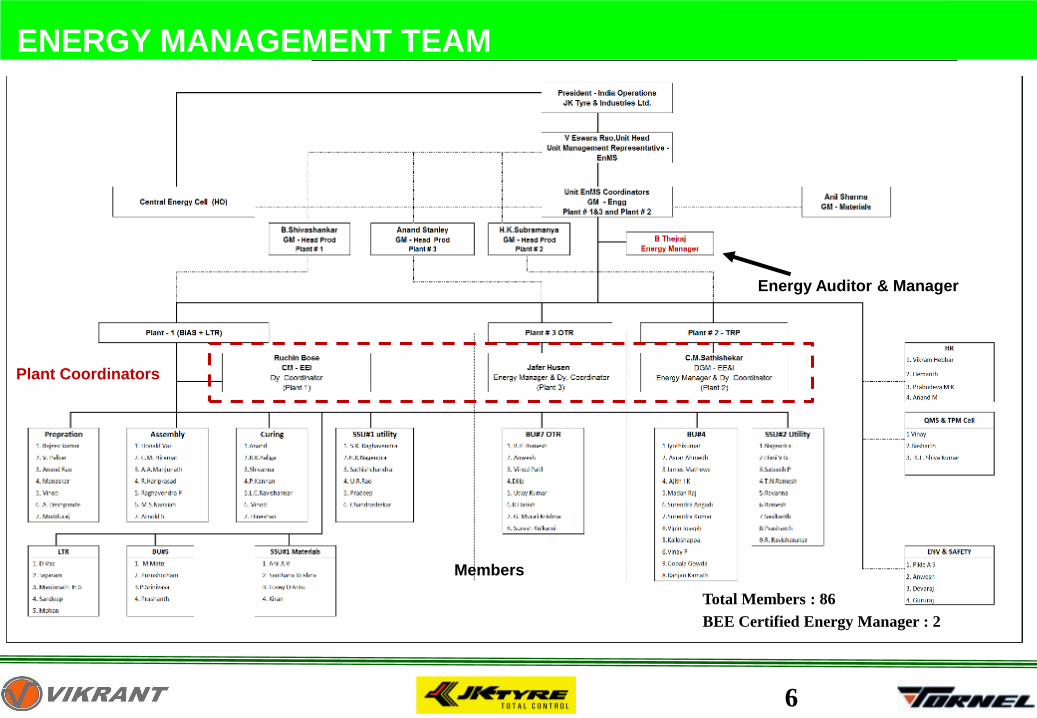
ENERGY MANAGEMENT TEAM
Energy Auditor & Manager
Plant Coordinators
Members
Total Members : 86
BEE Certified Energy Manager : 2
7
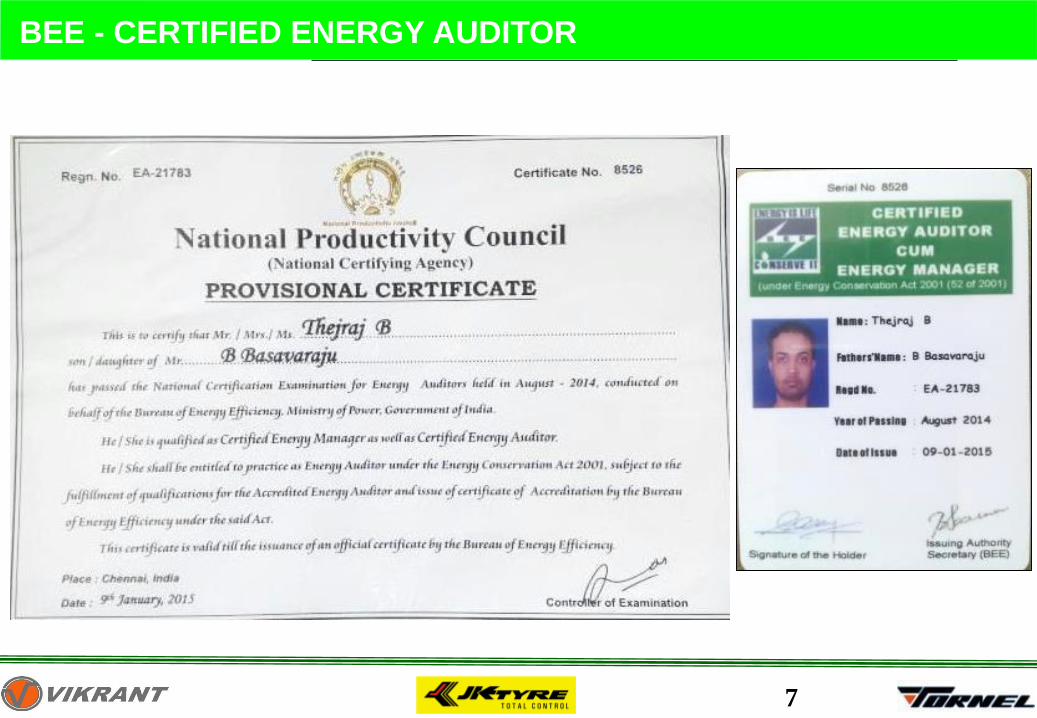
BEE - CERTIFIED ENERGY AUDITOR
8
2. PLANT ENERGY PERFORMANCE –
SEC FOR LAST 3 YEARS
9
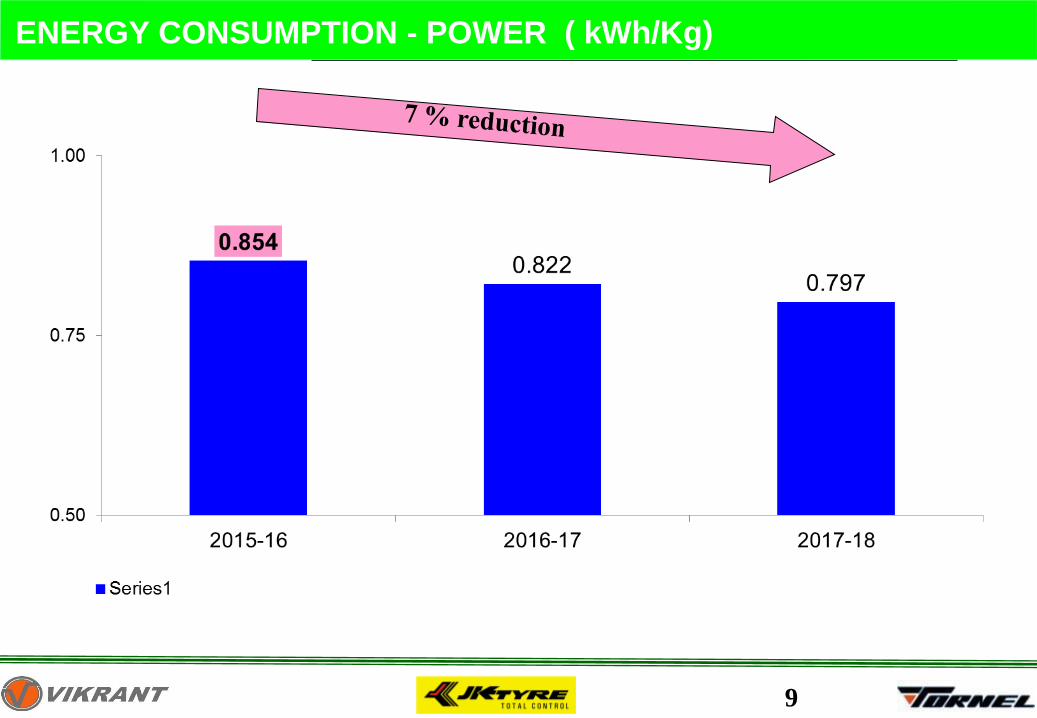
ENERGY CONSUMPTION - POWER ( kWh/Kg)
10
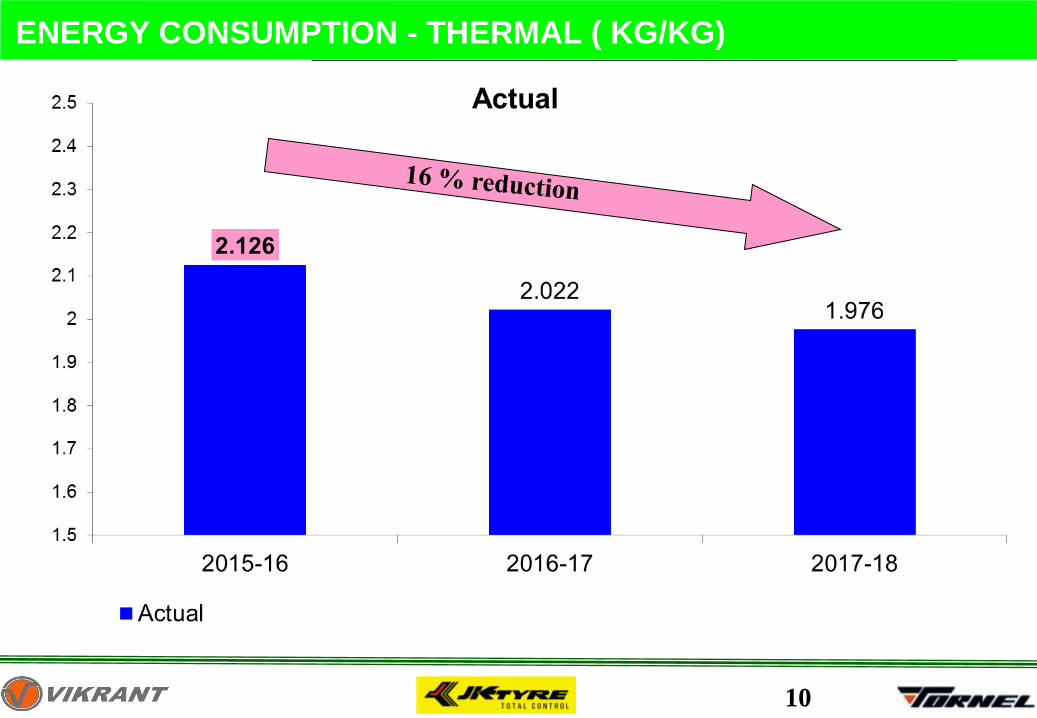
ENERGY CONSUMPTION - THERMAL ( KG/KG)
11
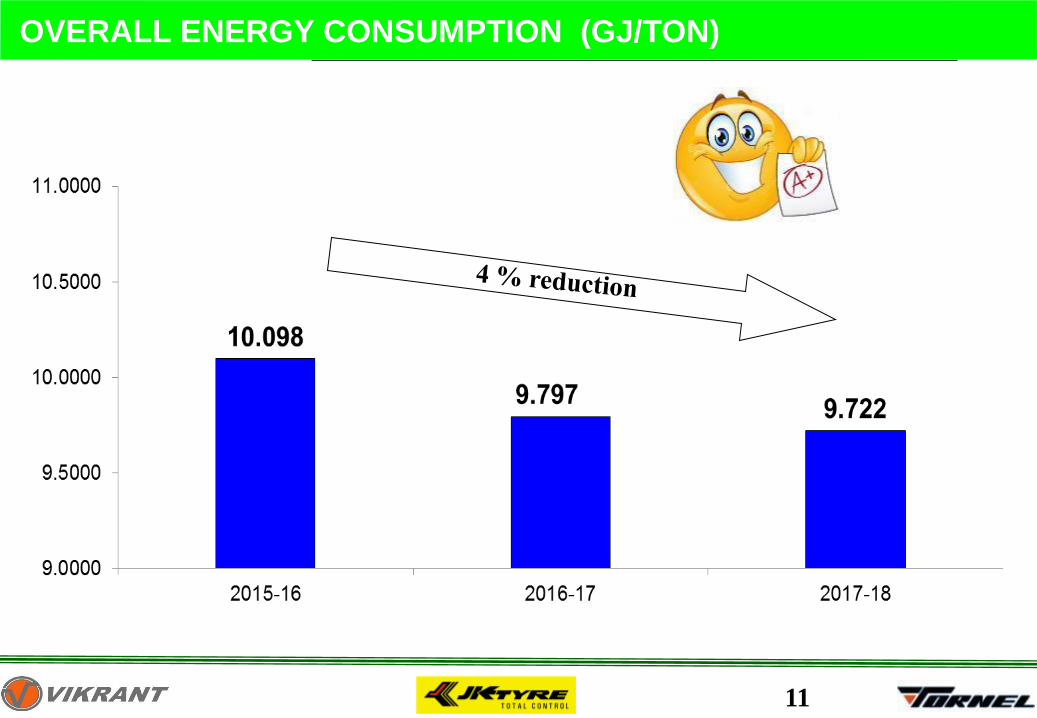
OVERALL ENERGY CONSUMPTION (GJ/TON)
12
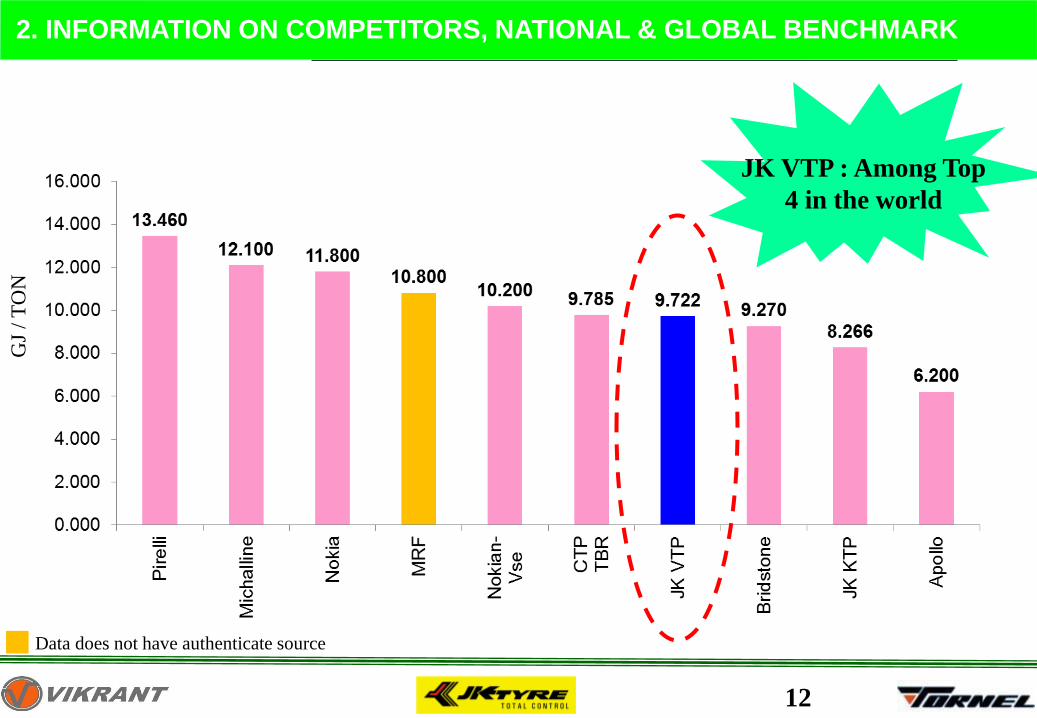
Data does not have authenticate source
JK VTP : Among Top
4 in the world
GJ
/ T
ON
2. INFORMATION ON COMPETITORS, NATIONAL & GLOBAL BENCHMARK
13
3. ENERGY SAVING PROJECTS IMPLEMENTED
14
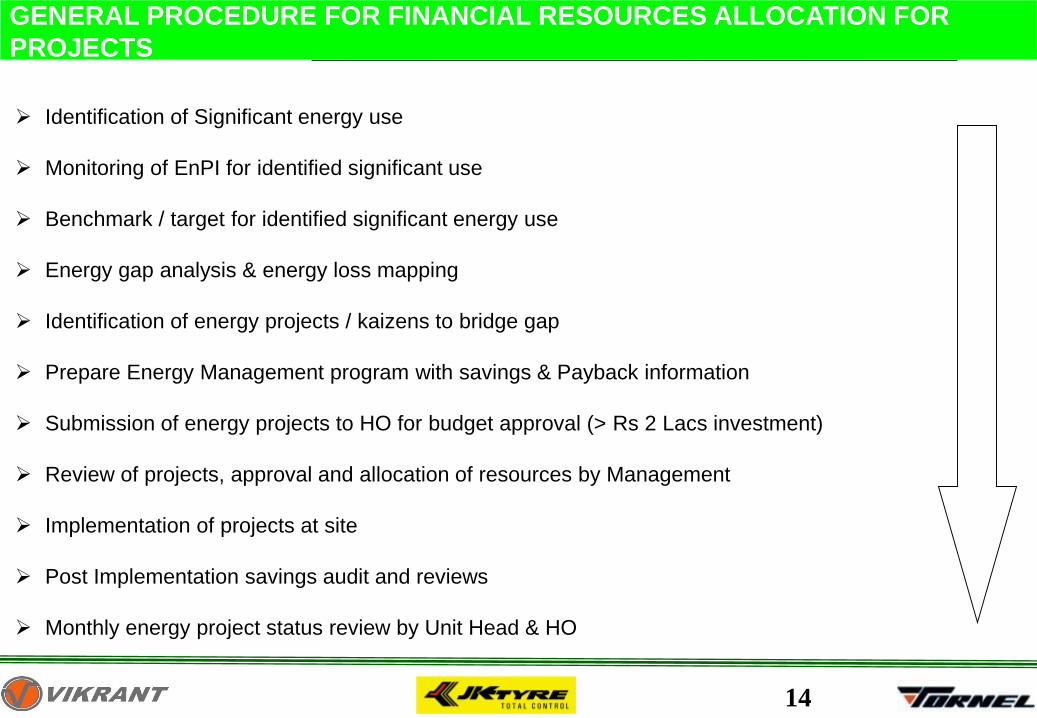
GENERAL PROCEDURE FOR FINANCIAL RESOURCES ALLOCATION FOR
PROJECTS
➢ Identification of Significant energy use
➢ Monitoring of EnPI for identified significant use
➢ Benchmark / target for identified significant energy use
➢ Energy gap analysis & energy loss mapping
➢ Identification of energy projects / kaizens to bridge gap
➢ Prepare Energy Management program with savings & Payback information
➢ Submission of energy projects to HO for budget approval (> Rs 2 Lacs investment)
➢ Review of projects, approval and allocation of resources by Management
➢ Implementation of projects at site
➢ Post Implementation savings audit and reviews
➢ Monthly energy project status review by Unit Head & HO
15
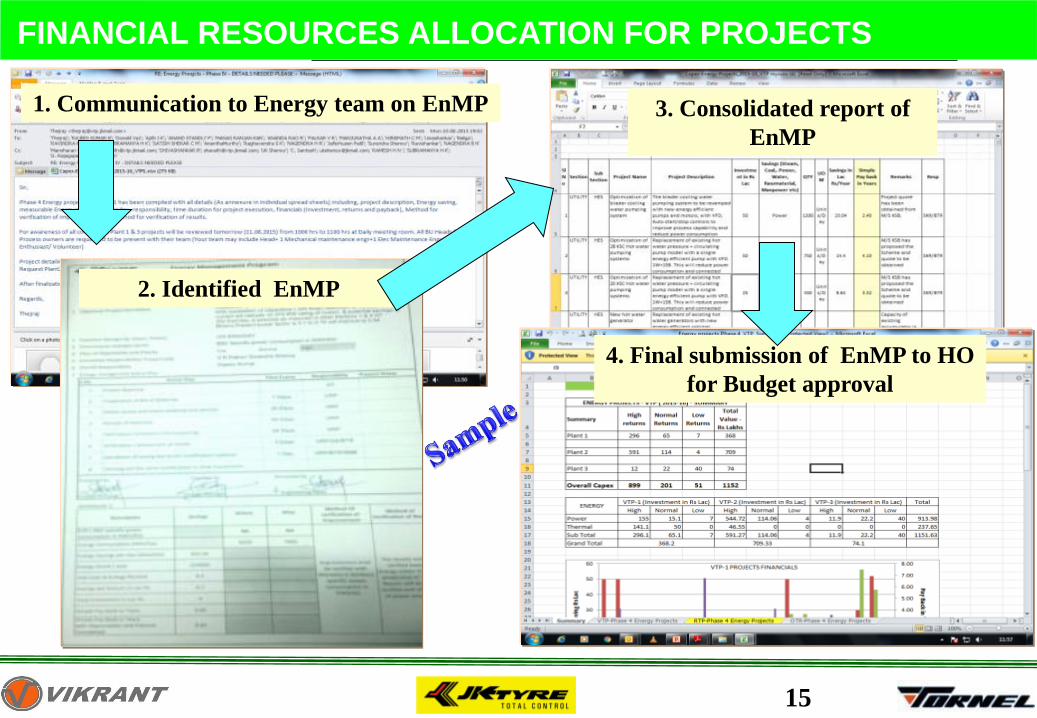
FINANCIAL RESOURCES ALLOCATION FOR PROJECTS
1. Communication to Energy team on EnMP
2. Identified EnMP
3. Consolidated report of
EnMP
4. Final submission of EnMP to HO
for Budget approval
16
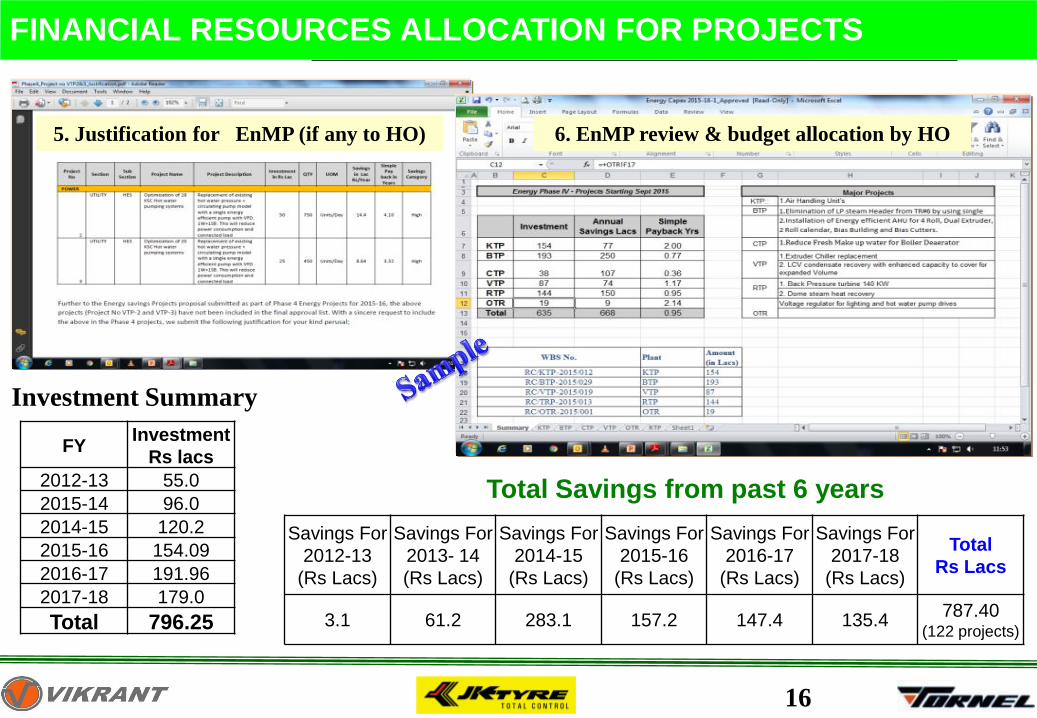
FINANCIAL RESOURCES ALLOCATION FOR PROJECTS
FYInvestment
Rs lacs
2012-13 55.0
2015-14 96.0
2014-15 120.2
2015-16 154.09
2016-17 191.96
2017-18 179.0
Total 796.25
Investment Summary
5. Justification for EnMP (if any to HO) 6. EnMP review & budget allocation by HO
Savings For
2012-13
(Rs Lacs)
Savings For
2013- 14
(Rs Lacs)
Savings For
2014-15
(Rs Lacs)
Savings For
2015-16
(Rs Lacs)
Savings For
2016-17
(Rs Lacs)
Savings For
2017-18
(Rs Lacs)
Total
Rs Lacs
3.1 61.2 283.1 157.2 147.4 135.4787.40
(122 projects)
Total Savings from past 6 years
17
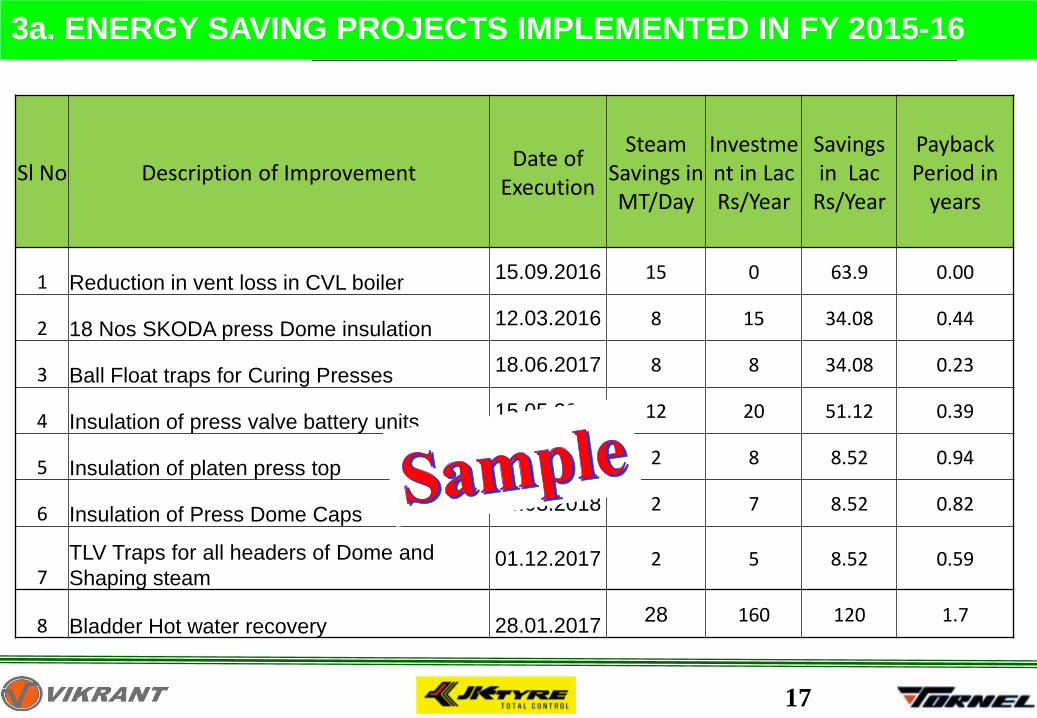
3a. ENERGY SAVING PROJECTS IMPLEMENTED IN FY 2015-16
Sl No Description of ImprovementDate of
Execution
Steam Savings in MT/Day
Investment in Lac Rs/Year
Savings in Lac
Rs/Year
Payback Period in
years
1 Reduction in vent loss in CVL boiler 15.09.2016 15 0 63.9 0.00
2 18 Nos SKODA press Dome insulation 12.03.2016 8 15 34.08 0.44
3 Ball Float traps for Curing Presses18.06.2017 8 8 34.08 0.23
4 Insulation of press valve battery units15.05.2017 12 20 51.12 0.39
5 Insulation of platen press top6.12.2017 2 8 8.52 0.94
6 Insulation of Press Dome Caps24.03.2018 2 7 8.52 0.82
7TLV Traps for all headers of Dome and
Shaping steam01.12.2017 2 5 8.52 0.59
8 Bladder Hot water recovery 28.01.201728 160 120 1.7
18
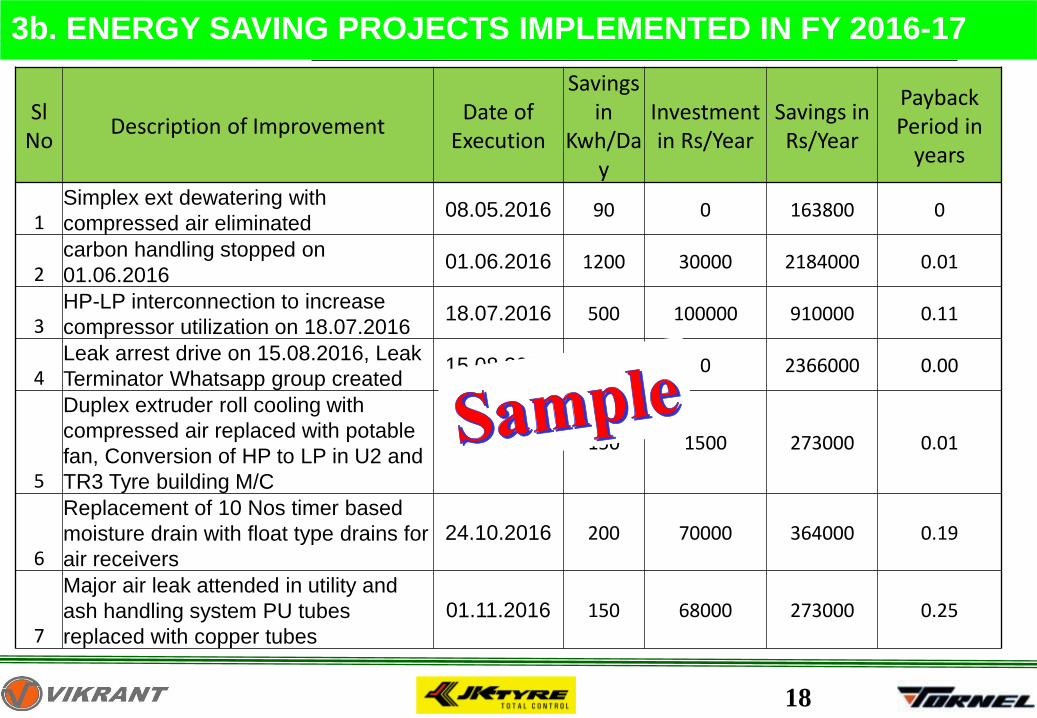
3b. ENERGY SAVING PROJECTS IMPLEMENTED IN FY 2016-17
SlNo
Description of ImprovementDate of
Execution
Savings in
Kwh/Day
Investment in Rs/Year
Savings in Rs/Year
Payback Period in
years
1Simplex ext dewatering with
compressed air eliminated08.05.2016 90 0 163800 0
2carbon handling stopped on
01.06.201601.06.2016 1200 30000 2184000 0.01
3HP-LP interconnection to increase
compressor utilization on 18.07.201618.07.2016 500 100000 910000 0.11
4Leak arrest drive on 15.08.2016, Leak
Terminator Whatsapp group created15.08.2016 1300 0 2366000 0.00
5
Duplex extruder roll cooling with
compressed air replaced with potable
fan, Conversion of HP to LP in U2 and
TR3 Tyre building M/C
6.09.2016 150 1500 273000 0.01
6
Replacement of 10 Nos timer based
moisture drain with float type drains for
air receivers
24.10.2016 200 70000 364000 0.19
7
Major air leak attended in utility and
ash handling system PU tubes
replaced with copper tubes
01.11.2016 150 68000 273000 0.25
19
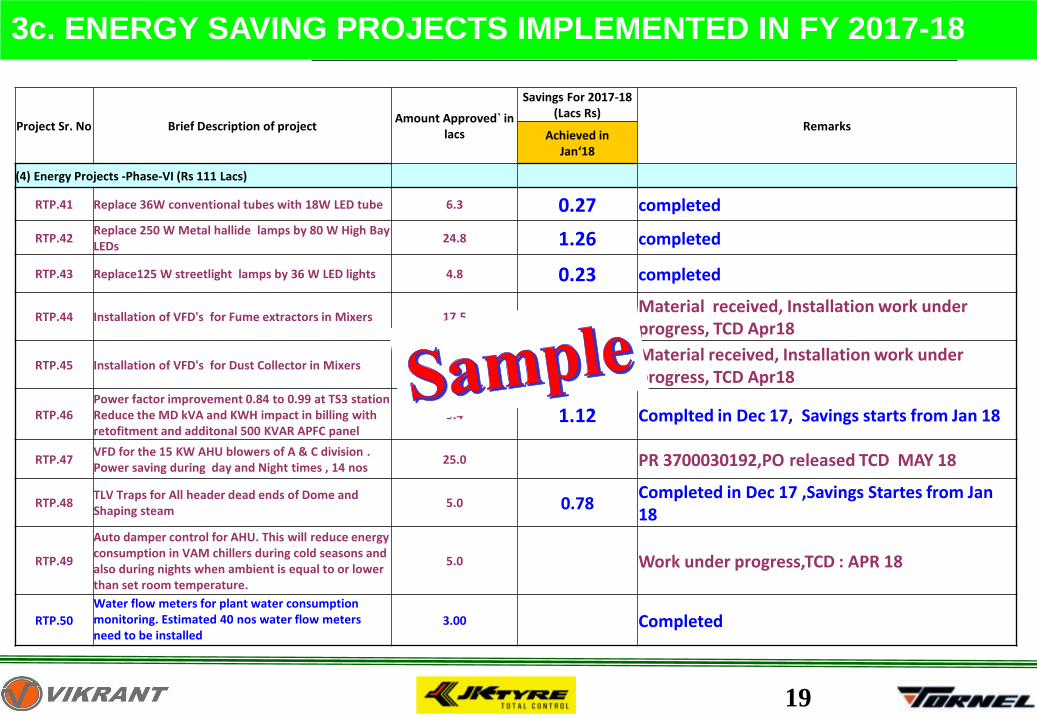
3c. ENERGY SAVING PROJECTS IMPLEMENTED IN FY 2017-18
Project Sr. No Brief Description of projectAmount Approved` in
lacs
Savings For 2017-18 (Lacs Rs)
RemarksAchieved in
Jan‘18
(4) Energy Projects -Phase-VI (Rs 111 Lacs)
RTP.41 Replace 36W conventional tubes with 18W LED tube 6.3 0.27 completed
RTP.42Replace 250 W Metal hallide lamps by 80 W High Bay LEDs
24.8 1.26 completed
RTP.43 Replace125 W streetlight lamps by 36 W LED lights 4.8 0.23 completed
RTP.44 Installation of VFD's for Fume extractors in Mixers 17.5Material received, Installation work under progress, TCD Apr18
RTP.45 Installation of VFD's for Dust Collector in Mixers 10.5Material received, Installation work under progress, TCD Apr18
RTP.46Power factor improvement 0.84 to 0.99 at TS3 station Reduce the MD kVA and KWH impact in billing with retofitment and additonal 500 KVAR APFC panel
9.4 1.12 Complted in Dec 17, Savings starts from Jan 18
RTP.47VFD for the 15 KW AHU blowers of A & C division . Power saving during day and Night times , 14 nos
25.0 PR 3700030192,PO released TCD MAY 18
RTP.48TLV Traps for All header dead ends of Dome and Shaping steam
5.0 0.78Completed in Dec 17 ,Savings Startes from Jan 18
RTP.49
Auto damper control for AHU. This will reduce energy consumption in VAM chillers during cold seasons and also during nights when ambient is equal to or lower than set room temperature.
5.0 Work under progress,TCD : APR 18
RTP.50
Water flow meters for plant water consumption monitoring. Estimated 40 nos water flow meters need to be installed
3.00 Completed
20
4. INNOVATIVE PROJECTS IMPLEMENTED
21
INNOVATIVE PROJECT : ENERGY
22
INNOVATIVE PROJECT : ENERGY
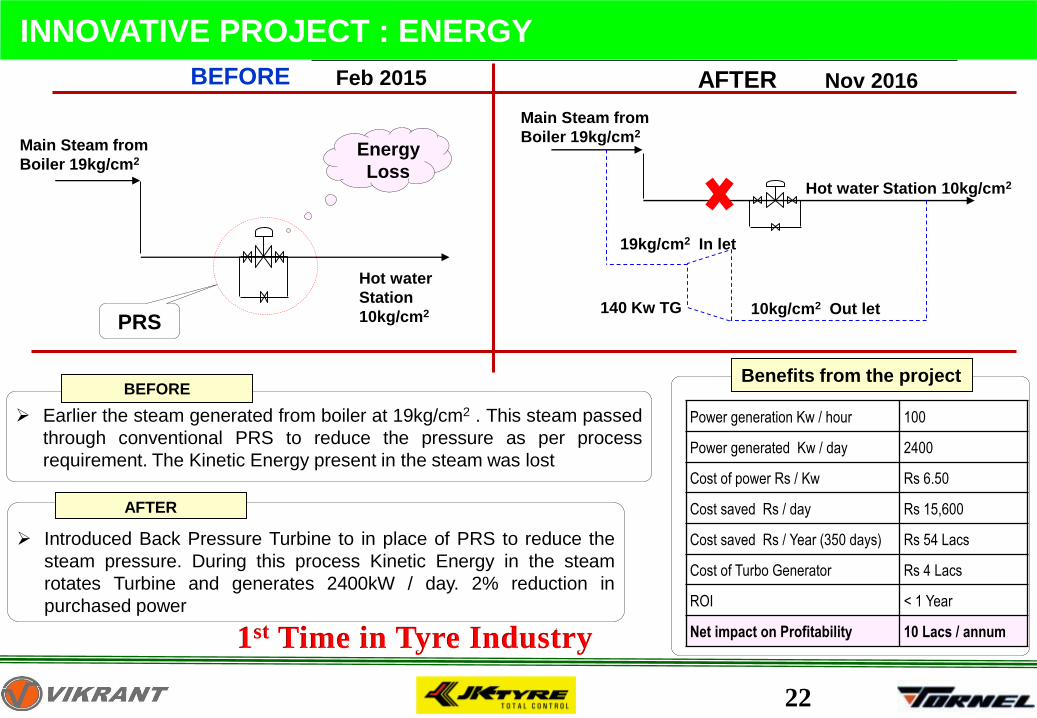
Power generation Kw / hour 100
Power generated Kw / day 2400
Cost of power Rs / Kw Rs 6.50
Cost saved Rs / day Rs 15,600
Cost saved Rs / Year (350 days) Rs 54 Lacs
Cost of Turbo Generator Rs 4 Lacs
ROI < 1 Year
Net impact on Profitability 10 Lacs / annum
Main Steam from
Boiler 19kg/cm2
Hot water
Station
10kg/cm2
Energy
Loss
Main Steam from
Boiler 19kg/cm2
Hot water Station 10kg/cm2
140 Kw TG 10kg/cm2 Out let
19kg/cm2 In let
BEFORE AFTERFeb 2015 Nov 2016
Benefits from the project
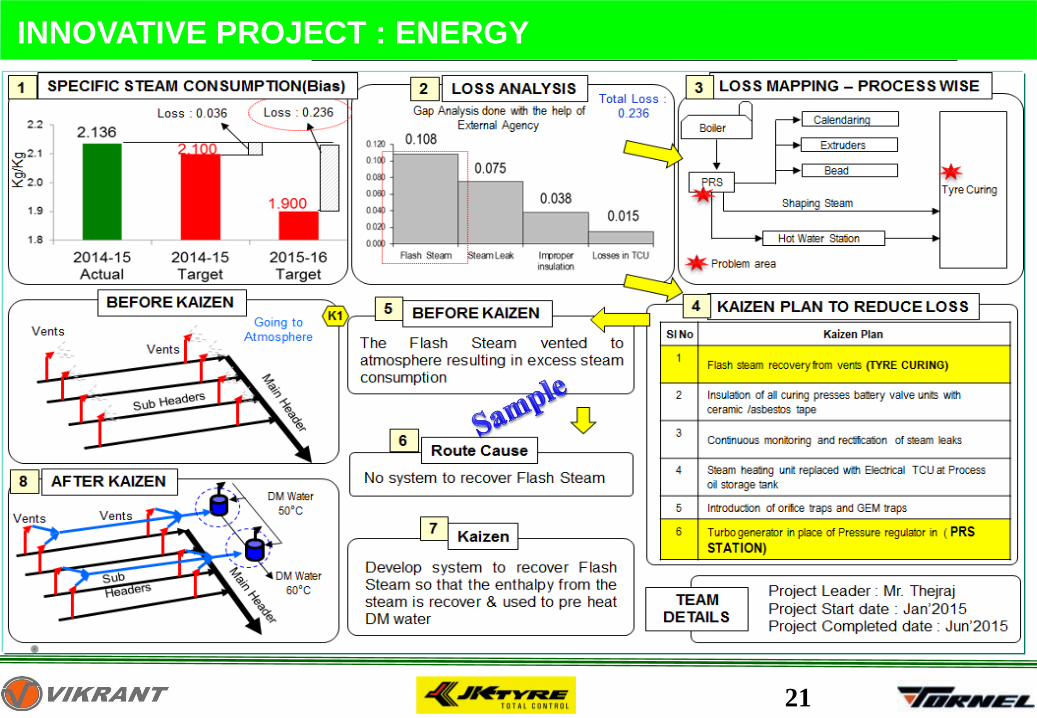
➢ Earlier the steam generated from boiler at 19kg/cm2 . This steam passed
through conventional PRS to reduce the pressure as per process
requirement. The Kinetic Energy present in the steam was lost
BEFORE
PRS
➢ Introduced Back Pressure Turbine to in place of PRS to reduce the
steam pressure. During this process Kinetic Energy in the steam
rotates Turbine and generates 2400kW / day. 2% reduction in
purchased power
AFTER
1st Time in Tyre Industry
23
ENERGY PROJECT – MOULD CONTAINER INSULATION
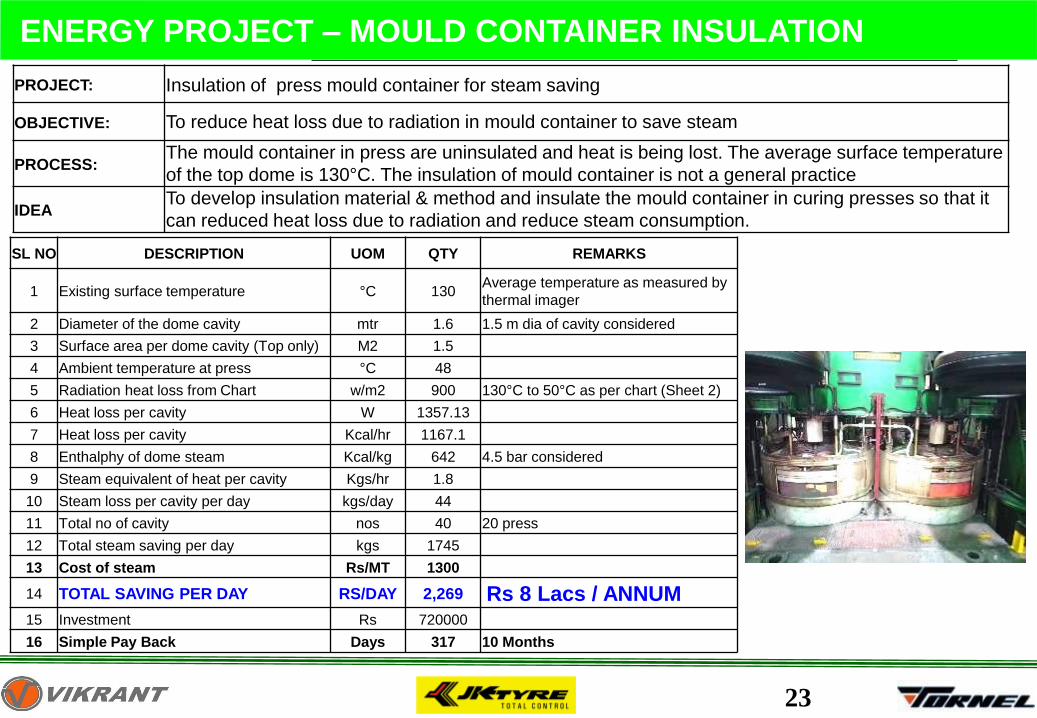
PROJECT: Insulation of press mould container for steam saving
OBJECTIVE: To reduce heat loss due to radiation in mould container to save steam
PROCESS:The mould container in press are uninsulated and heat is being lost. The average surface temperature
of the top dome is 130°C. The insulation of mould container is not a general practice
IDEATo develop insulation material & method and insulate the mould container in curing presses so that it
can reduced heat loss due to radiation and reduce steam consumption.
SL NO DESCRIPTION UOM QTY REMARKS
1 Existing surface temperature °C 130Average temperature as measured by
thermal imager
2 Diameter of the dome cavity mtr 1.6 1.5 m dia of cavity considered
3 Surface area per dome cavity (Top only) M2 1.5
4 Ambient temperature at press °C 48
5 Radiation heat loss from Chart w/m2 900 130°C to 50°C as per chart (Sheet 2)
6 Heat loss per cavity W 1357.13
7 Heat loss per cavity Kcal/hr 1167.1
8 Enthalphy of dome steam Kcal/kg 642 4.5 bar considered
9 Steam equivalent of heat per cavity Kgs/hr 1.8
10 Steam loss per cavity per day kgs/day 44
11 Total no of cavity nos 40 20 press
12 Total steam saving per day kgs 1745
13 Cost of steam Rs/MT 1300
14 TOTAL SAVING PER DAY RS/DAY 2,269 Rs 8 Lacs / ANNUM15 Investment Rs 720000
16 Simple Pay Back Days 317 10 Months
24
ENERGY PROJECT – MOULD CONTAINER INSULATION
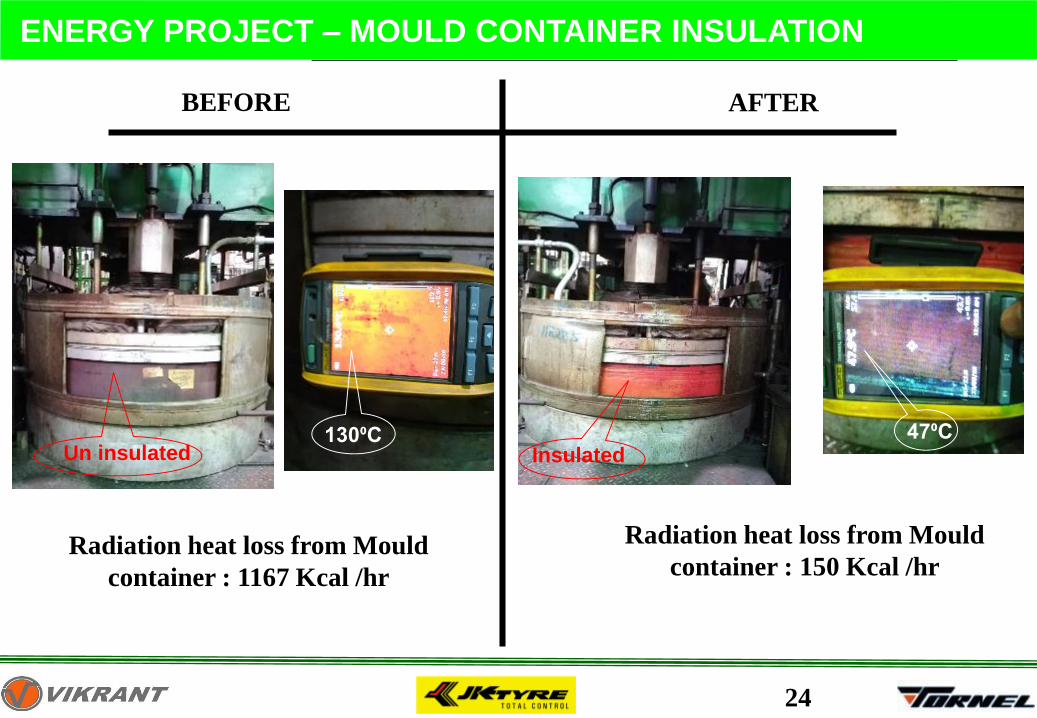
BEFORE AFTER
Radiation heat loss from Mould
container : 1167 Kcal /hr
Radiation heat loss from Mould
container : 150 Kcal /hr
130⁰C 47⁰CUn insulated Insulated
25
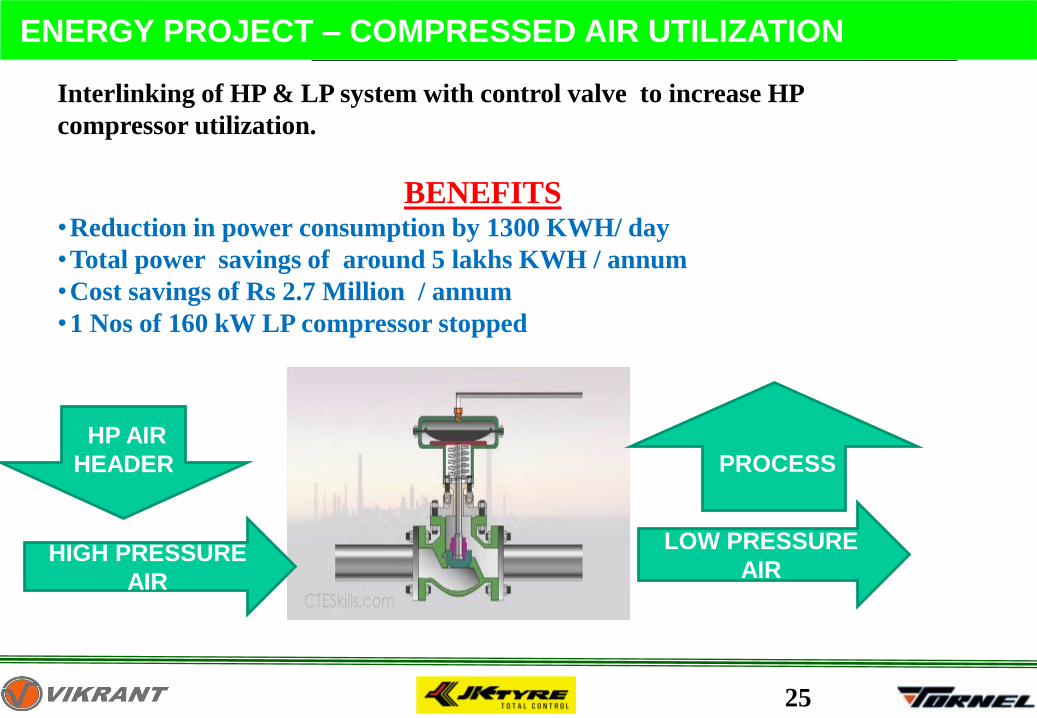
Interlinking of HP & LP system with control valve to increase HP
compressor utilization.
HP AIR
HEADER
HIGH PRESSURE
AIR
LOW PRESSURE
AIR
PROCESS
BENEFITS•Reduction in power consumption by 1300 KWH/ day
•Total power savings of around 5 lakhs KWH / annum
•Cost savings of Rs 2.7 Million / annum
•1 Nos of 160 kW LP compressor stopped
ENERGY PROJECT – COMPRESSED AIR UTILIZATION
26
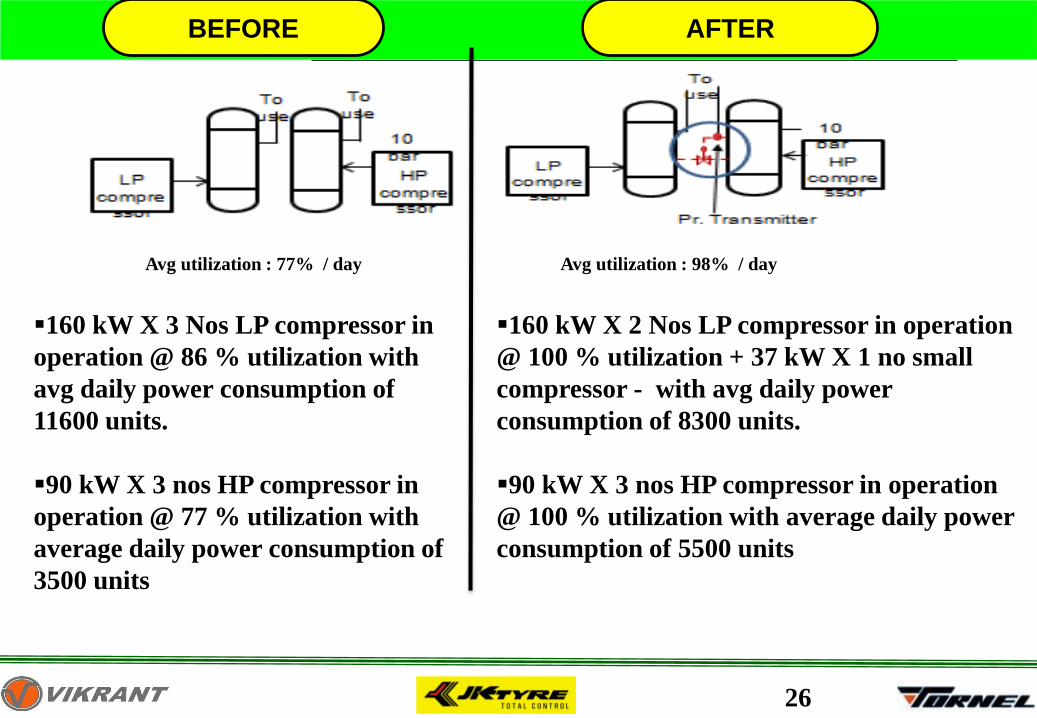
BEFORE AFTER
▪160 kW X 3 Nos LP compressor in
operation @ 86 % utilization with
avg daily power consumption of
11600 units.
▪90 kW X 3 nos HP compressor in
operation @ 77 % utilization with
average daily power consumption of
3500 units
Avg utilization : 77% / day
▪160 kW X 2 Nos LP compressor in operation
@ 100 % utilization + 37 kW X 1 no small
compressor - with avg daily power
consumption of 8300 units.
▪90 kW X 3 nos HP compressor in operation
@ 100 % utilization with average daily power
consumption of 5500 units
Avg utilization : 98% / day
27
5. UTILIZATION OF RENEWABLE ENERGY SOURCE
28
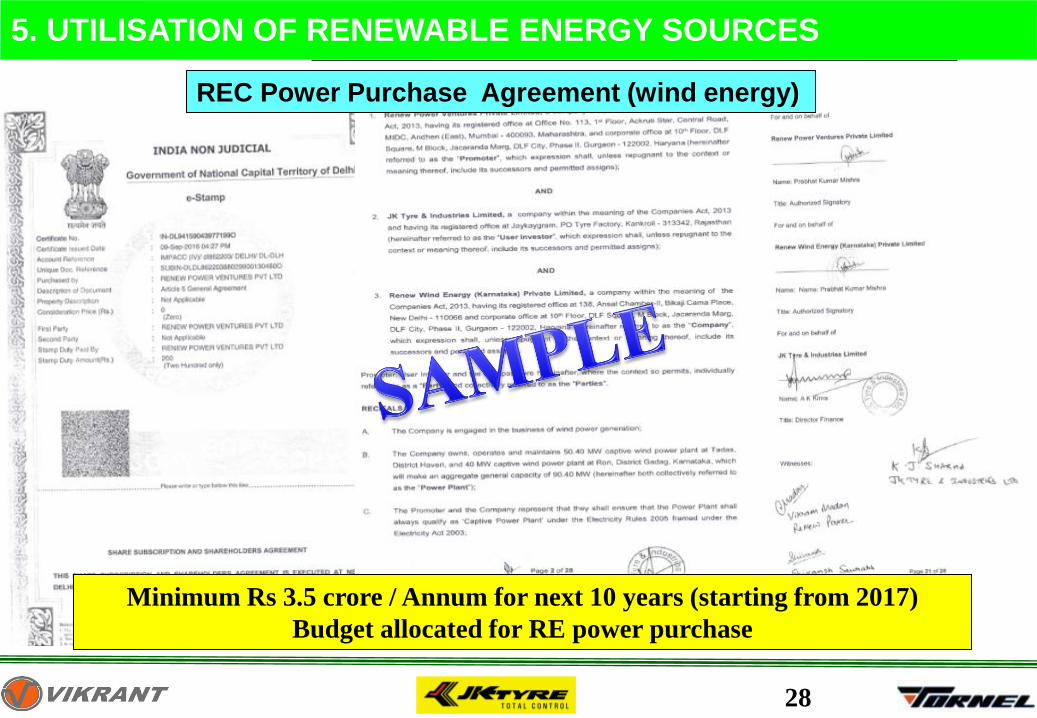
Minimum Rs 3.5 crore / Annum for next 10 years (starting from 2017)
Budget allocated for RE power purchase
REC Power Purchase Agreement (wind energy)
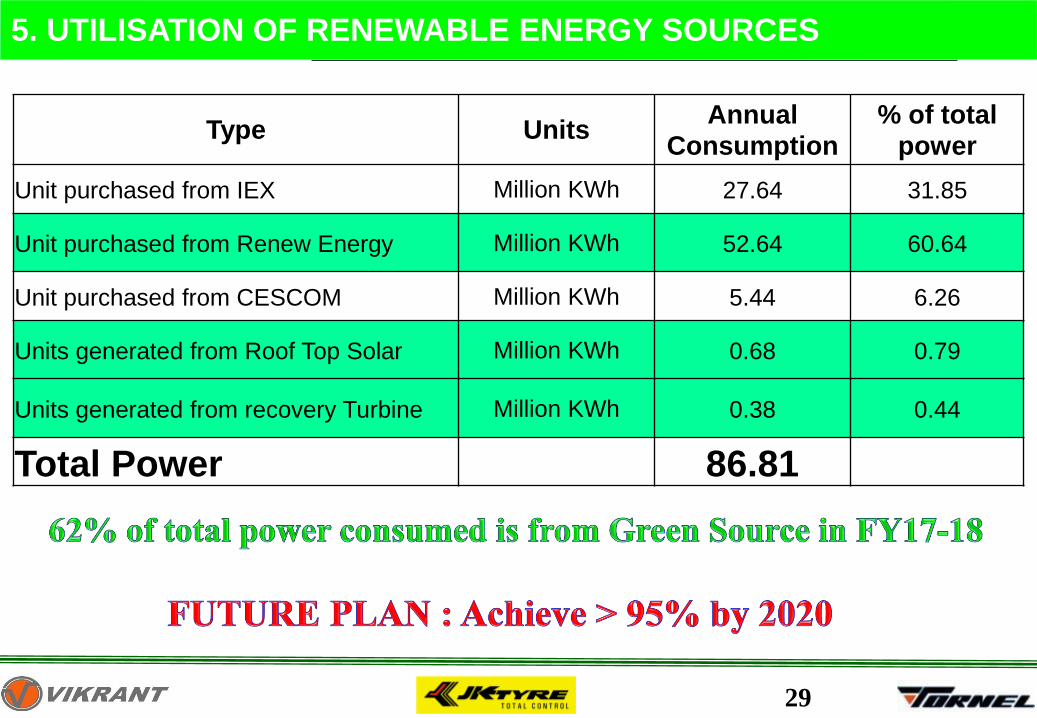
5. UTILISATION OF RENEWABLE ENERGY SOURCES
29
Type UnitsAnnual
Consumption% of total
power
Unit purchased from IEX Million KWh 27.64 31.85
Unit purchased from Renew Energy Million KWh 52.64 60.64
Unit purchased from CESCOM Million KWh 5.44 6.26
Units generated from Roof Top Solar Million KWh 0.68 0.79
Units generated from recovery Turbine Million KWh 0.38 0.44
Total Power 86.81
5. UTILISATION OF RENEWABLE ENERGY SOURCES
30
6. UTILIZATION OF WASTE MATERIAL AS FUEL
31
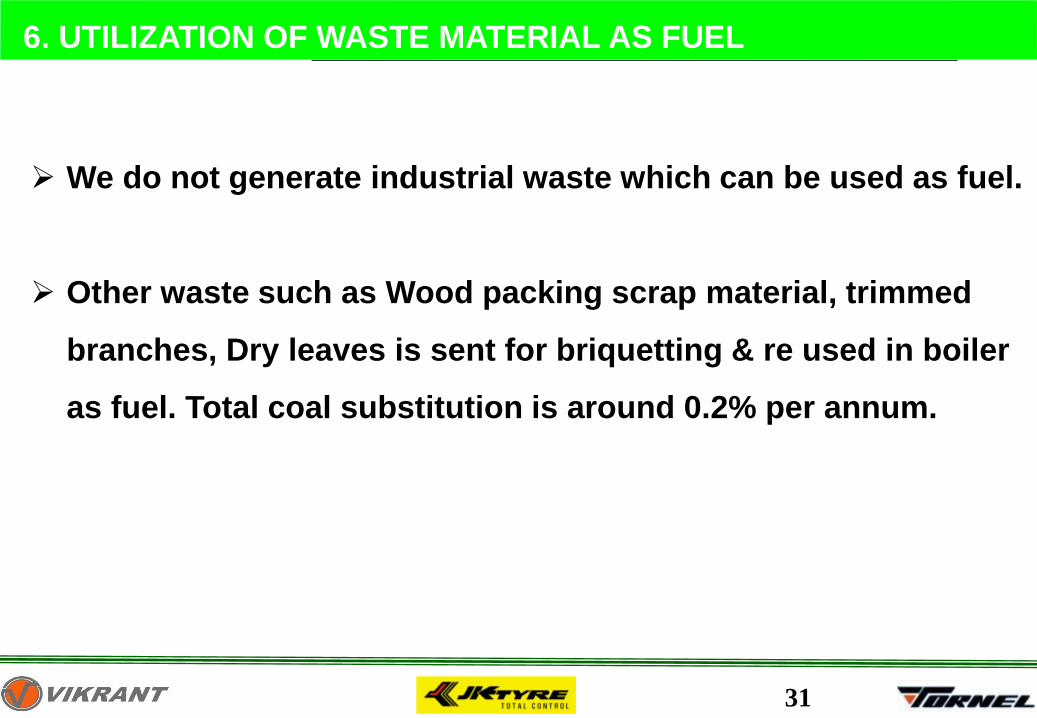
6. UTILIZATION OF WASTE MATERIAL AS FUEL
➢ We do not generate industrial waste which can be used as fuel.
➢ Other waste such as Wood packing scrap material, trimmed
branches, Dry leaves is sent for briquetting & re used in boiler
as fuel. Total coal substitution is around 0.2% per annum.
32
7. GHG INVENTORISATION
33
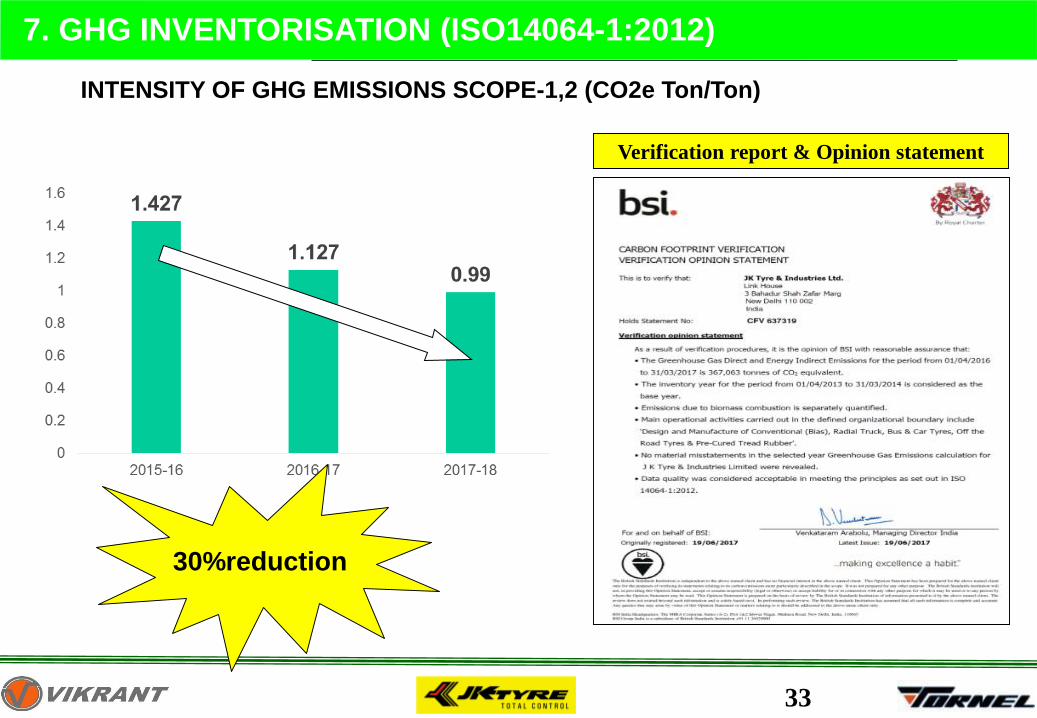
7. GHG INVENTORISATION (ISO14064-1:2012)
INTENSITY OF GHG EMISSIONS SCOPE-1,2 (CO2e Ton/Ton)
30%reduction
Verification report & Opinion statement
34
8. SUPPLY CHAIN
35
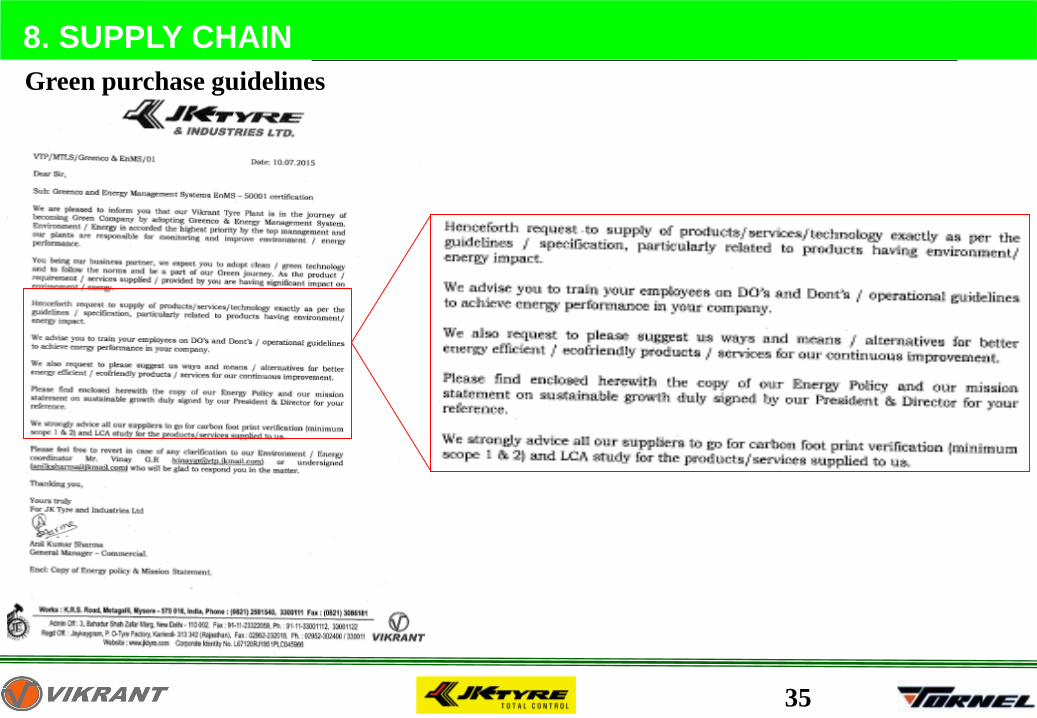
8. SUPPLY CHAIN
Green purchase guidelines
36
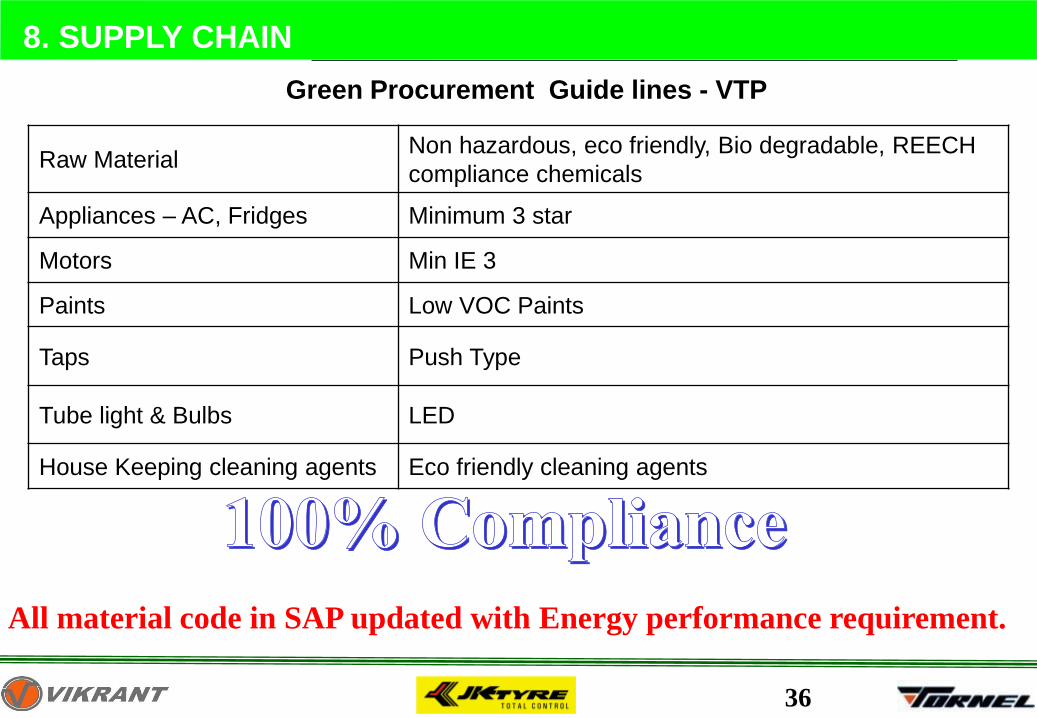
8. SUPPLY CHAIN
Green Procurement Guide lines - VTP
Raw MaterialNon hazardous, eco friendly, Bio degradable, REECH
compliance chemicals
Appliances – AC, Fridges Minimum 3 star
Motors Min IE 3
Paints Low VOC Paints
Taps Push Type
Tube light & Bulbs LED
House Keeping cleaning agents Eco friendly cleaning agents
All material code in SAP updated with Energy performance requirement.
37
8. SUPPLY CHAIN – IMPROVEMENT INITIATIVES
➢ Taking measures in Energy management system by being proactive , innovative and cost effective including procurement of energy efficient products & services.
➢ As a Green Responsible company, we have re-sourced / re-organized / re-structured our suppliers close to our manufacturing plants. Suppliers in South cater to south plant & North to North plants
Eg. :- Carbon Black - Earlier supplied from Kolkata to VTP & plant in Chennai supplied carbon black to KTP now the supplies reorganized so that Chennai plant supplies to Mysuru & Chennai Tyre Plant and Kolkata plant supplies to KTP, LTP & BTP. This resulted is overall savings in emission from supply chain .
INVOLVING SUPPLIER IN CII GREENCO JOURNEY
➢ All our major suppliers are involved in Green Supply chapter of GreenCo, couple of them made their Green Initiative presentation during VTP GreenCo assessment.
➢ We are encouraging our suppliers to go for GreenCo certification. Initial assessment done by our team for 2 suppliers in Mysuru. Very soon they may apply for CII GreenCocertification
38
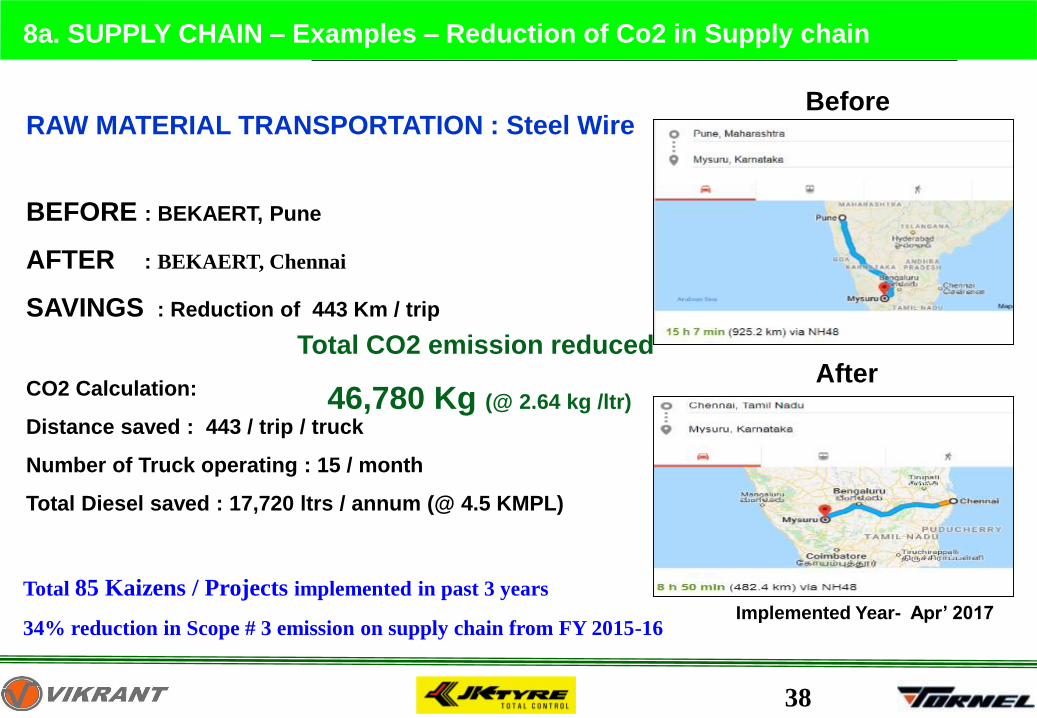
8a. SUPPLY CHAIN – Examples – Reduction of Co2 in Supply chain
BEFORE : BEKAERT, Pune
AFTER : BEKAERT, Chennai
SAVINGS : Reduction of 443 Km / trip
CO2 Calculation:
Distance saved : 443 / trip / truck
Number of Truck operating : 15 / month
Total Diesel saved : 17,720 ltrs / annum (@ 4.5 KMPL)
RAW MATERIAL TRANSPORTATION : Steel Wire
Implemented Year- Apr’ 2017
Total CO2 emission reduced
46,780 Kg (@ 2.64 kg /ltr)
Before
After
Total 85 Kaizens / Projects implemented in past 3 years
34% reduction in Scope # 3 emission on supply chain from FY 2015-16
39
9. TEAM WORK, EMPLOYEE INVOLVEMENT &
MONITORING
40
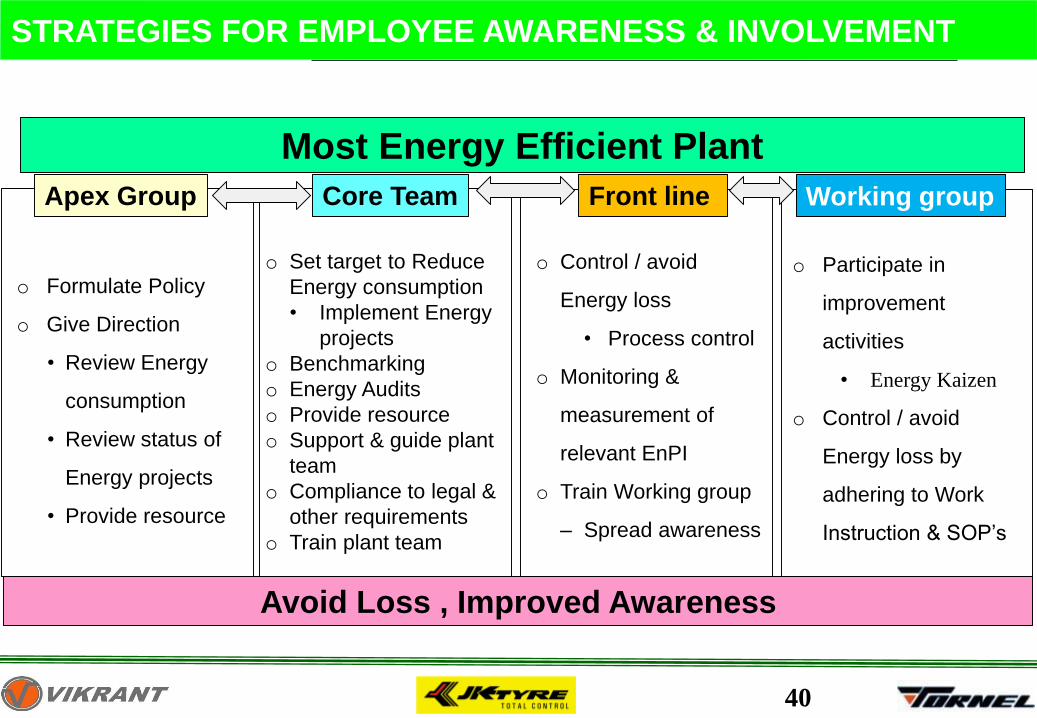
STRATEGIES FOR EMPLOYEE AWARENESS & INVOLVEMENT
o Formulate Policy
o Give Direction
• Review Energy
consumption
• Review status of
Energy projects
• Provide resource
o Set target to Reduce
Energy consumption
• Implement Energy
projects
o Benchmarking
o Energy Audits
o Provide resource
o Support & guide plant
team
o Compliance to legal &
other requirements
o Train plant team
o Control / avoid
Energy loss
• Process control
o Monitoring &
measurement of
relevant EnPI
o Train Working group
– Spread awareness
o Participate in
improvement
activities
• Energy Kaizen
o Control / avoid
Energy loss by
adhering to Work
Instruction & SOP’s
Apex Group Core Team Front line Working group
Most Energy Efficient Plant
Avoid Loss , Improved Awareness
41
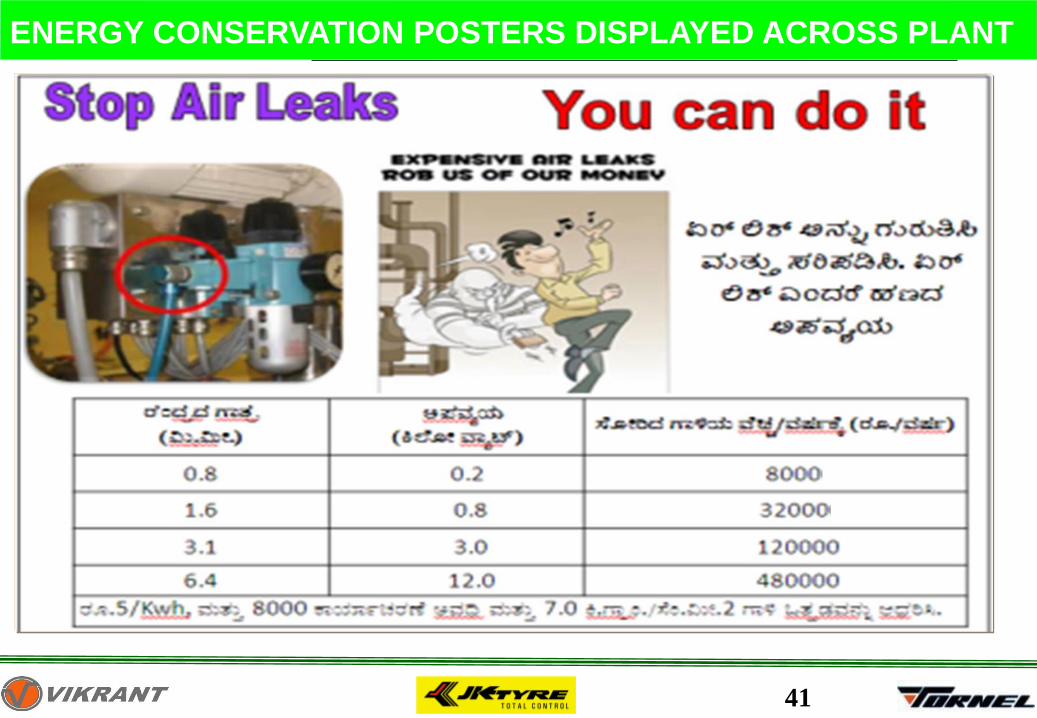
ENERGY CONSERVATION POSTERS DISPLAYED ACROSS PLANT
42
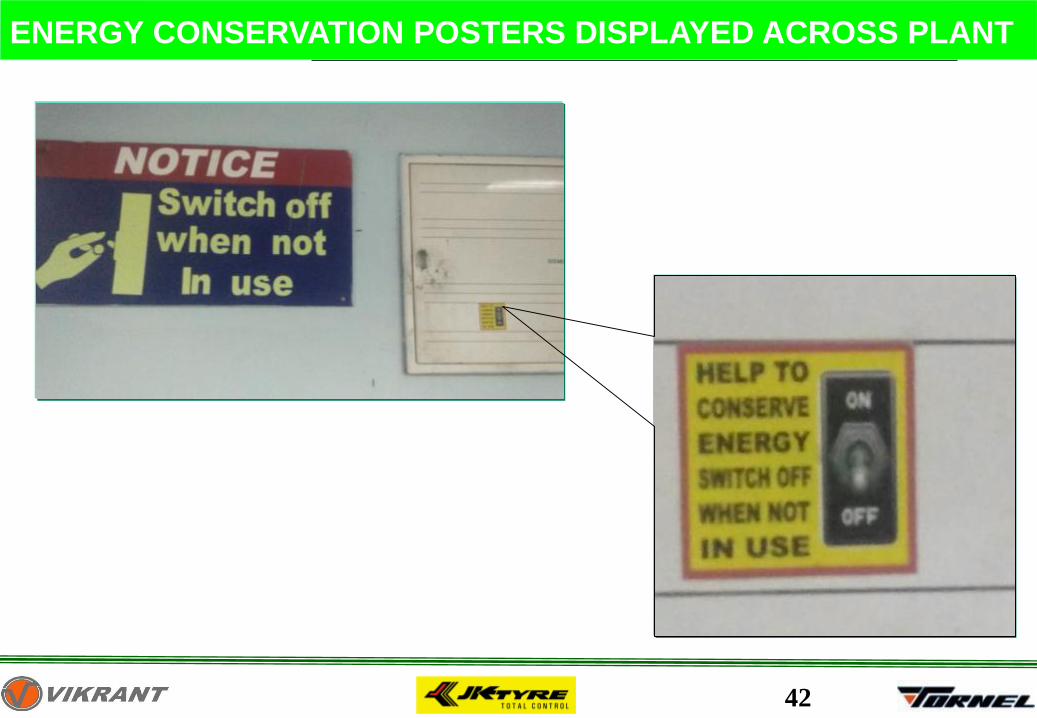
ENERGY CONSERVATION POSTERS DISPLAYED ACROSS PLANT
43
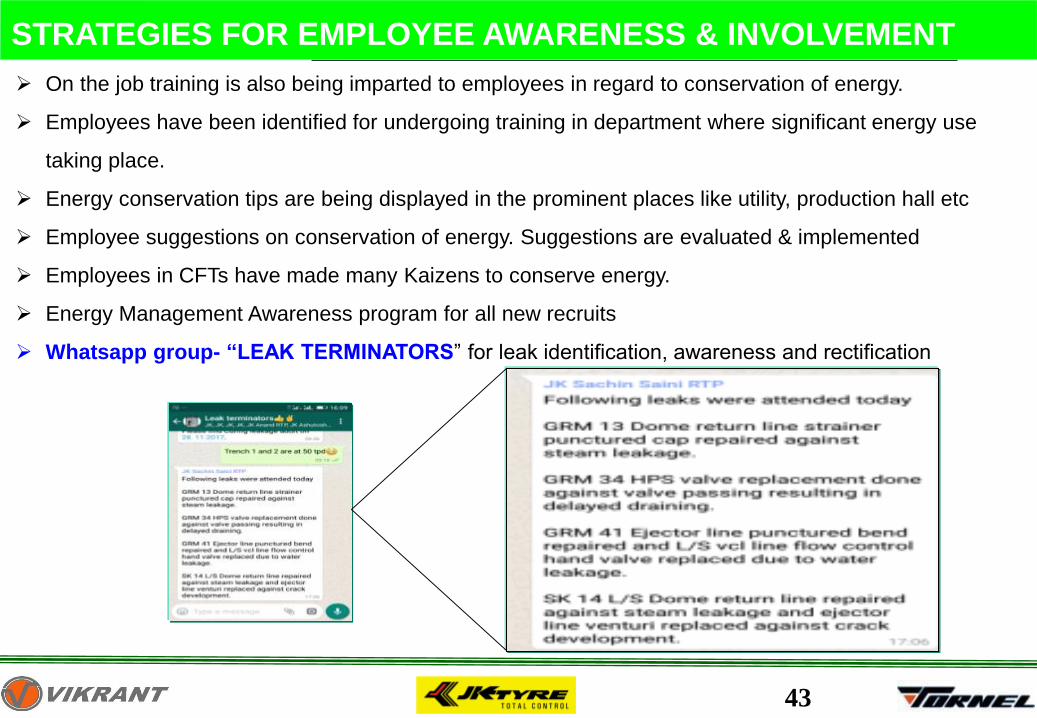
STRATEGIES FOR EMPLOYEE AWARENESS & INVOLVEMENT
➢ On the job training is also being imparted to employees in regard to conservation of energy.
➢ Employees have been identified for undergoing training in department where significant energy use
taking place.
➢ Energy conservation tips are being displayed in the prominent places like utility, production hall etc
➢ Employee suggestions on conservation of energy. Suggestions are evaluated & implemented
➢ Employees in CFTs have made many Kaizens to conserve energy.
➢ Energy Management Awareness program for all new recruits
➢ Whatsapp group- “LEAK TERMINATORS” for leak identification, awareness and rectification
44
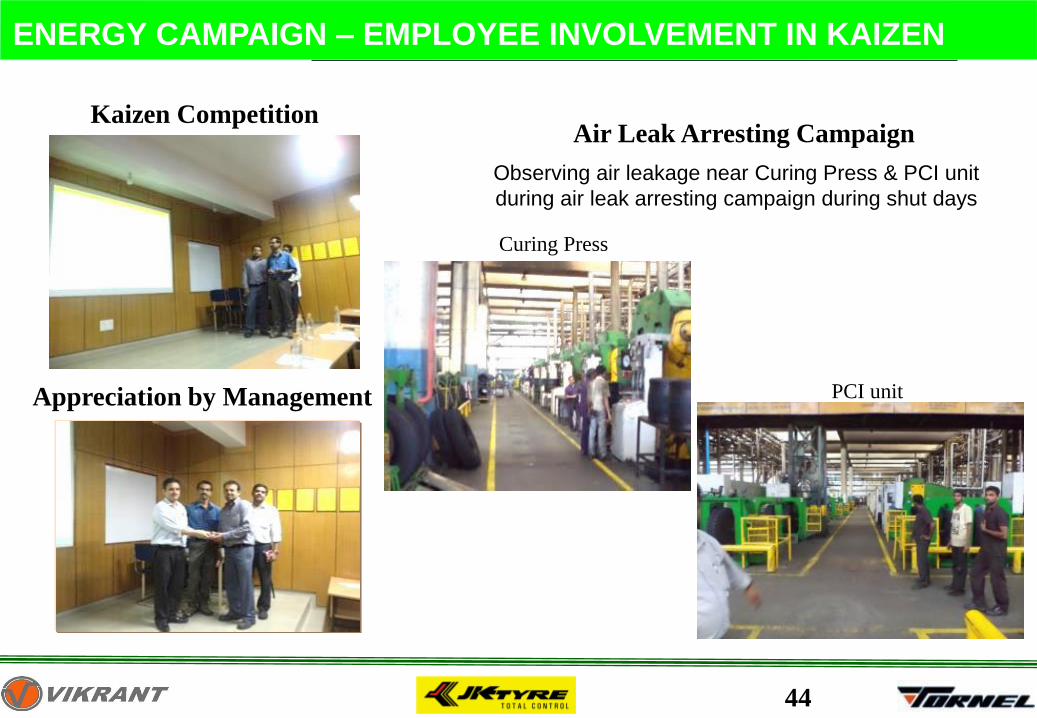
ENERGY CAMPAIGN – EMPLOYEE INVOLVEMENT IN KAIZEN
Kaizen CompetitionAir Leak Arresting Campaign
Appreciation by Management
Observing air leakage near Curing Press & PCI unit
during air leak arresting campaign during shut days
Curing Press
PCI unit
45
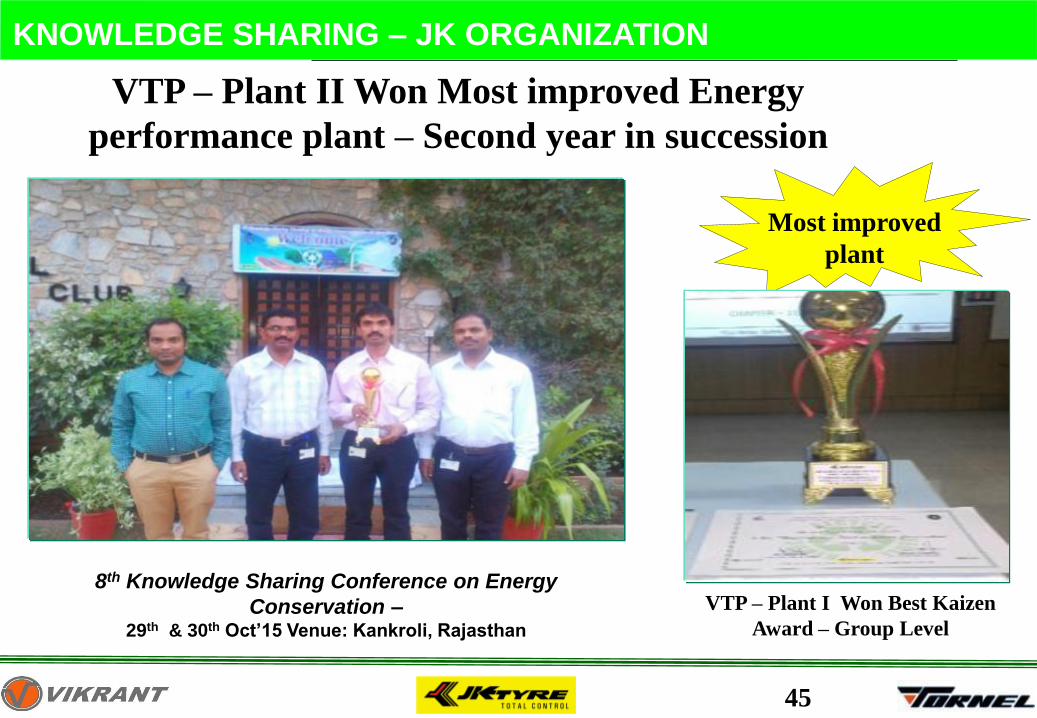
KNOWLEDGE SHARING – JK ORGANIZATION
VTP – Plant II Won Most improved Energy
performance plant – Second year in succession
VTP – Plant I Won Best Kaizen
Award – Group Level
8th Knowledge Sharing Conference on Energy
Conservation –29th & 30th Oct’15 Venue: Kankroli, Rajasthan
Most improved
plant
46
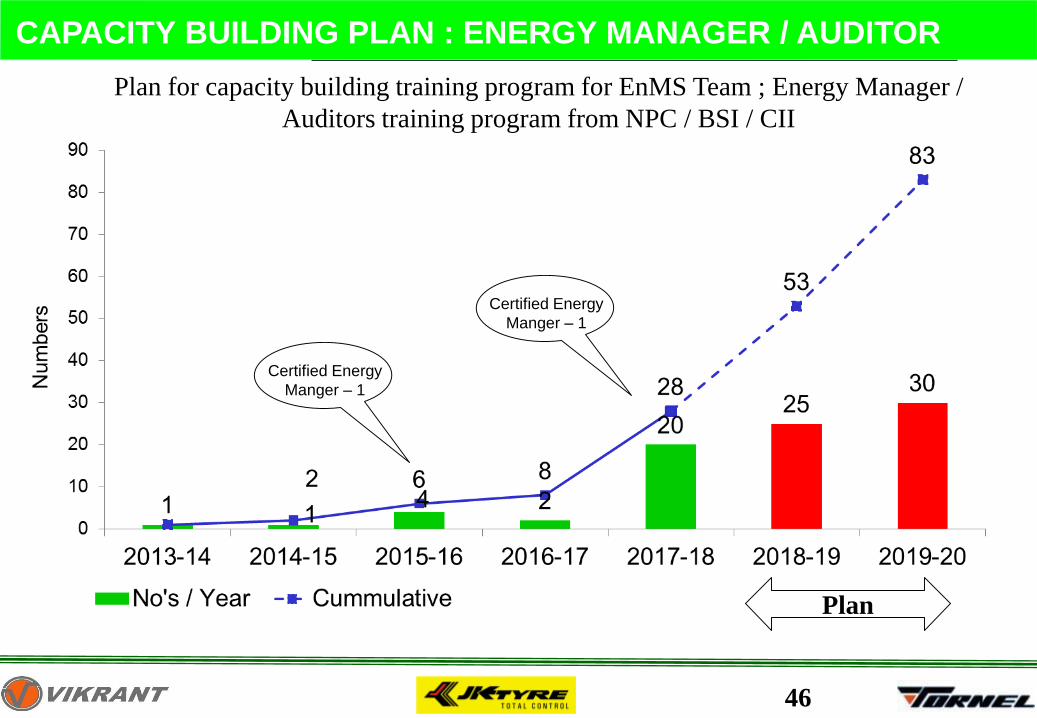
CAPACITY BUILDING PLAN : ENERGY MANAGER / AUDITOR
Plan for capacity building training program for EnMS Team ; Energy Manager /
Auditors training program from NPC / BSI / CII
Plan
Certified Energy
Manger – 1
Certified Energy
Manger – 1
47
10. ENERGY REVIEW, DAILY
MONITORING & VARIANCE ANALYSIS
48
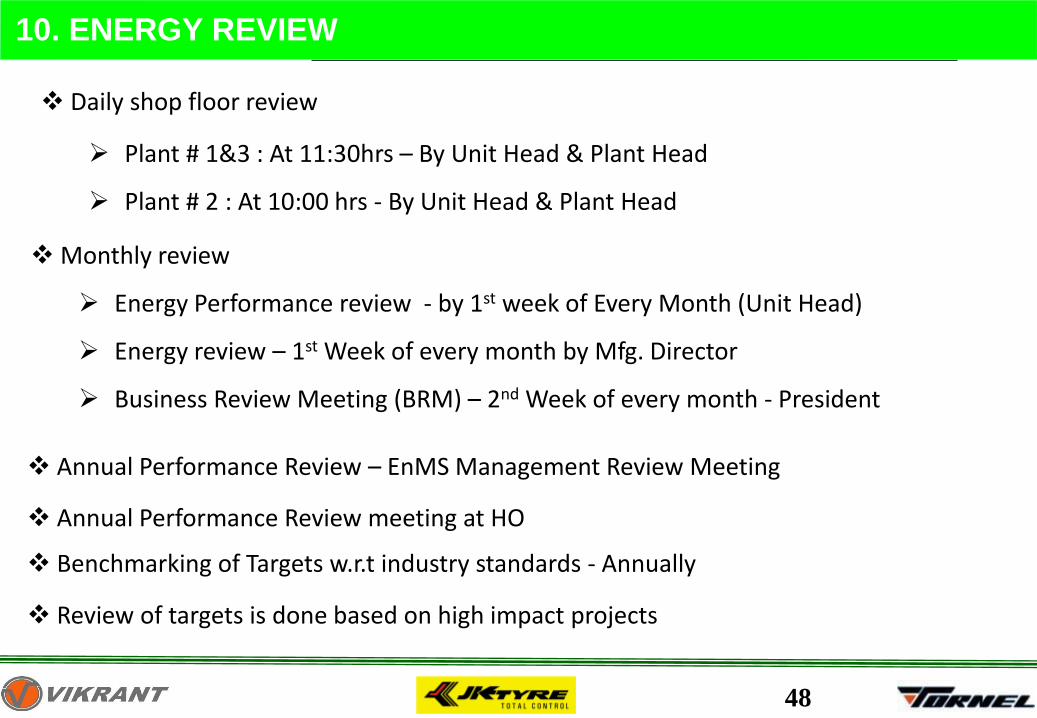
10. ENERGY REVIEW
❖ Daily shop floor review
➢ Plant # 1&3 : At 11:30hrs – By Unit Head & Plant Head
➢ Plant # 2 : At 10:00 hrs - By Unit Head & Plant Head
❖ Monthly review
➢ Energy Performance review - by 1st week of Every Month (Unit Head)
➢ Energy review – 1st Week of every month by Mfg. Director
➢ Business Review Meeting (BRM) – 2nd Week of every month - President
❖ Annual Performance Review – EnMS Management Review Meeting
❖ Annual Performance Review meeting at HO
❖ Benchmarking of Targets w.r.t industry standards - Annually
❖ Review of targets is done based on high impact projects
49
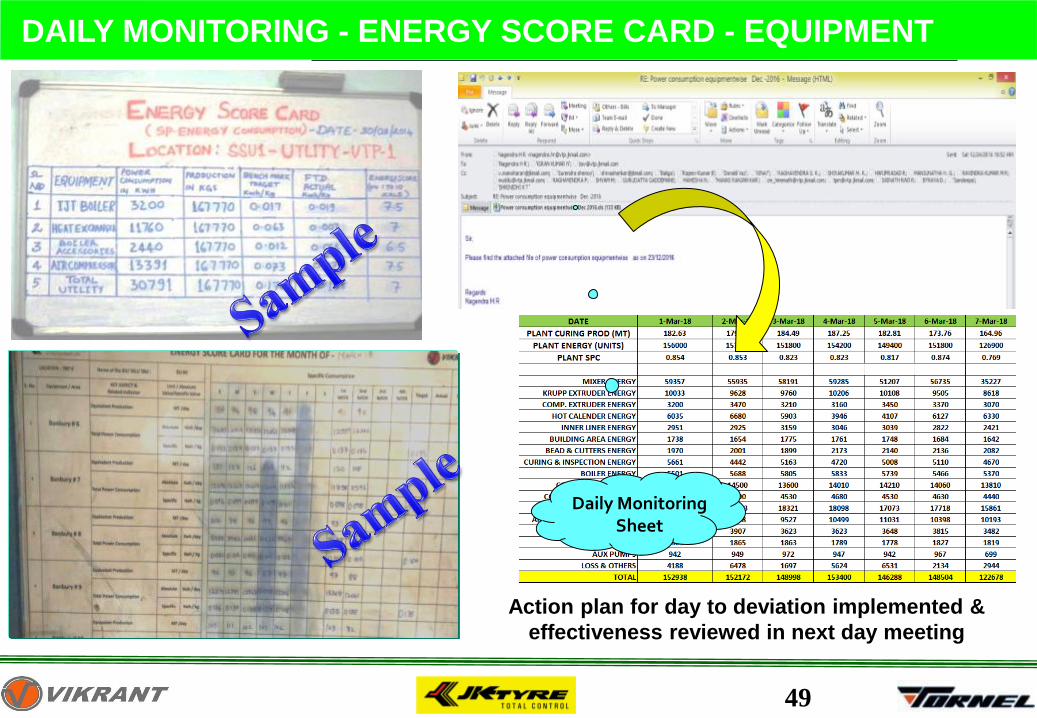
DAILY MONITORING - ENERGY SCORE CARD - EQUIPMENT
Action plan for day to deviation implemented &
effectiveness reviewed in next day meeting
Daily Monitoring Sheet
50
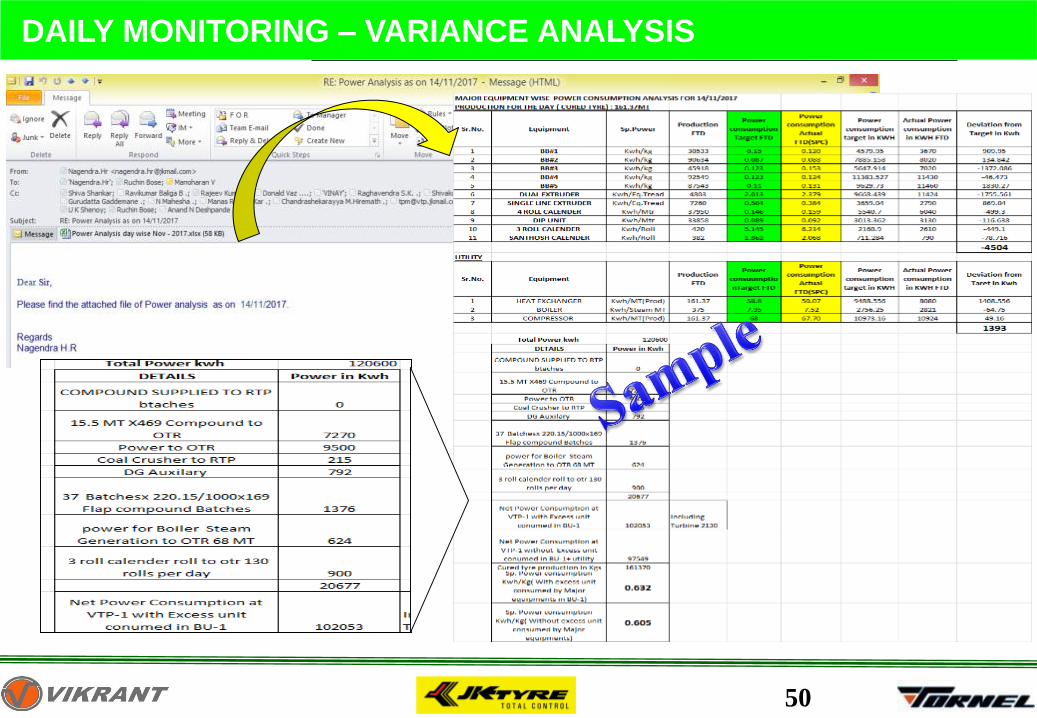
DAILY MONITORING – VARIANCE ANALYSIS
51
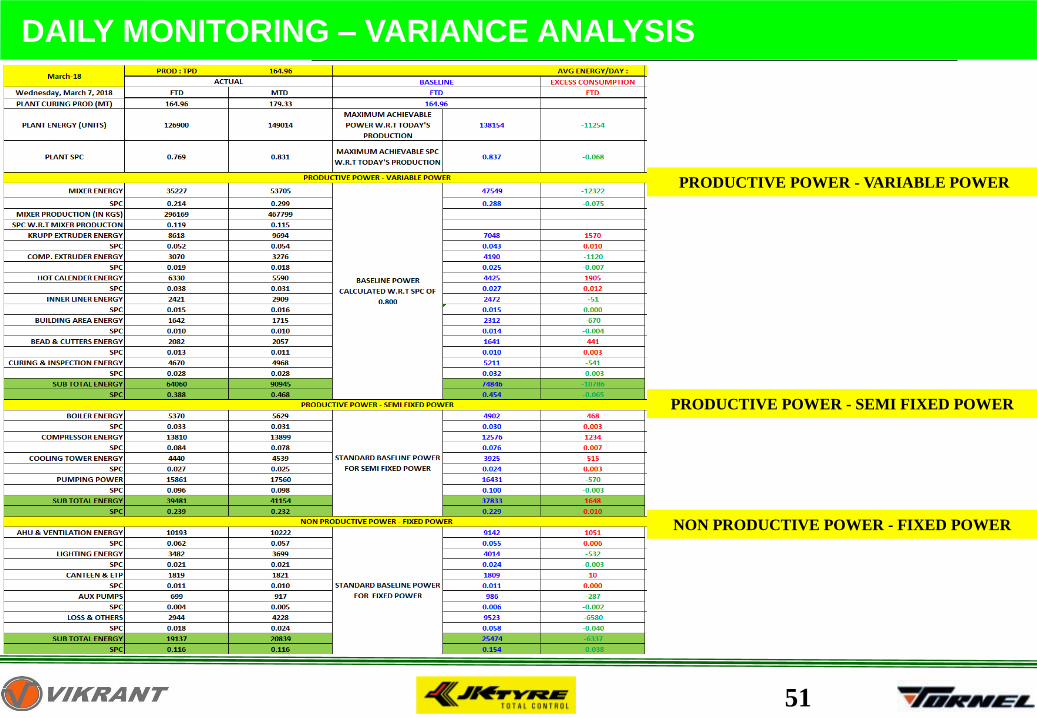
DAILY MONITORING – VARIANCE ANALYSIS
PRODUCTIVE POWER - VARIABLE POWER
PRODUCTIVE POWER - SEMI FIXED POWER
NON PRODUCTIVE POWER - FIXED POWER

52
11. AWARDS & ACCOLADES
53
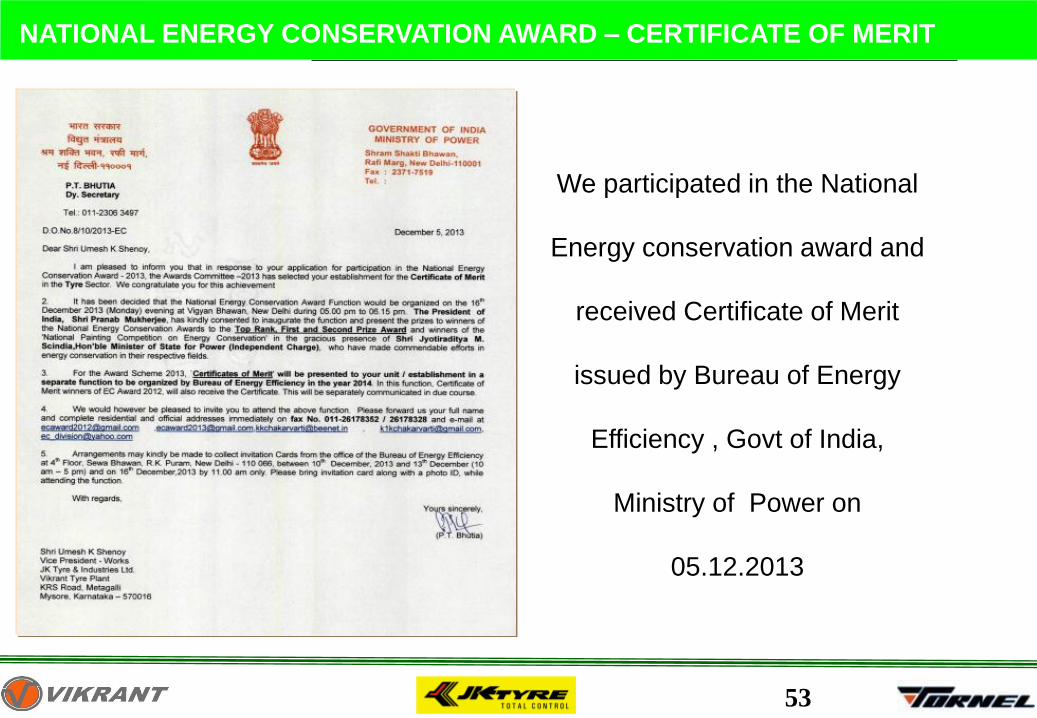
NATIONAL ENERGY CONSERVATION AWARD – CERTIFICATE OF MERIT
We participated in the National
Energy conservation award and
received Certificate of Merit
issued by Bureau of Energy
Efficiency , Govt of India,
Ministry of Power on
05.12.2013
54
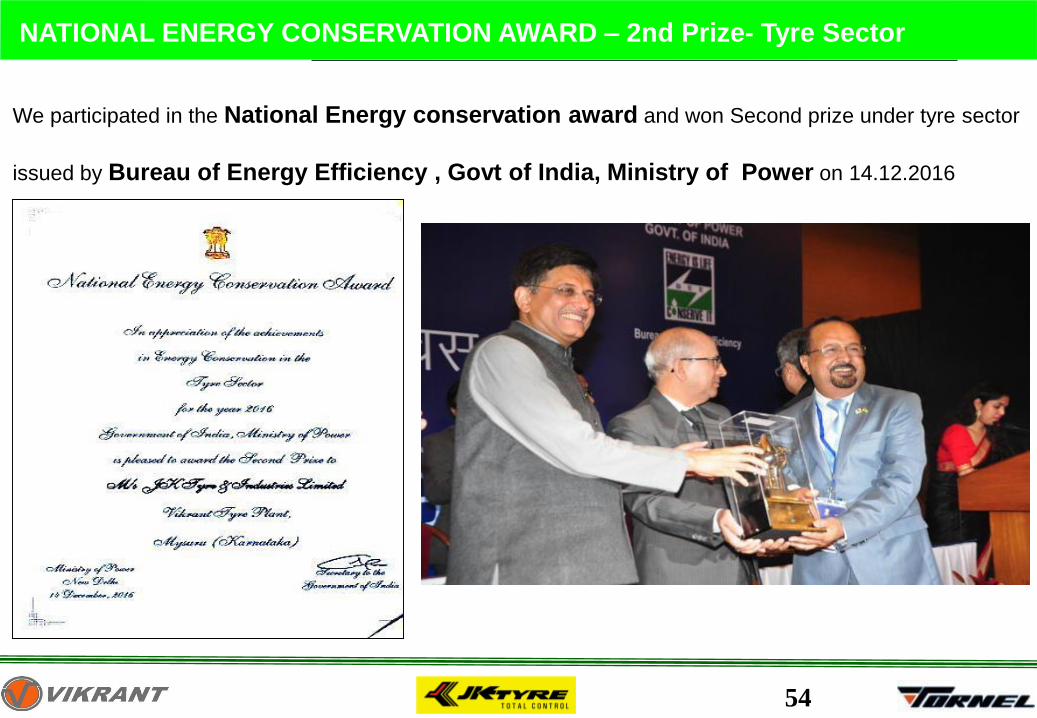
NATIONAL ENERGY CONSERVATION AWARD – 2nd Prize- Tyre Sector
We participated in the National Energy conservation award and won Second prize under tyre sector
issued by Bureau of Energy Efficiency , Govt of India, Ministry of Power on 14.12.2016
55
GREENCO PLATINUM AWARD (29th Jun’2018)
56
FUTURE PLAN
EE Chapter score : 124 marks out of 150
GREENCO PLATINUM PLUS
by 2019
57