energy · fgv energia is the center for studies dedicated to power at getúlio vargas foundation...
TRANSCRIPT
BOOKLETS
DECEMBER 2014 | YEAR 1 | No. 3 | ISSN 2358-5277
ENERGY AND SUSTAINABILITY BRAZILIAN CHALLENGES IN THE EXPANSION OF OFFER AND DEMAND MANAGEMENT

ENERGY AND SUSTAINABILITY BRAZILIAN CHALLENGES IN THE EXPANSION OF OFFER AND DEMAND MANAGEMENT

DIRECTOR FOUNDING PARTNER Carlos Otavio de Vasconcellos Quintella Clarissa Lins TECHNICAL STAFF TECHNICAL STAFF Editorial coordination Editorial Coordination Lavinia Hollanda Clarissa Lins
Authors Authors Lavinia Hollanda Clarissa Lins Mônica Varejão Felipe Vignoli
PRODUCTION STAFF Coordination of Communication Simone C. Lecques de Magalhães
Cover, graphic design and desktop publishing Maria Clara Thedim www.mathedim.com.br

Introduction
Lavinia Hollanda and Mônica Varejão, FGV Energia1 Clarissa Lins and Felipe Vignoli, Catavento2
This booklet is the result of a partnership between FGV Energia and Catavento, which joined efforts to promote a new look at the dilemmas faced by the power industry in Brazil. Fueling the debate about hey issues affecting both the possibilities to expand power sources and the role of demand in a context with efficient use of natural resources and growing restrictions to greenhouse gas emissions is the premise of this work.
ABOUT FGV ENERGIA ABOUT CATAVENTO FGV Energia is the center for studies dedicated to power at Getúlio Vargas Foundation created to place FGV as a protagonist in the research and discussion about public power for power in the country. The center seeks to formulate studies, policies and guidelines of power, and establish partnerships to help companies and the Government making decisions.
Catavento is a consulting company on corporate sustainability that seeks to influence decision makers. It broadens the company’s strategic view about potential changes in its business context, maps risks and opportunities, assesses sustainability in its business models, and identifies the amount associated to innovative practices.
1. Lavinia Hollanda and Mônica Varejão are the Coordinator for Research and Researcher at FGV Energia,
respectively. 2. Clarissa Lins and Felipe Vignoli are the founding partner and partner of Catavento consulting, respectively.

FIRST FOUNDING PRESIDENT Luiz Simões Lopes PRESIDENT Carlos Ivan Simonsen Leal VICE-PRESIDENTS Sergio Franklin Quintella, Francisco Oswaldo Neves Dornelles and Marcos Cintra Cavalcanti de Albuquerque BOARD OF DIRECTORS President Carlos Ivan Simonsen Leal Vice-Presidents Sergio Franklin Quintella, Francisco Oswaldo Neves Dornelles and Marcos Cintra Cavalcanti de Albuquerque Members Armando Klabin, Carlos Alberto Pires de Carvalho e Albuquerque, Ernane Galvêas, José Luiz Miranda, Lindolpho de Carvalho Dias, Marcílio Marques Moreira and Roberto Paulo Cezar de Andrade Deputies Antonio Monteiro de Castro Filho, Cristiano Buarque Franco Neto, Eduardo Baptista Vianna, Gilberto Duarte Prado, Jacob Palis Júnior, José Ermírio de Moraes Neto and Marcelo José Basílio de Souza Marinho. TRUSTEE COUNCIL President Carlos Alberto Lenz César Protásio Vice-President João Alfredo Dias Lins (Klabin Irmãos e Cia) Members - Alexandre Koch Torres de Assis, Angélica Moreira da Silva (Brazilian Federation of Banks), Ary Oswaldo Mattos Filho (EDESP/FGV), Carlos Alberto Lenz Cesar Protásio, Carlos Moacyr Gomes de Almeida, Eduardo M. Krieger, Fernando Pinheiro e Fernando Bomfiglio (Souza Cruz S/A), Heitor Chagas de Oliveira, Jaques Wagner (State of Bahia), João Alfredo Dias Lins (Klabin Irmãos & Cia), Leonardo André Paixão (IRB - Brasil Resseguros S.A.), Luiz Chor (Chozil Engenharia Ltda.), Marcelo Serfaty, Marcio João de
Andrade Fortes, Orlando dos Santos Marques (Publicis Brasil Comunicação Ltda.), Pedro Henrique Mariani Bittencourt (Banco BBM S.A.), Raul Calfat (Votorantim Participações S.A.), Ronaldo Mendonça Vilela (Trade Union of Private Insurance, Capitalization and Reinsurance Companies of the State of Rio de Janeiro and Espírito Santo), Sandoval Carneiro Junior (DITV - Dept. Vale Technology Institute) and Tarso Genro (State of Rio Grande do Sul). Deputies - Aldo Floris, José Carlos Schmidt Murta Ribeiro, Luiz Ildefonso Simões Lopes (Brookfield Brasil Ltda.), Luiz Roberto Nascimento Silva, Manoel Fernando Thompson Motta Filho, Roberto Castello Branco (Vale S.A.), Nilson Teixeira (Banco de Investimentos Crédit Suisse S.A.), Olavo Monteiro de Carvalho (Monteiro Aranha Participações S.A.), Patrick de Larragoiti Lucas (Sul América Companhia Nacional de Seguros), Rui Barreto (Café Solúvel Brasília S.A.), Sérgio Lins Andrade (Andrade Gutierrez S.A.), and Victório Carlos De Marchi (AMBEV).
DIRECTOR Carlos Otavio de Vasconcellos Quintella RESEARCH COORDINATION Lavinia Hollanda COORDINATION OF INSTITUTIONAL RELATION Luiz Roberto Bezerra COORDINATION OF TEACHING AND R&D Felipe Gonçalves COORDINATION OF COMMUNICATION AND MARKETING Simone C. Lecques de Magalhães RESEARCHERS Bruno Moreno Rodrigo de Freitas Camilo Poppe de Figueiredo Muñoz Felipe Castor Cordeiro de Sousa Mônica Coelho Varejão Rafael da Costa Nogueira
PRAIA DE BOTAFOGO, 190, RIO DE JANEIRO - RJ - POSTAL CODE 22250-900 OR POSTAK BOX 62.591 - POSTAL CODE 22257-970 - TELEPHONE (21) 3799-5498 - WWW.FGV.BR
Institution of technical and scientific, educational, and charitable nature created on December 20, 1944 as a private legal entity with the purpose of fully acting in all scientific matters, and emphasizing in the field of social sciences: administration, law and economy, thus contributing to the country’s social and economic development.
Table of Contents 06 EXECUTIVE SUMMARY
08 TALKING ABOUT ENERGY WITH DAVID ZYLBERSZTAJN
13 PRESENTATION
17 POWER MATRIX AND MAIN USES OF ENERGY
27 OFFER EXPANSION DILEMMAS
43 THE ROLE OF POWER DEMAND
55 LIST OF ACRONYMS
56 BIBLIOGRAPHY

Executive Summary • Power is essential for the society to live
comfortably and prospering. It is a precondition for a country to develop. In addition to economic and technical aspects, conditions that determine the expansion possibilities should also take into account social and environmental impacts, thus making power offer and demand analysis inseparable from its effects on the society and the environment.
• The current Brazilian power matrix rests largely in traditional sources, with predominance of oil and oil products, while renewable sources have a relevant role in terms of historical penetration of hydroelectricity.
• Distribution between the different sources of power is crucial for the level of greenhouse gas emissions, now considered a decisive factor in the configuration of the country’s economic growth. Recently, the country presented a matrix more intensive in carbon as a consequence of the regular activation of thermal plants due to changes in the hydrological cycle.
• Power offer expansion possibilities, necessary to support the growth of Brazil, show that the country has several dilemmas to be addressed in a transparent way, such as: how and where to expand hydropower generation; how to boost the development of other renewable sources and optimize its intermittent character; what is the role of pre-salt reserves exploration given the pressure for reduced exposure to fossil fuels?
• From the power consumption point of view, industrial production and transport sector are the main users of several sources. Any expansion should focus on the efficient use of power, encourage efforts in combined heat and power and rethinking the transport model adopted until then, clearly dependent on road transport, individual car and the use of fossil fuels. Models based on ethanol, less pollutant liquid fuels and public transport in urban centers should be privileged.

Brazil has conditions to become relevant in the global power scenario.
• In this context, the role of demand cannot
be minimized. The search for efficiency in power consumption should be tireless, and a first step in this direction would include the reduction of waste and inefficiencies throughout the value chain.
• Moreover, demand management mechanisms should be implemented in order to contribute to the sustainable use of natural resources and relieving the pressure on expansion investments. A correct indication of prices properly reflecting offer and demand situations, as well as social and environmental externalities is a key step in towards this direction.
• Current technologies - as those of smart grids - contribute heavily to optimize demand response, changing the way energy is consumed and the relationship between consumer - whether industrial or residential - and provider of energy solutions.
• Brazil has conditions to become relevant in the global power scenario due to its abundance of natural resources, access to traditional sources and acceptance of its consumer market of more modern technologies. Now, the Government is entitled to guide the strategy to be followed through public policies with guidelines, actions and clear economic signals, based on the consensus obtained from mechanisms of dialogue with the society.

Talking about Energy with David Zylbersztajn
David Zylbersztajn gave an interview on 11/14/14, in order to have the opinion of an expert in power, who has experience and knowledge both in the power sector and in the oil and gas sector. David is Doctor in Energy Economy by the University of Grenoble (1987), he was the Secretary for Energy in São Paulo and Director-General of the Brazilian National Agency of Petroleum (ANP). Currently, he is partner at DZ business with Energy and member of the Board of Directors of Light.
WHAT IS THE CURRENT OUTLOOK OF THE BRAZILIAN POWER MATRIX? Everybody realize we are walking towards a positive carbon matrix, that is, emissions are increasing. The problem is to know where are we going to stop. When the world was fossil, Brazil was mainly renewable. When the world constantly seeks to become more renewable, Brazil walks
against it. In the power sector, I believe we will have a technology breakthrough mainly in what regards to solar power capture, such as the shale gas in the United States. Five years ago nobody imagined we would have such a development, but today shale gas contributes to a scenario of excessive supply of power, for example. Here in Brazil, it is possible to have a transition in the way of solar capture and in the field of bioenergy.

TO WHAT EXTENT BRAZIL GOES THE OPPOSITE DIRECTION? ARE WE GOING TO ADAPT TO THE GLOBAL MATRIX AT ANY POINT? If we take into account the low investment Brazil makes in renewable sources and energy efficiency, environmental limitations for the construction of power plants and if we don’t make any efforts to use the raw material we have - through solar capture and use of biomass - we will see to point of power matrix adjustment pass us by. Acting soon to reverse this trend of smudging the matrix is important. Climatic changes are serious and this is an important moment to justify the internalization of environmental costs and review the feasibility of many projects. IN THIS PROCESS OF TREND REVERSAL, WHAT IS THE MOST RELEVANT MATTER? Public policy. We learned that the economic sign is decisive from the 2001 rationing. If there is no market for the industry, for research centers, if there is no economic sign for consumers, there is no progress. The role of the Government is essential and Government programs could be better exploited in an
integrated manner. For example, for programs as “Minha Casa Minha Vida”, this could include solar heating or pipe for gas heating, among other issues to facilitate the complementary use of power sources. The Brazilian matrix is also subjected to circumstances instead of a strategy. We do not have a power project expected for the country. Planning with market forecast that concretely guides the use of renewable sources is important. ENVIRONMENTALISTS ARE ENTITLED TO FIGHT RESERVOIRS. IN TURN, “DAM BUILDERS” SAY THAT WE PUT ENERGY SAFETY AT RISK. IS THIS THE DILEMMA? Yes, this is the dilemma, but there is no proper discussion forum. The role of the Government would be of recognizing these challenges and debate them with the society. We must assume we will have problems. If we are going to use other sources, what is the impact of them? I have to choose between one thing or another, and this is only up to the Government. The Government bids, grants environmental license, grants fund. Therefore, mediation and guidance with the society are decisive Government roles. A lot that we lost from

the possibility of making better projects, for example in Belo Monte, was because of the lack of dialogue. Now, Amazon projects on the table will generate power, but at a very high economic and socio-environmental cost. Due to the lack of dialogue on this debate, there is a small space to revisit optimal economic allocation. The focus is essentially environmental. AND, IN THIS CONTEXT, WHAT IS THE FUTURE OF PRE-SALT? If you consider the annual growth in global oil demand, it is equivalent to the surplus that Brazil will produce annually with the pre-salt. That is, six years from now, the increase in our production will be equivalent to the global demand growth. If we assume that the Middle East, Africa, Gul of Mexico and other producing countries will also have increased production, what will happen to our exportable surplus? It will enter a saturated market. In addition, its exploration can be more expensive than expected and the global aversion to oil with its obvious consequences for the quality of air and the country’s emissions level can make it equivalent to what the cigarette is now for the society. EXPLORATION AND USE OF NATURAL GAS COULD BE A SOURCE OF TRANSITION FOR A CLEANER MATRIX?
The Brazilian matrix was mainly based on the use of wood until the early 1970s. We were one of the few countries that made a transition from wood to oil without going through coal. This is something very curious and there are only a few cases. I think that, in Brazil, the space to use natural gas as an element of transition for renewables is narrower. We do not have infrastructure. We have a few natural gas stations to configure a growth of this infrastructure. Besides, there is a series of restrictions to build a pipeline that will pass through environmentally sensitive regions. On the other hand, this can be good for us. We may have a shorter gas cycle and an anticipation of the use of renewable sources. However, the low price of oil can make transition slower. If the world is not able to internalize environmental costs in a very explicit manner, cheap oil will start to slow the development of renewable sources. WHAT IS THE ROLE OF THERMALS AND OTHER INTERMITTENT SOURCES WITH THE REDUCED CAPACITY OF LARGE RESERVOIRS STORAGE? We don’t have an alternative. A possibility would be to make a thermal at the wellhead and transmit this energy, that is, changing the molecule by electron. On the other hand, supplementary power sources could also help. Wind farms advanced a lot due to a global availability and we have good
Educate people who pay the bills is necessary. This is a social economic efficiency process not very used.
results in wind generation. We still need to make progress in Brazil. There are still a lot of challenges for entrepreneurs, who must be stubborn and almost irrational to not give up. Greater regulatory and economic incentives are also necessary from the Government for distributed generation, although it is likely that difficulties are milder in the future even due to the crisis in the power industry that could accelerate this process. AND WHAT COULD BE THE ROLE OF ENERGY EFFICIENCY TO RELIEVE PRESSURES ON THE POWER SECTOR? In 2001 crisis, the solution came with demand management. People’s perception was fast, since they reacted to the economic sign: each power unit (kWh) represented money. In addition, the need for power economy was internalized. Only years later, the demand returned to previous levels. There was a social gain, but unfortunately it was lost. However, the economic sign proved itself important. Now,
years later, we will begin to implement rate flags. When you work on the rate, you make the economic sign clear for the population and the perception is positive. Current cases of water and power scarcity are a problem of conducting natural resources policies. The economic signs must be clear: electricity cannot be reduced to a level of water resources scarcity and oil price cannot be maintained in the same level regardless of international oscillations. WHAT IS THE ROLE OF PEOPLE’S BEHAVIOR? Educate people who pay the bills is necessary. This is a social economic efficiency process not very used. I cannot trust the entire efficiency to the lamp, the equipment. The social side of power use is largely unexplored and has a monumental impact. Such a demand management that serves for electricity serves for water and any other natural resource that one wishes to preserve.
Presentation A country’s level of development can be assessed according to the GDP traditional metrics - or in a broader way, incorporating the availability of natural resources3 and other factors associated to the population’s well-being - such as education, health and the same civil rights.4 However, whatever is the metric chose emphasizing the access of the population to infrastructure services as basic sanitation, electricity and transport is important, as well as education and health services. Thus, the theme “power” is key in any approach on well-being and growth of a country. There is no way to segregate the economic sphere of social and environmental aspects, as they are naturally interdependent.
However, the alignment of the three aspects is not trivial. Commitments are being assumed in several countries and cities around the world in order to reduce carbon intensity of economic activities, including those that depend on power.5
3. For a discussion on different forms of assessing progress, see Lins (2014) / 4. SEN (1999). 5. An example of such initiatives is the UNITED NATIONS (2014), "FORESTS: New York Declaration on Forests Action Statements and Action Plans”, that provides for the reduction of half of deforestation on the plant by 2020 and end it by 2030. Supporters of the agreement intend to cut 4.5 to 8.8 billion tons of carbon per year by 2030. Another example is the incentive to renewable sources in Germany with the enactment of a law to reduce the participation of fossil fuels in the power matrix in 1991 and the approval of the Renewable Energy Sources Act in 2000, which enables the distributed generation and trade of generated power between producer and operators (http://www.mudancasclimaticas.andi.org.br/node/1128).

Challenges in the power field are not a few in Brazil. In addition to emergency situation to be solved, there are priority longer term matters as the participation of renewable sources in
generation, the option for reserves development in the pre-salt layer and the influence of climatic changes in choices made.
FIGURE 1 - INTERDEPENDENCE BETWEEN DIMENSIONS __________________
Source: Prepared by Catavento and FGV Energia, adapted from the Report Branch Points, prepared by the Global Scenario Group from the Stockolm Environment Institute. If the debate on energy supply sources is abundant, it is not applicable to demand, which has received less attention from the involved agents. Avoiding market conditions, business models, technologies and other matters that may influence consumer’s behavior is essential in this context in order to better understand the
role of demand management and its potential contribution to the efficient use of energy resources in the country. This booklet intends to address power from the perspective of sustainability by emphasizing the Brazilian dilemmas found
SOCIETY Population;
Social Organization; Lifestyle; Culture
ENVIRONMENT Atmosphere;
Hydrosphere; Earth; Biome; Minerals
Natural resources
Impacts
ECONOMY Agriculture; Houses; Industry; Transport;
Services

in the power supply and evidencing the demand management as a possible point of relief for the alignment of social, environmental and economic aspects. Chapter 2 illustrates the progress of our power matrix emphasizing the participation of traditional and renewable sources and the main uses of power in the past and present, as well as impacts
of greenhouse gas emissions (GHG). In chapter 3, the possibilities to expand the supply of power in Brazil are addressed under the perspective of opportunities and future challenges. Lastly, chapter 4 introduces economic, social and technology conditions that strengthen the role of the society in power demand in a more efficient way.

Power Matrix and Main Uses of Energy In 2013, Brazil had most part (59%) of its internal power supply from traditional sources.6 However, this configuration varied historically according to the economic growth cycles. CHART 1 - ENERGY MATRIX IN 2013: INTERNAL OFFER
Source: Prepared by Catavento and FGV Energia. Adapted from do BEN 2014.
6. As defined in Chart 1.
RENEWABLES
Sugarcane derivatives
Hydraulic
Wood and coal
Other renewable sources
Renewables
Traditional
TRADITIONAL
Oil and derivatives
Natural Gas
Mineral coal and coke
Uranium (U308)

Periods of intense economic development are followed by power consumption expansion and, as a consequence, expanding the power supply to support growth is necessary. Thus, over the last decade, oil, hydraulic power and sugarcane
derivatives have been the main power sources accessed to support the country’s development, as shown in Chart 2.
CHART 2 - PRIMARY INTERNAL PRODUCTION OF POWER
Source: Prepared by Catavento and FGV Energia. Adapted from do BEN 2014. OIL AND GAS Oil production had a significant growth since the end of the State monopoly instituted by Law no. 9.478/1997. Petrobras played a preponderant role in this trajectory by enabling a 64% growth in the oil internal production, which passed from 1.2 million barrels per day for over 2 million between 2000 and 2013.7 Moreover, the sector
opening was successful attracting foreign investment and enabling the installation of several international companies in the exploration and production sector. In order to develop the chain of goods and services linked to the oil sector, the Government increased the local content requirement
7. ANP. Available at: http://www.anp.gov.r/?pg=64555&m=&t1=&t2=&t3=&t4=&ar=&ps=&cachebust= 406655789973.
Prod
uctio
n (1
0³ te
p) Oil
Natural Gs Steam coal Uranium (U308) Sugarcane products Hydraulic power Wood Metallurgic coal

for the sector players through PROMINP - National Oil and Natural Gas Industry Mobilization Program established by Decree no. 4.925/2003. With this, the participation of this sector in the domestic GDP grew from 3% in 2000 to 13% in 2013.8 POWER PLANTS Historically, power plants contributed expressively to the internal offer of power. Between the 70s and 90s, these projects were mostly built in places far from large consumer centers and based in large water reservoirs. However, recent social and environmental requirements9 - and even the difficulty to find new water uses feasible for generation projects - has been making it increasingly difficult to expand the country’s power matrix through large power plants. Thus, hydroelectricity has reduced its participation in the power matrix, being reduced from 16% in 2000 to 13% in 2013.
OTHER RENEWABLE SOURCES Brazilian climatic conditions favors the complementarity of hydraulic power with other renewable energies sources as biomass, wind and solar.10 Brazil is the largest global producer of ethanol from sugarcane, mainly due to technology innovations that place the country in favorable conditions to compete in the international market. This type of energy contributed to 4.8% of the matrix in 2013, and consumption was pulled by the popularization of flex11 cars and Government incentives to include biomass in diesel.12 Due to its intermittent nature, wind and solar sources are considered complementary to traditional energy sources and power plants. In spite of the recent progress in renewable sources auction rounds, wind power represents only 1.1% of the domestic offer of power and 3.2% of electricity supply.13 With an even more timid participation, solar photovoltaic power
8. Portal Brasil. Available at: http://www.brasil.gov.br/economia-e-emprego/2014/06/setor-de-petroleo-e-gas-
chega-a-13-do-pib-brasileiro. 9. The postponement of São Luiz do Tapajós power plant auction, in Pará, originally scheduled for December
15, 2014 due to the need for adequacies in studies related to the indigenous component is an example of such requirements.
10. Costa, Prates (2005). 11. The Federal Government established a reduction in IPI - Industrialized Products Tax - for flex cars compared
to gasoline cars through Decree no. 7.725/12. In some states as Rio de Janeiro, the IPVA - Automotive Vehicle Tax - is also lower for flex cars than cars exclusively powered by gasoline.
12. Law no. 13.033/2014 increased the percentage of mandatory biodiesel addition to diesel oil sold for end consumers, from 5% to 7%.
responds for only 0.01% of the power generated in the country.14 However, the results of electricity auctions15 in 2014 represent an important indication for future participation of such sources in the matrix. MAIN USES OF POWER IN BRAZIL The way the economic activity is established and developed is directly related to the type of power source consumed and, as a consequence, influences the matrix composition. Industrial production, loads transport and people’s mobility account for 66% of power consumption in Brazil. In 2013, the industrial and transport sector accounted for 33.9% and 32.0%16 of the total consumed, respectively. The third greatest consumer were houses, with 9.1%. Total power consumption increased 2.9% this year, followed by a 2.3% growth in the GDP in 2013. In a historic perspective, industrial and transport sectors were also responsible for most part
(51.9%) of increased power consumption in the country from 2000 to 2013. The growth of energy consumption in the industrial sector was supported by sugarcane bagasse, which can be partly explained by the increase in combined heat and power projects17, which almost tripled in terms of installed capacity between 2000 and 2013.18 However, more recently, it is noteworthy that electricity consumption of the industrial sector has been based on a more polluting matrix due to the dispatch of thermoelectric plants operating with fuel combustion. As evidenced by CDP Brazil report of 201419, this effect is already felt by companies. They reported increased emissions of scope 2 (that is, indirect GHG emissions) from 2012 to 2013 attributing the cause to increased emission factor of the National Interconnected System (SIN) caused by the activation of thermal plants. This information is presented in Chart 3 showing that the amount of CO2 emitted by MWh almost tripled from 2006 to 2013.
13. EPE (2014). BEN 2014. / 14. ANEEL (2014). Brazilian Capacity of Generation. 15. See, for example, results of the Reserve Energy Auction held on 10/31/2014, available at
http://www.epe.gov.br/leiloes/Paginas/Leil%C3%A3o%20de%20Energia%20de%20Reserva%20(2014)/ Leil%C3%A3odeEnergiadeReserva2014atraiinvestimentosdeR$7,1bi.aspx
16. EPE (2014). Energy Demand 2050. 17. International Energy Agency - IEA (2013), World Energy Outlook. 18. SisCogen. There was 4,164 MW of installed power until 2000 due to combined heat and power projects. After
2010, this number was 12,016 MW. Available at: http://www.cogen.com.br/ind_lista_g.asp.. 19. CDP (2014), Connection between climatic changes and business models. An agenda in progress.
For more information, please check http://www.catavento.biz/papers/conexao-entre-mudancas-climaticas-e-modelos-de-negocios-uma-agenda-em-evolucao/
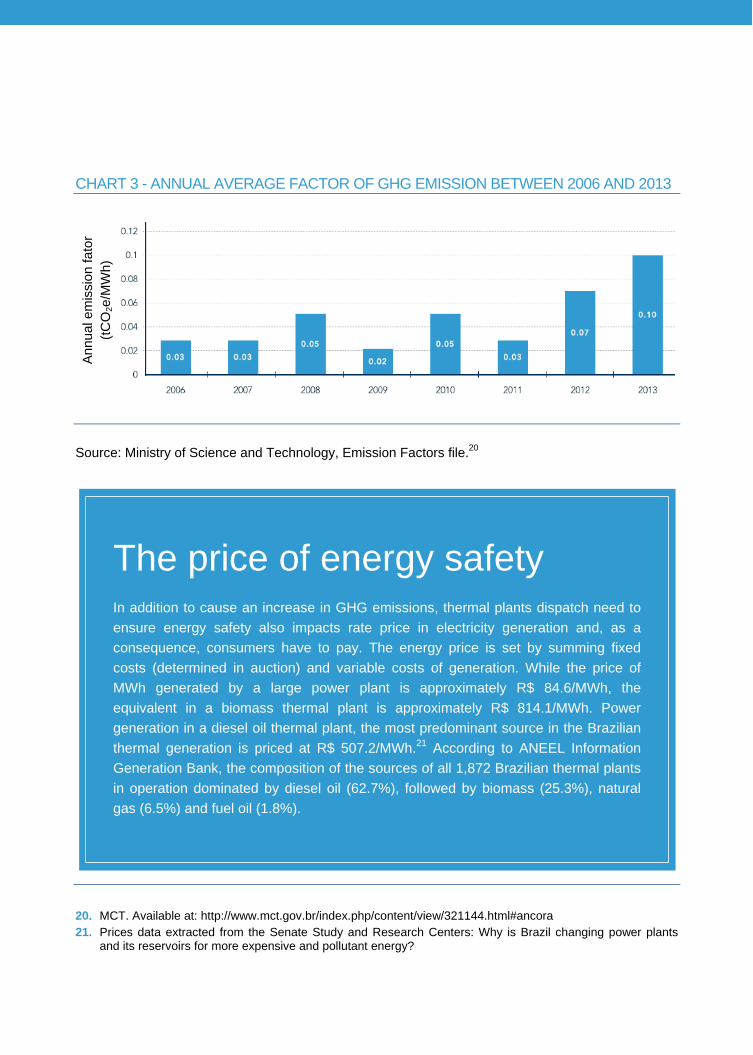
CHART 3 - ANNUAL AVERAGE FACTOR OF GHG EMISSION BETWEEN 2006 AND 2013
Source: Ministry of Science and Technology, Emission Factors file.20
The price of energy safety In addition to cause an increase in GHG emissions, thermal plants dispatch need to ensure energy safety also impacts rate price in electricity generation and, as a consequence, consumers have to pay. The energy price is set by summing fixed costs (determined in auction) and variable costs of generation. While the price of MWh generated by a large power plant is approximately R$ 84.6/MWh, the equivalent in a biomass thermal plant is approximately R$ 814.1/MWh. Power generation in a diesel oil thermal plant, the most predominant source in the Brazilian thermal generation is priced at R$ 507.2/MWh.21 According to ANEEL Information Generation Bank, the composition of the sources of all 1,872 Brazilian thermal plants in operation dominated by diesel oil (62.7%), followed by biomass (25.3%), natural gas (6.5%) and fuel oil (1.8%).
20. MCT. Available at: http://www.mct.gov.br/index.php/content/view/321144.html#ancora 21. Prices data extracted from the Senate Study and Research Centers: Why is Brazil changing power plants
and its reservoirs for more expensive and pollutant energy?
Annu
al e
mis
sion
fato
r (tC
O2e
/MW
h)
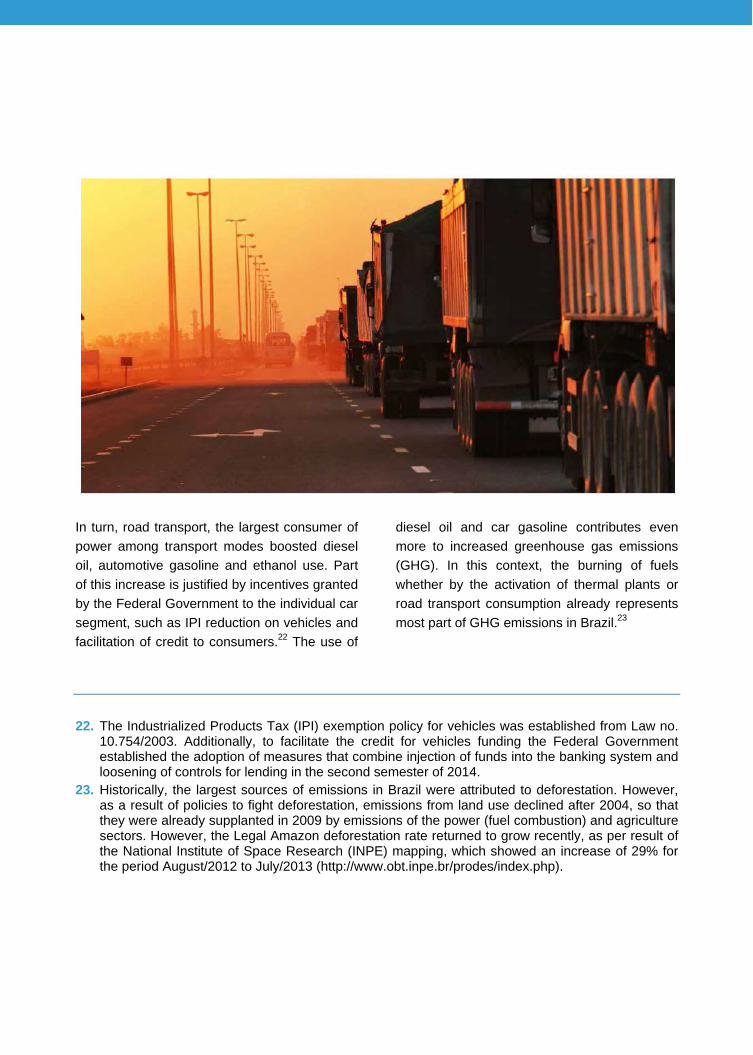
In turn, road transport, the largest consumer of power among transport modes boosted diesel oil, automotive gasoline and ethanol use. Part of this increase is justified by incentives granted by the Federal Government to the individual car segment, such as IPI reduction on vehicles and facilitation of credit to consumers.22 The use of
diesel oil and car gasoline contributes even more to increased greenhouse gas emissions (GHG). In this context, the burning of fuels whether by the activation of thermal plants or road transport consumption already represents most part of GHG emissions in Brazil.23
22. The Industrialized Products Tax (IPI) exemption policy for vehicles was established from Law no.
10.754/2003. Additionally, to facilitate the credit for vehicles funding the Federal Government established the adoption of measures that combine injection of funds into the banking system and loosening of controls for lending in the second semester of 2014.
23. Historically, the largest sources of emissions in Brazil were attributed to deforestation. However, as a result of policies to fight deforestation, emissions from land use declined after 2004, so that they were already supplanted in 2009 by emissions of the power (fuel combustion) and agriculture sectors. However, the Legal Amazon deforestation rate returned to grow recently, as per result of the National Institute of Space Research (INPE) mapping, which showed an increase of 29% for the period August/2012 to July/2013 (http://www.obt.inpe.br/prodes/index.php).

CHART 4 - VEHICLES SALES IN BRAZIL FROM 2000 TO 2013
Source: Prepared by Catavento and FGV Energia from ANFAVEA data.24 In a less expressive way, residential power consumption grew 14.7% between 2000 and 2013. This period was marked by the replacement of wood by electricity as a result of the energy universalization program instituted by Law no. 10.762/2002.25 The main sources of power consumed by the industrial, transport and residential sectors are not distributed equally. The first one has greater diversity in the use of sources, thus balancing consumption of renewable and traditional
sources. On the other hand, the transport sector depends more on less clean sources, using only 17% of renewable sources. In the opposite direction, residential consumption has expressive contribution in the use of renewable sources as it can be seen in Chart 5. Thus, targeting public policies to one or other sector may influence the composition of our matrix expanding or reducing the renewable energy participation.
24. Available at: http://www.anfavea.com.br/tabelas.html. 25. For more information, please check https://www.google.com.br/webhp?sourceid=chrome-
instant&ion=1&espv=2&ie=UTF-8#q=universaliza%C3%A7%C3%A3o%20do%20acesso%20% C3%A0%20energia%20el%C3%A9trica
No.
of s
ales
of v
ehic
les
(10³
)
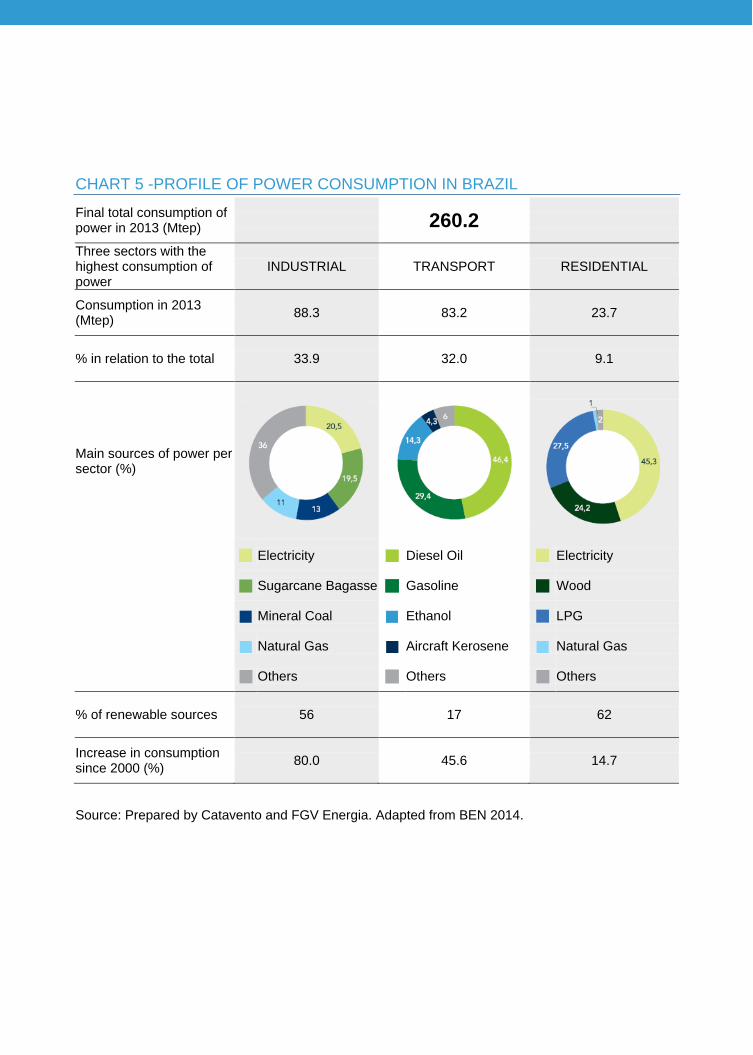
CHART 5 -PROFILE OF POWER CONSUMPTION IN BRAZIL
Final total consumption of power in 2013 (Mtep) 260.2
Three sectors with the highest consumption of power
INDUSTRIAL TRANSPORT RESIDENTIAL
Consumption in 2013 (Mtep) 88.3 83.2 23.7
% in relation to the total 33.9 32.0 9.1
Main sources of power per sector (%)
Electricity Diesel Oil Electricity
Sugarcane Bagasse Gasoline Wood
Mineral Coal Ethanol LPG
Natural Gas Aircraft Kerosene Natural Gas
Others Others Others
% of renewable sources 56 17 62
Increase in consumption since 2000 (%) 80.0 45.6 14.7
Source: Prepared by Catavento and FGV Energia. Adapted from BEN 2014.

Seeking initiatives that value the demand management and energy efficiency as innovative and important instruments to mitigate impacts in GHG emissions is essential.
In view of the long-term nature of power investments, bearing in mind that current choices of the offer expansion and final use profile will have consequences on the future levels of GHG emissions associated to the sector is important. As addressed in this chapter, recent advances associated to a less renewable power matrix has been showing this impact illustrated by increased emissions. With
this, it becomes relevant to establish a clear strategy to expand the power matrix by defining the role of traditional and renewable sources and taking into account tradeoffs from different options. Likewise, seeking initiatives that value the demand management and energy efficiency as innovative and important instruments to mitigate impacts in GHG emissions is essential.

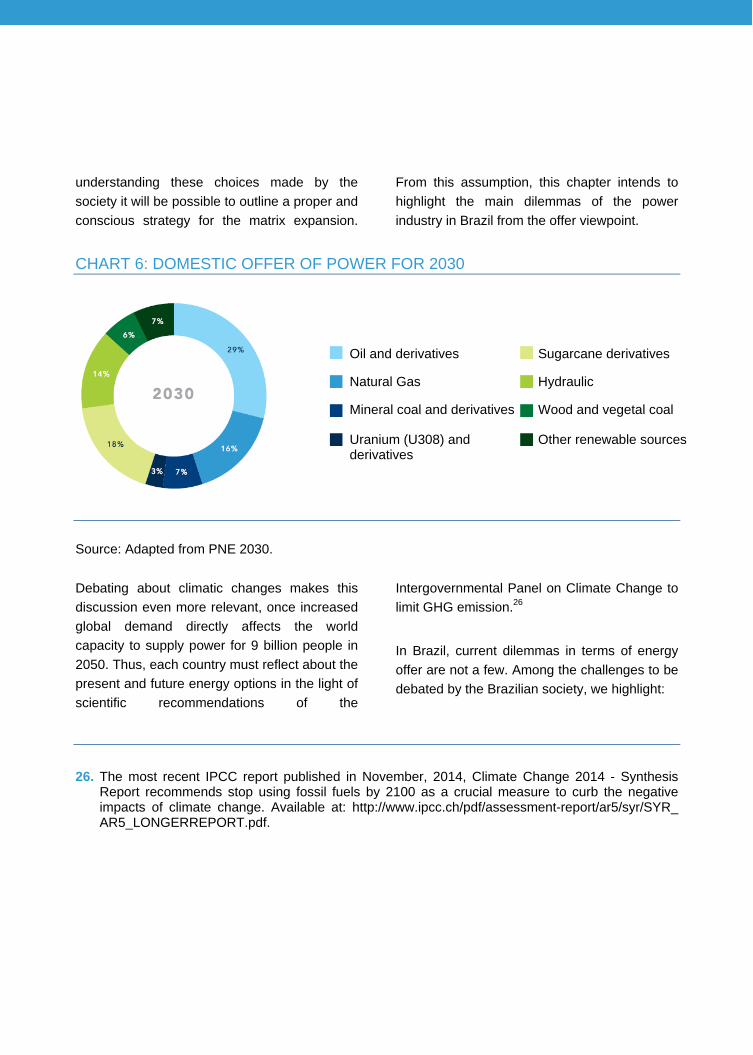
Offer Expansion Dilemmas The National Energy Plan (PNE) 2030 provides for increased domestic offer of power of 3.6% per year by 2020 and 3.4% from 2020 to 2030. In this horizon, PNE indicates a more expressive participation of renewable and natural gas resources, considered as the cleanest among fossil fuels, as it can be seen in Chart 6. However, there are still matters and impasses to be addressed in the power sector so that expectations in planning can be confirmed. Generally, the establishment of energy offer should consider diversity and resources availability, in addition to technology possibilities so that the proportion of each source’s participation and their contribution to expanded generation over the next decades
can be established. However, the debate on the energy offer expansion should be established from the clear understanding of costs and benefits involved in the option for each source of power. After all, what the country wants to reach from the point of view of energy policy with the expansion of offer? Energy safety or reduction in GHG emission levels? Rate mode or attraction of investments? Only after
understanding these choices made by the society it will be possible to outline a proper and conscious strategy for the matrix expansion.
From this assumption, this chapter intends to highlight the main dilemmas of the power industry in Brazil from the offer viewpoint.
CHART 6: DOMESTIC OFFER OF POWER FOR 2030
Source: Adapted from PNE 2030. Debating about climatic changes makes this discussion even more relevant, once increased global demand directly affects the world capacity to supply power for 9 billion people in 2050. Thus, each country must reflect about the present and future energy options in the light of scientific recommendations of the
Intergovernmental Panel on Climate Change to limit GHG emission.26
In Brazil, current dilemmas in terms of energy offer are not a few. Among the challenges to be debated by the Brazilian society, we highlight:
26. The most recent IPCC report published in November, 2014, Climate Change 2014 - Synthesis
Report recommends stop using fossil fuels by 2100 as a crucial measure to curb the negative impacts of climate change. Available at: http://www.ipcc.ch/pdf/assessment-report/ar5/syr/SYR_ AR5_LONGERREPORT.pdf.
Oil and derivatives
Natural Gas
Mineral coal and derivatives
Uranium (U308) and derivatives
Sugarcane derivatives
Hydraulic
Wood and vegetal coal
Other renewable sources

CHALLENGES OF OFFER EXPANSION
How and where to expand power
generation?
How to boost the penetration of renewable sources more effectively?
How to ensure safe development of
pre-salt reserves from the
technology and environmental point of view?
How to ensure natural gas offer
development given the Brazilian market
peculiarities?
How to boost the ethanol
market focusing on technology for the second generation?
In the following sections, we will present each dilemma above with further detail. HOW AND WHERE TO EXPAND POWER GENERATION? Despite being considered clean due to hydroelectricity concentration, the domestic power matrix has the burden of being a little diversified system accentuated in the context of climatic changes with representative cycles on the hydrological cycles. One of the major issues discussed about current hydroelectricity is the opinion between
plants with large reservoirs and run-of-river plants. The first ones allow the accumulation of water working as power stocks to be used in dry periods.27 Run-of-river units use the course of river to generate power using little or no accumulation of water resources. In some cases, run-of-river plants work with one or more large reservoir upstream plants in order to ensure continuous electricity generation. Cases that do not count on joint work with large reservoir plants, the run-of-river plant is subject to oscillations in power generation over the year, which reduces its capacity to store energy in the form of water and thus contribute to energy safety.
27. ANEEL. Information taken from Chapter 3 - Hydraulic Energy - Part II - Renewable Energies of the
Atlas of Electric Power in Brazil. Available at: http://www.aneel.gov.br/arquivos/PDF/atlas_par2_cap3.pdf.
Large plants and small hydroelectric centrals - PCHs Belo Monte plant is a symbol of the inflection point between the trend of construction of large reservoirs. The first studies for the construction of a plant started in 1979 and showed the technical feasibility for the construction of five dams along Xingu River. However, after the visible impacts of Itaipu construction as the resettlement of people and flooding of the Sete Quedas National Park, there was greater political and social pressure on such type of projects. With this, the project was dragged on until 2010, the year in which the Installation License was granted by IBAMA, admitting the construction of the plant, but only operating as run-of-river. Given this fact, in order to take advantage of the easier granting of installation licenses, Small Hydroelectric Centrals (PCHs) constructions that can operate via small reservoirs or run-of-river spread. It was believed that such plants would have lower environmental and social impact. If, on one hand, impacts are less visible, on the other, such centrals provide a drastic reduction of the water storage capacity to produce power. PCHs represented 3.6% of the country’s29 power generation28 in 2014 - while large plants still contribute to 63.1%. In this context, the energy storage capacity with reservoirs has been dropping over the years. Chart 7 shows that even if reservoirs were fully supplied, there would still be a reduction in storage over the years.
CONTINUES ►
28. The generation mentioned refers to Inspected Power. According to ANEEL, Inspected Power corresponds to
that considered from commercial operation conducted by the first generating unit. 29. ANEEL (2014). Information Generation Bank.
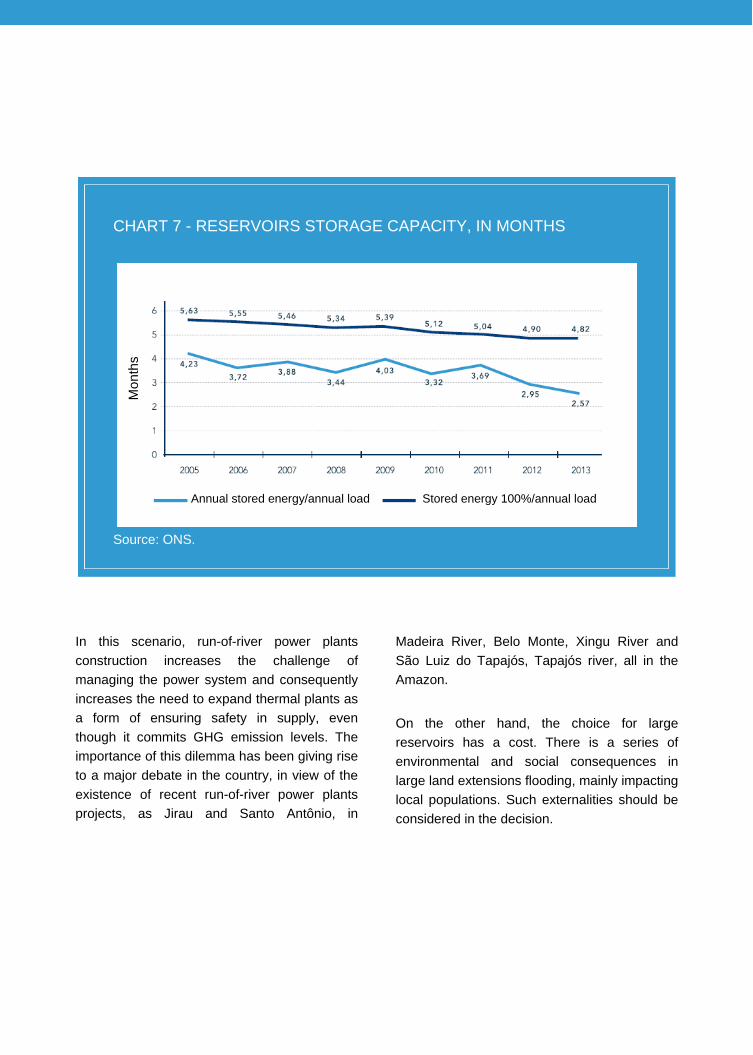
CHART 7 - RESERVOIRS STORAGE CAPACITY, IN MONTHS
Source: ONS. In this scenario, run-of-river power plants construction increases the challenge of managing the power system and consequently increases the need to expand thermal plants as a form of ensuring safety in supply, even though it commits GHG emission levels. The importance of this dilemma has been giving rise to a major debate in the country, in view of the existence of recent run-of-river power plants projects, as Jirau and Santo Antônio, in
Madeira River, Belo Monte, Xingu River and São Luiz do Tapajós, Tapajós river, all in the Amazon. On the other hand, the choice for large reservoirs has a cost. There is a series of environmental and social consequences in large land extensions flooding, mainly impacting local populations. Such externalities should be considered in the decision.
Mon
ths
Annual stored energy/annual load Stored energy 100%/annual load

POTENTIAL IMPACTS OF LARGE RESERVOIRS
Forming another reservoir affects local fauna and flora,
so that many species are submerged with flooding.
Need to relocate riverside, indigenous, quilombo
populations and other local communities affected.
Change in the local economy dynamics not only during the construction of dams, but also
before and after it.
Reservoirs have thermal stratification with the absence of oxygen at the bottom, which results in release of methane in this area via anaerobic decomposition of organic matter. This, in turn, has a global warming potential 21 times higher than carbon dioxide.
Changes in the morphology of terrestrial systems through increased erosion and soil
salinity.
Interruption in the normal watercourse flow can cause changes in temperature and
chemical composition of water with direct consequences in its
quality.
Water damming may cause several endemic diseases,
thus endangering surrounding communities.
In this context, exploring the water potential in the Amazon gives rise to an intense debate nationally and internationally even influencing in its funding capacity. The International Finance Corporation (IFC), the private arm of the World Bank, for example, classifies such projects as highly environmental impact and determines assessments that take into account the ability to mitigate it. Such assessments include the capacity of companies to conduct social and
environmental risk management, conditions of work in projects, biodiversity conservation, involuntary relocation of local communities and threats to cultural inheritance, among others. Incorporating a social and environmental assessment to determine the risk level of a project is now considered a good practice by the main players of the financial market, whether funding banks or investors.30

Multiple use of water Not less important, proper water resources management is object of major debate due to reduced levels in reservoirs available for power generation and water scarcity for other uses. Additionally, the environmental, social and economic impacts above can change the natural dynamics of the ecosystem and constitute factors that determine the quality deterioration process and water availability, which generates conflicts regarding the use of such resource. Impacts and conflicts can be minimized taking into account the concept of multiple use of reservoirs’ water. According to Law no. 9.433/97 that established the National Water Resources Policy, the management of water resources should always provide multiple use of waters, which favors access equality by the several economy sectors. However, priority uses in situations of water scarcity are human consumption and animal consumption. In the case of plans with large reservoirs, multiple use of water may include urban supply, irrigation, river navigation, recreation and flood regulation. Some of the social and economic benefits generation from the multiple use of reservoirs can be quantitatively expressed by annual net revenues obtained by determined uses and direct and indirect jobs created from projects implemented [Oliveira, Catão Curi and Fadlo Curi (1999)]. Disadvantages of multiple and integrated use of water resources, on the other hand, are managerial and require the establishment of technical and efficient governance mechanisms that seek the convergence of interests and better use of resource.
30. The main Brazilian banks are signatories to the Equator Principles, committing to adopt social and
environmental assessment practices in funding grant analysis for large enterprises. For more details, visit http://www.equator-principles.com/
Such matters are complex and delicate as there is the need to contemplate aspects directly linked to clean energy generation taking into account social and environmental externalities, as well as aspects related to the multiple use of water resources. In this context, the Brazilian legislation provides for a society participation instrument that can be used in the service of consensus, or at least consent - public hearings. The effective use of this participatory mechanism tends to increase the time for the start of a project because of the need for composition with various agents. After establishing a consensus and consent, project execution may happen less smoothly leading to
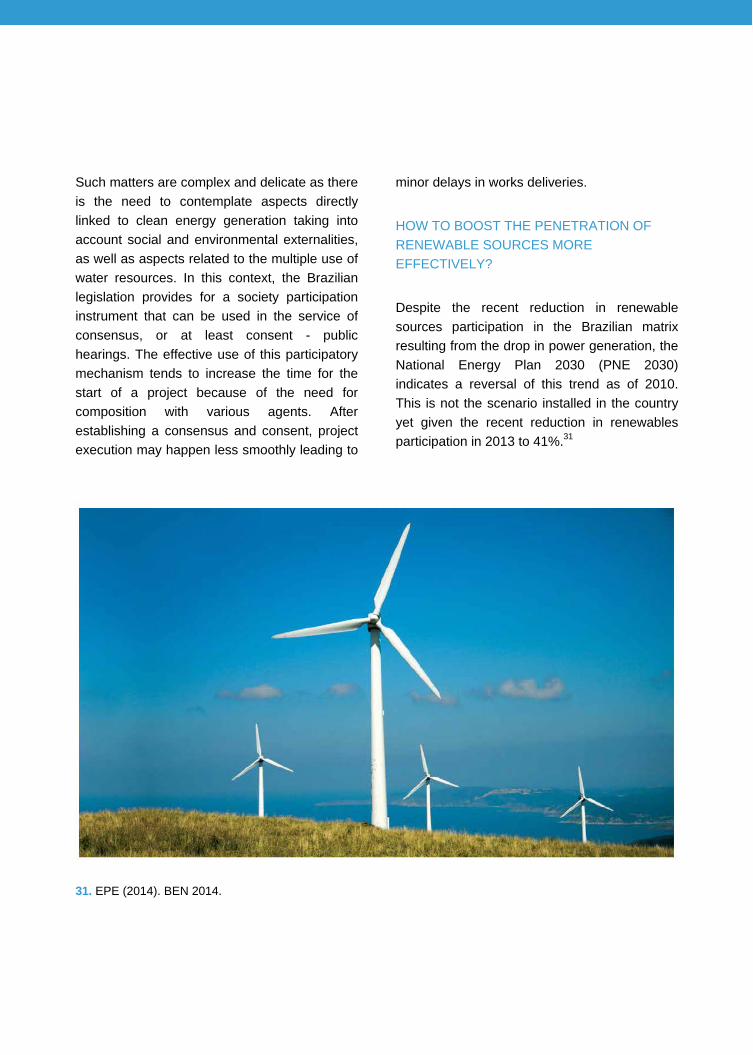
minor delays in works deliveries. HOW TO BOOST THE PENETRATION OF RENEWABLE SOURCES MORE EFFECTIVELY? Despite the recent reduction in renewable sources participation in the Brazilian matrix resulting from the drop in power generation, the National Energy Plan 2030 (PNE 2030) indicates a reversal of this trend as of 2010. This is not the scenario installed in the country yet given the recent reduction in renewables participation in 2013 to 41%.31
31. EPE (2014). BEN 2014.

The discussion about renewable sources necessarily includes a debate on the country’s energy safety once these are intermittent sources, particularly in the case of wind and solar photovoltaic sources. However, emphasizing that renewable sources may be supplementary both over the year and in periods of the day is important. Such complementarity can be seen, for example, in wind farms with winds mainly in the evening and leaving the network idle during the day, a period in which solar generation is possible.32 Renewable sources generation technical potential is expressive in Brazil once the country is privileged with plenty of natural resources, such as intensive sunlight and favorable wind mainly in the Northeast and South region. However, the economic feasibility of wind generation projects and especially photovoltaic still has major knots to be untied. In this sense, the Government is already defining the ceiling price in wind and solar generation auctions at higher levels in order to attract projects. The Reserve Auction held in October 31, 2014, for example33, 31 solar power projects and 31 wind power projects
were contracted with 889.6 MW and 769.1 MW of total installed capacity, respectively. Access to funding also represents a major obstacle to be overcome in order to develop the generation through renewable sources. WWF34 NGO study shows that additional resources should be employed for generation, development and innovation of technologies in early diffusion stages as the case of this sources in Brazil. For this purpose, the National Bank for Economic and Social Development (BNDES) established a funding policy for this type of generation project since 2006.35 In parallel, the Federal Government has also tried to encourage the development of a local chain of suppliers through local content policies. This is achieved by means of conditional credit grant by BNDES for generation projects by these sources, so that the credit is only granted if the winner commits to a local content consideration in production. However, it must be observed that the local content policy may be a possible barrier to the speed of source expansion in the power matrix.
32. Macêdo, Pinho (2002). ASES: programs for analysis of wind and solar photovoltaic systems. For more
information, please visit http://www.cogen.com.br/workshop/2012/Abeolica_Tiago %20Ferreira_Forum_CanalEnergia_Cogen_12_Abril_2012.pdf
33. More information available at: http://www.epe.gov.br/leiloes/Paginas/Leilão%20de%20Energia%20de %20Reserva%20(2014)/LeilãodeEnergiadeReserva2014atraiinvestimentosdeR$7,1bi.aspx
34. WWF (2012). In addition to Large Power Plants: policies for renewable sources of electricity in Brazil. 35. BNDES reactivated the Technology Fund (Funtec) in 2006 focused on granting non-refundable resources for
the development of renewable power as semiconductors, drugs, among others. Available at: http://www.ipea.gov.br/agencia/images/stories/PDFs/livros/capitulo10.pdf.

WHAT ARE THE CHALLENGES TO ENSURE SAFE DEVELOPMENT OF PRE-SALT RESERVES FROM THE TECHNOLOGY AND ENVIRONMENTAL POINT OF VIEW? The possibility to expand the offer in the oil and gas sector is in a more advanced stage judging by the level of investments and allocation of resource in the sector. Brazil has potential to expand its reserves in 55 billion barrels of equivalent oil36 (bboe) due to the exploration of pre-salt reserves.37 Such expansion would rank the country as the eighth nation in the oil global reserves ranking in 2020. According to PNE 2030 estimates, oil production should reach 2.96 million barrels per day in 2020 remaining in this level by 2030 as a reflex of the continuous investment policy in exploration and production. Production of oil derivatives is expected to reach 3.66 million barrels per day due to the expansion of the refining capacity to meet the internal demand. Pre-salt reserves exploration is also included in a context of growing pressure regarding GHG emissions associated to the use of fossil fuels. There is a growing expectation that COP2138 negotiations
Brazil has potential to expand its reserves in 55 billion barrels of equivalent oil (bboe) due to the exploration of pre-salt reserves.
in Paris, in 2015, include countries like China, India and Brazil in the list of those subjected to restrictions of emissions. In this scenario, the Brazilian oil and gas sector may have an additional cost and have its development in the traditional mold questioned by the civil society. Results of the preliminary climate negotiation round at COP20, in Lima, on December of 201439 will be an important indicator of climatic policies that can be established in Paris.40
36. Generally used to express oil and natural gas volumes in the same unit of measurement (barrels) by
converting the gas at the rate of 1,000 m3 of gas for 1 m3 of oil. 37. PwC (2013). The Brazilian Oil and Gas Industry. 38. COP21 (21st Conference of the Parties to the United Nations Framework Convention on Climate Change). 39. COP20 (20th Conference of the Parties to the United Nations Framework Convention on Climate Change). 40. Climatic negotiations between United States and China announced on November, 2014, confirmed the
expected reduction in GHG emissions from major global emitters.

Additionally, the eventual carbon pricing may represent a significant cost increase in reserves exploration with direct impact in its development. There is now, in the international sphere, increasing pressure from investors for the sale of assets exposed to fossil fuel41 or at least to make international oil companies to disclose the impact of a possible carbon tax in the amount of their reserves.42 On the other hand, several countries have adopted policies that favor some type of restriction to GHG emission as cap and trade markets43 and the own carbon price. On September, 2014, Chile approved a regulation44
for tax carbon dioxide emissions, thus becoming the first country in South America to adopt such a measure. In addition to the unique technology challenges to pre-salt exploration in deep water and ultra-deep, there is an expectation of a more restrictive environmental regulation, following the post-Macondo45 global trend. In practice, this will mean more resources and technologies allocated to aspects related to operational safety, better response capacity in case of accident and greater consultation between operators and licensing agencies. All of this in the current scenario of drop in oil prices.
41. Investors as the Rockefeller family and the Stanford University fund recently announced the intention to sell
assets with high exposure to fossil fuels as a sign of contribution to fight global warming. Visit http://www.theguardian.com/environment/2014/sep/22/ rockefeller-heirs-divest-fossil-fuels-climate-change and http://news.stanford.edu/news/2014/may/divest-coal- trustees-050714.html
42. The international financial community debates about the impact of eventual restrictions on emissions related to the market value of companies with assets to be explored yet. Companies like Shell and Exxon already gave a public opinion on this debate. Visit http://www. carbontracker.org/report/responding-to-shell-an-analytical-perspective/ and http://s02.static-shell.com/content/ dam/shell-new/local/corporate/corporate/downloads/pdf/investor/presentations/2014/sri-web-response- climate-change-may14.pdf
43. The European Commission launched the 2030 Climate and Energy Package in January, 2014, which included goals as reduction of 40% in GHG emissions below the 1990 level and the minimum of renewable sources participation in the energy matrix by 27%.
44. Regulation provided in Law no. 20.780/2014 that establishes a series of topics for the country’s tax reform. Rules to charge a tax on CO2 emission are included on themes addressed.
45. The accident happened in April, 2010 in the Gulf of Mexico, when the oil tower Deepwater Horizon was drilling a well in Mississippi Canyon, block 252 known as Macondo. Due to technical failures associated with well cementing there was an explosion. The consequent oil spillage of 4.9 million barrels results in severe impacts to the impacts to the local flora and fauna, in addition to financial and image damages for the field operator, BP (http://www.bbc.co.uk/portuguese/noticias/2010/08/100802_ vazamento_bp_ac.shtml).

HOW TO ENSURE THE DEVELOPMENT OF THE NATURAL GAS OFFER DUE TO PECULIARITIES IN THE BRAZILIAN MARKET? Regarding natural gas, PNE indicates that total production should exceed 250 million m3 per day in 2030, which will result in a percentage increase of its participation in the Brazilian power matrix of 16% in 2030. Current Brazilian production of natural gas is of approximately 80 million m3/day - including burning, reinjection and gas used internally by Petrobras in platforms and refineries (30 to 40 million m3/day). This means that gas production should more than triple by 2030. However, this scenario depends on the overcoming of several obstacles by the gas sector in Brazil. An important aspect of the domestic production of gas is that it comes associated to oil produced offshore, mainly by Petrobras. Therefore, part of this future offer is expected to come from oil and gas-associated production in the pre-salt layer.46 With this, in addition to dilemmas faced by pre-salt production feasibility emphasized above, gas production in these areas will have to face additional obstacles. On one hand, there are still doubts regarding the gas volume that will be produced in pre-salt. On the other, part of this production
should be used by Petrobras in platforms to enable its operation and oil production, which increases even more the uncertainty about what volume of gas shall be effectively available for the domestic market. Also with regards to pre-salt production - and offshore production in general - difficulties will be faced regarding the drainage of this production. Since Petrobras47 owns these pipes and there is no guarantee of free access for other producers, almost all the gas produced offshore ends up being drained by the Brazilian state company. In the case of pre-salt, production areas are far from the coast (almost 300 km in the case of Libra field) emphasizing the need to define the draining of the gas produced. In the case of onshore production, the current volume is nearly a quarter of the total national. This production’s development mainly includes the low penetration of transport gas pipelines network concentrated in the country’s coast and owned by Petrobras.48 Fiscal and regulatory matters are also significant barriers and, in addition, companies that act in onshore gas production indicate difficulties to obtain funding for their activities, as well as the need to adapt the regulation.
46. Petrobras (2014). Petrobras Strategic Plan 2030. 47. According to article 45 of the Gas Law, no. 11.909/2009, production flow pipelines must not allow the access
of third parties. 48. The Gas Law, Law no. 11.909/2009 ensures free access of third parties to transport gas pipelines in article 32.
Finally, due to investment costs in the gas pipelines network, the development of gas production generally involves establishing an anchor market. The current gas market in Brazil is of approximately 100 million m3/day considering thermal plants dispatch level. The difference between national production is supplied through the gas imported from Bolivia or LNG. However, in favorable hydrological periods in which thermal plants are not dispatched, the national market is supplied through local production and import contract with Bolivia - without the need to import LNG. This means that good part of the Brazilian gas market is intermittent, which makes it difficult the guarantee of an offer capable of enabling transport investment. An alternative would be to
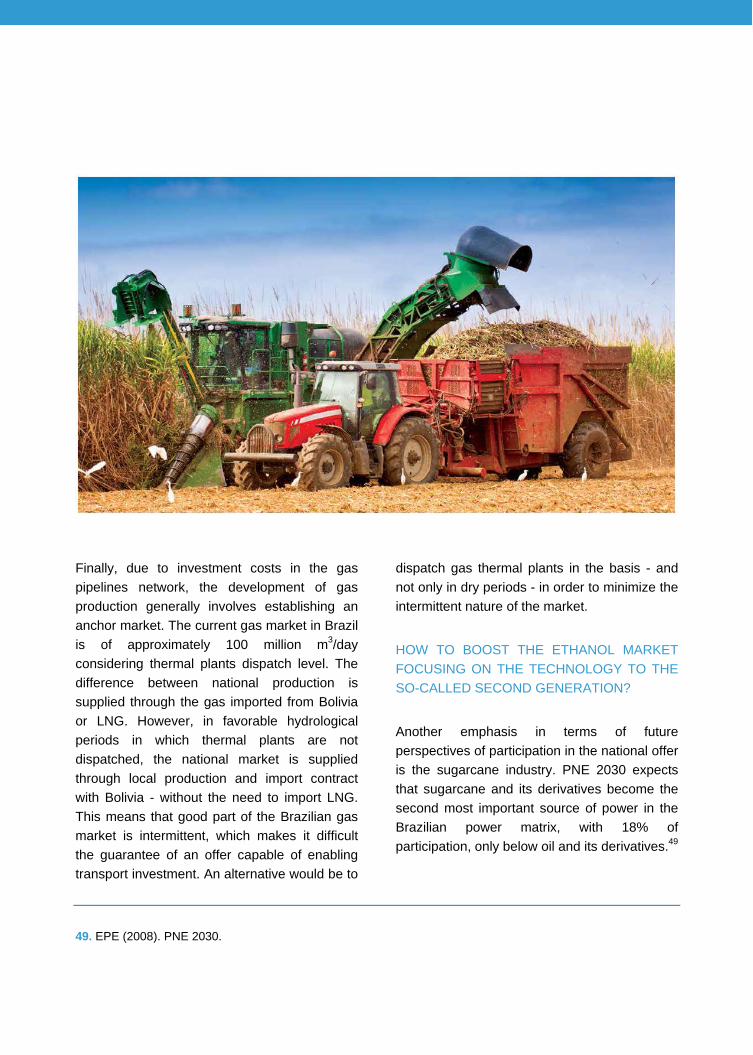
dispatch gas thermal plants in the basis - and not only in dry periods - in order to minimize the intermittent nature of the market. HOW TO BOOST THE ETHANOL MARKET FOCUSING ON THE TECHNOLOGY TO THE SO-CALLED SECOND GENERATION? Another emphasis in terms of future perspectives of participation in the national offer is the sugarcane industry. PNE 2030 expects that sugarcane and its derivatives become the second most important source of power in the Brazilian power matrix, with 18% of participation, only below oil and its derivatives.49
49. EPE (2008). PNE 2030.

The projected growth in ethanol demand also deserved attention. Currently, ethanol has expressive participation due to increased demand, a result of its inclusion in the matrix through addition to gasoline and consumption in vehicles fleet powered by hydrated alcohol and
flex fuel. Additionally, the ethanol offer tends to grow with the development of second generation plants that produce cellulosic ethanol50, a fuel considered a more sustainable and energy efficient alternative.
Cellulosic ethanol: sustainable and efficient Cellulosic ethanol produced from straw and sugarcane bagasse has great growth potential once it does not depend on the production of food for its industrialization or the expansion of sugarcane planted area, but the reuse of wastes from ethanol and sugar production. Thus, the generation process is expressively more efficient than first generation plants once, in addition to increasing the chain costs efficiency, it improves the use of the cane energy potential. Therefore, second generation plants are expected to change the market dynamics representing an opportunity of competitive differential.
Sugarcane competitiveness for energy purposes is the main factor that motivates the expressive expansion of ethanol production, including with surplus for export. Brazilian ethanol accomplishment, on February, 2010 is worth mentioning when the American Environmental Protection Agency (EPA)
classified ethanol from sugarcane as an advanced fuel51 that reduces the emission of carbon dioxide by 61% compared to gasoline, thus levering the Brazilian ethanol market. Therefore, production of other sugarcane derivatives is expected to grow, especially biomass.
50. The first second generation cellulosic ethanol plant of Brazil started to operate in Alagoas in
September, 2014, from GraalBio group. 51. Ethanol produced in the United States of America from corn is capable of reducing CO2 emissions
by 20% when compared to gasoline; therefore, it is less efficient than sugarcane ethanol.
In this context, progress of this sector can represent a strategic movement in the transition for a low carbon economy. Preparing incentives for the allocation of research and development resources in companies, universities and sector
entities is necessary, in order to boost second generation ethanol. On the other hand, the role of the Government in relation to a correct pricing of gasoline before ethanol is key for this fuel to be a natural choice for consumers.
The role of the energy policy and integrated planning facing these dilemmas The energy policy should be capable of translating the most relevant long-term choices for the country’s growth - whatever they might be - providing essential guidelines to guide investments and resources allocation for the energy sector’s development. Due to its long-term nature, reflecting a State thinking immune to Government oscillations and ensuring safety for investors, business owners and consumers is important. Guidelines should be in line with the society’s wishes and contemplate social, environmental and economic matters. To avoid eventual conflicts between the energy policy and other sectoral policies, the debate among players should be encouraged aiming at evidencing externalities in each decision and agreeing on gains and losses from each of them. Thus, matters as quality and availability of water, food offer, GHG emissions, transport matrix, among others, may be integrated to the country’s strategic goals. In this sense, energy planning, which complied to political guidelines, should move towards a convergence with the planning of other strategic sectors.

The Role of Power Demand “There is a key power source disregarded by people in general. Sometimes, it is known as conservation; others, as efficiency. It is something hard to conceptualize and mobilize; still, it can provide the greatest contribution of all for the energy balance in the near future.” (Daniel Yergin, The Search, p.15). Final consumption of liquid fuels grew 5.3% in 2013 in Brazil compared to 2012, while power consumption increased 3.6% compared to a growth in the Gross Domestic Product (GPD) of 2.3%. Such a direct relationship between GDP and energy consumption is even greater in developing countries as Brazil. According to EPE estimates, total demand for energy in Brazil should52 increase from 2013 to 2050 at an average rate of 2.2% per year. The strong and prolonged national power demand
expansion, the search for efficiency must be an important goal. Two factors that greatly influence per capita consumption of energy over time, namely: number of consumers and variation in the level of per capita income of the population. In Brazil, due to the almost universal access to electricity, increased per capita consumption should mainly reflect increased income of the population.
52. EPE (2014). Energy Demand 2050.

CHART 8 - ESTIMATED PROGRESS OF PER CAPITA CONSUMPTION OF POWER
Source: Energy Demand 2050, EPE. In a scenario of increased power demand, managing such a demand is very important not only to meet the needs in a more efficient way, but also to use natural resources rationally. WASTE REDUCTION In this context, the most efficient measure in the search for an efficient use of natural and energy resources is to fight waste via reduction of losses - whether in the power sector, use of water, transport matrix or even in oil and gas processes.
Losses can be technical in the power sector, including electrical losses from the transmission and distribution activities, or non-technical (also known as commercial) whose scope comprise situations as energy stealing and differences in revenue. The reduction of technical losses is related to investment in quality and maintenance of equipment used in transmission and distribution, as well as the search for new technologies. Commercial losses tend to occur in large social complexity area, which makes the approach
Per c
apita
con
sum
ptio
n
of p
ower
(tep
/inha
)
Per capita consumption of power
Per capita income
Per c
apita
inco
me
(U
S$ th
ousa
nd/in
ha)
to reducing such losses very specific for each area. The high index of commercial losses, especially in certain concession areas has been a challenge for regulators and utility companies, and requires a multidisciplinary analysis for its deeper understanding. Some initiatives are
being successful, but this matter is far from being satisfactorily addressed. Progress of technical and commercial losses53 in the power sector by 2013 to 2050 beholds a gradual reduction in the index of losses54, going from 17% to 13.7%.
Fighting Commercial Losses: Light Legal Program Light, one of the power utility companies in Rio de Janeiro, intensified actions to fight commercial losses of power in 2013 and the most significant one is the Light Legal Program. Related to electronic metering and through field teams in areas with nearly 15 thousand clients and high indexes of commercial losses and defaults, called Zero Loss Areas (APZs), the Program provides electricity services as checking meters, tips for efficient consumption and safety, among others. The goal is to reduce the index of losses, reduce the displacement of teams and bring the customer close to the company through partnerships with micro local entrepreneurs. According to Light’s Sustainability report 2013, the commercial loss in selected areas was 24.8% in January, 2013, and was reduced to 20.3% in December, 2013, and default almost reached 100%. In areas where the Program is implemented and counting on Pacifying Police Units (UPPs), default increased from 9.6% to 98.5% in average from 2009 to 2013.
53. EPE (2014). Energy Demand 2050. 54. The index of losses is an indicator that represents losses as energy load percentage.

However, fighting waste is only the first step towards achieving better efficiency.
Regarding the use of water, the level of losses in Brazil is alarming - almost 38% of average revenue for the country.55 Such a high index of losses becomes even more concerning if we consider the dependence of our power matrix on water and the need to expand the coverage of potable water and sewage services for the population - in 2010, the national average was 81,1% and 46.2%, respectively, according to IBGE Census data. Which means that water consumption per inhabitant in the country tends to grow as more houses have access to sanitation services. From 2009 to 2010, water consumption per inhabitant in the country grew 7.1% reaching an average of 159 liters per inhabitant per day. Low penetration of sanitation services turns the implementation of measures encouraging the
rational use of water even more important. The current scenario of large waste must be emphasized, whether due to lack of education on consumption, operational inefficiency or inadequacy in prices indication once pricing the use of water does not translate the reality between resource offer and demand. The transports matrix enables others, thus directly affecting safety, quality of life and national economic development. The transport sector has several focuses to be fought in an attempt to mitigate shortcomings such as the maintenance of transport fleet, the lack of adequate road and rail infrastructure and the low use of waterways for the flowing, for example, of agricultural products. Fighting in oil and gas sector must be specially made through control and monitoring of gas burning in flare and reinjection level in reservoirs. Burning of gas in flare, already restricted by the current regulation56 wastes resources and causes undesirable environmental impacts, thus notable contributing to GHG emission. Reinjecting associated gas, which intends to increase oil production ends up hampering the greater inclusion of gas produced domestically in the Brazilian market - especially for economic reasons.
55. Data of 2010 available at http://www.tratabrasil.org.br/datafiles/uploads/perdas-de-agua/book.pdf 56. Ordinance ANP no. 249/2000.
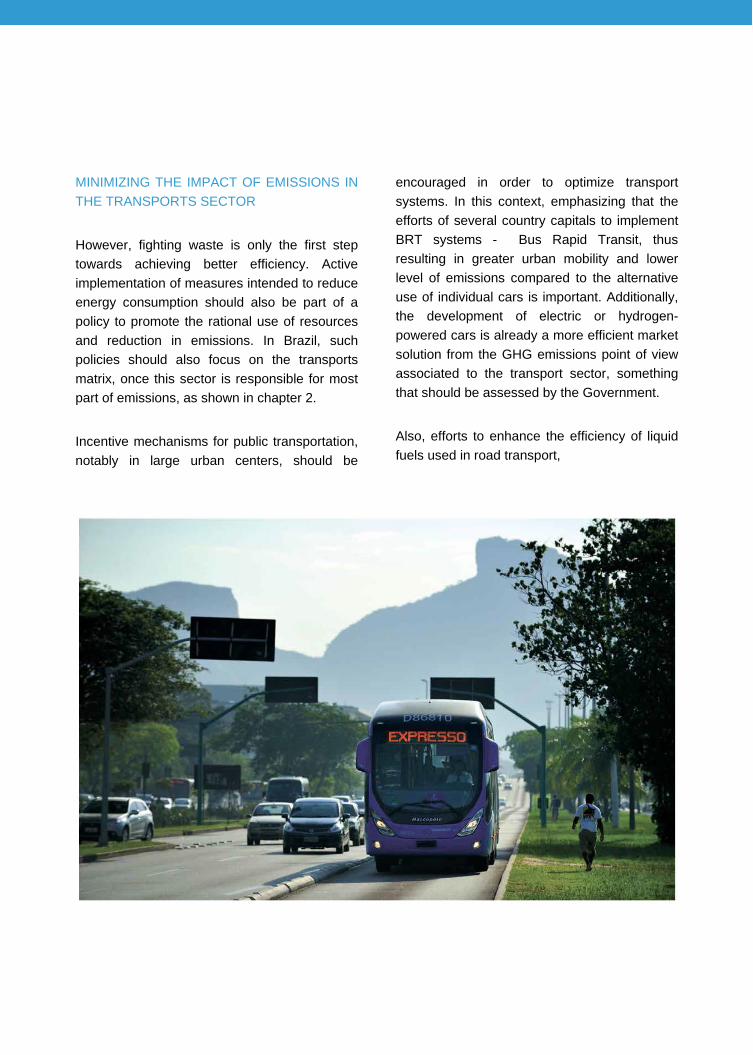
MINIMIZING THE IMPACT OF EMISSIONS IN THE TRANSPORTS SECTOR However, fighting waste is only the first step towards achieving better efficiency. Active implementation of measures intended to reduce energy consumption should also be part of a policy to promote the rational use of resources and reduction in emissions. In Brazil, such policies should also focus on the transports matrix, once this sector is responsible for most part of emissions, as shown in chapter 2. Incentive mechanisms for public transportation, notably in large urban centers, should be
encouraged in order to optimize transport systems. In this context, emphasizing that the efforts of several country capitals to implement BRT systems - Bus Rapid Transit, thus resulting in greater urban mobility and lower level of emissions compared to the alternative use of individual cars is important. Additionally, the development of electric or hydrogen-powered cars is already a more efficient market solution from the GHG emissions point of view associated to the transport sector, something that should be assessed by the Government. Also, efforts to enhance the efficiency of liquid fuels used in road transport,
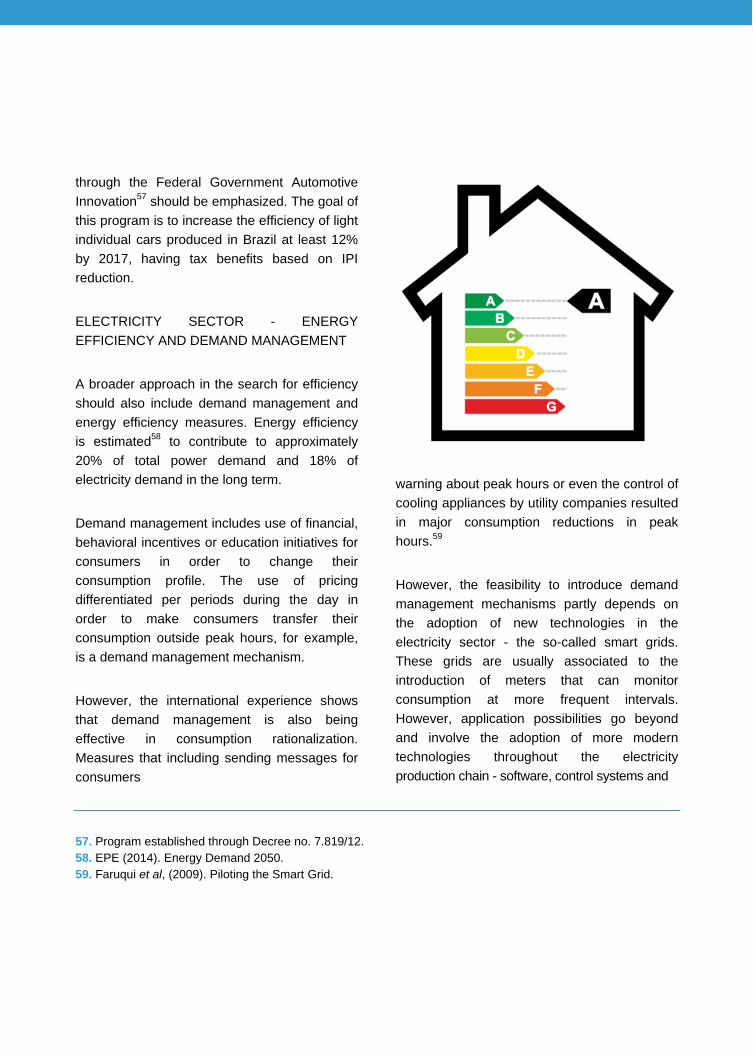
through the Federal Government Automotive Innovation57 should be emphasized. The goal of this program is to increase the efficiency of light individual cars produced in Brazil at least 12% by 2017, having tax benefits based on IPI reduction. ELECTRICITY SECTOR - ENERGY EFFICIENCY AND DEMAND MANAGEMENT A broader approach in the search for efficiency should also include demand management and energy efficiency measures. Energy efficiency is estimated58 to contribute to approximately 20% of total power demand and 18% of electricity demand in the long term. Demand management includes use of financial, behavioral incentives or education initiatives for consumers in order to change their consumption profile. The use of pricing differentiated per periods during the day in order to make consumers transfer their consumption outside peak hours, for example, is a demand management mechanism. However, the international experience shows that demand management is also being effective in consumption rationalization. Measures that including sending messages for consumers
warning about peak hours or even the control of cooling appliances by utility companies resulted in major consumption reductions in peak hours.59 However, the feasibility to introduce demand management mechanisms partly depends on the adoption of new technologies in the electricity sector - the so-called smart grids. These grids are usually associated to the introduction of meters that can monitor consumption at more frequent intervals. However, application possibilities go beyond and involve the adoption of more modern technologies throughout the electricity production chain - software, control systems and
57. Program established through Decree no. 7.819/12. 58. EPE (2014). Energy Demand 2050. 59. Faruqui et al, (2009). Piloting the Smart Grid.

advanced communication protocols that enable bidirectional communication, remote cut of supply and distance load control, among others. The technology in question also enables to detect and solve system abnormalities, in order to avoid or mitigate energy shortages, interruptions or problems in the quality of service, thus ensuring greater operating efficiency. Introducing these technologies also enables increased power offer through distributed micro generation. One of the important functionalities of the smart grid is net metering, which allows consumers to generate power at their houses (in solar panels, for example) and inject the surplus in the distribution network. This power not consumed and injected in the network may generate electricity credits subject to deduction in consumers’ bills. Such a mechanism enables60 the generation of electricity in small scale and closer to consumption, over which Aneel published Resolution no. 482/2012 establishing rules for net metering. Likewise, self-production is important in the analysis of power demand service once it already represents almost 10% of the entire electricity consumed in the country.61 The most common case of self-production is combined
heat and power, defined as simultaneous generation of thermal and electrical power from the same primary source of power. Incrementing combined heat and power is essential for the electric system, as it its a form of distributed generation located close to consumption units that requires lower investments from the power system to expand transmission networks. In addition, these systems usually have up to 85% of efficiency. An example of combined heat and power in the industrial sector would be sugarcane plants in which energy source, when burned, generates a thermal source in the form of steam and electricity. The steam jet drives a turbine connected to a generator, resulting in the generation of electricity. In periods of greater thermal activation, the use of sugarcane bagasse in the combined heat and power process can be even more attractive mainly when associated to the inclusion of the source in auctions with interesting ceiling prices. Also, another example to be highlighted is natural gas combined heat and power, which may have great utility for the industrial or trade and services market, as a mall, in which in addition to electricity generation through steam, cooling provided by the simultaneous presence of hot and cold water is a possibility.
60. To enable the expansion of distributed micro generation in Brazil, however, there are other matters -
especially related to tax - to be solved. For more information, please check https://www.ambienteenergia.com.br/index.php/2014/09/evolucao-conservadora-da-energia-solar-brasil/24444
61. EPE (2014). Energy Demand 2050.

Smart Grid Projects in Brazil. There are several cases of pilot projects in cities with smart grid technologies in Brazil comprising a series of services as smart generation and management of power, smart buildings, smart vehicles, energy storage system and smart public lighting, among others. Examples of cities with this technology include: • Búzios (RJ), with Projeto Cidade Inteligente (Smart City Project); • Sete Lagoas (MG) with Projeto Cidades do Futuro (Future Cities Project) chosen for its
electrical and telecommunication systems that favors tests, in addition to good population sample and diversified market;
• Parintins (AM), with Parintins Project chosen for having an isolated supply system; • Aparecida (SP), with InovCity project executed by the Portuguese group EDP and
chosen for its similarities with the city of Évora, a Portuguese city and successful experience;
• Other cities as Aquiraz (CE), Curitiba (PR), Fernando de Noronha (PE) and Barueri
(SP). Rio de Janeiro also has the Light Smart Grid Project with the purposes of providing the smart grid for 1.6 million consumers (40% of the company costumers) by 2018, seeking relevant results in the network supervision and commercial losses reduction program.62
62. Examples of projects of Brazil Smart Grid available at http://redesinteligentesbrasil.org.br/projetos-piloto-
brasil.html. For information on Light’s project, visit http://smartgridlight.com.br/
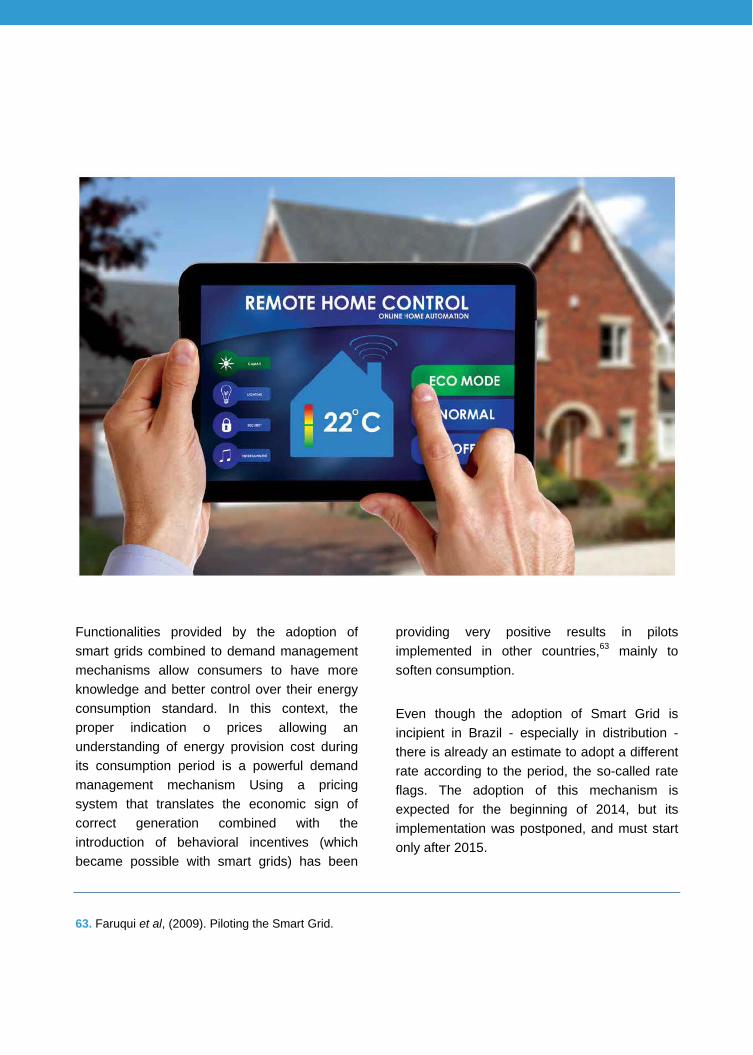
Functionalities provided by the adoption of smart grids combined to demand management mechanisms allow consumers to have more knowledge and better control over their energy consumption standard. In this context, the proper indication o prices allowing an understanding of energy provision cost during its consumption period is a powerful demand management mechanism Using a pricing system that translates the economic sign of correct generation combined with the introduction of behavioral incentives (which became possible with smart grids) has been
providing very positive results in pilots implemented in other countries,63 mainly to soften consumption. Even though the adoption of Smart Grid is incipient in Brazil - especially in distribution - there is already an estimate to adopt a different rate according to the period, the so-called rate flags. The adoption of this mechanism is expected for the beginning of 2014, but its implementation was postponed, and must start only after 2015.
63. Faruqui et al, (2009). Piloting the Smart Grid.

Rate Flags: towards an economically smart pricing An example to be implemented in Brazil for the power sector, as of 2015, are the rate flags in energy bills. Rates are only corrected once a year nowadays and in different dates for each of the 63 utility companies spread throughout the country. This system results in rate deficits, and charges by utility companies do not reflect the real costs of power generation. According to the Brazilian Electricity Regulatory Agency (ANEEL), green, yellow or red flags reflect conditions for electricity generation. The green flag indicates favorable hydrological conditions and the rate does not change. The yellow flag is used when water conditions are less favorable and when there is need for thermal dispatch. In this case, the rate is increased in R$ 1.50 for each 100 kWh consumed. The red flag indicates critical conditions that requires intense thermal dispatch and consumers pay R$ 3.00 more for each 100 kWh consumed.
In this new technological context and with the adoption of energy efficiency and demand management mechanisms, consumers play a more active role by interacting in a more influential way with the utility company. That is, the relationship between consumer and utility company providing the service is changed, which may also lead to a change in the relationship of such agents with the regulator.
Thus, it seems important to revisit and rediscuss the role of each agent in this new context in which the society will be included in the near future. Also, given the costs involved in this technology transition it become essential to understand what the society wants and is willing to pay. With this, the need to adjust the regulation in order to fit the new sector arrangement is necessary.

In this new technological context and with the adoption of energy efficiency and demand management mechanisms, consumers play a more active role by interacting in a more influential way with the utility company.
As a picture of the wishes of consumers, a research64 was conducted in 2007 with a sample represented by 100 utility companies and 1,900 US, Germany, The Netherlands, England, Japan and Australia consumers. The result showed that 83% of respondents would like to choose their utility company and almost two thirds of consumers would rather receive power from renewable sources. One same
parcel would also like to be able to generate their own power and sell it to the utility company. This shows a consumption awareness. However, in order to make this wish come true, monetary and non-monetary costs involved must be clear especially in terms of quality and safety of supply, and also from the aspect of convenience and utility from the use of power.

LIST OF ACRONYMS ANEEL - Brazilian Electricity Regulatory Agency
ANFAVEA - National Association of Automotive Vehicle Manufacturers
ANP - Brazilian National Agency of Petroleum, Natural Gas and Biofuels
APZ - Zero Loss Areas
BEN - National Energy Balance
BNDES - National Bank for Economic and Social Development
CDP - Carbon Disclosure Program
COP20 - 20th Conference of the Parties to the United Nations Framework Convention on Climate Change.
COP21 - 21st Conference of the Parties to the United Nations Framework Convention on Climate Change.
E&P - Exploration and Production
EPA - US Environmental Protection Agency
EPE - Energy Research Company
FGV - Getúlio Vargas Foundation
Funtec - Technology Fund
GHG - Greenhouse Gases
LNG - Liquefied Natural Gas
IBP - Brazilian Institute of Oil
IBRE - Brazilian Institute of Economics
IFC - International Finance Corporation
INPE - National Institute of Space Research
IPCC - Intergovernmental Panel on Climate Change
IPI - Industrialized Products Tax
IPVA - Automotive Vehicle Tax
MCT - Ministry of Science and Technology
MW - Megawatt
NGO - Non Governmental Organization
PCH - Small Central Power Plants
GDP - Gross Domestic Product
PNE - National Energy Plan
Procel - National Electrical Energy Conservation Program
PROMINP - National Oil and Natural Gas Industry Mobilization Program
SIN - National Interconnected System
UPP - Pacifying Police Units
WWF - World Wide Fund for Nature
Bibliography AGÊNCIA NACIONAL DE ENERGIA ELÉTRICA. Atlas de Energia Elétrica do Brasil 3a edição. Brasília: ANEEL, 2008. Parte II, cap. 3. AGÊNCIA NACIONAL DE ENERGIA ELÉTRICA. Capacidade de Geração do Brasil. 2014. Available at: http://www.aneel.gov.br/aplica-coes/capacidadebrasil/capacidadebrasil.cfm. Access on: November 13, 2014. AGÊNCIA NACIONAL DO PETRÓLEO, GÁS NATURAL E BIOCOMBUSTÍVEIS. Planilha de dados mensais de importações e exportações de petróleo, seus derivados e gás natural em barris. Available at: http://www.anp.gov.br/?pg=64555&m = &t1 =&t2=&t3=&- t4=&a r=&ps=&cachebust=1406655789973. Access on: November 13, 2014. AGÊNCIA NACIONAL DO PETRÓLEO, GÁS NATURAL E BIOCOMBUSTÍVEIS. Portaria ANP n° 249, de 1 de novembro de 2000. GERMANY. Gesetz für den Vorrang Erneuerbarer Energien (da tradução, Lei sobre Concessão de Prioridade para Energia Renovável). Germany, 2000. ASSOCIAÇÃO DA INDÚSTRIA DE COGERAÇÃO DE ENERGIA. SisCogen: Indicadores de Gestão. Available at: http://www.cogen.com.br/ind_lista_g.asp.. Access on: November 14, 2014.
ASSOCIAÇÃO NACIONAL DOS FABRICANTES DE VEÍCULOS AUTOMOTORES. Planilha Séries Temporais. Available at: http://www.anfavea.com.br/tabelas.html. Access on: November 13, 2014. BBC BRASIL. Vazamento despejou 4,9 milhões de barris de petróleo no Golfo. Washington, 2010. Available at: http://www.bbc.co.uk/ portuguese/noticias/2010/08/100802_va- zamento_bp_ac.shtml. Access on: November 13, 2014. BRAZIL. Decreto n° 7.725, de 21 de maio de 2012. BRAZIL. Lei n° 10.754, de 31 de outubro de 2003. BRAZIL. Lei n° 11.909, de 4 de março de 2009. BRAZIL. Lei n° 13.033, de 24 de setembro de 2014. CDP Brasil, 2014. Conexão entre mudanças climáticas e modelos de negócios: uma agenda em evolução. CDP Mudanças Climáticas 100. Available at: http://www.cdpla.net/sites/default/ files/CDP_B razil_100_Clim ate_Ch ange_Report_ pt.pdf. Access on: November 15, 2014. CHILE. Lei n° 20.780, de 26 de setembro de 2014. Chile: Ministério da Fazenda, 2014. Available at: http://www.leychile.cl/Nave-gar?idNorma=1067194. Access on: November 13, 2014.

COSTA, R. C. da; PRATES, C. P. T.. O papel das fontes renováveis de energia no desenvolvimento do setor energético e barreiras à sua penetração no mercado. Rio de Janeiro: BNDES, 2005.
Curi, W. F.; Curi, R. C.; Oliveira, E. F. C. C. de. Simulação da operação e estimativa dos benefícios sociais e econômicos do reservatório Co- remas / Mãe d'Água sujeito a múltiplos usos, in Água em quantidade e qualidade: o desafio do próximo milênio. Belo Horizonte: ABRH, 1999.
ELETROBRAS. Programa Nacional de Conservação de Energia Elétrica. Available at: http://www.eletrobras.com/elb/data/Pages/ LUMIS0389BBA8PTBRIE.htm. Access on: November 13, 2014.
EMPRESA DE PESQUISA ENERGÉTICA. Balanço Energético Nacional. 2014.
EMPRESA DE PESQUISA ENERGÉTICA. Demanda de Energia 2050. 2014.
EMPRESA DE PESQUISA ENERGÉTICA. Plano Nacional de Energia 2030. 2008.
FARUQUI, A.; HLEDIK, R.; SERGICI, S.. Piloting the Smart Grid. 2009.
INTERNATIONAL ENERGY AGENCY. World Energy Outlook, 2013
INSTITUTO ACENDE BRASIL. Análise Pós o 6° Leilão de Energia de Reserva. 2014. Available at: http://www.acendebrasil.com.br/media/ analises/20141031_AnalisePos_6oLER_(1).pdf Access on: November 13, 2014.
INSTITUTO BRASILEIRO DE ECONOMIA. Operador Único no Pré-sal: Possíveis Efeitos sobre a Economia. Rio de Janeiro: FGV, 2010.
INSTITUTO NACIONAL DE PESQUISAS ESPACIAIS. Projeto PRODES, Monitoramento da Floresta Amazônica Brasileira por Satélite. Available at: http://www.obt.inpe.br/pro- des/index.php. Access on: November 13, 2014.
INTERGOVERNMENTAL PANEL ON CLIMATE CHANGE. The Synthesis Report of the IPCC Fifth Assessment Report. IPCC, 2014. Available at: http://www.ipcc.ch/pdf/asses- sment-report/ar5/syr/SYR_AR5_LONGERRE- PORT.pdf. Access on: November 14, 2014.
LINS. Desafios na Valoração do Progresso, Catavento, Paper 02. Rio de Janeiro: Catavento, 2014. Available at http://www.catavento.biz/ wp-content/uploads/2014/05/02_Catavento_ ValoracaoProgresso_FINAL_baixa.pdf . Access on: November 18, 2014.
CONTINUES ►

MACÊDO, W. N.; PINHO, J. T.. ASES: programs for analysis of wind and solar photovoltaic systems. Pará: UFPA, 2002.
MINISTÉRIO DA CIÊNCIA E TECNOLOGIA. Fator médio mensal de emissão de CO2 por geração de energia elétrica no Sistema Interligado Nacional do Brasil.
Available at: http://www.mct.gov.br/index. php/content/view/321144.html#ancora. Access on: November 13, 2014.
MINISTÉRIO DE MINAS E ENERGIA. Relatório Smart Grid 2010. 2010.
MORAIS, J. M. DE. Programas Especiais de Crédito para Micro, Pequenas e Médias Empresas: BNDES, PROGER e Fundos Constitucionais de Financiamento.
Available at: http://www.ipea.gov.br/agencia/ images/stories/PDFs/livros/capitulo10.pdf. Access on: November 13, 2014.
PETROBRAS. Plano Estratégico Petrobras 2030. 2014.
PORTAL BRASIL. Setor de petróleo e gás chega a 13% do PIB brasileiro. Available at: http://www.brasil.gov.br/economia-e-emprego/2014/06/setor-de-petroleo-e-gas-chega-a-13-do-pib-brasileiro. Access on: November 13, 2014.
PRICEWATERHOUSECOOPERS BRASIL. The Brazilian Oil and Gas Industry. 2013.
REDES INTELIGENTES BRASIL. Projetos Piloto. Available at: http://redesinteligentesbrasil. org.br/projetos-piloto-brasil.html. Access on: November 13, 2014.
SEN, Amartya. Development as Freedom. USA: Anchor Books, 1999.
TANCREDI, ABBUD. Por que o Brasil está trocando as hidrelétricas e seus reservatórios por energia mais cara e poluente?. Núcleo de Estudos e Pesquisas do Senado. May,
2013. Texto para Discussão 128. Available at: http://www.anacebrasil.org.br/portal/files/TD- 128-MarcioTancredi_OmarAbbud.pdf Acesso em: November 15, 2014.
UNITED NATIONS. "FORESTS: New York Declaration on Forests Action Statements and Action Plans ", NEW YORk, Climate Summit, 2014. Available at http://www.un.org/climatechan- ge/summit/wp-content/uploads/sites/2/2014/09/ FORESTS-New-York-Declaration-on-Forests.pdf. Access on November 15, 2014.
WORLD WIDE FUND FOR NATURE - BRASIL. Além de grandes hidrelétricas: políticas para fontes renováveis de energia elétrica no Brasil. Brazil, 2012.


www.fgv.br/energia www.catavento.biz