energy efficient snow diversion accumulation prevention device · energy efficient snow diversion...
TRANSCRIPT

1
Energy Efficient Snow Diversion
&
Accumulation Prevention Device
Major Qualifying Project
Submitted to the Faculty of
Worcester Polytechnic Institute
in partial fulfillment of the requirements for the
Degree in Bachelor of Science
In
Mechanical Engineering
By Nithin Das
Date: 4/27/2016 Mechanical Engineering Department
Project Advisor: Pratap Rao
--------------------------------------- Professor Pratap Rao, Advisor
This report represents work of WPI undergraduate students submitted to the faculty as evidence of a
degree requirement. WPI routinely publishes these reports on its web site without editorial or peer
review. For more information about the projects program at WPI, see
http://www.wpi.edu/Academics/Projects.

2
Abstract
This MQP presents a solution to the time consuming and expensive process of snow removal.
Eleven initial designs were generated and analyzed in terms of forces, weight, cost, safety, energy
efficiency, storage/installation and internal forces. Finally a cable guided shovel design was selected for
further analysis, design refinement and prototyping. The final design consists of a shovel that is driven
along taut cables fixed parallel to the path to be cleared. The cables pass through either side of the
shovel and through a motor-pulley assembly mounted to the shovel. Opposing frictional forces on the
shovel blade and cable were determined to size the motors and cable. A prototype device was
assembled to test its performance using mulch as the substitute for snow.
Acknowledgements

3
The project was possible only due to the support of my Parents and Sister. And my Project
Advisor, Professor Pratap Rao for his guidance and insight all along the way. Also I would like to thank
my friends Nathan, Kevin, and Edson and William for their help in understanding and obtaining parts for
this projects as well as helping me brainstorm.
4
Table of Contents Abstract ......................................................................................................................................................... 2
Acknowledgements ....................................................................................................................................... 2
Table of Figures ............................................................................................................................................. 6
Chapter 1: Introduction ................................................................................................................................ 7
Chapter 2: Identification of Need ................................................................................................................. 8
Chapter 3: Background Research .................................................................................................................. 9
Chapter 4: Preliminary Designs ................................................................................................................... 13
4.1 Design 1 – Blower with Axial Fans .................................................................................................... 13
4.2 Design 2 – Blower with Centrifugal Fan ............................................................................................ 14
4.3 Design 3 – Blower on Tent With Axial Fans ...................................................................................... 15
4.4 Design 4 – Cyclical Flow Unit With Underground Blower ................................................................. 16
4.5 Design 5 – Cyclical Flow Above Ground Unit .................................................................................... 18
4.6 Design 6 – Brush/Shovel Blade With Heated Snow Gutter ............................................................... 20
4.7 Design 7 – Brush/Shovel Blade With Snow Launching Panel ............................................................ 21
4.8 Design Decision Matrix Results and Designing Actuators for Design 7 Concept .............................. 23
4.8.1 Energy Calculations for Design 2 ................................................................................................ 24
4.8.2 Energy Calculations for Brush Device ........................................................................................ 26
4.9 Design 7.1 – Spring Launcher Actuator ............................................................................................. 27
4.10 Design 7.2 – Scissor Arm Actuator .................................................................................................. 34
4.11 Design 7.4 - Telescopic Extender Arm Actuator ............................................................................. 41
4.12 Design 7.5.3 - Cable Guided Shovel Actuator ................................................................................. 50
4.13 Max Force Within Actuator ............................................................................................................ 55
Chapter 5: Materials for Cable Guided Shovel Device ................................................................................ 57
Chapter 6: Testing Setup ............................................................................................................................. 62
6.1 Cords ................................................................................................................................................. 62
6.1.1 Calculations For Actual Tension in Cord (Device off) ................................................................. 66
6.1.2 Calculations for Depth of Indentation of Cord in CGA for Generating Appropriate Friction..... 67
6.2 Electrical ............................................................................................................................................ 69
6.2.1 Calculations for Shaft RPM Under Load ..................................................................................... 70
6.3 Clearing Path ..................................................................................................................................... 72
6.4 Mulch as Snow Substitute ................................................................................................................. 73

5
Chapter 7: Testing & Observations ............................................................................................................. 75
7.1 Device Velocity .................................................................................................................................. 76
7.2 Removal Efficiency ............................................................................................................................ 77
7.3 Work & Power ................................................................................................................................... 79
7.3.1 Calculations for Work and Power .............................................................................................. 80
Chapter 8: Conclusion & Recommendations .............................................................................................. 82
Bibliography ................................................................................................................................................ 83

6
Table of Figures Figure 1 - Heating Elements By Warmly Yours ............................................................................................. 9
Figure 2 - Heating Mats by HeatTrak .......................................................................................................... 10
Figure 3 -Road Snow Melting System Tajima.............................................................................................. 11
Figure 4 - Shovel Blade ................................................................................................................................ 57
Figure 5 - Polyurethane Cord ...................................................................................................................... 57
Figure 6 - Shaft Collars ................................................................................................................................ 58
Figure 7 - Shaft Couplers ............................................................................................................................. 58
Figure 8 - Gussets ........................................................................................................................................ 58
Figure 9 - Drive Shafts ................................................................................................................................. 59
Figure 10 - Plastic Bearings ......................................................................................................................... 59
Figure 11 - C Channel .................................................................................................................................. 59
Figure 12 - Nut ............................................................................................................................................ 60
Figure 13 - Screw ......................................................................................................................................... 60
Figure 14 - Motor ........................................................................................................................................ 60
Figure 15 - Co-Axial Power Cord ................................................................................................................. 61
Figure 16 - Eye Bolt ..................................................................................................................................... 61
Figure 17 - Wooden Studs ........................................................................................................................... 61
Figure 18 - Initial Cord Setup ...................................................................................................................... 62
Figure 19 - Cord Gripping Assembly (CGA) ................................................................................................. 62
Figure 20 - Right CGA with Tensioned Polyurethane Cord Running Through ............................................ 63
Figure 21 - Visible Difference of Tensioned Cord ....................................................................................... 63
Figure 22 - Making Use of Stairwell Support for Experimental Setup ........................................................ 64
Figure 23 - Back View of Setup ................................................................................................................... 64
Figure 24 - Eyebolts Used to Connect Cord to Wooden Studs ................................................................... 65
Figure 25 - Wiring of Motors in Parallel to Power Supply .......................................................................... 69
Figure 26 - Direction Controller .................................................................................................................. 71
Figure 27 - 12 V AC Adapter ........................................................................................................................ 71
Figure 28 - Mulch Spread into the Actual Testing Box ................................................................................ 72
Figure 29 - Graduated Plactic Mug Used to Measure Mulch ...................................................................... 73
Figure 30 - Mulch Spread a About a Thickness of 9mm ............................................................................. 74
Figure 31 - Twisting of Device to Its Right on Reverse Cycle ...................................................................... 76
Figure 32 - View of Clearing Path After Forward Cycle ............................................................................... 77
Figure 33 - Top View of Clearing Path After Forward Cycle ........................................................................ 78

7
Chapter 1: Introduction
I proposed this project for my MQP in A Term of 2015 to Professor Pratap Rao. It was accepted
as a 3 term MQP that lasted through B, C, and D Term. I wanted to work on a snow accumulation
prevention device because of the realization of the crippling impact that a strong snow season could
have on busy families. Just the task of shoveling out of your driveway everyday if you have a busy
schedule can be a highly inconvenient and a morale draining task, especially first thing in the morning. It
can also be a financial burden on families with low income when heating oil bills are already so high. The
initial goal was to design a device that cleared a path continuously using air flow, but that idea was
changed to a cable guided shovel that oscillated on the driveway in regular intervals. Much later in the
project I realized that the automation aspect of having the device oscillate on the driveway was a coding
intensive task so it was discontinued. Also, the cable guided shovel required a “snow flipping device”
that does the job of transferring the shoveled snow off the edges of the driveway, however the design
and mechanics of that part was not pursued due to time constraints. Thus this report concentrates
mainly on the snow moving part of the assembly.
As one goes through this report it is important to remember that it is laid out in a chronological
order, so as calculations are being done, the designs, clearing path, method of implementation, etc.
undergo changes until the “Testing Setup” section. Many of the calculations were done in inches during
setup therefore you might notice a lot of non-rounded SI approximations. An acronym that you will
come across in later sections is CGA which is short for Cord Gripping Assembly. In the beginning of this
project I referred to the Shaft Collars as pulleys because initial designs were drafted in that manner.
However during prototyping, VEX parts were used for implementing the CGA and shaft collars were used
instead of pulleys.

8
Chapter 2: Identification of Need
The winter of 2014-2015 was a particularly harsh winter with Worcester City regaining the title
of Snowiest City in America (Telegram-Staff). Worcester received about 115.6 inches of snow( ~ 9.6
feet). This translates to a lot of energy, time, and safety risks taken to clear snow from roads and
buildings. For example, the cost of clearing driveways alone in the 2014-2015 season would have
reached about $700 at $35 per service for 20 snow days.
Snow blowers are effective, but heavy and cumbersome to be used easily by everyone. If there
is a strong wind, the snow that is being blown ends up in the user’s face, which can be very
uncomfortable. There are also maintenance costs (spark plug, oil, tires) and operating costs (gas,
battery). They are expensive and wear being exposed to the elements and varying temperatures. Snow
ploughs are fast and sometimes the only option in case of heavy snow fall. Each cleaning service is about
$35 dollars and if there are 20 snow days, that is, a total of $700.00 spent on snow removal for one
winter season. For many middle income households, this is just another unnecessary burden on top of
other bills.
Shoveling by hand is very hard especially with wet snow. It is really backbreaking work that is
time consuming, and can only be done by people who are physically capable of doing so. Others would
have to call a cleaning service.
Finally, road salt is effective only for light snowfalls, not for heavy storms. Also, they are known to have
bad effects on waterbodies and vegetation.
Thus the need boiled down to a device that can keep snow from preventing snow from
accumulating on asphalt surfaces, in an energy efficient manner, that does not use road salt or melting
solutions.
9
Chapter 3: Background Research
Methods of snow removal other than shoveling, ploughing, snow blowing, water spraying or salting are
presented below.
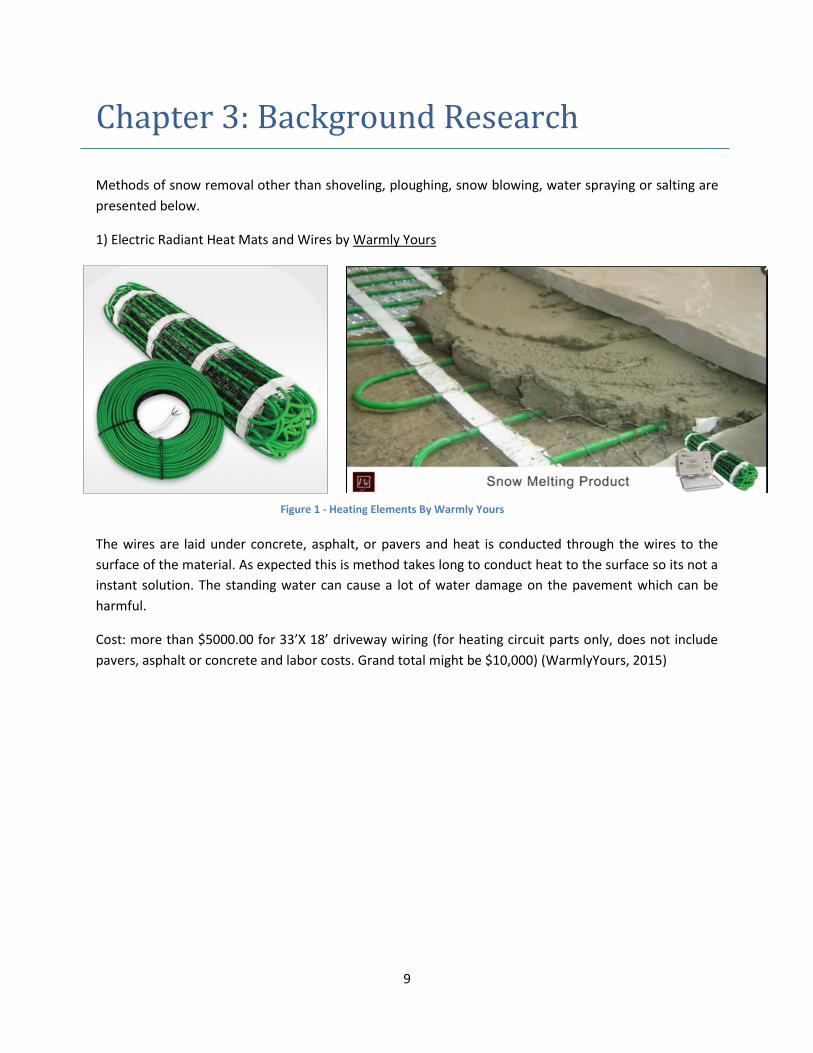
1) Electric Radiant Heat Mats and Wires by Warmly Yours
The wires are laid under concrete, asphalt, or pavers and heat is conducted through the wires to the
surface of the material. As expected this is method takes long to conduct heat to the surface so its not a
instant solution. The standing water can cause a lot of water damage on the pavement which can be
harmful.
Cost: more than $5000.00 for 33’X 18’ driveway wiring (for heating circuit parts only, does not include
pavers, asphalt or concrete and labor costs. Grand total might be $10,000) (WarmlyYours, 2015)
Figure 1 - Heating Elements By Warmly Yours

10
2) Carpeted Snow melting heat mats by HeatTrak
This is a mat that is laid on top of any given surface to melt the snow. There is no installation required.
The mats are made of an electrically operated heating element placed between two surfaces of non-slip
rubber.
Cost: $10,700 for a 33’X18’ area mats (cannot be used as a driveway mat, because it is stated on the
website that: We do not recommend the mats for parking lots or any other driveway that has a lot of
vehicular traffic) (HeatTrak, 2015)
Figure 2 - Heating Mats by HeatTrak

11
3) Japanese Road Sprinkler Systems (Tajima, Japan):
Figure 3 -Road Snow Melting System Tajima

12
Water is sprayed on the road to melt the falling snowflakes (perspectivedetective, 2009); however this
system cannot be applied in New England, because this system is meant for warmer climates. Whereas
if it were used in New England, ice would form once the temperature falls. The average low temperature
rarely goes below freezing in Tajima, whereas in Massachusetts, below freezing temperatures in the
winter months is a normal occurrence
- Weather data Tajima
http://www.worldweatheronline.com/v2/weather-averages.aspx?q=TJH&tp=1
- Weather data Massachusetts:
http://www.usclimatedata.com/climate/worcester/massachusetts/united-
states/usma0502/2015/1
Apart from the aforementioned solution there were no intrinsically different designs in the market
or in any existing patents. This meant that the existing solutions would not be energy efficient, cheap,
easily operable, or environmentally safe.
Therefore a completely new design based on the concept of keeping the snow from settling on
the ground in the first place was pursued. Two major areas of research that helped this endeavor was
the ice resistant nanomaterial panels and air flow. The nanomaterial panels were based on the design of
the slippery sides of the pitcher plant. Liquids surrounding the nanostructures on the side of the plant
create a slippery surface that helped the plant obtain its food. This idea was being pursued at MIT who
had engineered a superhyrdophobic surface which repels water (Bullis, 2014). Although this idea was
very interesting, the practicality of obtaining and paying for such expensive panels that are not widely
marketed was simply out of the budget allotted for this project.
Therefore it was decided that it would be best to proceed with the air flow design. This design
involved the use of a strong laminar airflow over a driveway surface. The laminar air flow would be
blown along one side of the driveway. As the layer of air flowed across the width of the driveway, it
would act as a conveyor belt which takes the falling snow and deposits it on the other side of the
driveway. This requires then that there be some allotted area on at least one side of the driveway that
the snow can be transferred to. The following section details the preliminary designs.

13
Chapter 4: Preliminary Designs
4.1 Design 1 – Blower with Axial Fans

14
4.2 Design 2 – Blower with Centrifugal Fan

15
4.3 Design 3 – Blower on Tent With Axial Fans

16
4.4 Design 4 – Cyclical Flow Unit With Underground Blower

17

18
4.5 Design 5 – Cyclical Flow Above Ground Unit

19
Brush/Shovel Instead of Air:
Other than the possible designs shown above, I had thought of another one which utilizes a brush/plow that pushes the snow
to one side (detailed in Designs 6 & 7 below). Once the snow reaches the other side, the brushes will push it onto the panel, and the
brushes will return to their original position. This panel will turn about an axis and will be equipped with a mechanism that allows it
to launch the snow into an area away from the driveway. There is no air flow involved. However, the design criteria/ performance
specifications from before still apply.
Note: In Design 7, the exact mechanism for the snow flipping panel/flap wasn’t detailed in the drawing since I don’t know much
about that mechanism yet. I think it could be simple as an electric motor turning a gear on the panel’s turning axis. (The turning
motion will be an impulse force, which will be able to launch the snow.)
Other mechanisms that might work: Spring loaded release, linear escapement mechanism, air bag underneath the turning
panel/flap.

20
4.6 Design 6 – Brush/Shovel Blade With Heated Snow Gutter
DESIGN 6

21
4.7 Design 7 – Brush/Shovel Blade With Snow Launching Panel
DESIGN 7

22
Design Decision Matrix (Norton, 2006)
Cost for Parts and Mfg.
Cost for Installation
Ease of Disassembling and Storage for Summer
Energy Consumption
Average Rank
Design 1 (Axial Fans- Ground)
3 1 1 2 1.75 3
Design 2 (Centrifugal Blower- Ground)
2 1 1.5 1.5 1.50 2
Design 3 (Axial Fans on Tent)
4.5 1.5 2.5 1 2.38 6
Design 4 (Cyclical Flow- Centrifugal -Underground)
5 5 1 1.5 3.13 7
Design 5 (Cyclical Flow- Centrifugal -Above Ground)
4 1.5 1.5 1.5 2.13 5
Design 6 (Brush W/ Heated Snow Drain)
2 3 2 0.25 1.81 4
Design 7 (Brush W/ Snow Launching Panel/Flap)
2.5 1 1 0.5 1.25 1

23
4.8 Design Decision Matrix Results and Designing Actuators for Design 7 Concept
In this matrix, the winning design is the one with the lowest score. That happened to be Design
7, the “Brush/ Shovel Blade with Snow Launching Panel”. In second place was Design 2 the “Blower with
Centrifugal Fan”.
As mentioned earlier, the Design Decision Matrix was one of the initial filtering steps that was
used to narrow down to a specific design. These design specifications were mostly qualitative in nature
such as cost, storage and installation difficulty. Those parameters could not hold up to empirical
scrutiny, which is why in the following sections, new designs for actuators for Design 7 will be presented.
This will be done while simultaneously performing force analyses on them. It was decided that the
laminar air flow concept would not be furthered as the fans were very expensive and testing would
require multiple ones since effective use involved blowing air into a wide open space and not some
closed system.
The actuator designs in the following sections improve upon the concepts introduced in Designs
6 and 7. The main aim for the force analysis was to be to able find where maximum forces occurred in
the actuators and what their magnitudes would be. This is because the maximum force within the
actuators directly correlates with the parameters for support forces, installation difficulty and structural
weaknesses. And comments could be made about those parameters empirically, based on the idea that
the lower the max force within the system is, the lesser the values for those parameters are going to be.
This, along with an energy analysis was done for each design.
24
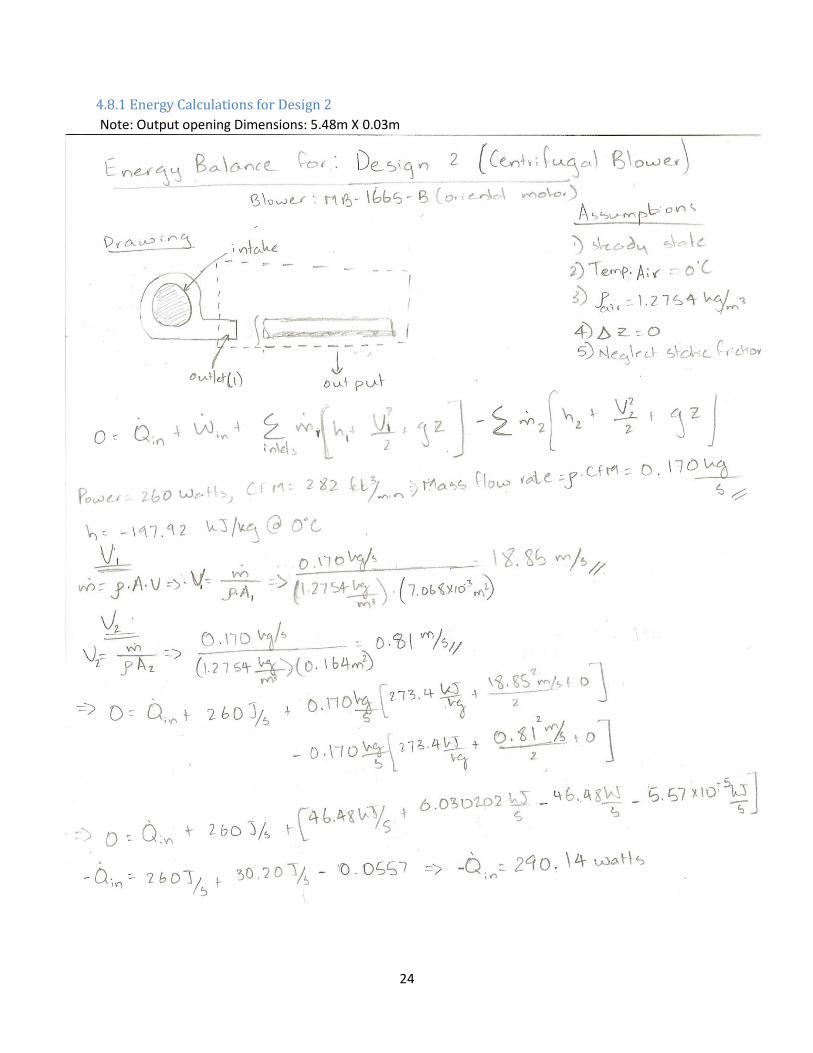
4.8.1 Energy Calculations for Design 2
Note: Output opening Dimensions: 5.48m X 0.03m

25

26
4.8.2 Energy Calculations for Brush Device

27
4.9 Design 7.1 – Spring Launcher Actuator
Free Body Diagram

28

29
Snow Weight
This is the horizontal distance (width of driveway)
For slushy snow
Shovel Weight
Material : Alloy Steel, mass calculated by SolidWorks Other Weights
Total Normal Force
Friction between Shovel and Ground
Kinetic friction between steel and concrete
Friction factor obtained from
(http://www.academia.edu/5307385/WTC2005-
63579_FRICTION_BETWEEN_STEEL_AND_ASPHALT_WITHO
UT_GOUGING_UNDER_REPRESENTATIVE_IMPACT_PRESSU
RES)
Work done to overcome shovel friction
ddriveway 4.57m
snow 800kg
m3
hsnow 2cm
Widthshovel 0.6m
Areaclear Widthshovel ddriveway 2.742m2
Vsnow Areaclear hsnow 0.055m3
Msnow snow Vsnow 43.872kg
Wsnow Msnow g 430.237N
Mshovel 9.67kg Mother 2kg
Wshovel 9.67kg g 94.83N Wother Mother g 19.613N
Fnormal Wshovel Wother 114.444N
Ns Wshovel Wother 114.444N
s 0.75
Fsg s Ns 85.833N
Wsg Fsg ddriveway 392.255J

30
Energy
Assuming that snow travels in a parabolic form
Let us take this equation
Assuming the above graph is the trajectory for the snow.
Launch Angle
Height of vertex in meters
Range in meters
Launch Angle
Launch Velocity
x 0 0.1 10
y x( ) 4x x2
0 2 4 60
2
4
6
y x( )
x
S 4m
r 4m
launch atan4S
r
75.964deg
vfr g
sin 2launch 9.13
m
s

31
Energy for Launching Snow in Air
Total Energy for One Launch
Total Energy = Energy for Launching snow in Air + Work done to overcome frictional energy
This total energy should equal to the PE stored in the spring
Choosing Electric Motor
where τ is torque and n is the rpm
30 seconds is the total time we are allotting
the motor to fully compress the spring From before we have
if we assumed that the shaft had an rpm of 60
Torque of Motor has to be
M Msnow Mshovel Mother 55.542kg
KElaunch1
2
M vf
2 2.315 10
3 J
E KElaunch Wsg 2.707 103
J
P 2 n( )
60s
E PE
30s90.238W
n 60
P 2 n( )
60ssolve 14.361874226081265186W s 14.362N m
14.4N m

32
Spring Specifications
For these sections, all information and equations are obtained from Chapter 13 (Spring Design)
of Norton Machine Design.
We know that W=F*d, therefore we obtain, F from the total energy
where k is the spring constant, and y is the deflection
spring deflection, y is equal to length of the driveway, since that is how far the spring
need to expand to clear snow off driveway
Spring constant
Diameter of Coils - Preferred range of C is from 4 to 12, I will choose 8 (Norton, Spring Design
- Assuming d = 4mm
Therefore, coil diameter D equals
Determining Spring Material
The spring material that we are analyzing is 228 ASTM/SAE 1085, Music Wire, because it is the
toughest, most widely used material for small coil springs. It has the highest tensile and fatigue
strength of all spring wire. (Norton Machine Design)
FE
ddriveway
592.374N
Fspring k y
Fspring F 592.374N
y ddriveway
kFspring
y129.622
kg
s2
CD
d
C 8 d 0.004m
D C d 0.032m

33
Length of Spring
F - force on the spring
D - coil diameter
N.t - number of coils
d - wire diameter
G - shear modulus
For squared ground ends
Number of active coils
Shut Length of Spring
Cost of Spring
Total Cost: $6.43 based on http://www.acxesspring.com/spring-calculator.html
Max Force within System
This Force occurs in the Spring when it is fully loaded.
y8 F D
3 Na
d4
G
F Fspring 592.374N D 0.032m d 0.004m G 80 109
N
m2
y8 F D
3 Nt
d4
G
solve Nt 602.71248569289890984 602.712
Nt 391
Na Nt 2 389
Ls Na d 1.556m
Fmax F 592.374N

34
4.10 Design 7.2 – Scissor Arm Actuator
Free Body Diagram
Section View

35
In the Above FBD's please assume that there are roller balls at the base of points B and D.
This is to allow screw jack to act as if were in the upright position.

36
Snow Weight
Shovel Weight
Material : Alloy Steel, mass calculated by SolidWorks Other Weights
Friction between Shovel and Ground
Kinetic friction between steel and concrete
Friction factor obtained from
(http://www.academia.edu/5307385/WTC2005-
63579_FRICTION_BETWEEN_STEEL_AND_ASPHALT_WITHO
UT_GOUGING_UNDER_REPRESENTATIVE_IMPACT_PRESSU
RES)
Work done to overcome shovel friction
Friction Between Snow and Ground
ddriveway 4.57m
snow 800kg
m3
hsnow 2cm
Areasnow 0.6m 1 m 0.6m2
Vs Areasnow hsnow 0.012m3
Msnow snow Vs 9.6kg
Wsnow Msnow g 94.144N
Mshovel 9.67kg Mother 2kg
Wshovel 9.67kg g 94.83N Wother Mother g 19.613N
Ns Wshovel Wother 114.444N
s 0.75
Fsg s Ns 85.833N
Wsg Fsg ddriveway 392.255J
s 0.50
Fs s Wsnow 47.072N Ws Fs ddriveway 215.119J

37
Determining Screw Friction
Where N is the weight of the screw
Where and is the coefficient of friction
in the major and collar diameter
Determining Components of Force at Point D
On calculation we get
N 3kg g 29.42N
c 0.12 c 0.15
Fscrewfric N c N 7.943N
F y 0 Fscrewfric FD cos ( ) 0
F x 0 Fsg Fsnow FD sin ( ) 0
87deg
FD 202.30N
FDx FD sin ( ) 5.943 103
N
FDy FD cos ( ) 311.486N

38
Determine Torque Required to Start the Scissors
Assume following dimensions
single square thread screw
major diameter
minor diameter
pitch, distance between center of threads
friction of major diameter
friction of minor diameter
mean diameter
Instead of W put in Fscrew
Power Required for Overcoming Friction
Work
Power
Obtaining Power Rating from Torque Equation
where τ is torque and n is the rpm
Total Power Rating for Motor
d 22mm
dc 14mm
p 8mm
fc 0.12
f 0.15
dm dp
2
0.018m
Torque Fscrewfric dm
2
f dm p
dm f p
Fscrewfric fc dc
2
9.504 104
N m
Frictot Fsg Fscrewfric Fs 140.848N
W Frictot ddriveway 643.675J
PfricW
30s21.456W
n 60
Ptorque 2 n( )
60s0.176W
Ptot Pfric Ptorque 21.632W

39
Stress Within Screw
For this Statically Indeterminate System, we will use Principle of Virtual Work
Assuming that each Linkage has a length, L
based on height of Shovel Head
in radians (10 degrees)
Assuming:
1) Arbitrary infinitesimal change in the position of the Shovel Head, δ .s
2) Change in Energy of System = 0
Therefore
Stress within Screw:
Taking material as Cast Iron we see the Young's Modulus is 10^9 Pa or 1 GPa
which is well over the max stress for the scissor device
L 0.15m
.17453
x 2 L sin ( )
y L cos ( )
x 2 L cos ( )
y L sin ( )
U 0
U Ftot x F y
U Wtot 2 L cos ( ) ( ) F L sin ( ) ( )
Fscrew 2cot ( ) W 7.301m kN
Areascrew1
4
dc2
1.539 10
4 m
2
Fscrew
Areascrew
47.429m MPa

40
Max Force in System
The Max Force occurs at F.D
Fmax FDx 5.943 103
N
41
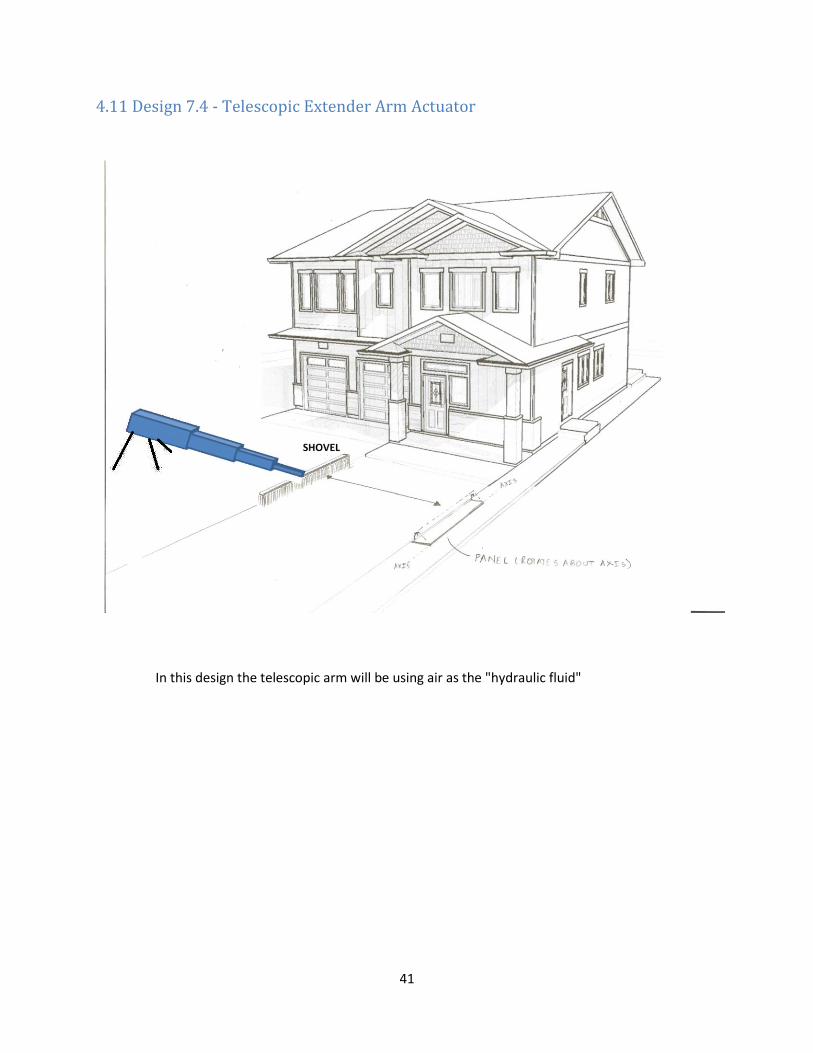
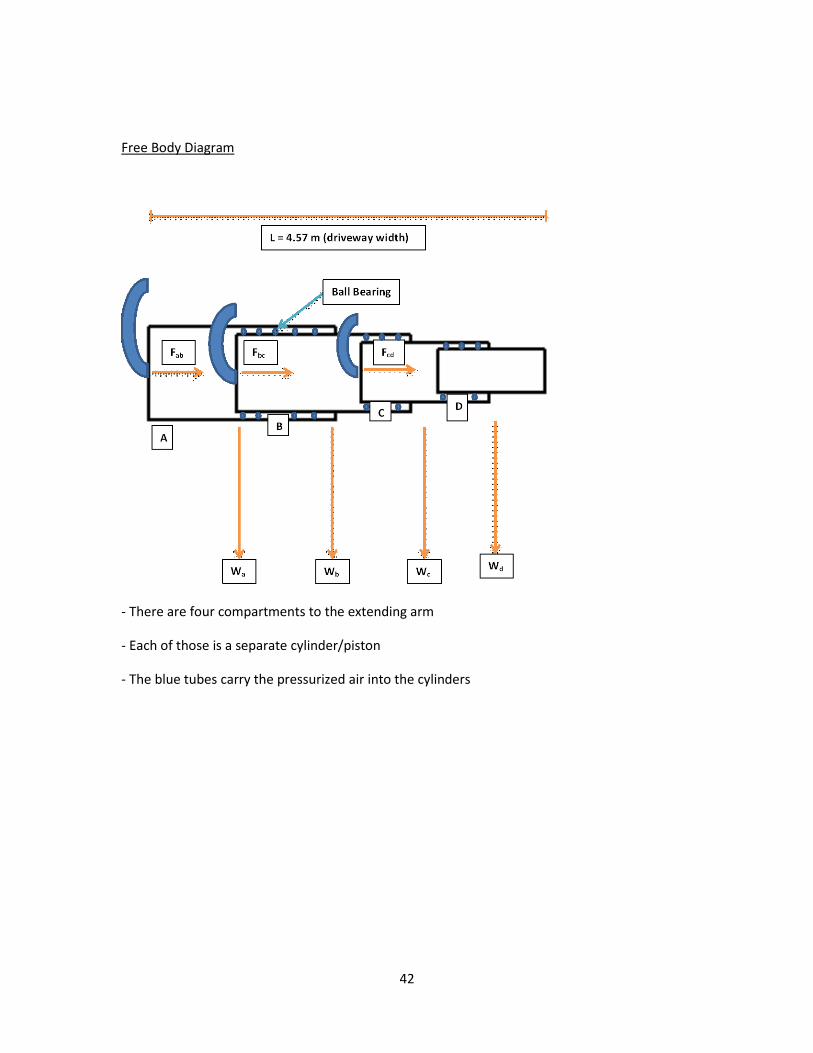
4.11 Design 7.4 - Telescopic Extender Arm Actuator
In this design the telescopic arm will be using air as the "hydraulic fluid"
42
Free Body Diagram
- There are four compartments to the extending arm
- Each of those is a separate cylinder/piston
- The blue tubes carry the pressurized air into the cylinders
43
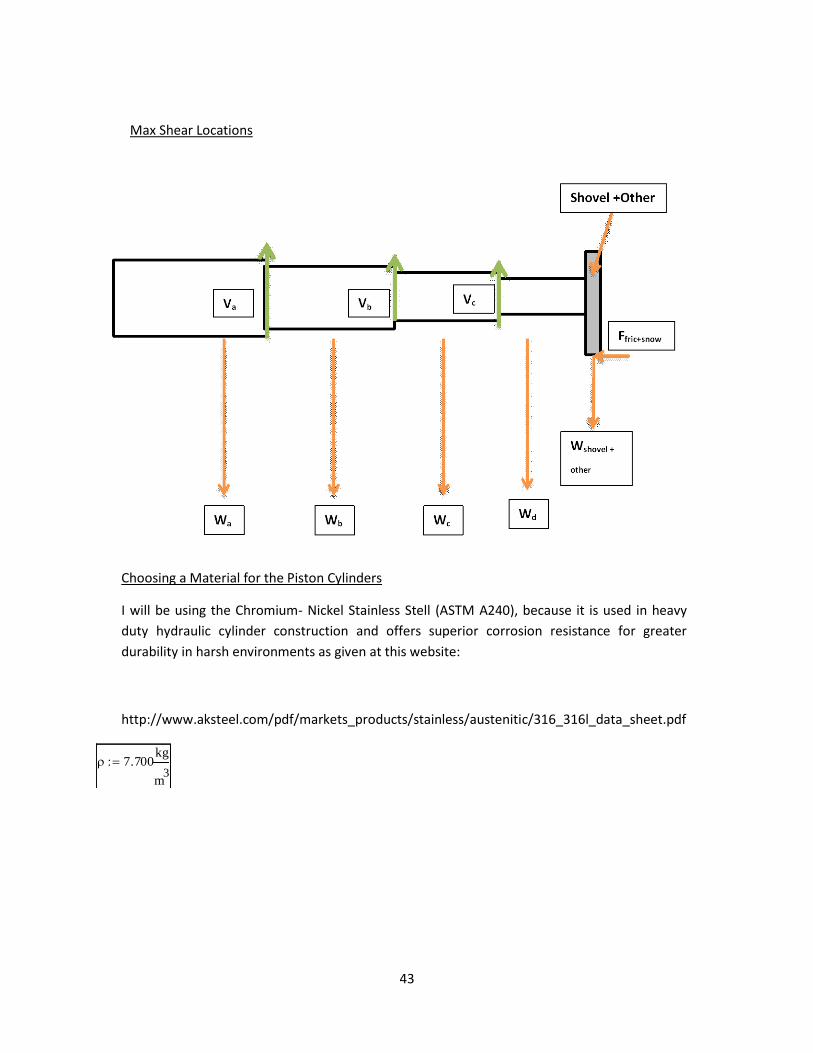
7.700kg
m3
Max Shear Locations
Choosing a Material for the Piston Cylinders
I will be using the Chromium- Nickel Stainless Stell (ASTM A240), because it is used in heavy
duty hydraulic cylinder construction and offers superior corrosion resistance for greater
durability in harsh environments as given at this website:
http://www.aksteel.com/pdf/markets_products/stainless/austenitic/316_316l_data_sheet.pdf

44
Dimensions of the Arm
When extended the length of the arm has to equal the length of the driveway, 4.57 m
Based on the FBD arrangement, the lengths and areas of the cylinders are as follows for a 4.57 m driveway
Although the following may look confusing, it is just playing around with ratios to find the right
dimensions
Calculating Volume of cylinders, given that the walls have a 1.5 cm thickness
Weight of Each Cylinder
Le 4.57m
La 1.492mAa
La
3
2
0.247m2
Lb 1.260m
Lc 1.061mAb
Lb
3
2
0.176m2
Ld 0.756m
Ac
Lc
3
2
0.125m2
Ad
Ld
3
2
0.064m2
Va 3cm Aa 2cm La2
Ab 1.5 cm 0.049m
3
Vb 3cm Ab 2cm Lb2
Ac 1.5 cm 0.035m
3
Vc 3cm Ac 2cm Lc2
Ad 1.5 cm 0.025m
3
Vd 3cm Ad 2cm Ld2
0.013m
3
Wa Va g 3.722N Wc Vc g 1.912N
Wb Vb g 2.656N Wd Vd g 1.007N

45
Choosing Bearing Type
- We will look at the max shear the cylinder has to withstand in order to determine the right type of
bearing for this application. We are choosing Cylinder A as it supports the weight of all the rest of
the Telescopic Arm.
- In this we will assume that the moment on the arm is 0
Snow Weight
This is the horizontal distance (width of driveway)
For slushy snow
Shovel
Material : Alloy Steel, mass calculated by SolidWorks Other Weights
Max Shear Force
- Since the telescopic arm is a square shape, a normal roller bearing wouldn't fit this application
- So we will be using ball transfer (image below)
- The make is SKF Type 3000, which can bear loads of up to 245 N
- http://www.skf.com/binary/30-97863/Ball-Transfer-units.pdf
ddriveway 4.57m
snow 800kg
m3
hsnow 2cm
Widthshovel 0.6m
Areaclear Widthshovel ddriveway 2.742m2
Vsnow Areaclear hsnow 0.055m3
Msnow snow Vsnow 43.872kg
Wsnow Msnow g 430.237N
Mshovel 9.67kg Mother 2kg
Wshovel 9.67kg g 94.83N Wother Mother g 19.613N
Vmax Wb Wc Wd Wshovel Wother 120.018N

46
Bearing Chosen: SKF Ball Transfer, Type 3000, max load of 245 N
Number of Ball Bearings to be Used
Cylinder A will need to support V.max, which is
- And since the rest of the cylinders will be supporting less than we don't need to calculate the values for
those
- It would seem one of the bearings would be more than enough for supporting each cylinder, but
since the next cylinder inside it wouldn't be balanced, it is necessary to have 4 on the top and
bottom and 2 on either side
- We would need a total of 36 ball transfers
Total Number of Ball Transfers: 36
Price For Ball Transfers
Using the price of a similar SKF Ball transfer @ $41.46 per piece we calculated the price to be:
http://www.mscdirect.com/product/details/06377493
Vmax 120.018N
Pball $1 493

47
Bearing Fricition
http://www.irusa.com.br/catalogos/Bosch%20-%20Rexroth/Esferas%20Transferidoras.pdf
Assuming the highest coeffecient of friction of
Normal force at Cylinder A
Max Normal at A
Normal force at Cylinder B
Max Normal at B
0.008
Na Vmax
Fa Na 0.96N
Nb Wc Wd Wshovel Wother 117.362N
Fb Nb 0.939N

48
Normal force at Cylinder C
Max Normal at C
Friction between Shovel and Ground
Kinetic Friciton between steel and concrete
Friction factor obtained from
(http://www.academia.edu/5307385/WTC2005-
63579_FRICTION_BETWEEN_STEEL_AND_ASPHALT_WITHO
UT_GOUGING_UNDER_REPRESENTATIVE_IMPACT_PRESSU
RES)
Work done to overcome shovel friction
Friction Between Snow and Ground
Total Friction Force
Air Pressure Needed for 1 Sweep
The air Pressure needed at each cylinder to be able to overcome Friction
Nc Wd Wshovel Wother 115.451N
Fc Nc 0.924N
Ns Wshovel Wother 114.444N
s 0.75
Fsg s Ns 85.833N
Wsg Fsg ddriveway 392.255J
s 0.50
Fs s Wsnow 215.119N Ws Fs ddriveway 983.092J
Ftot Fa Fb Fc Fsg Fs 303.774N
Atot Ab Ac Ad 0.365m2
Ptot
Ftot
Atot
832.294Pa

49
The Max Force is present throughout the arm when it is fully extended.
Work done by Air on Cylinders
Volume for expansion
we have
Power Rating for Air Compressor
A commercially available air compressor of 150 W is sufficient for this application.
Price will be about $50- $150
Total Price with ball bearings might cost about $1600.00
Max Force in System
V Aa La Ab Lb Ac Lc 0.724m3
W Ptot V
0
V
V1
V
d
W Ptot V ln 0.724( ) 194.613J
PW
10s19.461W
Fmax Ftot 303.774N

50
4.12 Design 7.5.3 - Cable Guided Shovel Actuator
Free Body Diagram

51
Z-Y Plane View (Bottom View)
- In this design the cable acts like a track. There are two holes on either side, and a double pulley
tensioner allows the shovel to pull itself to either side of the driveway.
- The cable is in tension by being anchored at either side of the driveway.

52
Snow Weight
This is the horizontal distance (width of driveway)
For slushy snow
Shovel Weight
Material : Alloy Steel, mass calculated by SolidWorks Other Weights
Friction between Shovel and Ground
Kinetic friction between steel and concrete
Friction factor obtained from
(http://www.academia.edu/5307385/WTC2005-
63579_FRICTION_BETWEEN_STEEL_AND_ASPHALT_WITHO
UT_GOUGING_UNDER_REPRESENTATIVE_IMPACT_PRESSU
RES)
Work done to overcome shovel friction
ddriveway 4.57m
snow 800kg
m3
hsnow 2cm
Widthshovel 0.6m
Areaclear Widthshovel ddriveway 2.742m2
Vsnow Areaclear hsnow 0.055m3
Msnow snow Vsnow 43.872kg
Wsnow Msnow g 430.237N
Mshovel 9.67kg Mother 2kg
Wshovel 9.67kg g 94.83N Wother Mother g 19.613N
Ns Wshovel Wother 114.444N
s 0.75
Fsg s Ns 85.833N
Wsg Fsg ddriveway 392.255J

53
Friction Force On Pulley/ Cable
For this design we will take the material of the pulley and the cable to be rubber. I chose rubber
because the coefficient of friction between rubber and rubber is 1.15, which is very high.
Larger μ helps maintain contact between the pulley and the cable so that a smaller normal force
required to maintain the same amount of traction.
Assuming a Normal Force at points, E,F, G and H onto the cable,
Friction force on Cable,
Work done to overcome friction between pulley and cable
(It's 2*F.c because there are two cables)
Friction Between Snow and Ground
Choosing Electric Motor
Total Work required to overcome Friction,
where τ is torque and n is the rpm
30 seconds is the total time we are allotting
the motor to fully compress the spring
if we assumed that the shaft had an rpm of 60
Torque of Motor has to be
1.15
Npc 15N
Fpc Npc 17.25N
Wpc 2Fpc ddriveway 157.665J
s 0.50
Fs s Wsnow 215.119N Ws Fs ddriveway 983.092J
W Wsg Wpc Ws 1.533 103
J
P 2 n( )
60s
PW
30s51.1W
n 60
P 2 n( )
60ssolve 8.1328854973582022585W s 8.133N m
8.1N m

54
Moment
- In the first FBD there is a net moment that occurs as a result of F.cable on the top and F.cable and
F.snow on the bottom
- To counteract this, it was discussed that the weight in the pulley apparatus region should be
increased, which would cause counteractive moment.
Max Force in System
The Max Force gets transferred through the cables as the motor tries to overcome the friction forces.
Fmax Fsg 2 Fpc 120.333N

55
Max Force Within System
Spring Loaded Launcher
(Chameleon Design)
593 N
Scissor Arms w/ Screw Jack
5943 N
Telescopic Arms
304 N
Rope Pulling Shovel
120.33 N
4.13 Max Force Within Actuator

56
After the calculations, it turned out that the “Rope Pulling Shovel” or Cable Guided Shovel-
Design (7.5.3) was the best one, in terms of internal forces. It is also the second cheapest of the
designs, the first being the Spring Launcher. The following sections will be about the prototype
and its testing.

57
Chapter 5: Materials for Cable Guided
Shovel Device
Some of the materials that were required for building this device were bought and some were
acquired from the robotics lab in Atwater Kent and some I had at home. Below is a list of the items that
were used to build the device and its testing setup.
1) Heavy Duty Adjustable Rolling Snow Pusher With 6" Rubber Wheels ($59.99)
2) Chemical-Resistant Polyurethane Cord 1/4" Diameter ($18.50 for 25ft)
Figure 4 - Shovel Blade
Figure 5 - Polyurethane Cord

58
3) Shaft Collar, 16 Pack ($7.99)
4) Shaft Coupler, 5 Pack ($4.99)
5) Gusset Pack ($7.49)
Figure 6 - Shaft Collars
Figure 7 - Shaft Couplers
Figure 8 - Gussets
59
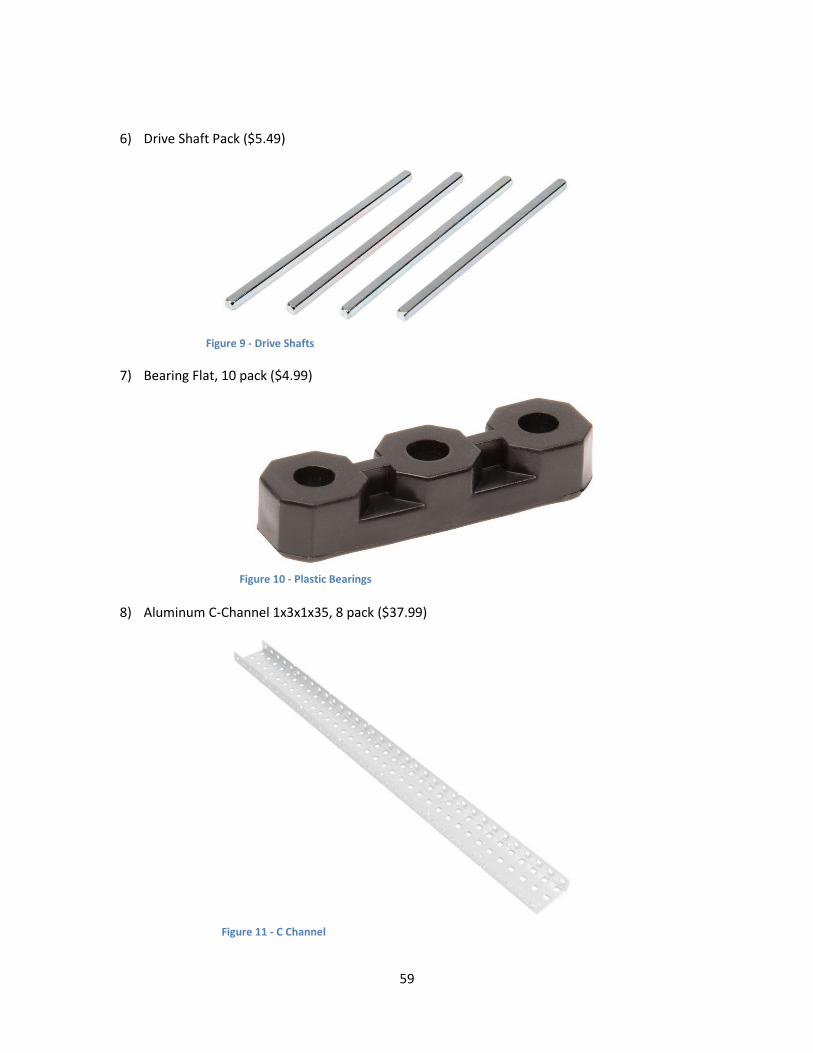
6) Drive Shaft Pack ($5.49)
7) Bearing Flat, 10 pack ($4.99)
8) Aluminum C-Channel 1x3x1x35, 8 pack ($37.99)
Figure 9 - Drive Shafts
Figure 10 - Plastic Bearings
Figure 11 - C Channel

60
9) Nut 8-32 Hex, 100 pack ($2.99)
10) Screw 8-32 x 0.750", 100 pack ($9.99)
11) 12V DC Motor 251rpm (2 Motors) GB37Y3530-12V-251R. ($29.00 for 1-> $58.00 total)
Figure 12 - Nut
Figure 13 - Screw
Figure 14 - Motor

61
12) 18-2 Silver Stranded Lamp Wire ($3.70)
13) Eyebolt, 1/2-13, 1In, Turned Wire ($1.52 for 4-> $6.08)
Figure 16 - Eye Bolt
14) White Wood Studs ($2.49 for 2-> $4.98)
Total Cost: $230.18
Figure 15 - Co-Axial Power Cord
Figure 17 - Wooden Studs

62
Chapter 6: Testing Setup
6.1 Cords
One of the main unaddressed elements in the design process was the fixture method for the cords. The
initial design was as shown below:
However three major changes were made to this:
1) The area where the edges of the holes on the shovel blade meet the polyurethane cord, high
frictional forces were developing. This was not only an added opposing force on the motors but
also the friction would wear away the cord, making it more likely to fail under high tension.
Therefore during setup it was decided that the cord would not be fixed at an angle to the floor
surface but parallel to it.
An added advantage was that the cord gripping assembly now received the cord at one set
position as opposed to varying angles depending on the position of the device relative to the
fixed ends of the cord.
2) The cord ended up being tensioned to 182 N, 76 N higher than original calculations (calculations
follow). This was necessary because the diameter of the cord was 6.35 mm, whereas there was
only a gap of 2mm at the CGA. The stretching was required to decrease the diameter of the cord
down to 3mm.
Driveway Surface
Cord
Shovel Blade
Figure 19 - Cord Gripping Assembly (CGA), both shafts go through a set of 5 Shaft Collars (Pulleys)
2mm width
Figure 18 - Initial Cord Setup

63
Figure 20 - Right CGA with Tensioned Polyurethane Cord Running Through
Figure 21 - Visible Difference of Tensioned Cord

64
3) And because of this increased tension force, fixture methods based on stakes in the ground
were not going to be enough to hold the cord rigidly. Therefore the whole fixture methods was
implemented as such on concrete floors with the help of staircase support frames:
Figure 22 - Making Use of Stairwell Support for Experimental Setup
Figure 23 - Back View of Setup

65
As shown above, two eyebolts were drilled into a wood stud which then was placed behind the
staircase support frame, with one stud at each end of the clearing path. The polyurethane cord was
then looped through the device, tied to both studs and tightened until there was an optimal gripping
force as well as easy movement at the CGA.
Figure 24 - Eyebolts Used to Connect Cord to Wooden Studs

66
6.1.1 Calculations For Actual Tension in Cord (Device off)
Given:
1) The initial and final lengths of the cord are 𝑙𝑖 and 𝑙𝑓 , respectively
2) The elastic modulus of the Polyurethane cord, 𝐸1 (Engineering-Toolbox, 2016a)
3) Diameter of the stretched cord, 𝑑
Solving for 𝐹 we get the tension within the cord:
F F
Asolve F 181.81436458167089931Pa m
2 181.814N
lf 2.4606m li 1.2128m l lf li 1.248m
E 0.025 GPa 25 MPa
F
A
E
l
li
solve 2.5721470976253298153e7Pa 25.721 MPa
d 3mm 3 103
m
A d
2 4
7.069 106
m2

67
6.1.2 Calculations for Depth of Indentation of Cord in CGA for Generating Appropriate Friction
Since the cord needed to be gripped between the Shaft Collars to generate sufficient friction, we
needed to know how much the cord need to be compressed by the shaft collars when it is pulled
through the CGA. Since this was a contact mechanics problem, we used the depth of indentation
formula based on the contact area between a sphere and plane.
Given:
1) Opposing Frictional Force, 𝐹𝑓
2) Radius of the Cord, 𝑑
3) Elastic Modulus of the Polyurethane and Shaft Collar, 𝐸1 and 𝐸2
4) Poisson’s Ratio of Polyurethane and Shaft Collar, 𝑣12
and 𝑣12
(Boyce, 2003) and
(Engineering-Toolbox, 2016b)
The Depth of Indentation is given by the formula:
𝑑 = (9𝐹2
16𝑅𝐸`2)
1/3
(Wikipedia-Contributors, 2016)
The Adjusted Elastic Modulus is Given by:
1
𝐸`=1 − 𝑣1
2
𝐸1+1 − 𝑣2
2
𝐸2
The frictional force bore by a single shaft (there are 4 shafts, with shaft collars on them, 2 shafts in each
CGA, 2 CGA’s on either side of the shovel blade, please refer to Figures 19 and 20)
Ff 158.65N
Fsingle
Ff
439.663 N

68
Elastic Moduli and Poisson’s Ratios of Polyurethane (𝐸1, 𝑣1) and Steel (𝐸2, 𝑣2)
Radius of the Polyurethane Cord
Adjusted Elastic Modulus
Solving Equation for Depth of Indentation by one Collar
Total Compression between 2 Collars
Thus, the optimal compression of the cord would have been about 1.43mm. This was 0.43 mm
higher than the actual achieved compression of 1mm. The initially calculated opposing friction force of
158 N was based on much heavier device than the one finally assembled. So the compression was
probably much higher than required. As for the tension in the cord, it needed to be tensioned that high
to stretch the 6.35 mm diameter cord to about 3mm so that it could fit between the 2mm gap of collars
in the CGA, it’s not that the tensioning actually had to be that high.
E1 25MPa E2 200MPa
v2 0.28v1 0.49
Rcord 0.003m
E'1
E'
1 v12
E1
1 v22
E2
solve E' 28.568163638441320992MPa
d9 Fsingle
2
16 Rcord E'2
1
3
0.712 mm
dtot d 2 1.425 mm

69
6.2 Electrical
The electrical wiring for this device is as shown below:
It is important to note that the polarity of the connecting wires of the motors are switched. This
is because they are placed on the opposite sides of the CGA so that if the device is to move forward, the
motor on the left needs to turn in a counterclockwise manner whereas the motor on the right,
clockwise.
Figure 25 - Wiring of Motors in Parallel to Power Supply

70
The motors (DF Robot GB37Y3530, 251 RPM) were powered using a 12V AC adapter as per
power rating requirements for that model. They were wired in a parallel setup because the motors were
rated to run at 250 RPM at 12V which was too fast for this application. Wiring them in parallel helped to
reduce the RPM. Under load, the motors had an RPM of about 40. Not only was the parallel wiring
responsible for lowering the RPM but there were also significant friction forces at the plastic bearings as
a result of the 3mm cord pushing against the shafts which rubbed on the plastic bearings increasing
rotational friction. The calculations for the RPM under load are shown below and tabulated in Table 1.
6.2.1 Calculations for Shaft RPM Under Load
Given:
1) Diameter and circumference of the shaft collars, 𝑑 and 𝑐 respectively
2) Length of the clearing path, 𝑙
3) Average time taken for forward cycle, 𝑡
Since the motor shaft goes through the shaft collars, the diameter of the collars was needed
because the collars were in direct contact with the cord. First the diameter and circumference of the
collar is calculated.
The length of the clearing path is used to determine the number of revolutions in one cycle.
Number of revolutions are divided by the average time it takes for one forward cycle, then the RPM is
found.
Also, a simple “direction controller” was made so that the user
could control the direction of the device, forward and back by switching the
polarity. It is controlled by taking the positive and neutral wires from the
12V AC adapter and touching the wires on the
controller to go in one direction and reversing the
d 11mm 0.011 m c d 0.035 m
l 0.9525 m
revsl
c27.563
t 42.39 s
revs
t0.65
1
s
RPMrevs
t
60 39.0131
s

71
wires to go in the opposite direction.
Figure 27 - 12 V AC Adapter
Figure 26 - Direction Controller

72
6.3 Clearing Path The path that was delineated to be cleared was done using green tape as shown below. Initially
the clearing path was 67.31cm X 178.43cm, but the dimensions were changed (length only) to 67.31cm
X 95.25cm to facilitate clean up between trials thus reducing the amount of time for each trial. That’s
why there are two rectangular boxes on the clearing path. Therefore only the first box was the one that
was used for testing.
Figure 28 - Mulch Spread into the Actual Testing Box

73
6.4 Mulch as Snow Substitute
The first prototype was finished in April, however the snows had stopped by that time.
Therefore testing required the use of some other form of material which was similar to snow; wood
mulch was chosen as this material. Dry wood mulch has a density similar to that of wind packed snow,
380 kg/m^3 (Aqua-Scale, 2016). With mulch, multiple tests could be conducted on the path just by
rearranging the mulch back onto the path after each trial. Also the present prototype necessitated the
use of something other than snow, because of the possibility of a shorting due to the infiltration of
water into the wiring or the motors was very likely.
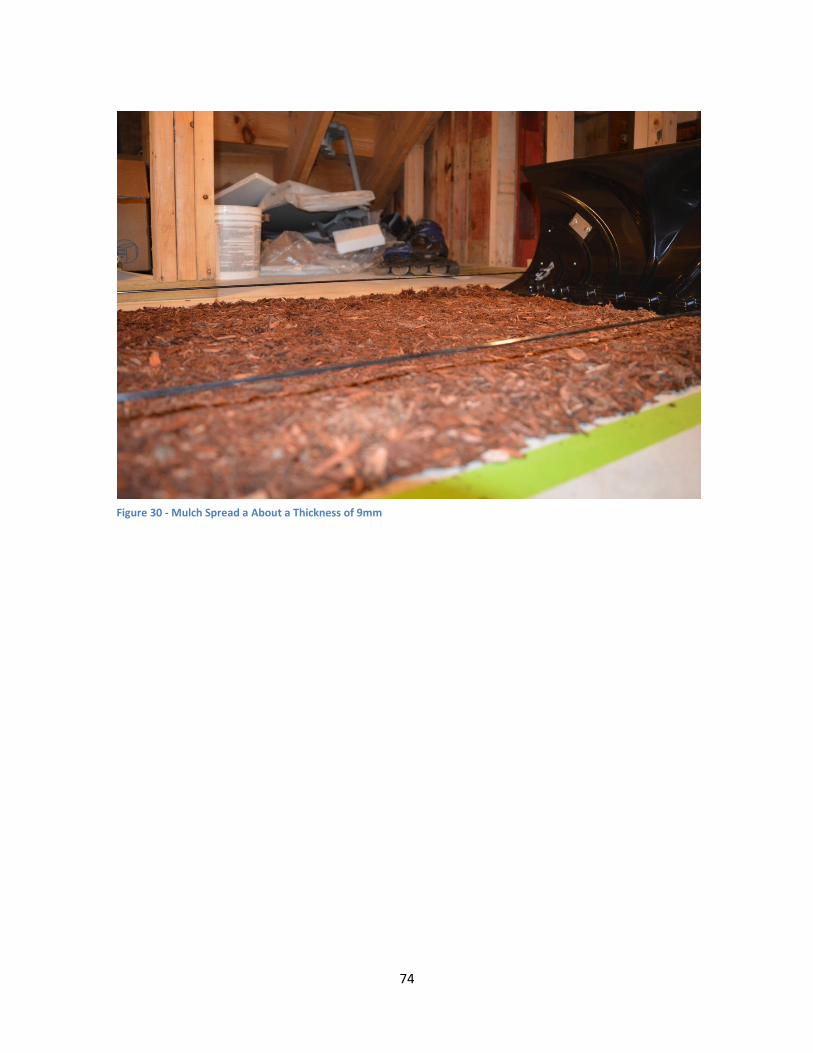
6200 ml (2.356 kg) of mulch were spread at a thickness of 9mm ± 2mm onto the clearing path.
The mulch had to be carefully spread within the dimensions of the clearing path marked by the green
tape. It had to be spread evenly onto the entire surface so that there was a uniform thickness that
simulates snow accumulation. After the mulch was carefully placed, the device was then powered to
move forward till it reached, then reversed till it reached the home position. At this point the amount of
left over mulch on the path that falls within the inside border of the green tape would be gathered into
a graduated cylinder mug, measured and recorded. Next the mulch would be rearranged onto the path
for the next trial. This process was done 5 times.
Figure 29 - Graduated Plactic Mug Used to Measure Mulch
74
Figure 30 - Mulch Spread a About a Thickness of 9mm

75
Chapter 7: Testing & Observations
Five trials were conducted in the manner outlined above. The time the device took for each
forward and reverse cycle was recorded and RPM for both cycles calculated. Then the remaining mulch
in the path would be gathered and measured. Table 1 below shows the time required for forwards and
reverse cycles, their velocities, the initial and final mulch amounts in the clearing path, the removal
efficiencies, mass of the mulch cleared, and finally the work done in remove that mass. Finally the
average and standard deviation were calculated for each parameter.
Table 1
Trial #
Time for Forward Cycle (s)
Time for Reverse Cycle (s)
Velocity Forward (m/s)
Velocity Reverse (m/s)
Motor RPM (Forward Cycle)
Motor RPM (Reverse Cycle)
1 46.34 48.17 0.020554596 0.019773718 35.68762505 34.3318361
2 46.95 49.61 0.02028754 0.019199758 35.22395197 33.33530629
3 46.68 48.65 0.020404884 0.019578623 35.42768948 33.99310473
4 37.88 39.38 0.025145195 0.024187405 43.65798693 41.99503669
5 34.12 37.62 0.027916178 0.025318979 48.46906638 43.95971677
Data Analysis
Average 42.394 44.686 0.022861679 0.021611697 39.69326397 37.52300012
Standard Deviation 5.990265437 5.704807622 0.003490955 0.002902896 6.061121075 5.040111638
Ave ± SD 42.39 ± 5.99 44.67 ± 5.70
0.0228 ± 0.003
0.0216 ± 0.003 39.7 ± 6.06 37.52 ± 5.04
Trial # Mulch Initial (m3)
Mulch Final (m3)
Removal Efficiency (%)
Mass of Mulch Cleared (kg)
Work Done (J)
Power (W)
1 0.0062 0.00061 90.16129032 2.1242 24.6981183 0.53297623
2 0.0062 0.00079 87.25806452 2.0558 24.30185689 0.51761144
3 0.0062 0.00071 88.5483871 2.0862 24.47797307 0.52437817
4 0.0062 0.000605 90.24193548 2.1261 24.70912556 0.65230004
5 0.0062 0.00063 89.83870968 2.1166 24.65408926 0.72257003
Data Analysis
Average 0.000669 89.20967742 2.10178 24.56823262 0.58996718
Standard Deviation 7.97183E-05 1.285778288 0.030292936 0.175495933 0.09253937
Ave ± SD
0.000669 ± 7.8E-05 89.21 ± 1.29 2.101 ± 0.03 24.57 ± 0.18 0.59 ± 0.09

76
7.1 Device Velocity
The device took an average of 0.0228 m/s (2.28 cm/s) to complete the forward cycle and 0.0216
m/s (2.16 cm/s) to complete the reverse cycle. This was interesting because it had a higher velocity
under the opposing force of the mulch than it did on the reverse cycle. This was interesting because the
opposing force of the mulch was a fraction of the initial mulch load on the reverse cycle. I suspect that
this may have been because of a misalignment of the cords, because the device would twist to the right
only on the reverse cycle thus causing excessive friction to develop on right CGA. Or it also might have
been because of a difference of tensioning between the two cords thus causing different gripping
frictions at the CGA’s. However this is still curious that it should happen on only the reverse cycle.
The image above shows a top view of the device twisting to the right. Although one might point
out that the source of this twisting might be the power cord under left side of the shovel blade, this
twisting occurred even when the wire was not under the blade. It just so happened to go under the
blade as I was taking a top view picture. The power cord needs to be pulled out of the way as the device
reverses into the home position.
Figure 31 - Twisting of Device to Its Right on Reverse Cycle

77
Another interesting observation was that the time required for the forward cycle in the first
three trials took about 9-12 seconds longer than the last two trials. The only reason I can see why this
occurred was because of varying current usages in the house. As I remember the drier and washing
machine were running for a period of the time that the experiment was being conducted. This might
have caused the voltage to drop. I know this because whenever the space heater or drier in the house is
turned on, the lights become noticeably dimmer.
7.2 Removal Efficiency
On average the device cleared about 89.21% of the initial mulch “accumulation” from the
clearing path with the remaining parts shoved to the front and side of the path. A majority of the
efficiency loss came as a result of left over mulch on the shovel tip as it reversed back to the home
position. Without this, I suspect the efficiency would have been much closer to 100% because the
remaining mulch on the clearing path were very small pieces as shown in the image below.
Figure 32 - View of Clearing Path After Forward Cycle

78
Figure 33 - Top View of Clearing Path After Forward Cycle

79
7.3 Work & Power
The value for work was calculated based on the forward cycle, because useful work was done
only during the forward cycle. The reverse cycle is only required to bring the device back to the home
position. The maximum work done was 24.71 J in Trial # 4 and the min work done was 24.30 W in Trial #
2. The average work done by the motors was calculated to be 24.57 J. This was lower than the initially
calculated value of 190 J by 165 J. The 190 J was also calculated only for the forward cycle. The major
contributing factors to this were three fold:
1) The shovel blade as initially designed was not metal but plastic, thus reducing the weight
dramatically. The whole weight for the final assembly weighed 2.948 kg while initial shovel
blade estimates alone reached 10kg.
2) The length of the clearing path was decreased by about 0.2475m
3) The coefficient of friction between the snow and asphalt of 0.75 was changed to a
coefficient of friction of 0.62 between the mulch and concrete. And the coefficient of
friction within the snow was not required anymore. A new coefficient of friction between
the steel edge of the shovel and concrete of 0.45 was introduced.
From Table 1 we can see the max power developed was 0.723 W in Trial # 5 and the minimum
was 0.518 W developed in Trial # 2. The average power developed by the device was calculated to be
0.589 W. The average value was extremely low compared to the initial estimate of 19 W, as a matter of
fact it was only 3.1% of the initial estimate. Two of the major reasons for this was because:
1) The cycle period for the device was increased dramatically by more than 3-4 times as much
from 10s to 36s-47s.
2) The weight of the device went up, clearing path area decreased, and coefficients of friction
also decreased, as discussed above in the work section.
And since the power is dependent on time we can see a clear correlation between the power and
velocity. The power increases in the last two trials since velocity is directly proportional to power

80
7.3.1 Calculations for Work and Power
Friction Between the Steel Shovel Tip and Concrete Floor
Given
1) Length of the clearing path, 𝑑
2) The coefficient of friction between the steel shovel tip and concrete, 𝜇𝑑
3) Mass of the whole device, 𝑚𝑑
Friction Between the Wood Mulch and Concrete Floor
Given
1) Length of the clearing path, 𝑑
2) The coefficient of friction between the wood mulch and concrete, 𝜇𝑚
3) Mass of the mulch depends on the Trial number; here we will be taking the average value of
𝑚𝑚 = 2.101kg
The work done to overcome the friction between the mulch and concrete is given by Wm
d 95.25 cm 0.953 m
md 2.948kg Fd md g 28.91N d 0.45
Wd Fd d d 12.392J
mm 2.101kg Fm mm g 20.604N m 0.62
Wm Fm d m 12.168J

81
Total Work for Opposing Force and Power
Assuming that the average time for a forward cycle is 𝑡
t 42.39 s
Wtot Wd Wm 24.559J PWtot
t0.579 W

82
Chapter 8: Conclusion & Recommendations
As a conclusion, I think the whole design to prototype process went well. There were some
initial troubles such as getting to understand the purpose of the Design Decision Matrix in the design
process but I came to understand the benefits of a quantitative versus qualitative approach to the
design process. Also, I learned about the importance of coming up with several viable ideas. It allows the
best idea to be chosen while aiding in the development and improvement of existing ideas. I was also
pleased that the prototype that was assembled was very similar to the one designed and was also strong
enough to clear the mulch with ease. I am sure it could have handled loads three times as much as ones
used for testing. And with the use of lower RPM, large gear ratio motors, I believe this device can be
easily upgraded to taken on much larger loads.
I learned how a systematic approach could be taken right from designing the device to force
analysis and energy analysis of the device. We analyzed preliminary designs so that they can be
individually tested and the best design could be chosen based on quantitative and empirical data. I was
intrigued by the fact that there are formulas that can tell me how much a material needs to be indented
to produce the appropriate frictional force.
A defect that needs to be addressed is the twisting motion that occurs on the reverse cycle. The
source of the problem doesn’t seem to be clear. While it could be because the cords are not aligned
parallel to each other, the twisting never occurs in the forward cycle. If it is because of varying tension
within the cords, I should be able to able observe that in the forward cycle, which I don’t.
With regards to the practicality of this device, two major problems are that the design wasn’t
advanced far enough to develop water proofing ideas for the electrical parts, making it non-operable for
its intended use, clearing snow. And the second was that the device once setup on the driveway has no
easy method to temporarily remove it to allow for traffic. This is because the cords are in tension and
the supports which they are tied to will be fixed. These two aspects highly diminish the practicality of
the device.
Some things to keep in mind when testing in the future is to use a power source that does not
vary due to voltage fluctuations in a building. To set the right amount of tension in the cord there should
be a better method to measure the elongation, using precise instruments and not sharpie markings like I
had to resort to. To avoid the blades getting stuck on rough surfaces on the ground, the end of the blade
should be made more rounder to help facilitate more efficient snow removal without the device getting
stuck.
For videos taken in the Testing, please follow this link: bit.ly/1rhBe0j

83
Bibliography
Aqua-Scale. (2016). Wood chips, dry density in 285 measurement units. In d. wood chips (Ed.). http://www.aqua-calc.com/: Aqua-Scale.
Boyce, M. C. (2003). Stress-Strain Behavior of Thermoplastic Polyurethane. (Research), Massachusetts
Institute of Technology Online. Retrieved from http://web.mit.edu/cortiz/www/Jerry/TPU_final.pdf
Bullis, K. (2014, July 2, 2014). Super-Slick Material Stops Ice From Forming. MIT Technology Review. Engineering-Toolbox. (2016a). Modulus of Elasticity or Young's Modulus - and Tensile Modulus for some
common Materials. Online: The Engineering Toolbox. Engineering-Toolbox. (2016b). Poisson's ratio. Online: Engineering Roolbox. HeatTrak. (2015). HeatTrak Residential Mats. In H. Inc. (Ed.). Online. Norton, R. L. (2006). Machine Design - An Integrated Approach (3rd ed.): Pearson Prentice Hall. perspectivedetective. (2009). 20 Road Sprinkler Vblog [Video]. YouTube: YouTube. Telegram-Staff. (March 29, 2015 ). Worcester Regains 'Snowiest City' Title. Telegram & Gazette.
Retrieved from http://www.telegram.com/article/20150329/NEWS/303299708#loadComment WarmlyYours. (2015). Outdoor Heating: Snow Melting and Deicing Systems. In WarmlyYours (Ed.).
Online. Wikipedia-Contributors. (2016). Contact Mechanics Wikipedia. Online: Wikipedia.